Article

Experimental Study on Thermal Runaway Behavior of Lithium-Ion Battery and Analysis of Combustible Limit of Gas Production

1
School of Locomotive and Vehicle Engineering, Dalian Jiaotong University, Dalian 116028, China
2
State Key Laboratory of Automotive Safety and Energy, Tsinghua University, Beijing 100084, China
3
Clean Energy Automotive Engineering Center, Tongji University, Shanghai 200092, China
*
Authors to whom correspondence should be addressed.
Batteries 2022, 8(11), 250; https://doi.org/10.3390/batteries8110250
Submission received: 12 October 2022 / Revised: 7 November 2022 / Accepted: 17 November 2022 / Published: 21 November 2022
(This article belongs to the Collection Advances in Battery Energy Storage and Applications)

Abstract

:
Lithium-ion batteries (LIBs) are widely used in electric vehicles (EV) and energy storage stations (ESS). However, combustion and explosion accidents during the thermal runaway (TR) process limit its further applications. Therefore, it is necessary to investigate the uncontrolled TR exothermic reaction for safe battery system design. In this study, different LIBs are tested by lateral heating in a closed experimental chamber filled with nitrogen. Moreover, the relevant thermal characteristic parameters, gas composition, and deflagration limit during the battery TR process are calculated and compared. Results indicate that the TR behavior of NCM batteries is more severe than that of LFP batteries, and the TR reactions becomes more severe with the increase of energy density. Under the inert atmosphere of nitrogen, the primarily generated gases are H2, CO, CO2, and hydrocarbons. The TR gas deflagration limits and characteristic parameter calculations of different cathode materials are refined and summarized, guiding safe battery design and battery selection for power systems.

1. Introduction

With the large consumption of traditional energy such as coal, oil, and natural gas in the world in recent years, energy supply based on fossil fuels is facing severe problems [1,2,3,4], and the demand for clean new energy is increasing all over the world [5,6,7]. Lithium-ion batteries (LIBs) are widely used in electric vehicles (EVs), energy storage systems (ESS), and various household digital products due to the high specific energy, high output voltage, low environmental pollution, and long cycle life [8,9,10,11,12,13].
However, due to the manufacturing process, materials, use environment, and other LIB problems, fire accidents caused by battery combustion and explosion frequently occur [14,15,16,17]. Reality according to survey results, there are more than 30 safety accidents of LIB ESSs in South Korea during 2017 to 2019 [18]. The investigation and analysis of the causes of these accidents show that LIBs are prone to TR under overcharge, external extrusion, high temperature, and overheating. Moreover, LIBs have an extremely high energy density, and the manufacturing materials contain flammable components [1,19]. Moreover, many flammable gases will be generated after the TR, leading to the rapid spread of the fire, inducing a chain reaction [20]. A fire accident caused by an LIB is difficult to extinguish, and the degree of reignition is high. Based on the structure and material composition of LIBs, we can better understand and prevent the TR disaster of LIBs. The main internal structure of an LIB includes five parts: cathode, anode, separator, electrolyte, and shell. In addition, there are cathode and anode insulation plates, leads, PTC elements, gaskets, exhaust holes, and safety valves [21,22]. When TR occurs in the LIB, the temperature and pressure inside the battery will rise rapidly, causing the internal separator to melt. The battery cathode and anode material will undergo a series of chemical reactions with the electrolyte, generating a large amount of gas [23,24], which will then be ejected from the pressure relief valve.
At present, a large number of scholars have carried out research on the TR mechanism and TR disasters of LIBs. Liu et al. [25] studied battery TR disasters under overcharge, and examined the influence of charging rate, environmental temperature, and battery aging on TR from qualitative and quantitative perspectives. Vijay et al. [26] studied the risk of combustion and explosion caused by TR of the LIB pack in an enclosed space and found that the combustion characteristics of the exhaust gas depended on the state of charge (SOC) of the battery and may be highly sensitive to the chemical system of the LIB. Dong et al. [27] determined the temperature change and temperature rise rate of the TR of the battery through TR experiments on square-shelled LIBs, and proposed a basis for judging the TR of the battery. Weng et al. [28] studied the effect of oxygen concentration on the TR and fire behavior of cylindrical LIBs and found that the mass loss of the battery decreased with the decrease of oxygen concentration, but the oxygen concentration had little effect on the maximum temperature of TR. Liu et al. [29] studied the aging behavior of LIBs under slight overcharge. It was found that the thermal stability of batteries decreased after aging. Peng et al. [30] studied the disaster of TR of LFP batteries, and the main toxic gases detected by FTIR analysis were CO, HF, SO2, and NO2. Sascha et al. [31] determined the gas production, mass loss, and gas composition of the TR of LIBs by triggering the TR of the battery in a high-pressure device, and they indicated seven common gas types. Yuan et al. [32] used an accelerating rate calorimeter (ARC) to heat the battery until TR occurred, determined the TR temperature of different types of batteries, collected the exhaust gas samples and analyzed them with a gas chromatograph, and detected several primary gases, including H2. Wu et al. [33] tested the influence of different SOC on the TR time of the battery and determined the thermal stability of the internal materials of the battery through two heating methods, in the order of anode < separator < cathode.
Previous studies have focused on the ISC mechanism of LIBs, the ISC triggered TR mechanism, the temperature characteristics, and TR gas generation characteristics, and different devices have been used to perform TR tests through different TR triggering methods. However, the TR characteristics of LIBs with different cathode material systems, including temperature, voltage, gas production, mass loss, and other relevant parameters, are not summarized. The detailed temperature voltage change relationship during the TR process was not indicated, and the TR hazard of the battery was not evaluated in detail. At the same time, a detailed analysis of the TR gas is also lacking. Because the gas generated by the TR process of LIBs is flammable and may cause explosion risk, it is essential to analyze the flammability limit of the generated gas. Based on the above analysis, this study utilizes a fully enclosed cabin to conduct TR experiments, filled with nitrogen to create an inert gas atmosphere. TR of four commercial LIBs is triggered by lateral heating, battery temperature, voltage, mass loss, gas production, and other data obtained during the TR process. Furthermore, the TR gas is collected for analysis, and the combustible limit is calculated. The combustible limit, also known as the explosion limit in engineering, represents the maximum and minimum concentration of combustible gas mixtures that can cause combustion and explosion. According to different gas concentrations, it can be divided into the lower flammability limit (LFL) and the upper flammability limit (UFL) [34,35]. There are many experimental methods, formula calculation methods, and simulation methods to study the flammability limit of mixed gas. The fire risk of battery TR gas can be better evaluated by analyzing and calculating the flammability limit of the gas produced by TR. Under the condition of summarizing the temperature, voltage, mass loss rate, gas production, and other characteristic parameters during the battery TR process, this study comprehensively evaluated the safety of different cathode material batteries and the harmfulness of TR, which can guide the safety design of LIBs, leading to disaster prevention.

2. Experimental Setting

2.1. Battery Sample

Four different types of commercially available LIBs were used in the experiment. The cathode of sample 1 is LiNi0.6Co0.2Mn0.2O2, the cathode of sample 2 is LiNi0.8Co0.1Mn0.1O2, the cathode of sample 3 is LiNi0.9Co0.05Mn0.05O2, and the cathode of sample 4 is LiFePO4, and the anode is mainly composed of graphite. The cathode current collector of the four batteries is aluminum foil, and the anode current collector is copper foil. The specific parameters of the battery samples are shown in Table 1.

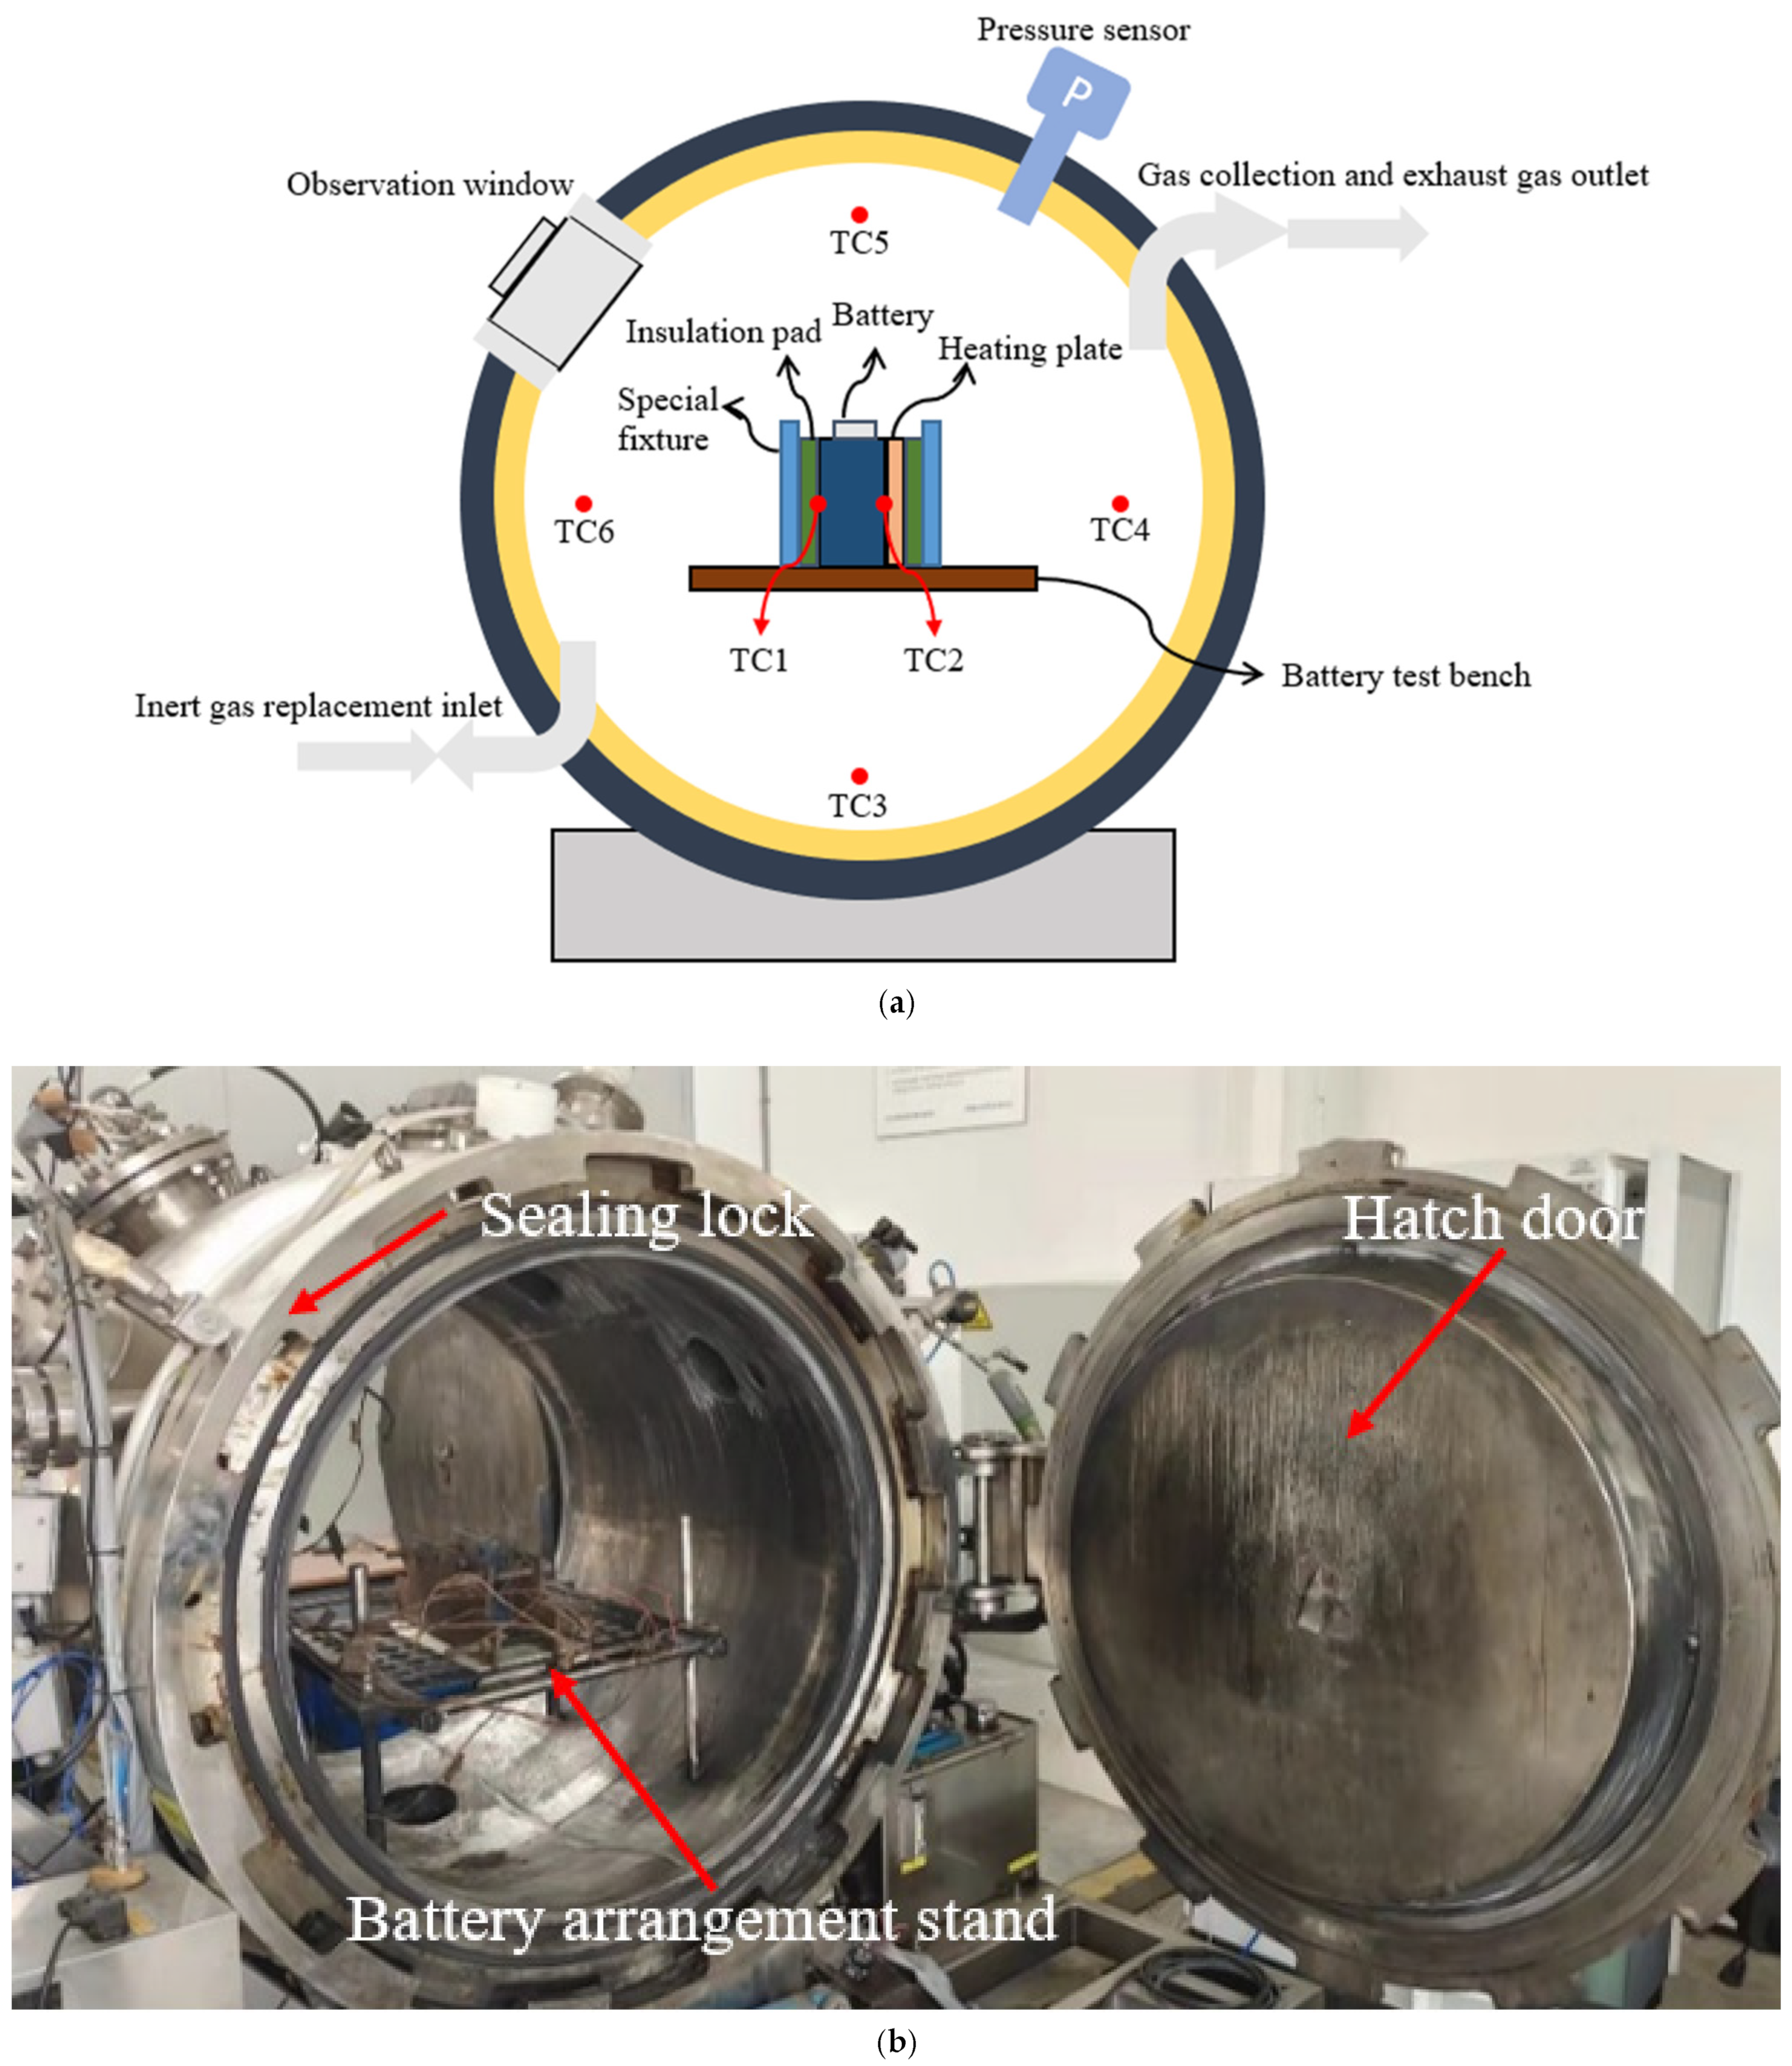
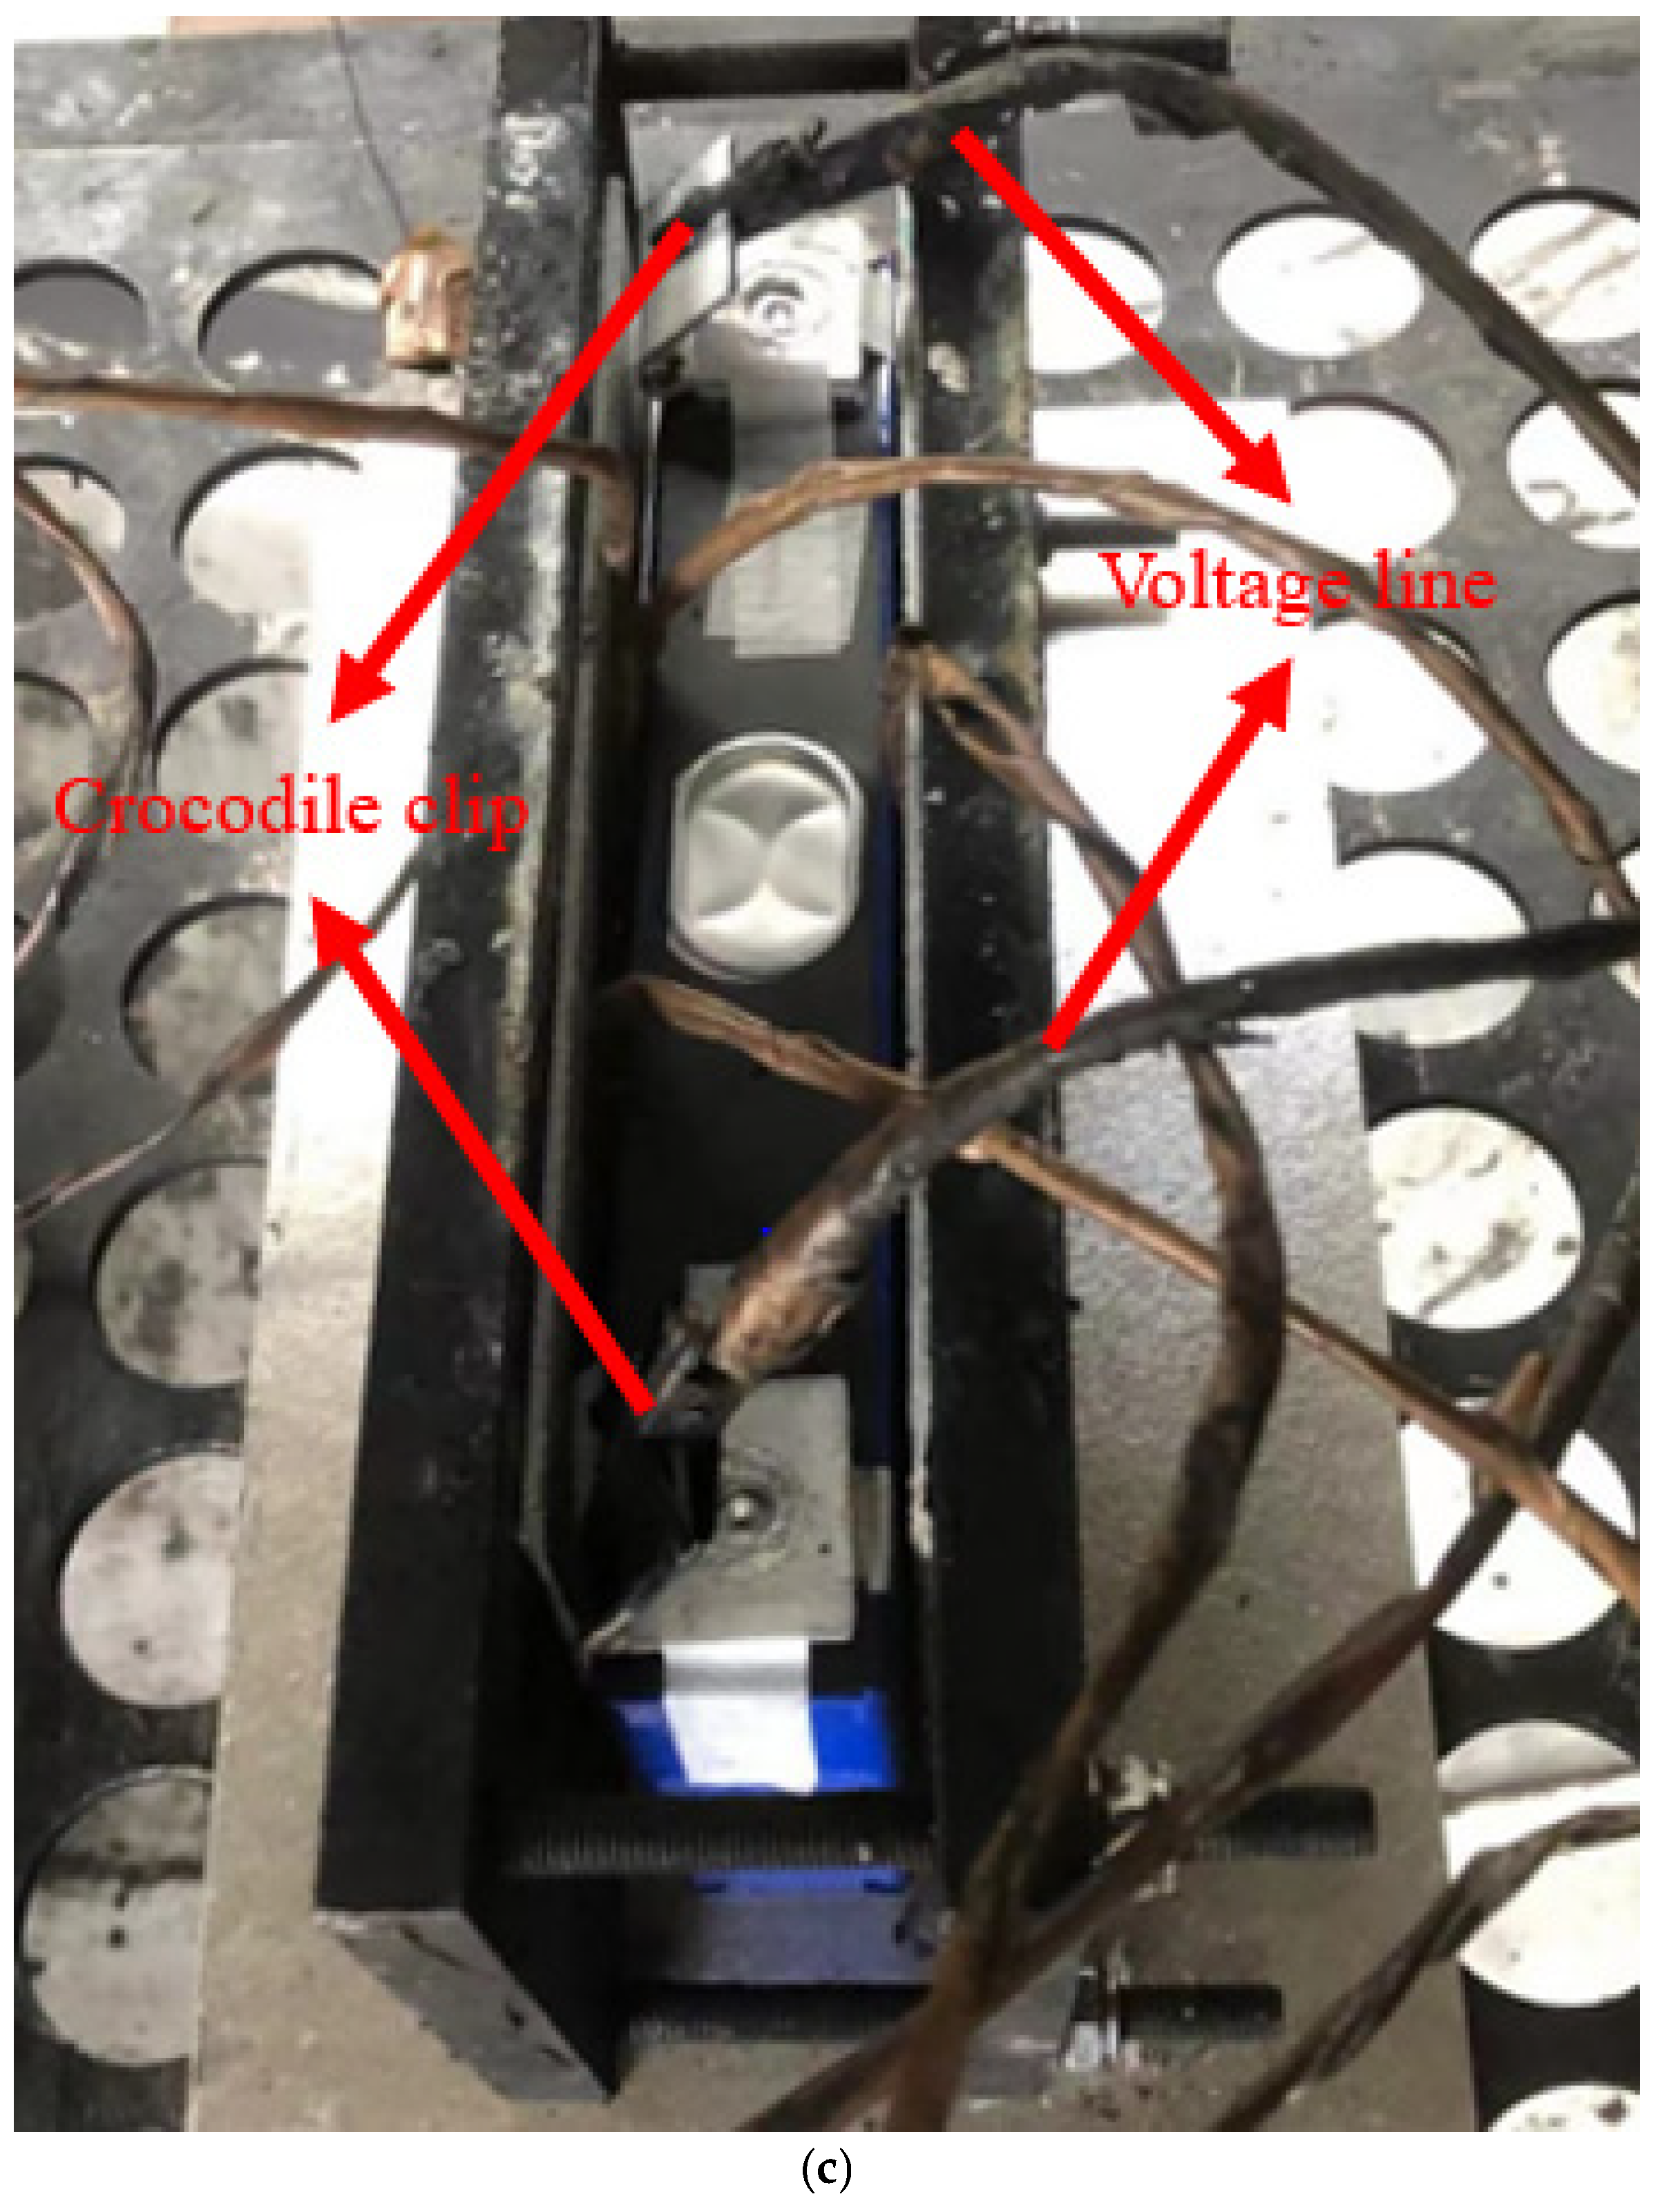
2.2. Experimental Instruments

The experimental device used in this study is a sealed experimental chamber with a volume of 1000 L. The device is equipped with a pressure sensor to monitor the real time pressure. Multiple K-type thermocouples are used to monitor the battery temperature (TC1, TC2) and the ambient temperature (TC3-TC6), the battery test bench, the inert gas replacement pipeline, the gas collection pipeline, and the glass observation window. The structure of the experimental cabin is shown in Figure 1. During the experiment, the battery is fixed by the fixed clamp inside the cabin. The door of the experimental cabin is hydraulically driven and can achieve complete internal sealing. The cabin is equipped with a vacuum pump to replace the gas inside the cabin. The gas generated by TR is collected through the gas discharge pipeline and then passed to the gas analysis equipment (GC) for gas analysis. After completing the gas composition test, the remaining exhaust gas was discharged through the exhaust pipe. The gas analysis equipment used in the experiment was a Thermo Fisher Scientific gas chromatography analyzer, model Trace1300(Country of origin and manufactures: Singapore/Thermo Fisher), equipped with four detectors and eight chromatographic columns.

2.3. Experimental Design

A battery and a heating plate of the same size are placed side by side, and the battery TR is triggered by lateral heating. The heating plate shell is stainless steel, containing resistance wire. A 550 W constant power heating A thermocouple (TC1) is arranged in the center of the large surface of the battery, and a thermocouple (TC2) is arranged in the center of the battery and the heating plate. The two thermocouples are used to measure the real-time temperature of the battery and the heating plate. A heat shield is arranged outside to reduce the heat loss of the heating plate. Two copper wires are connected to two crocodile clips, which are insulated with rubber over the outside of the wire and then clamped onto the battery patch using crocodile clips to measure the real-time voltage during battery heating. Moreover, a fixed clamp is used. The experimental layout is shown in Figure 2.
During the experiment, the battery is arranged on the bench, and multiple thermocouples are arranged to measure the average ambient temperature in the test chamber. The TR of four battery samples were triggered under a nitrogen (N2) atmosphere, in which nitrogen had three effects: 1. As carrier gas; it will produce a dry inert oxygen-free atmosphere; 2. Prevent the risk of fire outbreak in the reaction vessel; 3. Control the temperature of the gas released from the reaction vessel at a manageable level for chemical analysis and quantitative analysis. A lithium iron phosphate battery will generate massive electrolytes, particles, and some gases after the TR. In order to ensure that the gas composition measurement is more accurate for the lithium iron phosphate battery, we first heated the ambient temperature in the experimental cabin to 150 °C, waiting for three minutes to make the cabin temperature more stable. We then turned on the heating plate on the side of the battery, heating until the battery thermal runaway. The purpose of doing so was to make the ambient temperature reach the boiling point of the electrolyte inside the battery, so that the electrolyte would vaporize and change into a gaseous state during the eruption process, and therefore more accurate gas volume and gas composition could be obtained [36]. The experimental steps mainly include the following points:
(1)
Measure the open circuit voltage of the battery, ensure that the battery is in the specified state of charge, and record the initial quality of the battery before the test;
(2)
Arrange the battery, heating plate, and heat insulation plate on the battery rack, arrange the temperature measuring thermocouple and fix it with fixed clamps;
(3)
Vacuum the test chamber and rinse it with N2 to reach the specified experimental atmosphere;
(4)
Turn on the heating plate for heating until the battery TR is triggered.
After the TR of the battery, the internal temperature and pressure of the cabin is left to reach a stable state. While waiting for the natural cooling of the battery and the sedimentation of particles inside the chamber, the internal gases of the cabin were collected and the gas chromatograph (GC) was used to analyze the gas composition. In order to obtain the full component gas of the gas produced by the TR of the lithium battery, the gas analysis equipment was calibrated for more than ten common gases, including H2, CO, CO2, and short chain olefin gases.

3. Experimental Results and Analysis

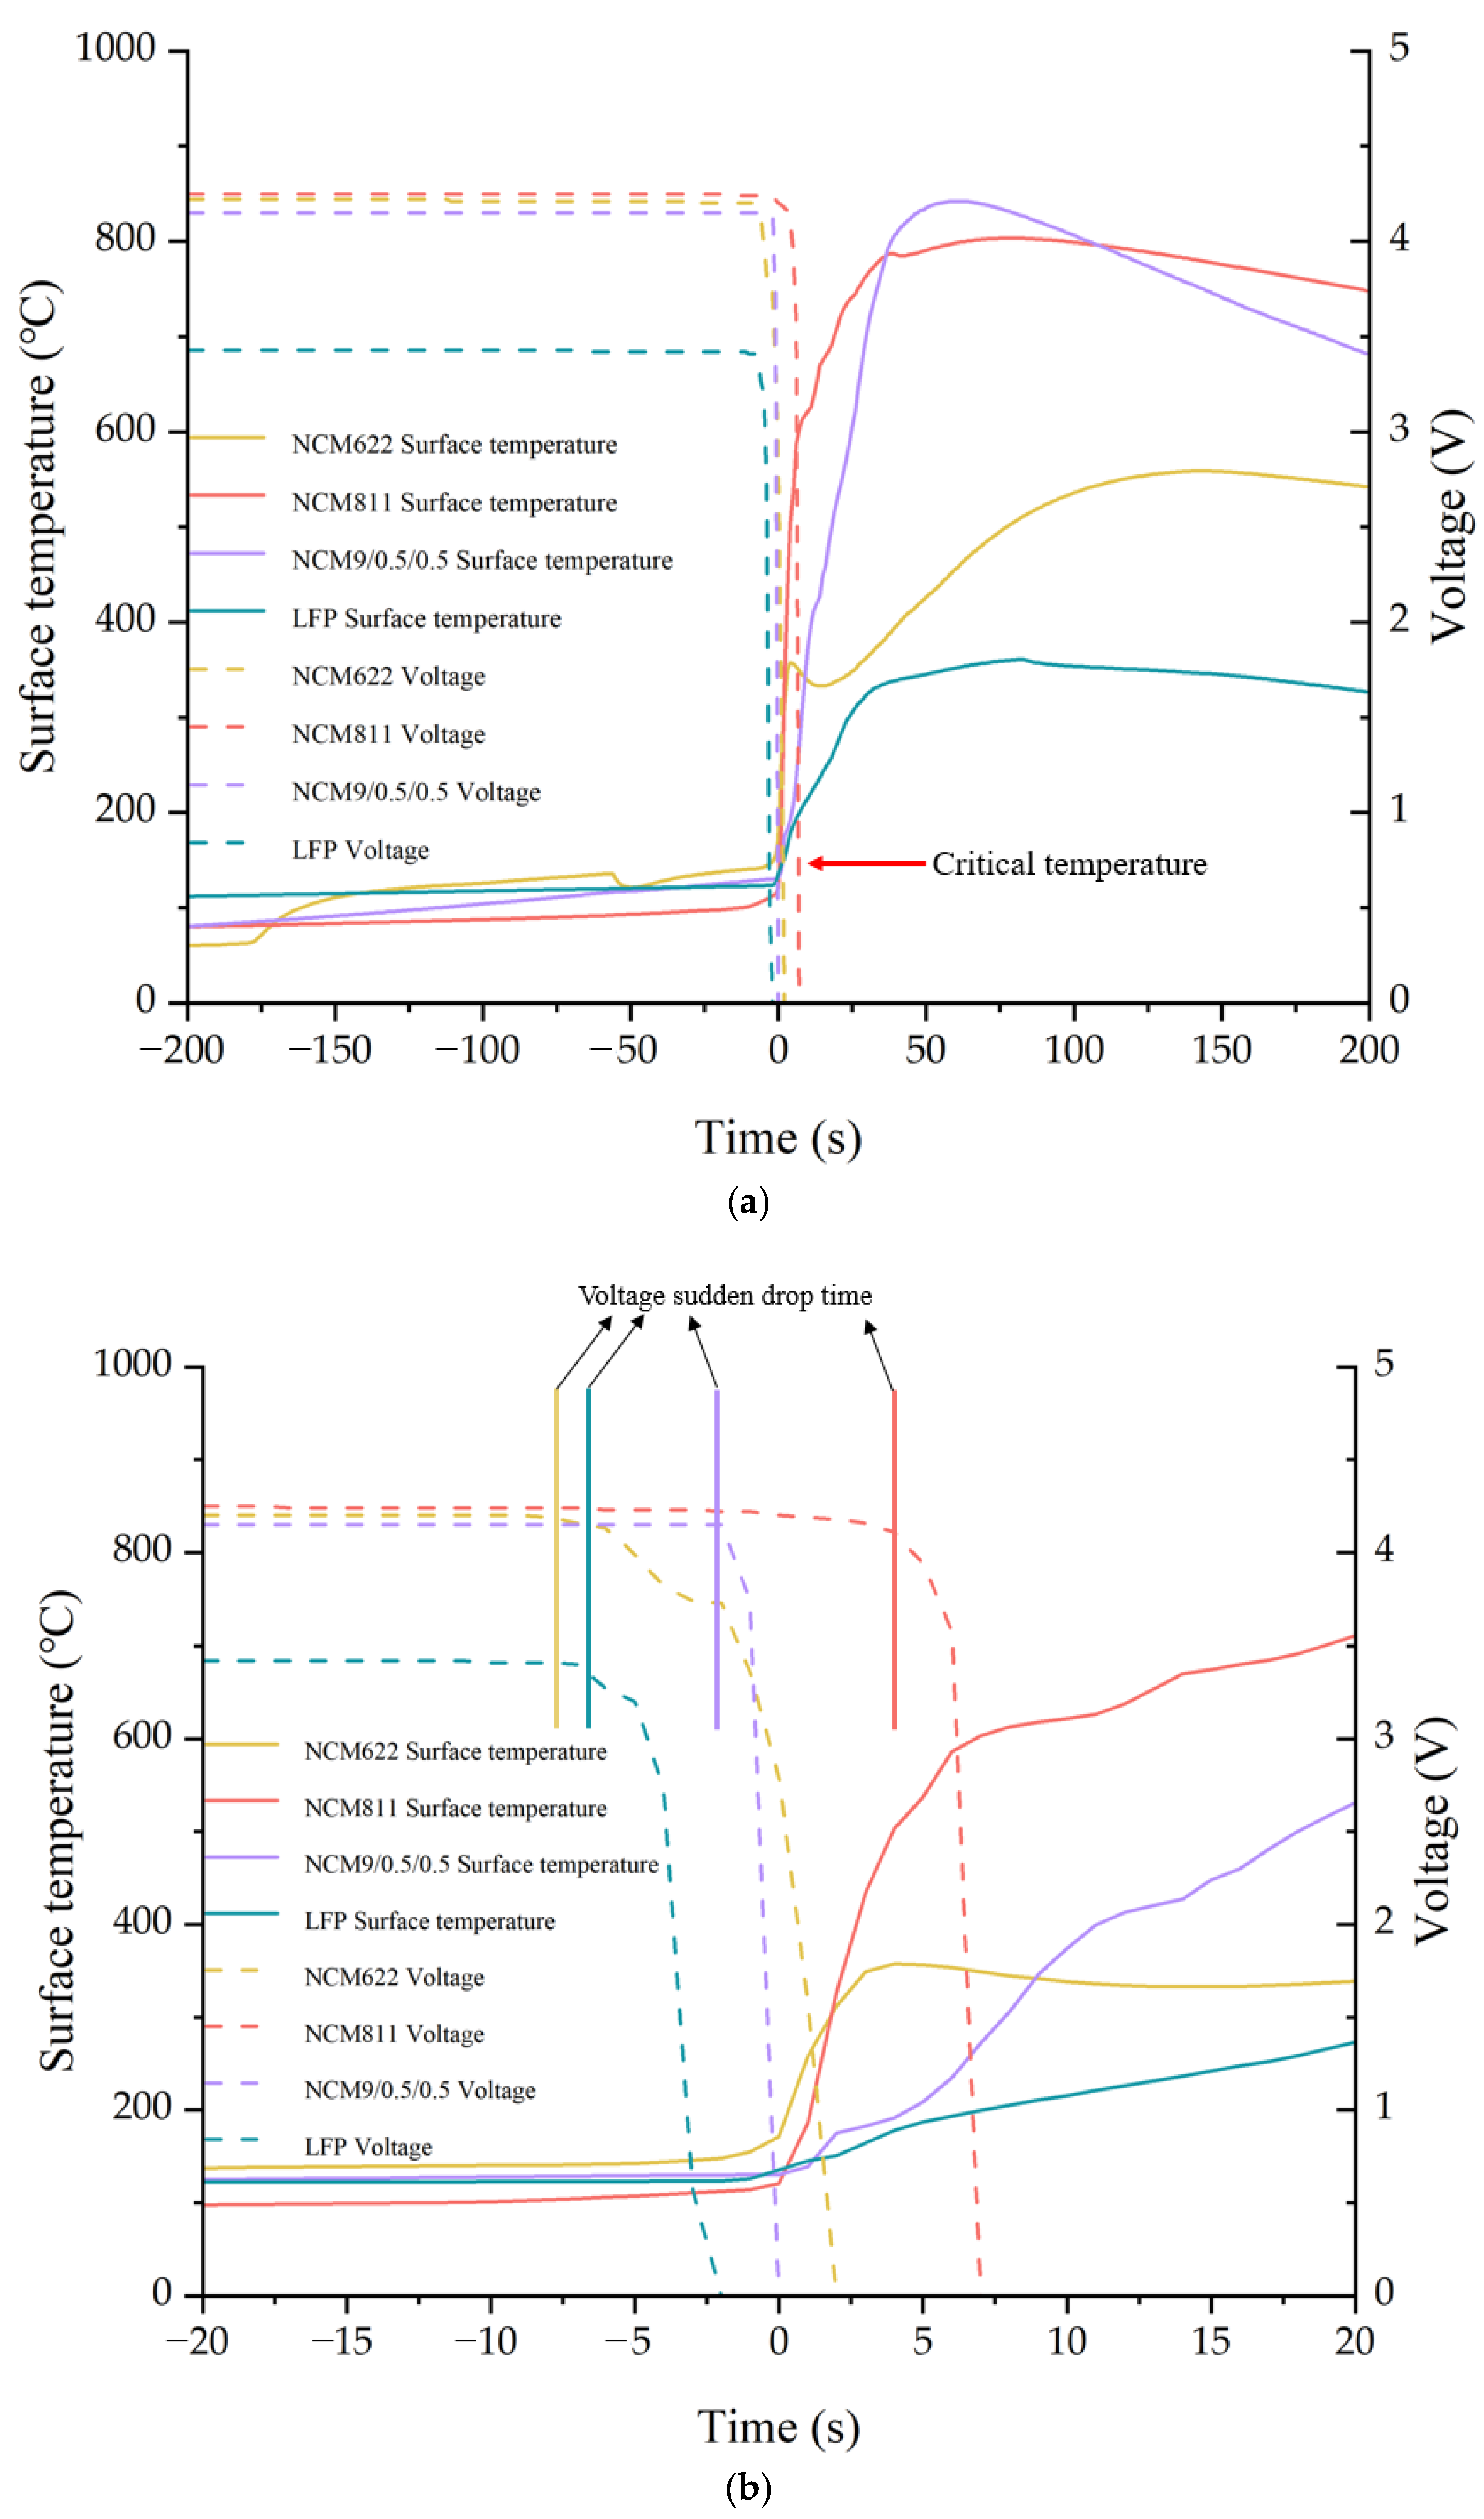
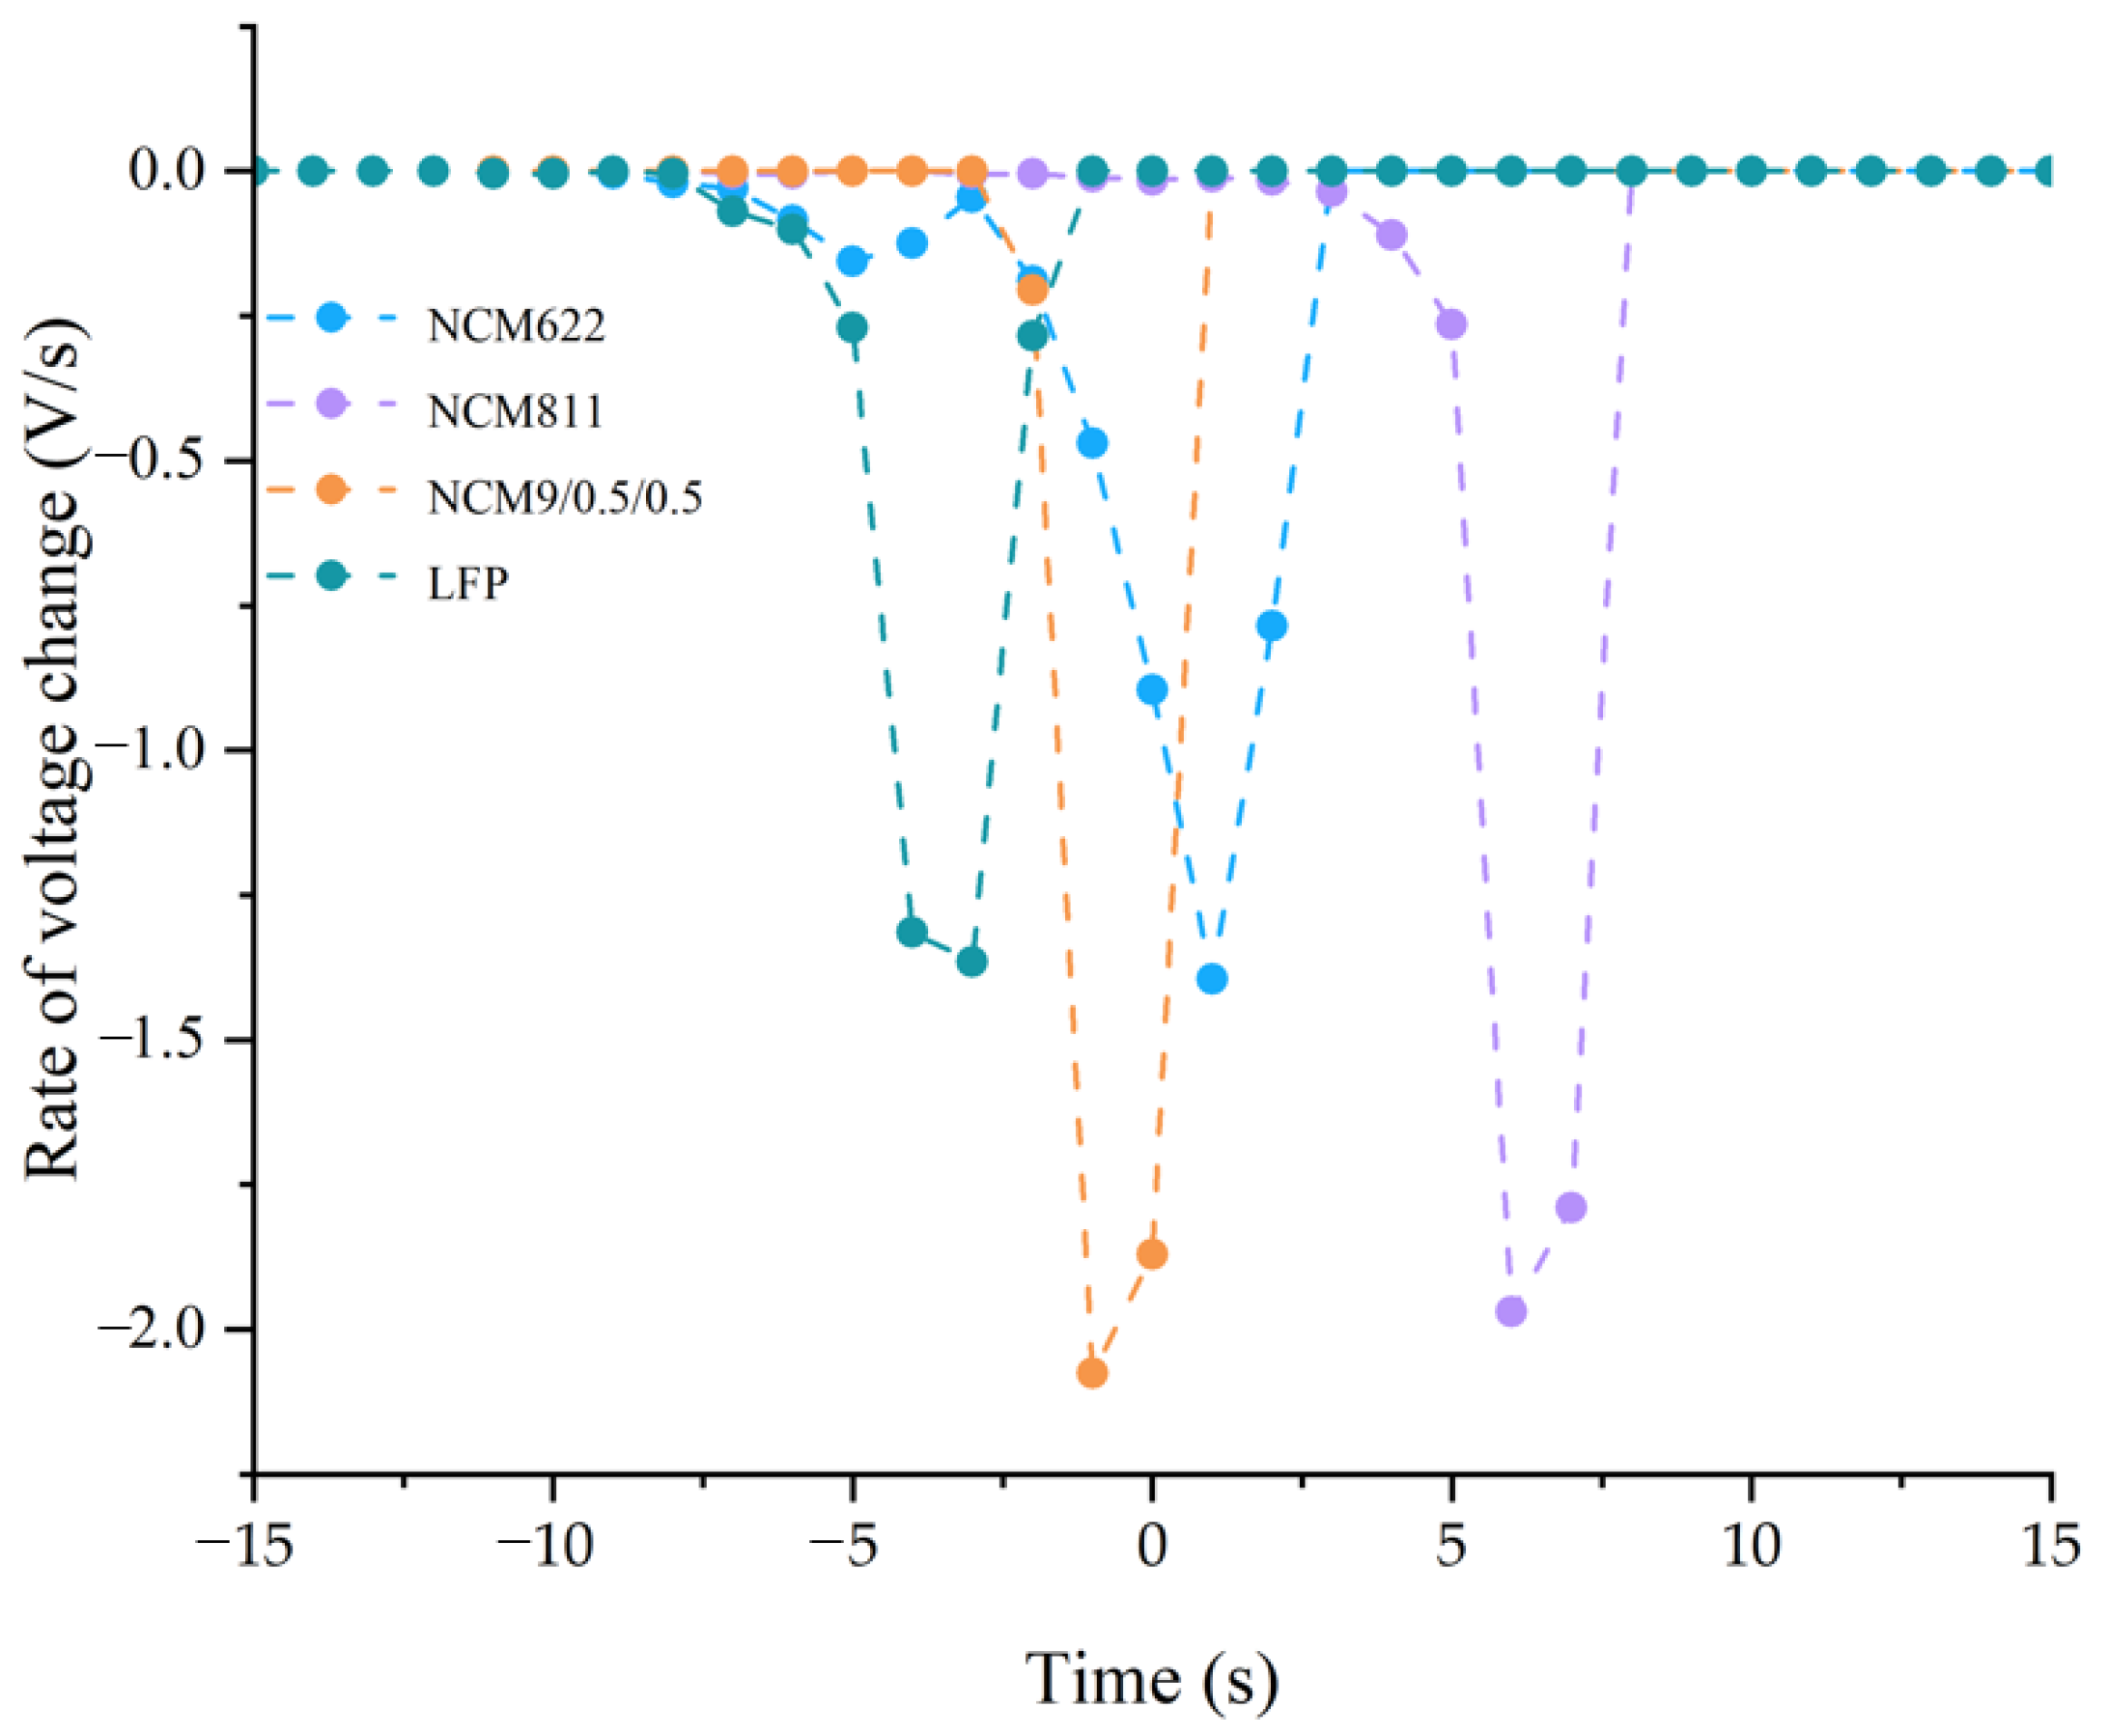
3.1. Battery Temperature and Voltage Changes

The surface temperature and voltage response of the four battery samples in the process of TR through lateral heating are shown in Figure 3. During the experiment, we monitored the surface center temperature on the opposite side of the heating side of the battery and used this temperature value to define a new temperature boundary-critical temperature (when the battery is heated laterally, the surface temperature of the battery exceeds this value, the temperature will rise sharply, and the battery will also enter an uncontrolled severe TR stage). Due to the heating effect of the heating plate, the surface temperature of the four battery samples increased continuously, and finally reached the critical temperature. After this temperature point, the battery temperature rises rapidly, and TR occurs until the highest temperature is reached. As shown in Figure 3a, the heater was turned off after the TR of the battery. In the processing of the data, time 0 is set as the time when the battery surface temperature suddenly rises. The temperature curve before the ‘0’ moment is when the battery is being heated by the heating plate, indicating that the temperature gradually increases, and the temperature curve will fluctuate due to the different volumes and heat absorption capacities of different batteries. With the progress of heating, the internal separator of the battery will eventually melt due to the increase in temperature, resulting in direct contact between the cathode and the anode of the battery and the ISC, resulting in a sudden voltage drop. It can be seen from Figure 3b that the voltage drops of the three batteries occurred two to eight seconds before the sudden temperature rise. Although the voltage drops of the NCM811 battery occurred approximately seven seconds after the TR, the voltage had decreased by 0.2 V approximately five seconds before the TR. For the development process of TR, the time of the TR can be more clearly confirmed by the voltage change rate. Figure 4 is a curve of the voltage change rate. It can be seen from the figure that the voltage of the four sample batteries decreased at a low rate first, which may be caused by the shrinkage of the internal separator of the battery [37]. Later, due to the failure of the separator, the anode and the cathode of the battery contact, and the short circuit promoted the voltage to further rapidly decrease until it reached 0. In the process of overall TR, the temperature rise and the voltage drop of the battery are a positive feedback, both promoting TR.
The TR critical temperatures of the four battery samples are: NCM622—154.7 °C, NCM811—120.8 °C, NCM9/0.5/0.5—130.8 °C, LFP—145.2 °C. Moreover, it can be observed from Figure 3a that the temperature of the NCM9/0.5/0.5 battery is the highest during TR, reaching 842.1 °C; the maximum temperature of the NCM811 battery is 803.4 °C, the maximum temperature of the NCM622 battery is 559.1 °C, and the maximum temperature of the LFP battery is only 360.9 °C. The surface temperature of the battery during TR can also reflect the safety and harmfulness of the battery. The higher the critical temperature of TR, the higher the safety of the battery. The lower the maximum temperature of TR, the less the harmfulness of the battery [38].
The battery is heated until the surface temperature of the battery reaches a critical value, after which the battery indicates that the temperature has risen sharply and the battery has TR. When the heater is turned off, the battery enters the cooling stage. The surface temperature of the battery gradually decreases and the pressure and ambient temperature in the experimental cabin gradually decrease and finally tends to be stable.

3.2. Battery Mass Loss

In the case of battery TR, various chemical reactions will occur due to the reaction of electrolyte and the electrode material, generating heat and releasing a large amount of gas. The internal pressure of the battery will rise sharply in a short time. After the gas pressure reaches the release pressure of the safety valve, the safety valve will open to eject the internal gas, electrolyte, and active substances [39].
In the four battery samples, the mass loss rate before and after TR were 38.12%, 37.80%, 72.89%, and 22.80%, respectively. Comparing the different battery systems, the NCM622 battery, NCM811 battery, and NCM9/0.5/0.5 battery mainly eject black solid particles after TR, while the LFP batteries eject unreacted electrolytes. Due to the different degrees of TR and battery ejection products, the mass loss rate of the NCM622 battery, NCM811 battery, and NCM9/0.5/0.5 battery is higher than that of the LFP battery. Among them, the NCM9/0.5/0.5 battery, because of its high energy density, ejected a large number of battery internal coil material in the process of TR, so the mass loss rate is much higher than the other three samples. Based on the above analysis, the battery safety of the NCM system is lower than that of the LFP system. Through a comprehensive analysis of the temperature characteristics of the TR process of the battery, it can be found that the TR hazard of the LFP battery is the lowest.
In contrast, in the NCM batteries, the TR hazard of the battery increases with the increase of energy density. Table 2 lists the critical parameters of the four battery samples during TR. The exhaust time is the time from the opening of the valve to the end of the pressure relief of the battery. At this time, the gas volume in the cabin is stable, and more accurate gas production of the battery can be obtained.

3.3. Gas Production and Composition

The concentration and composition of toxic and combustible gas produced during the TR of the LIB is an important indicator for measuring the safety of the battery. The reactants produced during the TR of the batteries include the cathode and the anode of the battery and the electrolyte. For LIBs, the cathode is composed of lithium intercalated transition metal oxides. The more common cathodes are lithium iron phosphate (LiFePO4), lithium nickel cobalt manganite (Li [NixCoyMnz]O2, x + y + z = 1), and lithium cobaltate (LiCoO2). Meanwhile, the anode is usually composed of graphite, and the electrolyte is composed of one lithium salt and two or more solvents. Lithium hexafluorophosphate (LiPF6) is generally used as the lithium salt. The solvent is ethylene carbonate (EC) combined with dimethyl carbonate (DMC), diethyl carbonate (DEC), and methyl ethyl carbonate (EMC). Because the decomposition temperature of the cathode material of the ternary lithium battery is low, oxygen and other combustible gases will be generated during the TR process, so the gas content generated during the TR process is higher than that of the lithium iron phosphate battery.
The four battery samples will produce a large amount of gas during the TR process. The test results show that the gas produced by TR is mainly CO, CO2, H2, C2H4, CH4, and a small amount of hydrocarbon and other gases. Although the cathode materials of the four battery samples are different, the types of gases released after TR are roughly the same. The reason for this is that the battery cathode mainly releases O2 without generating other gases. The intercalation of lithium into the anode material is an essential factor affecting the types of gas [31,40]. In addition, the electrolyte in the battery will also vaporize at high temperatures to generate macromolecular organic compounds. Although the gas production types of the four samples are almost the same, there are significant differences in gas production. The gas production formula of the battery is as follows:
P V = n R T
n = P 2 V 2 R T 2 n 0
where n is the gas production, P2 is the real time cabin pressure after TR, V2 is the volume of the test cabin, R is the ideal gas constant, T2 is the cabin ambient temperature after stabilization, and n0 is the gas volume in the initial cabin.
Because the temperature and pressure of the battery rise sharply after TR, the precise gas quantity can be obtained only when the temperature and pressure inside the test cabin are stable. Among them, the gas production of the NCM622 battery is 3.93 mol, the gas production of the NCM811 battery is 12.01 mol, the gas production of the NCM9/0.5/0.5 battery is 17.14 mol, and the gas production of the LFP battery is 10.3 mol. Although the gas production of NCM622 is the lowest, its capacity is only 50 Ah, much smaller than that of the other three samples. It can be seen that the gas production of battery TR is related to the battery capacity. In contrast, the LFP battery generates less gas after TR, which is attributed to the solid covalent P–O bond in the cathode of the lithium iron phosphate battery, reducing oxygen release [41,42]. Figure 5 shows the gas producing components and the volume percentage of the four samples.
It can be seen from Figure 5 that the toxic and hazardous gases produced by the four samples are mainly CO, CO2, and H2, but no HF is detected. Previously, some scholars have studied the mechanism of battery gas. In the process of battery TR, gas will mainly experience the following reaction: SEI film decomposition reaction. The reaction is as follows:
(CH2OCO2Li)2 → LiCO3 + C2H4 + CO2 + ½O2
After that, as the reaction heat releases, the temperature increases, and the released heat causes the intercalated lithium to react with the organic solvent in the electrolyte. The reaction is as follows:
2Li + C3H4O3 (EC) → Li2CO3 + C2H4
2Li + C4H6O3 (PC) → Li2CO3 + C3H6
2Li + C3H6O3 (DMC) → Li2CO3 + C2H6
At the same time, the electrolyte inside the battery will also decompose and produce gas at high temperature. The reaction formula is as follows [1]:
C2H5OCOOC2H5 + PF5 → C2H5OCOOPF4 + HF + C2H4
C2H4 + HF → C2H5F
C2H5OCOOPF4 → PF3O + CO2 + C2H4 + HF
C2H5OCOOCPF4 → PF3O + CO2 + C2H5F
C2H5OCOOCPF4 + HF → PF4OH + CO2 + C2H5F
Some scholars have shown that the source of HF is mainly TR reaction products and product reoxidation [43]. HF is a highly toxic gas, and only a tiny amount of gas may cause vomiting or even coma. The gas generation mechanism is as follows [44]:
LiPF6 → LiF + PF5
PF5 + H2O → POF3 + 2HF
LiF6 + H2O → LiF + POF3 + 2HF
POF3 + H2O → POF2(OH) + HF
HF is not detected in this experiment because there is an inert nitrogen atmosphere in the test chamber. Some studies have shown that HF will not be formed under the water content of 10 ppm, and a large amount of hydrofluoric acid will be produced under 300 ppm [45]. However, the water content in the chamber is shallow due to the replacement of inert gas, and the intermediate substance PF5 that generates HF does not react with it. Therefore, the HF content is too low to be measured.
To analyze the gas producing components of the four samples, the volume concentration of the main gas components of the battery was normalized. We divided the volume of the different types of gas produced by each battery sample by the capacity of the corresponding battery, and obtained the normalized results in mol/Ah, as shown in Figure 6. Through the analysis of the gas production results of the four samples and the energy density of the battery, it can be concluded that the increase of the energy density of the battery will lead to the increase of the content of CO gas and the decrease of the content of other hydrocarbons. Figure 7 is the CO concentration and energy density fitting curve. The fitting curve shows that the increase of CO concentration is positively related to the energy density, with a coefficient of 0.39.
In the process of TR of the batteries, the formation of CO has a high priority and can capture the most C atoms, while the remaining C atoms are used to generate hydrocarbons. It can be predicted that the concentration of CO will increase with the continuous increase of energy density, but the concentration of other toxic hydrocarbons will not necessarily increase. Another gas with noticeable concentration change is H2. Figure 8 shows the fitting curve between the H2 concentration and energy density of the battery. From the fitting curve, it can be seen that the concentration change of H2 is negatively related to the energy density, with a coefficient of −0.28. The reason for this may be that, with the increase in energy density of the battery, the TR reaction inside the battery becomes fiercer and the reaction time is shorter, resulting in insufficient reaction time for H2 generation. It is also possible for the reducing gas to rapidly oxidize, resulting in insufficient reactants to generate H2. Until now, there is limited detailed research on the principle of H2 generation by the battery, and further experimental research is needed in the future.
In addition, the TR of the battery will also generate many hydrocarbons and CO2, which are combustible or toxic gases. Although CO2 gas is non-toxic, if people breathe it for a long time in a limited space, it will increase the absorption rate of asphyxiated objects, resulting in hypoxia, coma, syncope, and other symptoms. CH4, C2H4, and other gases have extremely high combustion risks, promoting the flame spread. Preventing the potential combustion risk of gas and the toxicity risk to the human body is crucial to improving battery safety.

3.4. Gas Production Characteristics and Deflagration Limit

Due to the different cathode materials and energy systems of LIBs, the gas production characteristics will be different. The most obvious difference is the difference in gas volume. In order to better analyze the difference in the gas production characteristics of the four samples, the total gas production of the sample battery is normalized to the cell capacity. Figure 9 shows the normalization results of the gas production of the four samples. It can be seen from the figure that there are significant differences in the overall capacity of the four battery samples, leading to a tremendous difference in the gas production results during the TR process. However, the normalized gas production results after the TR show that the gas production of the battery is positively related to the energy density. Moreover, the normalized gas production results of the NCM622 battery, the NCM811 battery, and the NCM9/0.5/0.5 battery are higher than those of LFP battery, indicating that the NCM system’s gas production is higher than that of the LFP system under the same battery capacity. With the increase of Ni element content, gas production will also increase significantly, indicating that the risk of TR will gradually increase with the increase of battery energy density.
Among the gases generated during the TR process of the battery, the public is most concerned about the fire risk caused by the eruption of combustible gas. It can be seen from Figure 5 that the gases generated after the TR of the battery are H2, CO, CO2, CH4, and some combustible alkene gases. In order to obtain the flammability limit of the gases, this paper uses the formula calculation method (L-C formula) to calculate and analyze the flammability limit of different battery samples. This method has been used in previous studies. Li et al. [46]. obtained the combustible limit concentration of the released gas of a commercial 18650 LIB through experiments and compared the results with the results calculated by the Le-Chatelier formula. It was found that the numerical error of the two was minimal, proving that it is reliable to calculate the explosion limit of the TR gas produced by the battery using the L-C formula. At the same time, because the gas production component contains CO2, the calculation method containing inert gas is used. The “pairing elimination method” is utilized to pair the inert gas and the combustible gas in the mixed gas as a “new” combustible gas, and then calculate the explosion limit of the mixed gas using the theoretical calculation formula containing the explosion limit of various combustible gas mixtures [47,48,49,50]. The explosion limits of various gas mixtures are as follows:
L m = 100 V 1 L 1 + V 2 L 2 + + V n L n
where Lm is the explosion limit of combustible gas mixture, %; L1, L2Ln are the explosion limits of components in the mixed gas, %; and V1, V2Vn are the volume fraction of each component in the mixed gas, %.
There are two aspects to evaluate the battery safety by the gas flammability limit. One is the size of the lower flammability limit of the gas. From the perspective of the three factors of combustion reaction (combustibles, oxygen, and ignitors), the lower the flammability limit of the gas, the easier it is to act as a combustor, and the more likely it is to burn and explode. The second is the combustible concentration range (upper limit of flammability and lower limit of flammability). The more extensive the combustible concentration range, the easier it is for the concentration of combustible gas in the environment to meet the conditions for combustion and explosion. When the concentration of combustible gas is lower than the lower limit of flammability (LFL) or higher than the upper limit of flammability (UFL), there will be no explosion risk, even if there is an ignition source because the gas concentration in the environment is too low or the oxygen concentration is too low. Figure 10 shows the calculated gas flammability limit results. The flammability concentration range of the NCM622 battery is the largest, 54%, and the lower flammability limit is 7%. The flammability concentration range of the NCM9/0.5/0.5 battery is the most negligible, 41%, and the lower flammability limit is 8.2%. It can be seen that, with the increase of the battery energy density, the flammability limit range of the gas generated by TR is gradually reduced, especially in the NCM system. The lower flammability limit is gradually increased with the energy density increase. The above analysis shows that increasing the battery energy density will reduce the battery deflagration risk from the perspective of the gas deflagration limit. It is worth noting that the lower flammability limit of the LFP battery is the lowest among the four samples, 6%, taking into account the effect of battery electrolyte eruption. For the LFP battery, it is also an important method to improve the safety of the battery by reducing the deflagration limit range and increasing the flammability limit of the TR gas.

4. Conclusions and Summary

In this study, the surface temperature, voltage change, mass loss, and gas production characteristic parameters of four kinds of LIBs with different systems were obtained by conducting side heating experiments on the samples in an inert atmosphere in a self-made sealed test chamber. Based on the analysis of the data, the following conclusions are obtained:
(1)
The critical triggering temperature of TR of the ternary high nickel system battery is lower than that of the LFP system, and the maximum temperature of the battery surface is much higher than that of the LFP system. Furthermore, the voltage drop of the battery during heating occurs 2–8 s before TR;
(2)
The NCM battery will eject gas and black solid particles during TR, while the LFP battery will eject unreacted electrolytes during TR, and the mass loss rate of the NCM battery during TR is higher than that of the LFP battery.
(3)
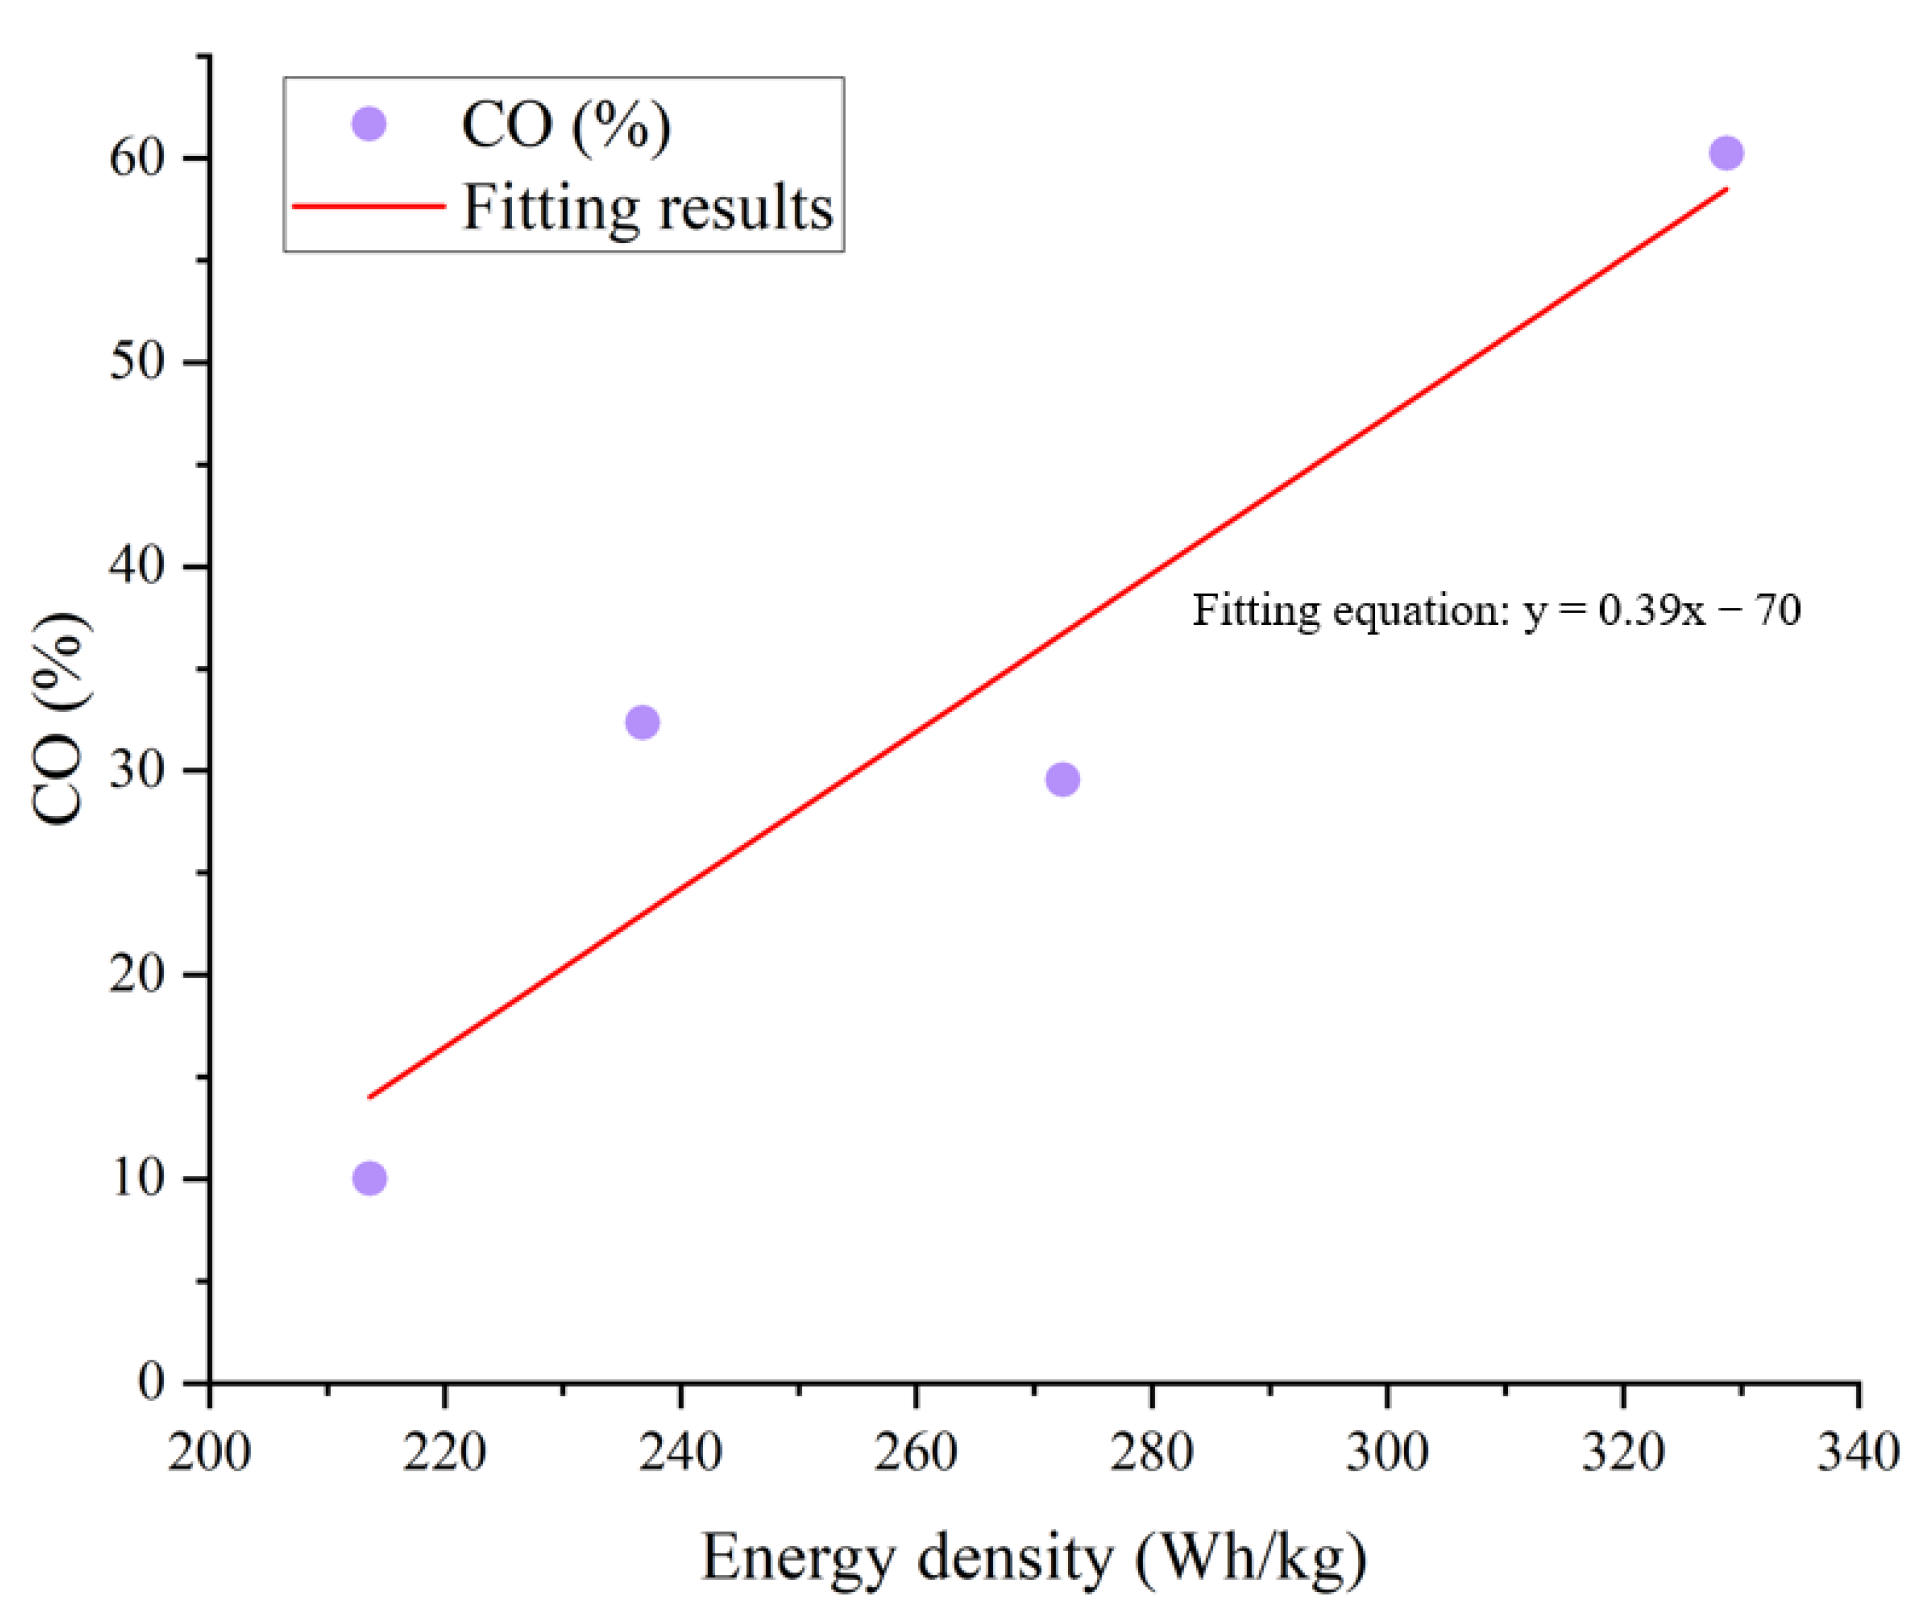
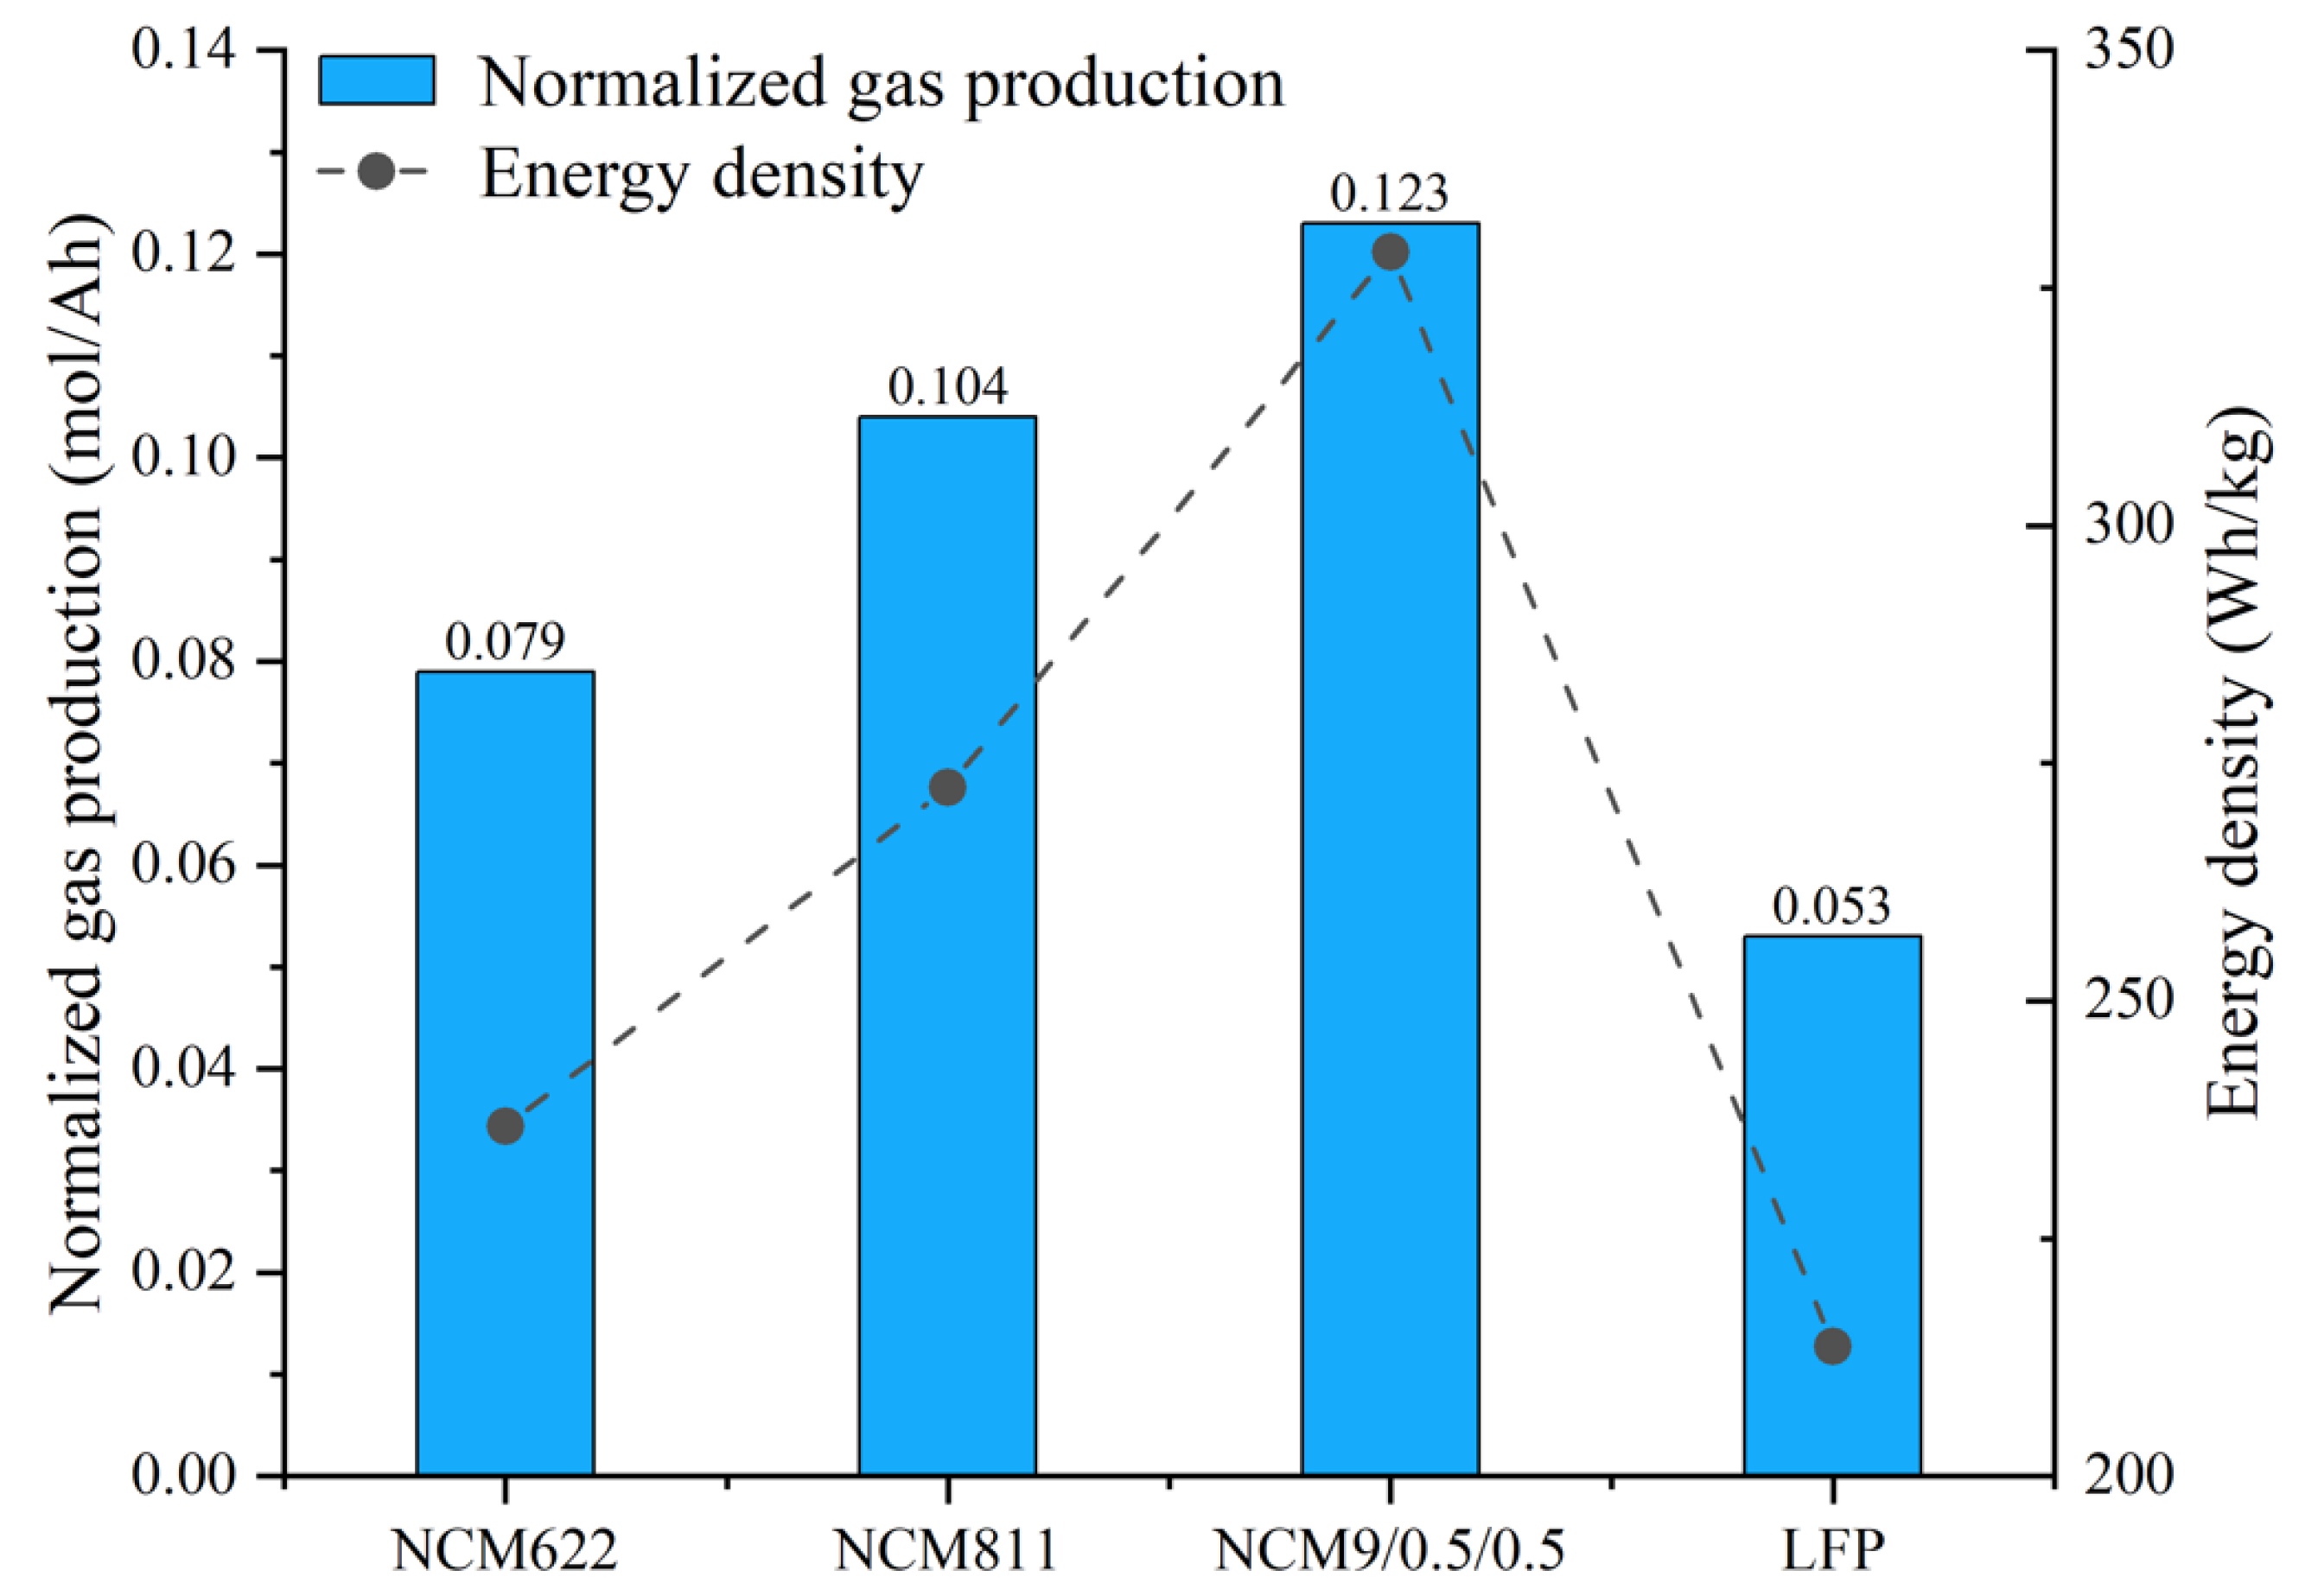
The batteries of the NCM system and the LFP system will produce CO, CO2, H2, CH4, C2H4, and other gases in the process of TR. The higher the energy density of the battery, the greater the concentration of CO gas produced, and the smaller the concentration of H2 gas. The normalized gas production of the NCM9/0.5/0.5 battery is the highest, and the normalized gas production of the LFP battery is the lowest.
(4)
The deflagration limit of gas generated by the TR of LIBs is related to the battery energy density. The higher the energy density, the lower the deflagration risk of gas generated. Among the four battery samples used in this study, the lower flammability limit of gas produced by the TR was that of the LFP battery.

5. Prospect Work

In addition to this study, analyzing the TR characteristics and gas production components of power/energy storage LIBs with various other materials, capacities, and battery types are necessary. Through summarizing the results obtained, it is hoped that appropriate evaluation standards (including fire safety warnings and fire protection measures) can be given to the fire safety and gas flammability limit of LIBs. The application of electric vehicles puts forward an improved scheme with higher safety.

Author Contributions

Conceptualization, X.Y.; methodology, X.Y., C.L. and H.S.; software, X.Y., Y.L. and S.C.; validation, H.W. and M.L.; writing—original draft preparation, X.Y., Y.L. and H.W.; writing—review and editing, X.Y., Y.L., M.L. and H.W.; visualization, X.Y., C.L., F.Q. and Y.Z.; supervision, X.F., Y.L. and M.O.; project administration, H.W., Y.L. and M.O.; funding acquisition, M.O. All authors have read and agreed to the published version of the manuscript.

Funding

This research was supported by the Ministry of Science and Technology of the People’s Republic of China under Grant No. 2019YFE0100200 and funded by the Guangdong Basic and Applied Basic Research Foundation (Grant No. 2021B1515130008), the National Natural Science Foundation of China (Grant No. 52207241), the China National Postdoctoral Program for Innovative Talents (Grant No. BX20220171), and the China Postdoctoral Science Foundation (Grant No. 2022M711760).

Institutional Review Board Statement

Not applicable.

Informed Consent Statement

Not applicable.

Data Availability Statement

The data is available through appropriate requests.

Conflicts of Interest

The authors declare no conflict of interest.

References

  1. Wang, Q.S.; Ping, P.; Zhao, X.J.; Chu, G.Q.; Sun, J.H.; Chen, C.H. Thermal runaway caused fire and explosion of lithium ion battery. J. Power Sources 2012, 208, 210–224. [Google Scholar] [CrossRef]
  2. Chen, S.; Zhang, G.; Zhu, J.; Feng, X.; Wei, X.; Ouyang, M.; Dai, H. Multi-objective optimization design and experimental investigation for a parallel liquid cooling-based Lithium-ion battery module under fast charging. Appl. Therm. Eng. 2022, 211, 118503. [Google Scholar] [CrossRef]
  3. Ou, H.; Huang, J.; Zhou, Y.; Zhu, J.; Fang, G.; Cao, X.; Li, J.; Liang, S. Surface-dominated ultra-stable sodium and potassium storage enabled by N/P/O tri-doped porous carbon. Chem. Eng. J. 2022, 450, 138444. [Google Scholar] [CrossRef]
  4. Zhang, H.; Zhang, J. An overview of modification strategies to improve LiNi0·8Co0 1Mn0·1O2 (NCM811) cathode performance for automotive lithium-ion batteries. eTransportation 2021, 7, 100105. [Google Scholar] [CrossRef]
  5. Chen, J.M. Carbon neutrality, Toward a sustainable future. Innovation 2021, 2, 100127. [Google Scholar] [CrossRef]
  6. Fachrizal, R.; Shepero, M.; Van Der Meer, D.; Munkhammar, J.; Widen, J. Smart charging of electric vehicles considering photovoltaic power production and electricity consumption: A review. eTransportation 2020, 4, 100056. [Google Scholar] [CrossRef]
  7. Lyu, P.Z.; Liu, X.J.; Qu, J.; Zhao, J.T.; Huo, Y.T.; Qu, Z.G.; Rao, Z.H. Recent advances of thermal safety of lithium ion battery for energy storage. Energy Storage Mater. 2020, 31, 195–220. [Google Scholar] [CrossRef]
  8. Wang, X.Y.; Wei, X.Z.; Zhu, J.G.; Dai, H.F.; Zheng, Y.J.; Xu, X.M.; Chen, Q.J. A review of modeling, acquisition, and application of lithium-ion battery impedance for onboard battery management. eTransportation 2021, 7, 100093. [Google Scholar] [CrossRef]
  9. Wu, C.J.; Wu, Y.; Xu, X.D.; Ren, D.S.; Li, Y.L.; Chang, R.Z.; Deng, T.; Feng, X.N.; Ouyang, M.G. Synergistic Dual-Salt Electrolyte for Safe and High-Voltage LiNi0.8Co0.1Mn0.1O2//Graphite Pouch Cells. ACS Appl. Mater. Interfaces 2022, 14, 10467–10477. [Google Scholar] [CrossRef]
  10. Amano, K.O.A.; Hahn, S.K.; Tschirschwitz, R.; Rappsilber, T.; Krause, U. An Experimental Investigation of Thermal Runaway and Gas Release of NMC Lithium-Ion Pouch Batteries Depending on the State of Charge Level. Batteries 2022, 8, 41. [Google Scholar] [CrossRef]
  11. Yu, W.; Guo, Y.; Shang, Z.; Zhang, Y.; Xu, S. A review on comprehensive recycling of spent power lithium-ion battery in China. eTransportation 2022, 11, 100155. [Google Scholar] [CrossRef]
  12. Marinaro, M.; Bresser, D.; Beyer, E.; Faguy, P.; Hosoi, K.; Li, H.; Sakovica, J.; Amine, K.; Wohlfahrt-Mehrens, M.; Passerini, S. Bringing forward the development of battery cells for automotive applications, Perspective of R&D activities in China, Japan, the EU and the USA. J. Power Sources 2020, 459, 228073. [Google Scholar]
  13. Dixon, J.; Bell, K. Electric vehicles, battery capacity, charger power, access to charging and the impacts on distribution networks. eTransportation 2020, 4, 100059. [Google Scholar] [CrossRef]
  14. Liao, C. Electrolytes and additives for batteries Part I: Fundamentals and insights on cathode degradation mechanisms. eTransportation 2020, 5, 100068. [Google Scholar] [CrossRef]
  15. Meng, X.D.; Li, S.; Fu, W.D.; Chen, Y.W.; Duan, Q.L.; Wang, Q.S. Experimental study of intermittent spray cooling on suppression for lithium iron phosphate battery fires. eTransportation 2022, 11, 100142. [Google Scholar] [CrossRef]
  16. Huang, W.S.; Feng, X.N.; Han, X.B.; Zhang, W.F.; Jiang, F.C. Questions and Answers Relating to Lithium-Ion Battery Safety Issues. Cell Rep. Phys. Sci. 2021, 2, 100285. [Google Scholar] [CrossRef]
  17. Feng, X.; Ouyang, M.; Liu, X.; Lu, L.; Xia, Y.; He, X. Thermal runaway mechanism of lithium ion battery for electric vehicles: A review. Energy Storage Mater. 2018, 10, 246–267. [Google Scholar] [CrossRef]
  18. Qiu, Y.; Jiang, F. A review on passive and active strategies of enhancing the safety of lithium-ion batteries. Int. J. Heat Mass Transfer 2022, 184, 122288. [Google Scholar] [CrossRef]
  19. Wildfeuer, L.; Lienkamp, M. Quantifiability of inherent cell-to-cell variations of commercial lithium-ion batteries. eTransportation 2021, 9, 100129. [Google Scholar] [CrossRef]
  20. Lee, E.-P. Analysis of car fire cases related to a lithium battery and cause investigation technique. Fire Sci. Eng. 2019, 33, 98–106. [Google Scholar] [CrossRef]
  21. Meng, J.; Guo, H.; Niu, C.; Zhao, Y.; Xu, L.; Li, Q.; Mai, L. Advances in structure and property optimizations of battery electrode materials. Joule 2017, 1, 522–547. [Google Scholar] [CrossRef]
  22. Singh, A.K.; Cao, L.; Ma, J.; Seo, J.; Bakis, C.E.; Zhang, Y.C.; Hickner, M.A.; Rahn, C.D. Design, manufacture and test of a novel structural battery based on sandwich construction. J. Sandw. Struct. Mater. 2015, 17, 666–690. [Google Scholar] [CrossRef]
  23. Yin, H.F.; Ma, S.; Li, H.G.; Wen, G.L.; Santhanagopalan, S.; Zhang, C. Modeling strategy for progressive failure prediction in lithium-ion batteries under mechanical abuse. eTransportation 2021, 7, 100098. [Google Scholar] [CrossRef]
  24. Kovachev, G.; Ellersdorfer, C.; Gstrein, G.; Hanzu, L.; Wilkening, H.M.R.; Werling, T.; Schauwecker, F.; Sinz, W. Safety assessment of electrically cycled cells at high temperatures under mechanical crush loads. eTransportation 2020, 6, 100087. [Google Scholar] [CrossRef]
  25. Liu, J.; Wang, Z.; Bai, J. Influences of multi factors on thermal runaway induced by overcharging of lithium-ion battery. J. Energy Chem. 2022, 70, 531–541. [Google Scholar] [CrossRef]
  26. Zhu, Y.; Xie, J.; Pei, A.; Liu, B.; Wu, Y.; Lin, D.; Li, J.; Wang, H.; Chen, H.; Xu, J.; et al. Fast lithium growth and short circuit induced by localized-temperature hotspots in lithium batteries. Nat. Commun. 2019, 10, 2067. [Google Scholar] [CrossRef] [Green Version]
  27. Dong, H.B.; Xian, X.L.; Ma, J.Q.; Yi, C.Y. Research on thermal runaway characteristics of lithium manganate battery. Fire Sci. Technol. 2022, 41, 21–25. [Google Scholar]
  28. Weng, J.; Ouyang, D.; Liu, Y.; Chen, M.; Li, Y.; Huang, X.; Wang, J. Alleviation on battery thermal runaway propagation, effects of oxygen level and dilution gas. J. Power Sources 2021, 509, 230340. [Google Scholar] [CrossRef]
  29. Liu, J.; Duan, Q.; Ma, M.; Zhao, C.; Sun, J.; Wang, Q. Aging mechanisms and thermal stability of aged commercial 18,650 lithium-ion battery induced by slight overcharging cycling. J. Power Sources 2020, 445, 227263. [Google Scholar] [CrossRef]
  30. Peng, Y.; Yang, L.; Ju, X.; Liao, B.; Ye, K.; Li, L.; Cao, B.; Ni, Y. A comprehensive investigation on the thermal and toxic hazards of large format lithium-ion batteries with LiFePO4 cathode. J. Hazard. Mater. 2020, 381, 120916. [Google Scholar] [CrossRef]
  31. Koch, S.; Fill, A.; Birke, K.P. Comprehensive gas analysis on large scale automotive lithium-ion cells in thermal runaway. J. Power Sources 2018, 398, 106–112. [Google Scholar] [CrossRef]
  32. Yuan, L.M.; Dubaniewicz, T.; Zlochower, I.; Thomas, R.; Rayyan, N. Experimental study on thermal runaway and vented gases of lithium-ion cells. Process Saf. Environ. Prot. 2020, 144, 186–192. [Google Scholar] [CrossRef]
  33. Wu, T.Q.; Chen, H.D.; Wang, Q.S.; Sun, J.H. Comparison analysis on the thermal runaway of lithium-ion battery under two heating modes. J. Hazard. Mater. 2018, 344, 733–741. [Google Scholar] [CrossRef]
  34. Wang, H.; Xu, H.; Zhang, Z.; Wang, Q.; Jin, C.; Wu, C.; Xu, C.; Hao, J.; Sun, L.; Du, Z.; et al. Fire and explosion characteristics of vent gas from lithium-ion batteries after thermal runaway: A comparative study. eTransportation 2022, 13, 100190. [Google Scholar] [CrossRef]
  35. Baird, A.R.; Archibald, E.J.; Marr, K.C.; Ezekoye, O.A. Explosion hazards from lithium-ion battery vent gas. J. Power Sources 2020, 446, 227257. [Google Scholar] [CrossRef]
  36. Zhang, Y.J.; Wang, H.W.; Li, W.F.; Li, C. Quantitative identification of emissions from abused prismatic Ni-rich lithium-ion batteries. eTransportation 2019, 2, 100031. [Google Scholar] [CrossRef]
  37. Zhong, G.; Mao, B.; Wang, C.; Jiang, L.; Xu, K.; Sun, J.; Wang, Q. Thermal runaway and fire behavior investigation of lithium-ion batteries using modified cone calorimeter. J. Therm. Anal. Calorim. 2019, 135, 2879–2889. [Google Scholar] [CrossRef]
  38. Bugryniec, P.J.; Davidson, J.N.; Brown, S.F. Assessment of thermal runaway in commercial lithium iron phosphate cells due to overheating in an oven test. 3rd Annual Conference on Energy Storage and its Applications (CDT-ESA-AC). Energy Procedia 2018, 151, 74–78. [Google Scholar] [CrossRef]
  39. Chen, S.; Wang, Z.; Yan, W. Identification and characteristic analysis of powder ejected from a lithium-ion battery during thermal runaway at elevated temperatures. J. Hazard. Mater. 2020, 400, 123169. [Google Scholar] [CrossRef]
  40. Jia, Z.; Qin, P.; Li, Z.; Wei, Z.; Jin, K.; Jiang, L.; Wang, Q. Analysis of gas release during the process of thermal runaway of lithium-ion batteries with three different cathode materials. J. Energy Storage 2022, 50, 104302. [Google Scholar] [CrossRef]
  41. Xiang, H.F.; Wang, H.; Chen, C.H.; Ge, X.W.; Guo, S.; Sun, J.H.; Hu, W.Q. Thermal stability of LiPF6-based electrolyte and effect of contact with various delithiated cathodes of Li-ion batteries. J. Power Sources 2009, 191, 575–581. [Google Scholar] [CrossRef]
  42. Huang, Z.H.; Li, H.; Mei, W.X.; Zhao, C.P.; Sun, J.H.; Wang, Q.S. Thermal Runaway Behavior of Lithium Iron Phosphate Battery During Penetration. Fire Technol. 2020, 56, 2405–2426. [Google Scholar] [CrossRef]
  43. Sturk, D.; Rosell, L.; Blomqvist, P.; Tidblad, A.A. Analysis of Li-ion battery gases vented in an inert atmosphere thermal test chamber. Batteries 2019, 5, 61. [Google Scholar] [CrossRef] [Green Version]
  44. Jiang, J.W.; Fortier, H.; Reimers, J.N.; Dahn, J.R. Thermal stability of 18,650 size Li-ion cells containing LiBOB electrolyte salt. J. Electrochem. Soc. 2004, 151, A609–A613. [Google Scholar] [CrossRef]
  45. Yang, H.; Zhuang, G.V.; Ross, P.N. Thermal stability of LiPF6 salt and Li-ion battery electrolytes containing LiPF6. J. Power Sources 2006, 161, 573–579. [Google Scholar] [CrossRef] [Green Version]
  46. Li, W.F.; Wang, H.W.; Zhang, Y.J.; Ouyang, M.G. Flammability characteristics of the battery vent gas: A case of NCA and LFP lithium-ion batteries during external heating abuse. J. Energy Storage 2019, 24, 100775. [Google Scholar] [CrossRef]
  47. Luo, Z.; Liang, H.; Wang, T.; Cheng, F.; Su, B.; Liu, L.; Liu, B. Evaluating the effect of multiple flammable gases on the flammability limit of CH4: Experimental study and theoretical calculation. Process Saf. Environ. Prot. 2021, 146, 369–376. [Google Scholar] [CrossRef]
  48. Hu, X.; Yu, Q.; Sun, N.; Qin, Q. Experimental study of flammability limits of oxy-methane mixture and calculation based on thermal theory. Int. J. Hydrog. Energy 2014, 39, 9527–9533. [Google Scholar] [CrossRef]
  49. Wang, T.; Liang, H.; Luo, Z.; Su, B.; Liu, L.; Su, Y.; Wang, X.; Cheng, F.; Deng, J. Near flammability limits behavior of methane-air mixtures with influence of flammable gases and nitrogen: An experimental and numerical research. Fuel 2021, 294, 120550. [Google Scholar] [CrossRef]
  50. Huang, L.; Pei, S.; Wang, Y.; Zhang, L.; Ren, S.; Zhang, Z.; Xiao, Y. Assessment of flammability and explosion risks of natural gas-air mixtures at high pressure and high temperature. Fuel 2019, 247, 47–56. [Google Scholar] [CrossRef]
Figure 1. Pictures of experimental cabin. (a) Structure diagram of experimental cabin. (b) Physical picture of experimental cabin.
Batteries 08 00250 g001
Figure 2. Layout diagram of the experimental battery. (a) Schematic diagram of experimental arrangement. (b) The layout of the experiment. (c) Voltage measurement wiring diagram.
Batteries 08 00250 g002aBatteries 08 00250 g002b
Figure 3. Battery surface temperature and voltage record. (a) Sample surface temperature and voltage changes. (b) Voltage change curve.
Batteries 08 00250 g003
Figure 4. Voltage change rate.
Batteries 08 00250 g004
Figure 5. Gas production composition and volume percentage of four samples. (a) Sample No.1 (NCM622). (b) Sample No.2 (NCM811). (c) Sample No. 3 (NCM9/0.5/0.5). (d) Sample No. 4 (LFP).
Batteries 08 00250 g005
Figure 6. Normalized results of each component gas.
Batteries 08 00250 g006
Figure 7. Relationship between CO concentration and battery energy density.
Batteries 08 00250 g007
Figure 8. Relationship between H2 concentration and battery energy density.
Batteries 08 00250 g008
Figure 9. Normalization results of gas production.
Batteries 08 00250 g009
Figure 10. Flammability limit of gas after thermal runaway.
Batteries 08 00250 g010
Table 1. Experimental battery parameters.
Sample
Name
Nominal
Voltage
(V)
Rated
Capacity
(Ah)
Energy
Density
(Wh/kg)
Battery
Quality
(g)
State of
Charge
(%)
NCM6224.350236.78908100
NCM8114.3115272.451815100
NCM9/0.5/0.54.3165328.782158100
LFP3.65196213.623349100
Table 2. Key parameters of four batteries.
Sample NameThermal Runaway Trigger Temperature
(°C)
Thermal Runaway
Maximum Temperature
(°C)
Mass Loss Rate
(%)
Exhaust Time
(s)
Thermal Runaway
Product
NCM622154.7559.138.1276Gas and solid particles
NCM811120.8803.437.8084Gas and solid particles
NCM9/0.5/0.5130.8842.172.8962Gas and solid particles
LFP135.4360.922.80408Gas and unreacted electrolyte
Publisher’s Note: MDPI stays neutral with regard to jurisdictional claims in published maps and institutional affiliations.

