Article

Electrochemical Performance of Li2TiO3//LiCoO2 Li-Ion Aqueous Cell with Nanocrystalline Electrodes

by
Ambadi Lakshmi-Narayana
1,
Kapu Sivajee-Ganesh
2,
Merum Dhananjaya
1,
Arghya Narayan-Banerjee
1,*,
Christian M. Julien
3,* and
San-Woo Joo
1,*
1
School of Mechanical and IT Engineering, Yeungnam University, Gyeongsan 38541, Korea
2
Department of Physics, Rajiv Gandhi University of Knowledge Technologies, Srikakulam 532402, India
3
Institut de Minéralogie, de Physique des Matériaux et de Cosmochimie (IMPMC), Sorbonne Université, CNRS-UMR 7590, 4 Place Jussieu, 75252 Paris, France
*
Authors to whom correspondence should be addressed.
Batteries 2022, 8(10), 149; https://doi.org/10.3390/batteries8100149
Submission received: 26 July 2022 / Revised: 4 September 2022 / Accepted: 29 September 2022 / Published: 1 October 2022
(This article belongs to the Special Issue Feature Papers to Celebrate the First Impact Factor of Batteries)

Abstract

:
A challenge in developing high-performance lithium batteries requires a safe technology without flammable liquid electrolytes. Nowadays, two options can satisfy this claim: all-solid-state batteries and aqueous-electrolyte batteries. Commercially available Li-ion batteries utilize non-aqueous electrolytes (NAE) owing to a wide potential window (>3 V) that achieves high energy density but pose serious safety issues due to the high volatility, flammability, and toxicity of NAE. On the contrary, aqueous electrolytes are non-flammable, low-toxic, and have a low installation cost for humidity control in the production line. In this scenario, we develop a new aqueous rechargeable Li-ion full-cell composed of high-voltage cathode material as LiCoO2 (LCO) and a safe nanostructured anode material as Li2TiO3 (LTO). Both pure-phase LTO and LCO nanopowders are prepared by hydrothermal route and their structural and electrochemical properties are studied in detail. Simultaneously, the electrochemical performances of these electrodes are tested in both half- and full-cell configurations in presence of saturated 1 mole L−1 Li2SO4 aqueous electrolyte medium. Pt//LCO and Pt//LTO half-cells deliver high discharge capacities of 142 and 133 mAh g−1 at 0.5 C rate with capacity retention of ~95% and 94% after 50 cycles with a Coulombic efficiency of 98.25% and 99.89%, respectively. The electrochemical performance of a LTO//LCO full cell is investigated for the first time. It reveals a discharge capacity of 135 mAh g−1 at 0.5 C rate (50th cycle) with a capacity retention of 94% and a Coulombic efficiency of 99.7%.

1. Introduction

Rechargeable lithium-ion batteries (LIBs) are considered as one of the most ubiquitous electrochemical generators. Due to their relatively high balanced specific energy and power, long calendar life cycling stability and less manufacturing cost, they are widely applied in daily life applications such as portable digital electronic devices (such as laptops, cameras, personal digital assistants (PDAs), handheld phones, etc., [1,2]) and low-emission eco-friendly electrical vehicles (EVs) and hybrid electrical vehicles (HEVs) [3]. In addition, Li-ion secondary batteries are ideal systems to store electricity from renewable sources of energy such as wind mills and solar cells. Their attractivity comes from many factors such as: (i) by nature Li is the lightest metal with high electro-positivity, (ii) LIBs endeavor a balanced substantial volumetric density (Wh L−1) and gravimetric density of energy (Wh kg−1) [4]. In contemporary studies, abundant configurations have been proposed for the next generation LIBs based on a large variety of chemistries for anode, cathode, and electrolyte materials [5]. However, the main drawback of LIBs is their hazardous safety due to the use of flammable organic electrolytes that cannot withstand misuse, such as overcharging or short-circuiting [6]. The development of “green” and safer lithium-ion batteries with a non-flammable and low-toxic aqueous electrolyte has been explored in the mid-1990s [7]. Generally, aqueous rechargeable lithium batteries (ARLBs) use lithium-insertion compounds such as LiCoO2 (LCO) [8], LiMn2O4 (LMO) [9,10], LiFePO4 (LFP) [11], and LiNi1/3Mn1/3Co1/3O2 (NMC333) [12] as cathode materials, which have an intercalation potential lying with the electrochemical stability window of the aqueous electrolyte at high pH value. Layered-structured LCO is a reliable cathode material showing a great cycling stability, much better than spinel-structured LMO, which suffers from poor long-life cycling, and olivine-structured LFP, which displays a low energy density, while NMC333 containing-Ni is humidity sensitive. Anode materials of ARLBs include titanium-based oxides such as Li4Ti5O12 [13,14], TiO2 anatase [15,16], TiO2(B) [17], and LiTi2(PO4)3 [18]. These titanium oxides synthesized with a nanomorphology are believed to have better properties than those of their bulk counterparts. This has been demonstrated in the case of the monoclinic Li2TiO3 phase (denoted LTO hereafter). Bhatti et al. demonstrated that for 0.3 μm LTO particles, a weak electrochemical activity with initial discharge capacity of 12–17 mAh g−1 at a current density of 0.2 C is observed [19]. In contrast, Lakshmi-Narayana et al. reported that nanostructured LTO (~50 nm particle size) delivers a specific discharge capacity of 122 mAh g−1 in the potential range 0–1 V. Consequently, LTO can be a candidate for anode material of ARLBs, exhibiting a working potential window of ~0.8 V vs. Li+/Li against standard organic electrolytes with good thermal stability. The nanosized structure of LTO can easily be achieved by tuning the synthesis parameters that result in excellent electrochemical performance with enhanced volumetric energy density.
Among ARLBs made with titanium oxide anodes, the LiMn2O4//TiO2 cell using a water-in-bisalt electrolyte (LiTFSI/LiOTf/H2O) shows a specific capacity of 48 mAh g−1 at 0.5C rate (75 mA g−1) between 0.8 and 2.5 V [20]. The cell made with LiMn2O4 as cathode and Li4Ti5O12 as anode and 42 m LiTFSI + 21 m Pyr14·TFSI as aqueous gel electrolyte delivered a total electrode capacity of 58 mAh g−1 after 150 cycles at 0.2C [21]. The LiCoO2//Li4Ti5O12 Li-ion cell using the Li(PTFSI)0.6(TFSI)0.4·1.15H2O hydrate-melt electrolyte exhibited a specific capacity of ~75 mAh g−1 after 100 cycles at 0.2C rate [14]. Recently, Zhou et al. demonstrated that the LiMn2O4//TiO2(B) full cell delivered a specific capacity of ~115 mAh g−1 after 400 cycles at 1C rate in water-in-salt aqueous electrolyte [17]. The LiMn2O4//TiP2O7 aqueous full-cell, in which the anode is the nanocomposite TiP2O7 (50–100 nm) encapsulated in the pore of expanded graphite, had an open circuit voltage of 1.5 V and delivered a specific capacity of 42 mAh g−1 at 0.5 A g−1 in 1 mol L−1 Li2SO4 solution [22].
Among ARLBs made with LiCoO2 cathodes, the LiCoO2//Mo6S8 aqueous full-cell showed an out-voltage of 2 V and delivered an initial specific capacity of 40 mAh g−1 and showed an extremely low-capacity decay rate of 0.013% per cycle [23]. Cyclability experiments in aqueous electrolytes have shown the excellent stability of LCO [24,25]. By using the 3D hierarchy LiCoO2 nanorod arrays as cathode, Xue et al. tested a flexible aqueous LiCoO2//LiTi2(PO4)3 cell, which demonstrated a specific capacity of 112 mAh g−1 after 2000 cycles at 1C rate [18]. Using commercial electrode powders and 1 mol L−1 LiNO3 solution, Ruffo et al. constructed a LiCoO2//Li0.5Mn2O4 aqueous full-cell and reported a gravimetric capacity of 105 mAh g−1 after 25 cycles at 1C rate [24]. Oh et al. investigated the interfacial degradation of the LCO electrode under various pH conditions using surface and bulk X-ray spectroscopy [26].
Various synthesis routes have been reported for the preparation of nanocrystalline Li2TiO3 and LiCoO2. Due to the possible material mixing at the molecular level, the wet-chemistry is the most popular synthesis associated with post-annealing treatment to obtain well-crystallized Li2TiO3 and LiCoO2 phases [27]. In another hand, the hydrothermal method using low-cost setup has many advantages such as preparation of large variety of oxides and simple synthesis procedure [28]. Furthermore, the ability to precipitate crystallized powders directly from solution regulates the growth rate with uniform nucleation, which affect the morphology, size, and aggregation control. Expensive surfactants or template are not necessary in hydrothermal synthesis, which appears to be suitable for the production of large-scale specimens with highly nanostructured crystallinity [29].
In the present work, we take the option of coupling Li2TiO3 and LiCoO2 and test the kinetics of a Li2TiO3//LiCoO2 aqueous-type full-cell. Nanocrystalline LTO and LCO powders are prepared by a simple hydrothermal synthesis. While several reports demonstrate the electrochemical performance of full cells including the spinel Li4T5O12 anode, there is no study (to best of the Authors’ knowledge) showing the features of a Li2TiO3//LiCoO2 aqueous full-cell, so far. The structural and electrochemical properties are investigated using analytical methods such as cyclic voltammetry (CV), galvanostatic charge-discharge (GCD), electrochemical impedance spectroscopy (EIS), and long-life cycling experiments in half-cells (using Pt metal as negative electrode) as well as in LTO//LCO full-cell.

2. Results and Discussion

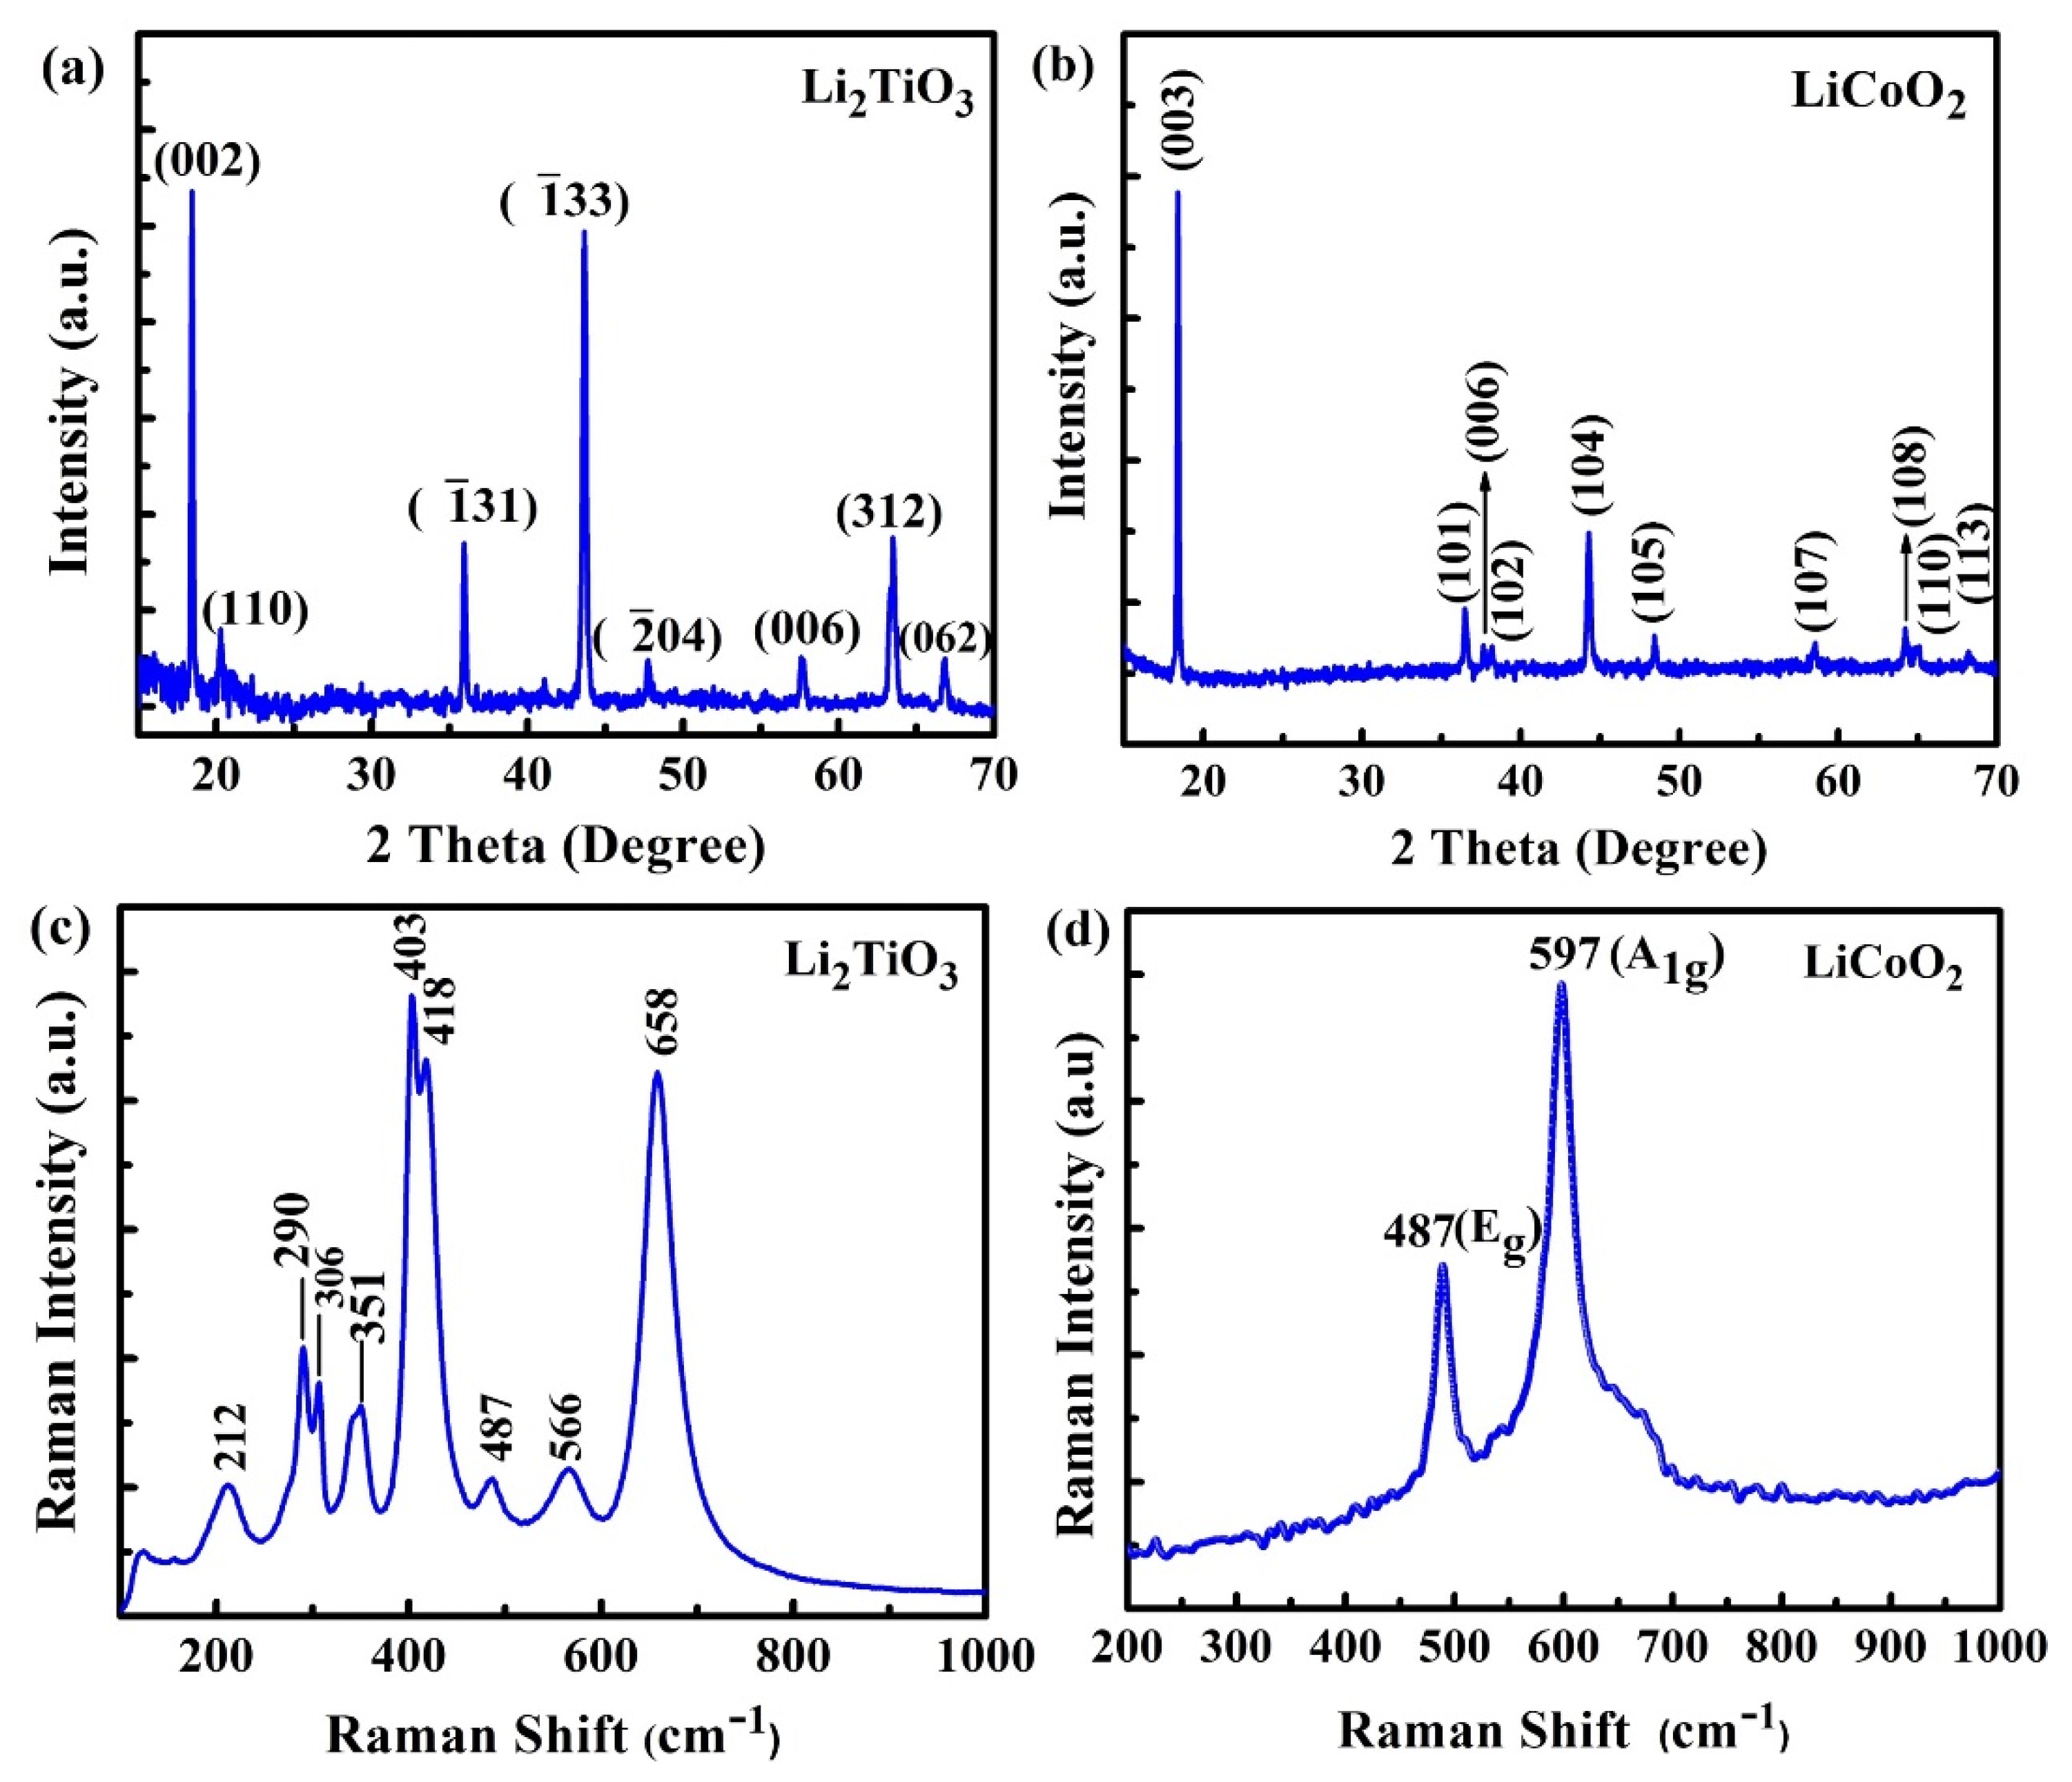
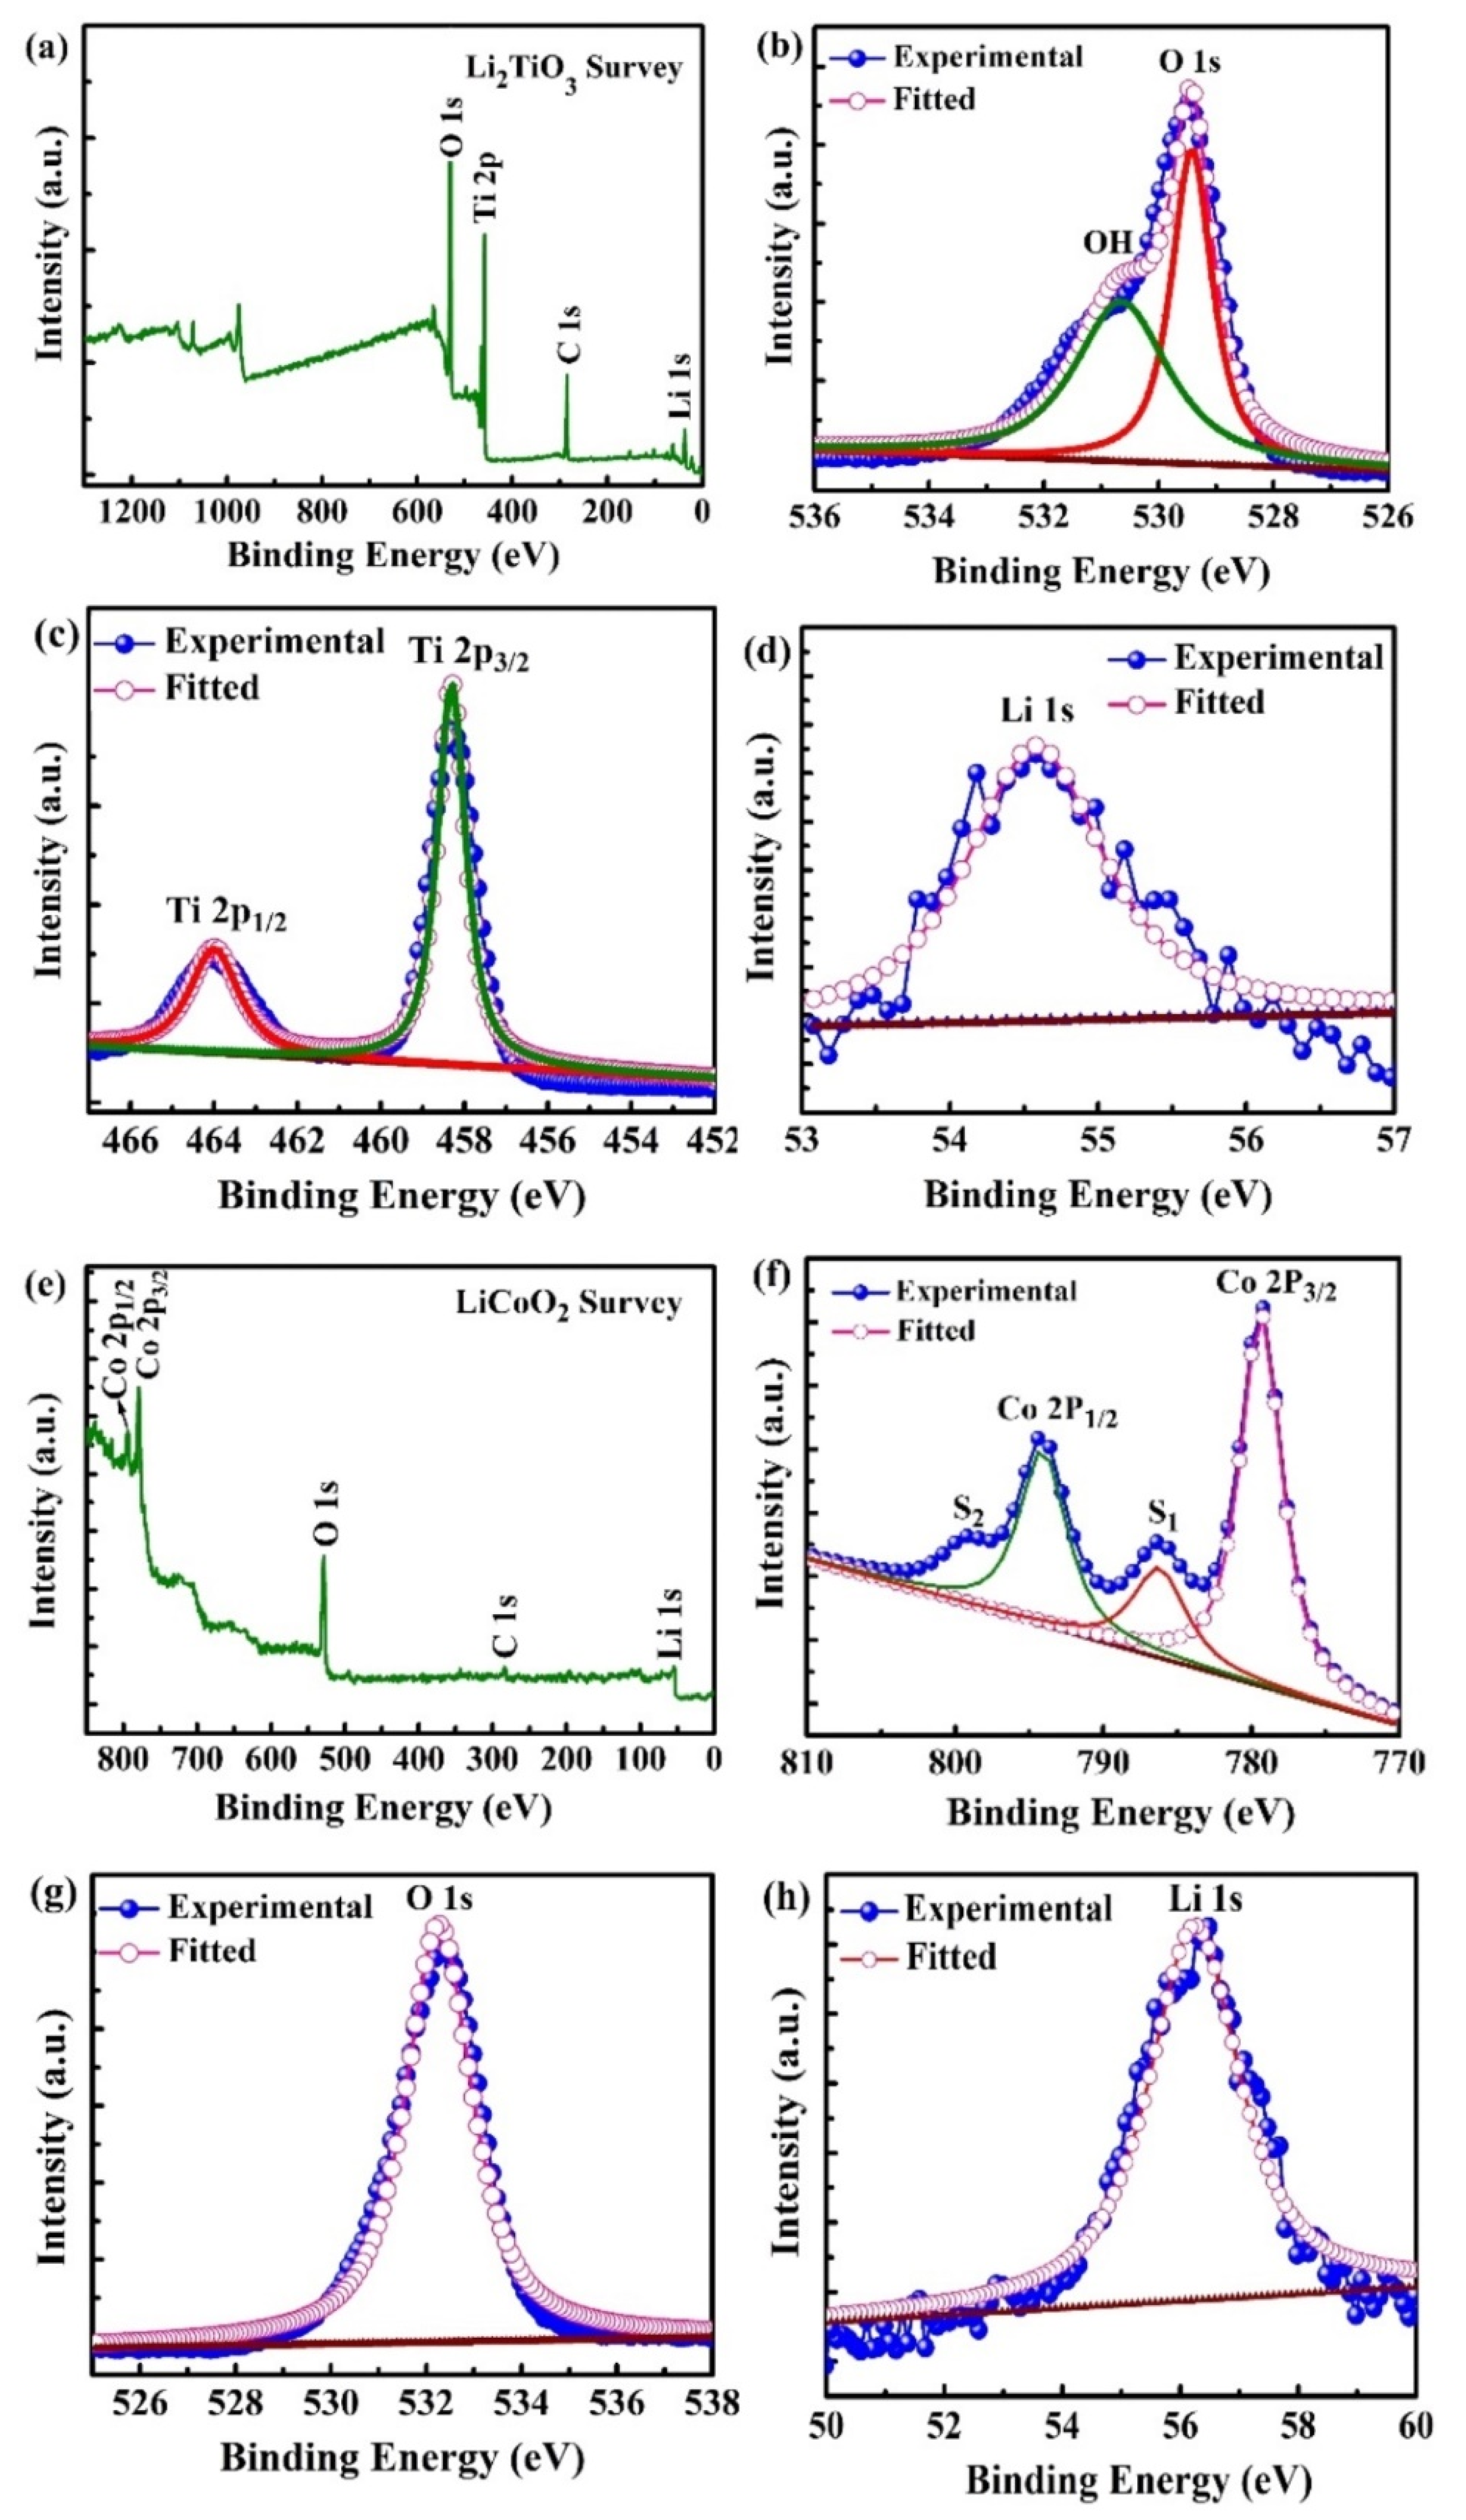
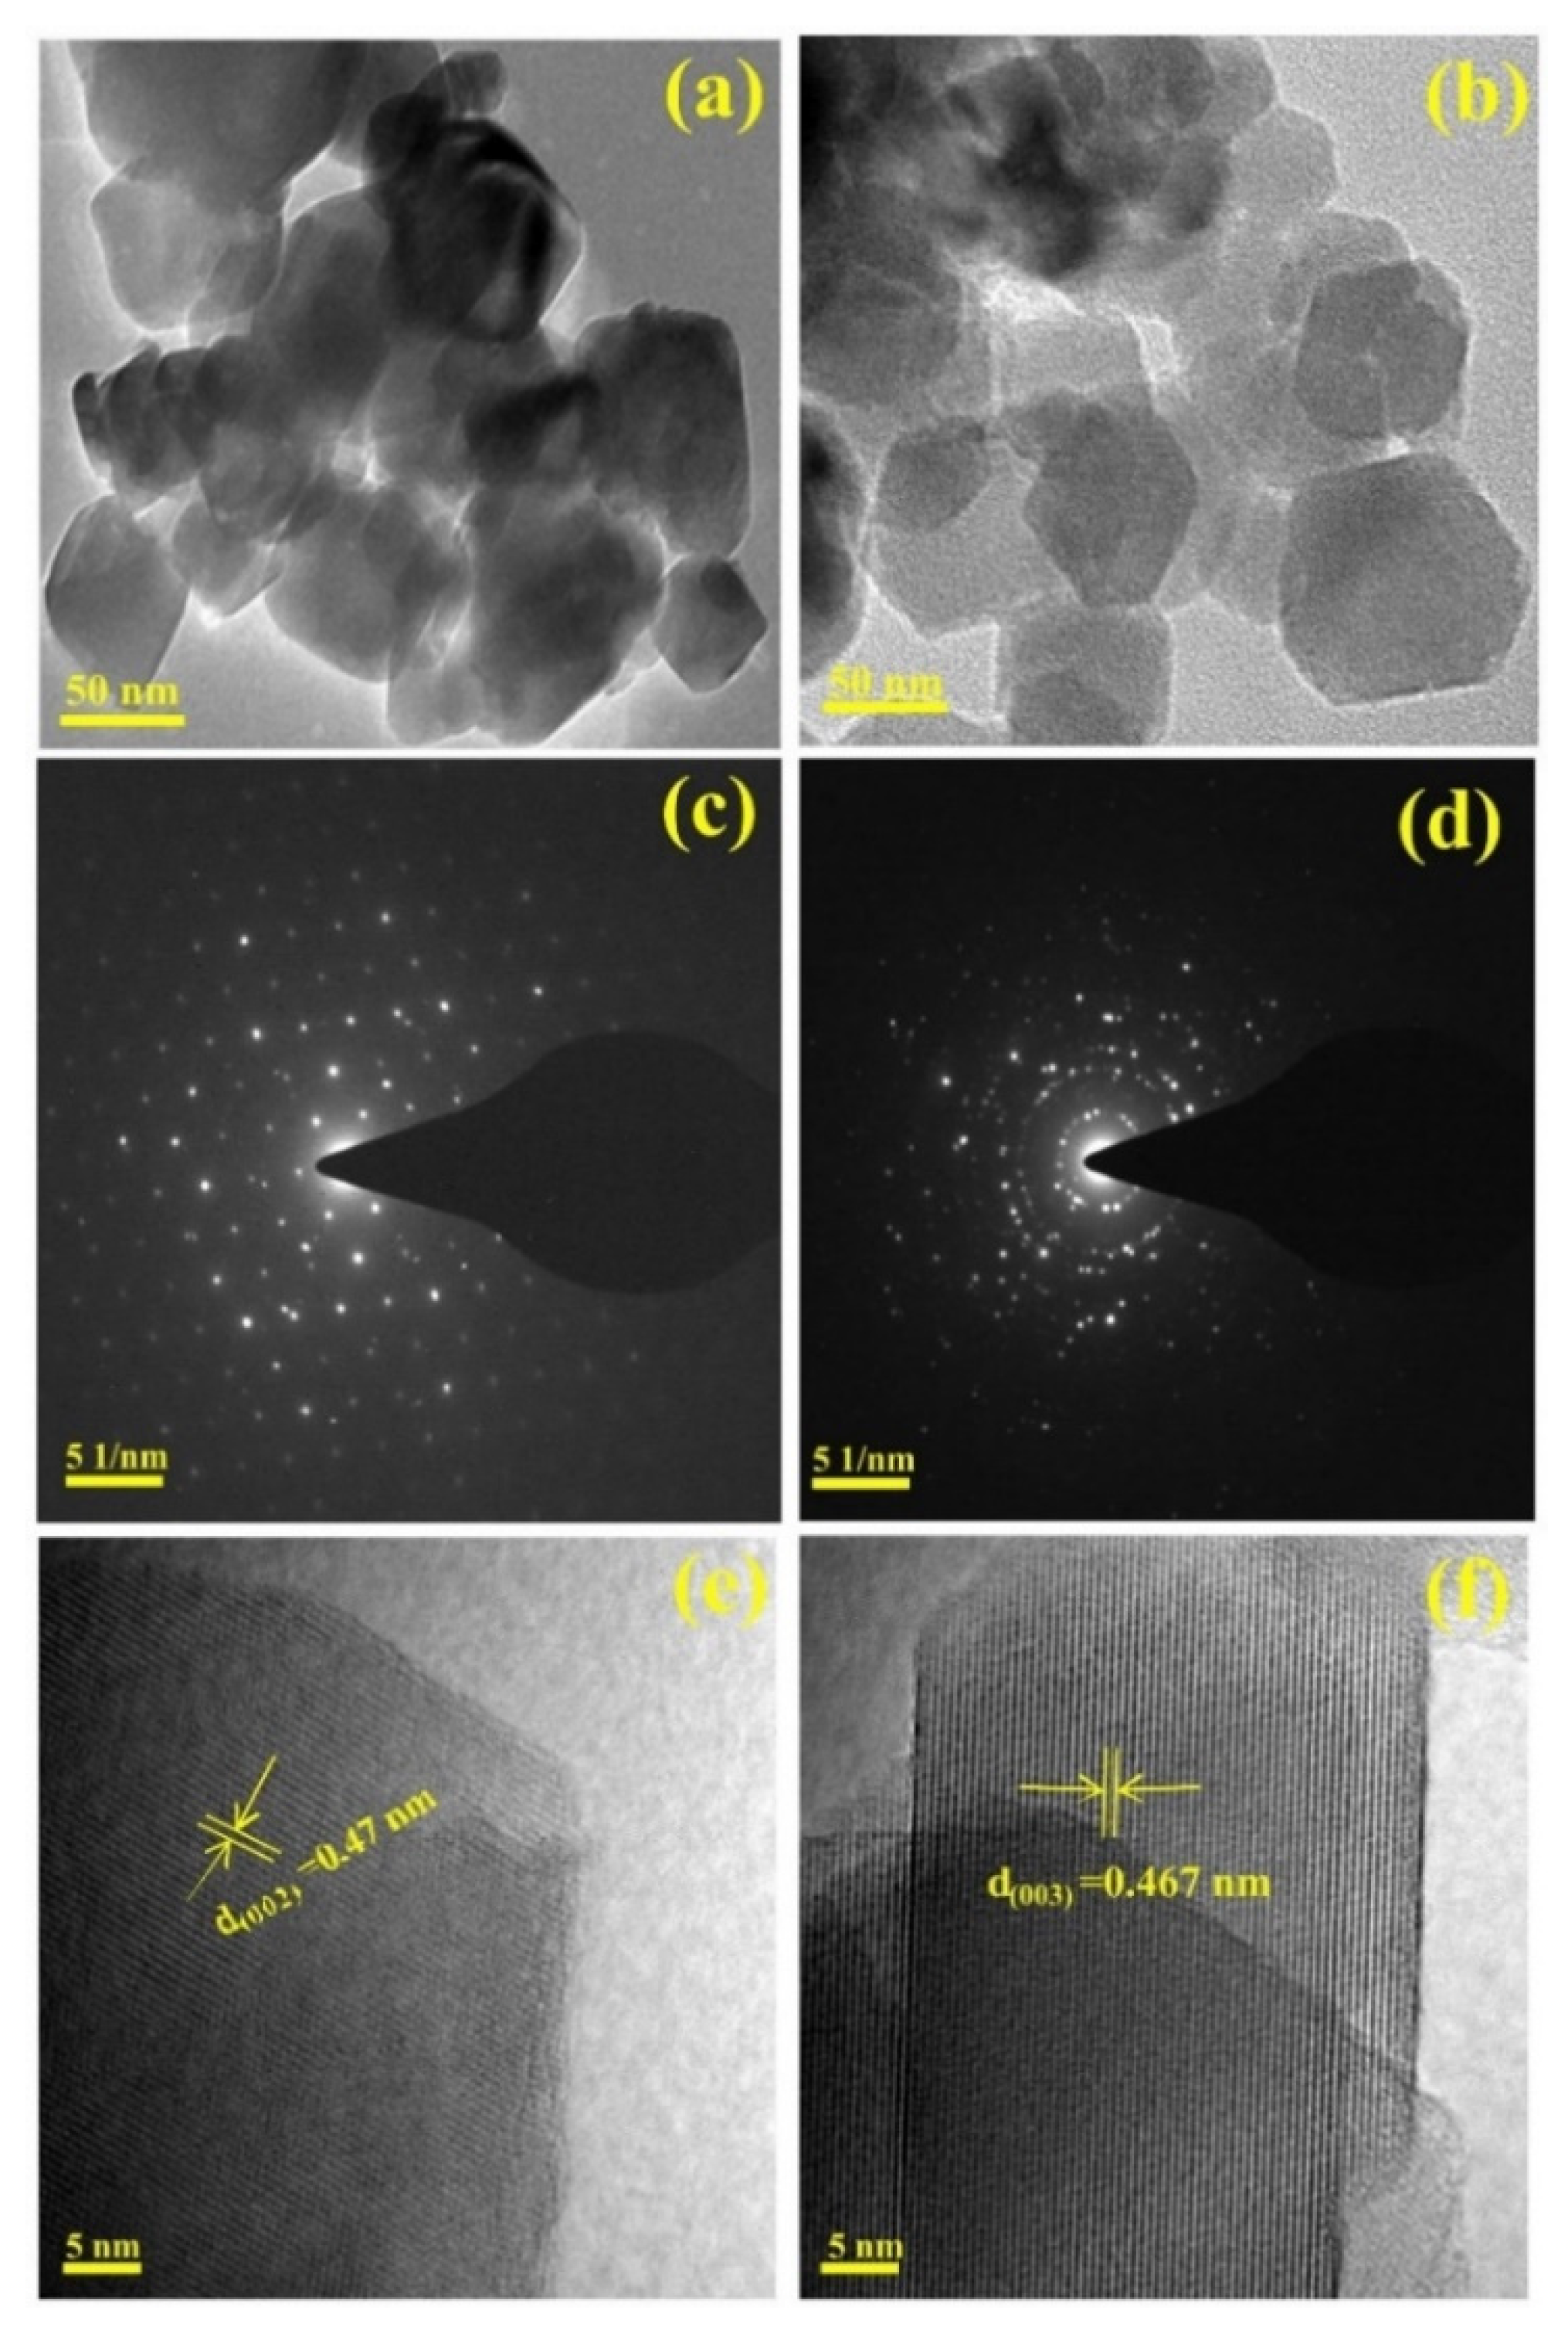
2.1. Structural and Elemental Analyses

The long- and short-range structural properties of LTO and LCO were investigated by XRD and Raman spectroscopy, respectively (Figure 1a–d). In Figure 1a, the XRD pattern of LTO exhibits a predominant (002) orientation at 2θ = 18.48° along with other characteristic planes of (101), ( 1 ¯ 31), ( 1 ¯ 33), ( 2 ¯ 04), (006), (312), and (062) corresponding to the monoclinic structure of the β-Li2TiO3 ordered phase with C2/c space group (JCPDS card No. 33-0831).
The Li-Ti-O framework is formed during the hydrothermal synthesis reaction; it is characterized by the basal lattice plane ( 1 ¯ 33), suggesting the correct ordering of lithium and titanium ions in the LiTi2 slab of the monoclinic structure. In the Li2TiO3 crystal, Li, Ti, and O atoms are arranged in the sequence Liinterslab(Li1/3Ti2/3)slabO2, in which Ti ions occupy 2/3 of other 4e sites (Wyckoff notation) and Li ions occupy 1/3 of 4e sites [30]. The elementary unit volume (V = abc sinβ for a monoclinic lattice) is 429.1 A3. These results are in good agreement with the results of the literature [31]. The XRD pattern of LCO powders (Figure 1b) exhibits the characteristic high-intensity peak located at 2θ = 18.39° corresponding to the (003) reflection accompanied with other reflections indexed as (101), (006), (102), (104), (005), (107), (108), (110), and (113), which are the typical patterns of the high-temperature HT-LCO phase with the α-NaFeO2 rock-salt structure (JCPDS card No. 50-0653) [32].
The crystallite size Lc of as-prepared samples was estimated using the Debye–Scherrer formula [33]:
L c = K λ β cos θ ,  
where β is the full-width at half-maximum (FWHM expressed in radians), λ is the wavelength of X-ray radiation (0.15406 nm), θ the Bragg angle, and K is a dimensionless shape factor (K = 0.94 for spherical-like particle). The crystallite size Lc was calculated by considering the (002) reflection line for LTO and (003) reflection line for LCO. The estimated crystallite size is 32 ± 2 and 50 ± 2 nm for LTO and LCO powders, respectively.
Figure 1c,d present the RS spectra of Li2TiO3 and LiCoO2 nanopowders, respectively, collected in the 100–1000 cm−1 spectral range. The RS spectrum of LTO (Figure 1c) displays the typical fingerprints of the monoclinic Li2TiO3 phase, in which the existence of Li+ ions in different co-ordinations is characterized by the stretching modes of Li-O bonds in LiO6 and LiO4 polyhedra at 411 and 283 cm−1, respectively. The strongest band at 658 cm−1 is attributed to the Ti-O stretching vibration of TiO6 octahedra. The peak at 290 cm−1 is assigned to the O-Li-O bending mode, while the O-Ti-O bending vibration is recorded at 212 cm−1 [34]. However, the characteristic peaks at 144 cm−1 (anatase TiO2) and at 451/615 cm−1 (rutile TiO2) respectively, do not exist confirming the phase purity of Li2TiO3. The RS spectrum of the HT-LiCoO2 phase (Figure 1d) shows the two well-defined Eg and A1g vibrational modes of the α-NaFeO2-type structure (R-3m symmetry) located at 488 and 598 cm−1, respectively. The Eg mode is attributed to the asymmetric bending mode of O–Co–O, i.e., the vibration of oxygen atom in ab-plane, while the A1g mode is assigned to the symmetric stretching mode of Co–O, i.e., the oxygen atoms vibration along the c-axis [35]. These results strongly evidenced that the hydrothermally synthesized LTO and LCO nanopowders are phase-pure electrode materials suitable for further electrochemical performance.
Elemental composition and valence-state analyses of the as-prepared Li2TiO3 and LiCoO2 nanopowders are characterized by X-ray photoelectron spectroscopy as reported in Figure 2a–h. The survey XPS spectrum of LTO shown in Figure 2a evidences the high chemical purity of the material by the presence of Li, Ti(IV), and O peaks. Figure 2b–d shows the high-resolution scan of the O 1s, Ti 2p, and Li 1s spectra, respectively. In Figure 2c, the Ti 2p spectrum exhibits the typical doublet of the spin-orbit splitting Ti 2p3/2 and Ti 2p1/2 with binding energy at about 458.26 and 464. 08 eV respectively, which matches well with literature data [36,37]. A good agreement is obtained between experimental and fitted spectra using only one deconvolution peak revealing the unique valence state 4+ of Ti ions in Li2TiO3. Moreover, the splitting between the binding energies of 2p3/2 and 2p1/2 core levels of 5.82 eV is in good agreement with the standard response of Li2TiO3 [38]. No trace of Ti3+ ions are evidenced by the fitting (Figure 2c) in the limit of XPS detection (tenths of a percent), which indicate the good stoichiometry of Li2TiO3. Figure 2b shows the intense peak of the O 1s core level at binding energy of 529.49 eV related to the Ti-O bonding in LTO with an additional weak peak at ~531.22 eV associated to adsorbed species such as LiOH or Li2O [39]. The presence of Li is confirmed by the peak of the Li 1s photoelectrons at binding energy of 54.57 eV shown in Figure 2d [40].
Figure 2e shows the wide-scan spectrum of LCO, which exhibits the characteristic XPS features of Co (III), O, and Li elements. The spectrum of the Co 2p photoelectrons shown in Figure 2f exhibits the main lines characteristics of 2p3/2 and 2p1/2 core levels at the binding energy of 779.23 and 793.53 eV with an intensity ratio of 2.25 due to the spin-orbit coupling and the corresponding satellite peaks at 799.91 and 786.22 eV (ascribed as S1 and S2). The main lines together with a satellite peak (shake-up) in the XPS spectrum of Co 2p can be deconvoluted using a single component indicating the excellent stoichiometry of LiCoO2, in which all Co ions are in the unique 3+ oxidation state. The binding energies and the intensity ratio of the 2p3/2/2p1/2 components of 2.25 matches well with reported values for low-spin Co3+ oxidation state in LiCoO2 crystal [41]. It can be noticed that the binding energy separation of the 2p3/2 and 2p1/2 core level of about 14.3 eV corroborates well with the features of LiCoO2 nanopowders [42]. The satellite with its corresponding position is strongly dependent on the valence state and the environment of the metallic ion. Figure 2g depicts the strong O 1s core peak of the XPS spectrum of LiCoO2 at binding energy of 528.72 eV that is assigned to oxygen atoms of the crystalline network. The characteristic peak at low binding energy of 56.55 eV evidences the existence of Li in the compound shown in Figure 2h. Apart from the survey XPS spectrum of LTO and LCO, the C1s peak located at 284.72 eV for LTO and 283.90 eV for LCO is attributed to spurious amounts of surface carbon (C=C) [43]. Thus, the presence of mixed oxidation states in both Li2TiO3 and LiCoO2 is excluded reflecting well-crystallized materials. By XPS characterization, within the detection limit of probing the interface within 8–10 nm collected by XPS, the valence states are revealed to be 3+ and 4+ for Co and Ti, respectively.
The microstructure, surface morphological features, and elemental composition analysis of hydrothermal-synthesized Li2TiO3 and LiCoO2 nanopowders were investigated by HRTEM, FE-SEM, and EDX experiments, respectively (Figure 3 and Figure 4). Figure 3a,b show the low magnification bright field TEM image of Li2TiO3 and LiCoO2 nanopowders obtained the final calcination step, respectively. The low magnification TEM bright field image displays well-dispersed and near-spherical shaped LTO particles (30–60 nm in size), while LCO particles exhibit a hexagonal shape (50–80 nm in size). For both materials, nanoparticles are homogeneously distributed. The corresponding selected area diffraction pattern (SAED) pattern displays well-crystallized nanopowders, which are presented in Figure 3c,d.
The HRTEM images of Li2TiO3 and LiCoO2 are shown in Figure 3e,f, in which, the d-spacing values of 0.47 nm for LTO can be indexed to the respective (002) plane, whereas fringe width of 0.467 nm indicates the formation of single crystalline LCO. Thus, nanosized particles for both the anode and cathode materials with quasi monodisperse distribution favors good electrochemical performances by shortening the diffusion pathways, such as, high-capacity retention and high rate-capability [39].
FE-SEM images of Li2TiO3 and LiCoO2 shown in Figure 4a and Figure 4b, respectively confirm the size of nanocrystals estimated from Scherrer equation (Lc < 100 nm) and display a homogeneous distribution of both LTO and LCO particles synthesized by hydrothermal method. No obvious aggregation was observed for both LTO and LCO nanopowders.
Note that the TEM and FE-SEM images shown in Figure 3 and Figure 4 belong to the final product, i.e., after calcination at 800 °C for LTO and 600 °C for LCO. Before high-temperature sintering, the nanoparticles of both LTO and LCO were slightly agglomerated after the first step of heat treatment at 60 °C. The sintering temperature for both electrode materials was chosen to obtain almost the same particles size (around 50 nm). Thus, the heating rate was carefully controlled to obtain such a particle size characteristic. The choice of particle sizes in the 30–80 nm range was made for two reasons: (i) below 20 nm the material has large specific surface area but low tap density, which reflects in low volumetric energy density, and (ii) for bigger particle size than 80 nm, the ionic transport process is less and the wetting surface with the electrolyte is reduced [44]. For example, the influence of the LTO particle size on the diffusion coefficient of Li ions has been investigated by Kavan et al. [45]. Studies of thin film LTO electrodes prepared with a particle size between 9 nm and 1 µm show that optimum performance was achieved with a specific surface area of 100 m2 g−1, which corresponds to a particle size of approximately 20 nm.
The EDX spectra of the nanopowders, presented in Figure 4c,d, display majorly the set of two elements (Ti, O) and (Co, O) which are fingerprints of Li2TiO3 and LiCoO2, respectively. It is noteworthy that the lithium cannot be detected in the present spectrum because of its low energy characteristic radiation [46]. The elemental composition analysis gives the evidence that LTO contains Ti and O in the ratio 45.5:54.5 at.% (accuracy of ±0.5 at.%) and provides an elemental Co/O ratio of 35.5:64.5 at.% in LCO. These data confirm results obtained by XRD and Raman analyses showing the good stoichiometry of both LTO and LCO electrode materials.

2.2. Brunauer–Emmett–Teller (BET) Analysis

The specific surface area (SSA) and pore size distribution of Li2TiO3 and LiCoO2 samples were characterized via N2 adsorption–desorption isotherms. The N2 adsorption–desorption isotherm was conducted at 77 K in liquid nitrogen. Figure 5a,b demonstrate the characteristic of the type-IV isotherm curve for both LTO and LCO with a distinct hysteresis loop of type H3 in the relative pressure (P/P0) range from 0.7 to 1.0 and 0.8 to 1.0 under the IUPAC classification, which can be induced by the capillary condensation taking place within the abundant mesopores in the material. The BET specific surface area of the LTO and LCO samples was calculated to be 22.35 and 35.74 m2 g−1 respectively. Furthermore, the mesoporous nature of both samples was characterized by Barrette–Joyner–Halenda (BJH) pore size distribution and data shown in Figure 5c,d. The BJH method demonstrated that the LTO and LCO samples had a porous nature with a narrow distribution centered at 17 and 25 nm and a wide distribution centered around 50 and 30 nm, respectively. The calculated average pore diameter of LTO and LCO is 17.5 nm, 15.6 nm and pore volume of 0.167, and 0.0981 cm3 g−1, respectively. The mesoporous feature, large surface area, and sufficient pore volume of both LTO and LCO samples support the conclusion that the nanoscale particles not only shorten the diffusion paths for lithium ions but also allowed larger buffering space to compensate the volume expansion during the charge–discharge reaction.

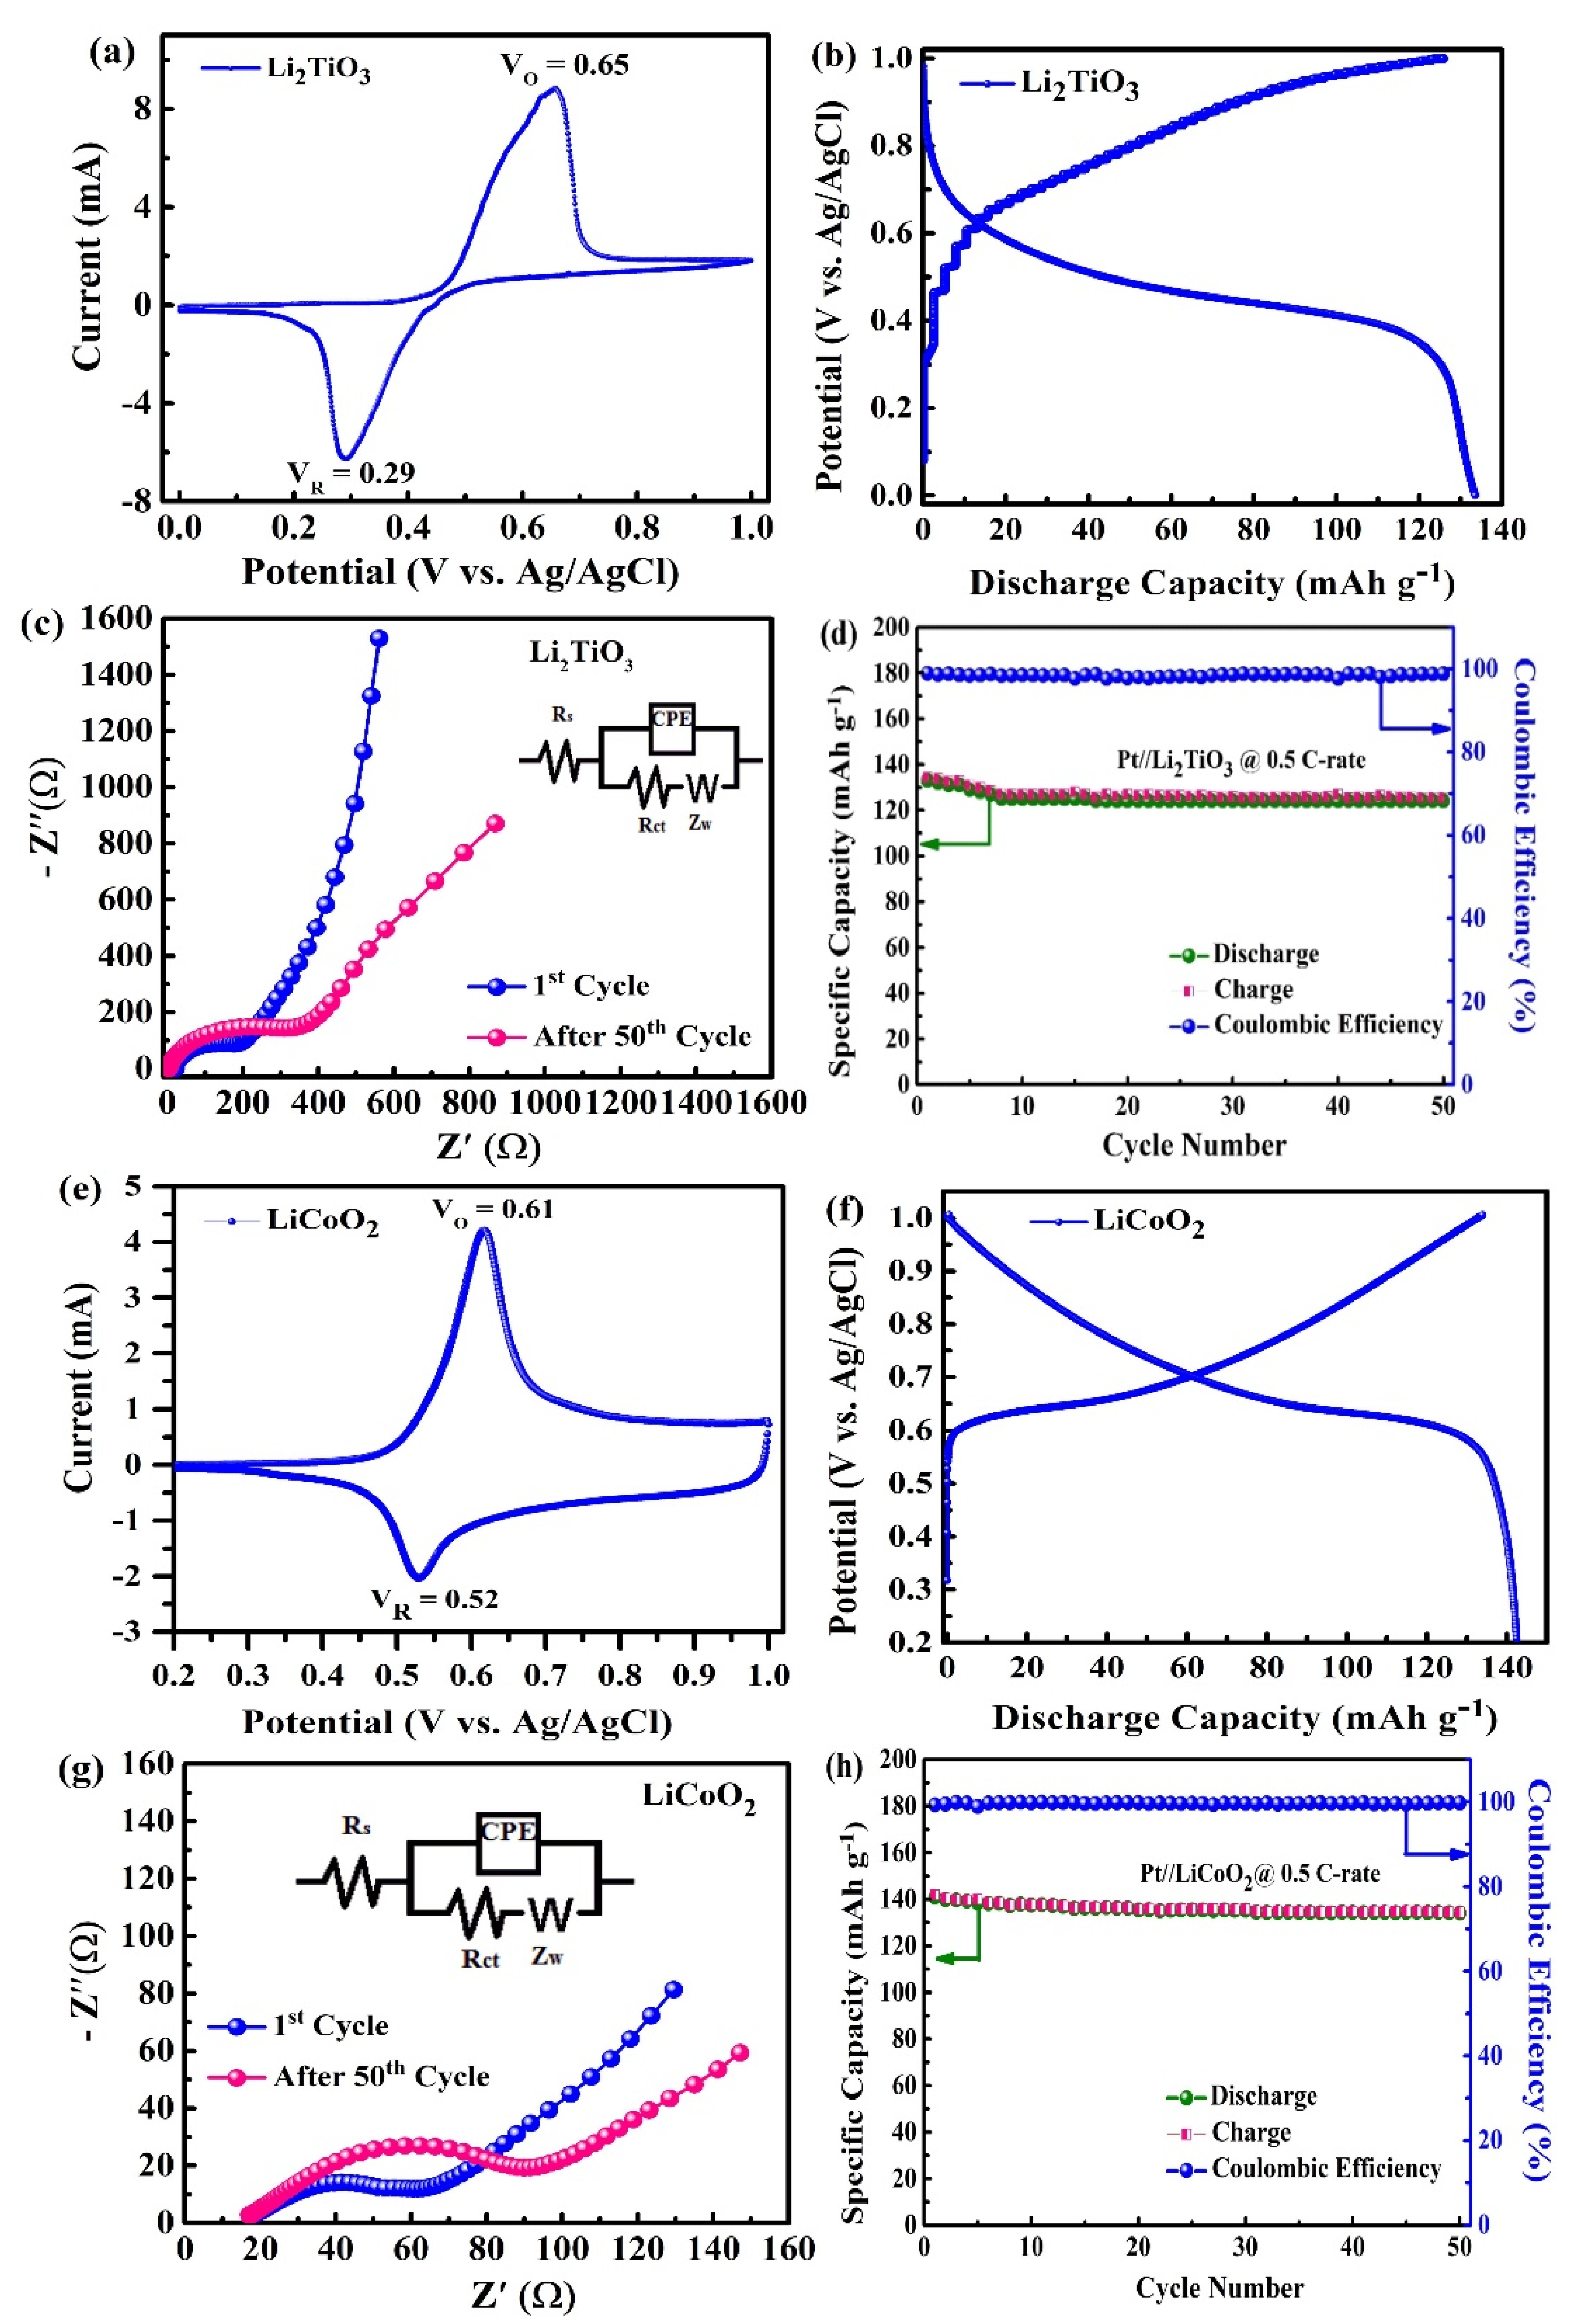
2.3. Electrochemical Properties of Half-Cells

Electrochemical tests for both Pt//Li2TiO3 and Pt//LiCoO2 aqueous half-cells were performed by CV, GCD, and EIS experiments and by long-life cycling. Results are presented in Figure 6a–h. CV curves carried out at sweep rate of 1 mV s−1 in the potential range 0.0–1.0 V for LTO and 0.2–1.0 V for LCO are shown in Figure 6a and Figure 6e, respectively. A set of well-defined cathodic and anodic peaks was recorded for both electrodes. For LTO, the CV peaks at 0.29 and 0.65 V correspond to the Ti4+/Ti3+ redox reaction, while the set recorded at 0.52 and 0.61 V for LCO is due to the Co4+/Co3+ redox reaction. It has been reported that during discharge, the number of Li+ ions inserted into the interstitial sites of the Li2+xTiO3 framework does not exceed x = 0.5, which implies a partial reduction of Ti4+ to Ti3+ state [47]. Similarly, during anodic sweep, the oxidation peak of Li1-xCoO2 is located at 0.61 V implying the Li+ ion extraction from the rhombohedral lattice. The peak separation ΔEp = 0.36 V for LTO is much larger than that of 0.09 mV for LCO indicating the slow kinetics in the monoclinic LTO nanostructure compared with the high Li+ ion mobility in the layered rhombohedral lattice of LCO. These results match well with earlier reports for bulk materials [48,49].
Figure 6f shows the GCD curves of LTO and LCO electrodes in the cutoff 0.0–1.0 V and 0.2–1.0 V vs. Ag/AgCl, respectively. The aqueous half-cells were charged and discharged at a current rate of 0.5C (1C = 150 mA g−1) at 25 °C. The S-shaped discharge–charge curve indicates the formation of a non-stoichiometric single phase for Li2+xTiO3 (Figure 6b) and the appearance of the pseudo-plateau at the potential of 0.6–0.7 V for LCO (Figure 6f) infer the semiconductor-metal phase transition during the delithiation process [50]. This GCD curve matches well with voltage profile of microsized LCO powders reported by Wang et al. [23]. Lithiation of the monoclinic LTO electrode occurs with a lithium uptake of x ≈ 0.5 corresponding to the specific capacity of 122 mAh g−1 [47]. With an average particle size of ~32 nm, the nanosized LTO can exhibit better electrochemical properties than that of bulky material due to the shortening of the ion diffusion pathways. During lithiation, Li2TiO3 shows good electronic conductivity on the nanoparticle surface because the mixed Ti4+/Ti3+ valence state and an average discharge potential lower than that of Li4Ti5O12 [51]. GCD results show that the Pt//Li2TiO3 and Pt//LiCoO2 aqueous cells deliver an initial specific discharge capacity of 133 and 142 mAh g−1, respectively, at a current rate of 0.5C. The electrochemical redox reactions occurring in half-cell can be expressed by:
Li2Ti4+O3 + xLi+ + xe ⇄ Li2+xTi(4−x) + O3,
LiCoO2 ⇄ Li1−xCoO2 + xLi+ + xe.
EIS measurements were carried out to study the kinetics of Li+ ions in electrode materials. The EIS of the Li2TiO3 and LiCoO2 electrodes (first cycle and after 50th cycle) were tested in the frequency range from 1 Hz to 1 MHz under full load. The corresponding Nyquist plots are shown in Figure 6c and Figure 6g, respectively Nyquist plot is composed of a depressed semicircle and an inclined line in the high- and low-frequency region, respectively. At high frequency, the electrode/electrolyte resistance (Rs) is obtained by the intercept of the Z′ axis. The diameter of the depressed semicircle at medium frequency region is attributed to the charge transfer resistance (Rct) corresponding to the solid-state diffusion of Li+ ions in the bulk of the active material, while the constant phase angle element (CPE) includes the double layer capacitance [51]. The Rs and Rct values deduced from data of Figure 6c,g are 25 and 17 Ω and 110 and 73 Ω for LTO and LCO electrodes, respectively. At the 50th cycle, the charge transfer resistance value of the LTO and LCO electrodes increased to 90 and 309 Ω, respectively. The increment in the Rct values of both electrodes after cycling could be due to the formation of a resistive layer on the electrode surface over long-time cycling. The unchanged slope in the low-frequency range (Warburg contribution) after 50 cycles indicates an unaffected Li-ion diffusion process. The solution resistance of the electrode in both LTO and LCO electrodes cases have marginally (±1–2 Ω) changed. The inclined line (~45°) in low-frequency region attributed to the Warburg impedance contribution indicates a solid-state diffusion-controlled of Li+ ions in both electrode frameworks [52]. The cyclability of electrodes was investigated. Figure 6d,h display the specific discharge capacity vs. cycle number. Both materials exhibit an excellent stability over 50 cycles carried out at 0.5 C rate. The Li2TiO3 anode has a retention of ca. 94% and a Coulombic efficiency of 98.25%, while the LiCoO2 cathode retains 95% of its initial capacity and a Coulombic efficiency of 99.89%. Thus, the energy density of the aqueous-type half-cell calculated by integration of the GCD curve is 60 and 100 Wh kg−1 for LTO and LCO, respectively.

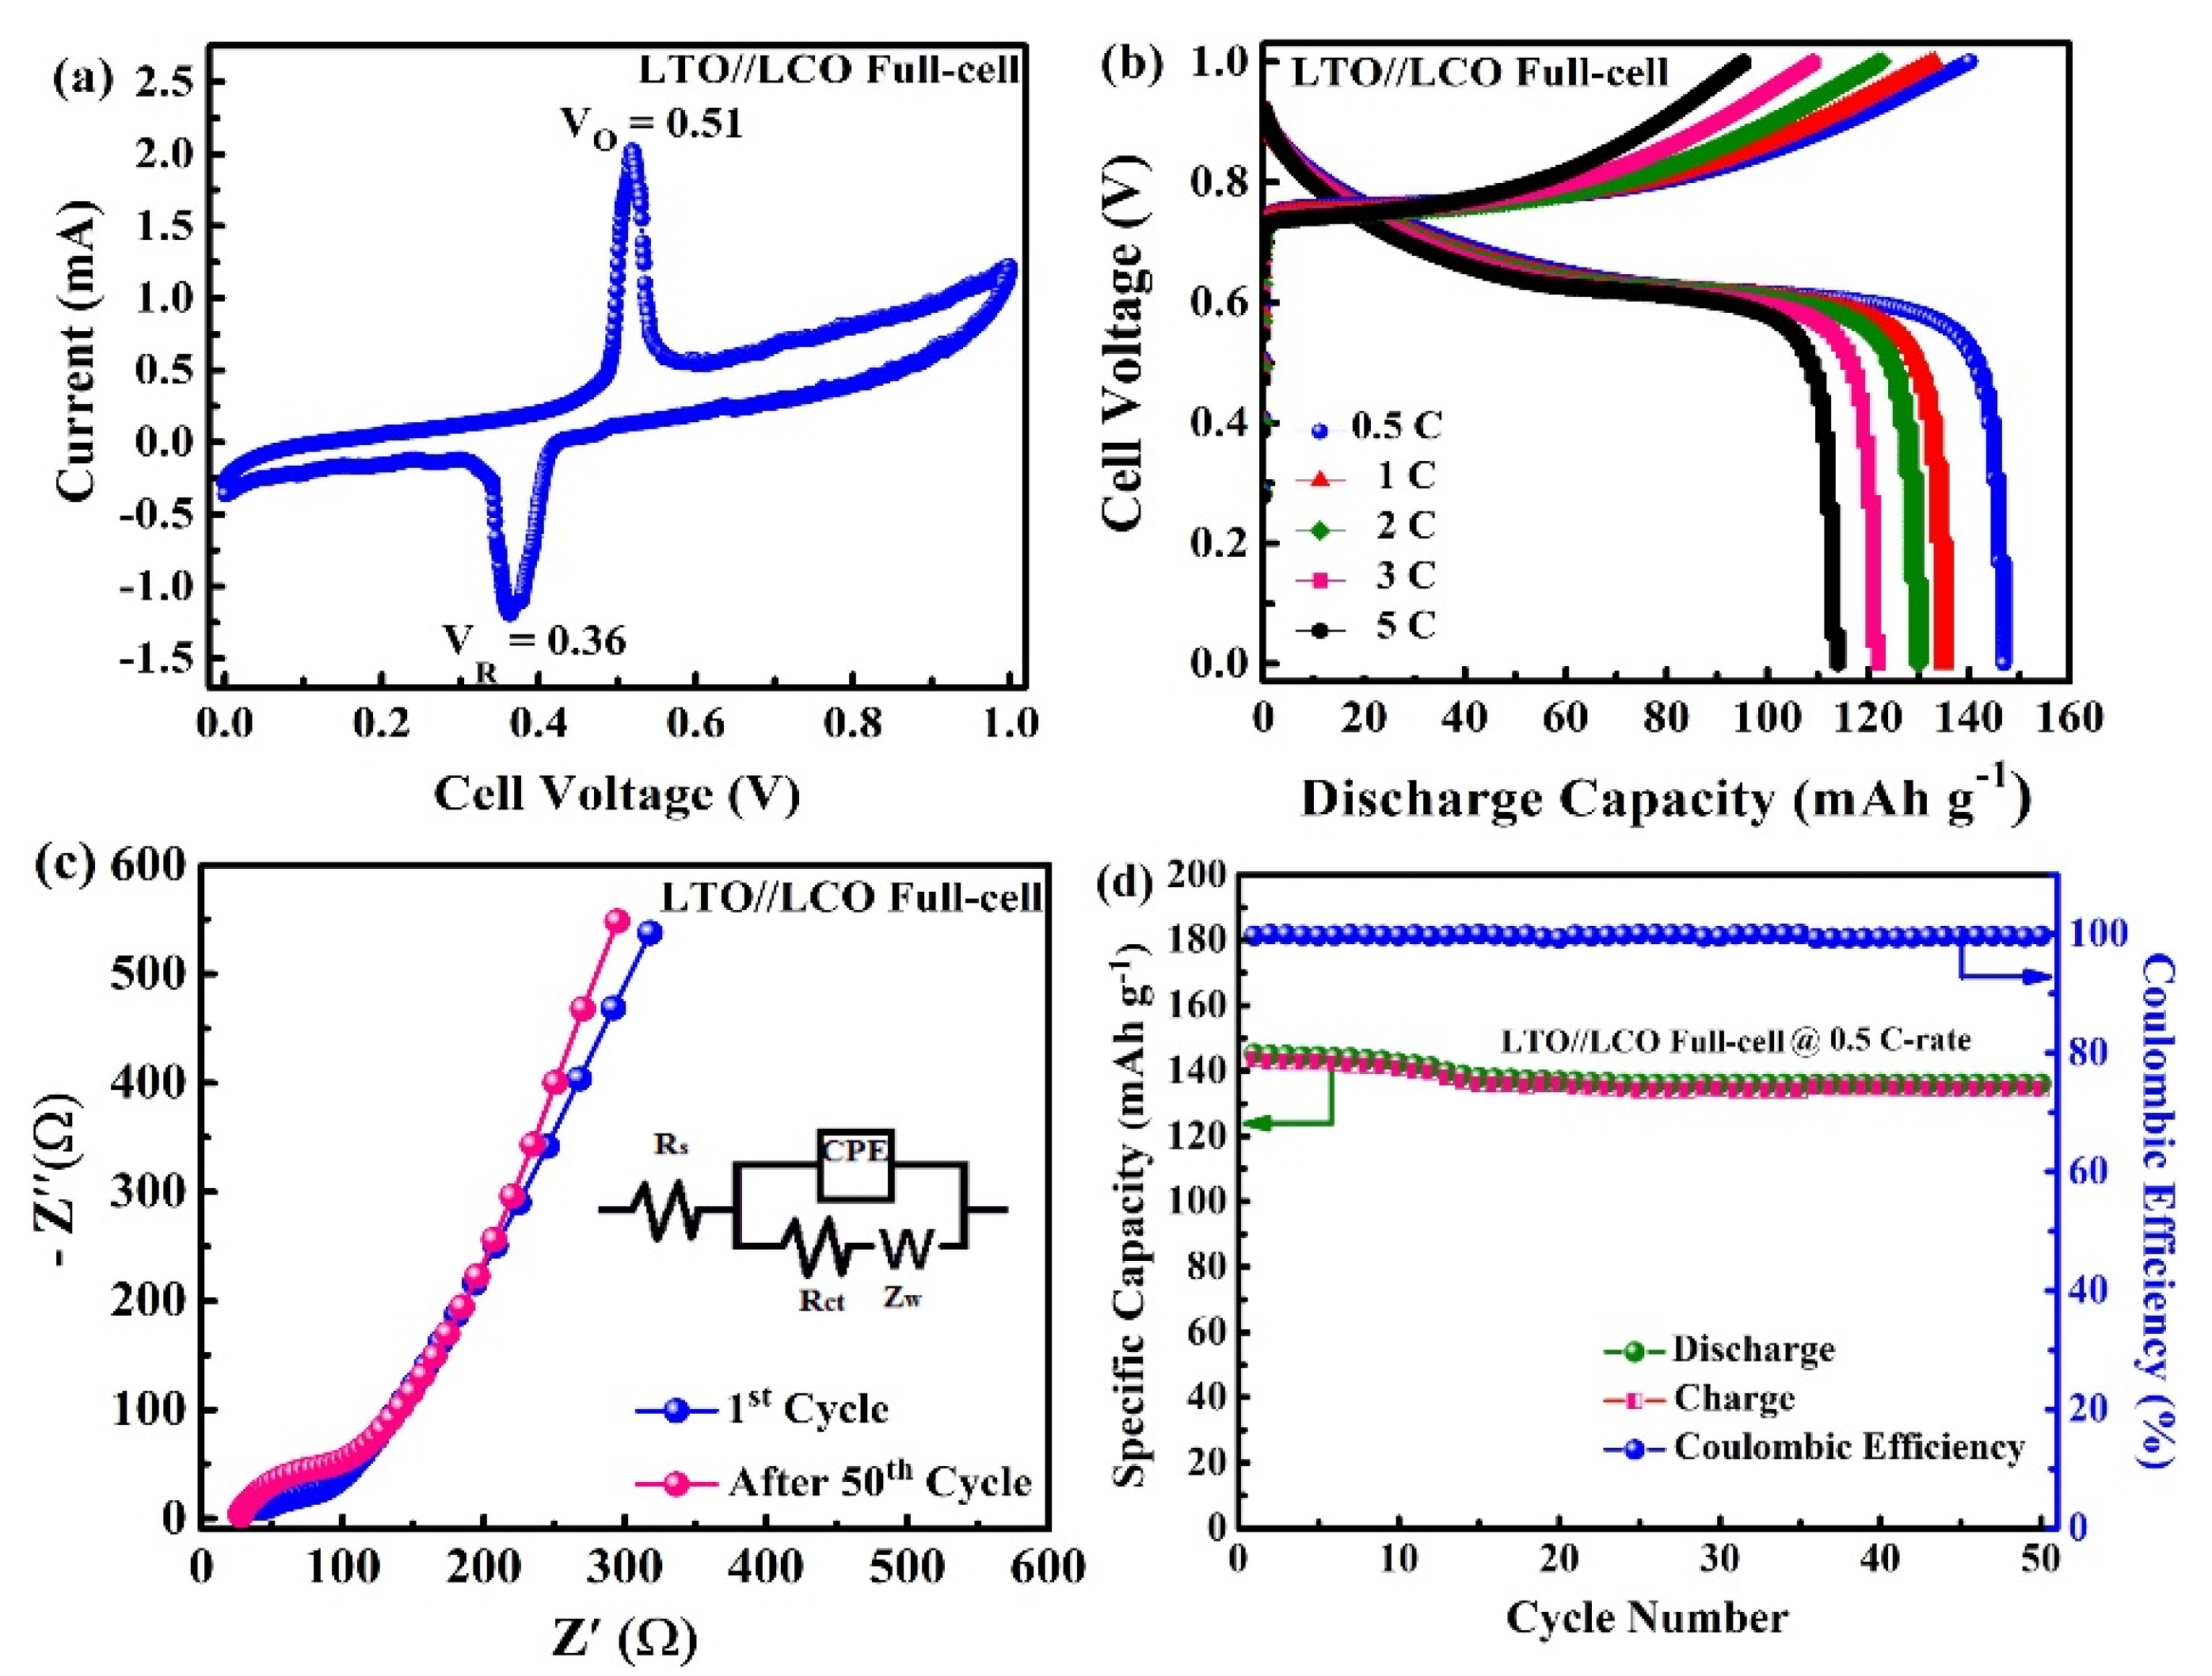
2.4. Electrochemical Properties of the LTO/LCO Full-Cell

The performance of the Li2TiO3 anode coupled with a LiCoO2 cathode has been tested in a full-cell assembly using a 1 mol L−1 saturated Li2SO4 aqueous solution as electrolyte and an Ag/AgCl reference electrode. The LTO//LCO full-cell was cycled between 0.0 and 1.0 V at various current rates in the range from 0.5 to 5 C rate. Results obtained at 25 °C are shown in Figure 7. As the overall performance of a Li-ion cell is majorly determined by the mass loading (mA, mC) of the electrodes, a mA/mC ratio of 1.1:1.0 was fixed for the LTO//LCO full-cell.
Figure 7a shows the cyclic voltammogram of the LTO//LCO full-cell recorded at a scan rate of 1 mV s−1. During anodic sweep, the well pronounced oxidation peak occurring at 0.51 V is attributed to the simultaneous extraction of Li+ ion from the LCO cathode and insertion into LTO, in which Li ions occupy the LiTi2 interlayer then in plane of Li(1), Li(2) and forming Ti4+ and O2− site vacancies with charge compensation of Ti4+/Ti3+ [48]. During cathodic sweep, the reduction reaction at 0.36 V is assigned to the reversible deinsertion of Li+ ions from LTO and the intercalation in the vacant sites of the layered LCO structure [53]. From the shape of the voltammogram, the close CV peak values to those of LTO and the voltage separation ΔEp = 0.15 V, we can infer that the LTO anode material is the limiting element from the view-point of Li+ ion kinetics [54]. Similar trends were observed for complete Li-ion batteries with spinel Li4Ti5O12 anode [55]. In Li4Ti5O12//LiFePO4 and Li4Ti5O12//LiCoO2 full cells, the anode is the predominant electrode for both thermodynamics and kinetics.
The galvanostatic charge–discharge curves of LTO//LCO full-cell recorded at various current rates from 0.5 to 5C are shown in Figure 7b. The discharge profiles display a voltage plateau at 0.65 V with the corresponding one at 0.75 V for the charge process. In these conditions, the full-cell delivers specific discharge capacities in the range 145-115 mAh g−1 (based on the mass of the LCO in the positive electrode). It is to be noted that both electrodes are well balanced because the Li2+xTiO3 negative electrode accommodate additional 0.5 Li, whereas it is well-known that the Li1-xCoO2 positive electrode is electrochemically stable in the range 0 ≤ x ≤ 0.5 [32]. Moreover, it is noteworthy that the stable value of the cell polarization with the increase of the discharge current is attributed to the high ionic conductivity of Li+ ion in both LCO and LTO host lattices. Finally, a comparison of the electrochemical performance of LCO-based aqueous cells with other anodes is given in Table 1, indicating that the hydrothermally synthesized LCO and LTO electrodes provide excellent electrochemical performances. Due to the lower value of the average potential of its anode material, the LiCoO2//Li2TiO3 full-cell exhibits higher energy density than that of the LiCoO2//Li4Ti5O12 full-cell. It can be observed that the charge capacity is slightly lower than the discharge capacity (GCD curves in Figure 7b). This can be explained in two ways. (1) At low current rates, diffusion-controlled phenomenon caused asymmetry between charge and discharge in the full cell. (2) Moreover, if any full cell has a high series resistance or the electrodes do not have sufficient electronic conductivity then that cell shows less charging capacity over discharge capacity. In this present study, Li2TiO3//LiCoO2 full cell, the electronic conductivity of anode (LTO) is very low (~10−11 S cm−1) over electrical conductivity of LCO (~5 × 10⁻³ S cm−1). The poor electrical conductivity of anode is the reason for less charging capacity. Note that LCO undergoes a semiconductor-metal transition after Li extraction, which does not limit the rate capability of the cell.
The Nyquist plots of a full-cell (first cycle and after 50th cycle) are presented in Figure 7c. This EIS results resemble to that of LTO with an Rct value of about 100 Ω for the first cycle, which slightly increases to 113 Ω after 50 cycles. The increment in the Rct values of both electrodes after 50 cycles could be due to the formation of resistive layer on the electrode surface over long-time cycling. On the other hand, the Warburg impedance (straight line in the low-frequency range) does not change notably, which means that the Li+ ion diffusion coefficient remains almost the same over cycling.
Figure 7d presents the cyclability of the LTO//LCO full-cell charged–discharged at current rate of 0.5 C over 50 cycles. The good electrochemical stability is depicted by the capacity retention of 94% (decrease of the specific capacity from 145 to 137 mAh g−1 after 50 cycles) and the Coulombic efficiency ( η ) of the full-cell (LTO and LCO half-cells) is calculated using the following expression [59,60]:
η = t d t c × 100 ,
where td and tc are the total discharge and total charge, respectively. The Coulombic efficiency of a full-cell is found to remain almost constant at 99.7% over 50 cycles (Figure 7d). The small capacity fade is majorly due to fast Li+ ion migration in both electrodes. As the anode and cathode in this cell have a layered-like structure, in which Li+ ions move by hopping from one octahedral Li site to another in the interplane between Co-O slabs of the LiCoO2 framework and by hopping in the direction perpendicular to the LiTi2 layers in the Li[Li1/3Ti2/3]O2 lattice [48], thus, the LTO and LCO electrodes in the full-cell contribute equally to the electrochemical process. Hence, the above results demonstrate the good performance of the LTO-LCO electrode couple in an aqueous electrochemical cell. Such type of battery without flammable chemistry can boost the development of high-power LIBs used in various applications.

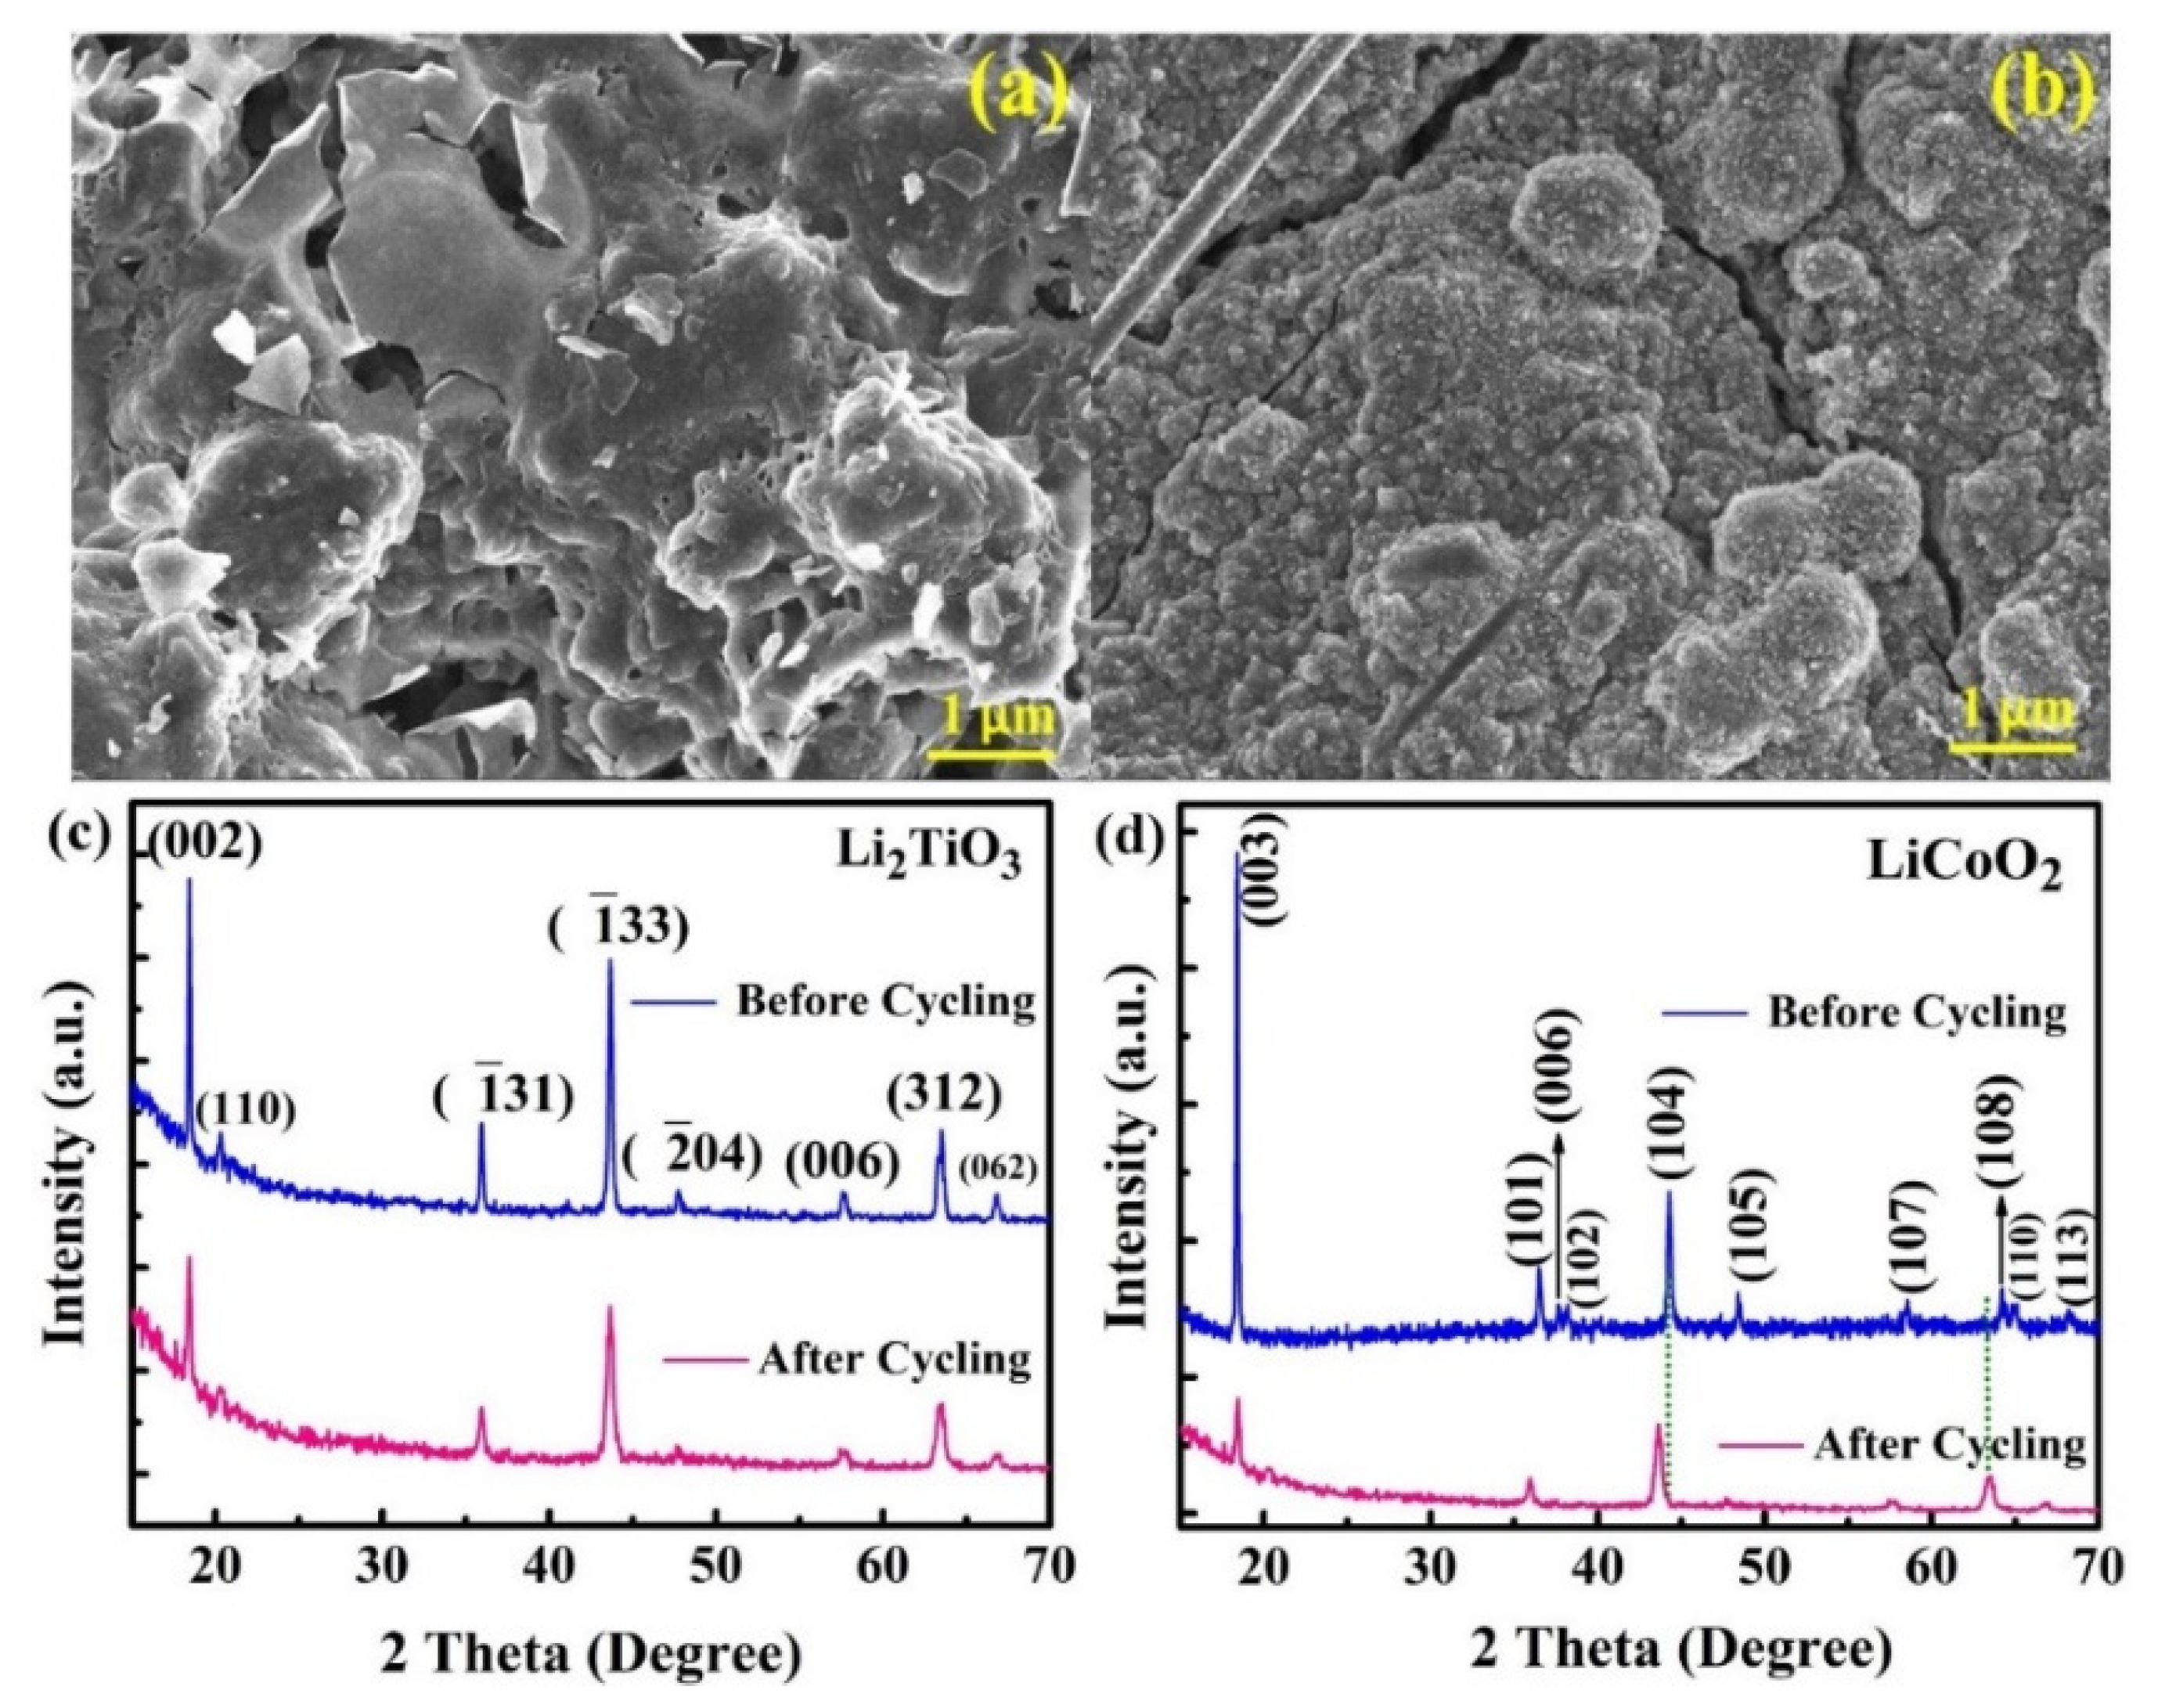
2.5. Post-Mortem Analyses of the LTO//LCO Full-Cell

Figure 8a,b show the post-mortem FE-SEM images of LTO and LCO after 50 cycles. The cycled LTO anode (Figure 8a) displayed cracks with pores and some particulates were spread on the surface demonstrating the increasing interfacial resistance. The cycled LCO cathode (Figure 8b) depicted cracks with agglomerated particles. Some areas on the electrode were seemed to be crashed after cycling, which can be caused by an increase in the internal temperature. When comparing to LTO, the LCO cracks/crashed area indicates that after Li+-ion intercalation/deintercalation the structural deformation of LCO is more due to the formation of internal temperature along with high interfacial resistance over anode (LTO is a zero-strain material). Figure 8c,d display the XRD patterns of both cycled anode and cathode. For LTO anode (Figure 8c), it can be seen that after cycling, the peak position and shape do not change significantly, but the intensity of the peak (002) decreases from 671 to 420 and the full-width of the half-maximum intensity (FWHM) increases from 0.175 to 0.212 for LTO sample. Whereas the intensity of the peak (003) of LCO in Figure 8d decreases from 2010 to 500 and the I(003)/I(104) decreases from 4.87 to 3.62. The full-width of the half-maximum intensity (FWHM) increases from 0.170 to 0.271, which reflects the deterioration of the structure. Note that these slight structural modifications do not seem to affect the Li+ extraction/insertion process any more since the battery capacity fade is less than 0.1% per cycle. When compared to LCO cathode (see Figure 8d), the intensity and FWHM have less change to be observed to LTO. It can be concluded that the capacity fade of the LTO//LCO aqueous full-cell is mainly caused by an increase of the interfacial resistances rather than a fatigue of electrodes [61].

3. Materials and Methods

3.1. Synthesis of Li2TiO3

Lithium hydroxide (LiOH·H2O) and titania (anatase TiO2, purity: 99.8%, 25 nm, Sigma-Aldrich, St. Louis, Missouri, USA) were used as Li and Ti precursors. In a typical synthesis process, 0.16 mol LiOH·H2O aqueous solution was added to 0.54 mol TiO2 dissolved in deionized (DI); then the total mixture solution was kept at 80 mL. The total solution was subjected to stirring for 30 min, then the suspension was placed into a Teflon lined autoclave (100 mL) and heated at 180 °C for 12 h. The autogenous saturation vapor pressure of the solution in the autoclave was maintained without agitation during the hydrothermal reaction. At the end, the precipitate was taken by centrifugation and washed several times with a mixture of DI water and ethyl alcohol. The as-prepared powder was dried at 60 °C for 5 h to get the white powder. Thereafter, the final product Li2TiO3 was obtained after annealing the suspension at 800 °C for 3 h in a horizontal tube furnace under an air atmosphere. The complete crystalline phase of Li2TiO3 can only be formed at 800 °C, below this temperature it shows TiO2 and Li2O as impurities.

3.2. Synthesis of LiCoO2

The nanocrystalline LiCoO2 powder was prepared using cobalt acetate tetrahydrate [Co(CH3COO)2·4H2O] and lithium nitrate (LiNO3) as starting materials. The 0.5 mol Co(CH3COO)2·4H2O was dissolved in 50 mL deionized (DI) water and 0.5 mol LiNO3 was subsequently added to the solution and subjected to vigorous stirring for 20 min. The total mixture of the solution was transferred into a Teflon-lined autoclave (100 mL) and subjected to heat treatment at 200 °C for 24 h. After the reaction, the precipitation was separated by centrifugation then filtered, washed with DI water and ethyl alcohol. The final product was dried at 60 °C for 3 h. Thereafter, the final suspension was annealed at 600 °C for 3 h in a horizontal tube furnace under an air atmosphere to obtain LiCoO2 as the final product. At lower temperatures, LiCoO2 is available in the cubic structure, which is not electrochemically active and does not support the intercalation-deintercalation process. At 600 °C, the LCO transformed into the rhombohedral structure, which is a highly electrochemical active phase, in which accelerated/allowed lithium ions migration occurs during intercalation/deintercalation processes.

3.3. Characterization

The crystal structure of samples was characterized by a powder X-ray diffraction (MPD for bulk, 3 KW, PANalytical, Philips Korea, Seoul, Korea) equipped with a Cu Kα radiation source (λ = 1.5406 Å) filtered by Ni film. Diffractograms were collected in the 2θ range 10–80° at a scan speed of 0.03 degree per second. The vibrational studies of the prepared samples were characterized at room temperature by Raman scattering (RS) spectroscopy using a spectrometer XploRA Plus HORIBA (Horiba Korea Ltd., Gyeonggi-Do, Korea) equipped with an air-cooled frequency doubled HORIBA Scientific CCD detector and an Ar-ion laser as an excitation source (532 nm line, power excitation source of 50 mW). RS spectra were acquired in the range of 50–1000 cm−1 with a spectral resolution of ≈1 cm−1. X-ray photoelectron spectroscopy (XPS) spectra were collected using a K-Alpha-Thermo Scientific spectrometer equipped with a monochromatized Al Kα X-ray source (1486.68 eV) with a power of 150 W. Carbon pollutant C 1s with a binding energy of 284.60–284.80 eV was used as a charge correction of the sample spectrum. The morphology and microstructure of the samples were observed by a field emission scanning electron microscope (FE-SEM, Hitachi S-4800, Hitachi Ltd, Tokyo, Japan)) and high-resolution transmission electron microscope (HRTEM, model TECHNAI G2-30 S-twin D905, FEI Company, Hillsboro, OR, USA). The compositional analysis was performed on the SEM equipped with Oxford INCA energy dispersive X-ray spectroscopy (EDX). The specific surface area (SSA) was evaluated by recording the nitrogen adsorption/desorption isotherms of the as-prepared samples. Measurements were performed at a temperature of 77 K using a surface analyzer (3 Flex, Micrometrics, Norcross, GA, USA). The specific surface area and the pore-size values were calculated using the Brunauer–Emmett–Teller (BET) and Barrett–Joyner–Halenda (BJH) methods.

3.4. Electrochemical Measurements

The electrochemical measurements were carried out by a conventional type aqueous three-electrode glass cell. The anode (LTO) or cathode (LCO) were working electrodes, platinum metal strip and Ag/AgCl electrodes were counter and reference electrodes, respectively. The anode and cathode were prepared by a mixture of the active LTO or LCO material with carbon acetylene black and polyvinylidene fluoride (PVDF) binder in the 80:10:10 weight ratio and dispersed in N-methyl-2pyrrolidone (NMP) solution. Then, the slurry was casted on the Ni foil current collector and dried at 100 °C for 3 h. The active mass loading of each electrode was 1.0~2.0 mg cm−2. The active area of the working electrode is 1 cm2, equal area to the Pt counter-electrode. The electrolyte employed in this work was a saturated 1 mol L−1 Li2SO4 aqueous solution. The electrochemical performances of the Li2TiO3, LiCoO2 half-cells and the Li2TiO3//LiCoO2 full-cell were evaluated with an electrochemical analyzer (CHI 760E, CH Instruments Inc., Austin, TX, USA). The galvanostatic charge-discharge tests were conducted in the voltage range 0.0–1.0 V for LTO anode half-cell and LTO//LCO full-cell, whereas potential cut off was 0.2–1.0 V for the LCO half-cell. The cyclic voltammetry (CV) measurements were carried out at a scan rate of 1 mV s−1 for all cells. The electrochemical impedance spectroscopy (EIS) analyses were conducted between 1 Hz and 1 MHz with amplitude of 5 mV under 100% state-of-charge (SOC). The weight ratio of Li2TiO3 and LiCoO2 in full-cell was carefully balanced with loading of ~3 mg cm−2. The specific discharge capacity of the full cell was calculated based on the weight of the limiting electrode. All the electrochemical tests were conducted at the room temperature (25 °C).

4. Conclusions

In this study, the nanocrystalline Li2TiO3 (monoclinic phase) and LiCoO2 (rhombohedral phase) were successfully synthesized by hydrothermal method. The structural and surface morphological properties show that nanostructured particles of size <100 nm are homogeneously distributed. BET analyses evidence the high specific surface area (SSA) of 22 and 35 m2 g−1 with an average pore diameter of 17.47, 15.57 nm for LTO and LCO samples, respectively. The mesoporous nature of the sample is useful for the diffusion of electrolyte ions to improve the kinetics of the material, while the pore diameter prevents structural instability resulting in exemplary electrochemical performance. The electrochemical properties of LTO and LCO nanopowders were carried out in aqueous half-cell using saturated Li2SO4 lithium salt as electrolyte. LTO anode and LCO cathode deliver specific capacities of 133 and 142 mAh g−1 retained at 94 and 95%, and a Coulombic efficiency of 98.25% and 99.89%, respectively. The Li-ion full-cell assembled using these electrodes delivered an initial specific capacity of 145 mAh g−1 and retained 94% (135 mAh g−1) of the initial capacity after 50 cycles at 0.5C rate with a Coulombic efficiency of 99.7%. Hence, the rechargeable lithium battery with the configuration Li2TiO3/1 mol L−1 Li2SO4 in DI water/LiCoO2 can open the doors for high energy storage in green and safe technology. The manufacture of such aqueous Li-ion batteries is a promising option for storing electricity from renewable energies (stationary plant) and powering electric/hybrid vehicles.

Author Contributions

Conceptualization, A.L.-N., C.M.J., and S.-W.J.; methodology, A.L.-N. and S.-W.J.; formal analysis, A.L.-N., K.S.-G., M.D., and A.N.-B.; investigation, A.L.-N.; data curation, K.S.-G., M.D., and A.N.-B.; writing—original draft preparation, A.L.-N.; writing—review and editing, A.N.-B., S.-W.J., and C.M.J.; supervision, S.-W.J.; project administration, S.-W.J.; funding acquisition, S.-W.J. All authors have read and agreed to the published version of the manuscript.

Funding

This work was financially supported by the National Research Foundation of Korea (Grant NRF-2019R1A5A8080290).

Data Availability Statement

Data are included within the article.

Conflicts of Interest

The authors declare no conflict of interest.

References

  1. Goodenough, J.B.; Kim, Y. Challenges for rechargeable Li batteries. Chem. Mater. 2009, 22, 587–603. [Google Scholar] [CrossRef]
  2. Scrosati, B.; Garche, J. Lithium batteries: Status, prospects and future. J. Power Sources 2010, 195, 2419–2430. [Google Scholar] [CrossRef]
  3. Lu, L.; Han, X.; Li, J.; Hua, J.; Ouyang, M. A review on the key issues for lithium-ion battery management in electric vehicles. J. Power Sources 2013, 226, 272–288. [Google Scholar] [CrossRef]
  4. Chan, C.K.; Peng, H.; Liu, G.; McIlwrath, K.; Zhang, X.F.; Huggins, R.A.; Cui, Y. High-performance lithium battery anodes using silicon nanowires. Nat. Nanotech. 2008, 3, 31–35. [Google Scholar] [CrossRef]
  5. Mauger, A.; Julien, C.M.; Paollela, A.; Armand, M.; Zaghib, K. A comprehensive review of lithium salts and beyond for rechargeable batteries: Progress and perspectives. Mater. Sci. Eng. R 2018, 134, 1–21. [Google Scholar] [CrossRef]
  6. Mauger, A.; Julien, C.M. Critical review on lithium-ion batteries: Are they safe? Sustainable? Ionics 2017, 23, 1933–1947. [Google Scholar] [CrossRef] [Green Version]
  7. Li, W.; Dahn, J.R.; Wainwright, D.S. Rechargeable lithium batteries with aqueous electrolytes. Science 1994, 264, 1115–1118. [Google Scholar] [CrossRef]
  8. Gu, X.; Liu, J.-L.; Yang, J.; Xiang, H.; Gong, X.; Xia, Y. First-principles study of H+ intercalation in layer-structured LiCoO2. J. Phys. Chem. C 2011, 115, 12672–12676. [Google Scholar] [CrossRef]
  9. Tang, W.; Hou, Y.; Wang, F.; Liu, L.; Wu, Y.; Zhu, K. LiMn2O4 nanotube as cathode material of second-level charge capability for aqueous rechargeable batteries. Nano Lett. 2013, 13, 2036–2040. [Google Scholar] [CrossRef]
  10. Zhu, X.; Long-Doan, T.N.; Yu, Y.; Tian, Y.; Sun, K.E.K.; Zhao, H.; Chen, P. Enhancing rate performance of LiMn2O4 cathode in rechargeable hybrid aqueous battery by hierarchical carbon nanotube/acetylene black conductive pathways. Ionics 2016, 22, 71–76. [Google Scholar] [CrossRef]
  11. Hou, Y.Y.; Wang, X.J.; Zhu, Y.S.; Hu, C.L.; Chang, Z.; Wu, Y.P.; Holze, R. Macroporous LiFePO4 as a cathode for an aqueous rechargeable lithium battery of high energy density. J. Mater. Chem. A 2013, 1, 14713–14718. [Google Scholar] [CrossRef]
  12. Zheng, J.; Tan, G.; Shan, P.; Liu, T.; Hu, J.; Feng, Y.; Yang, L.; Zhang, M.; Chen, Z.; Lin, Y.; et al. Understanding thermodynamic and kinetic contributions in expanding the stability window of aqueous electrolytes. Chemistry 2018, 4, 2872–2882. [Google Scholar] [CrossRef] [Green Version]
  13. Yamada, Y.; Usui, K.; Sodeyama, K.; Ko, S.; Tateyama, Y.; Yamada, A. Hydrate-melt electrolytes for high-energy-density aqueous batteries. Nat. Energy 2016, 1, 16129. [Google Scholar] [CrossRef]
  14. Ko, S.; Yamada, Y.; Miyazaki, K.; Shimada, T.; Watanabe, E.; Tateyama, Y.; Kamiya, T.; Honda, T.; Akikusa, J.; Yamada, A. Lithium-salt monohydrate melt: A stable electrolyte for aqueous lithium-ion batteries. Electrochem. Commun. 2019, 104, 106488. [Google Scholar] [CrossRef]
  15. Liu, S.; Ye, S.H.; Li, C.Z.; Pan, G.L.; Gao, X.P. Rechargeable aqueous lithium-ion battery of TiO2/LiMn2O4 with a high voltage. J. Electrochem. Soc. 2011, 158, A1490–A1497. [Google Scholar] [CrossRef]
  16. Wu, M.-S.; Wang, M.-J.; Jow, J.-J.; Yang, W.-D.; Hsieh, C.-Y.; Tsai, H.-M. Electrochemical fabrication of anatase TiO2 nanostructure as an anode material for aqueous lithium-ion batteries. J. Power Sources 2008, 185, 1420–1424. [Google Scholar] [CrossRef]
  17. Zhou, A.; Liu, Y.; Zhu, X.; Li, X.; Yue, J.; Ma, X.; Gu, L.; Hu, Y.-S.; Li, H.; Huang, X.; et al. TiO2 (B) anode for high-voltage aqueous Li-ion batteries. Energy Storage Mater. 2021, 42, 438–444. [Google Scholar] [CrossRef]
  18. Xue, L.; Zhang, Q.; Zhu, X.; Gu, L.; Yue, J.; Xia, Q.; Xing, T.; Chen, T.; Yao, Y.; Xia, H. 3D LiCoO2 nanosheets assembled nanorod arrays via confined dissolution recrystallization for advanced aqueous lithium-ion batteries. Nano Energy 2019, 56, 463–472. [Google Scholar] [CrossRef]
  19. Bhatti, H.S.; Anjum, D.H.; Ullah, S.; Ahmed, B.; Habib, A.; Karim, A.; Hasanain, S.K. Electrochemical characteristics and Li+ ion intercalation kinetics of dual-phase Li4Ti5O12/Li2TiO3 composite in the voltage range 0–3 V. J. Phys. Chem. C 2016, 120, 9553–9561. [Google Scholar] [CrossRef] [Green Version]
  20. Suo, L.M.; Borodin, O.; Sun, W.; Fan, X.L.; Yang, C.Y.; Wang, F.; Gao, T.; Ma, Z.H.; Schroeder, M.; von Cresce, A.; et al. Advanced high-voltage aqueous lithium-ion battery enabled by “water-in-bisalt” electrolyte. Angew. Chem. Int. Ed. 2016, 55, 7136–7141. [Google Scholar] [CrossRef]
  21. Chen, L.; Zhang, J.; Li, Q.; Vatamanu, J.; Ji, X.; Pollard, T.P.; Cui, C.; Hou, S.; Chen, J.; Yang, C.; et al. A 63 m superconcentrated aqueous electrolyte for high-energy Li-ion batteries. ACS Energy Lett. 2020, 5, 968–974. [Google Scholar] [CrossRef]
  22. Wen, Y.; Chen, L.; Pang, Y.; Guo, Z.; Bin, D.; Wang, Y.G.; Wang, C.; Xia, Y. TiP2O7 and expanded graphite nanocomposite as anode material for aqueous lithium-ion batteries. ACS Appl. Mater. Interfaces 2017, 9, 8075–8082. [Google Scholar] [CrossRef] [PubMed]
  23. Wang, F.; Lin, Y.X.; Suo, L.M.; Fan, X.L.; Gao, T.; Yang, C.Y.; Han, F.D.; Qi, Y.; Xu, K.; Wang, C.S. Stabilizing high voltage LiCoO2 cathode in aqueous electrolyte with interphase-forming additive. Energy Environ. Sci. 2016, 9, 3666–3673. [Google Scholar] [CrossRef]
  24. Ruffo, R.; Wessells, C.; Huggins, R.A.; Cui, Y. Electrochemical behavior of LiCoO2 as aqueous lithium-ion battery electrodes. Electrochem. Commun. 2009, 11, 247–249. [Google Scholar] [CrossRef]
  25. Ramanujapuram, A.; Gordon, D.; Magasinski, A.; Ward, B.; Nitta, N.; Huang, C.; Yushin, G. Degradation and stabilization of lithium cobalt oxide in aqueous electrolytes. Energy Environ. Sci. 2016, 9, 1841–1848. [Google Scholar] [CrossRef]
  26. Oh, H.; Yamagishi, H.; Ohta, T.; Byon, H.R. Understanding the interfacial reactions of LiCoO2 positive electrodes in aqueous lithium-ion batteries. Mater. Chem. Front. 2021, 5, 3657–3663. [Google Scholar] [CrossRef]
  27. Wu, X.; Wen, Z.; Lin, B.; Xu, X. Sol–gel synthesis and sintering of nano-size Li2TiO3 powder. Mater. Lett. 2008, 62, 837–839. [Google Scholar] [CrossRef]
  28. Yu, L.; Yanagisawa, K.; Kamiya, S.; Kozawa, T.; Ueda, T. Monoclinic Li2TiO3 nanoparticles via hydrothermal reaction: Processing and structure. Ceram. Int. 2014, 40, 1901–1908. [Google Scholar] [CrossRef]
  29. Zhou, Q.; Oya, Y.; Chikada, T.; Zhang, W.; Xue, L.; Yan, Y. Preparation of Li2TiO3 by hydrothermal synthesis and its structure evolution under high energy Ar+ irradiation. J. Eur. Ceram. Soc. 2017, 37, 4955–4961. [Google Scholar] [CrossRef]
  30. Yu, C.L.; Wang, F.; Zhang, A.L.; Gao, D.P.; Cao, S.Y.; Guo, Y.Y.; Hui. H.B.; Hao, X.; Wang, D.Y.; Yanagisawa, K. Preparation of β-Li2TiO3 pebbles by a modified indirect wet chemistry method. Fusion. Eng. Des. 2015, 101, 73–79. [Google Scholar] [CrossRef]
  31. Kataoka, K.; Takahashi, Y.; Kijima, N.; Nagai, H.; Akimoto, J.; Idemoto, Y.; Ohshima, K.-I. Crystal growth and structure refinement of monoclinic Li2TiO3. Mater. Res. Bull. 2009, 44, 168–172. [Google Scholar] [CrossRef]
  32. Ohzuku, T.; Ueada, A. Solid-state redox reactions of LiCoO2 (R-3m) for 4-volt secondary lithium cells. J. Electrochem. Soc. 1994, 141, 2972–2977. [Google Scholar] [CrossRef]
  33. Calos, N.J.; Forrester, J.S.; Schaffer, G.B. A crystallographic contribution to the mechanism mechanically induced solid state reaction. J. Solid State Chem. 1996, 122, 272–280. [Google Scholar] [CrossRef]
  34. Denisova, T.A.; Maksimova, L.G.; Polyakov, E.V.; Zhuravlev, N.A.; Kovyazina, S.A.; Leonidova, O.N.; Khabibulin, D.F.; Yureva, E.I. Metatitanic acid: Synthesis and properties. Russian J. Inorg. Chem. 2006, 51, 691–699. [Google Scholar] [CrossRef]
  35. Julien, C. Local cationic environment in lithium nickel-cobalt oxides used as cathode materials for lithium batteries. Solid State Ion. 2000, 136, 887–896. [Google Scholar] [CrossRef]
  36. Diebold, U.; Madey, T.E. TiO2 by XPS. Surf. Sci. Spectra 1996, 4, 227–231. [Google Scholar] [CrossRef]
  37. Zhang, L.-Y.; Shui, Y.; Zhao, L.-L.; Zhu, P.; Xu, W.-Y.; You, Y.H. Preparation of Ni-doped Li2TiO3 using an inorganic precipitation-peptization method. Coatings 2019, 9, 701. [Google Scholar] [CrossRef] [Green Version]
  38. Lu, J.; Peng, Q.; Wang, W.; Nan, C.; Li, L.; Li, Y. Nanoscale coating of LiMO2 (M = Ni, Co, Mn) nanobelts with Li+—conductive Li2TiO3: Toward better rate capabilities for Li-ion batteries. J. Am. Chem. Soc. 2013, 135, 1649–1652. [Google Scholar] [CrossRef]
  39. Ouatani, L.E.; Dedryvère, R.; Siret, C.; Biensan, P.; Gonbeau, D. Effect of vinylene carbonate additive in Li-ion batteries: Comparison of LiCoO2/C, LiFePO4/C, and LiCoO2/Li4Ti5O12 systems. J. Electrochem. Soc. 2009, 156, A468–A477. [Google Scholar] [CrossRef]
  40. Dedryvère, R.; Foix, D.; Franger, S.; Patoux, S.; Daniel, L.; Gonbeau, D. Electrode/electrolyte interface reactivity in high-voltage spinel LiMn1.6Ni0.4O4/Li4Ti5O12 lithium-ion battery. J. Phys. Chem. C 2010, 114, 10999–11008. [Google Scholar] [CrossRef]
  41. Daheron, L.; Martinez, H.; Dedryvere, R.; Baraille, I.; Menetrier, M.; Denage, C.; Delmas, C.; Gonbeau, D. Surface properties of LiCoO2 investigated by XPS analyses and theoretical calculations. J. Phys. Chem. C 2009, 113, 5843–5852. [Google Scholar] [CrossRef]
  42. Sivajee Ganesh, K.; Purusottam Reddy, B.; Jeevan Kumar, P.; Hussain, O.M. Influence of Zr dopant on microstructural and electrochemical properties of LiCoO2 thin film cathodes by RF sputtering. J. Electroanal. Chem. 2018, 828, 71–79. [Google Scholar] [CrossRef]
  43. Lin, L.; Song, X.; Chen, Y.; Rong, M.; Zhao, T.; Jiang, Y.; Wang, Y.; Chen, X. One-pot synthesis of highly greenish-yellow fluorescent nitrogen doped graphene quantum dots for pyrophosphate sensing via competitive coordination with Eu3+ ions. Nanoscale 2015, 7, 15427–15433. [Google Scholar] [CrossRef] [PubMed]
  44. Li, L.; Xu, Y.; Sun, X.; He, S.; Li, L. High capacity-favorable tap density cathode material based on three-dimensional carbonous framework supported Na3V2(PO4)2F3 nanoparticles. Chem. Eng. J. 2018, 331, 712–719. [Google Scholar] [CrossRef]
  45. Kavan, L.; Procházka, J.; Spitler, T.M.; Kalbáč, M.; Zukalová, M.; Drezen, T.; Grätzel, M. Li Insertion into Li4Ti5O12 (spinel): Charge capability vs. particle size in thin-film electrodes. J. Electrochem. Soc. 2003, 150, A1000–A1007. [Google Scholar] [CrossRef]
  46. Kojima, Y.; Suzuki, K.; Kawai, Y. Hydrogen generation from lithium borohydride solution over nano-sized platinum dispersed on LiCoO2. J. Power Sources 2006, 155, 325–328. [Google Scholar] [CrossRef]
  47. Lakshmi-Narayana, A.; Dhananjaya, M.; Guru-Prakash, N.; Hussain, O.M.; Julien, C.M. Nanocrystalline Li2TiO3 electrodes for supercapattery application. Ionics 2017, 23, 3419–3428. [Google Scholar] [CrossRef]
  48. Islam, M.M.; Bredow, T. Lithium diffusion pathways in β-Li2TiO3: A theoretical study. J. Phys. Chem. C 2016, 120, 7061–7066. [Google Scholar] [CrossRef]
  49. Rho, Y.H.; Kanamura, K. Li+-ion diffusion in LiCoO2 thin film prepared by the poly(vinylpyrrolidone) sol-gel method. J. Electrochem. Soc. 2004, 151, A1406–A1411. [Google Scholar] [CrossRef]
  50. Van der Ven, A.; Aydinol, M.K.; Ceder, G.; Kresse, G.; Hafner, J. First-principles investigation of phase stability in LixCoO2. Phys. Rev. B 1998, 58, 2975–2987. [Google Scholar] [CrossRef]
  51. Morales, J.; Santos-Pena, J.; Trocoli, R.; Franger, S. Electrochemical activity of rock-salt-structured LiFeO2-Li4/3Ti2/3O2 nanocomposites in lithium cells. J. Nanopart. Res. 2008, 10, 217–226. [Google Scholar] [CrossRef]
  52. Pyun, S.-I.; Bae, J.-S. The ac impedance study of electrochemical lithium intercalation into porous vanadium oxide electrode. Electrochim. Acta 1996, 41, 919–925. [Google Scholar] [CrossRef]
  53. Mizushima, K.; Jones, P.C.; Wiseman, P.J.; Goodenough, J.B. LixCoO2 (0 <x <1): A new cathode material for batteries of high energy density. Mater. Res. Bull. 1980, 15, 783–789. [Google Scholar]
  54. Lakshmi-Narayana, A.; Dhananjaya, M.; Guru-Prakash, N.; Hussain, O.M.; Mauger, A.; Julien, C.M. Li2TiO3/Graphene and Li2TiO3/CNT composites as anodes for high power Liion batteries. ChemSelect 2018, 3, 9150–9158. [Google Scholar]
  55. Schweikert, N.; Heinzmann, R.; Eichhöfer, A.; Hahn, H.; Indris, S. Electrochemical impedance spectroscopy of Li4Ti5O12 and LiCoO2 based half-cells and Li4Ti5O12/LiCoO2 cells: Internal interfaces and influence of state-of-charge and cycle number. Solid State Ion. 2012, 226, 15–23. [Google Scholar] [CrossRef]
  56. Wang, Y.; Luo, J.; Wang, C.; Xia, Y. Hybrid aqueous energy storage cells using activated carbon and lithium-ion intercalated compounds: II. Comparison of LiMn2O4, LiCo1/3Ni1/3Mn1/3O2 and LiCoO2 positive electrodes. J. Electrochem. Soc. 2006, 153, A1425–A1431. [Google Scholar] [CrossRef]
  57. Sencanski, J.; Bajuk-Bogdanovi, D.; Majstorovic, D.; Tchernychova, E.; Papan, J.; Vujkovic, M. The synthesis of Li(Co-Mn-Ni)O2 cathode material from spent-Li ion batteries and the proof of its functionality in aqueous lithium and sodium electrolytic solutions. J. Power Sources 2017, 342, 690–703. [Google Scholar] [CrossRef]
  58. Wang, G.J.; Zhao, N.H.; Yang, L.C.; Wu, Y.P.; Wu, H.Q.; Holze, R. Characteristics of an aqueous rechargeable lithium battery (ARLB). Electrochim. Acta 2007, 52, 4911–4915. [Google Scholar] [CrossRef]
  59. Jeong, E.D.; Won, M.S.; Shim, Y.B. Cathodic properties of a lithium-ion secondary battery using LiCoO2 prepared by a complex formation reaction. J. Power Sources 1998, 70, 70–77. [Google Scholar] [CrossRef]
  60. Yoshio, M.; Tanaka, H.; Tominaga, K.; Noguchi, H. Synthesis of LiCoO2 from cobalt-organic acid complexes and its electrode behavior in a lithium secondary battery. J. Power Sources 1992, 40, 347–353. [Google Scholar] [CrossRef]
  61. Zhang, W.; Wang, D.; Zheng, W. A semiconductor-electrochemistry model for design of high-rate Li ion battery, literature. J. Energy Chem. 2020, 41, 100–106. [Google Scholar] [CrossRef] [Green Version]
Figure 1. X-ray diffraction patterns of Li2TiO3 (a) and LiCoO2 nanoparticles (b) recorded with the X-ray source CuKα (λ = 1.5406 Å) filtered by Ni film at a scan speed of 0.03 degree per second. Raman spectra of Li2TiO3 (c), and LiCoO2 (d) nanoparticles recorded with a 532 nm laser excitation line.
Batteries 08 00149 g001
Figure 2. XPS analysis of Li2TiO3 (ad) and LiCoO2 (eh). XPS survey spectrum of (a) Li2TiO3, high-resolution XPS spectra of (b) O 1s, (c) Ti 2p, and (d) Li 1s. XPS survey spectrum of (e) LiCoO2, high-resolution XPS spectra of individual elements: (f) O 1s, (g) Co 2p, and (h) Li 1s.
Batteries 08 00149 g002
Figure 3. TEM images of (a) Li2TiO3, and (b) LiCoO2. SAED patterns of (c) Li2TiO3 and (d) LiCoO2. HRTEM images of (e) Li2TiO3, and (f) LiCoO2.
Batteries 08 00149 g003
Figure 4. FE-SEM images of (a) Li2TiO3, and (b) LiCoO2; EDAX pattern of (c) Li2TiO3, and (d) LiCoO2.
Batteries 08 00149 g004
Figure 5. (a,b) N2 adsorption–desorption isotherms and (c,d) the corresponding BJH pore size distribution of Li2TiO3 and LiCoO2, respectively.
Batteries 08 00149 g005
Figure 6. Electrochemical properties of (ad) Li2TiO3//Pt half-cell and (eh) LiCoO2//Pt half-cell in the potential range 0.0–0.1 V. (a,e) Cyclic voltammetry curves recorded at scan rate range of 1 mV s−1. (b,f) Galvanostatic charge-discharge (GCD) curves cycled at current rate of 0.5 C. (c,g) Electrochemical impedance spectrum (1st and after 50th cycle) with equivalent circuit (Inset). (d,h) Cyclability measured at current rate of 0.5 C for LTO (d) in the potential range 0.0–1.0 V vs. Ag/AgCl and for LCO (h) in the potential range 0.2–1.0 V vs. Ag/AgCl.
Batteries 08 00149 g006
Figure 7. Electrochemical properties of a Li2TiO3//LiCoO2 full cell with 1 mol L−1 saturated Li2SO4 aqueous solution as electrolyte and Ag/AgCl reference electrode. (a) Cyclic voltammetry curves. (b) Galvanostatic charge–discharge profiles carried out at various current rates from 0.5–5 C, (c) Electrochemical impedance spectrum. (d) Cycling performance at current rate of 0.5 C in the voltage range between 0.0 and 1.0 V.
Batteries 08 00149 g007
Figure 8. Post-mortem analyses of LTO and LCO electrodes. FE-SEM images after 50 cycles of (a) Li2TiO3 and (b) LiCoO2. X-ray diffraction patterns before and after cycling of (c) Li2TiO3 and (d) LiCoO2.
Batteries 08 00149 g008
Table 1. Comparison of the electrochemical performance of various LCO-based aqueous cells. Number of cycles are given in parentheses.
CellElectrolyteAveraged
Cell Voltage
(V)
Specific Capacity
(mAh g−1)
Ref.
LiCoO2//AC1 M Li2SO4 solution0.6126 @ 6 mA cm−2[56]
LiCoO2//Mo6S8TFSI in water-in-salt1.060 @ 0.5 C (20)[23]
LiCoO2//Li4Ti5O12Li(TFSI)x(BETI)1−x salt2.3~40 @ 10 C (200)[13]
LiCoO2//Li0.5Mn2O41 M LiNO30.8105 @ 1 C (25)[24]
LiCo0.415Mn0.435Ni0.15O2//C6 M LiNO31.064 @ 40 C (1)[57]
LiCoO2//LiTi2(PO4)31 M Li2SO4 (pH = 10)0.7130 @ 1 C (1)[18]
LiCoO2//Li4Ti5O12(PTFSI)0.6(TFSI)0.4·1.15H2O2.2~75 @ 0.2 C (100)[14]
LiCoO2//LiV3O8saturated LiNO31.055 @ 0.2 mA cm−2 (12)[58]
LiCoO2//Li2TiO31 M Li2SO4 (pH ≈ 9)0.7135 @ 0.5 C (50)this work
Publisher’s Note: MDPI stays neutral with regard to jurisdictional claims in published maps and institutional affiliations.

