Article

A Study of Thermal Runaway Mechanisms in Lithium-Ion Batteries and Predictive Numerical Modeling Techniques

1
Chemical and Biological Engineering Department, University of Idaho, Moscow, ID 83844, USA
2
Electric Power Systems Inc., North Logan, UT 84341, USA
*
Author to whom correspondence should be addressed.
Batteries 2024, 10(4), 116; https://doi.org/10.3390/batteries10040116
Submission received: 5 March 2024 / Revised: 21 March 2024 / Accepted: 27 March 2024 / Published: 29 March 2024
(This article belongs to the Collection Recent Advances in Battery Management Systems)

Abstract

:
While thermal runaway characterization and prediction is an important aspect of lithium-ion battery engineering and development, it is a requirement to ensure that a battery system can be safe under normal operations and during failure events. This study investigated the current existing literature regarding lithium-ion battery thermal runaway characterization and predictive modeling methods. A thermal model for thermal runaway prediction was adapted from the literature and is presented in this paper along with a comparison of empirical data and predicted data using the model. Empirical data were collected from a Samsung 30Q 18650 cylindrical cell and from a large 20 Ah pouch cell format using accelerated rate calorimetry. The predictive model was executed in a macro-enabled Microsoft Excel workbook for simplicity and accessibility for the public. The primary purpose of using more primitive modeling software was to provide an accurate model that was generally accessible without the purchase of or training in a specific modeling software package. The modes of heat transfer during the thermal runaway event were studied and are reported in this work, along with insights on thermal management during a thermal runaway failure event.

1. Introduction

The development of lithium-ion battery technology has become a paramount task to assist in the transition from combustion-based propulsion systems to electric-based propulsion systems in both the automotive and aerospace industries. The Bloomberg New Energy Finance group projects that lithium-ion battery demand for the automotive industry is projected to grow to almost 1300 GWh by 2030. The aerospace industry’s demand for lithium-ion batteries is expected to grow at a similar rate as the automotive industry [1]. As a result, the advancement of lithium-ion battery safety is a critical enabling technology for electrification [2].
Lithium-ion batteries have a variety of failure modes that are caused by a series of abuse conditions: mechanical abuse, such as a collision, crush, pinch, or penetration; electrical abuse, such as external and internal short circuits, overcharge, and over-discharge; and thermal abuse, such as overheating [3]. The outcome of one or more of these abuse conditions can result in parasitic and exothermic reactions occurring between the electrolyte, solid electrolyte interphase (SEI), and the positive and negative electrodes. These reactions produce large amounts of heat and noxious gases, causing serious health, fire, and safety hazards. Although there is a significant amount of energy that is released from the battery in the form of joule heat (the electrochemical energy that was stored in the cell), the majority of the energy released originates from the exothermic reduction and oxidation reactions occurring at the positive and negative electrode surfaces [4,5]. To ensure the safe and rapid development of lithium-ion batteries, the failure mechanisms and modes must be characterized and predicted. Zhao et al. [6], Chen et al. [7], and Liu et al. [8] studied the mechanisms of thermal runaway (TR) during a failure event. They showed that TR has two mechanistic critical temperatures, as shown in Figure 1. TR can be separated into three stages, as indicated in Figure 1, where stage I indicates the safe temperature range in which the cell can be operated, stage II indicates the stage at which TR has begun to cause irreparable damage to the cell (complete destruction can be avoided by proper cooling of the cell), and stage III indicates the stage at which complete cell destruction is unavoidable and the rapid discharge of energy shortly follows. The first critical temperature begins at the point at which electrolyte is released from the cell during the venting process. As oxygen concentration increases, the internal pressure of the cell increases greatly until the cell either vents or ruptures, releasing the gases and decreasing the internal temperature. The first critical temperature is followed shortly by the separator melting temperature. The separator melting temperature is indicated by the inflection point between the first and second critical temperatures. At this point, the separator micropores that naturally allow for the shuttling of lithium ions between the electrodes increase in dimension. This deformation allows for micro shorts to occur between the positive and negative electrodes, further causing an increase in cell temperature and causing the voltage of the cell to become unsteady. The second critical temperature of the cell is reached when the micropores in the separator become large enough that a hard short occurs between the anode and cathode, allowing the internal stored energy to be discharged completely. This causes the temperature of the cell to increase at an extreme rate and a TR event becomes unavoidable. The second critical temperature is followed quickly by total cell destruction [6,8,9].
Although an understanding of these critical temperatures and failure mechanisms is imperative for the development of battery safety, it is not sufficient to design a battery module or system for application. Along with other important characteristics of a battery failure event, such as energy release and the energy release rate, a consistent prediction method of TR failure should also be considered for safe battery design. The development of a consistent prediction method for TR is a difficult task as TR failure events are statistically stochastic events, with wide fluctuations in maximum temperatures, mass lost, and energy release. It also becomes daunting, as the reactions in the cell and during the failure event occur at rapid rates and are complex in nature [8]. A variety of methods for TR modeling have been reported in the literature, with the consensus being a coupled thermal and electrochemical model using Arrhenius-based modeling techniques derived from empirical data [10,11,12,13,14,15,16].
This study explores the mechanisms of thermal runaway as initiated by overheat abuse in two different lithium-ion cell formats, including 3.3 Ah Samsung 30Q 18650 cylindrical cells and larger 20 Ah pouch cell formats. This study also discusses the uses of thermal and electrochemical modeling techniques for modeling TR failure events in lithium-ion batteries.

2. Materials and Methods

Thermal runaway testing was conducted in an extended volume plus accelerated rate calorimeter (ARC) manufactured by Thermal Hazard Technology. The ARC employed a heat-wait-seek algorithm, wherein a target temperature was specified and the heaters in the bottom, walls, and lid of the ARC were activated to reach the set temperature with 20% heater power. After the target temperature was reached, the ARC then entered a wait mode wherein the ARC heaters only activated to maintain the set temperature. The period of waiting depended on the thermal mass of the test being conducted. For a cylindrical 18650-style lithium-ion cell, the wait time was only 25 min to allow thermal equilibrium to be met; however, for the 20 Ah pouch-style cell, the wait time was 30 min to reach thermal equilibrium. After the waiting period was completed, the ARC then entered the seek mode, wherein the temperature rate of the cell was monitored for a period of 20 min. The temperature sensitivity was set to 0.05 °C/min. If the temperature rate was determined to be less than the sensitivity setting, the ARC defined a new temperature set point that was 5 °C above the previous temperature set point, and the process was repeated. If the temperature rate was determined to be above the temperature sensitivity setting, the ARC entered exotherm mode. In exotherm mode, the ARC monitored the temperature of the cell and used the heaters to match the temperature for the entire chamber. This process allowed for controlled heating and near-adiabatic conditions during the TR failure event. It also allowed for accurate measurements of the first and second critical temperatures since the heating process was slow enough to assume that the system was at thermal equilibrium. Once the maximum temperature in the ARC reached 300 °C, the chamber began to vent the expended gases and cool to 35 °C.
The ARC was excellent for measuring the temperature data for TR failure reactions; however, it was limited in its measurement of total change in cell enthalpy as the rise in temperature was not the only form of energy distribution during the TR event. As mentioned previously, large amounts of gases were produced that changed the pressure of the system, and the cell deformed greatly during the event. The ARC had rudimentary pressure measurements; however, these tests were conducted in the ARC outside of a sealed pressure vessel so as to not hinder the reaction rates of the failure event and to approximate actual failure conditions in a system where pressure was not contained. For a more comprehensive measurement of enthalpy change, additional measurements would need to be made with a system such as the NASA fractional TR calorimeter (FTRC), which can measure the pressure release rate and temperature rate, allowing the measurement of energy release in the form of pressure and temperature increase without hindering the reaction rates of the TR event.
All cells were charged to a 100% state of charge (SOC) prior to TR testing in the ARC, which was defined as a constant current charge until the manufacturer’s recommended maximum voltage was attained, followed by a constant voltage charge-tapering current until a current flow of less than 1C1/20 was reached, or the point at which the current was less than or equal to the current equivalent with the cell capacity was reached, or until a constant voltage charge time of 3 h was reached.
The software used for modeling simulations in this study was Macro-Enabled Microsoft Excel 365. The purpose of this software choice was three-fold. First, the data file produced by the ARC software Version 9.4.3 was easily compatible with Microsoft Excel and was easily visible. Second, it was a priority of this study to develop a thermal model using software that was readily available to those other than the authors, such as private consumers. Third, Microsoft Excel Version 2402 (Build 17328.20184) was software for which the authors already possessed licenses.

3. Results

3.1. Model and Implementation

The model selection for this study included a lumped thermal model that included heat accumulation, heat transfer by radiation, heat transfer by convection, and heat generation, as seen in Equation (1). Heat transfer by conduction was neglected as the cell was suspended in the ARC, minimizing heat losses by means of conduction. This method did not entirely remove heat transfer by conduction; however, it was assumed that the heat transfer contribution by conduction was small enough that it could be neglected.
C p m c e l l T c e l l t = Q ˙ c e l l A c e l l ϵ σ ( T a m b i e n t 4 T c e l l 4 ) A c e l l h ( T a m b i e n t T c e l l )
Here, C p is the specific heat capacity of the test cell, m c e l l is the initial mass of the test cell, T c e l l is the modeled cell temperature, Q ˙ c e l l is the heat generated by the test cell during the TR event, A c e l l is the surface area of the cell that is available for heat transfer, ϵ is the emissivity of the cell, σ is the Stefan–Boltzmann constant, T a m b i e n t is the ambient system or ARC temperature, and h is the convective heat transfer coefficient. A lumped thermal model approach is not always an accurate assumption but is a sufficient assumption if the Biot number is less than 0.1, as shown in Equation (2).
B i = h L c k < 0.1
In the equation, h is the convection coefficient of heat transfer, L c is the characteristic length of the cell, and k is the conduction coefficient of heat transfer of the cell. For experiments conducted in the ARC, the convection coefficient was small enough that the conduction coefficient was much larger, and, thus, the Biot number requirement to utilize a lumped thermal model was satisfied. To void the lumped thermal model assumption, the Biot number must be larger than 0.1, according to Equation (2). For an 18650 cell, this was not violated until the convection coefficient rose above 925   W m 2 K , which was two orders of magnitude larger than that experienced in the ARC of 9.63   W m 2 K , wherein the Biot number associated with the natural convection coefficient was 0.001. The calculation was not repeated for the 20 Ah pouch-style cell because the characteristic length of the pouch cell is smaller than the radius of the 18650 cell, which would result in an even larger convection coefficient being required to violate Equation (2). Because the lumped sum assumption is valid for this instance, it can reasonably be assumed that the temperature of the cell is not dependent on position since the entire cell will be approximately at the same temperature, and, therefore, the cell temperature is only dependent on time. Due to this situation, the partial differential expressed in Equation (1) can be written as an ordinary differential, d T c e l l d t .
It was understood in the literature that the majority of heat generated during a TR failure event originates from side reactions occurring between the SEI, positive and negative electrodes, and electrolyte, and only a small amount of relative energy is contributed by the stored electrochemical energy in the cell [4,5]. The heat generation is defined using Equation (3):
Q ˙ c e l l = Q ˙ S E I + Q ˙ P E l e + Q ˙ N E l e + Q ˙ E l e + Q ˙ I S C
where Q ˙ S E I is the heat generated by the decomposition of the SEI, Q ˙ P E l e is the heat generated by the reactions occurring between the positive electrode and electrolyte, Q ˙ N E l e is the heat generated by the reactions occurring between the negative electrode and electrolyte, Q ˙ E l e is the heat generated by the decomposition of the electrolyte, and Q ˙ I S C is the heat generated from the internal short circuit during the TR event.
Despite the complexity of the aforementioned heat generation term, a simplified model was presented in this study, patterned after the model developed by Chen et al. where the total heat generation was separated into two heat generation terms and was regressed from empirical data [7]. The relative distribution of heat generation among the various reaction sites in the cell will remain unknown; however, the total heat generation was determined and was used to accurately predict the temperature response of a TR failure event. The simplified heat generation term is defined in Equation (4).
Q ˙ c e l l = Q ˙ I + Q ˙ I I
Q ˙ I 
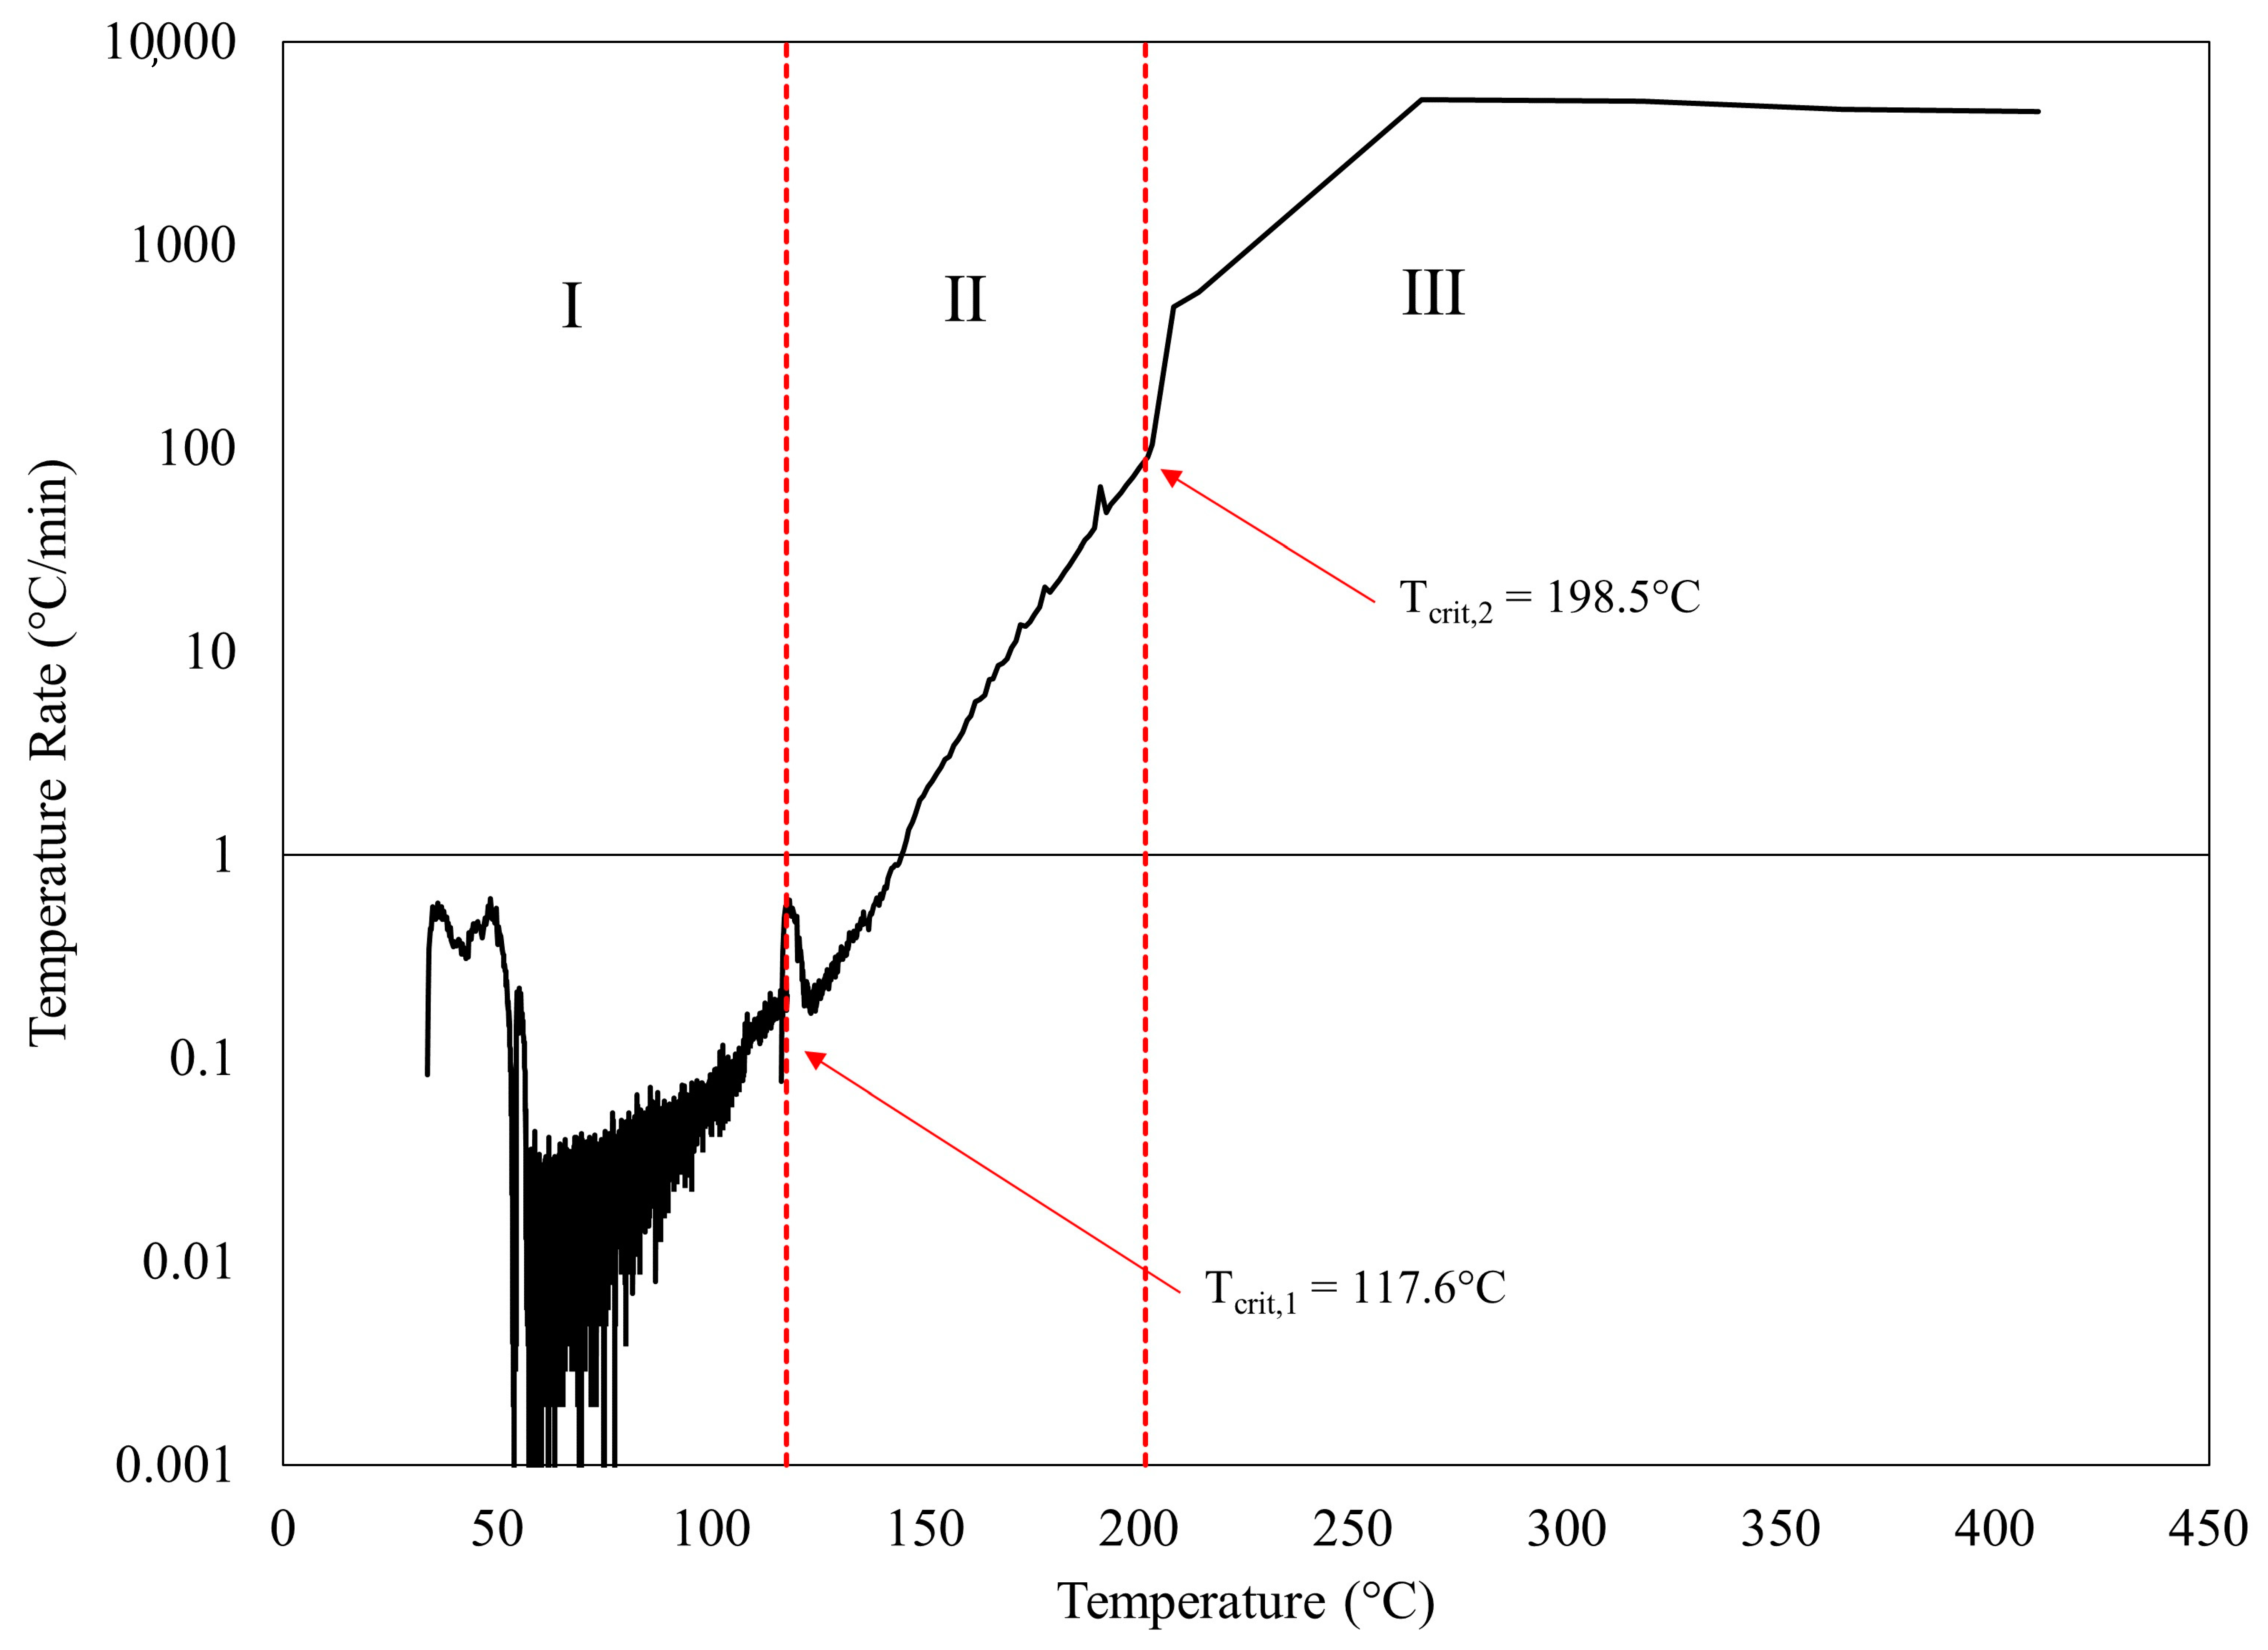
is defined as the heat generated from the TR overheat event from the first critical temperature to just before the separator melting point, also defined as T 2 . Q ˙ I I is defined as the heat generated from the TR overheat event, from T 2 to the second critical temperature. There was an experimental difference between the first and second sections of the TR event. During stage I , a side reaction began to occur, producing oxygen and causing irreparable damage to the cell; however, the cell was not self-heating at this point. Heat was generated from these reactions, but the reactions occurred slowly enough that the cell heating still needed to be subsidized for the temperature to continue to rise. In contrast, during stage I I , micropores in the separator began to develop, allowing shorting to occur and causing the temperature to rise much faster. The increased temperature accelerated the rates of side reactions occurring at the positive electrode, negative electrode, and SEI active sites. The combination of these two effects caused heat generation at this stage to be self-heating, thus showing the separation of stages I and I I .
The calculation of Q ˙ I and Q ˙ I I is defined in Equations (5)–(8).
Q ˙ I = m I H I d c d t
d c d t = A I exp ( E I R g a s T ) c
Q ˙ I I = m I I H I I d α d t
d α d t = A I I exp ( E I I R g a s T ) ( 1 α ) n
In the equation, m i (i = I and II) is the mass of the reactant material, H i is the enthalpy of the reaction, T is the modeled or predicted temperature, c is the normalized amount of reactant ranging from 0 to 1 (meaning that 100% of the reactant existing in the cell was present at the beginning of the TR event and 0% of the reactant consumed still existed at the end of the failure event), A I is the regressed frequency factor for stage I , E I is the apparent activation energy for stage I , R g a s is the universal gas constant, α is the reaction conversion, defined as the inverse of c , and n is the reaction order, which was determined by Chen et al. to be a second order [7]. During the TR event, we assume that the reaction conversion began at 0 and progressed to 1 when the maximum temperature was reached. A I I is the regressed frequency factor for stage I I , and E I I is the apparent activation energy for stage I I . The method for discrete calculation is presented in Appendix B.
As mentioned previously, the model was performed in Macro-Enabled Microsoft Excel, and c and α were computed by initially assuming the time step just before the first critical temperature was reached; the reaction progression was zero, the reaction progressed proportionally to the temperature rise, and concluded at the maximum temperature. The initial conditions of c , α , and T are given as c 0 = 1 , α 0 = 0 , and T = T 0 , respectively. Q ˙ g e n and T were implicitly solved simultaneously, using a Macro written in VBA.
Enthalpy is further defined in Equation (9):
H i = ϕ C p Δ T
where ϕ is the thermal inertia used to compensate for the deviation from adiabatic conditions during TR failure events in the ARC, C p is the specific heat capacity of the cell, and Δ T is the adiabatic temperature rise. For stage I, ϕ = 1 (indicating a near absolute adiabatic environment), and Δ T = ( T 2 T a m b i e n t ) . During stage I I , ϕ = 1.1 because the conversion of the reactants at that point is not complete in the model, and Δ T = ( T m a x T 2 ) [7].

3.2. Experimental Results and Model Comparison

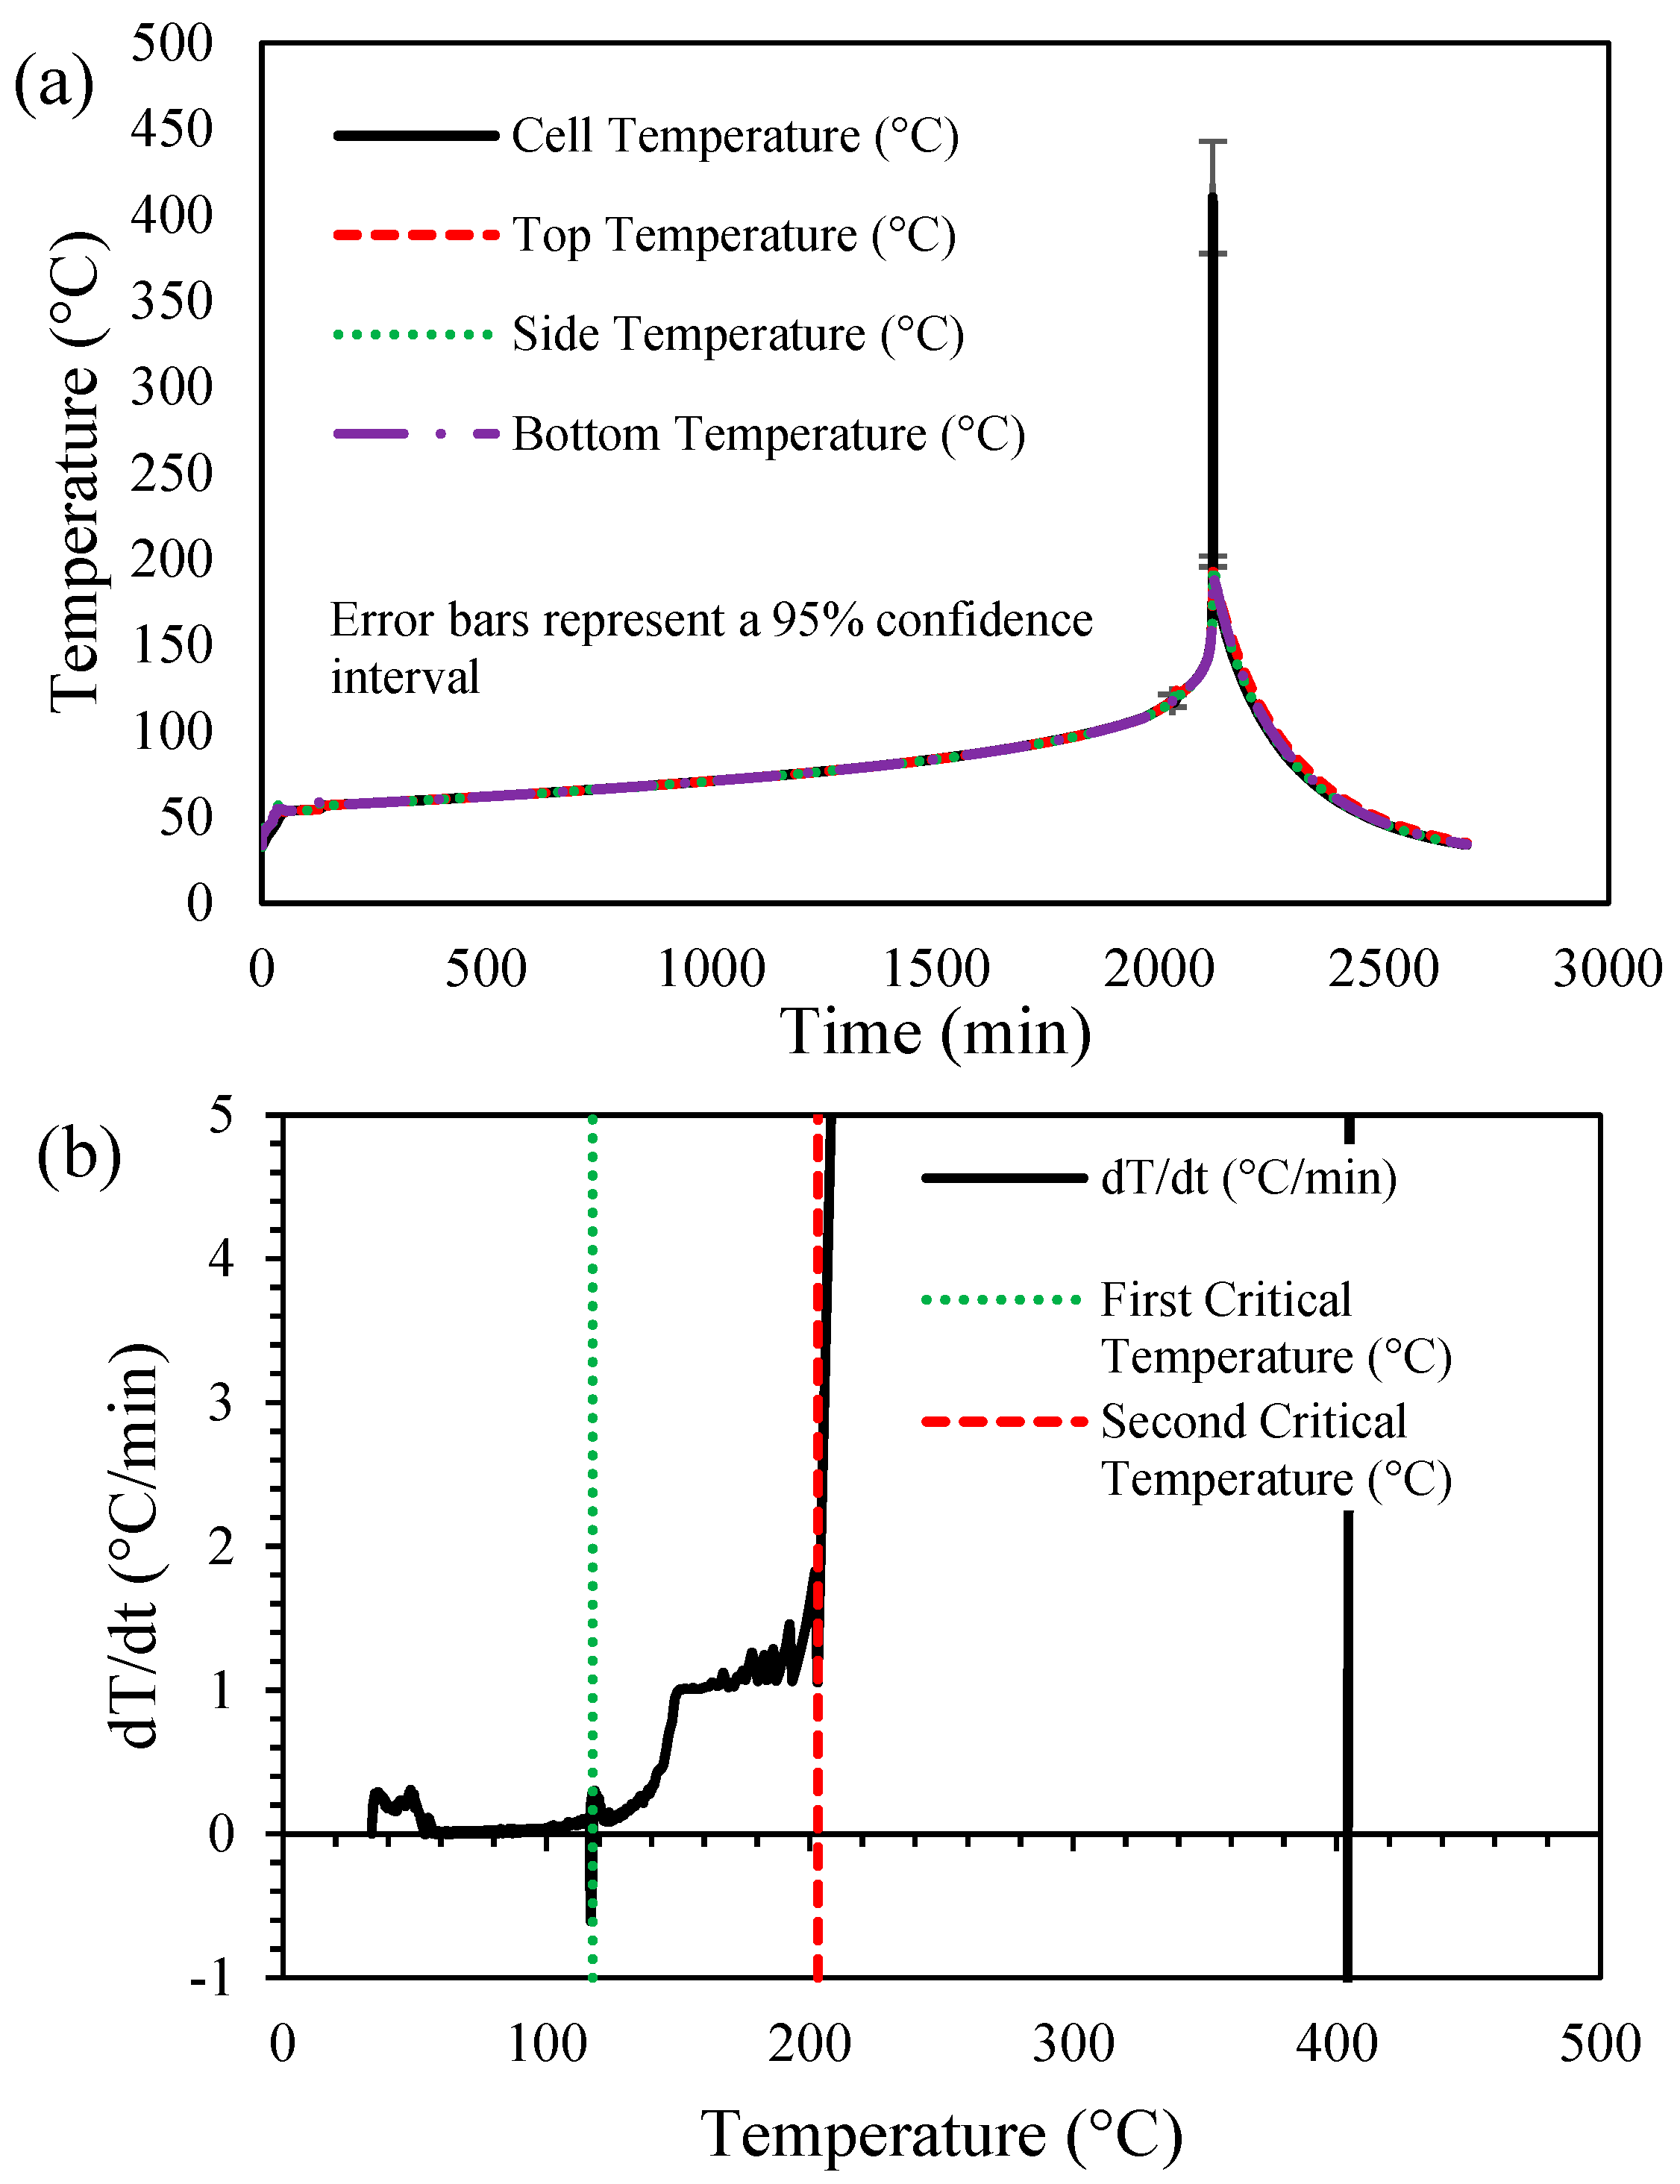
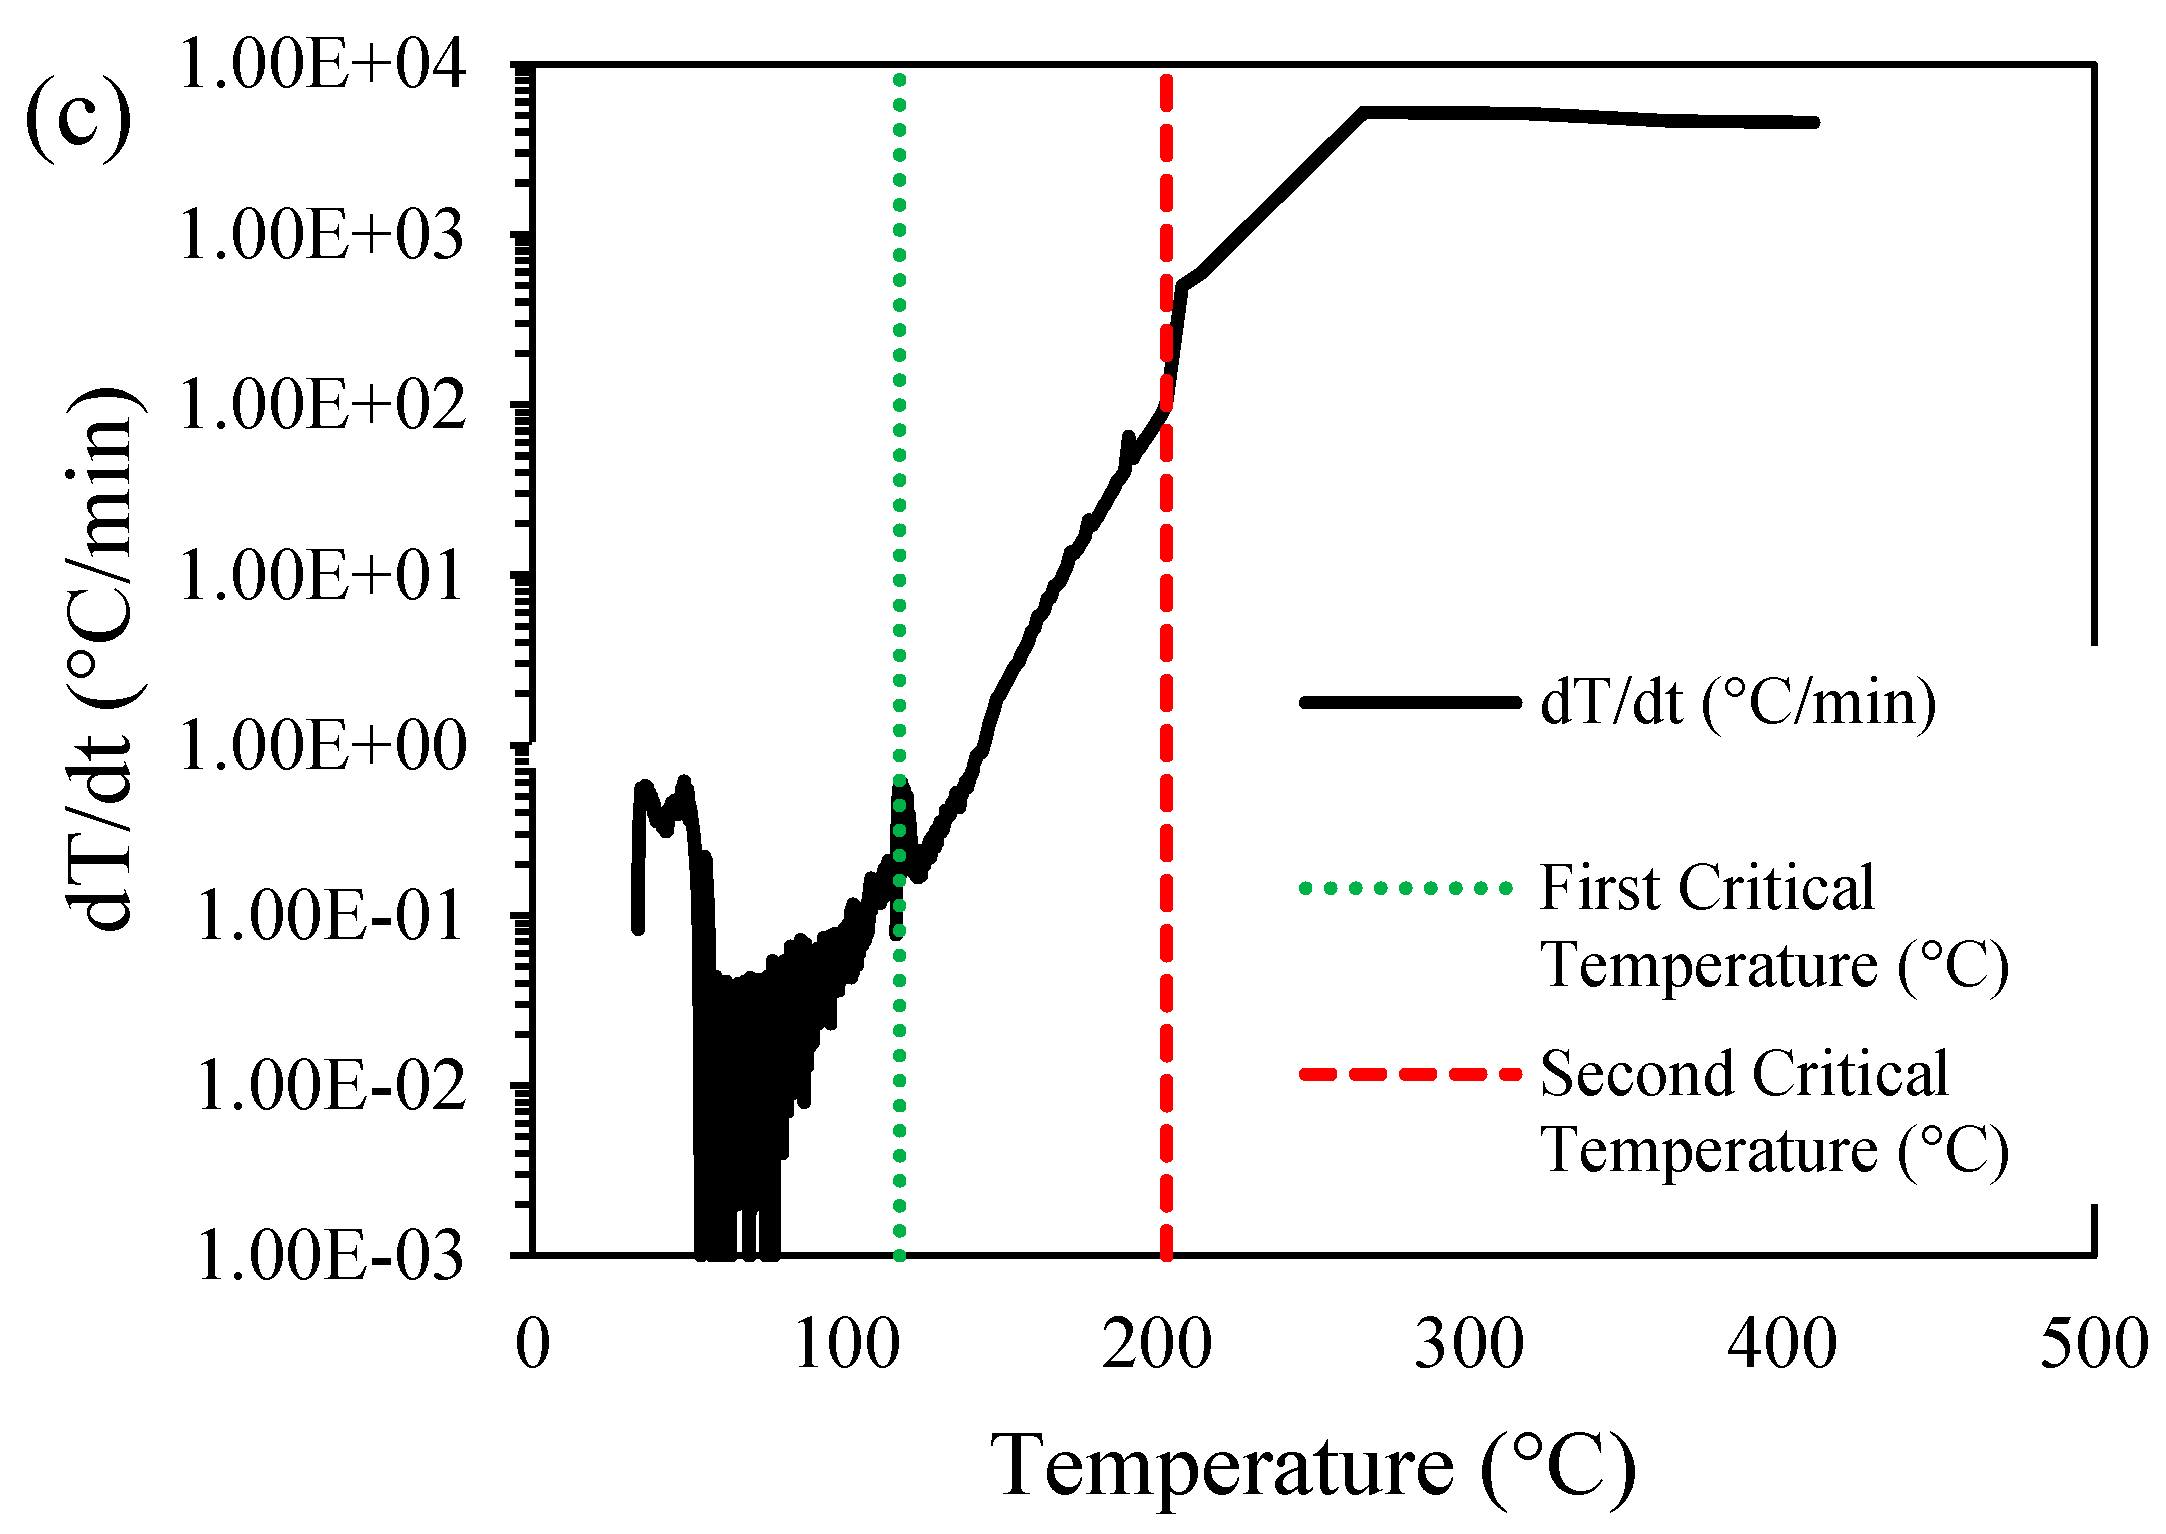
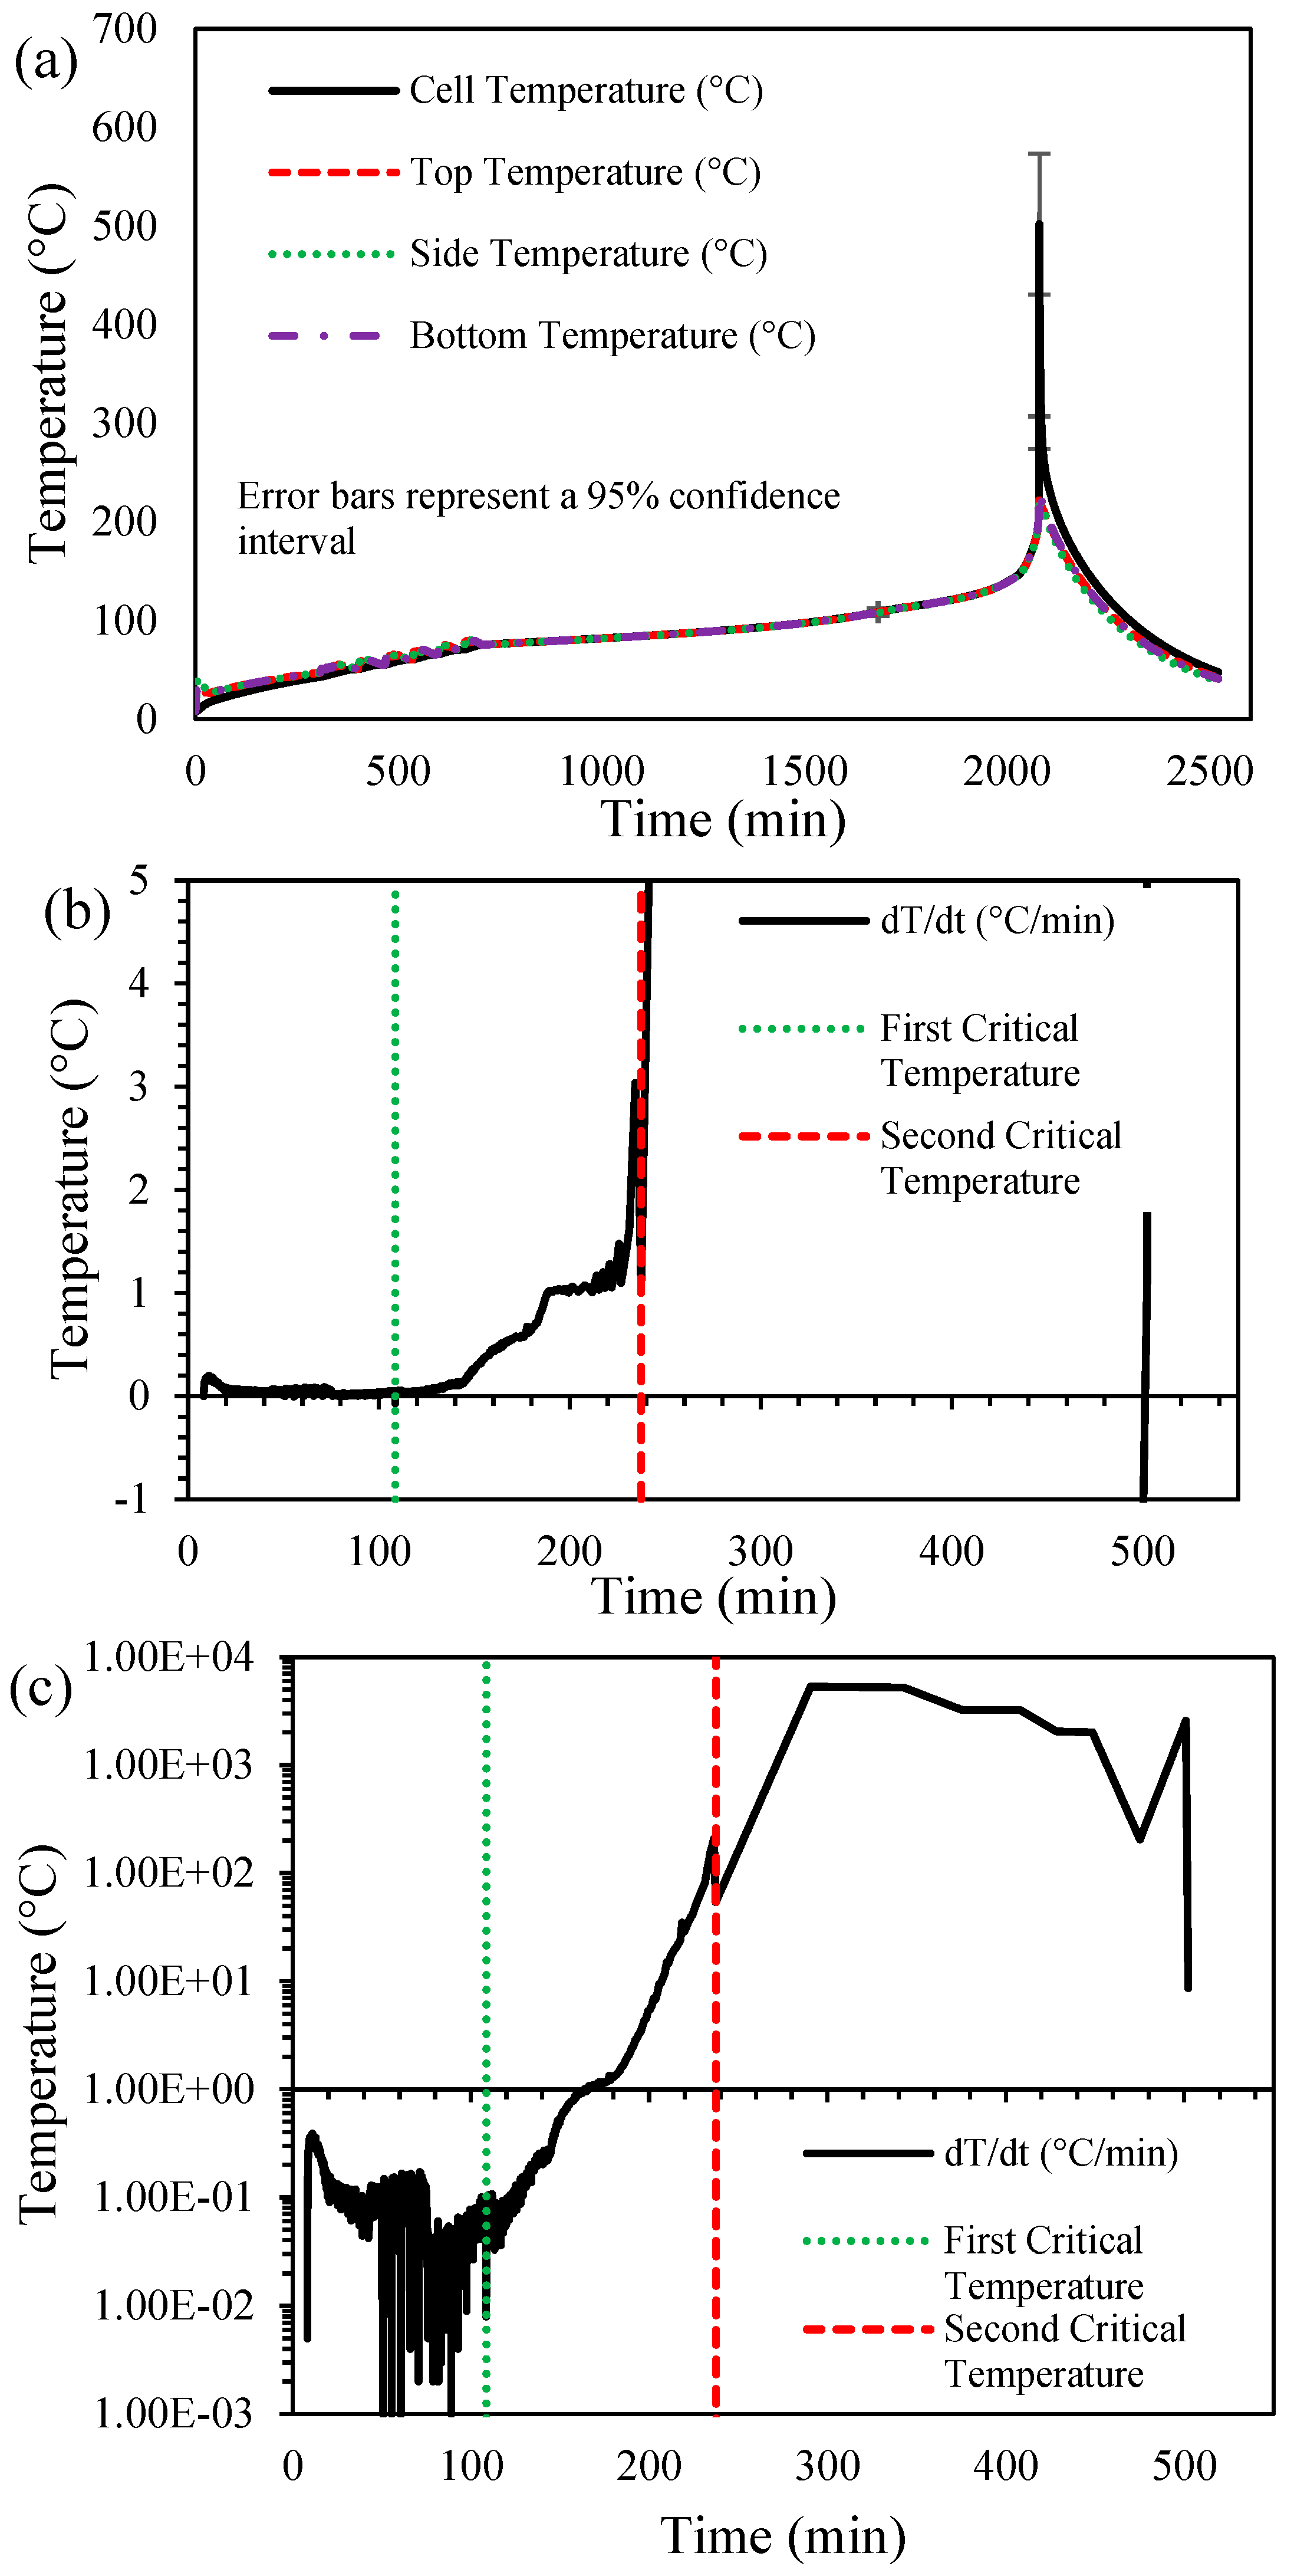
The initial stages of the study included initiating TR failure events by means of overheating in an EV+ ARC for a suite of Samsung 30Q 18650 cells. Empirical data were necessary to obtain the reaction kinetic parameters and calculate the total heat generation for the thermal model. The TR event profile for the Samsung 30Q 18650 cells under study is shown in Figure 2a–c. Please note that the cell temperature depicted in Figure 2a encompassed two distinct temperature measurements on the same cell during the thermal runaway event. This shows the deviation from adiabatic behavior seen during the thermal runaway event.
Empirical regression of the test data was derived by combining Equations (A1)–(A3) to produce Equation (10) (derivation in Appendix A).
d T c e l l d t = ϕ A I I ( T m a x T 2 ) exp ( E I I R g a s T c e l l ) ( 1 α ) ϕ
As discussed before, T 2 is the temperature at which the separator began to deform and melt. This temperature separated the concavity of the TR profile curve. At the beginning of stage I I , α was still approximately zero. There was some reaction conversion that occurred in stage I ; however, it was very small compared to the reaction progression that occurred in stage I I 
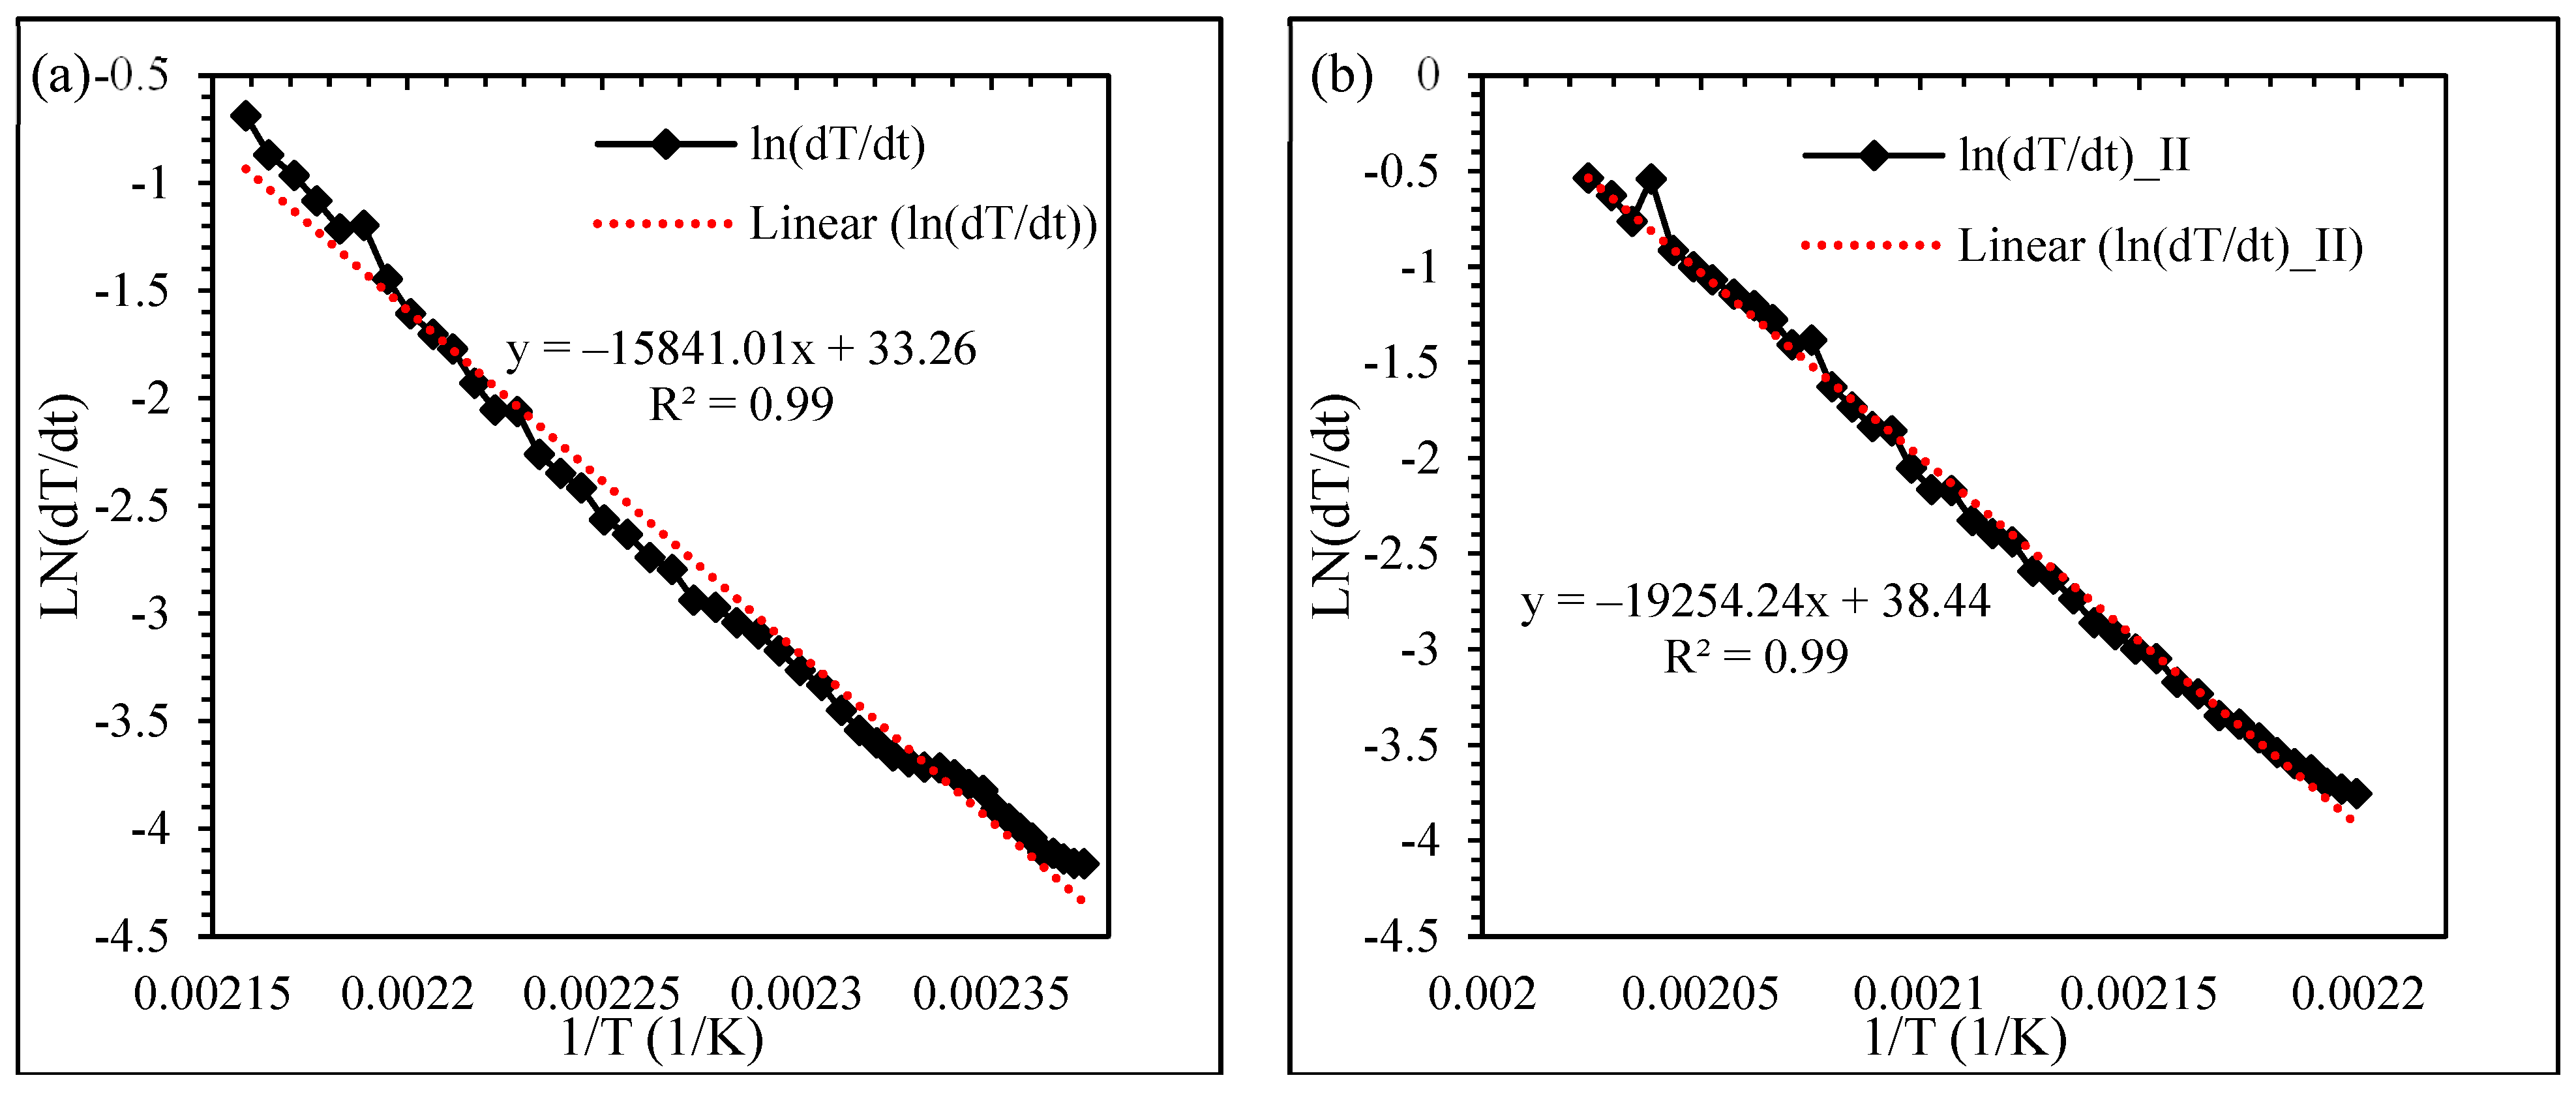
. Making this adjustment to Equation (10) and taking the natural log of both sides, Equation (11) was produced, which was used for the calculation of the kinetic parameters for the electrochemical portion of the model.
ln ( d T c e l l d t ) ln ( A I I ( T m a x T 2 ) ) E I I R g a s T c e l l
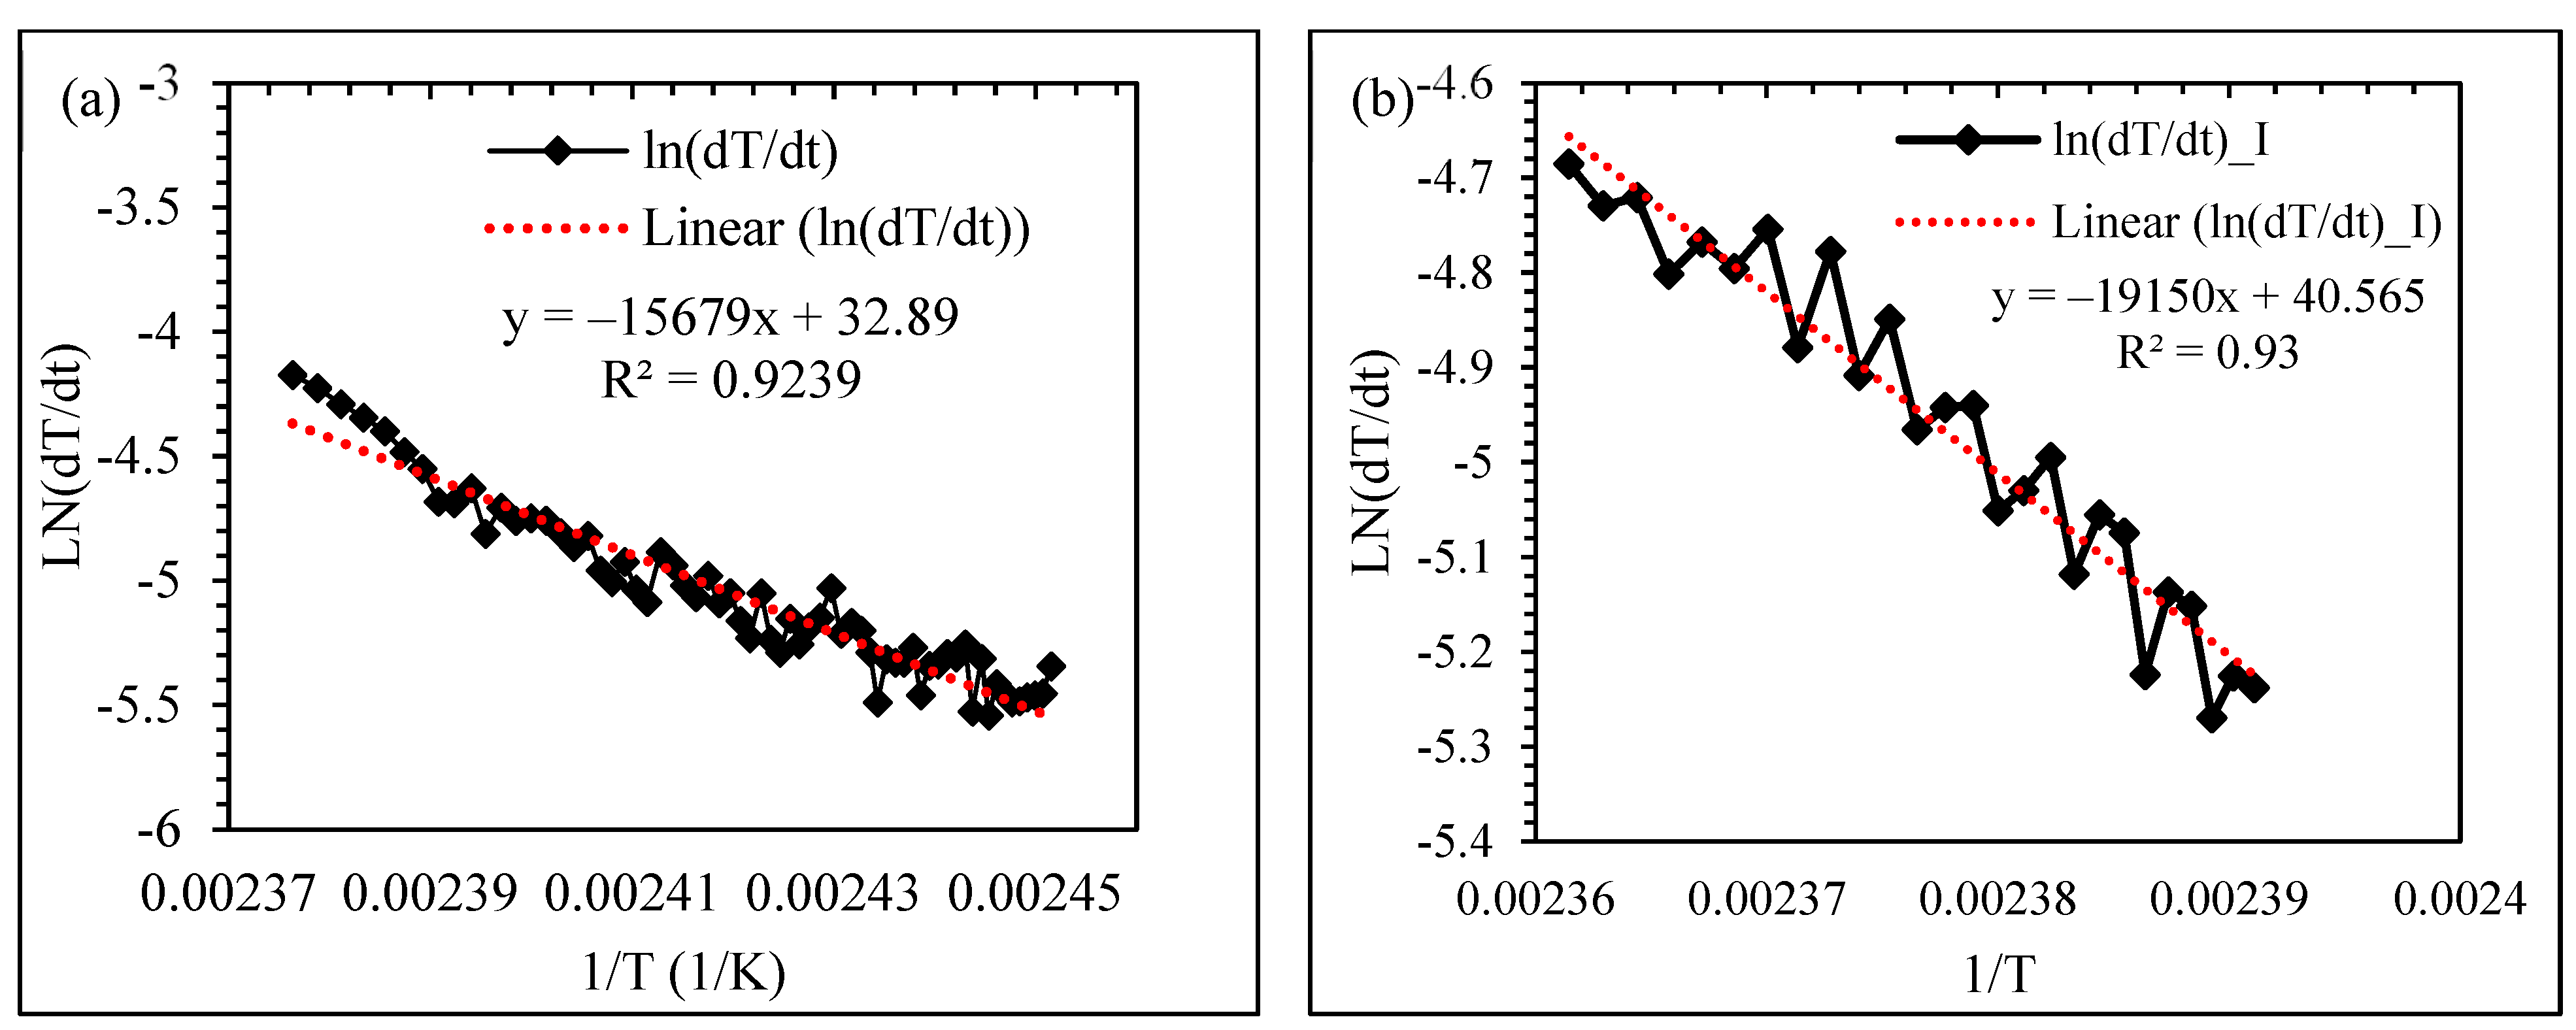
From Equation (11), TR empirical data was plotted as l n ( d T c e l l d t ) vs. 1 T c e l l . From this plot, shown in Figure 3 and Figure 4, a linear line was approximated wherein the frequency factor for stage I and stage II, respectively, was calculated with Equation (12), and the activation energy for stage I and stage II, respectively, was calculated with Equation (13).
A i = exp ( y i n t e r c e p t T m a x T 2 )
E i = S l o p e R g a s
Using Figure 4a and Equations (11)–(13), the Stage II kinetic parameters for the electrochemical portion of the model were determined for the Samsung 30Q 18650 cells and are presented in Table 1.
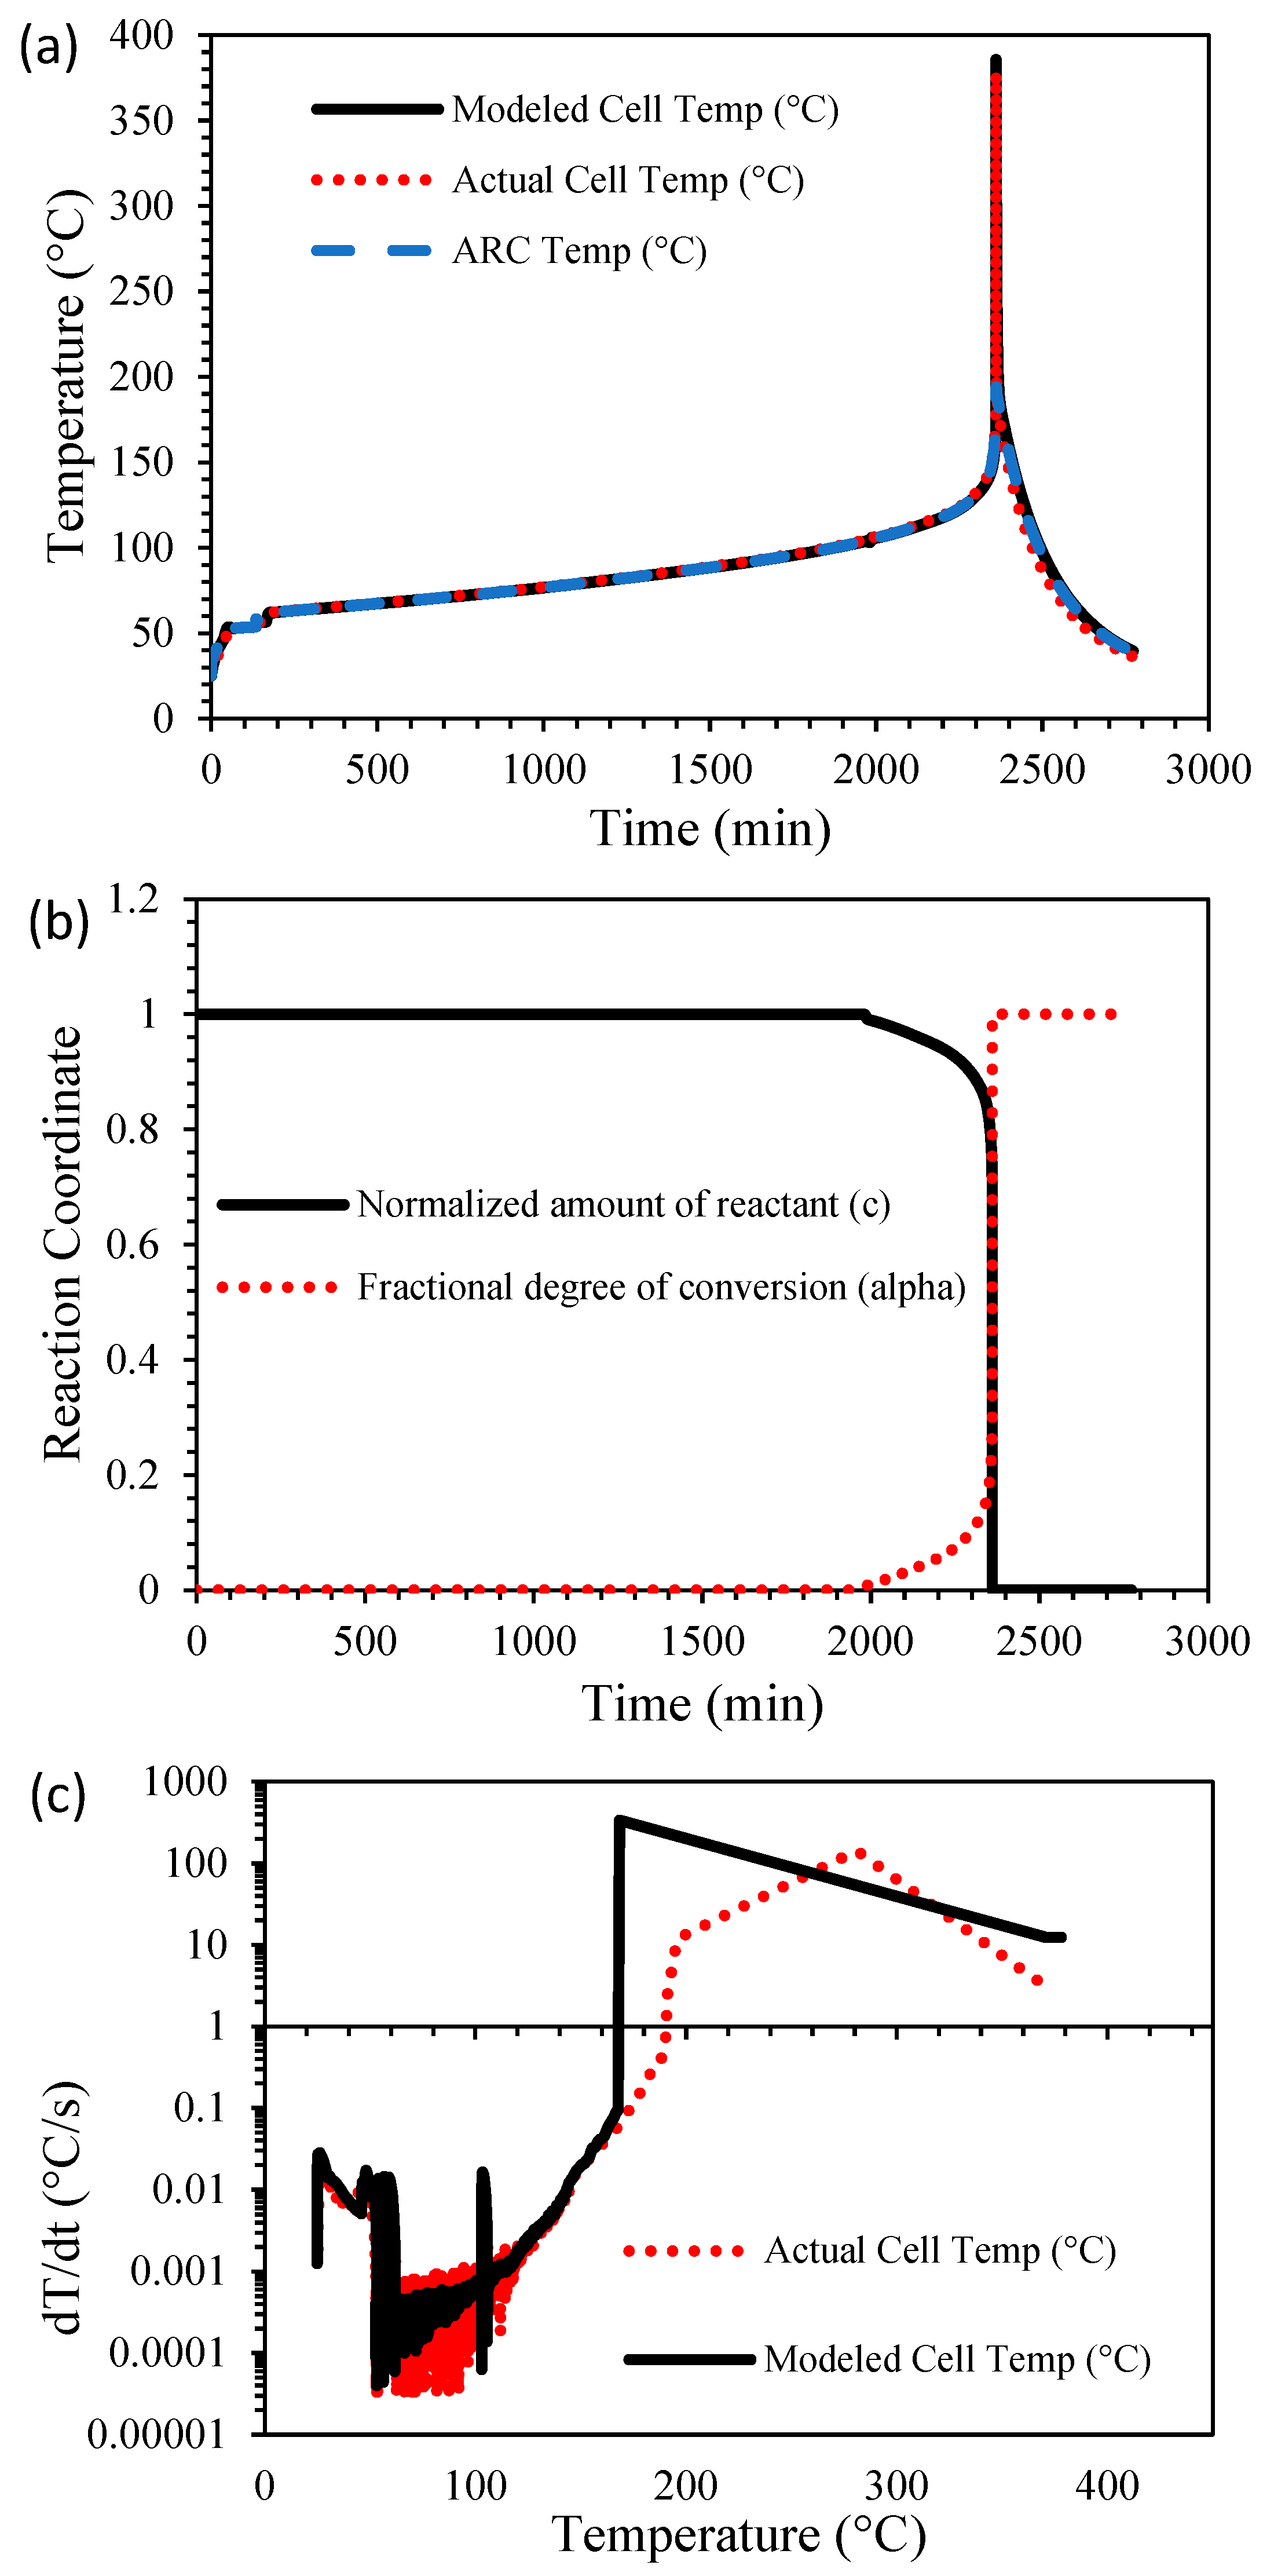
Using these parameters and Equations (1) and (4)–(8), the TR failure event was modeled and compared with empirical data for model effectiveness. The thermal model results are shown in Figure 5a–c. The model was shown to successfully predict maximum temperature and energy release within 1.98% relative error. It is important to note that as shown in Figure 5c, the first critical temperature was accurately predicted by the TR model; however, the second critical temperature was predicted to occur 27.4 °C earlier than the measured second critical temperature. This relative error was attributed to a lack of empirical data points collected between the second critical temperature and the maximum TR temperature. Introducing large variations in temperature in small time steps caused instabilities in the model. To improve the critical temperature predictions, the model should be trained on empirical data with an increased time step; however, the critical temperature prediction was not greater than the measured critical temperatures. This was important so as to not predict an unsafe maximum operating temperature.
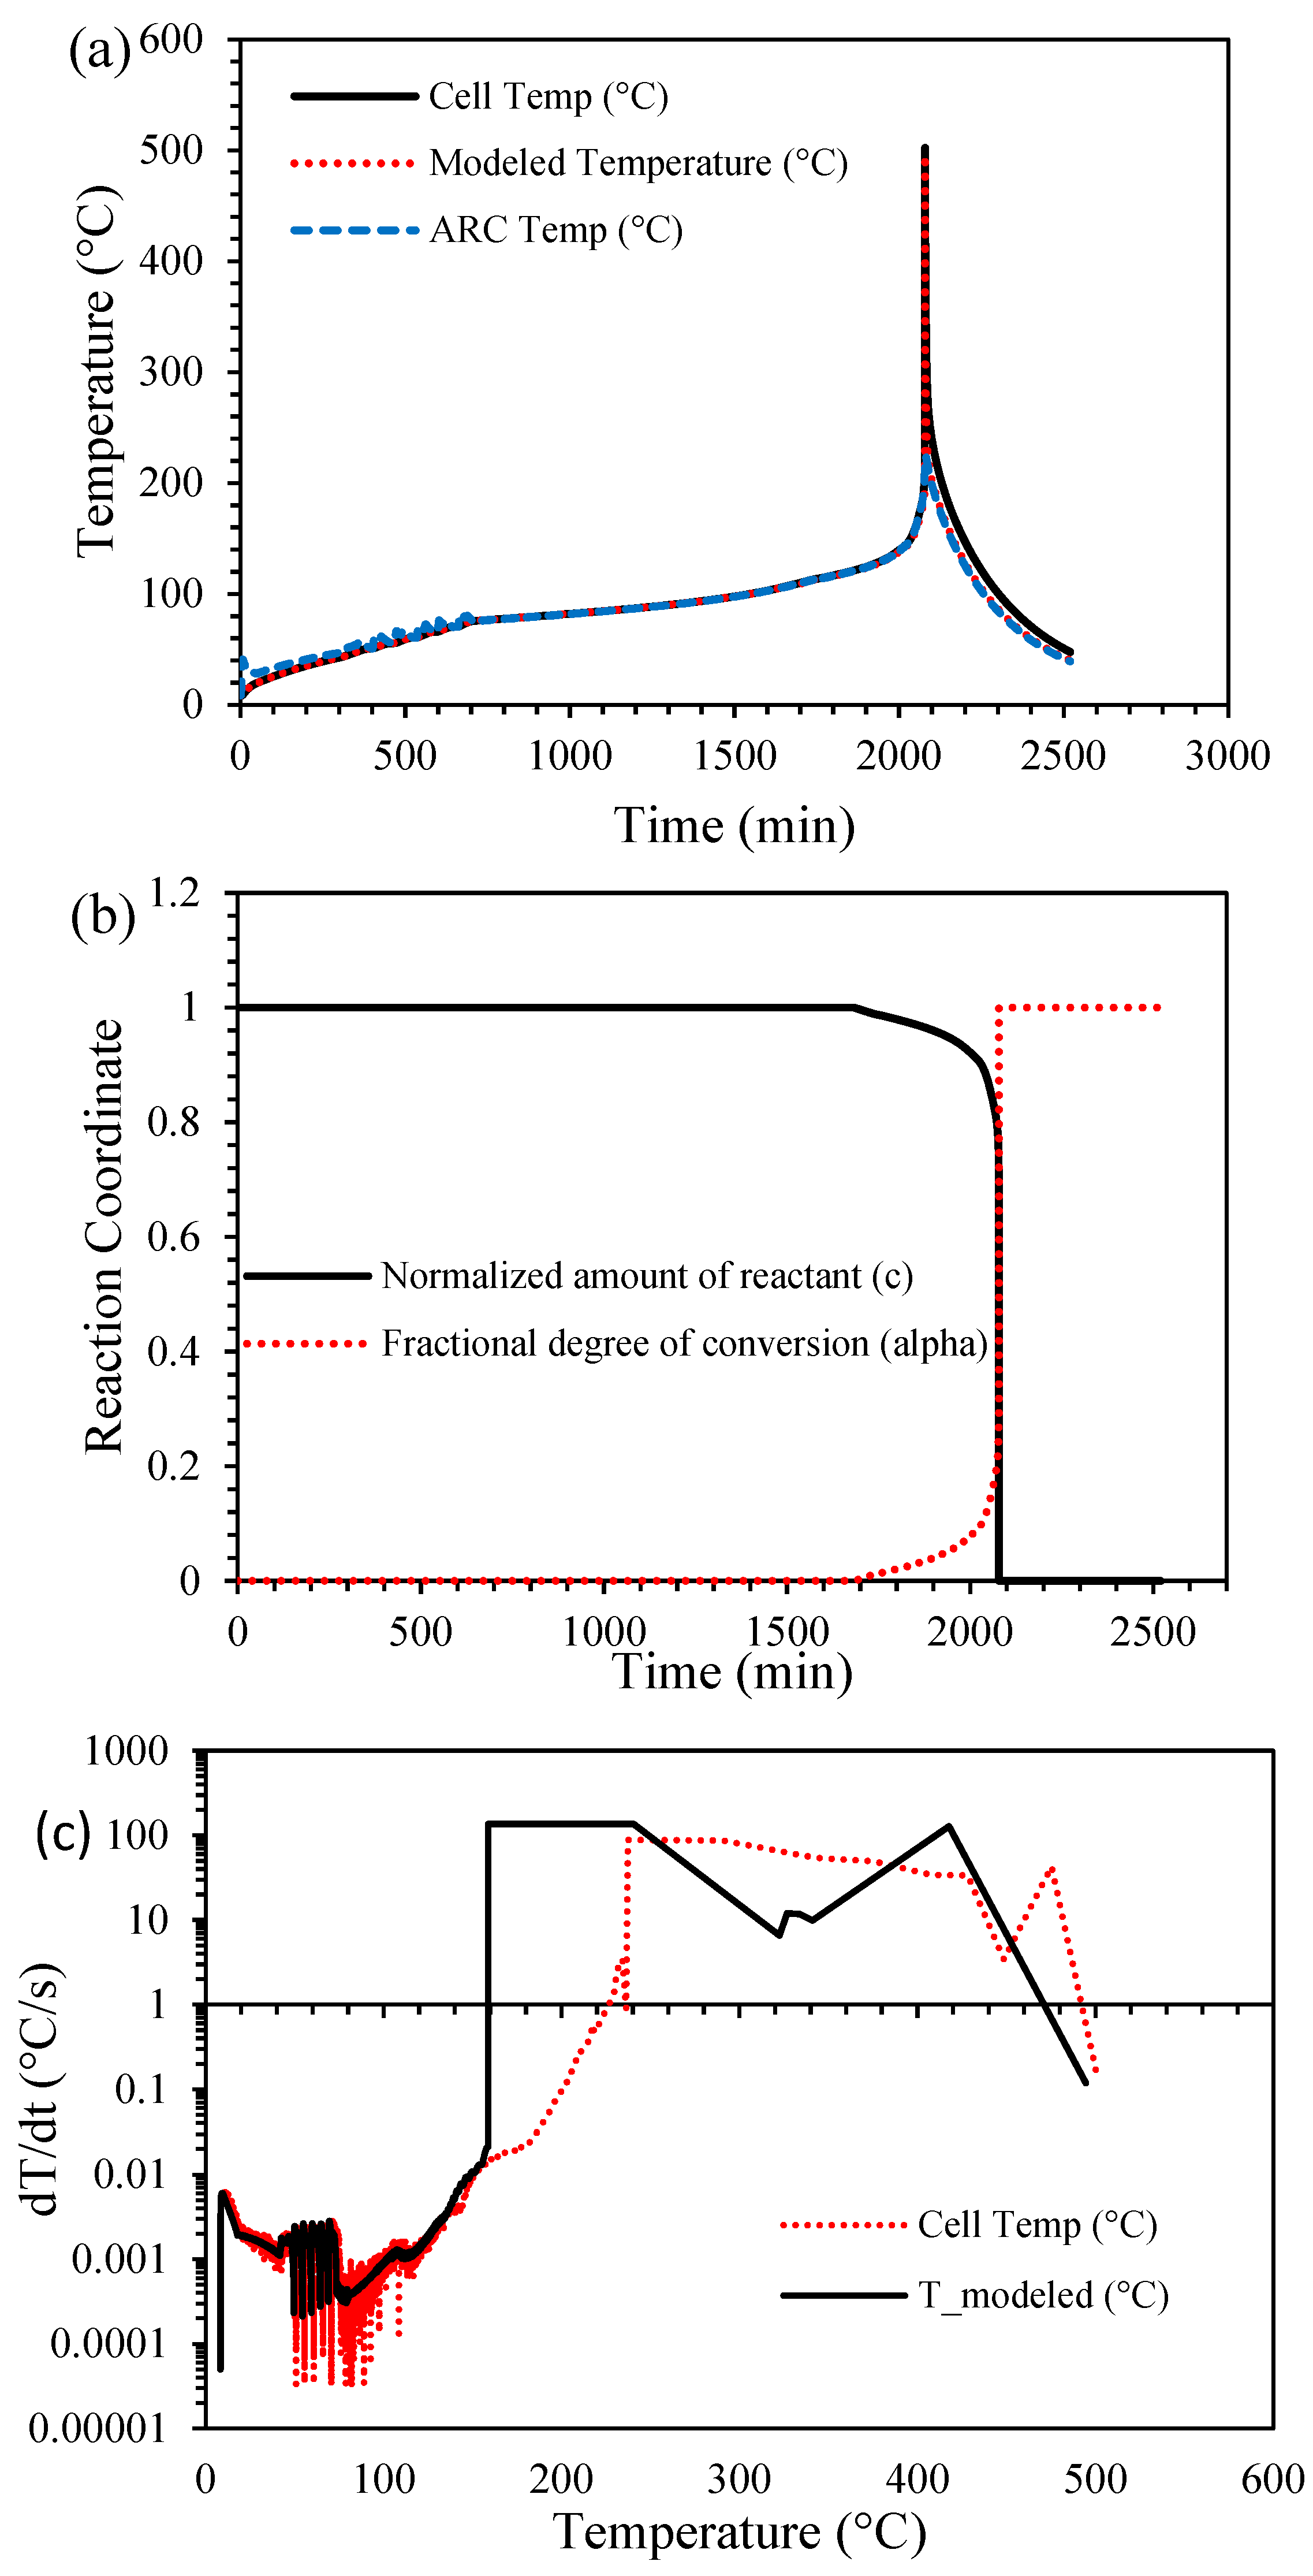
The TR failure cell-level testing was performed on a larger 20 Ah pouch-style cell in a similar manner to the testing performed for the Samsung 30Q 18650-style cells. The cell-level testing results are shown in Figure 6a–c. Again, it is important to note that the cell temperature in Figure 6a encompasses two distinct temperature measurements on the same cell during the TR failure event. The TR failure profile was similar to the Samsung 30Q 18650 style cell; however, the maximum temperature reached 502 °C with a first and second critical temperature of 108 °C and 236 °C, respectively. Using this empirical data, the aforementioned method for regressing and calculating the kinetic parameters for use in the electrochemical portion of the model was used for the 20 Ah pouch-style cell. The ln ( d T c e l l d t ) vs. 1 T c e l l plot is shown in Figure 3b and Figure 4b, along with the linear regression, equation, and coefficient of determination.
Using Figure 3b and Figure 4b and Equations (11)–(13), the stage II kinetic parameters for the electrochemical portion of the model were determined for the 20 Ah pouch-style cell and are presented in Table 2.
From these kinetic parameters and Equations (1) and (4)–(8), the TR failure event was modeled and compared with empirical data to establish model effectiveness. The thermal model results are shown in Figure 7a–c.
It is important to note the differences between the regressed pre-exponential factor and activation energy from the Samsung 30Q 18650 style cell and the 20 Ah pouch-style cell. As shown in Table 1 and Table 2, the apparent activation energy was fairly similar for both cells, with the pouch-style cell being 28.4 kJ/mol greater than the cylindrical-style cell; however, the regressed pre-exponential factor for the pouch-style cell was three orders of magnitude greater than for the cylindrical-style cell. Both of these increased parameters led to a greater reaction rate for the pouch-style cell compared to that of the cylindrical cell. There are a number of differences between the cell types that primarily lead to the increased reaction rates of cells. One of these differences, as stated previously, could be that the characteristic length of the pouch cell is smaller than the characteristic length of the Samsung 30Q 18650 cells. Since the pouch cell had greater capacity, a larger amount of electrode surface area was available for reacting with the electrolyte and the SEI and provided lower thermal resistance for heat transfer by conduction through the cell.
Similar to the prediction of the TR failure of the cylindrical cells, the model was shown to successfully predict maximum temperature and energy release within 1.34% relative error. As shown in Figure 7c, the first critical temperature was accurately predicted by the TR model; however, the second critical temperature was predicted to occur 77.5 °C earlier than the measured second critical temperature. The model was more unstable for the larger 20 Ah cell than the previous cylindrical cell, primarily because the total TR duration was much shorter than for the cylindrical cells, which led to fewer empirical data points being collected during the TR event and a larger change in temperature with a shortened time step, leading the model to encounter some instability. It is estimated that this error can be remedied by increasing the rate at which data are collected during the TR for which the model was trained. Unfortunately, the ARC was limited in the rate at which data were recorded, and modifications would need to be made to the ARC or an alternate method would need to be used to collect data at a faster rate during the TR event. Although there was a large discrepancy between the measured and predicted second critical temperatures, the predicted critical temperature was less than the measured temperature, which allowed the user to be certain that an unsafe critical temperature would not be predicted by the model and, instead, a much more conservative critical temperature would be predicted.
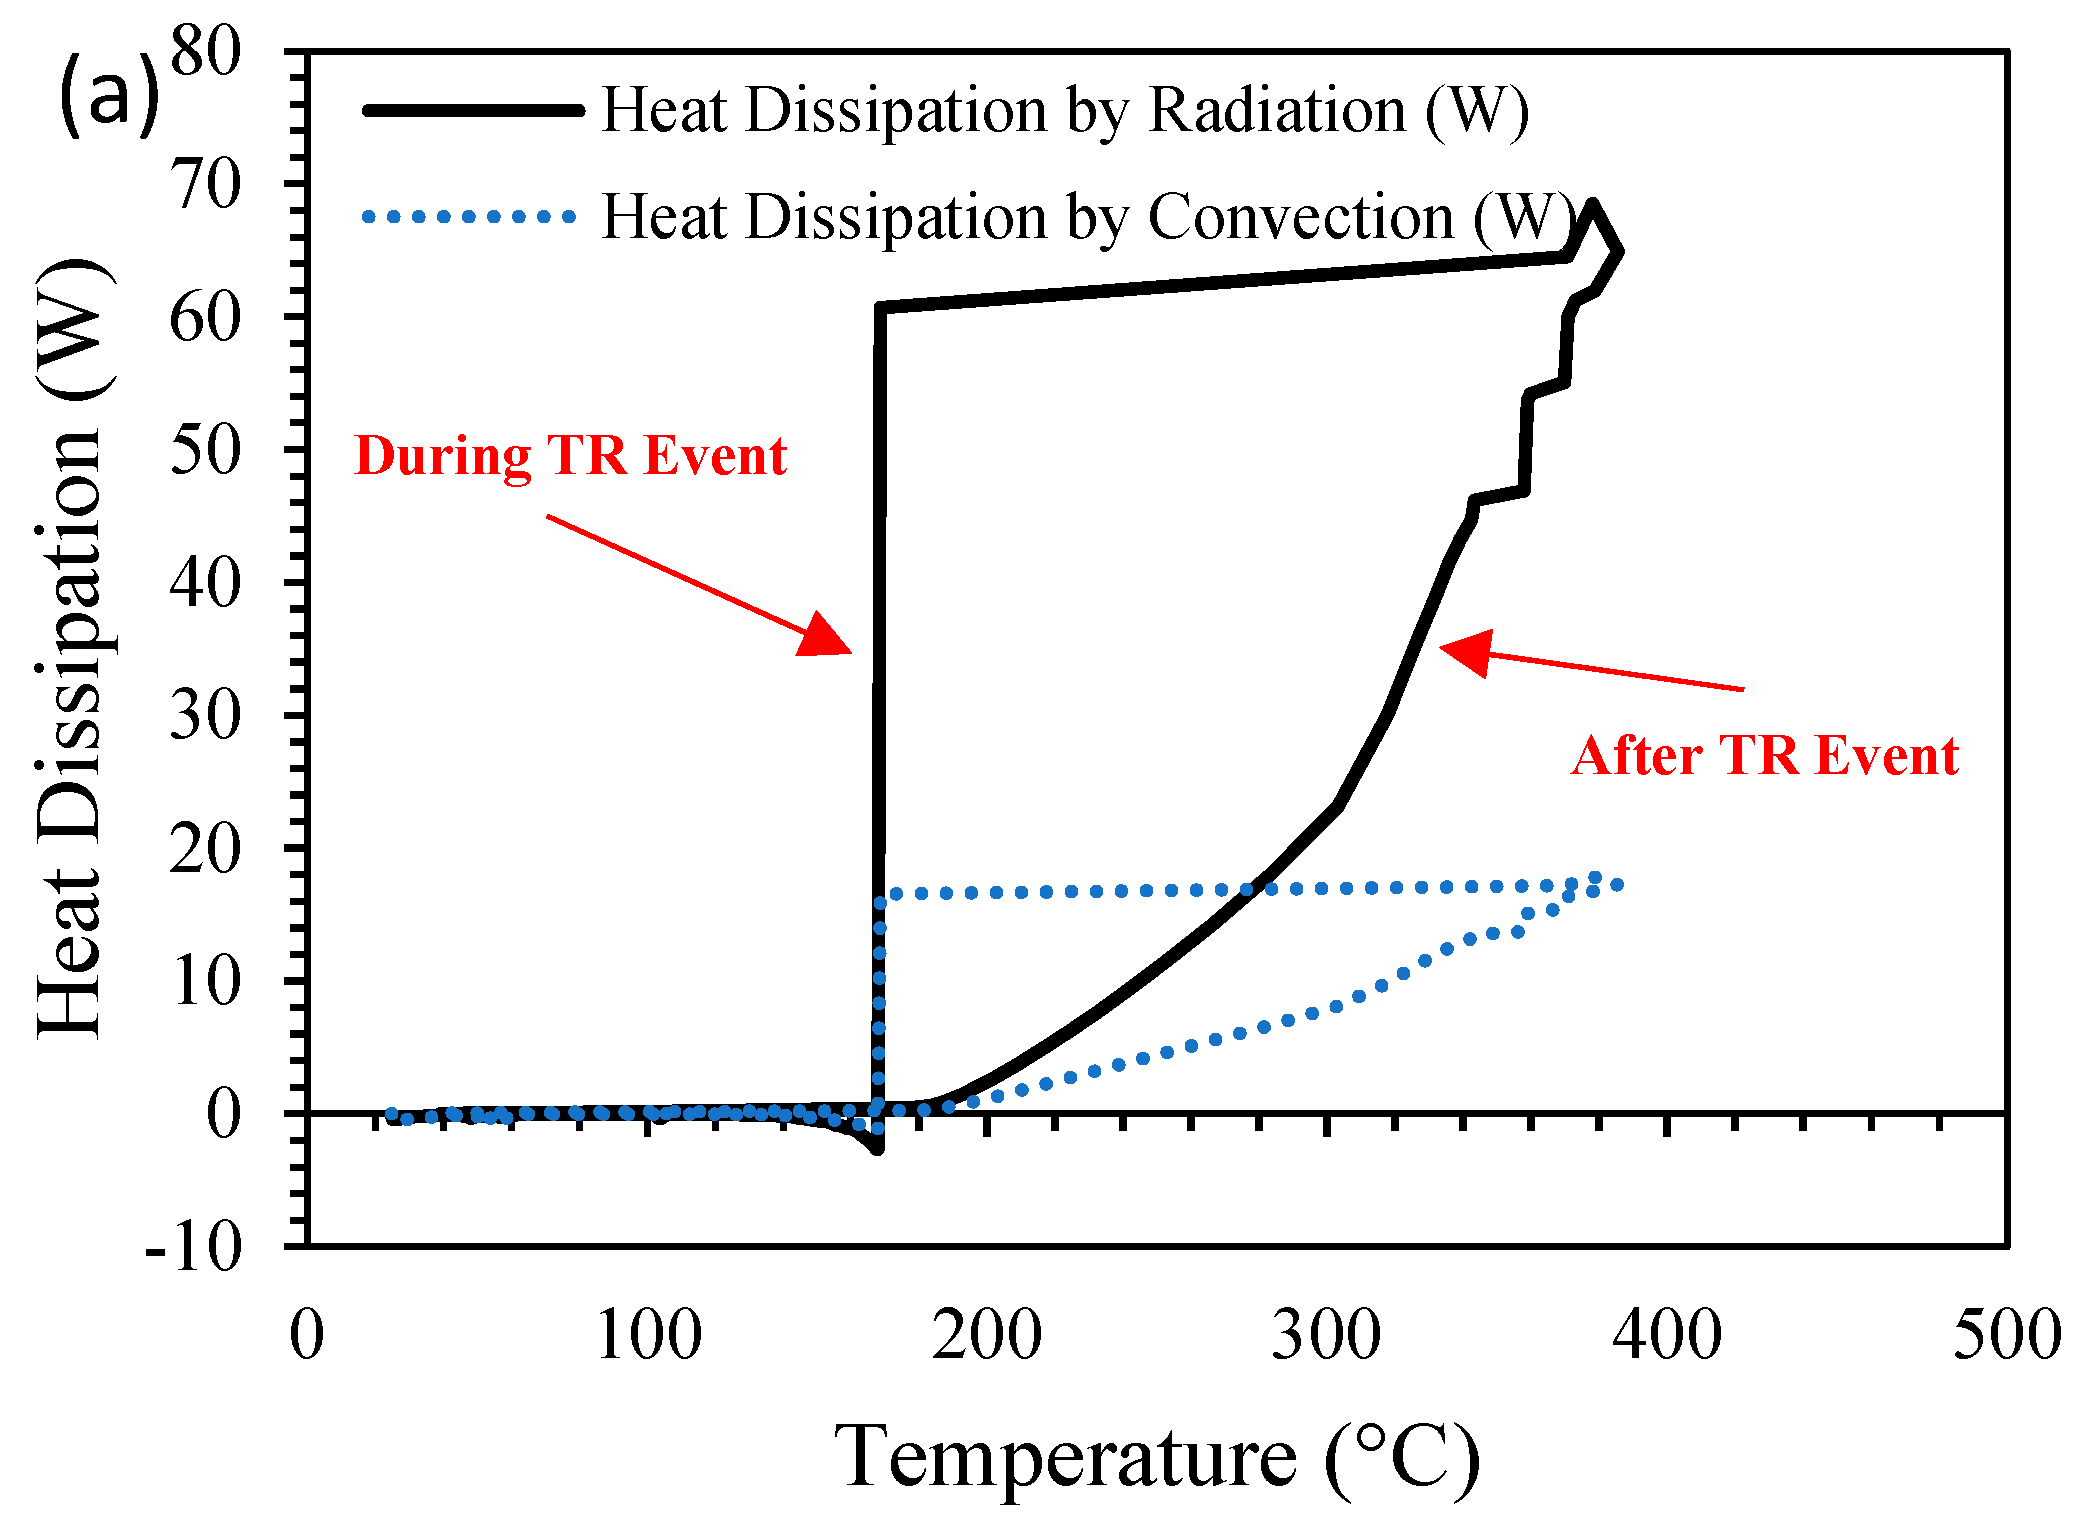
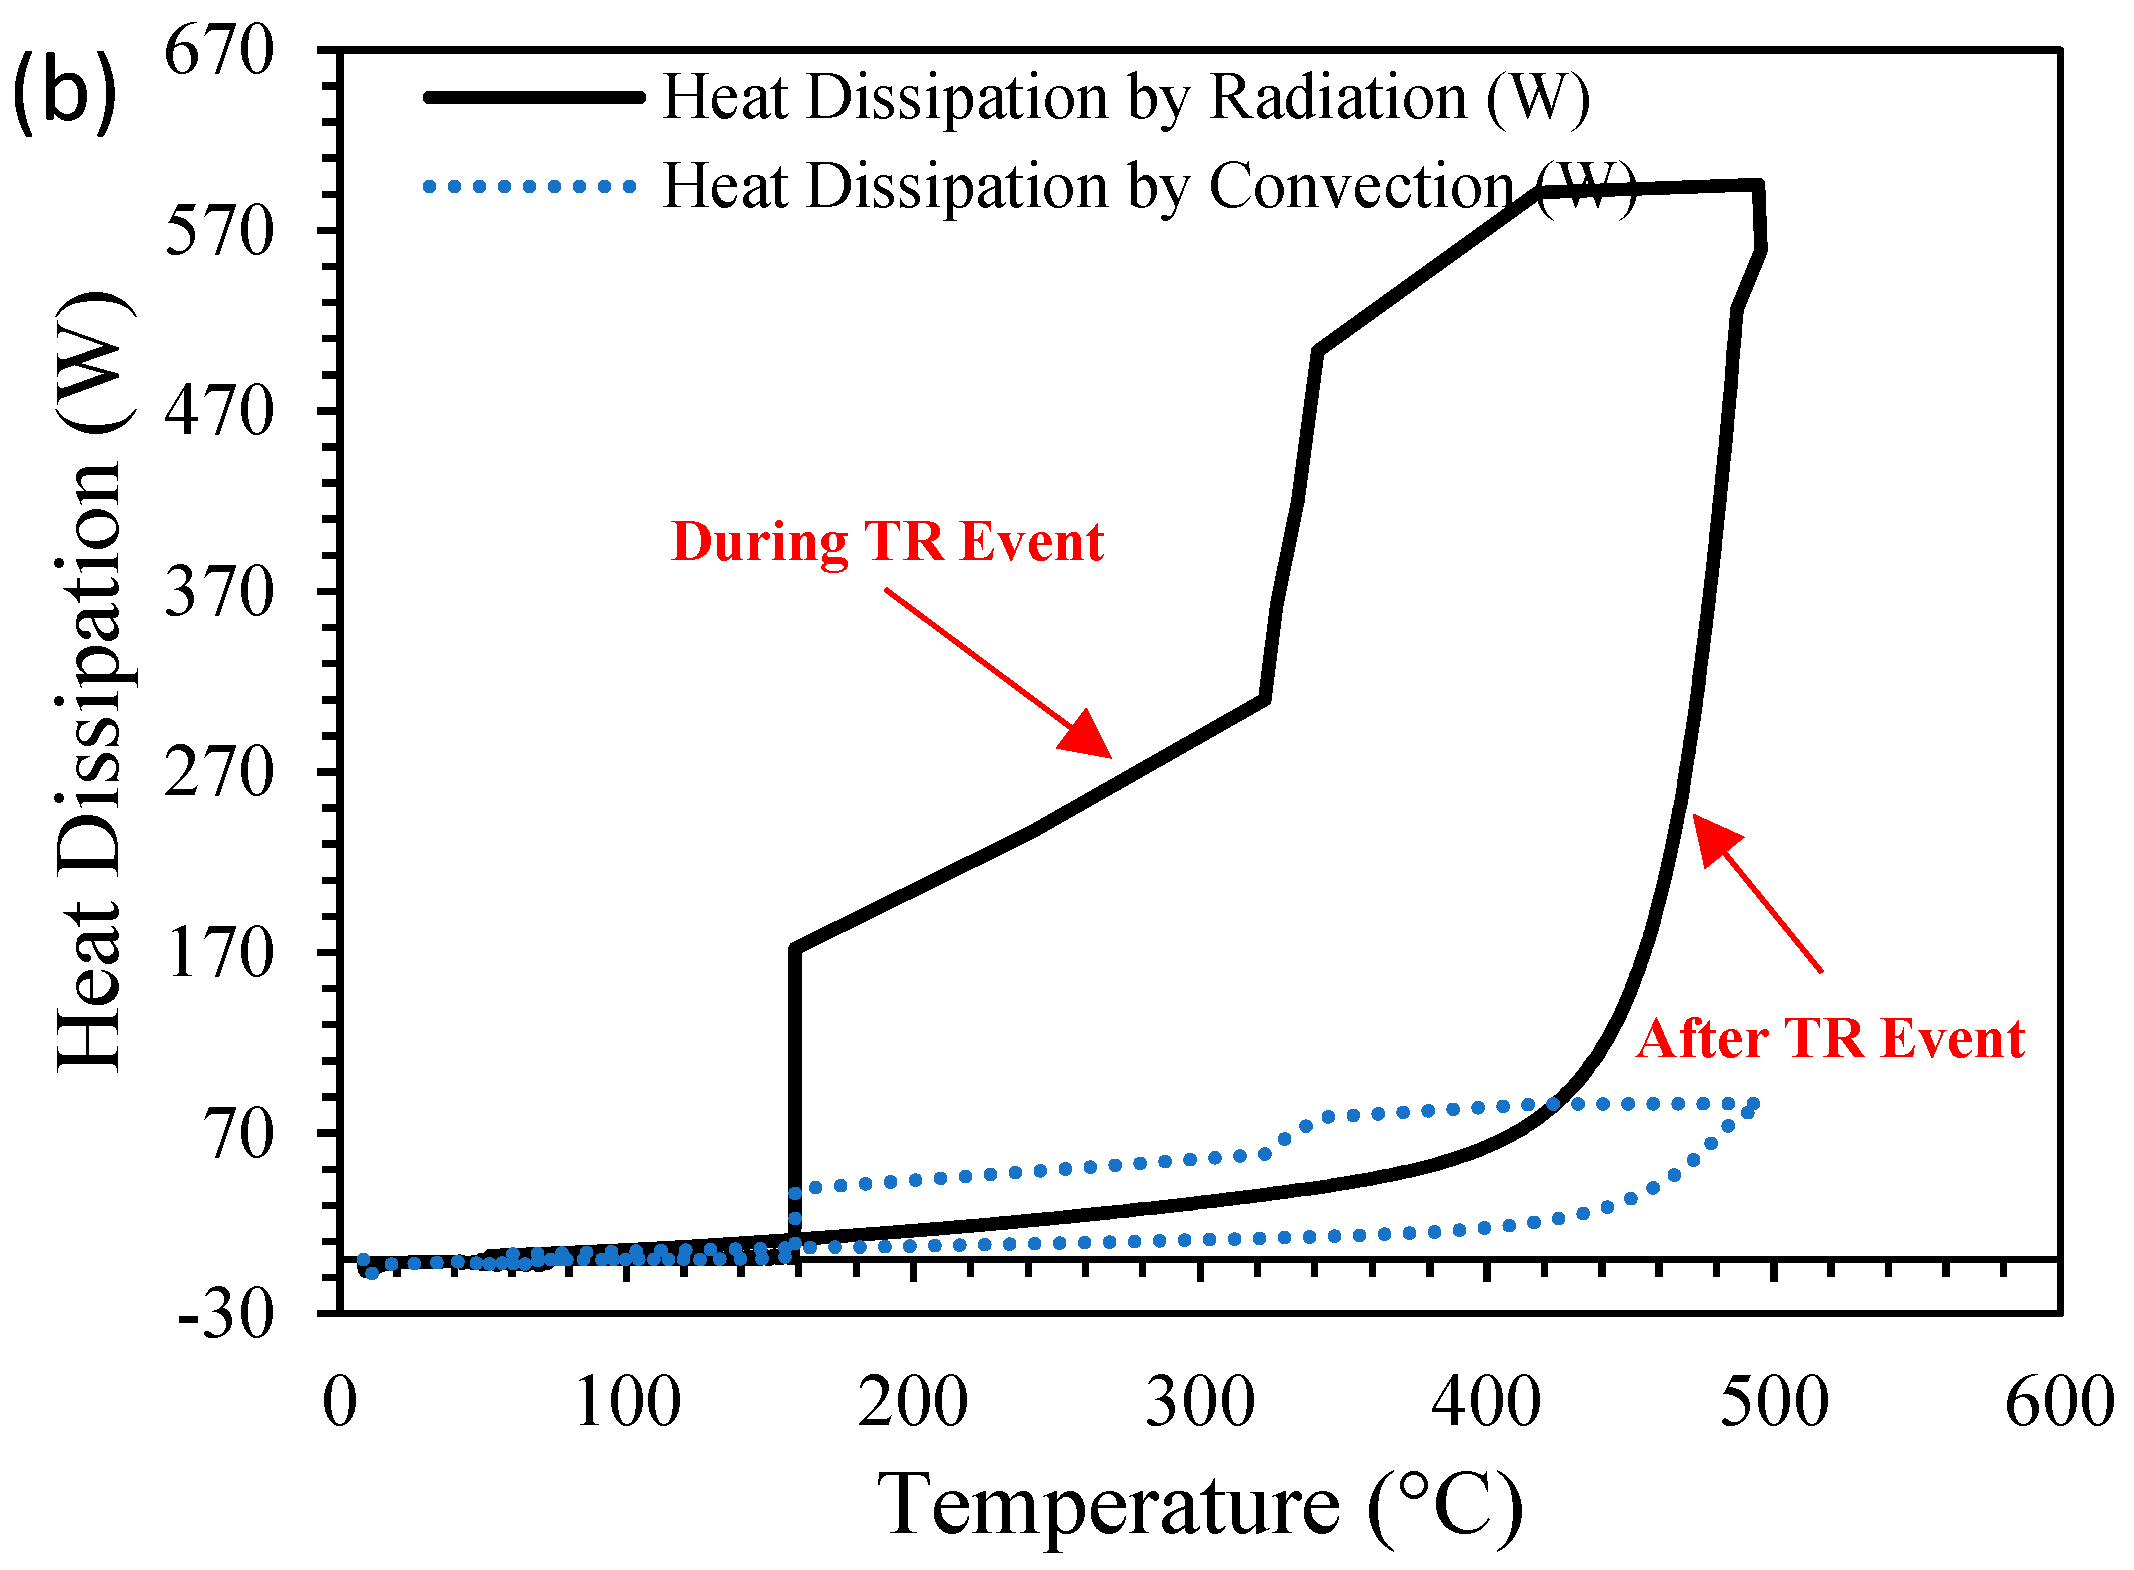
The modes of heat dissipation were also monitored during the TR failure event for both cell formats and the results are shown in Figure 8a,b. In both cases, the large majority of heat transfer before and after the TR event was due to radiation, and only a small portion of the heat dissipated was by convection. This metric will facilitate module and system design due to the large heat accumulation and TR propensity for propagation among cells within a module or system. 
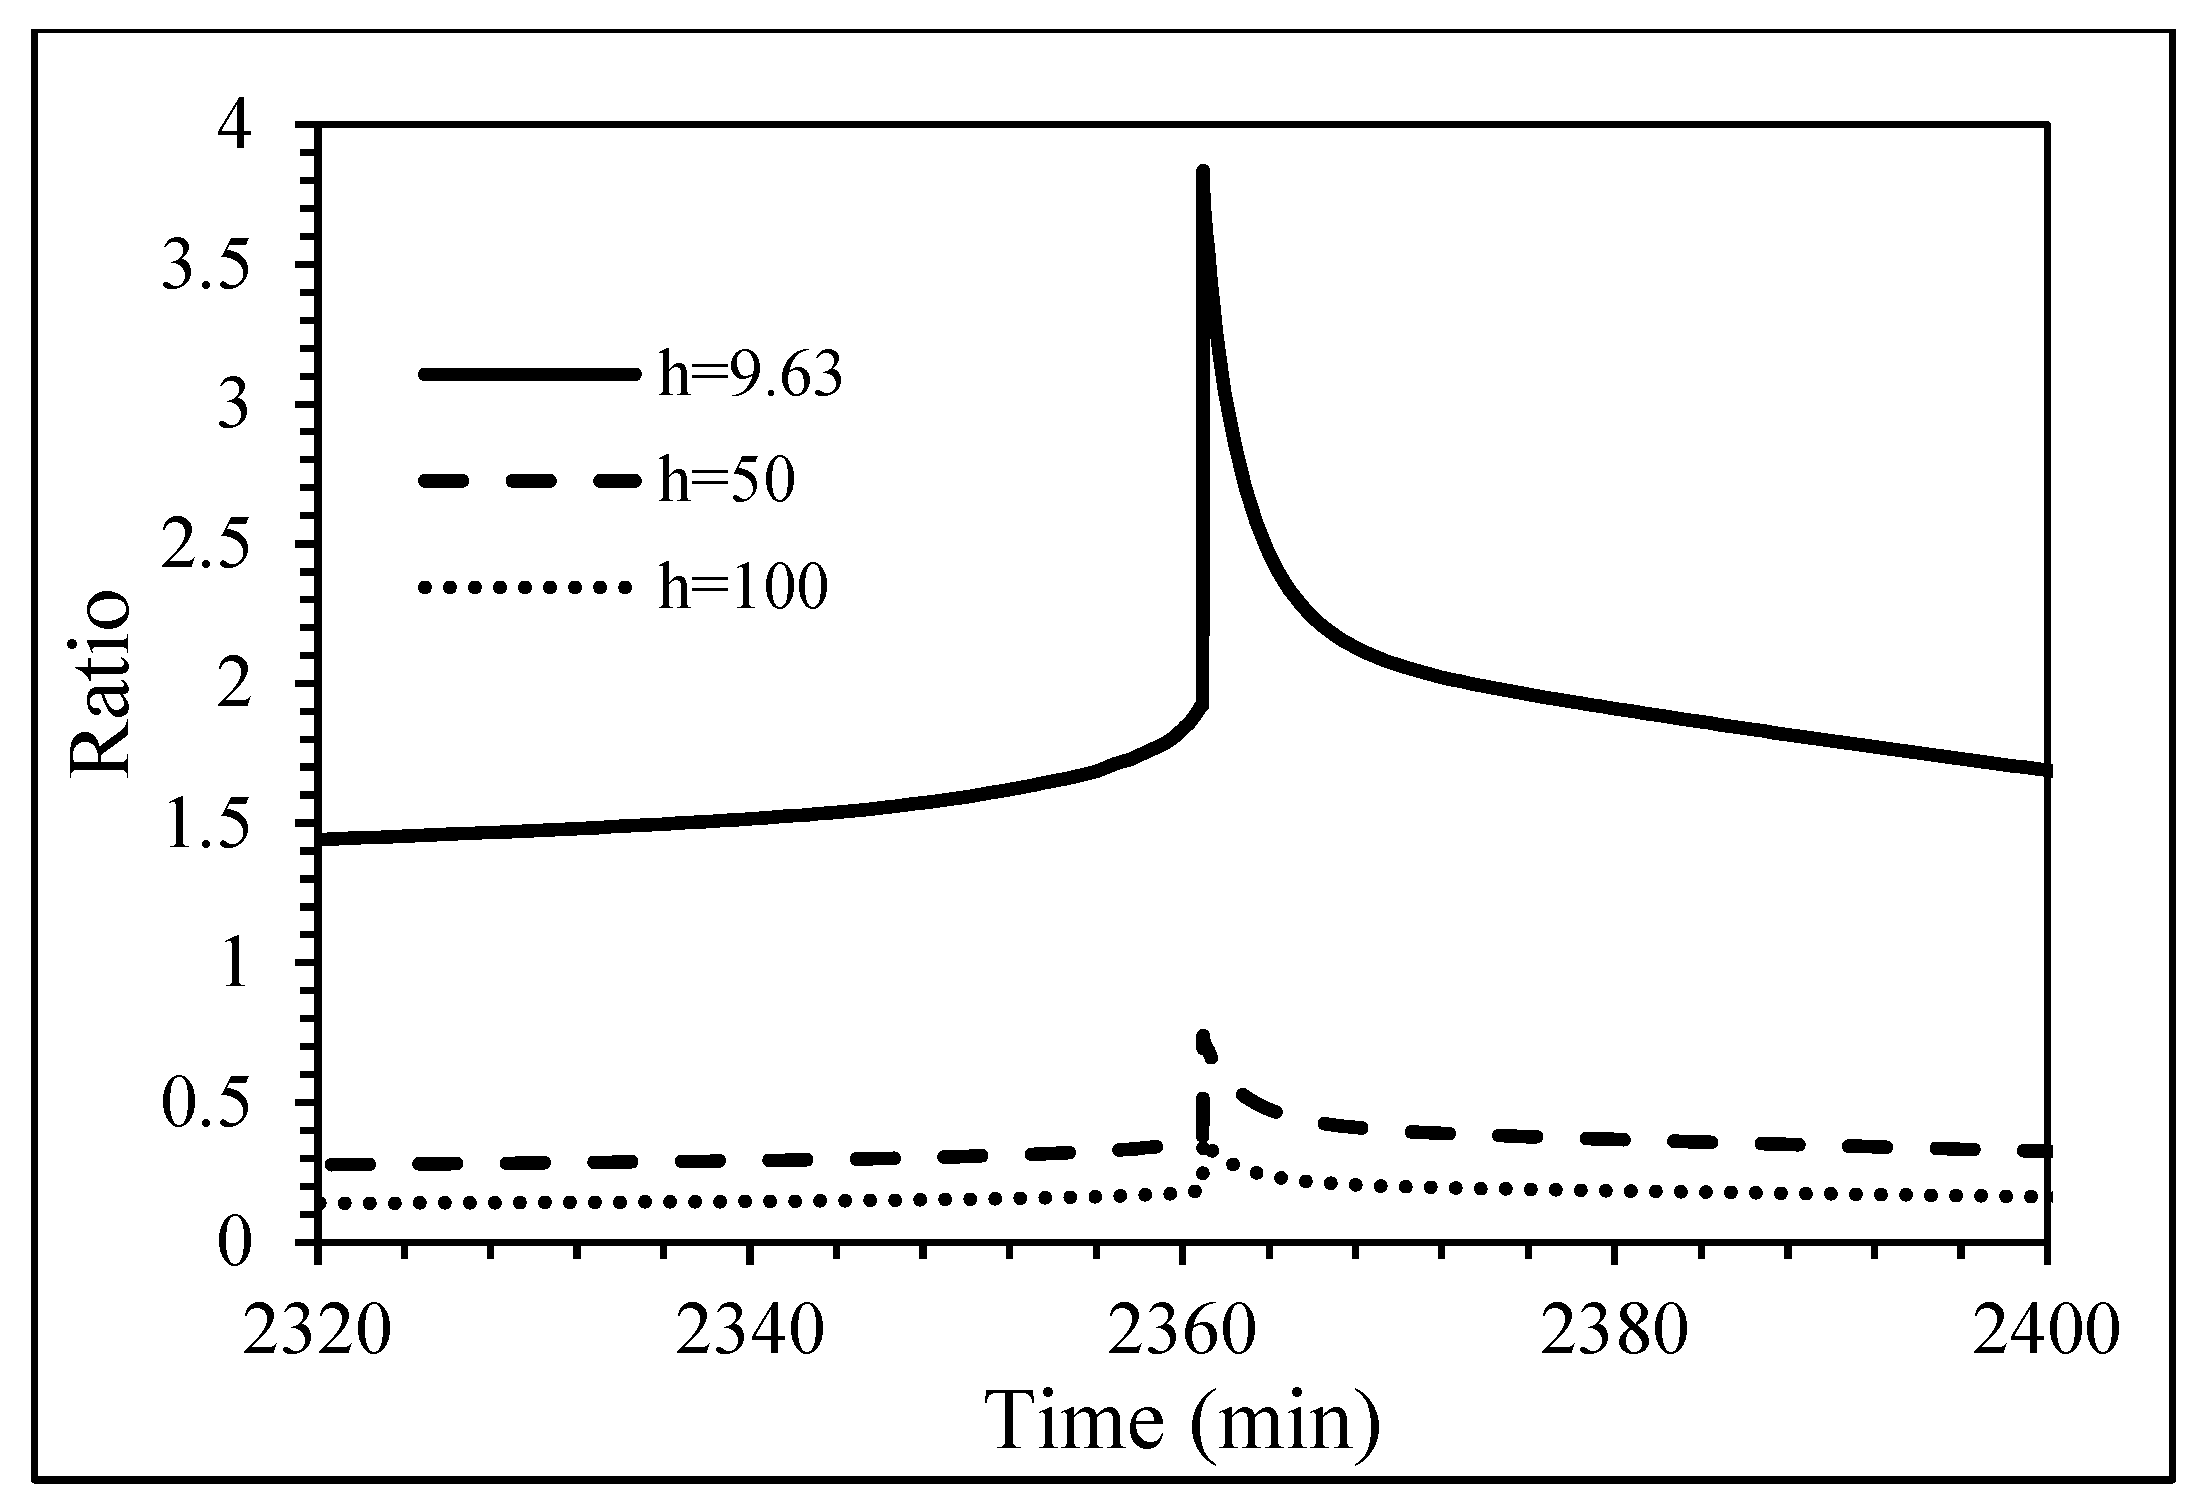
Figure 9 shows the ratio of radiation to convection heat transfer during a thermal runaway event as well as a function of the convection coefficient.
It was shown that at low convection coefficients, like those experienced in the ARC, the ratio of heat transfer during the TR event was larger than 1, indicating a greater amount of heat transfer by radiation than by convection. However, as the convection coefficient became larger, the ratio of heat transfer remained less than 1, indicating that the convective heat transfer was greater than the radiative heat transfer, even during the TR event. These figures show the need to increase the total amount of heat dissipation by methods of heat transfer other than radiation, such as convection by some sort of cooling system or by conduction through a heat sink or phase change material. The thermal model was performed using a convection coefficient of 50   W m 2 K to determine what effect the convective heat transfer had on the maximum temperature of the TR failure event. Despite a much higher convection coefficient, the predicted maximum temperature did not change from that recorded in the tests with natural convection. This phenomenon is likely due to the rapid duration of the TR failure event. Despite the ratio of radiation to convection being less than 1 with a higher convection coefficient, the duration at which heat was allowed to dissipate at extreme temperatures was very small. The total amount of energy removed from the cell by means of convection was still small compared to that in the rest of the test. This brings into question the feasibility of increasing the convection coefficient to improve heat transfer through a module for the purpose of preventing or mitigating TR propagation. Although forced cooling could improve the module’s performance during normal operation, during a failure event, the maximum temperature will not be significantly affected by increasing the convection coefficient. This may be due to the extreme temperatures and rapid TR duration of TR propagation mitigation strategies, such as optimizing the case material in the cell and module billet to increase the emissivity; thus, the radiative heat transfer during a failure event will prove more successful in preventing propagation among cells than increasing forced convection heat transfer.

4. Conclusions

The proposed thermal model was consistent in predicting accurate TR profiles of lithium-ion batteries of various formats, as long as the Biot number was less than 0.1 and, thus, the lumped thermal model requirement was satisfied. The Biot number assumption was also shown to be justified for convection coefficients much larger than those experienced in an ARC environment. The model predicted the maximum thermal runaway temperature with less than 2% relative error for both 18650 cylindrical cell formats and larger 20 Ah pouch cell formats. The predicted critical temperatures of both the cylindrical and pouch cell formats are conservative and are within safe operating margins. Modes of heat transfer during TR failure events were considered for both cylindrical and pouch cell formats. In both cases, the primary mode of heat transferred during the TR event was radiation, coupled with small contributions by convection. It was predicted that at larger convection coefficients (larger than 50   W m 2 K ), the convective heat transfer contribution would be greater than the radiative heat transfer contribution. Through the use of the thermal model, the maximum temperature of the TR event was determined to be a characteristic of the cell and not of the convection coefficient.

Author Contributions

Conceptualization, A.S.; methodology, A.S.; formal analysis, A.S.; investigation, A.S.; resources, A.S.; data curation, A.S.; writing—original draft preparation, A.S.; writing—review and editing, A.S., V.U. and J.B.; visualization, A.S.; supervision, V.U. and J.B.; project administration, J.B.; funding acquisition, V.U. and J.B. All authors have read and agreed to the published version of the manuscript.

Funding

This research was funded by Electric Power Systems Inc.

Data Availability Statement

The data presented in this study are available on request from the corresponding author. The data are not publicly available due to privacy constraints.

Acknowledgments

The authors would like to acknowledge Electric Power Systems Inc. for their assistance in funding this project, as well as the University of Idaho and Electric Power Systems Inc. for the testing, analysis, and review work performed during the duration of this study.

Conflicts of Interest

Author Jeffrey Belt is employed by the Electric Power Systems Inc. The remaining authors declare that the research was conducted in the absence of any commercial or financial relationships that could be construed as a potential conflict of interest. The funders had no role in the design of the study; in the collection, analyses, or interpretation of data; in the writing of the manuscript; or in the decision to publish the results.

Abbreviations

List of commonly used acronyms:
ARCAccelerated Rate Calorimeter
EV+Extended Volume Plus
FTRCFractional Thermal Runaway Calorimeter
SEISolid Electrolyte Interphase
SOCState of Charge
TRThermal Runaway

Appendix A

Derivation of Equation (10):
C p m c e l l d T c e l l d t = Q ˙ c e l l A c e l l ϵ σ ( T a m b i e n t 4 T c e l l 4 ) A c e l l h ( T a m b i e n t T c e l l )
Q ˙ I I = m I I H I I d α d t
d α d t = A I I exp ( E I I R g a s T ) ( 1 α ) n
During stage I I of the TR event, Q ˙ c e l l can be approximated as Q ˙ I I .
Q ˙ c e l l Q ˙ I I = m I I H I I d α d t
Therefore,
d T c e l l d t = Q ˙ I I A c e l l ϵ σ ( T a m b i e n t 4 T c e l l 4 ) A c e l l h ( T a m b i e n t T c e l l ) C p m c e l l
Over the course of stage I I , the energy balance can be approximated as near-adiabatic. Because of this near-adiabatic behavior, the enthalpy can be expressed as H I I = ϕ C p ( T m a x T 2 ) . Therefore, assuming that radiation and convection can be neglected, and approximating over the entirety of stage I I (i.e., from T 2 to T m a x ), the following equation can be obtained.
d T c e l l d t = ( ϕ m c e l l C p ( T m a x T 2 ) ( A I I exp ( E I I R g a s T c e l l ) ( 1 α ) n ) C p m c e l l )  
d T c e l l d t = ϕ A I I ( T m a x T 2 ) exp ( E I I R g a s T c e l l ) ( 1 α ) n

Appendix B

The method for the discrete calculation of Equations (5)–(8) presented in this work is shown below:
Q ˙ I , i = m I H I , i c i + 1 c i t i + 1 t i
c i + 1 = ( A I exp ( E I R g a s T i ) c i ) ( t i + 1 t i ) + c i
Q ˙ I I , i = m I I H I I , i α i + 1 α i t i + 1 t i
α i + 1 = ( A I I e x p ( E I I R g a s T i ) ) ( 1 α i ) n ( t i + 1 t i ) + α i
where i is an arbitrary variable that increments for each procedural calculation over the provided data conditions. For as long as the initial conditions of c i , α i , and t i are known, the heat generation can be calculated.

References

  1. Curry, C. Lithium-ion battery costs and market. Bloom. New Energy Financ. 2017, 5, 4–6. [Google Scholar]
  2. Belt, J.; Sorensen, A. Thermal and electrochemical analysis of thermal runaway propagation of Samsung cylindrical cells in lithium-ion battery modules. J. Electrochem. Soc. 2023, 170, 010515. [Google Scholar] [CrossRef]
  3. Feng, X.; Ouyang, M.; Liu, X.; Lu, L.; Xia, Y.; He, X. Thermal runaway mechanism of lithium ion battery for electric vehicles: A review. Energy Storage Mater. 2018, 10, 246–267. [Google Scholar] [CrossRef]
  4. Feng, X.; Zheng, S.; Ren, D.; He, X.; Wang, L.; Cui, H.; Liu, X.; Jin, C.; Zhang, F.; Xu, C.; et al. Investigating the thermal runaway mechanisms of lithium-ion batteries based on thermal analysis database. Appl. Energy 2019, 246, 53–64. [Google Scholar] [CrossRef]
  5. Liu, X.; Ren, D.; Hsu, H.; Feng, X.; Xu, G.-L.; Zhuang, M.; Gao, H.; Lu, L.; Han, X.; Chu, Z.; et al. Thermal runaway of lithium-ion batteries without internal short circuit. Joule 2018, 2, 2047–2064. [Google Scholar] [CrossRef]
  6. Zhao, C.; Sun, J.; Wang, Q. Thermal runaway hazards investigation on 18650 lithium-ion battery using extended volume accelerating rate calorimeter. J. Energy Storage 2020, 28, 101232. [Google Scholar] [CrossRef]
  7. Chen, H.; Buston, J.E.H.; Gill, J.; Howard, D.; Williams, R.C.E.; Read, E.; Abaza, A.; Cooper, B.; Wen, J.X. A simplified mathematical model for heating-induced thermal runaway of lithium-ion batteries. J. Electrochem. Soc. 2020, 168, 010502. [Google Scholar] [CrossRef]
  8. Liu, T.; Liu, Y.; Wang, X.; Kong, X.; Li, G. Cooling control of thermally induced thermal runaway in 18,650 lithium-ion battery with water mist. J. Energy Convers. Manag. 2019, 199, 111969. [Google Scholar] [CrossRef]
  9. Hou, J.; Lu, L.; Wang, L.; Ohma, A.; Ren, D.; Feng, X.; Li, Y.; Li, Y.; Ootani, I.; Han, X.; et al. Thermal runaway of lithium-ion batteries employing LiN(SO2F)2-based concentrated electrolytes. J. Nat. Commun. 2020, 11, 5100. [Google Scholar] [CrossRef] [PubMed]
  10. Coman, P.T.; Darcy, E.C.; Veje, C.T.; White, R.E. Numerical analysis of heat propagation in a battery pack using a novel technology for triggering thermal runaway. Appl. Energy 2017, 203, 189–200. [Google Scholar] [CrossRef]
  11. Duh, Y.-S.; Tsai, M.-T.; Kao, C.-S. Characterization on the thermal runaway of commercial 18650 lithium-ion batteries used in electric vehicle. J. Therm. Anal. Calorim. 2016, 127, 983–993. [Google Scholar] [CrossRef]
  12. Tran, M.-K.; Mevawalla, A.; Aziz, A.; Panchal, S.; Xie, Y.; Fowler, M. A review of lithium-ion thermal runaway modeling and diagnosis approaches. Processes 2022, 10, 1192. [Google Scholar] [CrossRef]
  13. Yeardley, A.S.; Bugryniec, P.J.; Milton, R.A.; Brown, S.F. A study of the thermal runaway of lithium-ion batteries: A Gaussian Process based global sensitivity analysis. J. Power Sources 2020, 456, 228001. [Google Scholar] [CrossRef]
  14. Kupper, C.; Spitznagel, S.; Döring, H.; Danzer, M.A.; Gutierrez, C.; Kvasha, A.; Bessler, W.G. Combined modeling and experimental study of the high-temperature behavior of a lithium-ion cell: Differential scanning calorimetry, accelerating rate calorimetry and external short circuit. Electrochim. Acta 2019, 306, 209–219. [Google Scholar] [CrossRef]
  15. Wang, G.; Kong, D.; Ping, P.; He, X.; Lv, H.; Zhao, H.; Hong, W. Modeling venting behavior of lithium-ion batteries during thermal runaway propagation by coupling CFD and thermal resistance network. Appl. Energy 2023, 334, 120660. [Google Scholar] [CrossRef]
  16. Feng, X.; Zheng, S.; He, X.; Wang, L.; Wang, Y.; Ren, D.; Ouyang, M. Time sequence map for interpreting the thermal runaway mechanism of lithium-ion batteries with LiNixCoyMnzO2 cathode. Front. Energy Res. 2018, 6, 126. [Google Scholar] [CrossRef]
Figure 1. Determination of temperature rate (TR) critical temperatures [6].
Batteries 10 00116 g001
Figure 2. (a) Samsung 30Q 18650 cell TR profile. (b) Samsung 30Q 18650 cell critical temperatures zoomed. (c) Samsung 30Q 18650 cell critical temperature log scale.
Batteries 10 00116 g002aBatteries 10 00116 g002b
Figure 3. (a) Stage I graphical determination of kinetic parameters for Samsung 30Q 18650 cells. (b) Stage I graphical determination of kinetic parameters for the 20 Ah pouch cell.
Batteries 10 00116 g003
Figure 4. (a) Stage II graphical determination of kinetic parameters for Samsung 30Q 18650 cells. (b) Stage II graphical determination of kinetic parameters for the 20 Ah pouch cell.
Batteries 10 00116 g004
Figure 5. (a) Samsung 30Q empirical data and model performance vs. test time. (b) Samsung 30Q cells’ predicted reaction progression during the TR event. (c) Samsung 30Q cells’ differential TR model prediction.
Batteries 10 00116 g005
Figure 6. (a) 20 Ah pouch cell TR profile. (b) 20 Ah pouch cell critical temperature determination, zoomed. (c) 20 Ah pouch cell critical temperature log scale.
Batteries 10 00116 g006
Figure 7. (a) 20 Ah pouch cell empirical data and model performance vs. test time. (b) 20 Ah pouch cell modeled reaction progression. (c) 20 Ah pouch cell differential TR model prediction.
Batteries 10 00116 g007
Figure 8. (a) Samsung 30Q 18650 heat dissipation during the TR event. (b) 20 Ah pouch cell heat dissipation during the TR event.
Batteries 10 00116 g008aBatteries 10 00116 g008b
Figure 9. Ratio of radiation to convection heat transfer during a 18650 TR event.
Batteries 10 00116 g009
Table 1. Samsung 30Q kinetic parameters for electrochemical heat generation.
A i   ( s 1 ) E i   ( J / m o l )
Stage I 7.003 × 10111.304 × 105
Stage I I 1.012 × 10121.317 × 105
Table 2. The 20 Ah pouch cell kinetic parameters for electrochemical heat generation.
A i   ( s 1 ) E i   ( J / m o l )
Stage I 1.159 × 10151.592 × 105
Stage I I 1.380 × 10141.601 × 105
Disclaimer/Publisher’s Note: The statements, opinions and data contained in all publications are solely those of the individual author(s) and contributor(s) and not of MDPI and/or the editor(s). MDPI and/or the editor(s) disclaim responsibility for any injury to people or property resulting from any ideas, methods, instructions or products referred to in the content.

