Article

Green Magnetic Nanoparticles CoFe2O4@Nb5O2 Applied in Paracetamol Removal

1
Department of Production Engineering, Federal University of Technology-Paraná, Paraná-Rua Doutor Washington Subtil Chueire St., 330, Ponta Grossa 84017-220, PR, Brazil
2
Department of Chemical Engineering, Federal University of Technology-Paraná, Paraná-Rua Doutor Washington Subtil Chueire St., 330, Ponta Grossa 84017-222, PR, Brazil
3
Department of Chemical Engineering, State University of Maringá, Colombo Ave. 5790, Maringá 87020-900, PR, Brazil
4
Department of Chemical and Environmental Technology, Rey Juan Carlos University, C. Tulipán, s/n, 28933 Móstoles, Spain
5
Centro de Investigação de Montanha (CIMO), Instituto Politécnico de Bragança, Campus de Santa Apolónia, 5300-253 Bragança, Portugal
*
Author to whom correspondence should be addressed.
Magnetochemistry 2023, 9(8), 200; https://doi.org/10.3390/magnetochemistry9080200
Submission received: 27 June 2023 / Revised: 28 July 2023 / Accepted: 3 August 2023 / Published: 5 August 2023

Abstract

:
This study describes the synthesis of an innovative nanomaterial (patent application number BR 1020210000317) composed of cobalt ferrite functionalized in niobium pentoxide CoFe2O4@Nb5O2 (CFNb), synthesized via green synthesis using tangerine peel extract. The material emphasizes the combination of a magnetic material (which allows for easy recovery after application) with niobium pentoxide (a metal which is abundant in Brazil). CFNb was applied as a catalyst for the paracetamol (PCT) degradation by photocatalysis. The new materials were characterized through surface and pore analysis (SBET, SEXT, Smic, Vmic, and VTOTAL), photoacoustic spectroscopy (PAS), zero charge point (pHPZC, scanning electron microscopy (SEM/EDS), and X-ray diffraction (XRD). The reaction parameters studied included pH and catalyst concentration. The results indicated that the CFNb nanocatalysts were efficient in the paracetamol degradation, presenting better results in conditions of low pH (close to 2) and low catalyst concentration under irradiation of the 250 W mercury vapor lamp (greater than 28 mW·cm−2) at 60 min of reaction.

1. Introduction

Catalysis is essential in several industries, allowing process optimization and reducing environmental impact [1]. By using catalysts, it is possible to minimize the consumption of energy and raw materials and promote the conversion of harmful substances into more environmentally friendly products. There are two main types of catalytic process: homogeneous, in which the catalyst is in the same phase as the reactants and heterogeneous, in which the catalyst is usually solid in a different phase than the reactants. Most chemical processes make use of heterogeneous catalysis [2,3,4].
In Brazil, research on catalysts began in the 1970s [5], and since then, it has proved very useful in producing heterogeneous catalysts. With the advancement of nanoscience, the synthesis of selective and efficient nanocatalysts has been possible, allowing their recovery after reactions and reuse. Nanocatalysts are nanomaterials with catalytic properties, with dimensions in the order of nanometers (10−9 m). Among them, magnetic nanocatalysts stand out, with advantages such as ease of recovery at the end of the process and the high catalytic efficiency of the metals that compose them [6,7].
Several methods are used to synthesize magnetic nanomaterials, the main ones are microemulsion, thermal decomposition, solvothermal, sonochemical, microwave, chemical vapor deposition, carbon arc, laser pyrolysis synthesis, coprecipitation, solution combustion synthesis, and reduction using plant extracts [8,9].
This study combined two synthesis methods to produce nanocatalysts: synthesis by combustion in solution and reduction using plant extracts. The method employed can be categorized as green synthesis, as it adheres to the principles of green chemistry, specifically principles 1, 3, 5, and 7. These principles include the prevention of waste, the design of less dangerous chemical syntheses, the use of solvents and safer reaction conditions, and the use of renewable raw materials, respectively [10,11,12].
Different plant species are already used to obtain extracts (from leaves, flowers, or seeds) for synthesizing magnetic nanoparticles. The size and shape of the nanoparticles obtained will depend on the characteristic of the extract, the location of the plant from which it was extracted (i.e., leaves, fruits, or seeds), the reaction temperature, agitation rate, pH, and biological composition of the plant (such as flavonoids, terpenoids, amino acids, proteins, or sugars), among other factors [13]. Tangerine (mandarin), whose specific classification is Citrus reticulata (C. reticulata), is one of the most important citrus genera [14]. It is a widely consumed fruit with high vitamin C, B complex, flavonoids, carotenoids, and ascorbic acid [15].
Cobalt ferrite (CoFe2O4) is one of the most relevant ferrites due to its peculiar properties, such as high physical and chemical stability [16,17,18]. This material finds application in magnetosensitive systems [19,20], removal of pollutants from water [21,22,23,24], drug delivery [25,26], and acid mine drainage treatment [27].
Niobium is an abundant transition metal in Brazil, with about 98% of the world’s known reserves located mainly in Amazonas, Goiás, and Minas Gerais. Its discovery in Brazilian territory occurred in the 1960s when not all the possible applications of this metal were yet known. It is widely used in metal alloys to provide strength and malleability, as well as in high-tech sectors such as rocket engines, producing superconducting wires, and other industrial applications confer high technological value to niobium. Niobium pentoxide (Nb2O5) and its combinations with other compounds have been studied as photocatalysts. Researchers report the efficiency of the photocatalytic activity of niobium oxide in the degradation of dyes in textile industries [28] and of herbicides such as methylviologen [29], as well as in the reduction of atmospheric pollution [30] and emerging pollutants [31,32].
Emerging pollutants (EPs) are micropollutants considered persistent and refractory, which are currently not included in routine monitoring programs and which may be candidates for future regulation [33,34,35]. Examples of EPs include surfactants, drugs, personal hygiene products, gasoline, and plasticizers [33,34,36]. The concepts of EPs and contaminants of emerging concern (CECs) intersect concerning pollutants that are being identified in low concentrations in wastewater, which may require specific treatment for their removal, with conventional treatments being inefficient [33,37].
Paracetamol (or acetaminophen) is widely used worldwide as a drug without prescription. The main concern about increasing the consumption of this drug is that after ingested, about 90% of a therapeutic dose is excreted in the urine after 24 h. However, the increase in consumption raises the concern of accumulation of this drug in the food chain since it is not easily degraded by the usual treatment methods at wastewater treatment plants (WWTPs) [33].
This work aims to present a new green synthesis methodology to produce magnetic nanomaterials using tangerine peel extract. In addition, it shows the efficiency of cobalt ferrite functionalized in niobium pentoxide in the paracetamol degradation via the heterogeneous photocatalytic process.

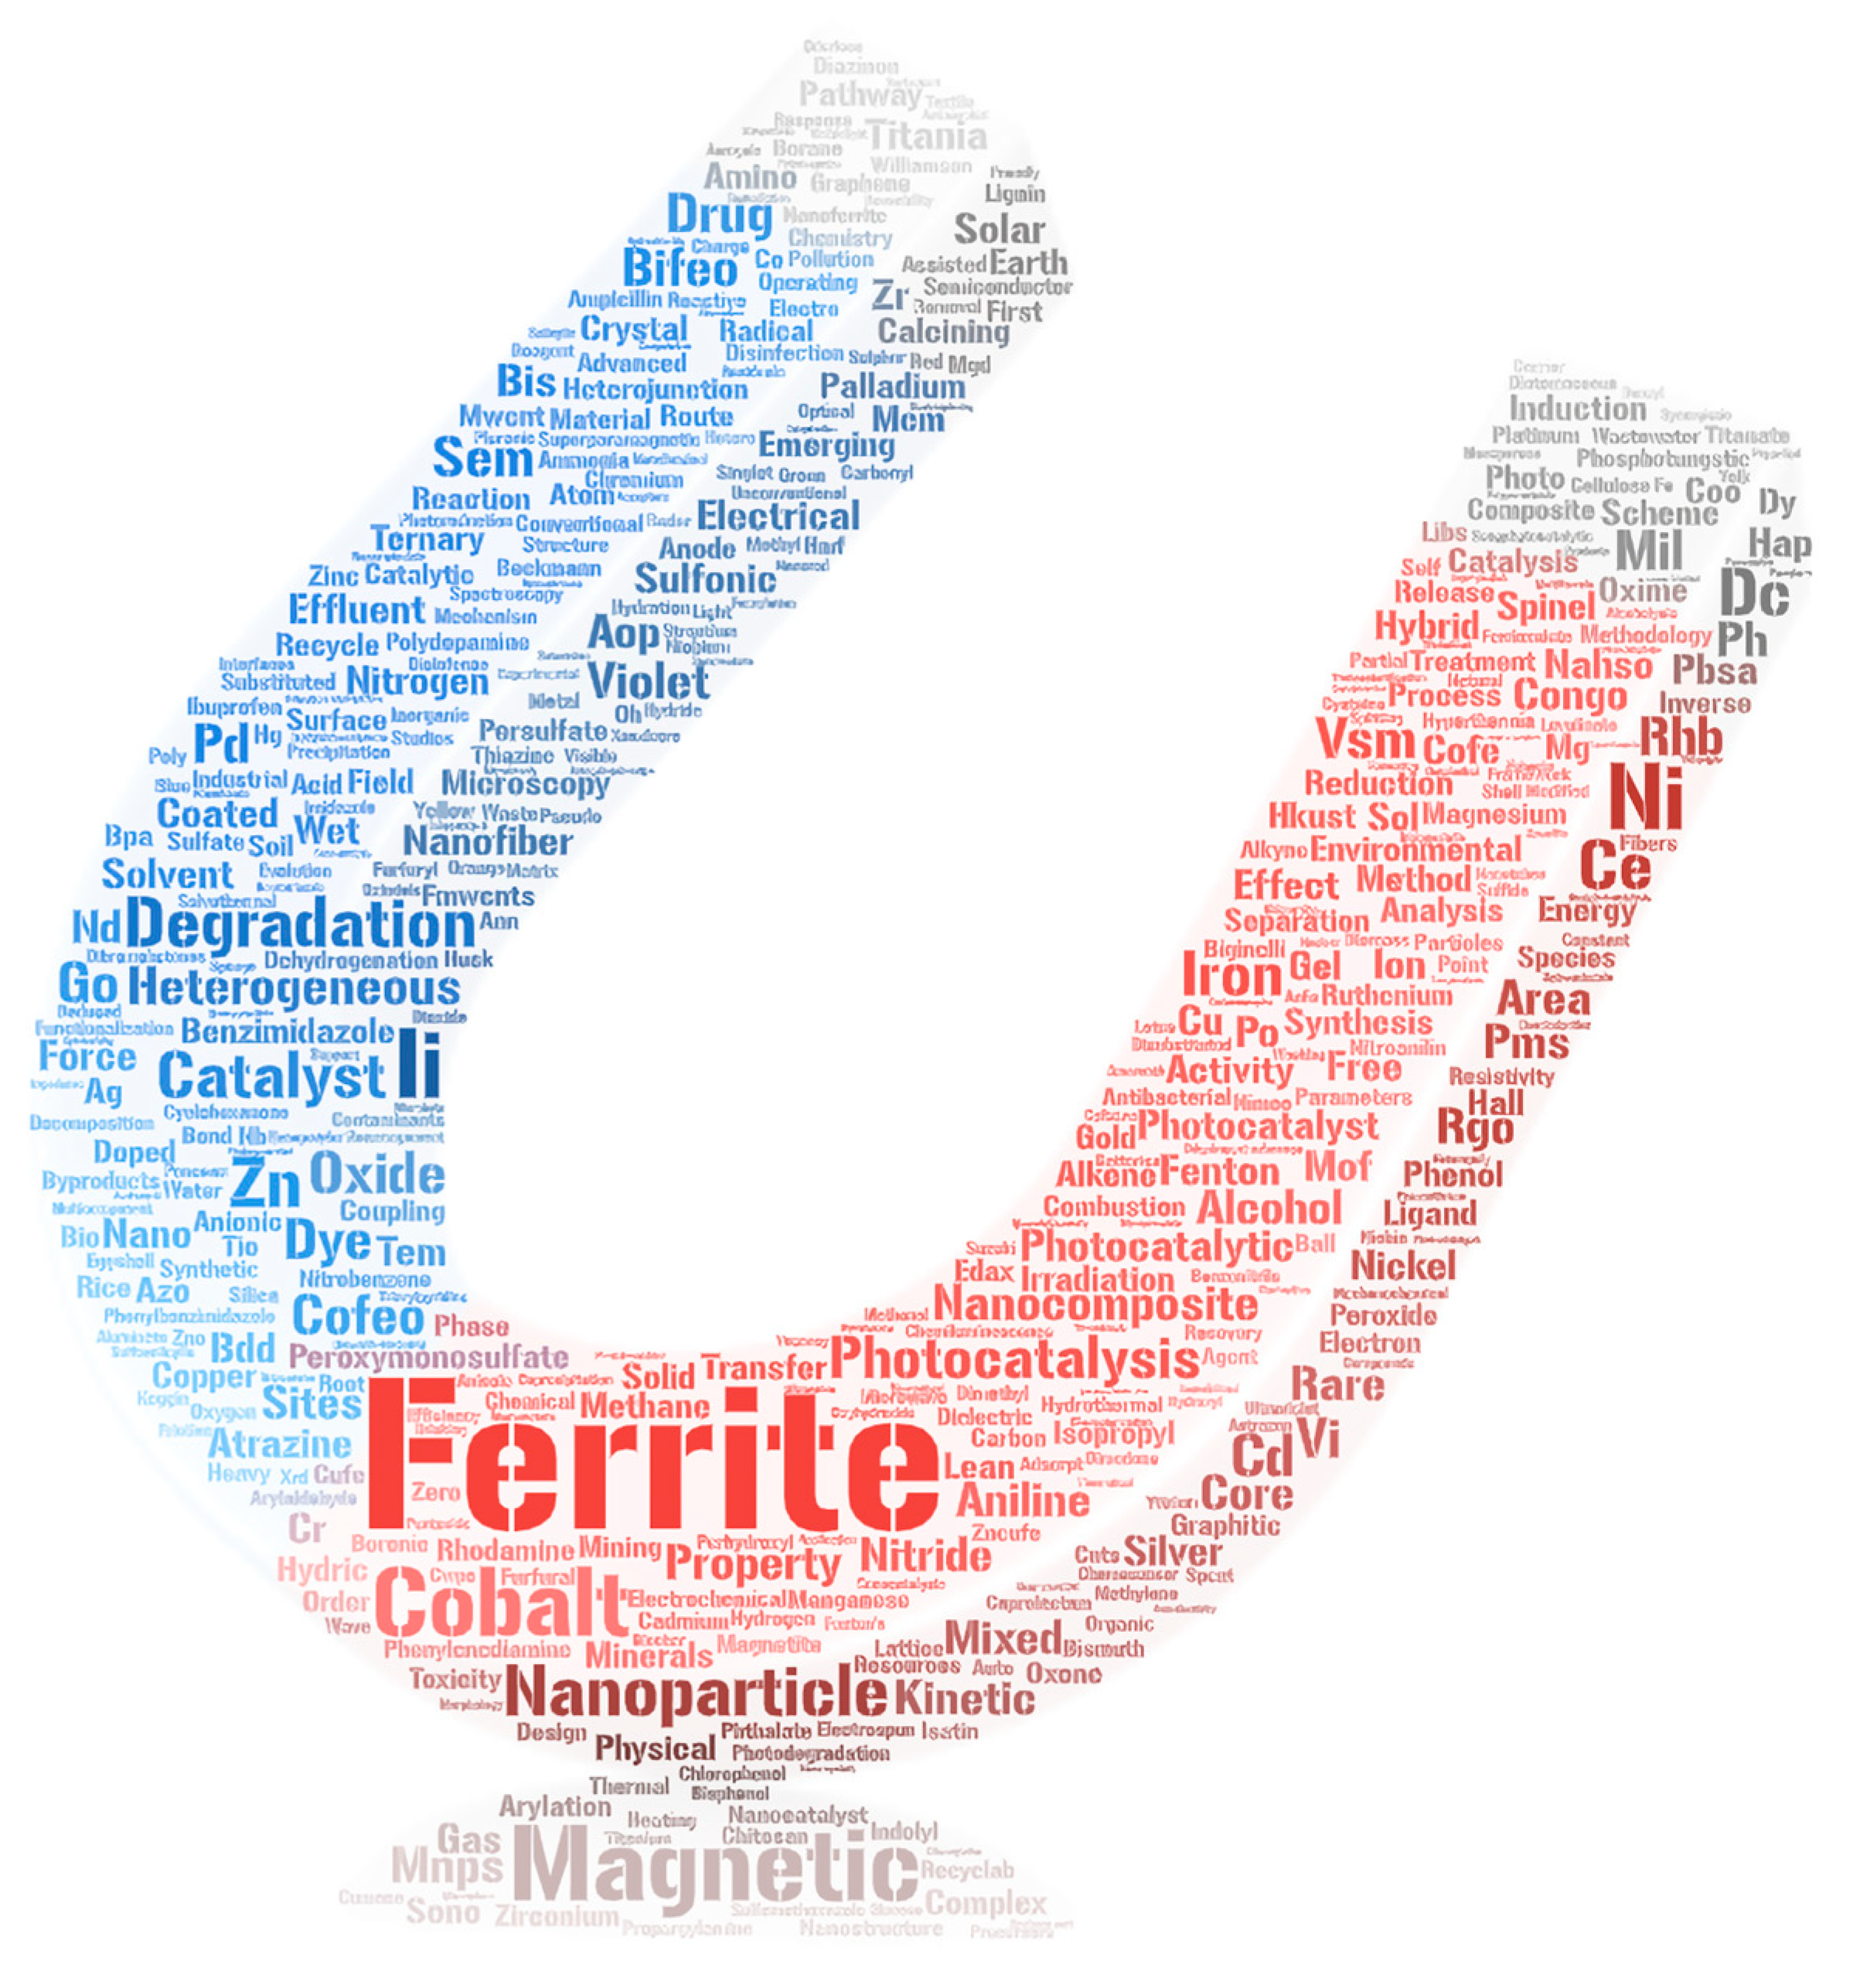
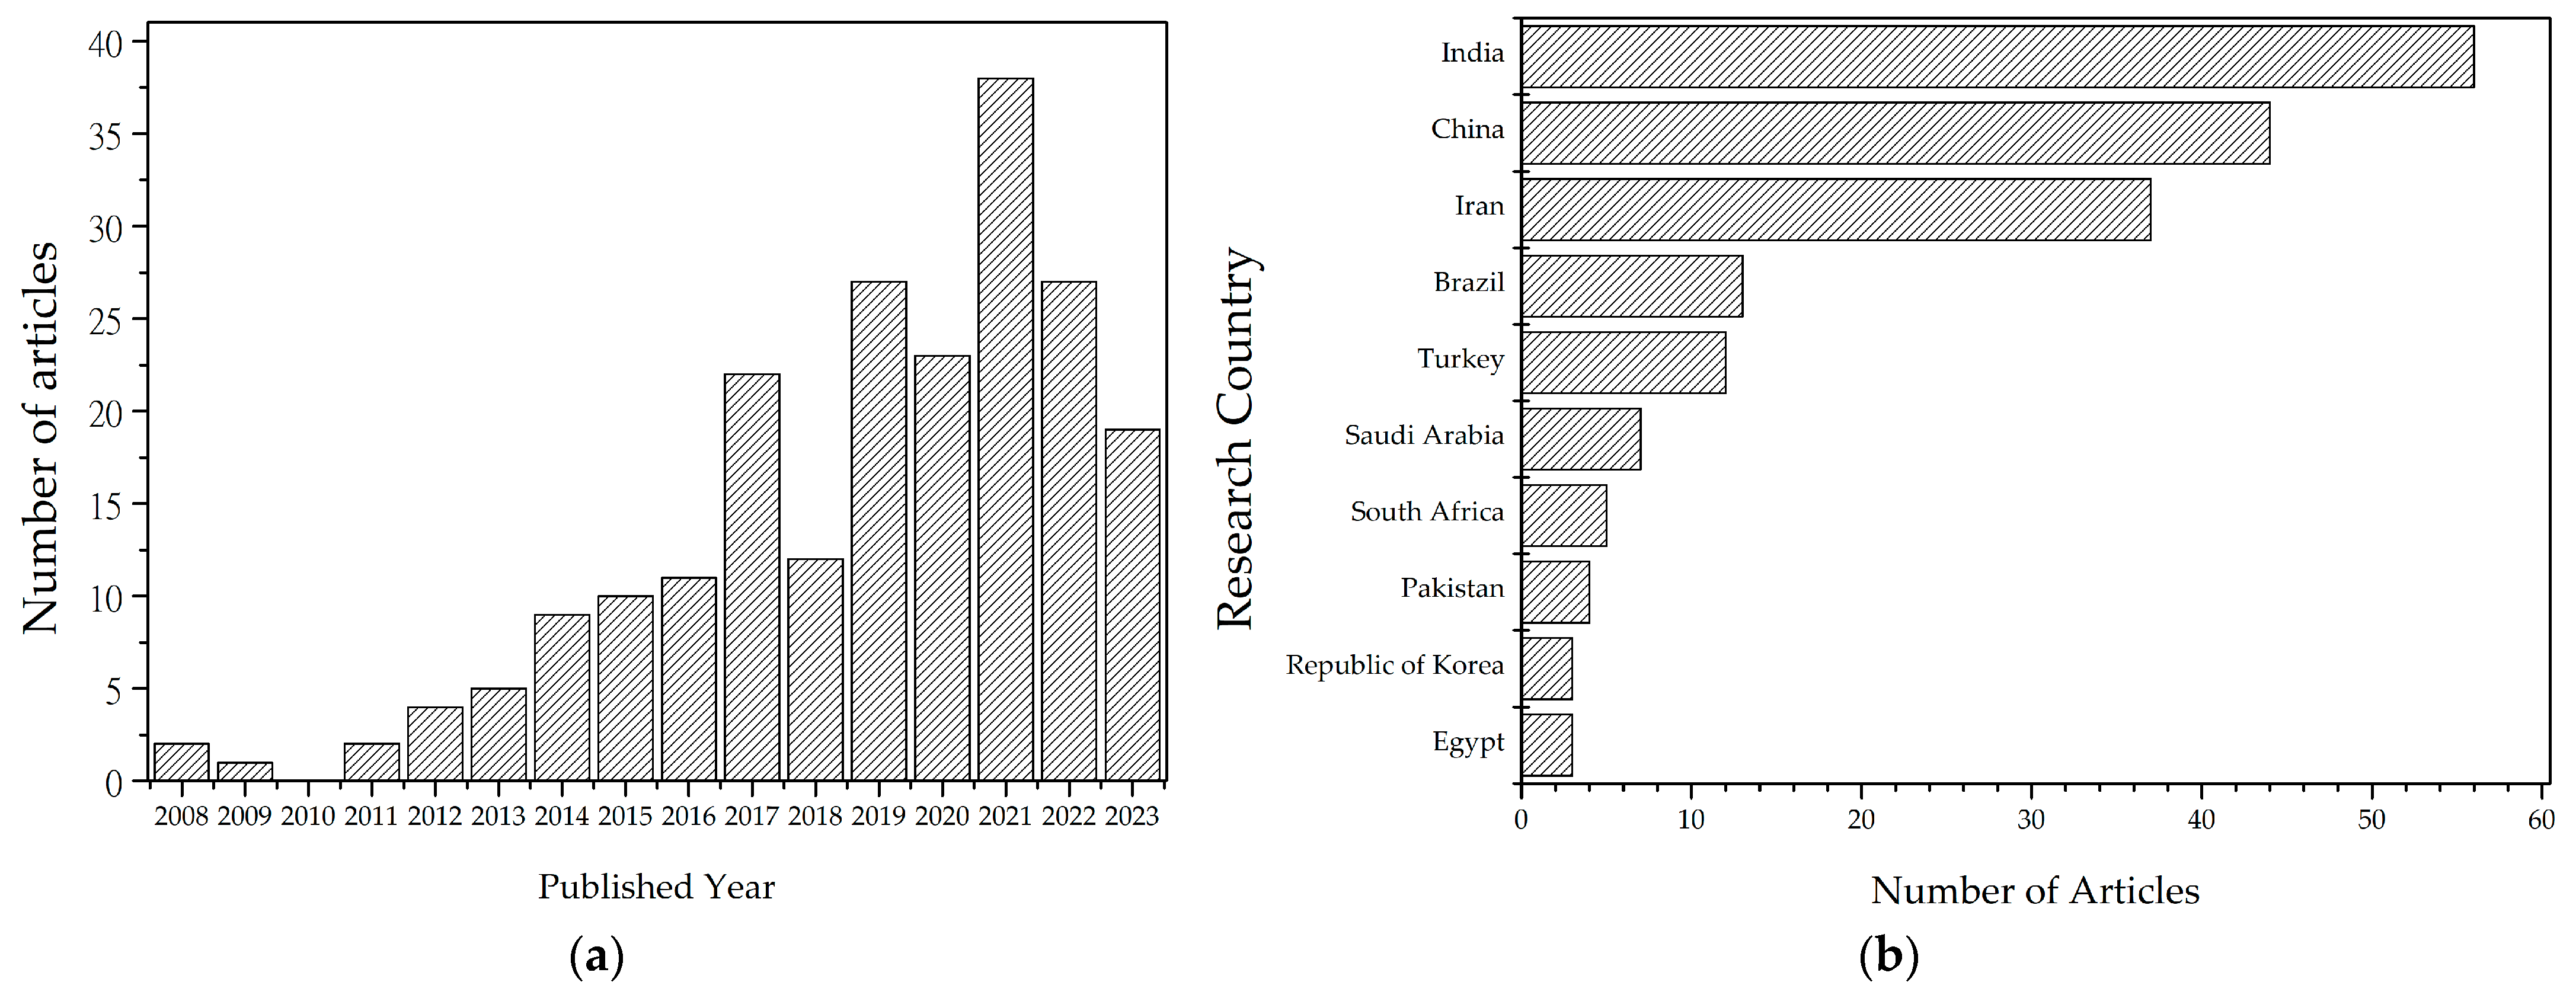
2. Bibliometric Analysis

A bibliometric analysis was conducted using the Methodi Ordinatio [38] to evaluate the significance of the articles published in the last years about the subject studied. Firstly, we searched for the following terms in two science search websites: ((((ALL = (niobium)) OR ALL = (cobalt ferrite)) AND ALL = (catalyst)) AND ALL = (photocat*)) AND ALL = (magnetic). We found 155 and 139 articles in Web of Science and Science Direct, respectively. After excluding the duplicates, 248 papers were filtered by title, resulting in 211 related to this study. The importance of each article was determined using the InOrdinatio equation, Equation (1):
I n O r d i n a t i o = Δ * I F λ * R e s e a r c h Y e a r P u b Y e a r H a l f L i f e + * C i R e s e a r c h Y e a r + 1 P u b Y e a r
According to Pagani (2022), IF represents the mean impact factor and corresponds to the selected journal metrics (JCR, CiteScore, SNIP, or SJR SCImago); Δ is a value ranging from 1 to 10 assigned by the researcher, with higher values indicating a greater importance of the impact factor; λ is a value between 0 and 10 that the researcher assigns to the relevance of the publication year; Ω is a value between 0 and 10 that the researcher assigns to the significance of the publication’s annual average of citations; ResearchYear denotes the year in which the research is being conducted, while PubYear represents the year the paper was published; ∑Ci is the total number of citations found in Google Scholar; and HalfLife refers to the median cited half-life of journals with JCR 2020 [38].
Methodi Ordinatio classified 211 articles, and the InOrdinatio value ranged from −12.79 to 579.75, when we used 10, 8, and 8 for Δ, λ, and Ω values, respectively. The main keywords that appear in the articles were: ferrite (97); magnetic (80); cobalt (65); nanoparticle (37); degradation (35); catalyst (30); photocatalysis (28); oxide (27); dye (25); CoFeO (24); heterogeneous (22); and nanocomposites (22) (Figure 1).
Another relevant bibliometric analysis is about the years of publication of the more significant InOrdinatio articles, 63% of the publications are concentrated between 2019 and 2023, Figure 2a. The countries that lead the survey in this area are India, China, and Iran, in first, second, and third place, respectively, responsible for about 65% of the publications studied, Figure 2b.
Bibliometric analysis of a subject is critical in research and academia, as it offers valuable insights into the relevance and impact of a particular area of study. By performing this analysis, it is possible to obtain quantitative information about the scientific production related to the topic, such as the number of publications, most cited authors, relevant journals, and trends over time. The Methodi Ordinatio is a current and efficient method of evaluating the articles found to be relevant to the chosen topic, as it classifies them in a ranking of relevance.
With this analysis, it was possible to identify trends and research advances about using cobalt ferrite as a catalyst and niobium as photocatalyst but have a gap in the combination of both nanomaterials to be applied in a photocatalyst. This is an unprecedented study; no result is found when you search for changing the Boolean OR by AND between niobium and cobalt ferrite.

3. Materials and Methods

3.1. Chemicals

Acetonitrile (CH₃CN), supplied by Merck S/A, Parque Rincão-SP, Brazil; anhydrous citric acid (C6H8O7), supplied by Perquim Rep. Com., Analytical Science, Ponta Grossa-PR, Brazil; anhydrous sodium sulfate (Na2SO4), supplied by Neon, Suzano-SP, Brazil; cobalt nitrate (Co(NO3)2.6H2O), supplied by Synth, Diadema-SP, Brazil; formic acid (CH2O2), supplied by Synth, Diadema-SP, Brazil; hydrochloric acid (HCl, 37%), supplied by VWR chemicals, São Paulo-SP, Brazil; iron nitrate (Fe(NO3)3.9H2O), supplied by Synth, Diadema-SP, Brazil; niobium pentoxide (Nb2O5), supplied by CBMM—Companhia Brasileira de Metalurgia e Mineração, Araxá-MG, Brazil; sodium hydroxide (NaOH), supplied by Dinâmica Química Contemporânea Ltd.a., Indaiatuba-SP, Brazil; and sulfuric acid (H2SO4), supplied by Dinâmica Química Contemporânea Ltd.a., Indaiatuba-SP, Brazil.

3.2. Catalysts Preparation

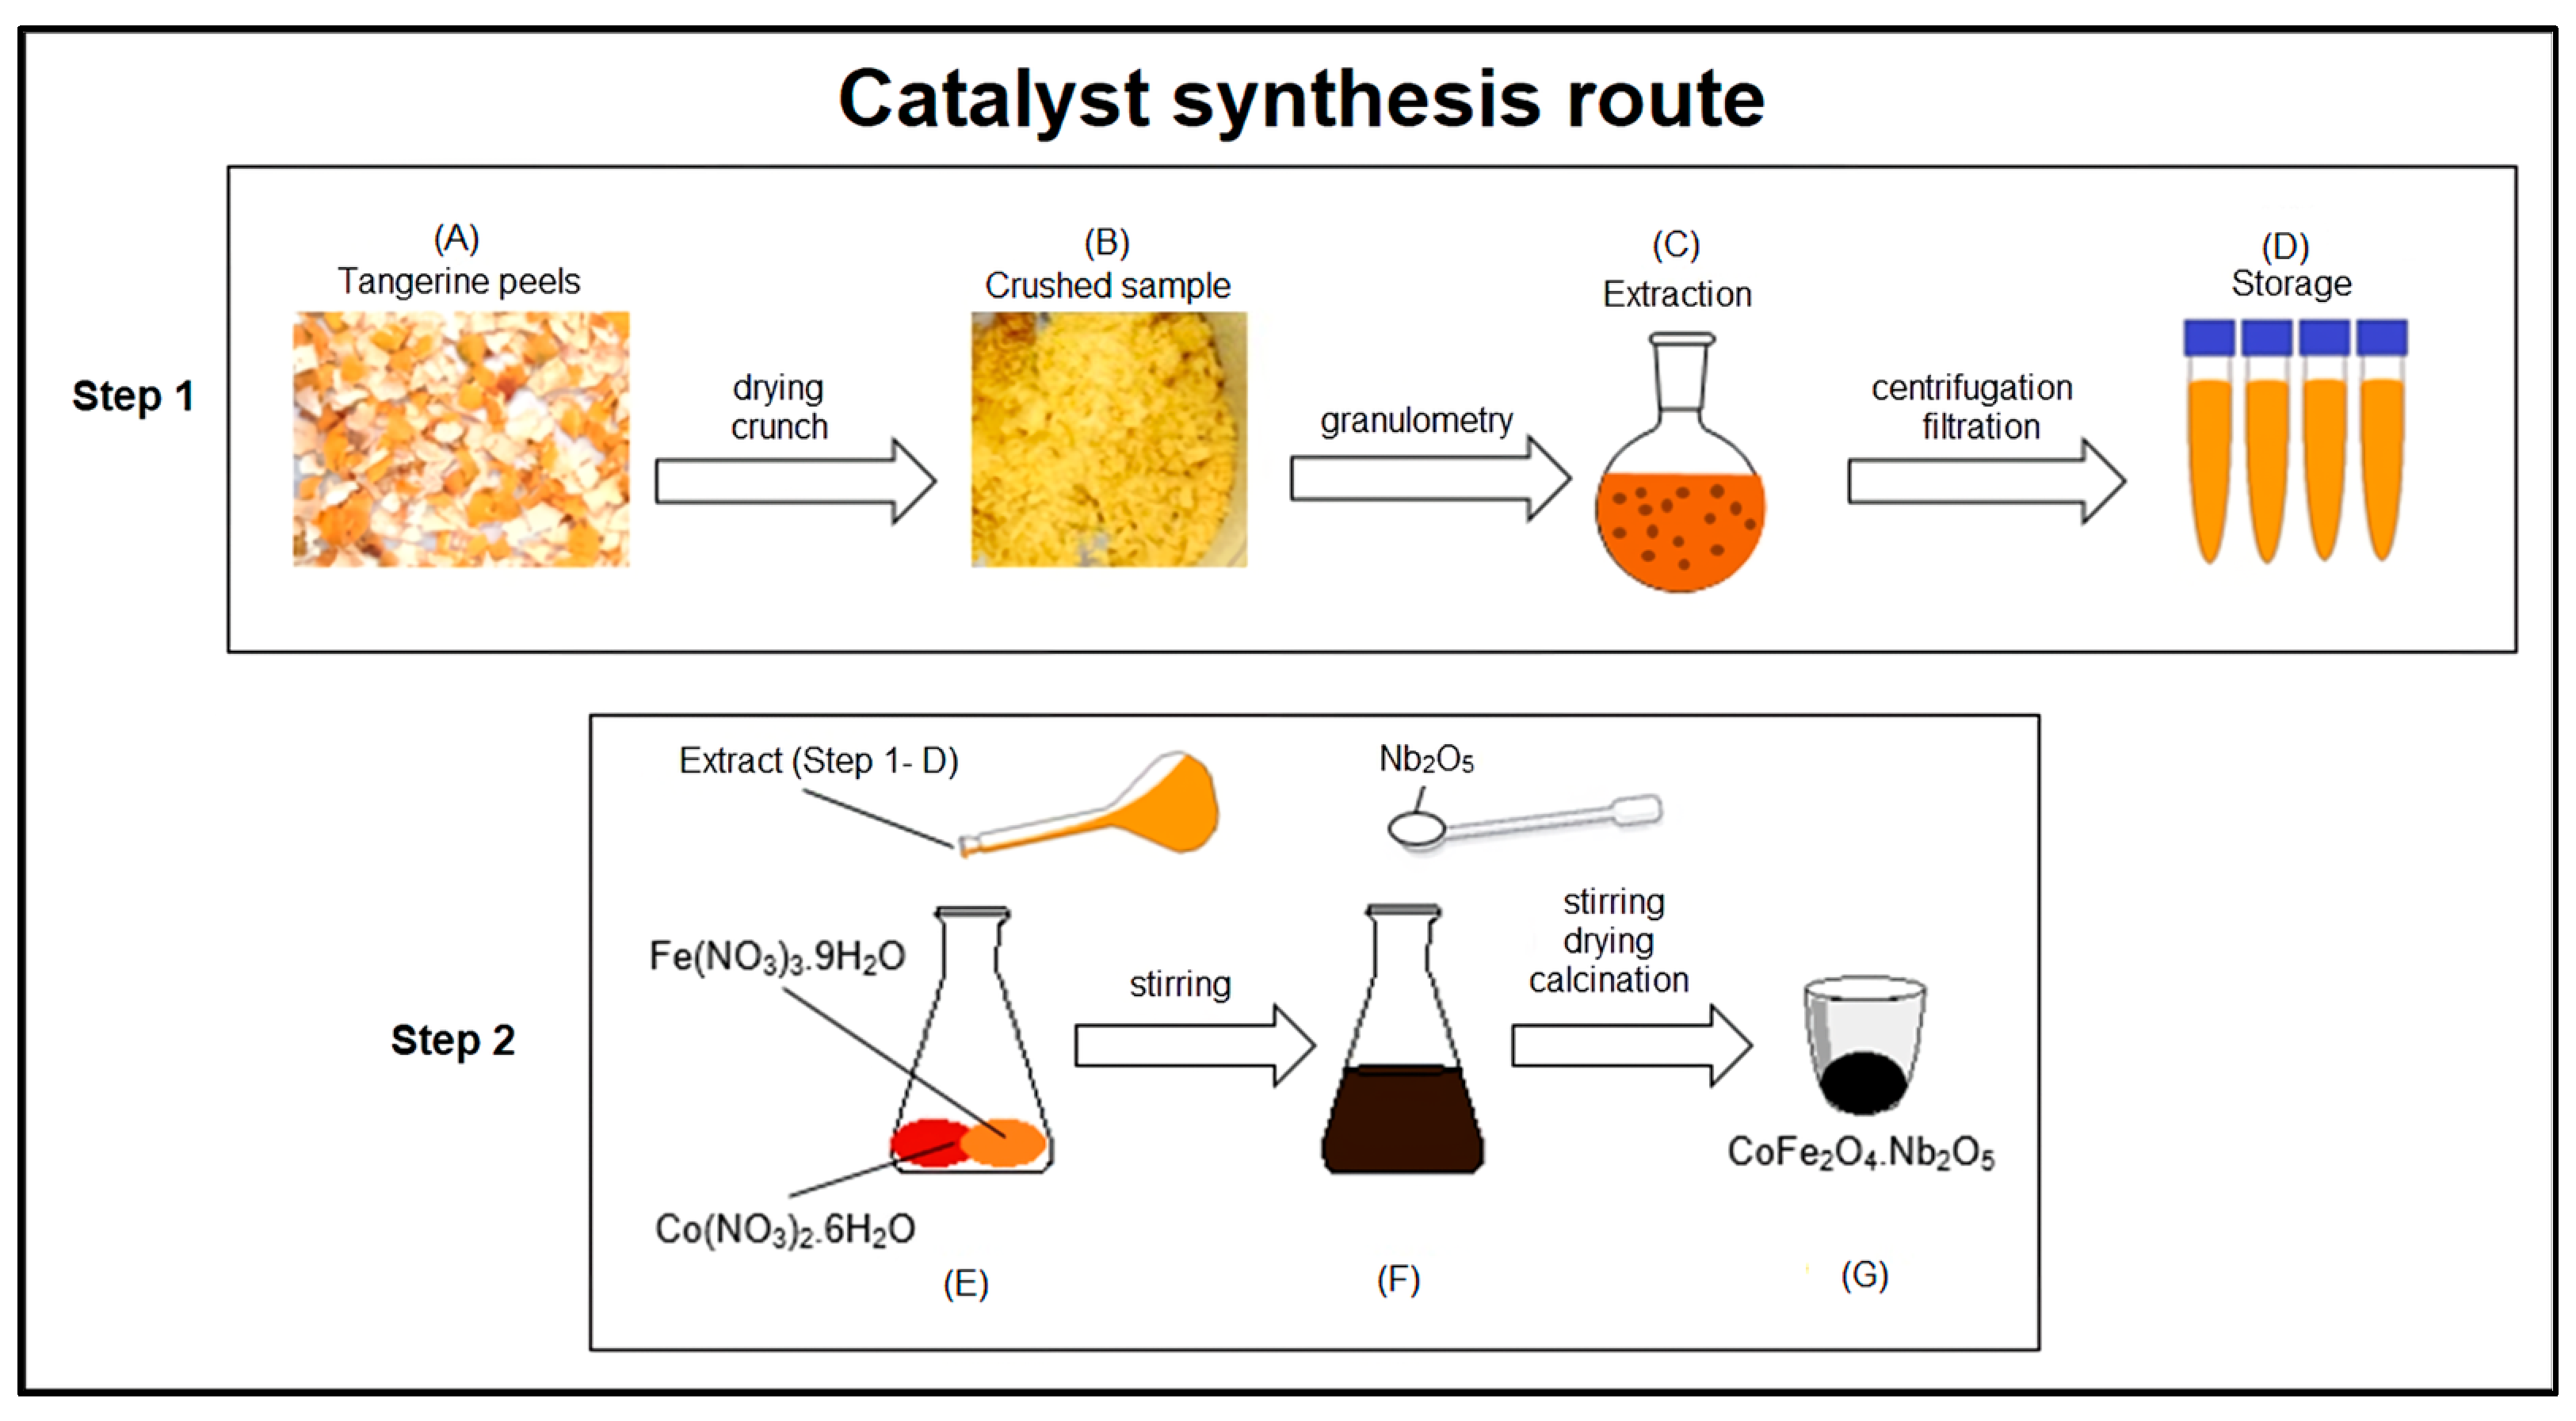
3.2.1. Tangerine Peel Extract

The first step to obtaining the catalyst is drying the tangerine peels, Figure 3-Step 1 (A). These peels were further subjected to washing under continuous water flow and had been previously dried in the sun to avoid fungal contamination. After this, the tangerine peels were placed in a drying oven (SL 102, SOLAB) at 353 ± 5 K for 18 h. Subsequently, the tangerine peels were crushed in an analytical mill (Q298A21, QUIMIS) and sieved to obtain a diameter lower than 425 μm (35 mesh) (wire-cloth test sieve, Bertel), Step 1 (B). Finally, the tangerine peels were stored until the next step. To obtain the tangerine peel extract, the following methodology was optimized: Step 1 (C), using an analytical balance (AUY220, SHIMADZU), 4.0 g of crushed tangerine peels were placed in a 250 mL round-bottom flask with 100 mL of distilled water, which was placed under magnetic stirring at room temperature (298 K) for 3 h (C-MAG HS 7, IKA). Next, the temperature was increased to 333 K for 1 h [16,39], the dispersion was further centrifuged at 4000 rpm (revolutions per minute) for 5 min to separate the tangerine peels from the supernatant (80-2B centrifuge, CENTRIBIO). After centrifugation, the supernatant was filtered through a paper filter to remove any possible peel in the solution. Finally, the obtained extract solution was stored in a freezer until use, completing the first step, Step 1 (D). The reducing power (EC50 RP) of this extract was 1.68 ± 0.03 mg mL−1 (analyzed by Centro de Investigação de Montanha-CIMO, Instituto Politécnico de Bragança, Bragança, Portugal). The EC50 values correspond to the concentration of extract that provides 50% of reducing power or antioxidant activity. Lower EC50 values mean higher antioxidant capacity of the samples [40].
In the second step, the cobalt ferrite functionalized catalysts in niobium pentoxide (CoFe2O4@Nb2O5) have been synthesized. The salts Fe3+ (11.4 mmol) and Co2+ (5.7 mmol) were weighed in a 150 mL Erlenmeyer flask. After 25 mL of tangerine peel extract (obtained in the first step) was added, the resultant solution showed an immediately black color, Step 2 (E). The Erlenmeyer was stirred in the shaker (TE-424, TECNAL) at 200 ± 2 rpm, 298 ± 2 K for 15 min. The theoretical weight of the cobalt ferrite formed was 1.33 g, so this amount of niobium pentoxide was weighed and added in the Erlenmeyer after the above referred 15 min, Step 2 (F). The mixture was stirred for more than 15 min under the same conditions. In sequence, the mixture was transferred to a porcelain crucible, which stayed in a drying oven for 4.5 h at 373 ± 10 K until forming a gel. Finally, the porcelain crucible with the gel was placed in a calcination furnace (N1200, NOVUS) with a heating ramp to increase the temperature to 423 K during 30 min and to keep it there for 1 h. The temperature was increased by 150 K per cycle (30 min to rise and 1 h in the final temperature) until it reached 873 K. After calcination, the resulting material in the porcelain crucible is cobalt ferrite functionalized in niobium (CFNb), Step 2 (G).

3.2.2. Magnetic Demonstration

A magnetic demonstration can be seen in the magnetic separation images over time. One catalyst sample (around 0.025 g) was placed in 5 mL of distilled water under stirring. The flask with this suspension was placed next to the magnet, and images were captured to register the separation.

3.3. Characterization Techniques

3.3.1. Surface and Pore Analyzer

The determination of the specific surface area was carried out for the characterization of porous and finely dispersed solids [41]. Analysis of N2 adsorption–desorption isotherms at 77 K was carried out with a Quantachrome NOVATouch XL4 adsorption analyzer to determine the textural properties of prepared samples. The BET specific surface area (SBET) was calculated by the Brunauer, Emmett, Teller method (BET). The external surface area (Sext) and the micropore volume (Vmic) were obtained by using the t-method and employing the ASTM standard D-6556-01 to calculate the thickness (t). Then, the microporous surface area (Smic) was calculated subtracting the Sext from SBET and the average pore width (Wmic) by approximation (W = 4 Vmic/Smic). The total pore volume (VTotal) was determined at p/p0 = 0.98.

3.3.2. Photoacoustic Spectroscopy

Photoacoustic spectroscopy is applied to measure the effect of absorbed electromagnetic energy (particularly light) using acoustic detection to determine the band gap energy relevant to photocatalysis [42]. Photoacoustic spectroscopy was performed at 200–700 nm, 800 W, and 23 Hz conditions. The catalyst samples were diluted in 80% silica (quartz powder) due to the color being too dark to analyze without dilution. The evaluated catalysts CFNb, as well as Nb2O5 without calcination, which is an efficient photocatalyst used as a reference.

3.3.3. Point of Zero Charge (pHpzc)

The determination of pHpzc allows suppositions to be made about types of active surface centers and the adsorption abilities of surfaces [43]. For this determination, approximately 0.09 g of material was added in 6 different Erlenmeyer flasks with different initial pH values (pH0). The Erlenmeyer flasks were loaded with 15.0 mL of 0.01 mol·L−1 Na2SO4 and their pHs were adjusted to different values (2.0, 4.0, 6.0, 8.0, 10.0, and 12.0) using 0.02 mol·L−1 NaOH and 0.02 mol·L−1 H2SO4 solutions. The Erlenmeyer flasks were placed in an orbital shaker (TE-424, TECNAL) at 200 ± 3 rpm, 298 ± 2 K. After stirring, the suspension was separated from the catalyst using a magnet, and the final pH was measured (pHF). The pHPZC corresponded to the average of the final pH values which tended to a constant value, regardless of the initial pH value [31,44].

3.3.4. Scanning Electron Microscopy (SEM) and Energy Dispersive Spectroscopy (EDS)

The topographic surface images were obtained using a scanning electron microscope model VEGA 3 LMU brand TESCAN, completed with a W 20 kV filament, 3.0 nm resolution, retractable SE and BSE detectors, and low-vacuum mode (500 Pa) chamber with an internal diameter of 230 mm and door opening of 148 mm, 5-axis compucentric stage, fully motorized, with X: 80 mm, Y: 60 mm, and Z: 47 mm movements, CCD camera for viewing the sample chamber and “chamberview” software, VegaTC operating software, data processing system and track ball. The microscope also has a DES Detector, model AZTec Energy X-Act, resolution 130 eV, Oxford.

3.3.5. X-ray Diffraction (XRD) Analysis

This test serves to analyze the crystal structure and to identify and quantify the crystalline phases of the samples [45]. The X-ray diffractograms of the samples were obtained using a Rigaku diffractometer model Miniflex 600 with copper radiation (CuKα λ = 1.54 Å), in the Bragg angle range of 3° ≤ 2θ ≤ 90°, with a step of 0.05° and time fixed count of 2 s per step in semi-continuous mode. The signals emitted are given as an intensity graph, whose unit is expressed in counts per second (cps) as a function of the scanning angle (2θ, or Bragg angle). To identify the materials, the signals obtained are compared with the literature to confirm the presence of the desired phase and/or other phases. The average crystallite sizes (L) were calculated by Scherrer’s equation (2), which is given as follows:
L = k λ β cos θ
where k is a constant equal to 0.91, λ is the wavelength of the X-ray radiation (all diffraction patterns shown in this work were performed with CuKa radiation, so λ is 0.154 nm), θ is the diffraction angle in radians and β is the full width half maximum (FWHM) in radians.

3.3.6. Transmission Electron Microscopy

The transmission electron microscopy (TEM) images were obtained to verify their morphology with the help of a microscope (JOEL JEM-1250) of 120 kV.

3.3.7. Photocatalysis

Before tests, the calibration curve for quantification of paracetamol was charted in HPLC—high-performance liquid chromatography (YL Clarity 9100) equipped with a pre-column, C-18 column (Phenomenex), and a visible, ultraviolet detector (UV-VIS) at 243 nm, which identifies itself as a peak that elutes after approximately 3.5 min of scanning [46]. The mobile phase comprised water and acetonitrile (80/20 volume ratio) with a 1.0 mL·min−1 flow rate. The concentration of the 20 mg·L−1 paracetamol solution was chosen based on the literature on paracetamol degradation [47,48,49].
All photocatalytic tests were performed in the photocatalytic chamber exemplified in Figure 4 with all elements that compose it. Therefore, the steps to carry out those tests were:
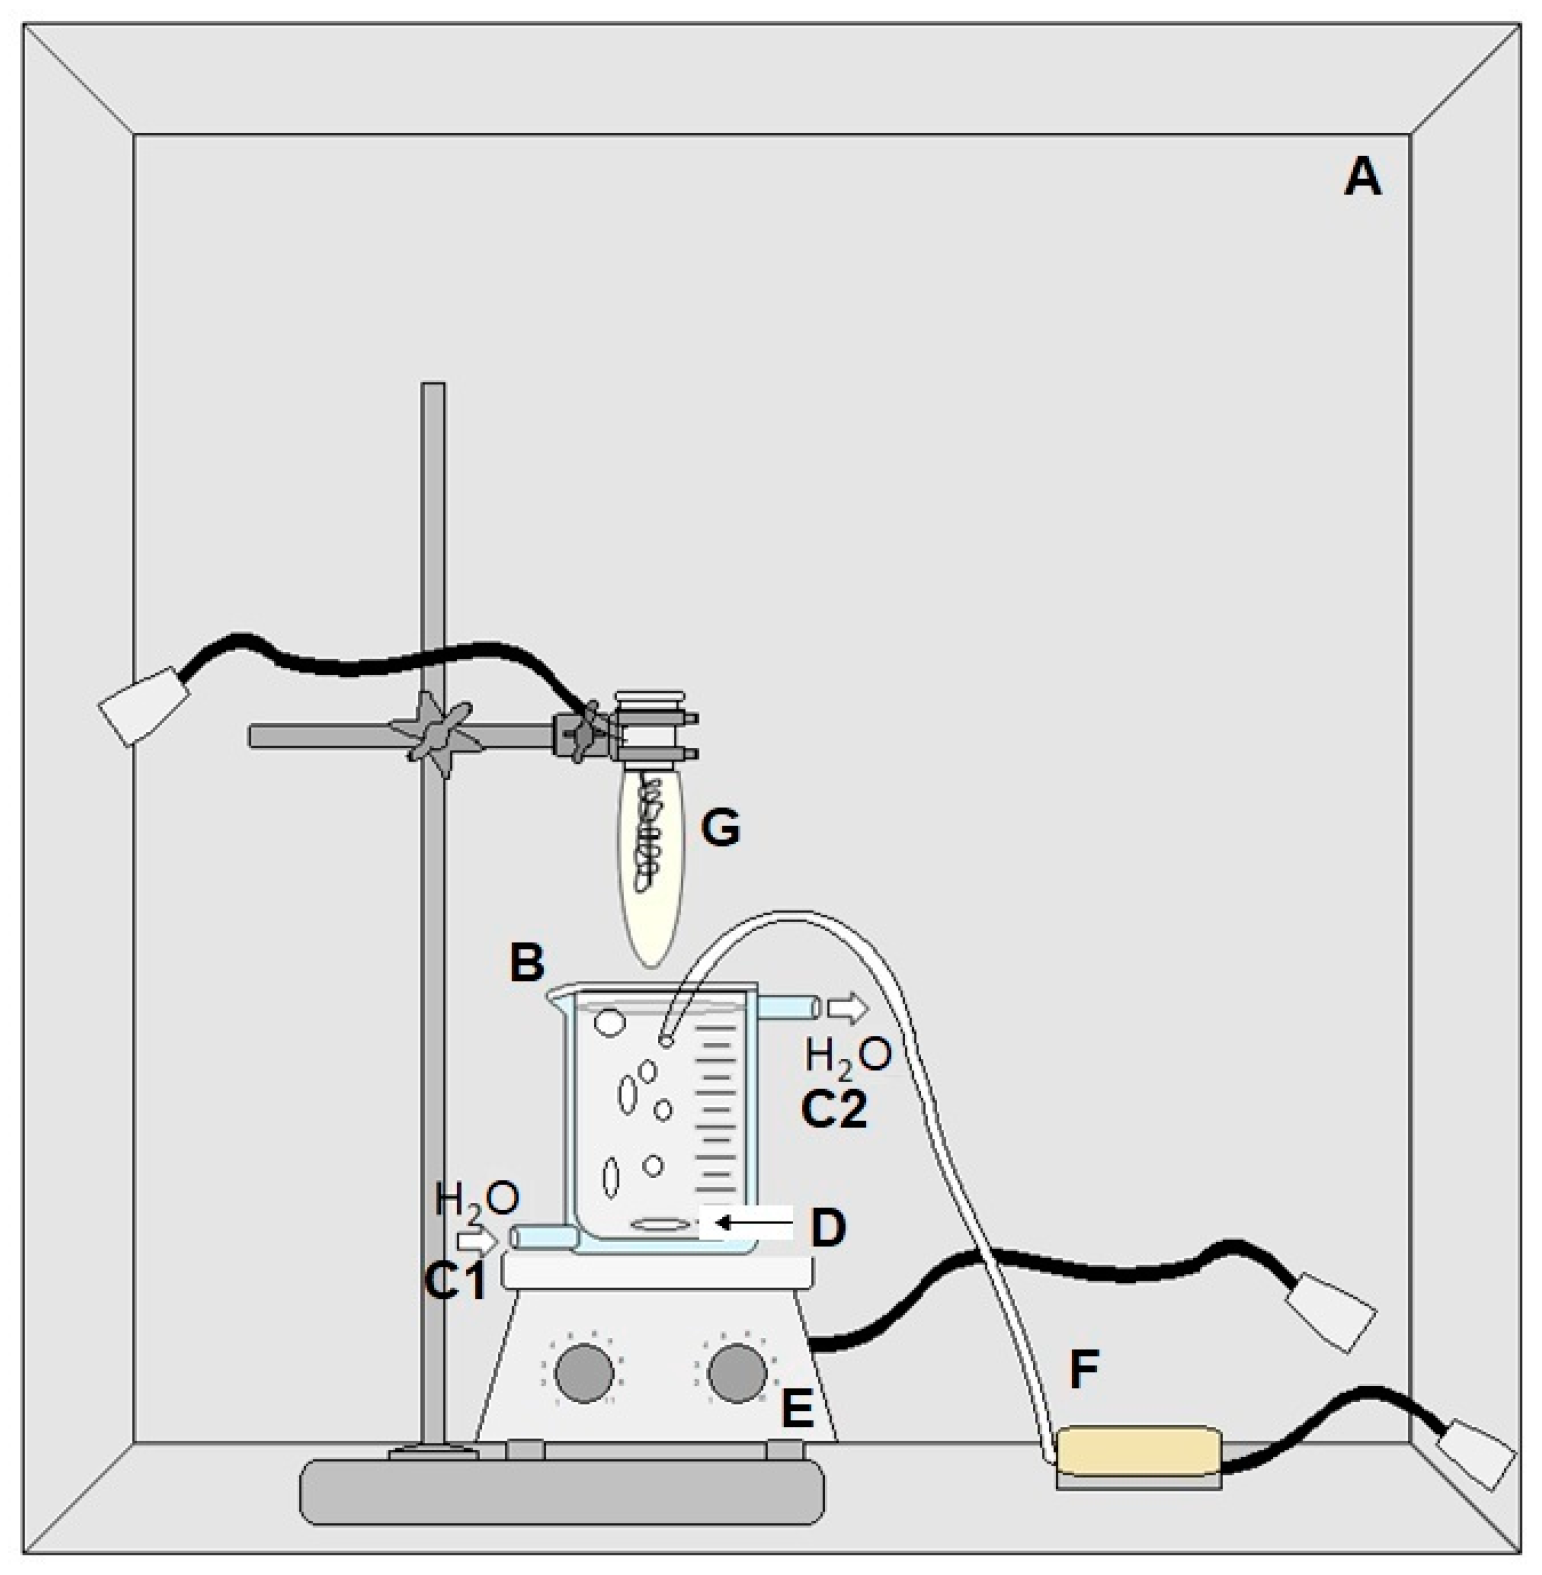
  • The pH of the paracetamol solution (21.7 ± 1.9 mg·L−1) was adjusted;
  • The paracetamol solution was placed in the reactor (B), which was established in the photocatalytic chamber (A);
  • A jacketed reactor maintained a constant temperature of approximately 298 K. To keep the flow of water in the reactor jacket (C1 and C2), an ultra-thermostatic bath was used (SL 152/10, SOLAB);
  • Magnetic stirring (D) using a magnetic stirring plate (C-MAG HS 7, IKA) (E) and constant airflow (F) started;
  • The catalyst was added to the solution, and samples were taken at 0, 15, 30, 45, 60, 90, 120, 180, and 240 min;
  • The mercury lamp (G) 250 Watts was lit, remaining on until the end of the reaction;
  • All nine samples of all reactions were analyzed using HPLC applying the calibration curve made initially as a reference.
A design of experimental (DoE), as a central composite design (CCD), was carried out by varying the catalyst concentration and the pH of the solution, as shown in Table 1.
To verify this catalyst’s efficiency, photocatalysis tests were performed using only cobalt ferrite synthesized with the same extract (CFext) and niobium (Nb600) calcined with the same methodology, and compared and discussed the results. Additionally, reuse tests were conducted to demonstrate the CFNb applicability several times.

4. Results and Discussion

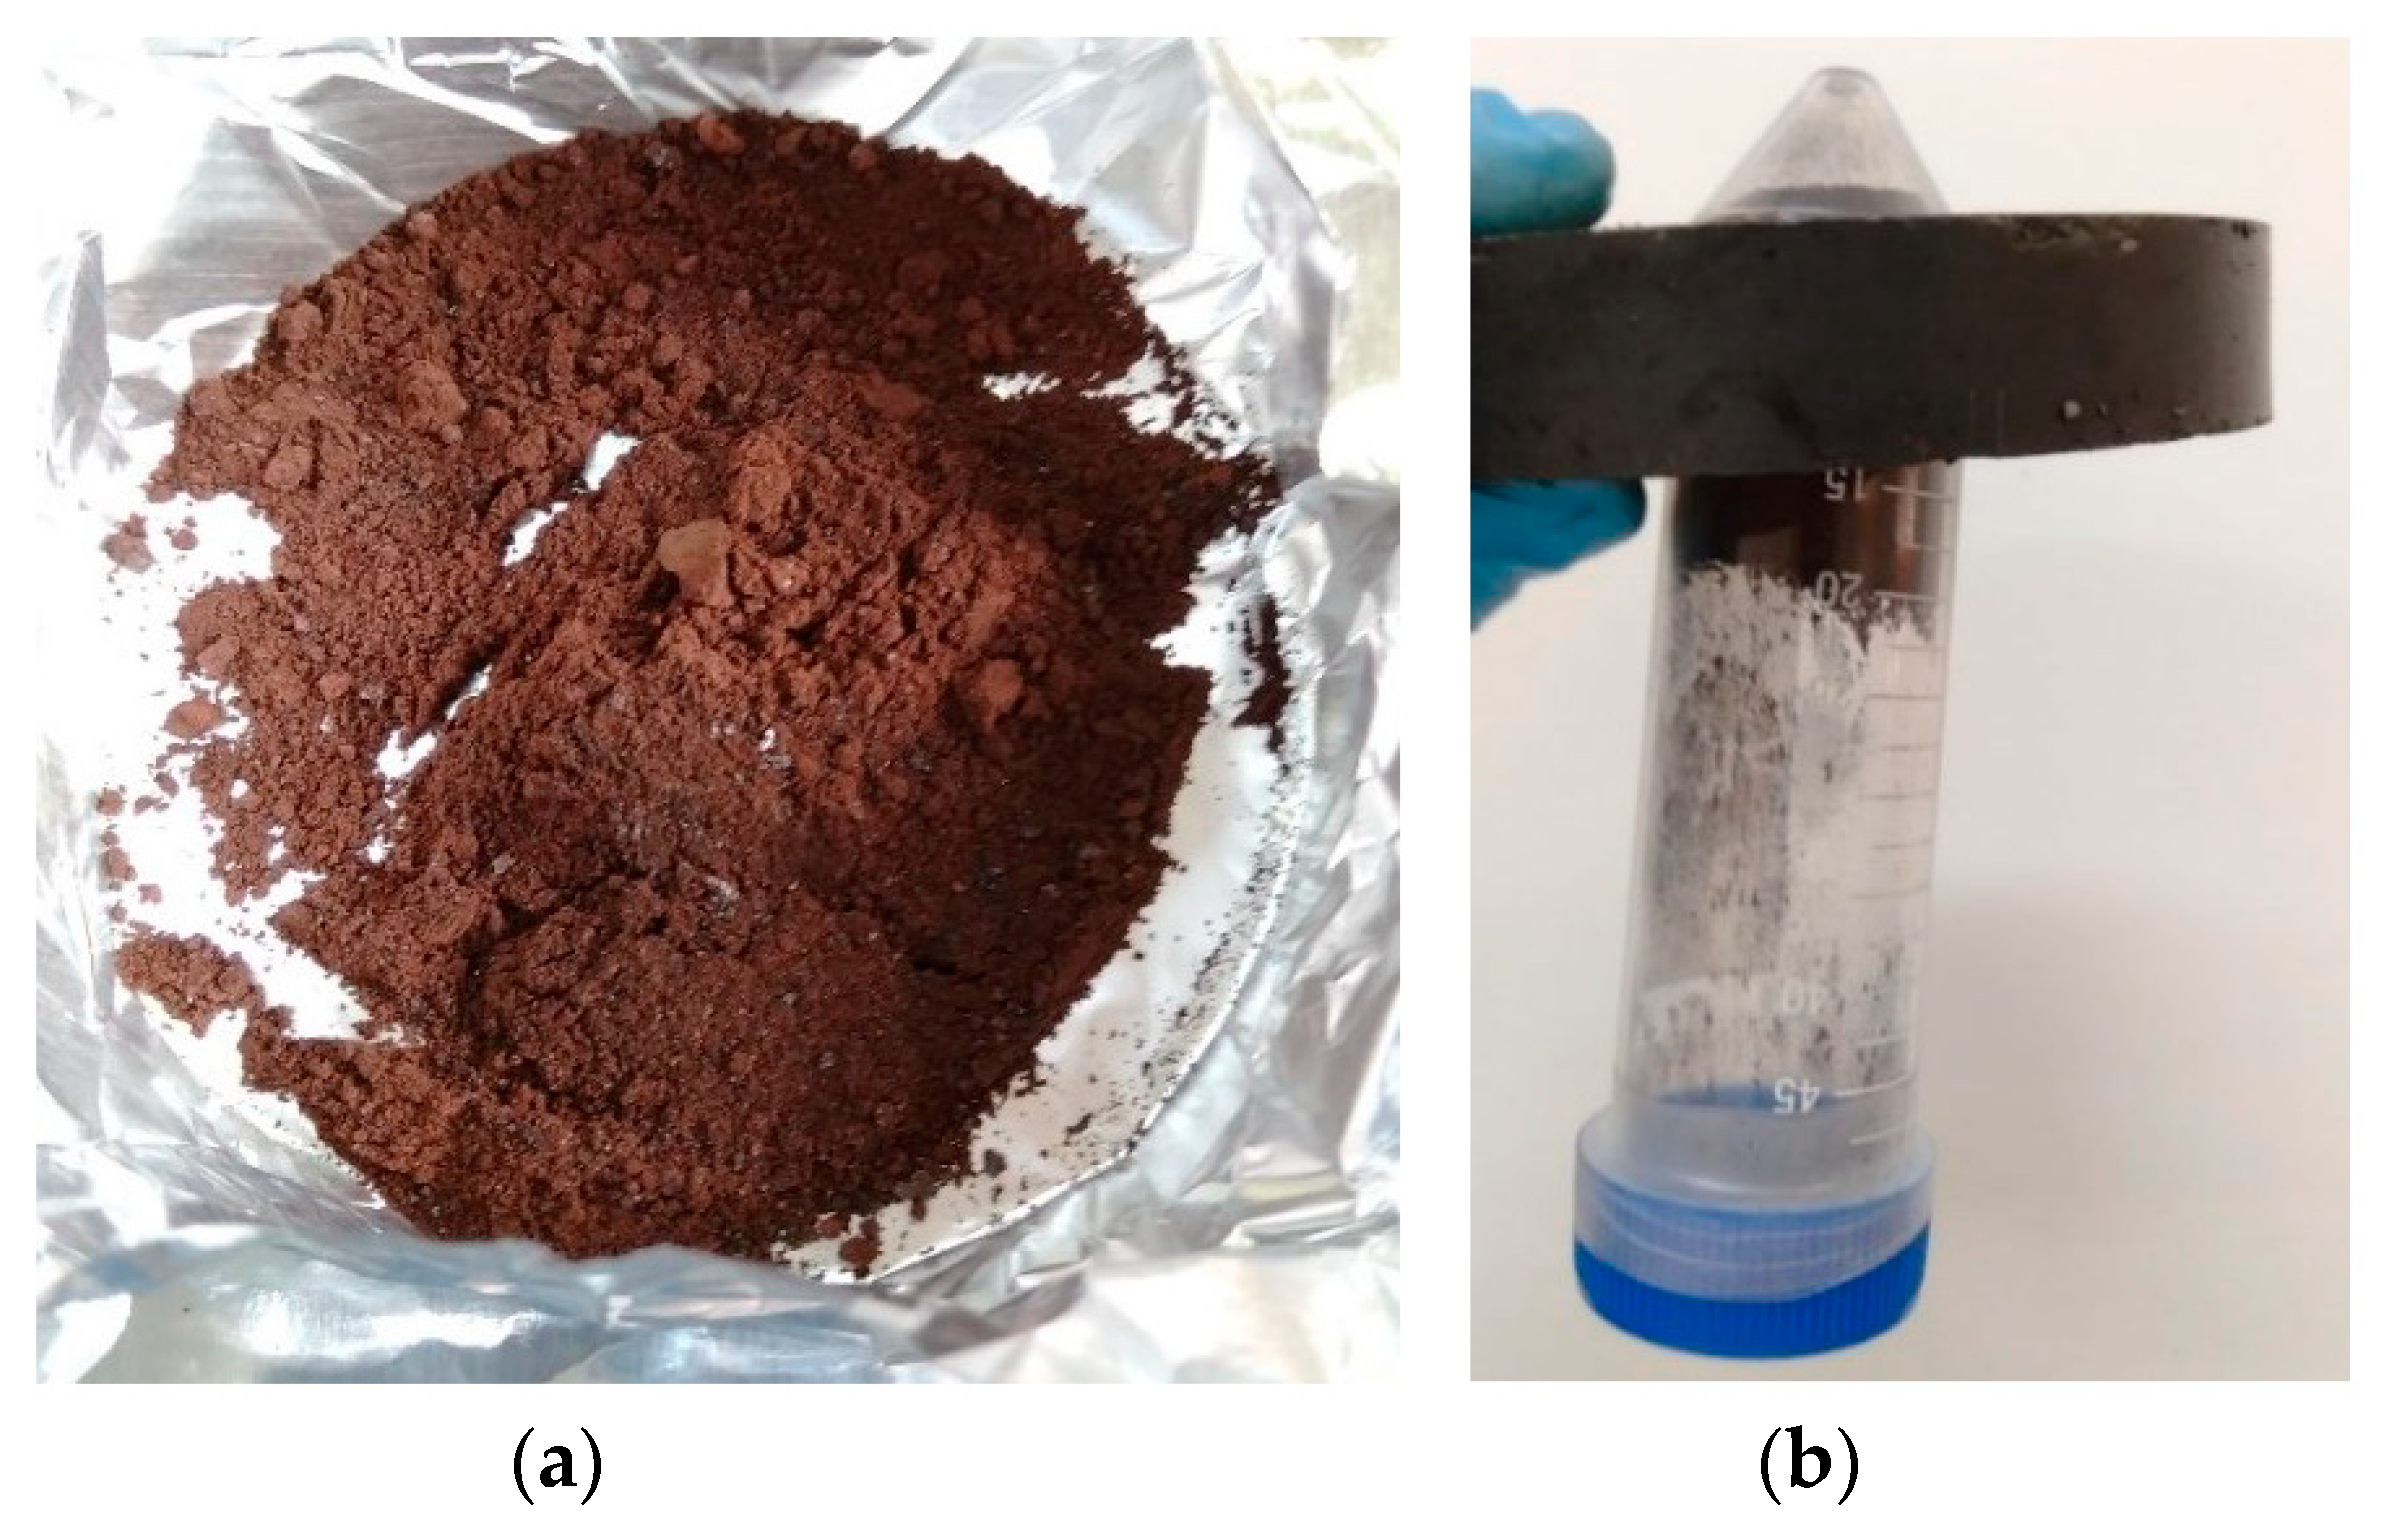
4.1. Catalyst Preparation

After completing the synthesis of the materials, in the recovery of the material that remains in the porcelain crucible after calcination, Step 2 (G), there is a weight loss of around 11 ± 3%, Figure 5a. The catalysts were stored in Falcon tubes until use, and the magnetic properties were tested by approaching with a magnet. The magnetic attraction is powerful enough that the magnet can hold the tube containing the sample, as shown in Figure 5b.
Besides the magnetic properties that facilitate the separation after using the magnetic nanoparticles in reactions, the type of synthesis created has several advantages over other types already reported in the literature. Among the benefits can be highlighted: utilization of biomass, namely fruit peels; extract production using only distilled water as a solvent and at room temperature; incorporation of the niobium pentoxide support in the same stage of synthesis of cobalt ferrite, when most other methods first suggest the synthesis of the precursor and then impregnation in the support, which would require more time and higher cost; high support incorporation compared to other methods, without losing or decreasing the magnetic properties of cobalt ferrite; added value to a raw material abundant in Brazilian territory, niobium; and low-cost synthesis, using common laboratory equipment.

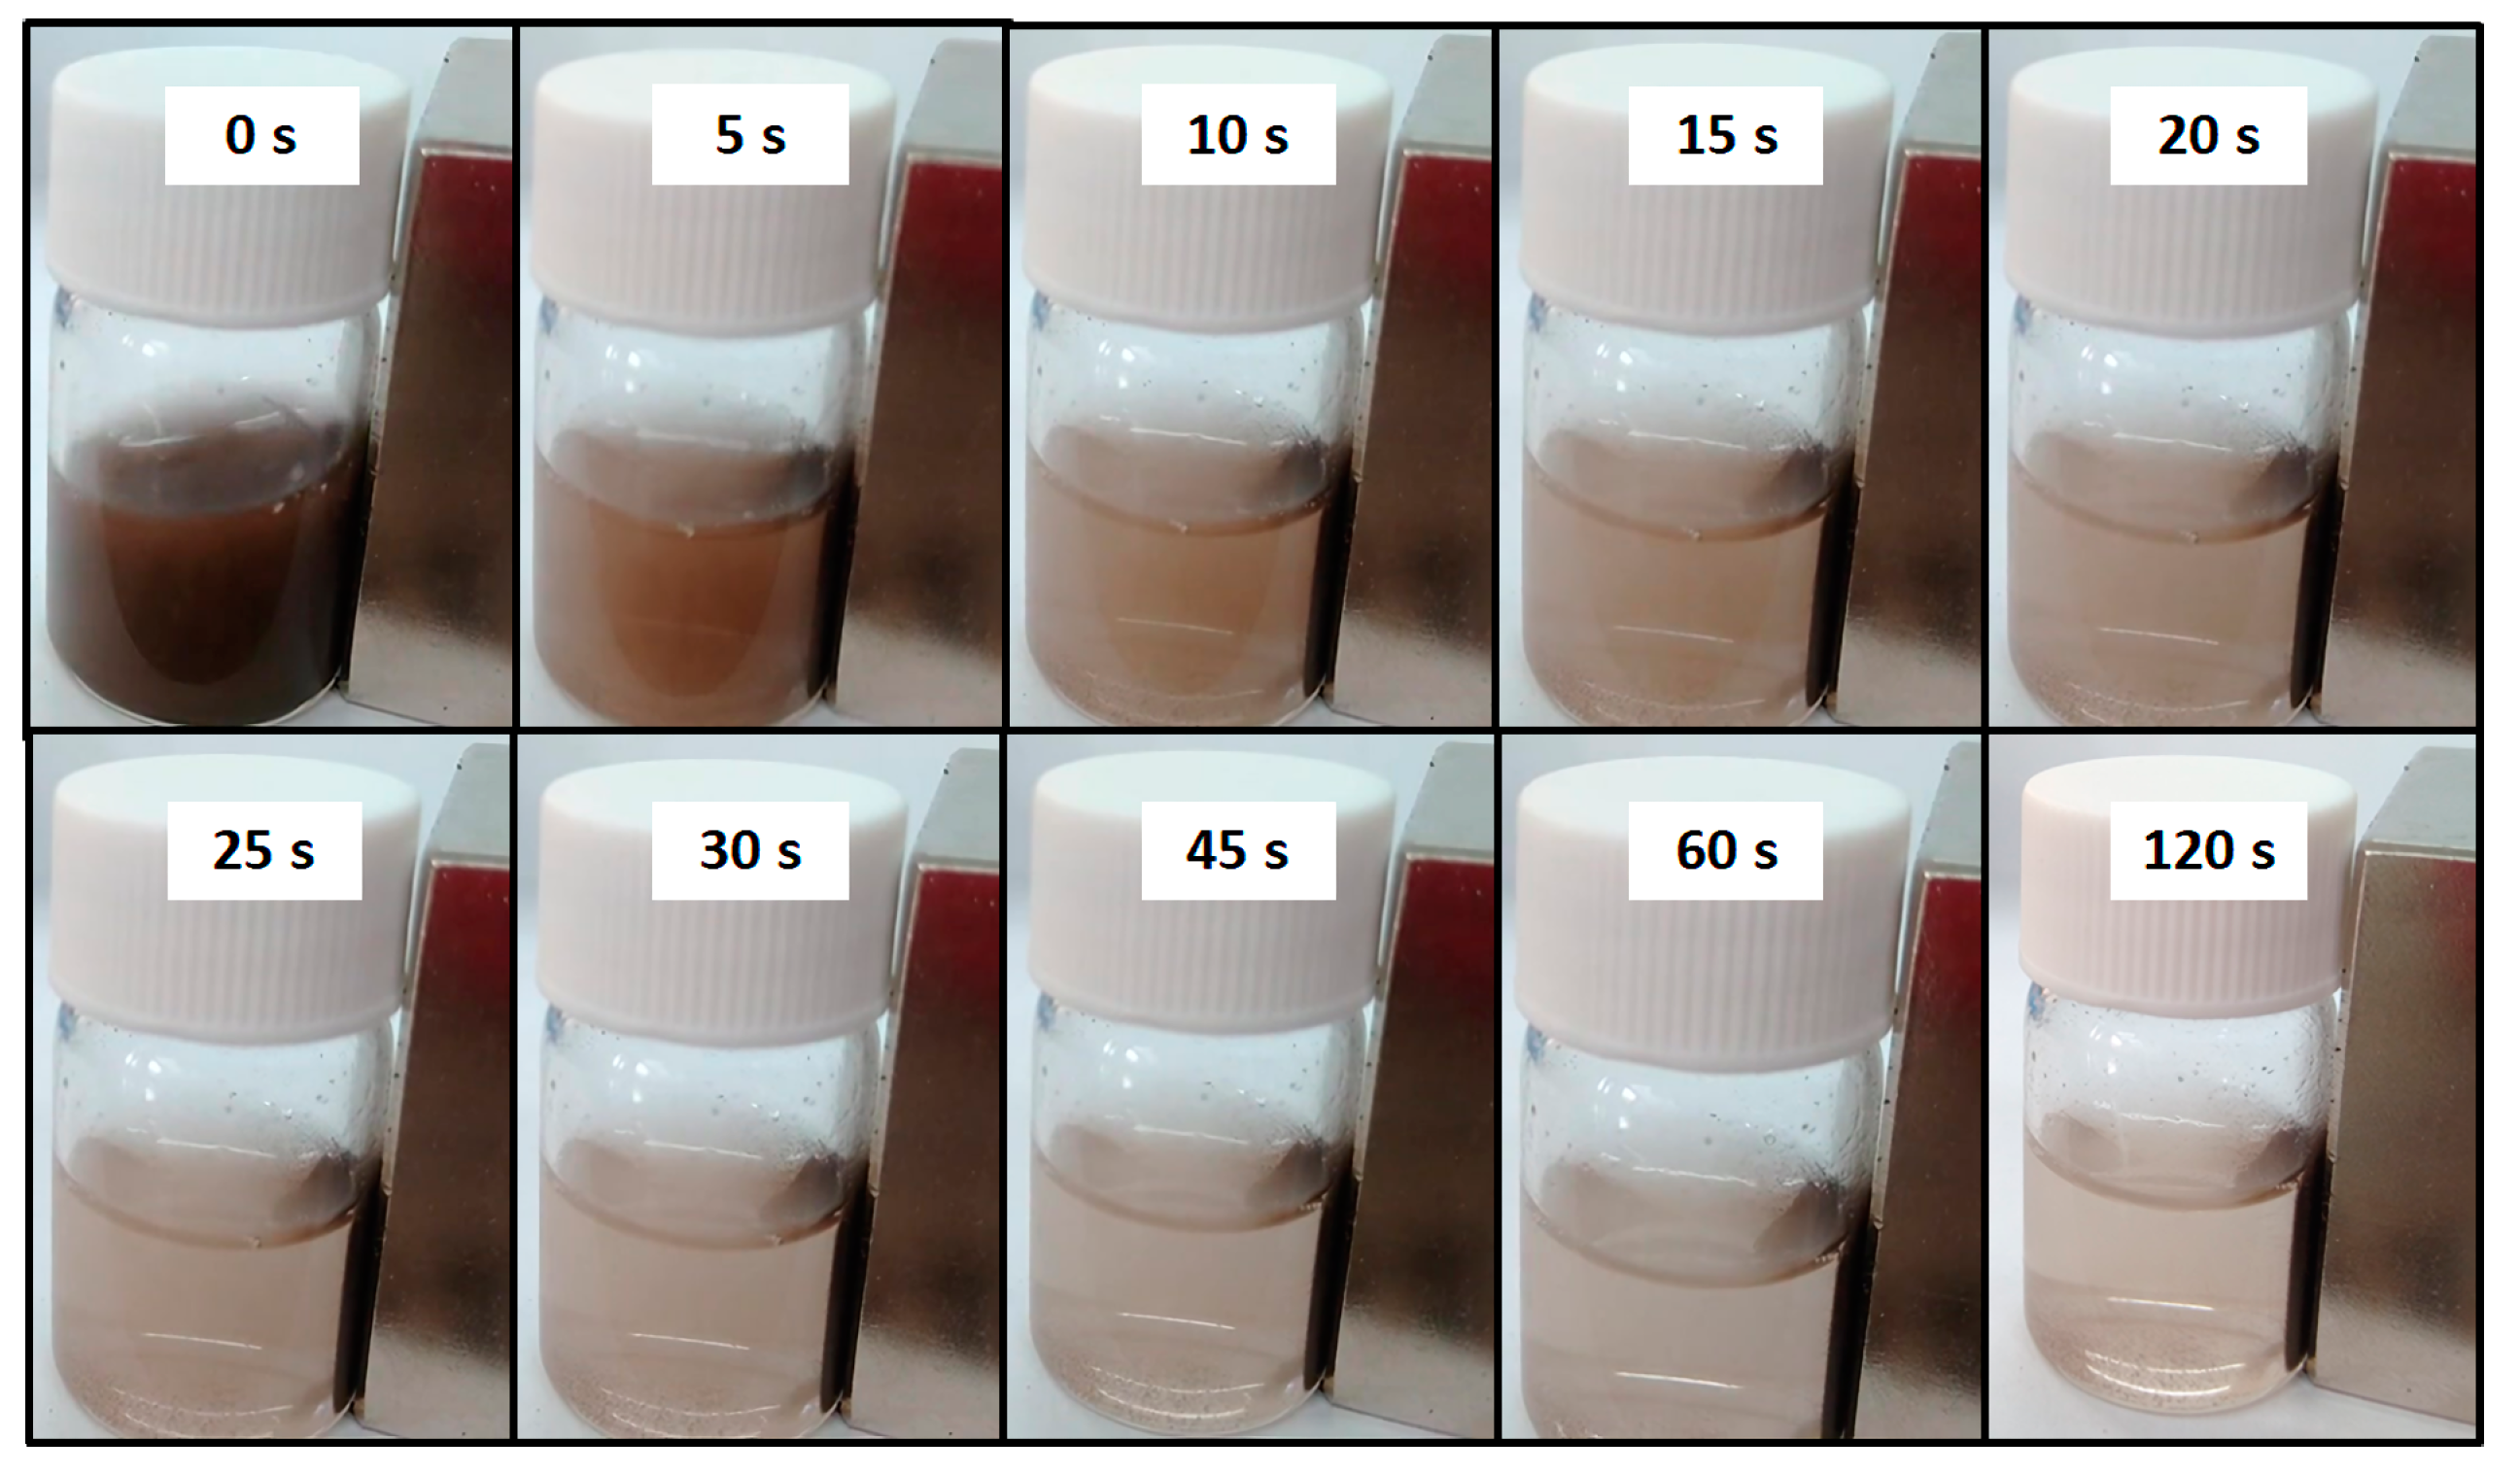
4.2. Magnetic Demonstration

The catalyst suspension with a concentration of approximately 5 g L−1 was placed next to the magnet and registered images at times: 0, 5, 10, 15, 20, 25, 30, 45, 60, and 120 s (Figure 6). We can note that around 30 s, a significant amount of the catalyst was already separated, and at the final time (120 s), practically the total catalyst was next to the magnet.

4.3. Characterization Techniques

4.3.1. Surface and Pore Analyzer

The Surface and pore analysis was performed with just Nb2O5 before nanoparticle synthesis. The values of the SBET, Sext, Smic, Vmic, and Vtotal were 185 m2·g, 88 m2·g, 97 m2·g, 50.3 mm3·g, and 158 mm3·g, respectively. Without calcination, the Nb2O5 is amorphous until heat treatment at 673 K, and therefore must have presented higher values up to this temperature. In theory, using the material with higher SBET, Smic, and Vmic would be more interesting, as it would better aggregate the cobalt ferrite particles and still have a higher surface area for active sites for catalysis. However, after mixing with the Fe3+ and Co2+ salts reagents and tangerine extract, there is another heat treatment step up to 873 K, and this temperature may also influence the behavior of both the Nb2O5 and the final catalyst. According to the literature, the materials containing niobium pentoxide and cobalt ferrite have specific surface area BET (SBET), Nb2O5 calcined at 873 K has SBET between 22 and 57.8 mm2·g [50,51], without other compounds. Niobium pentoxide nanocomposites under the same temperature calcination can be SBET between 21.24 and 149.63 mm2·g [32,52]. Cobalt ferrite in the literature has SBET 44 mm2·g at 673 K, and with carbon, the shell can be SBET around 330 mm2·g at 773 K [53,54]. However, there is no specific comparison for the material CoFe2O4@Nb2O5, as it is an innovation.

4.3.2. Photoacoustic Spectroscopy

The photoacoustic spectrum (PAS) in the UV-Vis region of 200–700 nm for the catalyst showed a broad absorption band between 225–420 nm similar to the PA spectrum of non-calcined Nb2O5. Applying the photoacoustic method with phase resolution (PAPR) to the non-calcined Nb2O5 spectrum, an average phase difference of (12 ± 3)° was observed between two absorption peaks. Therefore, the PAPR method indicated two regional absorber centers between 225–420 nm. The PAPR method found an absorption peak at 300 nm (peak 1), corresponding to the transition from ligand-to-metal charge transfer (LMCT) from O2− to Nb5+, and another at around 450 nm (peak 2) due to niobium nanodomains. For all catalysts, peak 1 remained at approximately 300 nm. However, peak 2 shifted to around 50 nm compared to non-calcined Nb2O5.
The intensity of the photoacoustic signal did not change with increasing calcination temperature during the synthesis. This result, in addition to not indicating changes in the band gap and the absorption threshold, suggests a slight variation in the size of the crystal with the increase of the calcination temperature.
GAP energy was calculated using the linear method and the derivative method, and it was an average value very close to the value of the gap energy for Nb2O5 recorded in the literature, equal to 3.1 eV [55]. The GAP energy values are 3.14 eV (linear method) and 3.19 eV (derivative method) both for Nb2O5; for the CFNb catalyst they are 3.12 eV (linear method) and 3.20 eV (derivative method).
As mentioned, the band gap value for Nb2O5 in the literature is 3.1 eV, while for cobalt ferrite around 1.1 eV [56]. Thus, it is observed that niobium pentoxide has more influence on this characteristic of the nanomaterial than the metal complex. To compare niobium pentoxide with different iron fractions, the band gap ranges from 3.05 to 3.94 eV, with values relatively close to those found in this work [32]. Compared with TiO2 P25, the most widely used commercial photocatalyst, it has a band gap equal to 3.2 eV [57]. The fact that the synthesized catalysts have a band gap close to that of TiO2 P25 reveals that they may also be promising for application in photocatalysis.

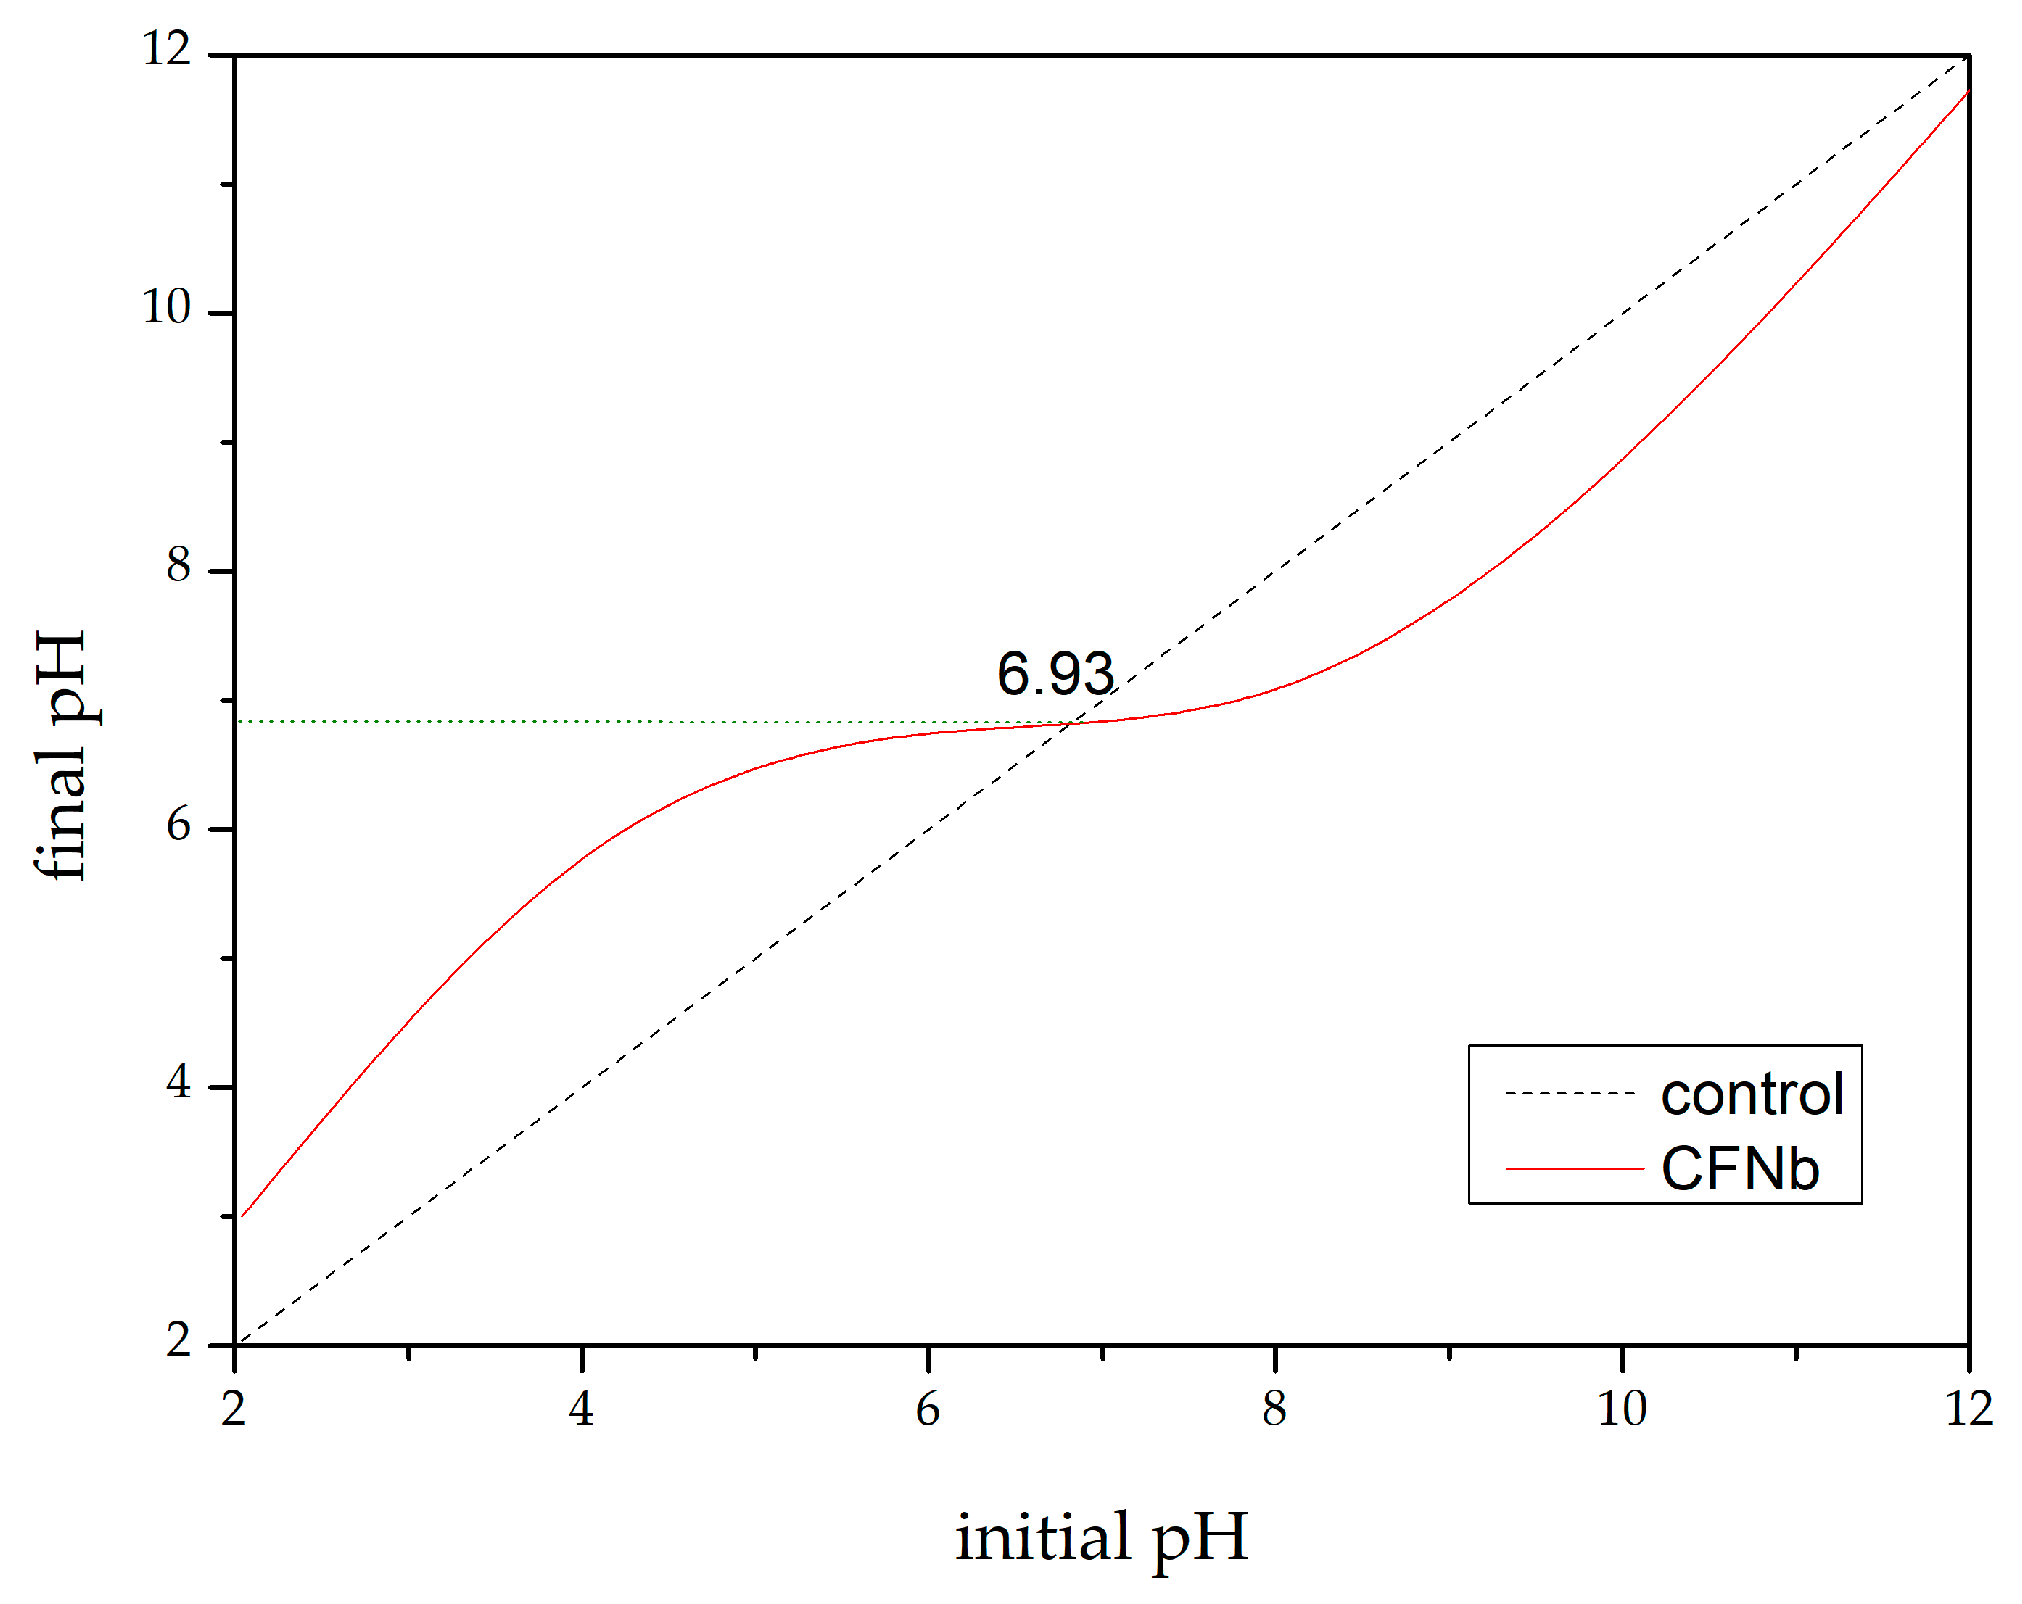
4.3.3. Point of Zero Charge (pHpzc)

Depending on the pH, the catalyst surface may be uncharged, negatively charged (pH > pHPZC), or positively charged (pH < pHPZC) [58]. The isoelectric point, also known as PZC (point of zero charge), is the pH at which the suspended particles have zero net charges and no mobility in the electric field (pHPZC) [8]. From the results of pHPZC, it is possible to notice that CFNb has a pHPZC value of around 6.9, Figure 7. Compared with the literature, the niobium oxide (Nb2O5) calcined at 873 K has 7.22 as a pHPZC value [31]. The cobalt ferrite has the value of pHPZC 7.2 when calcined at 873 K [59]. El-Khawaga et al. (2023) found a value of 6.9 for the pHPCZ, the same found in this work [60].

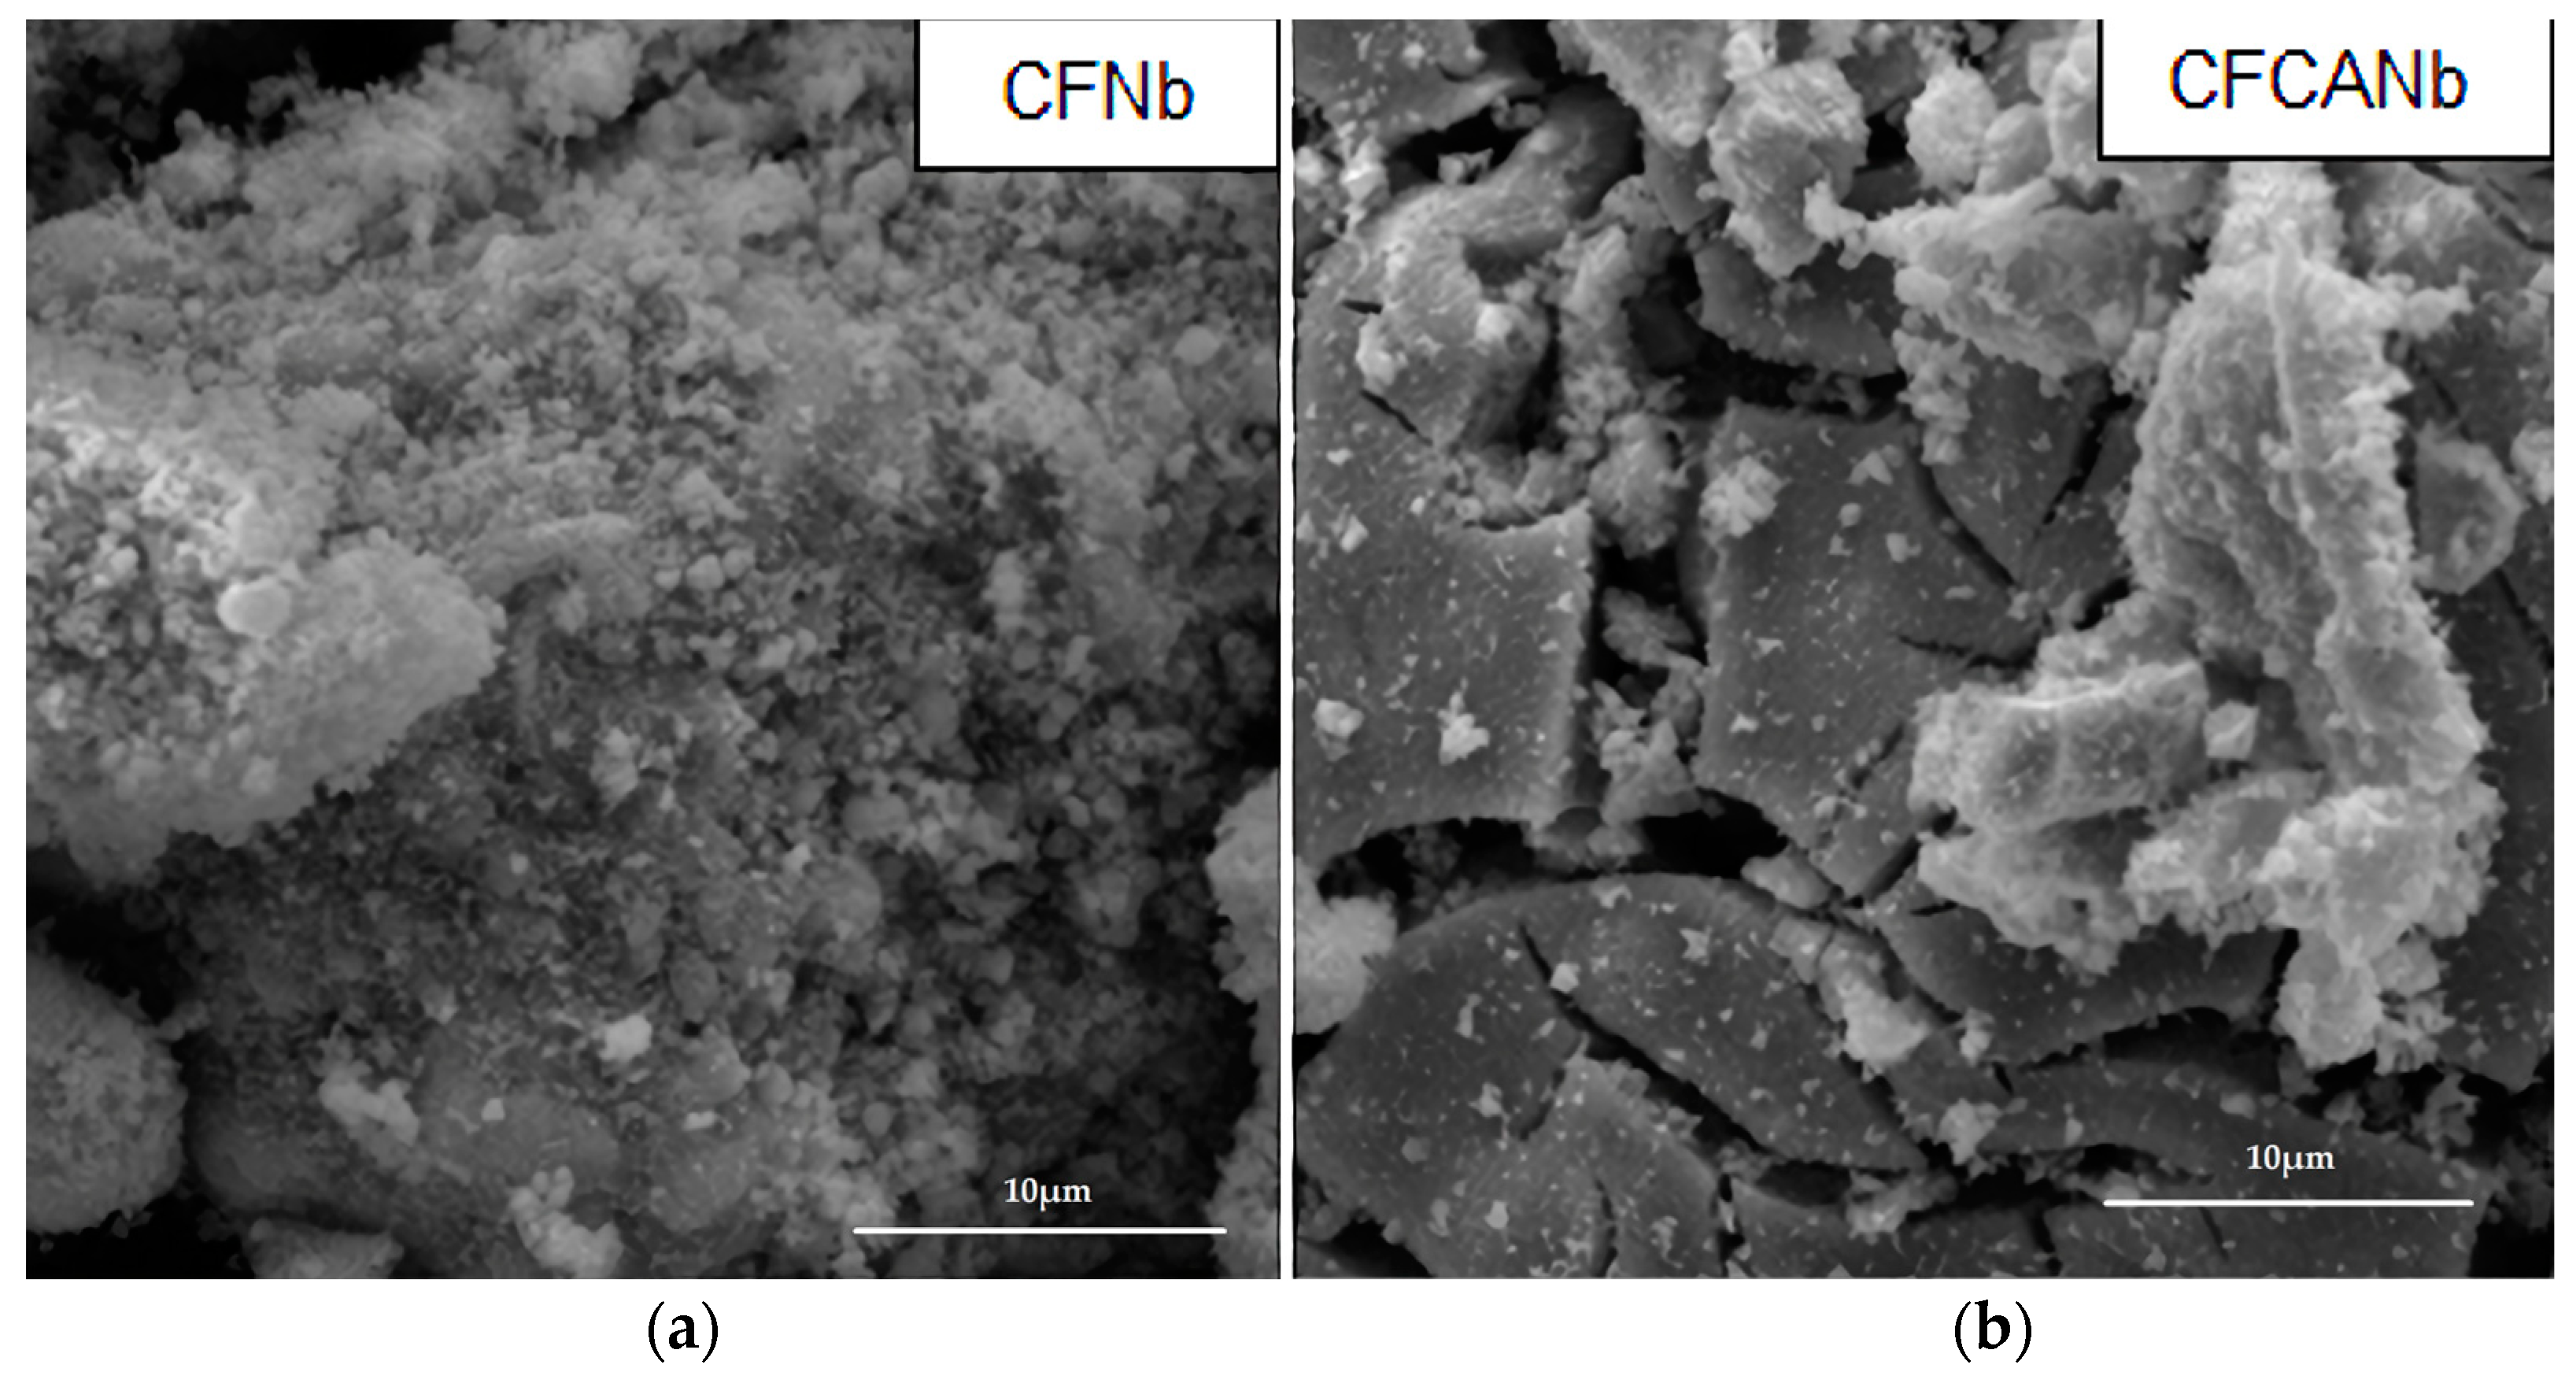
4.3.4. Scanning Electron Microscopy (SEM) and Energy Dispersive Spectroscopy (EDS)

The working principle of the SEM is related to an interaction between electrons and matter. The scanning electron microscope contains a source that generates an electron beam continuously fired in the sample during the test, scanning its surface. Thus, through a detector present in the equipment, it is possible to analyze the electron energies during the interaction between them and the surface, which is interpreted by the equipment and generates images, like in Figure 8, with a 10 µm scale. It is possible to observe clusters of nanomaterials, which are very typical of materials that have magnetic properties [13,23,26,61,62,63]. In addition, it is possible to observe the surface difference of the CFCANb sample, which was produced with commercial citric acid instead, with the tangerine extract. It has a planar surface, possibly because it formed larger clusters (in blocks).
Energy dispersive spectroscopy (EDS), which allows the detection and fraction of chemical elements on the surface, was performed for catalysts CFNb. The fraction of each component is summarized in weight: 33.6% is Oxygen, 27.3% is Iron, 24.8% is Niobium, and 14% is Cobalt.
It should be borne in mind that we expected to obtain the synthesis of nanomaterials of functionalized cobalt ferrite in niobium pentoxide of supposed molecular formula CoFe2O4@Nb2O5 and that the atomic weight of one mole of this component would be about 500.44 u (assuming Co = 58.93 u, Fe = 55.845 u, O = 16 u and Nb = 92.91 u). Recalling that the synthesis was performed with 50% w/w of CoFe2O4 and Nb2O5, the theoretical fraction by weight of each element would be O = 28.68%, Fe = 23.92%, Nb = 34.78%, and Co = 12.62%. These values are considered close to the values obtained. Therefore, it can be considered that CoFe2O4@Nb2O5 was the synthesized material.

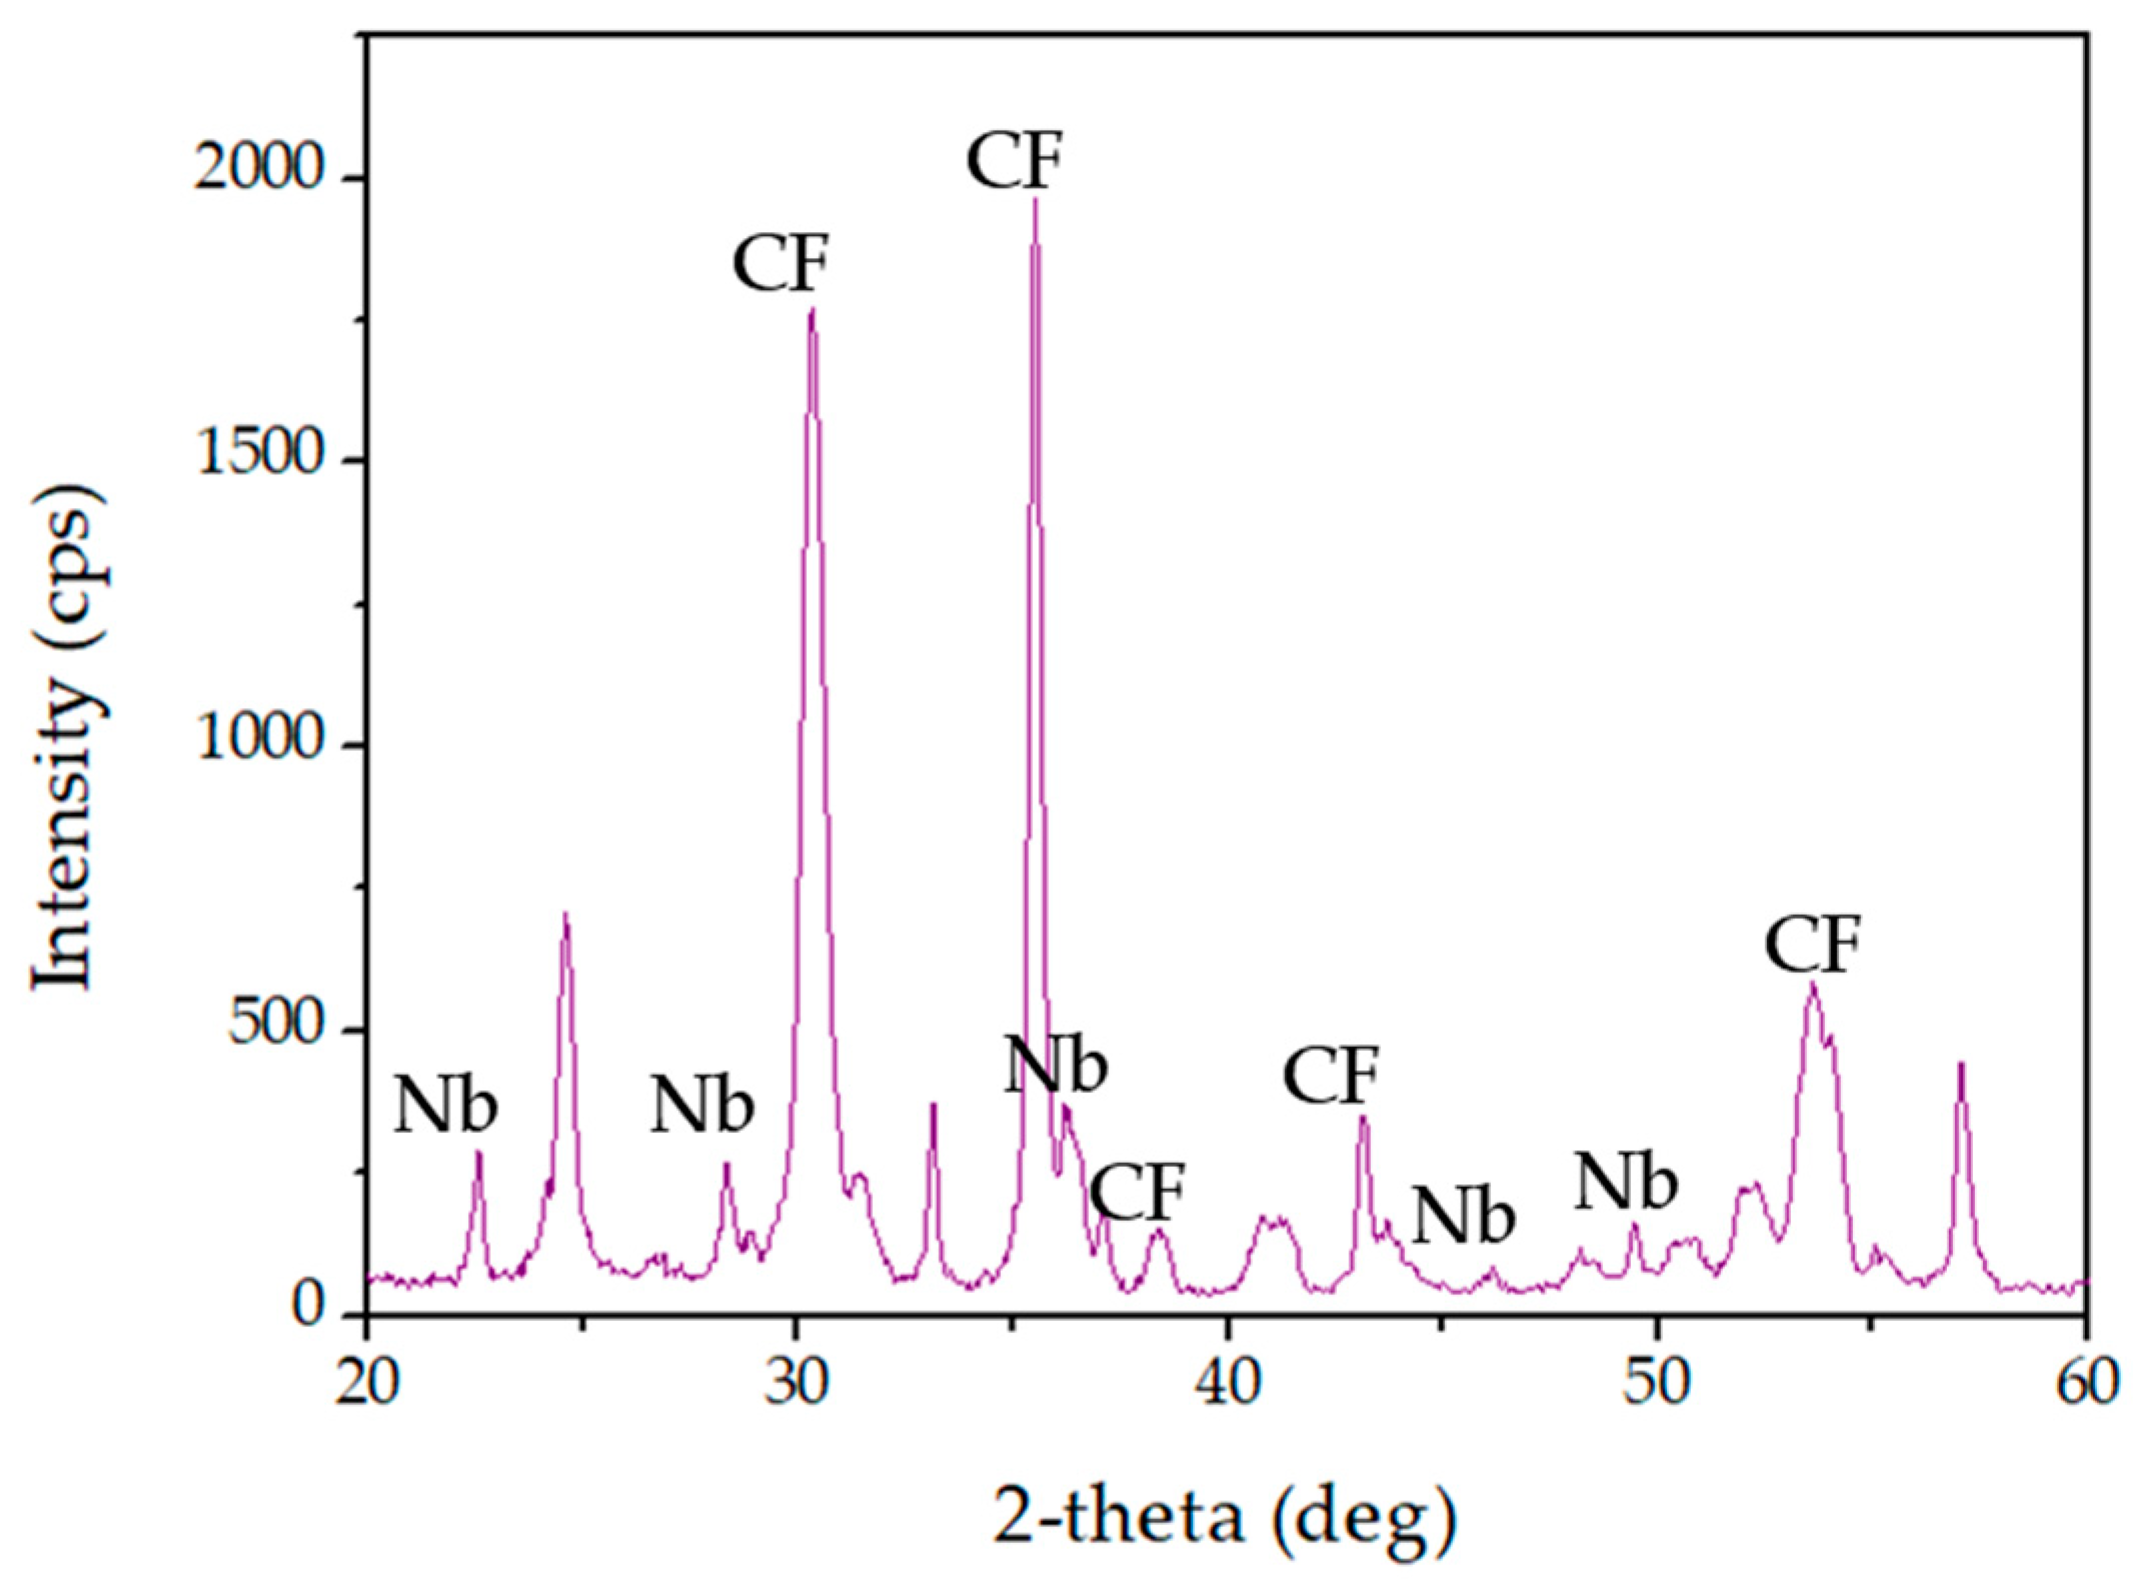
4.3.5. X-ray Diffraction (XRD) Analysis

The interpretation of the XRD analysis of the synthesized samples was done using the standards published by the Joint Committee on Powder Diffraction Standards-International Center for Diffraction Data (JCPDS-ICDD) cards No. 22-1086, No.28-0317 and No.30-0873 that concern cobalt ferrite, pseudo-hexagonal phase (TT-Nb2O5), and orthorhombic phase (T-Nb2O5) of niobium pentoxide, respectively.
According to the standards above, which belong to the face-centered cubic spinel-type (Fd-3m), the cobalt ferrite has an estimated lattice parameter a = b = c = 8.38 Å. In addition, this compound is characterized by having peaks between 2θ = 15° and 70° as follows: 18.289°, 30.085°, 35.438°, 37.057°, 43.059°, 53.446°, 56.975°, and 62.587°, which correspond to the indices of Miller (111), (220), (311), (222), (400), (422), (511), and (440), respectively [19,64,65].
On the other hand, the pseudo-hexagonal and orthorhombic phases of niobium pentoxide have very similar patterns. The TT-Nb2O5 (JCPDS-ICDD 28-0317), with lattice parameters a = 3.607 Å, b = 3.607 Å, c = 3.925 Å; space group: P6/mmm, has the Miller indices (001), (100), (101), (002), (110), (102), and (112) [66,67,68]. The T-Nb2O5 (JCPDS-ICDD 30-0873), with lattice parameters a = 6175 Å, b = 29,175 Å, c = 3930 Å and space group: Pbam, has typical diffraction peaks located at 22.7°, 28.5°, 36.7°, 46.2°, 50.6°, 55.1°, and 71.0°, which correspond to the Miller indices (001), (180), (181), (002), (380), (182), and (382), respectively [52,69,70].
Figure 9 shows the X-ray diffractogram obtained for the samples CFNb. In this figure, the peaks related to ferrite were identified as cobalt and niobium pentoxide, represented by the acronyms CF and Nb, respectively. Comparing the patterns with the obtained results, it is observed that all samples have peaks in the diffraction angles for the mentioned components. Identifying the cobalt ferrite, the peaks appear around 2theta angles of 18.3°, 30.3°, 35.5°, 37.1°, 43.1°, 53.5°, and 62.6°, corresponding to the mentioned pattern. For the identification of niobium pentoxide, peaks for the 2theta angles of 22.6°, 28.4°, 36.4°, 46.2°, 50.2°, 55.2°, and 71.1° were observed, which correspond to the patterns mentioned above. In this way, it is possible to identify that the obtained samples refer to the material of cobalt ferrite functionalized in niobium pentoxide.
One way to better define the structure obtained is by using a characterization refinement to compare lattice parameters, which for each structure has its specificity. Another way is to manually calculate the lattice parameter (a) [71]. The estimated lattice parameters’ values were compared with those established by the cited standards (Table 2). It can be observed that the values of the lattice parameters for cobalt ferrite were very close to the values set as standard. As for niobium pentoxide, the values were more comparable to TT-Nb2O5 than T-Nb2O5, which concerns the pseudo-hexagonal phase, possibly the predominant phase in the material obtained.
Further exploring the results of the XRD characterization, the average crystallite sizes (L) were calculated using Scherrer’s Equation (2), obtaining the size of 24.10 nm for these magnetic nanoparticles.

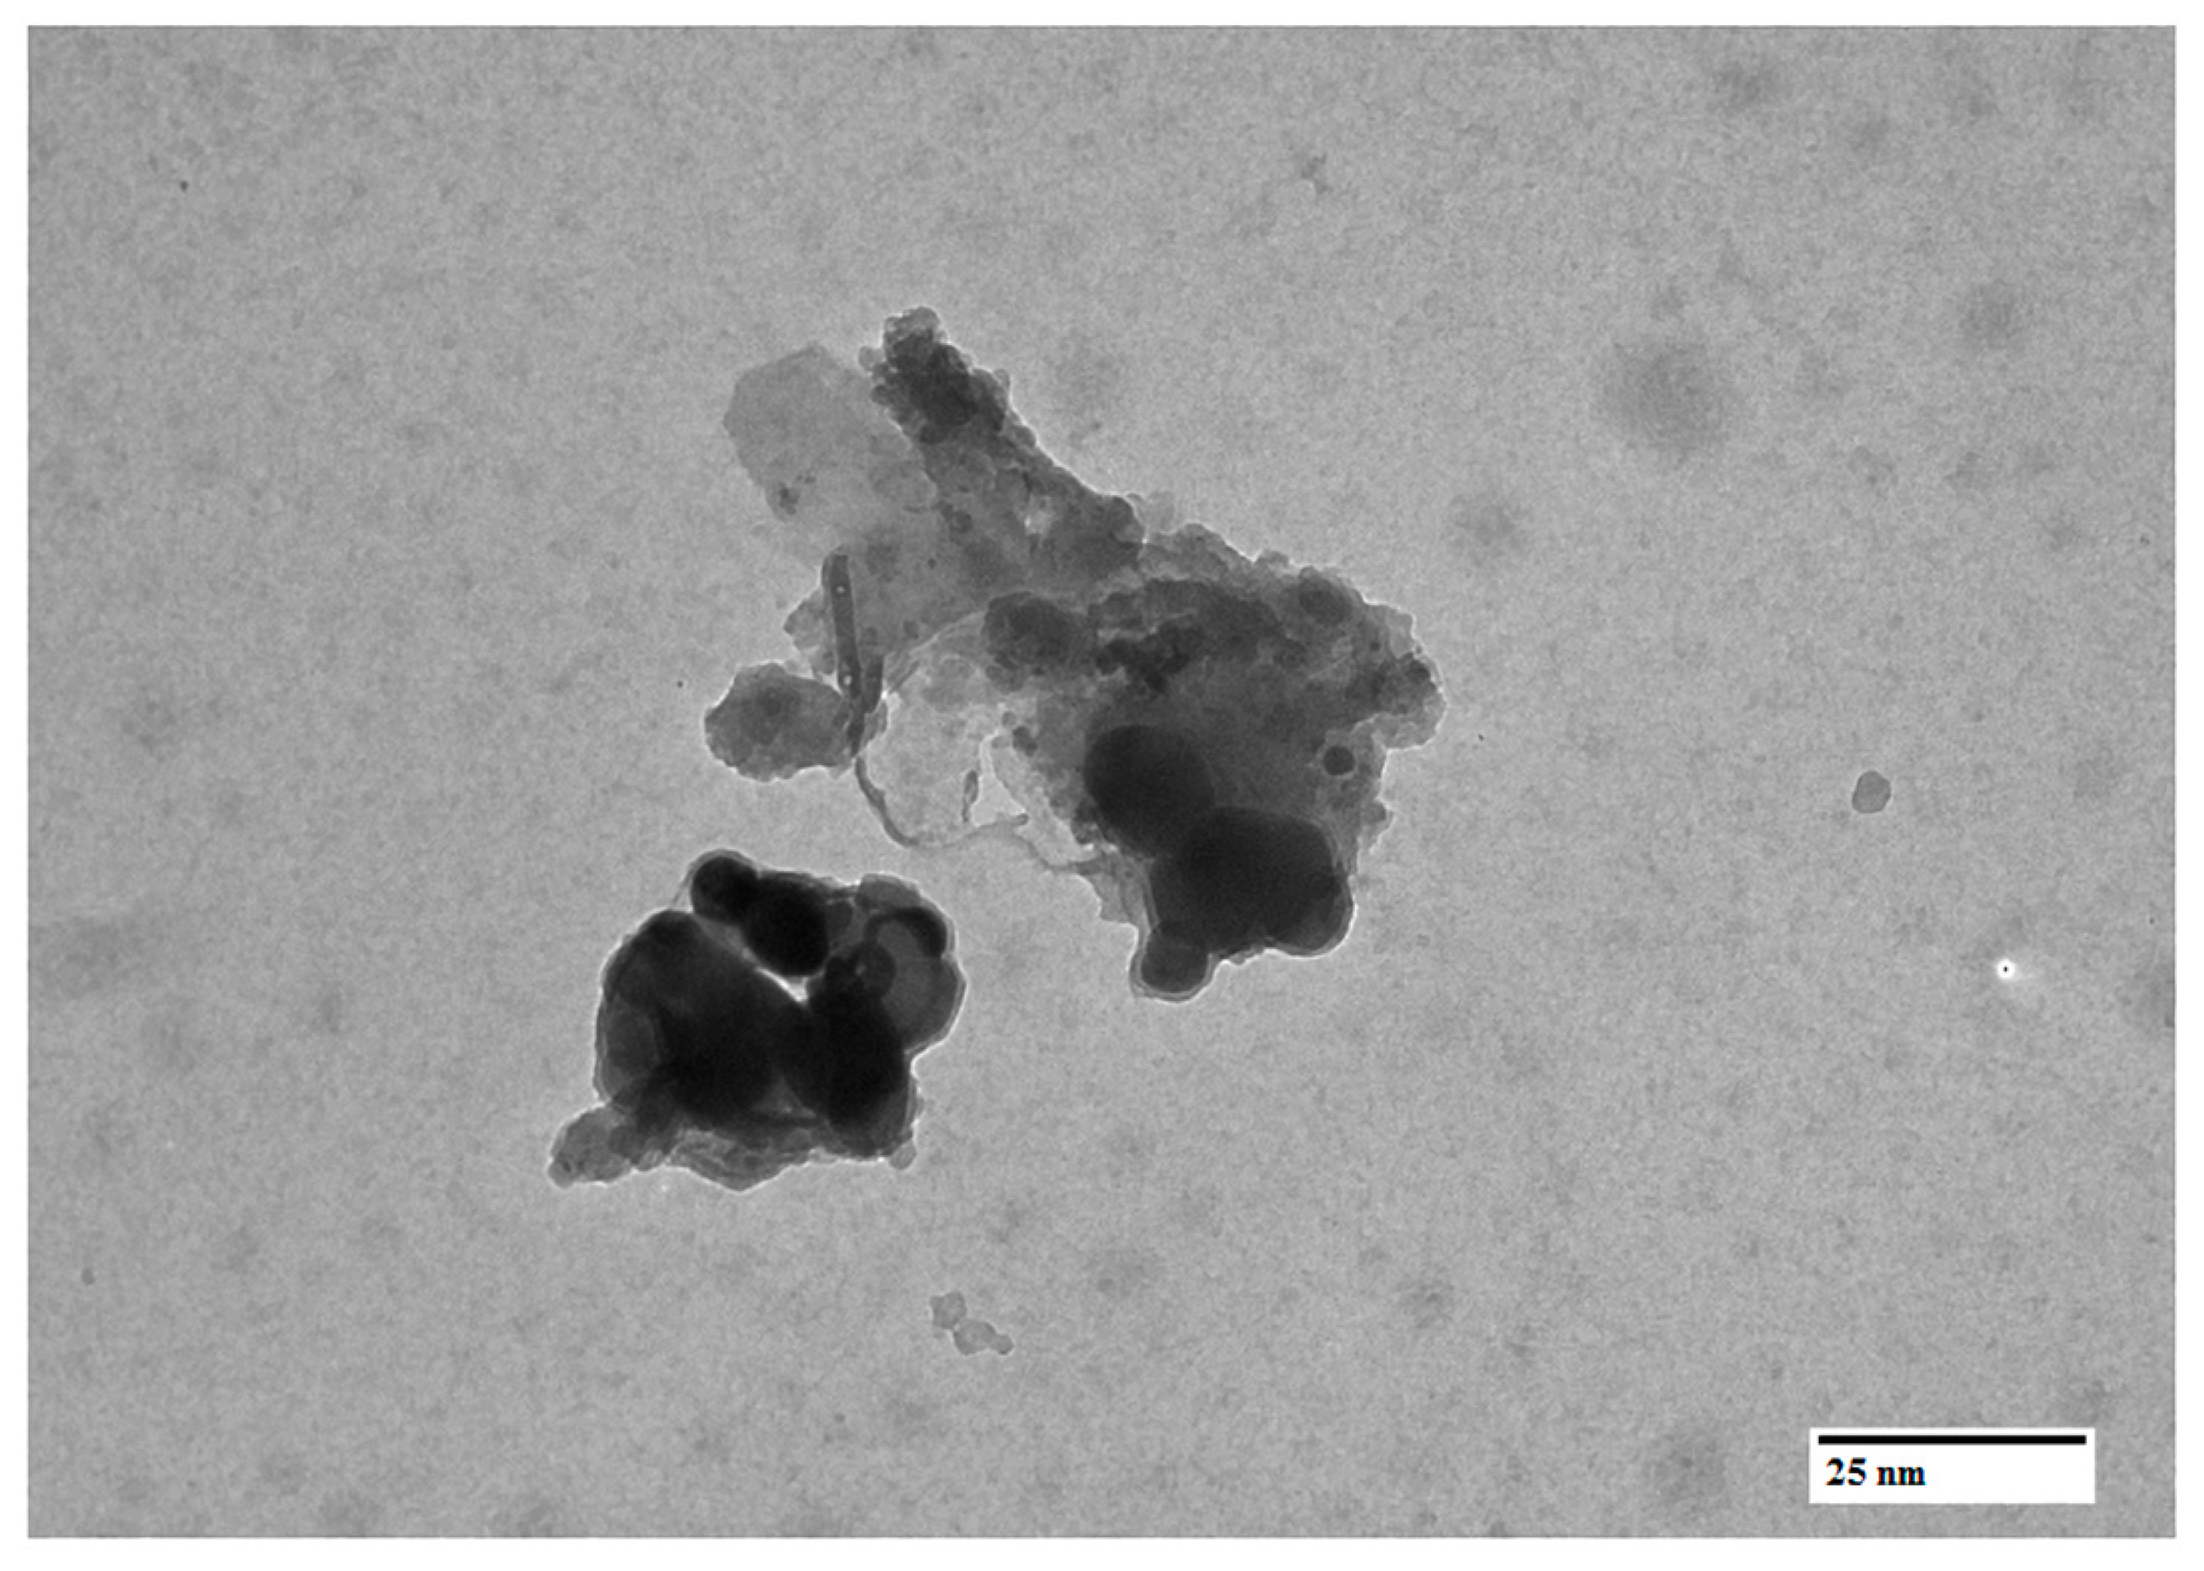
4.3.6. Transmission Electron Microscopy

The TEM image shows the accumulation of the particles, which is a common characteristic of magnetic nanomaterials, Figure 10. The darker round represents the cobalt ferrite involved by the clearer amount (referent to niobium). The nanoparticle does not demonstrate a regular shape, but it is possible to conclude that the cobalt ferrite was synthesized in a niobium oxide structure. Using resources such as ImageJ, to interpret the size of the CFNb particles, the average particle size was calculated to be around 32.9 ± 3.5 nm. The particle average size value is close to that found by XRD. Furthermore, according to the literature, the average size of the cobalt ferrite synthesized by citrate at 873 K can be around 21 and 36 nm [72,73].

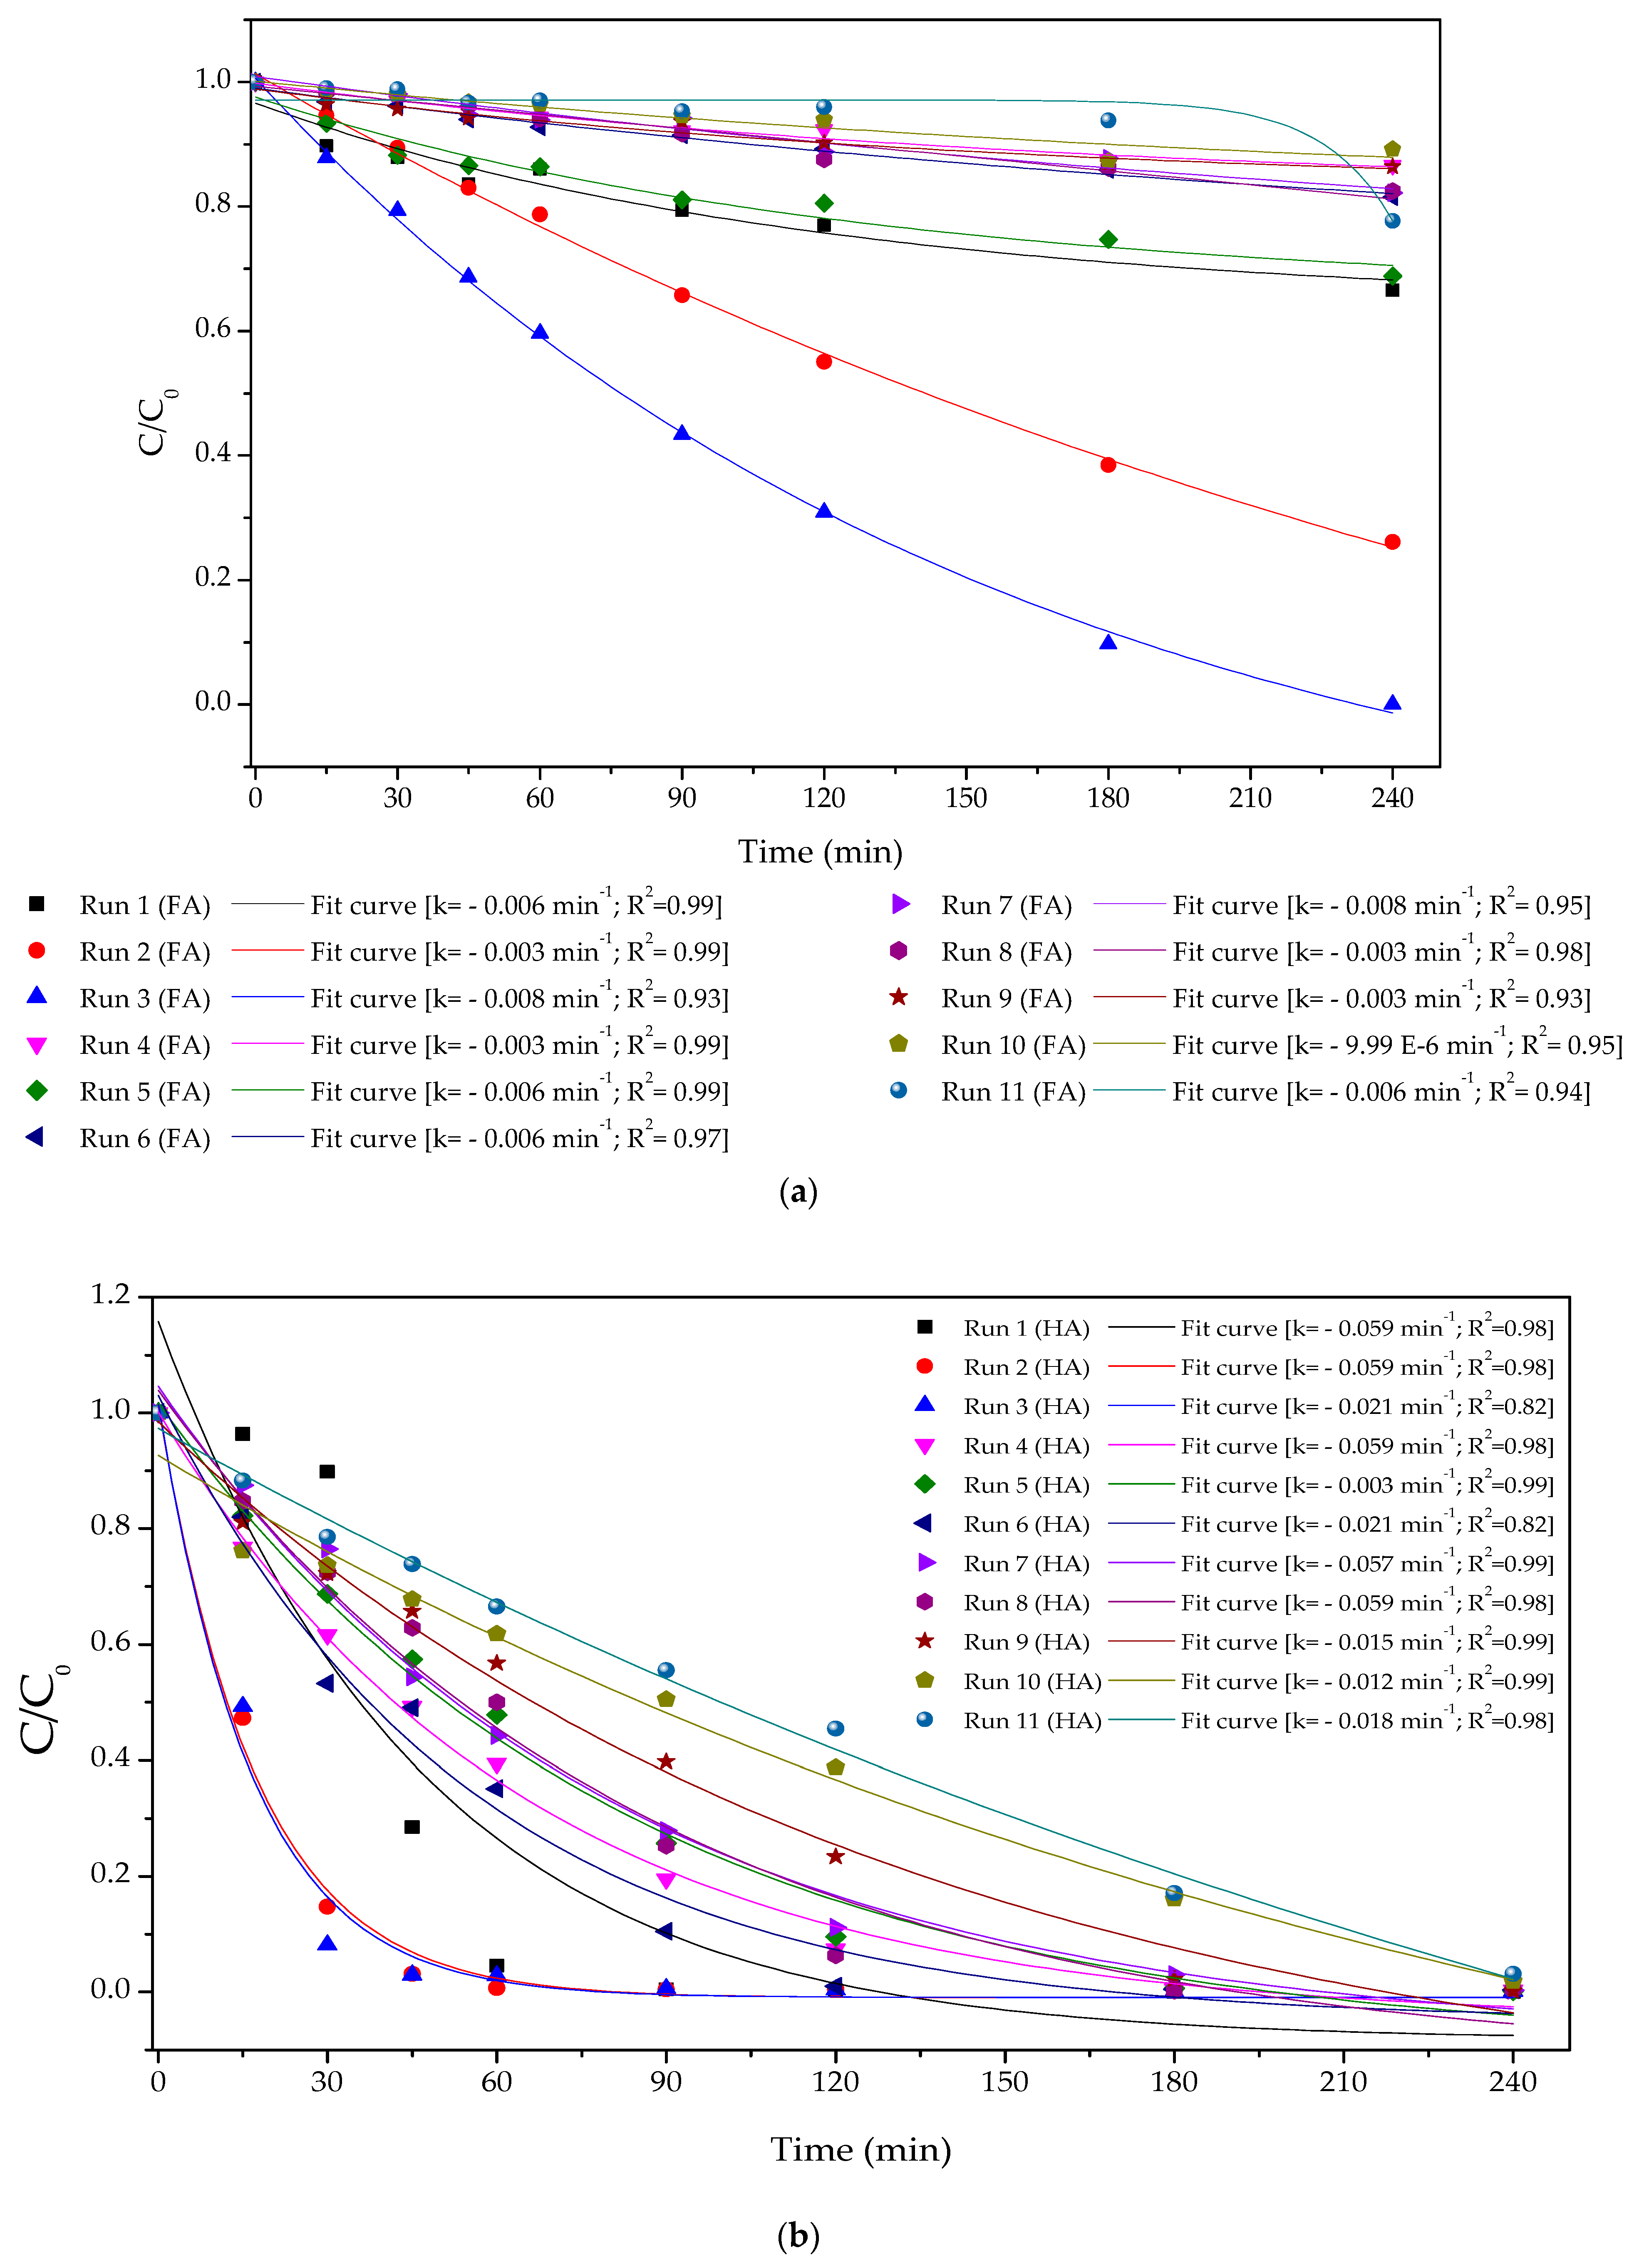
4.3.7. Photocatalysis

The tests were performed with a mercury vapor lamp of 250 W power and radiation measuring around 28 ± 2 mW·cm−2. The preliminary test was conducted with 200 mL paracetamol solution 20 ppm, catalyst concentration 300 mg·L−1, and pH 6.17 (without adjustment). This way, the paracetamol removal was just 2%.
Given the preliminary test result, we decided to perform the catalytic process with some additives to optimize the results. Thus, we chose to use 0.01 mol·L−1 formic acid (FA) [74] and 0.01 mol·L−1 NaOH for pH adjustment. The variation in catalyst concentration remained between 100 and 500 mg·L−1 because, as the catalyst is dark (tends to be black), adding too much catalyst would darken the solution, can impair the radiation effect, and decrease the efficiency of the photocatalytic process. The results were exciting but needed to be more satisfactory. This way, the conditions of planned runs (Table 1) were performed using hydrochloric acid (HA) to pH adjust. Both results were registered in Table 3 at two critical times for each. Figure 11 graphs (a) and (b) registered all the tests executed and the PCT removal over time.
The results using formic acid to pH adjustment cannot be the better alternative, evidenced by the mechanism reaction study. The FA can be competitive with paracetamol using the hydroxyl. radical (HO•) to ozonization itself [75], Figure 12. However, to obtain more efficient degradation, the HA to pH adjustment is correct.
According to the possible mechanisms proposed by Mukherjee et al., the degradation of the contaminant by photocatalysis would be caused by both the direct action of the photogenerated electron(e-)/hole (h+), which reduce/oxidize adsorbed molecules, and the attack of radicals generated during photocatalysis [31,76], Figure 13.
Previous studies indicate that photocatalytic degradation strongly depends on HO• radicals. The PCT can be oxidized by the photocatalyst holes (hvb+) and by HO• radicals, with greater emphasis on the latter [31,77,78], according to the mechanism in the Figure 14. The emerging pollutant PCT has a lot of intermediates before complete degradation.
Given the results obtained using HA for different catalyst concentrations, it was possible to observe, using the Pareto diagram, that the catalyst concentration also influences the PCT degradation, but only the pH effect is significant, Figure 15a. The contour plot confirms this response, showing that the lower the pH, the better the PCT degradation, Figure 15b.
The comparative performance between CFNb, CFext, and Nb600, was performed like Run 2 conditions (pH 2.59, catalyst concentration 441.42 mg·L−1) due to this condition having the total PCT degradation lightly before that of others. After 60 min of reaction, the PCT degradation was 97.5%, 96.5%, and 90.2% to CFNb, CFext, and NB600, respectively, Figure 16. The performance of the CFNb is similar to the Nb600. Still, the advantage of using the CFNb is regarding recovery after the reaction, which can be reobtained for reuse several times or just separated from the supernatant for discarding.
After 60 min of reaction, the PCT degradation was 97.5%, 96.5%, and 90.2% to CFNb, CFext, and NB600, respectively (Figure 17). In this way, the reuse performance of this catalyst is expressive and efficient.

5. Conclusions

The new methodology via green synthesis can be used to synthesize magnetic nanoparticles easily and quickly. The methodology developed, and the combination of elements considered was worthy of a patent attempt for the method and product obtained. Among the various advantages of synthesis, the reuse of biomass residues, the low cost of obtaining the material, and the added value to a richly available component in Brazil (niobium) stand out. The catalytic nanomaterials were active in the studied photocatalytic reaction of acetaminophen degradation. Several experiments allowed the finding of the optimal operating conditions: using hydrochloric acid to adjust the pH, catalyst concentration between 100 mg·L−1 and 500 mg·L−1, and mercury vapor lamp power of 250 W. Under these conditions, the proposed catalysts can achieve the objective of finding photocatalysis conditions that would totally degrade the emerging pollutant paracetamol.

6. Patents

BR 102021000031-7 A2.
Deposit Date: 04/01/2021.
National Publication Date: 07/12/2022.
Title: PROCESSO DE OBTENÇÃO DE NANOPARTÍCULAS MAGNÉTICAS A PARTIR DE CASCAS DE FRUTAS VIA SÍNTESE VERDE E PRODUTOS OBTIDOS.
Depositor(s): UNIVERSIDADE TECNOLOGICA FEDERAL DO PARANA.
Inventor(s): JESSICA DO ROCIO DE PAULA DE OLIVEIRA; GIANE GONÇALVES LENZI; HELDER TEIXEIRA GOMES; JOSÉ LUIS DIAZ DE TUESTA.

Author Contributions

Conceptualization, J.R.P.O.; methodology and investigation J.R.P.O., J.S.N., E.A., and L.S.R.; validation J.R.P.O., G.G.L., J.L.D.d.T., A.M.T., and H.T.G.; and writing—review and editing J.R.P.O. and G.G.L. All authors have read and agreed to the published version of the manuscript.

Funding

This research is funded by Base Funding of CIMO (UIDB/00690/2020) through FEDER under Program PT2020.

Institutional Review Board Statement

Not applicable.

Informed Consent Statement

Not applicable.

Data Availability Statement

The data used to support the findings of this study are included within the article.

Acknowledgments

The authors are thankful to the Brazilian agencies CAPES for financial support of this work, Brazilian Mining and Metallurgy Company—CBMM and Analysis Center laboratory of UTFPR-PG (C2MMa) and UTFPR-PB (CA).

Conflicts of Interest

The authors declare no conflict of interest.

References

  1. van Santen, R.A. Theoretical Heterogeneous Catalysis; World Scientific: Singapore, 1991; Volume 5, ISBN 9810203845. [Google Scholar]
  2. Bhaduri, S.; Mukesh, D. Homogeneous Catalysis: Mechanisms and Industrial Applications, 1st ed.; Wiley Interscience: New York, NY, USA, 2000; ISBN 0471372218. [Google Scholar]
  3. Ertl, G.; Knözinger, H.; Schüth, F.; Weitkamp, J. Handbook of Heterogeneous Catalysis; Wiley: Weinheim, Germany, 2008; Volume 1, ISBN 9783527312412. [Google Scholar]
  4. Ross, J.R.H. Heterogeneuos Catalysis: Fundamentals and Applications, 1st ed.; Elsevier: Amsterdam, The Netherlands, 2011; ISBN 978-0-444-53363-0. [Google Scholar]
  5. Dupont, J. A Catálise No Brasil Nos Últimos 25 Anos: Uma História de Sucesso. Quim. Nova 2002, 25, 12–13. [Google Scholar] [CrossRef] [Green Version]
  6. Ameta, R.; Ameta, S.C. Nanoparticles and Catalysis, 1st ed.; Astruc, D., Ed.; Wiley: Weinheim, Germany, 2007; ISBN 9783527315727. [Google Scholar]
  7. Ribeiro, R.S.; Silva, A.M.T.; Figueiredo, J.L.; Faria, J.L.; Gomes, H.T. The Role of Cobalt in Bimetallic Iron-Cobalt Magnetic Carbon Xerogels Developed for Catalytic Wet Peroxide Oxidation. Catal. Today 2017, 296, 66–75. [Google Scholar] [CrossRef] [Green Version]
  8. Faraji, M.; Yamini, Y.; Rezaee, M. Magnetic Nanoparticles: Synthesis, Stabilization, Functionalization, Characterization, and Applications. J. Iran. Chem. Soc. 2010, 7, 1–37. [Google Scholar] [CrossRef]
  9. Jessica, R.P. Oliveira Development and Functionalization of Magnetic Nanocomposites for Cancer Treatment. Master’s Thesis, Instituto Politécnico de Bragança, Bragança, Portugal, 2017. [Google Scholar]
  10. United States Environmental Protection Agency. Basics of Green Chemistry. Available online: https://www.epa.gov/greenchemistry/basics-green-chemistry#:~:text=Definition (accessed on 8 May 2023).
  11. Anastas, P.; Warner, J. 12 Principles of Green Chemistry. Available online: https://www.acs.org/content/acs/en/greenchemistry/principles/12-principles-of-green-chemistry.html (accessed on 8 May 2023).
  12. Kharissova, O.V.; Kharisov, B.I.; Oliva González, C.M.; Méndez, Y.P.; López, I. Greener Synthesis of Chemical Compounds and Materials. R. Soc. Open Sci. 2019, 6, 191378. [Google Scholar] [CrossRef] [Green Version]
  13. Makarov, V.V.; Makarova, S.S.; Love, A.J.; Sinitsyna, O.V.; Dudnik, A.O.; Yaminsky, I.V.; Taliansky, M.E.; Kalinina, N.O. Biosynthesis of Stable Iron Oxide Nanoparticles in Aqueous Extracts of Hordeum Vulgare and Rumex Acetosa Plants. Langmuir 2014, 30, 5982–5988. [Google Scholar] [CrossRef]
  14. Durmuş, A.; Çolak, H.; Karaköse, E. Production and Examination of ZnO Thin Film for First Time Using Green Synthesized Method from Aqueous Citrus Reticulata Peel Extract. J. Alloys Compd. 2019, 809, 151813. [Google Scholar] [CrossRef]
  15. Rueda, D.; Arias, V.; Zhang, Y.; Cabot, A.; Agudelo, A.C.; Cadavid, D. Low-Cost Tangerine Peel Waste Mediated Production of Titanium Dioxide Nanocrystals: Synthesis and Characterization. Environ. Nanotechnol. Monit. Manag. 2020, 13, 100285. [Google Scholar] [CrossRef]
  16. Gingasu, D.; Mindru, I.; Patron, L.; Calderon-Moreno, J.M.; Mocioiu, O.C.; Preda, S.; Stanica, N.; Nita, S.; Dobre, N.; Popa, M.; et al. Green Synthesis Methods of CoFe2O4 and Ag-CoFe2O4 Nanoparticles Using Hibiscus Extracts and Their Antimicrobial Potential. J. Nanomater. 2016, 2016, 1–12. [Google Scholar] [CrossRef] [Green Version]
  17. Carvalho, F.E.; Lemos, L.V.; Migliano, A.C.C.; Machado, J.P.B.; Pullar, R.C. Structural and Complex Electromagnetic Properties of Cobalt Ferrite (CoFe2O4) with an Addition of Niobium Pentoxide. Ceram. Int. 2018, 44, 915–921. [Google Scholar] [CrossRef]
  18. Rani, M.; Shanker, U. Removal of Chlorpyrifos, Thiamethoxam, and Tebuconazole from Water Using Green Synthesized Metal Hexacyanoferrate Nanoparticles. Environ. Sci. Pollut. Res. 2018, 25, 10878–10893. [Google Scholar] [CrossRef]
  19. Long, N.V.; Yang, Y.; Teranishi, T.; Thi, C.M.; Cao, Y.; Nogami, M. Synthesis and Magnetism of Hierarchical Iron Oxide Particles. Mater. Des. 2015, 86, 797–808. [Google Scholar] [CrossRef]
  20. Rani, B.J.; Ravina, M.; Saravanakumar, B.; Ravi, G.; Ganesh, V.; Ravichandran, S.; Yuvakkumar, R. Ferrimagnetism in Cobalt Ferrite (CoFe2O4) Nanoparticles. Nano-Struct. Nano-Objects 2018, 14, 84–91. [Google Scholar] [CrossRef]
  21. Amiri, M.; Salavati-Niasari, M.; Akbari, A.; Gholami, T. Removal of Malachite Green (a Toxic Dye) from Water by Cobalt Ferrite Silica Magnetic Nanocomposite: Herbal and Green Sol-Gel Autocombustion Synthesis. Int. J. Hydrogen Energy 2017, 42, 24846–24860. [Google Scholar] [CrossRef]
  22. Ribeiro, R.S.; Rodrigues, R.O.; Silva, A.M.T.; Tavares, P.B.; Carvalho, A.M.C.; Figueiredo, J.L.; Faria, J.L.; Gomes, H.T. Hybrid Magnetic Graphitic Nanocomposites towards Catalytic Wet Peroxide Oxidation of the Liquid Effluent from a Mechanical Biological Treatment Plant for Municipal Solid Waste. Appl. Catal. B Environ. 2017, 219, 645–657. [Google Scholar] [CrossRef] [Green Version]
  23. Sonu; Dutta, V.; Sharma, S.; Raizada, P.; Hosseini-Bandegharaei, A.; Kumar Gupta, V.; Singh, P. Review on Augmentation in Photocatalytic Activity of CoFe2O4 via Heterojunction Formation for Photocatalysis of Organic Pollutants in Water. J. Saudi Chem. Soc. 2019, 23, 1119–1136. [Google Scholar] [CrossRef]
  24. Lenzi, G.G.; Lopes, M.F.; Andrade, D.I.; Napoli, J.S.; Parolin, A.; Fávaro, Y.B.; Kounaris Fuziki, M.E.; de Almeida, L.N.B.; Josué, T.G.; Dias, D.T.; et al. Functioned Catalysts with Magnetic Core Applied in Ibuprofen Degradation. Water Sci. Technol. 2021, 84, 2158–2179. [Google Scholar] [CrossRef]
  25. Amiri, M.; Akbari, A.; Ahmadi, M.; Pardakhti, A.; Salavati-Niasari, M. Synthesis and in Vitro Evaluation of a Novel Magnetic Drug Delivery System; Proecological Method for the Preparation of CoFe2O4 Nanostructures. J. Mol. Liq. 2018, 249, 1151–1160. [Google Scholar] [CrossRef]
  26. Shi, Z.; Zeng, Y.; Chen, X.; Zhou, F.; Zheng, L.; Wang, G.; Gao, J.; Ma, Y.; Zheng, L.; Fu, B.; et al. Mesoporous Superparamagnetic Cobalt Ferrite Nanoclusters: Synthesis, Characterization and Application in Drug Delivery. J. Magn. Magn. Mater. 2020, 498, 166222. [Google Scholar] [CrossRef]
  27. Kefeni, K.K.; Mamba, B.B.; Msagati, T.A.M. Magnetite and Cobalt Ferrite Nanoparticles Used as Seeds for Acid Mine Drainage Treatment. J. Hazard. Mater. 2017, 333, 308–318. [Google Scholar] [CrossRef] [PubMed]
  28. Silva, M.K.; Marques, R.G.; Machado, N.R.C.F.; Santos, O.A.A. Evaluation of Nb2O5 and Ag/Nb2O5 in the Photocatalytic Degradation of Dyes from Textile Industries. Braz. J. Chem. Eng. 2002, 19, 359–363. [Google Scholar] [CrossRef]
  29. Castro, D.C.; Cavalcante, R.P.; Jorge, J.; Martines, M.A.U.; Oliveira, L.C.S.; Casagrande, G.A.; Machulek, A., Jr. Synthesis and Characterization of Mesoporous Nb2O5 and Its Application for Photocatalytic Degradation of the Herbicide Methylviologen. J. Braz. Chem. Soc. 2016, 27, 303–313. [Google Scholar] [CrossRef]
  30. Xiang, W.; Han, X.; Astorsdotter, J.; Farrauto, R. Catalysts Promoted with Niobium Oxide for Air Pollution Abatement. Catalysts 2017, 7, 144. [Google Scholar] [CrossRef] [Green Version]
  31. Abreu, E.; Fidelis, M.Z.; Fuziki, M.E.; Malikoski, R.M.; Mastsubara, M.C.; Imada, R.E.; Diaz de Tuesta, J.L.; Gomes, H.T.; Anziliero, M.D.; Baldykowski, B.; et al. Degradation of Emerging Contaminants: Effect of Thermal Treatment on nb2o5 as Photocatalyst. J. Photochem. Photobiol. A Chem. 2021, 419, 113484. [Google Scholar] [CrossRef]
  32. Fidelis, M.; Abreu, E.; Dos Santos, O.; Chaves, E.; Brackmann, R.; Dias, D.; Lenzi, G. Experimental Design and Optimization of Triclosan and 2.8-Diclorodibenzeno-p-Dioxina Degradation by the Fe/Nb2O5/UV System. Catalysts 2019, 9, 343. [Google Scholar] [CrossRef] [Green Version]
  33. Napoleão, D.C.; Elias, L.; Carneiro, M.; De Almeida, J.B.; Vitória, R.; Sales, D.L.; Lins, V. Degradação Do Contaminante Emergente Paracetamol Empregando Processos Oxidativos Avançados. Rev. Eletrônica Gestão Educ. Tecnol. Ambient. 2015, 19, 725–734. [Google Scholar] [CrossRef]
  34. Mitra, D.; Zhou, C.; Bin Hashim, M.H.; Hang, T.M.; Gin, K.Y.-H.; Wang, C.-H.; Neoh, K.G. Emerging Pharmaceutical and Organic Contaminants Removal Using Carbonaceous Waste from Oil Refineries. Chemosphere 2021, 271, 129542. [Google Scholar] [CrossRef]
  35. Yadav, D.; Rangabhashiyam, S.; Verma, P.; Singh, P.; Devi, P.; Kumar, P.; Hussain, C.M.; Gaurav, G.K.; Kumar, K.S. Environmental and Health Impacts of Contaminants of Emerging Concerns: Recent Treatment Challenges and Approaches. Chemosphere 2021, 272, 129492. [Google Scholar] [CrossRef] [PubMed]
  36. Vargas-Berrones, K.; Bernal-Jácome, L.; Díaz de León-Martínez, L.; Flores-Ramírez, R. Emerging Pollutants (EPs) in Latin América: A Critical Review of under-Studied EPs, Case of Study -Nonylphenol-. Sci. Total Environ. 2020, 726, 138493. [Google Scholar] [CrossRef] [PubMed]
  37. Paumo, H.K.; Dalhatou, S.; Katata-Seru, L.M.; Kamdem, B.P.; Tijani, J.O.; Vishwanathan, V.; Kane, A.; Bahadur, I. TiO2 Assisted Photocatalysts for Degradation of Emerging Organic Pollutants in Water and Wastewater. J. Mol. Liq. 2021, 331, 115458. [Google Scholar] [CrossRef]
  38. Pagani, R.N.; Pedroso, B.; dos Santos, C.B.; Picinin, C.T.; Kovaleski, J.L. Methodi Ordinatio 2.0: Revisited under Statistical Estimation, and Presenting FInder and RankIn. Qual. Quant. 2022. [Google Scholar] [CrossRef]
  39. Nava, O.J.; Soto-Robles, C.A.; Gómez-Gutiérrez, C.M.; Vilchis-Nestor, A.R.; Castro-Beltrán, A.; Olivas, A.; Luque, P.A. Fruit Peel Extract Mediated Green Synthesis of Zinc Oxide Nanoparticles. J. Mol. Struct. 2017, 1147, 1–6. [Google Scholar] [CrossRef]
  40. Oliveira, J.; Rodrigues, R.; Barros, L.; Ferreira, I.; Marchesi, L.; Koneracka, M.; Jurikova, A.; Zavisova, V.; Gomes, H. Carbon-Based Magnetic Nanocarrier for Controlled Drug Release: A Green Synthesis Approach. C 2018, 5, 1. [Google Scholar] [CrossRef] [Green Version]
  41. 3P-instrument BET Surface Area. Available online: https://www.3p-instruments.com/measurement-methods/bet-surface-area/#measurement-methods-bet-surface-area. (accessed on 16 December 2020).
  42. Shimadzu ABC’s of Photoacoustic Spectroscopy. Available online: https://www.shimadzu.com/an/service-support/technical-support/analysis-basics/ftirtalk/talk7.html. (accessed on 10 May 2023).
  43. Poghossian, A.A. Determination of the PHpzc of Insulators Surface from Capacitance–Voltage Characteristics of MIS and EIS Structures. Sens. Actuators B Chem. 1997, 44, 551–553. [Google Scholar] [CrossRef]
  44. Ibrahim, I.; Belessiotis, G.V.; Arfanis, M.K.; Athanasekou, C.; Philippopoulos, A.I.; Mitsopoulou, C.A.; Romanos, G.E.; Falaras, P. Surfactant Effects on the Synthesis of Redox Bifunctional V2O5 Photocatalysts. Materials 2020, 13, 4665. [Google Scholar] [CrossRef] [PubMed]
  45. Panalytical, M. X-ray Analysis. Available online: https://www.malvernpanalytical.com/br/products/technology/xray-analysis (accessed on 10 May 2023).
  46. Tan, C.; Gao, N.; Fu, D.; Deng, J.; Deng, L. Efficient Degradation of Paracetamol with Nanoscaled Magnetic CoFe2O4 and MnFe2O4 as a Heterogeneous Catalyst of Peroxymonosulfate. Sep. Purif. Technol. 2017, 175, 47–57. [Google Scholar] [CrossRef]
  47. Bavasso, I.; Poggi, C.; Petrucci, E. Enhanced Degradation of Paracetamol by Combining UV with Electrogenerated Hydrogen Peroxide and Ozone. J. Water Process. Eng. 2020, 34, 101102. [Google Scholar] [CrossRef]
  48. Masudi, A.; Jusoh, N.W.C.; Jusoh, R.; Jaafar, N.F.; Jalil, A.A.; Firdausi, A.; Hartanto, D. Equidistant Crystal Distortion Arrangement of Copper Doped Magnetite for Paracetamol Degradation and Optimization with Response Surface Methodology (RSM). Mater. Chem. Phys. 2020, 250, 122995. [Google Scholar] [CrossRef]
  49. Wang, L.; Bian, Z. Photocatalytic Degradation of Paracetamol on Pd–BiVO4 under Visible Light Irradiation. Chemosphere 2020, 239, 124815. [Google Scholar] [CrossRef]
  50. Falk, G.; Borlaf, M.; López-Muñoz, M.J.; Fariñas, J.C.; Rodrigues Neto, J.B.; Moreno, R. Microwave-Assisted Synthesis of Nb2O5 for Photocatalytic Application of Nanopowders and Thin Films. J. Mater. Res. 2017, 32, 3271–3278. [Google Scholar] [CrossRef]
  51. Li, S.; Xu, Q.; Uchaker, E.; Cao, X.; Cao, G. Comparison of Amorphous, Pseudohexagonal and Orthorhombic Nb2O5 for High-Rate Lithium Ion Insertion. CrystEngComm 2016, 18, 2532–2540. [Google Scholar] [CrossRef] [Green Version]
  52. Zeng, G.-Y.; Wang, H.; Guo, J.; Cha, L.-M.; Dou, Y.-H.; Ma, J.-M. Fabrication of Nb2O5/C Nanocomposites as a High Performance Anode for Lithium Ion Battery. Chin. Chem. Lett. 2017, 28, 755–758. [Google Scholar] [CrossRef]
  53. Ribeiro, R.S.; Gallo, J.; Bañobre-López, M.; Silva, A.M.T.; Faria, J.L.; Gomes, H.T. Enhanced Performance of Cobalt Ferrite Encapsulated in Graphitic Shell by Means of AC Magnetically Activated Catalytic Wet Peroxide Oxidation of 4-Nitrophenol. Chem. Eng. J. 2019, 376, 120012. [Google Scholar] [CrossRef] [Green Version]
  54. Ianoș, R. Highly Sinterable Cobalt Ferrite Particles Prepared by a Modified Solution Combustion Synthesis. Mater. Lett. 2014, 135, 24–26. [Google Scholar] [CrossRef]
  55. Greenwood, N.N.; Earnshaw, A. Chemistry of the Elements, 2nd ed.; Butterworth-Heinemann: Oxford, UK, 1997. [Google Scholar]
  56. Chavarriaga, E.A.; Lopera, A.A.; Franco, V.; Bergmann, C.P.; Alarcón, J. Gel Combustion Synthesis and Magnetic Properties of CoFe2O4, ZnFe2O4, and MgFe2O4 Using 6-Aminohexanoic Acid as a New Fuel. J. Magn. Magn. Mater. 2020, 497, 166054. [Google Scholar] [CrossRef]
  57. Núñez, O.; Sattayamuk, D.; Saelee, T.; Yamashita, H.; Kuwahara, Y.; Mori, K.; Praserthdam, P.; Praserthdam, S. A Closer Look inside TiO2 (P25) Photocatalytic CO2/HCO3 Reduction with Water. Methane Rate and Selectivity Enhancements. Chem. Eng. J. 2021, 409, 128141. [Google Scholar] [CrossRef]
  58. Bolzon, L.B.; Prado, A.G.S. Effect of Protonation and Deprotonation on Surface Charge Density of Nb2O5. J. Therm. Anal. Calorim. 2011, 106, 427–430. [Google Scholar] [CrossRef]
  59. Miri, A.; Sarani, M.; Najafidoust, A.; Mehrabani, M.; Zadeh, F.A.; Varma, R.S. Photocatalytic Performance and Cytotoxic Activity of Green-Synthesized Cobalt Ferrite Nanoparticles. Mater. Res. Bull. 2022, 149, 111706. [Google Scholar] [CrossRef]
  60. El-Khawaga, A.M.; Elsayed, M.A.; Fahim, Y.A.; Shalaby, R.E. Promising Photocatalytic and Antimicrobial Activity of Novel Capsaicin Coated Cobalt Ferrite Nanocatalyst. Sci. Rep. 2023, 13, 5353. [Google Scholar] [CrossRef]
  61. Huang, L.; Weng, X.; Chen, Z.; Megharaj, M.; Naidu, R. Green Synthesis of Iron Nanoparticles by Various Tea Extracts: Comparative Study of the Reactivity. Spectrochim. Acta Part A Mol. Biomol. Spectrosc. 2014, 130, 295–301. [Google Scholar] [CrossRef] [PubMed]
  62. Harshiny, M.; Iswarya, C.N.; Matheswaran, M. Biogenic Synthesis of Iron Nanoparticles Using Amaranthus Dubius Leaf Extract as a Reducing Agent. Powder Technol. 2015, 286, 744–749. [Google Scholar] [CrossRef]
  63. Machado, S.; Pacheco, J.G.; Nouws, H.P.A.; Albergaria, J.T.; Delerue-Matos, C. Characterization of Green Zero-Valent Iron Nanoparticles Produced with Tree Leaf Extracts. Sci. Total Environ. 2015, 533, 76–81. [Google Scholar] [CrossRef] [Green Version]
  64. Purnama, B.; Wijayanta, A.T. Suharyana Effect of Calcination Temperature on Structural and Magnetic Properties in Cobalt Ferrite Nano Particles. J. King Saud Univ. Sci. 2019, 31, 956–960. [Google Scholar] [CrossRef]
  65. Sajjia, M.; Oubaha, M.; Prescott, T.; Olabi, A.G. Development of Cobalt Ferrite Powder Preparation Employing the Sol–Gel Technique and Its Structural Characterization. J. Alloys Compd. 2010, 506, 400–406. [Google Scholar] [CrossRef]
  66. Liu, M.; Xue, D. Large-Scale Fabrication of H2(H2O)Nb2O6 and Nb2O5 Hollow Microspheres. Mater. Res. Bull. 2010, 45, 333–338. [Google Scholar] [CrossRef] [Green Version]
  67. He, J.; Hu, Y.; Wang, Z.; Lu, W.; Yang, S.; Wu, G.; Wang, Y.; Wang, S.; Gu, H.; Wang, J. Hydrothermal Growth and Optical Properties of Nb2O5 Nanorod Arrays. J. Mater. Chem. C 2014, 2, 8185–8190. [Google Scholar] [CrossRef]
  68. Morawa Eblagon, K.; Malaika, A.; Ptaszynska, K.; Pereira, M.F.R.; Figueiredo, J.L. Impact of Thermal Treatment of Nb2O5 on Its Performance in Glucose Dehydration to 5-Hydroxymethylfurfural in Water. Nanomaterials 2020, 10, 1685. [Google Scholar] [CrossRef] [PubMed]
  69. Liao, J.; Tan, R.; Kuang, Z.; Cui, C.; Wei, Z.; Deng, X.; Yan, Z.; Feng, Y.; Li, F.; Wang, C.; et al. Controlling the Morphology, Size and Phase of Nb2O5 Crystals for High Electrochemical Performance. Chin. Chem. Lett. 2018, 29, 1785–1790. [Google Scholar] [CrossRef]
  70. Seo, H.; Kim, K.; Kim, J.-H. Spherical Sb Core/Nb2O5-C Double-Shell Structured Composite as an Anode Material for Li Secondary Batteries. Energies 2020, 13, 1999. [Google Scholar] [CrossRef] [Green Version]
  71. Yakubu, A.; Abbas, Z.; Ibrahim, N.; Hashim, M. Effect of Temperature on Structural, Magnetic and Dielectric Properties of Cobalt Ferrite Nanoparticles Prepared via Co-Precipitation Method. Phys. Sci. Int. J. 2015, 8, 1–8. [Google Scholar] [CrossRef]
  72. Maaz, K.; Mumtaz, A.; Hasanain, S.K.; Ceylan, A. Synthesis and Magnetic Properties of Cobalt Ferrite (CoFe2O4) Nanoparticles Prepared by Wet Chemical Route. J. Magn. Magn. Mater. 2007, 308, 289–295. [Google Scholar] [CrossRef] [Green Version]
  73. Gabal, M.A.; Al-Juaid, A.A.; El-Rashed, S.; Hussein, M.A. Synthesis and Characterization of Nano-Sized CoFe 2 O 4 via Facile Methods: A Comparative Study. Mater. Res. Bull. 2017, 89, 68–78. [Google Scholar] [CrossRef]
  74. Fontana, K.B.; Chaves, E.S.; Kosera, V.S.; Lenzi, G.G. Barium Removal by Photocatalytic Process: An Alternative for Water Treatment. J. Water Process. Eng. 2018, 22, 163–171. [Google Scholar] [CrossRef]
  75. Parrino, F.; Camera-Roda, G.; Loddo, V.; Palmisano, G.; Augugliaro, V. Combination of Ozonation and Photocatalysis for Purification of Aqueous Effluents Containing Formic Acid as Probe Pollutant and Bromide Ion. Water Res. 2014, 50, 189–199. [Google Scholar] [CrossRef] [PubMed] [Green Version]
  76. Mukherjee, D.; Ray, A.; Barghi, S. Mechanism of Acetyl Salicylic Acid (Aspirin) Degradation under Solar Light in Presence of a TiO2-Polymeric Film Photocatalyst. Processes 2016, 4, 13. [Google Scholar] [CrossRef] [Green Version]
  77. Abdel-Wahab, A.-M.; Al-Shirbini, A.-S.; Mohamed, O.; Nasr, O. Photocatalytic Degradation of Paracetamol over Magnetic Flower-like TiO2 /Fe2O3 Core-Shell Nanostructures. J. Photochem. Photobiol. A Chem. 2017, 347, 186–198. [Google Scholar] [CrossRef]
  78. Moctezuma, E.; Leyva, E.; Aguilar, C.A.; Luna, R.A.; Montalvo, C. Photocatalytic Degradation of Paracetamol: Intermediates and Total Reaction Mechanism. J. Hazard. Mater. 2012, 243, 130–138. [Google Scholar] [CrossRef]
Figure 1. Word cloud with article keywords.
Magnetochemistry 09 00200 g001
Figure 2. Bibliometric analysis: (a) published year versus relevant publications and (b) relevant publications versus research country.
Magnetochemistry 09 00200 g002
Figure 3. Route to the green synthesis method of functionalized cobalt ferrite in niobium pentoxide: (A) the tangerine peel after sun exposition; (B) the tangerine peel after drying and crushing; (C) the extraction with tangerine peel powder in distilled water; (D) the extract to storage and done to use; (E) mixture of the Co and Fe salts and tangerine peel extract; (F) Addition of the niobium pentoxide in the solution; and (G) Co2Fe3O4@Nb2O5 nanoparticles synthesized.
Magnetochemistry 09 00200 g003
Figure 4. Representation of the photocatalytic chamber and other elements for the photocatalytic reaction created by the research group: (A) photocatalytic chamber; (B) jacketed reactor; (C1) water entering the reactor; (C2) water flow from the reactor; (D) Magnetic stirring; (E) magnetic stirring plate; (F) pump for airflow; and (G) mercury lamp 250 Watts.
Magnetochemistry 09 00200 g004
Figure 5. CFNb nanocatalyst: (a) catalyst recovered for storage after completing step 2 (G) and (b) demonstrating the magnetic properties, all material, including the Falcon tube, is supported by a magnet.
Magnetochemistry 09 00200 g005
Figure 6. Magnetic separation of the catalyst with the approximation of the magnet.
Magnetochemistry 09 00200 g006
Figure 7. pHPZC values calculated by the average of the final pH values which tended to a constant value, the green dotted line in the graph represents the pHpzc value in axis y.
Magnetochemistry 09 00200 g007
Figure 8. Scanning electron microscopy images of the samples: (a) CFNb and (b) CFACNb.
Magnetochemistry 09 00200 g008
Figure 9. Components identification in the diffractogram (cobalt ferrite = CF; niobium pentoxide = Nb).
Magnetochemistry 09 00200 g009
Figure 10. TEM image of CFNb.
Magnetochemistry 09 00200 g010
Figure 11. Preliminary photocatalytic tests for PCT removal with pH adjustment with (a) formic acid (FA) and (b) hydrochloric acid (HA).
Magnetochemistry 09 00200 g011
Figure 12. Formic acid ozonization mechanism.
Magnetochemistry 09 00200 g012
Figure 13. Photocatalytic degradation mechanism in catalyst surface.
Magnetochemistry 09 00200 g013
Figure 14. Mechanism of paracetamol degradation by photocatalysis [77,78].
Magnetochemistry 09 00200 g014
Figure 15. According to DOE proposed (a) a Pareto chart for the degradation of PCT and (b) a Contour plot for the degradation of PCT in 60 min of photocatalysis.
Magnetochemistry 09 00200 g015
Figure 16. Comparison of the performance of CFNb, CFext, and Nb600 catalysts in 60 min of paracetamol degradation.
Magnetochemistry 09 00200 g016
Figure 17. Comparison of the performance of CFNb in the first reaction and the next two reuses.
Magnetochemistry 09 00200 g017
Table 1. Experimental design (codified values in brackets) based on two-factor CCD.
RunpHCatalyst Concentration (mg·L−1)
12.00 (−1.41)300.00 (0.00)
22.59 (−1.00)441.42 (+1.00)
32.59 (−1.00)158.58 (−1.00)
44.00 (0.00)500.00 (+1.41)
54.00 (0.00)300.00 (0.00)
64.00 (0.00)300.00 (0.00)
74.00 (0.00)300.00 (0.00)
84.00 (0.00)100.00 (−1.41)
95.41 (+1.00)441.42 (+1.00)
105.41 (+1.00)158.58 (−1.00)
116.00 (+1.41)300.00 (0.00)
Table 2. Experimental design (codified values in brackets) based on two-factor CCD.
CompoundCalculated LatticeStandard Lattice
CoFe2O48.38 Å8.38 Å
TT-Nb2O53.53 Å3.61 Å
T-Nb2O525.38 Å29.17 Å
Table 3. Results of PCT removal with pH adjustment.
AcidFormic AcidHydrochloric Acid
Reaction Time4 h4 h
RunParacetamol
Removal (%)
Paracetamol
Removal (%)
133100
274100
3100100
413100
531100
618100
718100
818100
914100
101198
112297
Disclaimer/Publisher’s Note: The statements, opinions and data contained in all publications are solely those of the individual author(s) and contributor(s) and not of MDPI and/or the editor(s). MDPI and/or the editor(s) disclaim responsibility for any injury to people or property resulting from any ideas, methods, instructions or products referred to in the content.

