Article

Transformation Pathways of Ferromagnetic Mn-Al-Ga-Ni

Micron School of Materials Science and Engineering, College of Engineering, Boise State University, 1910 University Dr., Boise, ID 83725, USA
*
Authors to whom correspondence should be addressed.
Magnetochemistry 2023, 9(5), 128; https://doi.org/10.3390/magnetochemistry9050128
Submission received: 29 March 2023 / Revised: 9 May 2023 / Accepted: 9 May 2023 / Published: 11 May 2023
(This article belongs to the Special Issue Soft and Hard Magnetic Materials: Latest Advances and Prospects)

Abstract

:
This study investigates the impact of alloying Mn-Al-Ga with 3 at.-% Ni and the stability and formation mechanisms of the τ phase and the resulting magnetic properties. The stabilizing effect of Ga on the τ phase was verified, and the ternary alloy’s magnetization was measured up to M 2 T = 482 k A   m 1 . The phase transformation from γ 2 to τ in ternary Mn-Al-Ga was demonstrated microscopically. The solubility limit of Ni into the τ phase was exceeded at 3 at.-% and a primitive cubic κ phase formed. The Ni addition stabilized the τ phase. The highest magnetization at 2 T for the Mn52Al39.4Ga5.6Ni3 alloy was M 2 T = 416   k A   m 1 . A new transformation pathway was demonstrated by first annealing the Mn-Al-Ga-Ni alloy at 800 °C for 24 h, which forms a nearly single κ phase, which is followed by a second anneal at 500 °C for 24 h at which the τ phase formed with some remaining κ phase. This is a new transformation mechanism since it involves a phase reaction from κ to τ. The energy product of the Mn-Al-Ga-Ni alloy exceeded that of the ternary Mn-Al-Ga alloy by a factor of 4.5. The κ-phase particles in the Mn-Al-Ga-Ni alloy hinder magnetic domain boundary motion, thus providing a method for magnetic hardening and increasing the energy product.

1. Introduction

Mn-Al-X alloys form a ferromagnetic, L10-ordered τ phase. The magnetic properties of Mn-Al alloys have been studied, since both elements are abundant in the earth’s crust and are relatively inexpensive ($4/kg) [1]. Ferromagnetic coupling between Mn atoms occurs when the Mn-Mn atoms are sufficiently distanced apart. The theoretical maximum energy product for Mn-Al is 101 k J   m 3 [2]. Experimental work has reached 37 k J   m 3 [3,4]. Mn-Al compounds are presently being researched as substitutes for lanthanide permanent magnets. Binary Mn-Al alloys generate a metastable tetragonal ferromagnetic τ phase classified by Pearson symbol tP2 (Strukturbericht L10) when properly heat-treated in specific compositions (50–59 at.-% Mn) [2,3,5]. The Mn couples ferromagnetically in Mn-Al when sufficiently distanced apart. Excess Mn occupies the Al sites and couples antiferromagnetically to the Mn positioned at Mn sites. This antiferromagnetic coupling decreases the overall saturation magnetization. Perfectly ordered, alternating planes of Mn and Al maximize the Mn ferromagnetic coupling since there would be no excess Mn to decrease overall magnetization. Pasko et al. studied a range of compositions for the binary Mn-Al system and measured no formation of τ phase for the Mn50Al50 alloy; only non-magnetic γ2 existed. Pasko et al. found that by adjusting the composition to Mn55Al45, the alloy formed a τ phase [6]. For several Mn compounds, the type of magnetic order is controlled by the nearest neighbor distance between Mn atoms, where larger atomic distances result in ferromagnetism and smaller atomic distances often have antiferromagnetic ordering [7]. For the binary Mn-Al system, this suggests that excess Mn at the (1/2,1/2,1/2) site sufficiently strains the lattice for the Mn atoms at the (0,0,0) sites to couple ferromagnetically. The magnetic ordering stabilizes the τ phase. Kono et al. reported the nearest neighbor Mn distance that produces antiferromagnetism as 2.66 Å, and the adjacent Mn-Mn ferromagnetic coupling distance was 2.79 Å [5].
Studies have suggested that the Mn antiferromagnetic coupling could be reduced by replacing excess Mn with elements having small magnetic moments or non-magnetic moments [8,9,10]. However, 3d transition metals (e.g., Co, Fe, and Ni) have large magnetic moments, and the substitution of these elements for excess Mn may decrease the antiferromagnetic coupling and increase the saturation magnetization if ferromagnetic coupling to Mn occurred. The preliminary results from additional alloys we analyzed indicated that Co and Fe significantly reduced the saturation magnetization; therefore, further work was focused on alloying with Ni. The literature has also suggested that coercivity could be improved by the addition of an element such as Ni [11]. Studies on the addition of Ni to Mn-Al report that two magnetic phases, τ and κ, form when annealing at 470 °C [10,12]. The proportion of Ni for this study was selected based on work previously published by Feng and Matsumoto [8,9,13]. Feng added Ni to ternary Mn-Al-C and found that Ni stabilized the τ phase [8]; however, further work by Feng indicated that the Ni solubility limit in the τ phase is reached at 0.6 at.-% Ni [13]. Matsumoto et al. found that adding 3 at.-% of Ni to Mn-Al increased both the saturation magnetization and coercivity and concluded that the τ phase was formed as long as the Ni was less than 7 at.-% for a ternary Mn-Al-Ni alloy [9]. Based on these results, we studied a quaternary alloy with 3 at.-% Ni with the goal to maximize the magnetic moment contribution from the Ni while maintaining as much τ phase as possible by staying within the solubility limit of the τ phase.
Mix et al. demonstrated that Ga additions stabilize the ferromagnetic τ phase in Mn-Al alloys and also found that the non-magnetic γ 2 phase directly transformed into a ferromagnetic τ phase when annealing at 500 °C [14,15]. Zhao, S. et al. investigated ternary Mn-Al-X alloys (X = Cu, Co, and Ga) experimentally and performed first principles computations of Mn-Al-X supercells based on density functional theory and suggested from the resulting energy calculations that the Ga prefers to occupy the (1/2,1/2,1/2) site, while Cu and Co occupy the (0,0,0) sites [16]. Zhao also reported experiments in which Ga additions increased the intrinsic magnetic properties (i.e., Ms, K1, Tc) and improved the stabilization of the τ phase compared to the binary Mn-Al providing supporting evidence of gallium’s preferred site occupancy within the crystal lattice unit cell. Zhao et al. demonstrated for ternary Mn-Al-Ga that the Ga prefers to occupy the (1/2,1/2,1/2) site, and Ga increases the magnetization of the Mn-Al-based alloy by replacing excess Mn [17]. Moze et al. reported that magnetization decreased with the Ga substitution in contrast to studies by Zhao et al. and Mix et al. [14,16,18]. Most recently, Jia et al. reported that the twin boundaries of L10-type permanent magnets negatively impact the energy product and that optimal coercivity is achieved for a grain size within the range of 50–200 nm [19].
This study investigates lanthanide-free permanent magnets composed of Mn-Al-Ga-Ni. These are used to specifically target the gap magnet parameters described by Coey [20] with the intent to increase the energy product. This project builds upon the work of Mix et al. who studied ternary Mn55Al39.4Ga5.6 and reported increased saturation magnetization compared to previously studied binary magnetic Mn-Al and Mn-Ga [3,14]. Additionally, Mix et al. found that by annealing the solidified sample at 500 °C, the volume fraction of ferromagnetic τ phase increased through a phase transformation from γ 2 τ . This direct annealing pathway is atypical of the traditional pathway to form a ferromagnetic τ phase in Mn-Al-based alloys [21]. In this study, we investigated the structural properties, chemical composition, and magnetic properties for the formation of the ferromagnetic τ phase in the ternary Mn-Al-Ga and Ni-added Mn-Al-Ga alloys, and a new τ phase reaction path was identified.

2. Materials and Methods

Low-purity Mn (99.9%, ESPI Metals, Ashland, OR, USA), high-purity Mn (99.999%, Polish Academy of Science, Krakow, Poland), Al (99.9995%, Alfa Aesar, Heysham, Lancashire, UK), Ga (99.9999% American Elements, Los Angeles, CA, USA), and Ni (99.999%, American Elements, Los Angeles, CA, USA) were used in this study. The low-purity Mn easily oxidized, and therefore, a 1.3% nitric acid and aqueous solution was applied to remove the oxide layer prior to alloying. To ensure proper oxide removal prior to induction melting, the weight-to-volume ratio of Mn to the nitric acid solution was maintained at 0.12 g   mL 1 . The Mn was stirred in the nitric acid solution for 3 min. The nitric acid solution was decanted, and the Mn was rinsed with tap water, distilled water, and finally with ethanol for 1 min, respectively. Manganese alloys were produced within 1 h of cleaning to avoid reoxidation of the Mn. Alloys were induction melted in alumina crucibles (99.8% Almath, Newmarket, Suffolk UK 99.6% Advalue Technology, Tuscon, AZ, USA) in a Reitel Induret Compact casting chamber. Once alloys were melted, the induction furnace was held for 2–3 min to allow the induced eddy currents to homogenously mix the molten alloy. The chamber pressure was measured with a differential gauge against ambient pressure. The chamber was evacuated to a pressure of 0.2 bar, filled up to 2 bar with Ar, and again evacuated to 0.2 bar. This was repeated five times. On the fifth cycle, the chamber was finally filled to 1.3 bar of argon. Upon inspection of the alloys, we did not find traces of oxidation and conclude that the system was leak proof. The level of oxygen was further reduced by using an Ar-5% H2 blend for the last purge. It is estimated that no more than 1 ppm of O2 was present in the casting chamber during the melting process.
The mass of each sample after induction melting was approximately 50 g. The nominal compositions are given in atomic percent and presented in Table 1 with the measured masses of constituent elements. The ternary alloy and Mn-Al-Ga-Ni alloy nominal compositions were Mn55Al39.4Ga5.6 and Mn52Al39.4Ga5.6Ni3. Alloy total mass losses were 0.1 g or less.
A master alloy Al73.5Ni26.5 was synthesized to reduce the melting point of the Ni added to the Mn-Al-Ga system to reduce the evaporation of Mn due to its high vapor pressure. Samples were subsequently cut on an Allied TechCut 4 Precision low-speed saw with a diamond metal bonded wafering blade. Alloyed samples were cut to fit inside the quartz encapsulation tubes (99.99%, Advalue Technology). The XRD samples were cut to approximately 10 mm × 10 mm × 4 mm. The VSM samples were cut to approximately 6 mm × 6 mm × 1 mm. Samples were encapsulated with a titanium getter foil in quartz glass tubes, purged five times with argon between 0.25 and 2 bar and filled to 1.0 bar in the final cycle.

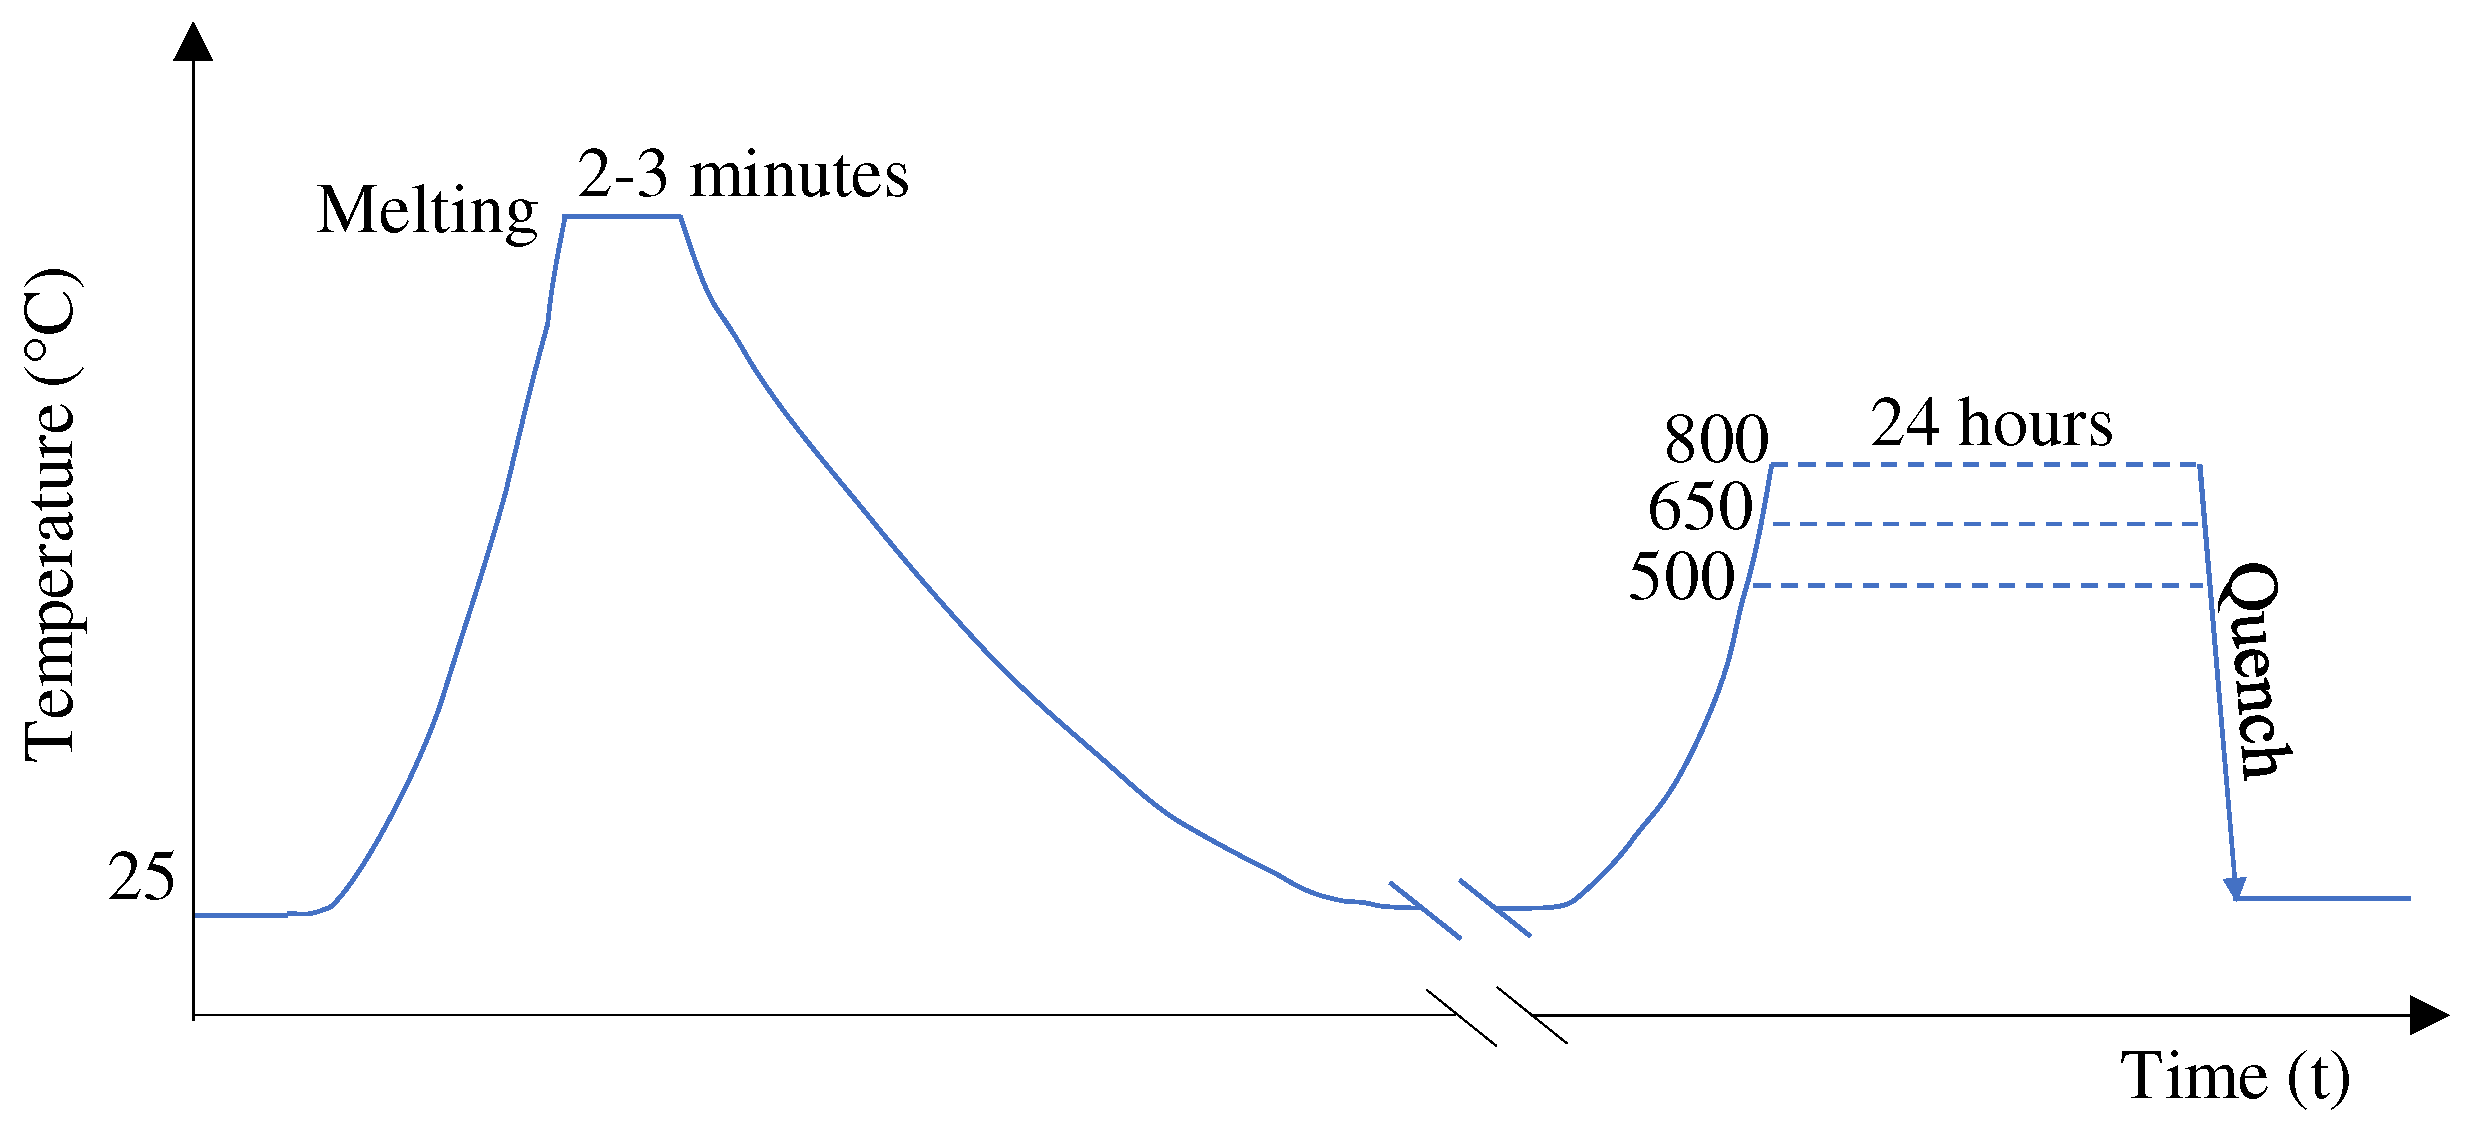
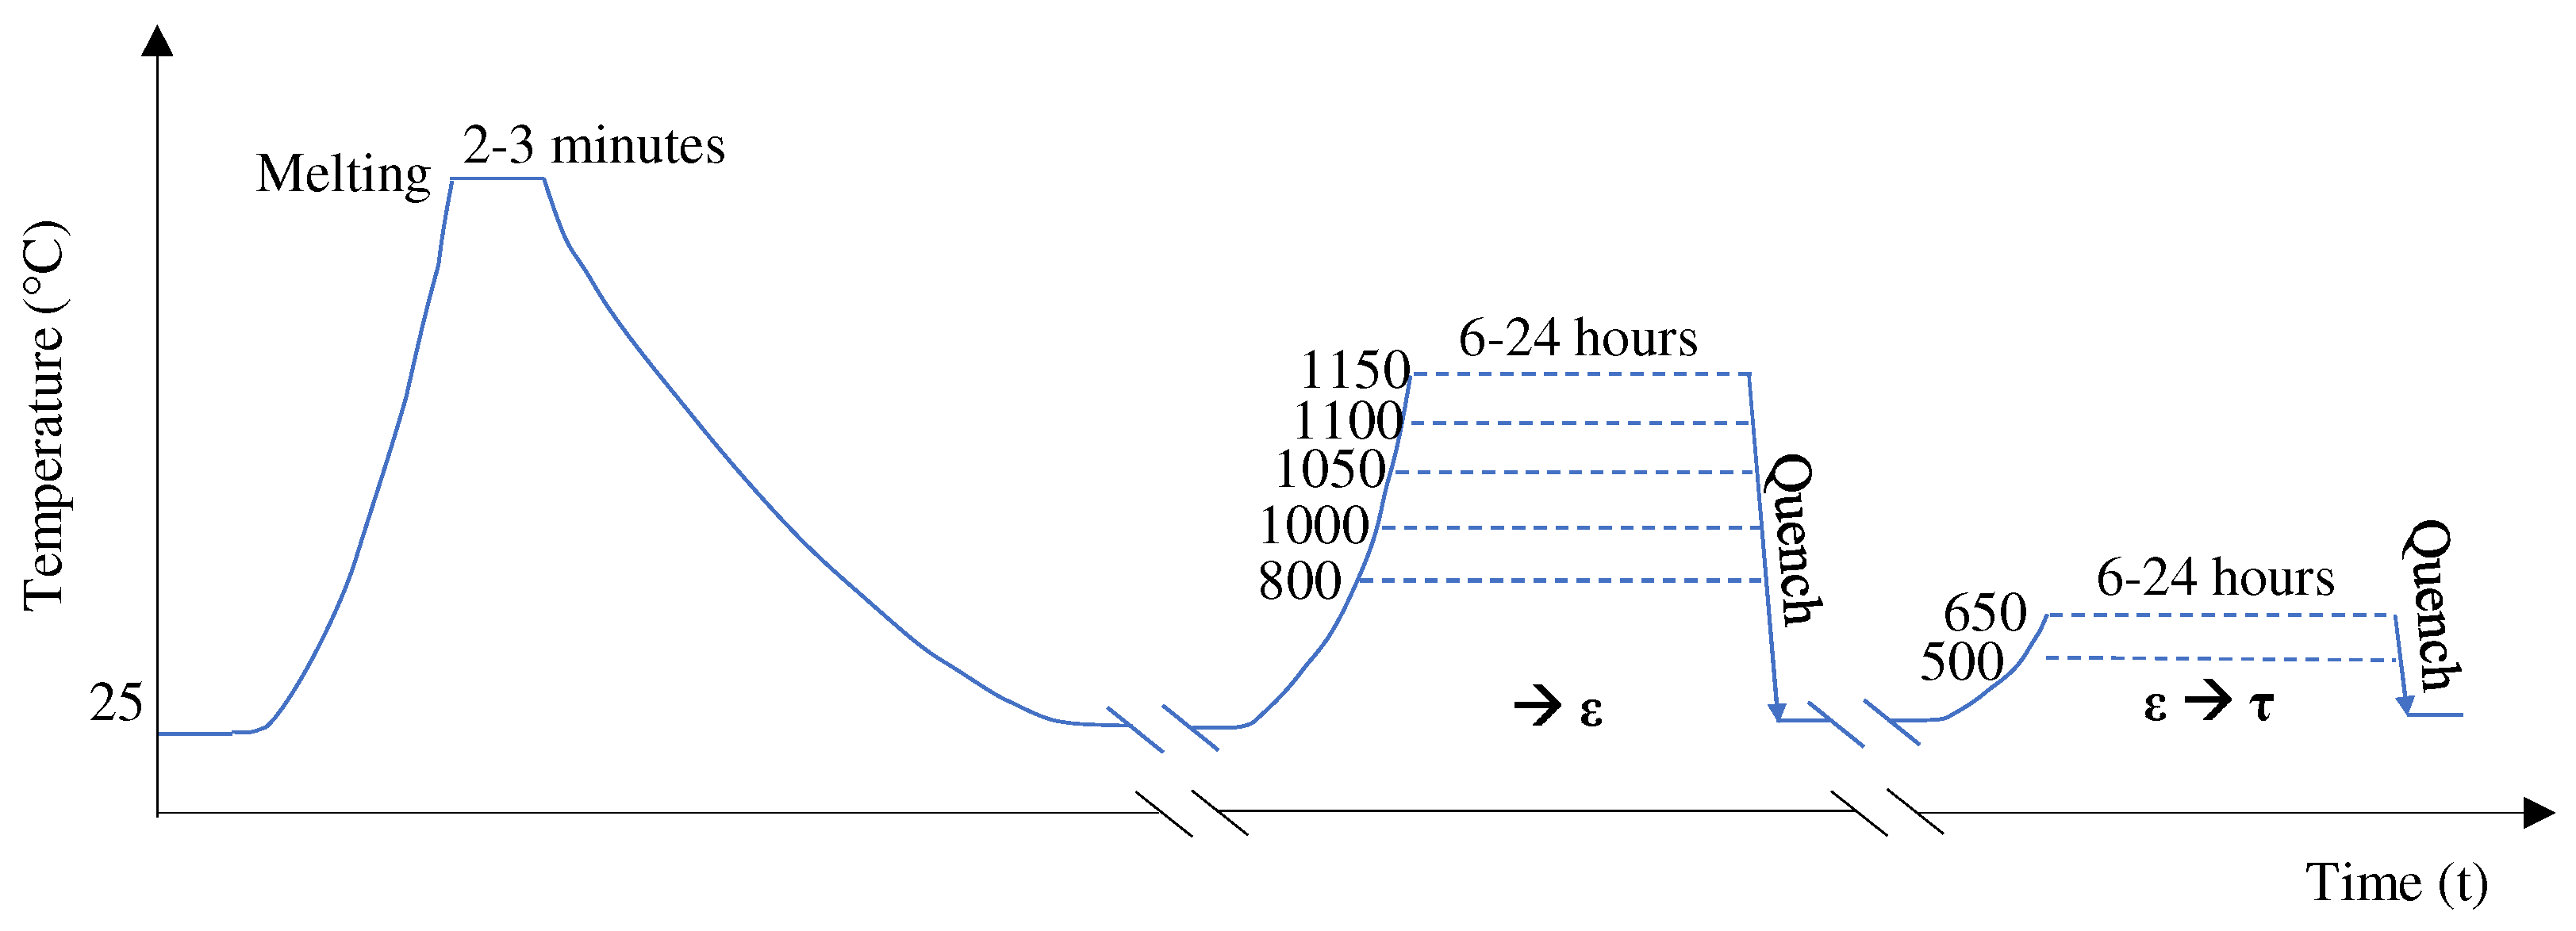
2.1. Heat Treatment: One and Two Step

The annealing treatments were performed via two different pathways, namely a one-step and a two-step treatment. The one-step treatment consists of a single heat treatment at 500 °C, 650 °C, or 800 °C for 24 h folllowed by quenching in brine to study the direct formation of a ferromagnetic τ phase (Figure 1).
The two-step annealing treatments start with a high-temperature anneal at 800 °C, 1000 °C, 1050 °C, 1100 °C, or 1150 °C followed by quenching in brine and a secondary low-temperature anneal between 500 and 650 °C. The two-step treatment follows the method frequently reported for Mn-Al binary alloys (e.g., [22]) and is shown in Figure 2. Annealed samples were quenched in a brine solution with a ratio of 9.5 L: 450 g: 240 mL of tap water, NaCl, and Dawn® liquid detergent (as a surfactant), respectively.

2.2. Characterization
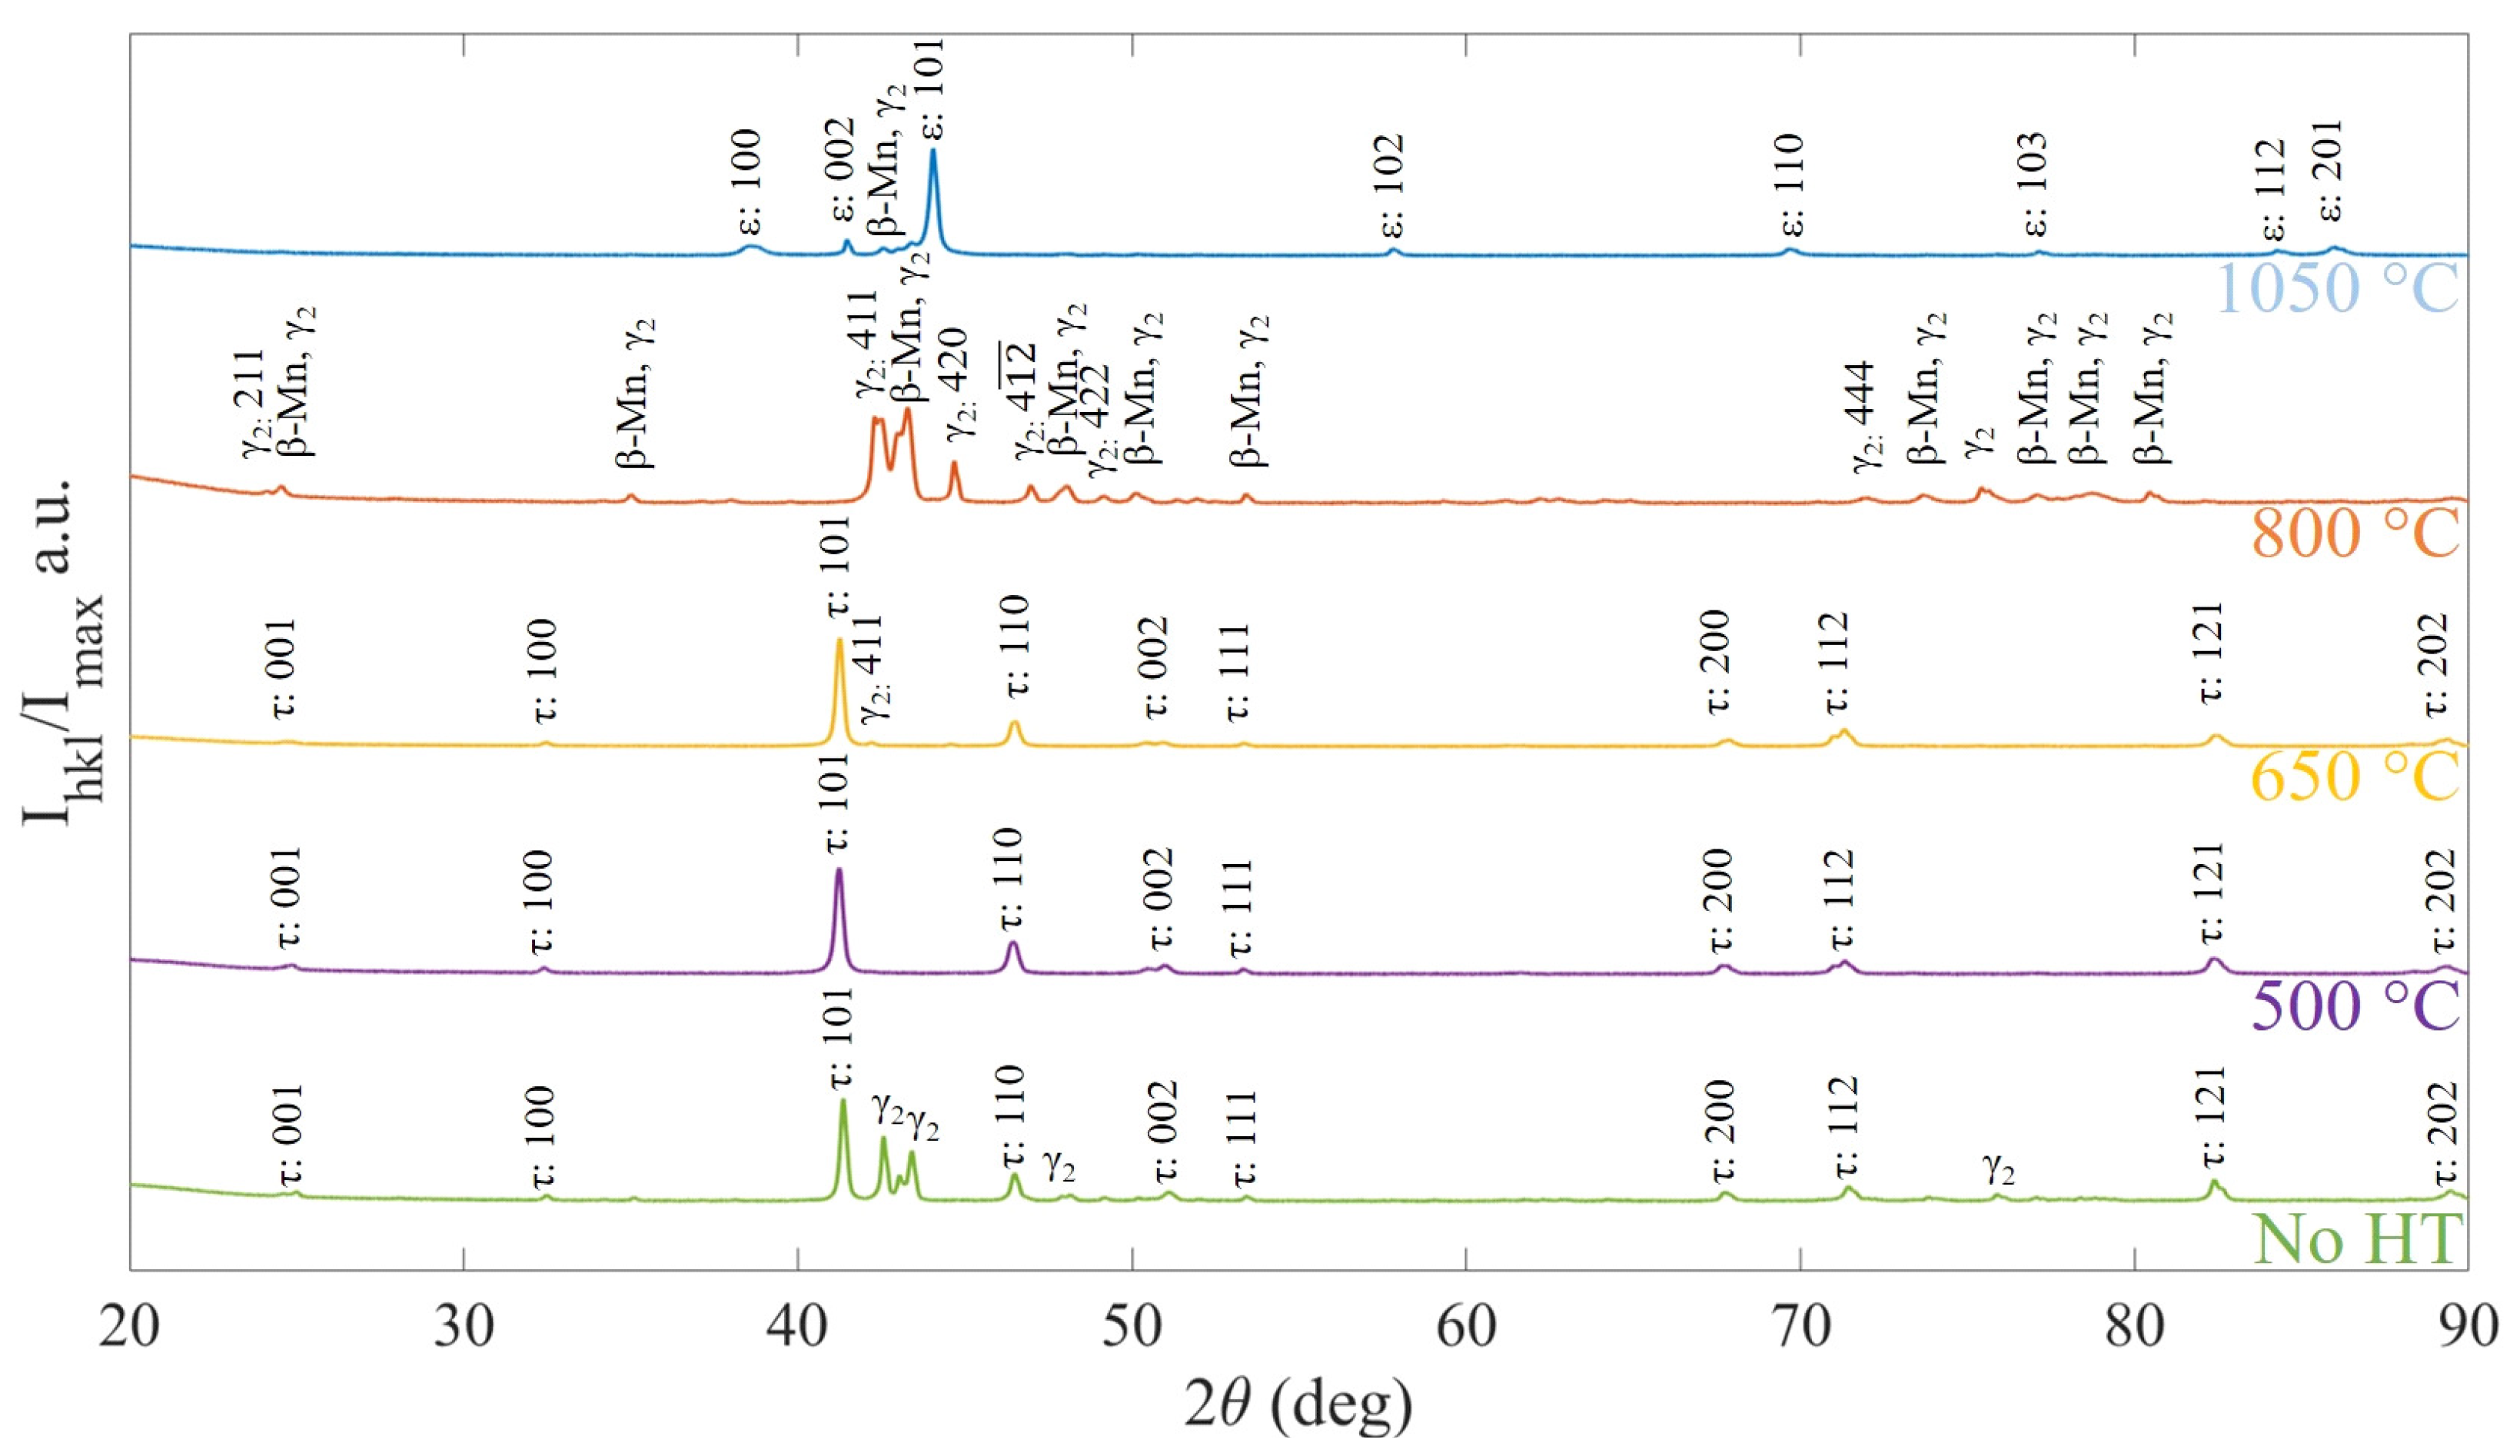
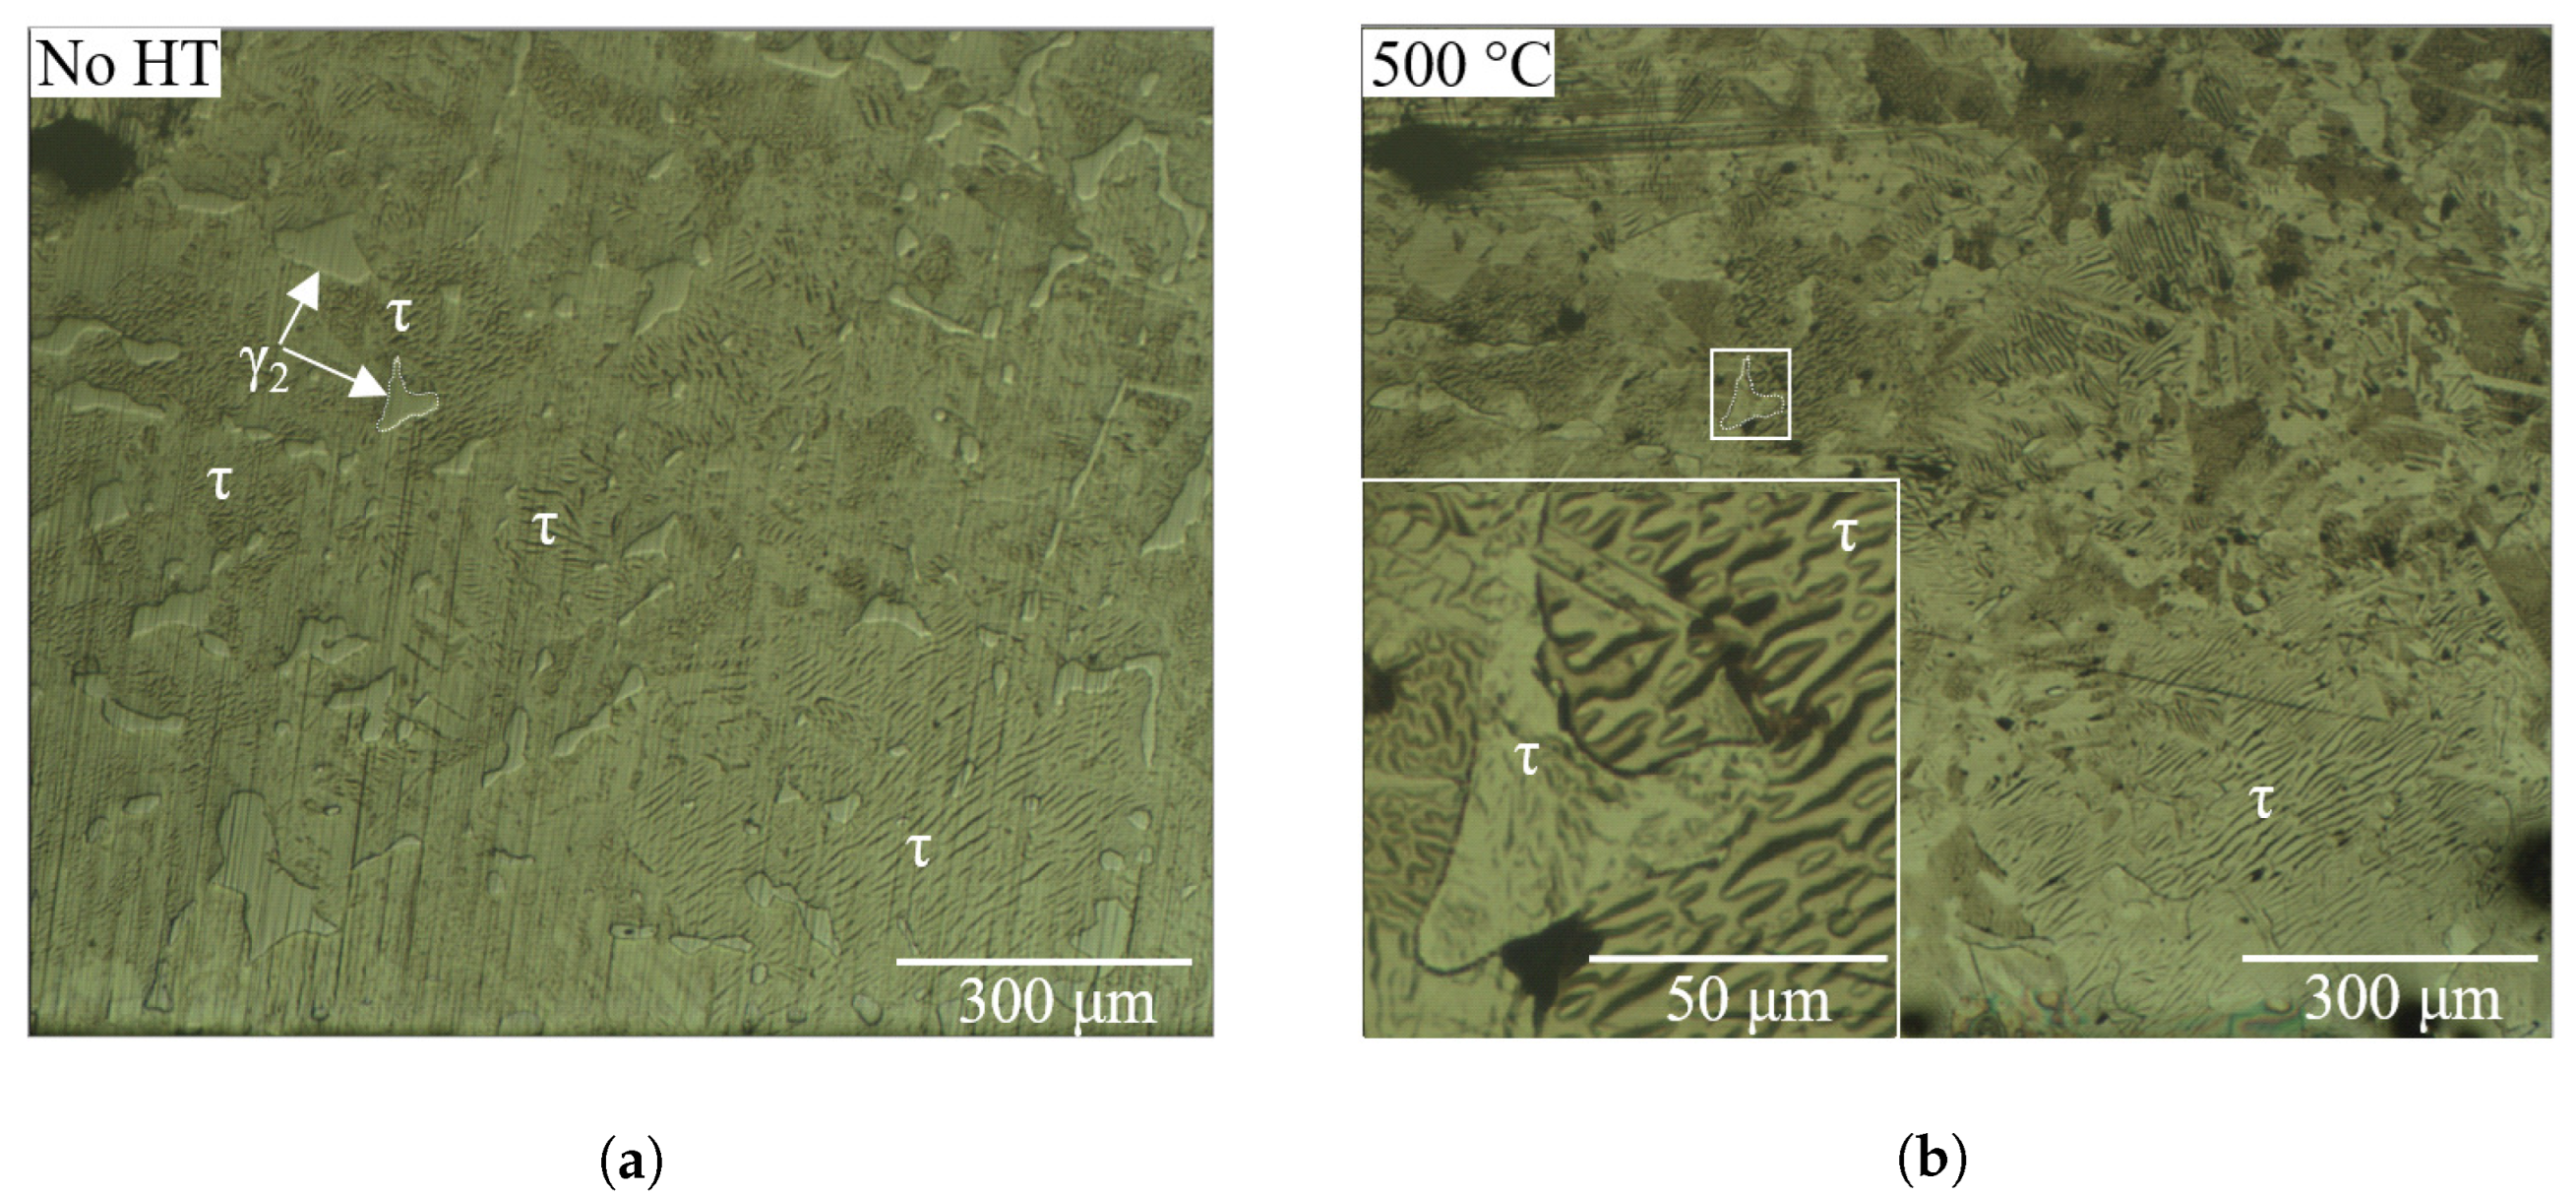
Mass and Density: The element and sample masses were measured on an Acculab Atilon ATL-224-I precision balance with standard deviation of 0.1 m g . The density of the alloys was determined using the Archimedes method. The immersion fluid was distilled water with an assumed density of 1.0 g   cm 3 at room temperature. Calibration was performed with an aluminum mass assumed to have a density of 2.7 g   cm 3 . The statistical error was less than 3%. Assumptions made were that the density of the alloy samples did not change after applying annealing treatments and that samples were homogenous.
Metallography: Samples were prepared with standard metallographic methods with a Struers LaboPol-5 polishing wheel. Samples were sequentially polished with P-grade SiC grinding paper from the range of P320 to P4000 grit. The samples were ultrasonically cleaned for 5 min in acetone between each SiC grit size to minimize scratches and contamination. Samples characterized with SEM-EDS included a 1 µm diamond suspension polishing step. An etching solution with a 4 mL:4 mL:37.5 mL ratio of HCL, HNO3, and H2O, respectively, was applied at room temperature.
X-ray Diffraction: Characterization of the alloy structure and phases were performed on a Rigaku Miniflex 600 bench-top X-ray diffractometer using Cu Kα radiation with 1.541867 Å wavelength and Bragg–Brentano geometry. The detector was a D/teX Ultra. The applied voltage and current were 40 kV and 15 mA, respectively. Measurements were scanned from 2 θ = 10–100° with a 0.02° step size and speed of 6° per minute. The bulk samples were rotated at approximately 80 rpm for improved counting statistics.
Magnetometry: The magnetic hysteresis measurements were performed on a Digital Measurement Systems (DMS) Model 10 vibrating sample magnetometer (VSM). Applied magnetic fields were limited to 2 T. The VSM was calibrated with a nickel standard to within 1% systematic error. The sample standard deviation was less than 1%.
Optical Microscopy: The microstructures were studied using a MEIJI Metallurgical Microscope model MT7100 with an OptixCam Summit Series camera attachment.
Scanning Electron Microscopy (SEM): Phase compositional analyses were performed on an FEI Teneo field emission scanning electron microscope (FESEM) equipped with an energy-dispersive X-ray spectroscopy (EDS) extension from Oxford Instruments. The FESEM included both backscattered electron (BSE) and secondary electron detectors, which were used to characterize phase boundaries and sample topology, respectively. Applied voltages were between 15 and 30 kV.
Bitter Imaging Method: The Bitter method involves the deposition of magnetic particles on the surface which accumulate in regions of maximal stray field revealing the magnetic domain structure. Approximately 0.5 mL of a ferrofluid solution from CMS magnetics with iron oxide particles of 10 nm average size was diluted with 2 mL of glycol and applied to the sample surface.

3. Results

3.1. Ternary Mn-Al-Ga One-Step Heat Treatment

This section presents the results of the ternary Mn-Al-Ga alloy’s magnetization, structure, and microstructure. Table 2 lists the phase compositions of the Mn-Al-Ga alloy and a comparison of results by Mix et al. [14]. High-purity Mn was used for the Mn-Al-Ga alloy in Table 2.
Figure 3 compares the XRD patterns for the Mn-Al-Ga alloy after the one-step heat treatments.
The green pattern of the non-heat-treated sample (No HT) has reflections of the ferromagnetic τ phase and of the γ 2 phase. The XRD patterns for the Mn-Al-Ga alloy annealed at 500 °C display only τ phase reflections. The annealed sample at 650 °C displays τ phase reflections with a (411) γ 2 reflection. The 800 °C treated sample displays γ 2 and β -Mn without the τ phase. A nearly single phase ϵ structure is formed after annealing at 1050 °C.
The magnetization of the ternary alloy increased by 60% following the one-step heat treatment for 500 °C and decreased at higher temperatures. The magnetization at 2 T measured 450 k A   m 1 for the 500 °C annealed sample. These results confirm those of Mix et al. [14]. Annealing at 800 °C and 1050 °C resulted in paramagnetism. One-step heat treatments were performed on ternary alloys at 500 °C, 650 °C, 800 °C, and 1050 °C for 24 h. Corresponding measurements for magnetization, remanence, and coercivity up to a 2 T applied field following the one-step heat treatments are tabulated in Table 3. The volumetric magnetic susceptibilities (XV) are reported for the samples annealed at 800 °C and 1050 °C. Table 3 shows that the low-purity Mn-Al-Ga alloy magnetization measured comparably to the high-purity Mn-Al-Ga alloy.
Applying the Bitter method combined with optical microscopy provided identification of the ferromagnetic phases. Figure 4a shows a non-annealed ternary alloy without etching with ferrofluid applied. The magnetic τ phase exhibits an alternating contrast, which marks the magnetic domains. The non-magnetic γ 2 phase is the dispersed, brighter contrasted region where the ferrofluid particles did not concentrate.
Additionally, the non-heat-treated alloy’s τ and γ 2 phases are identified. A beak-shaped γ 2 phase boundary is outlined in white for reference. Figure 4b displays the same ternary alloy after annealing at 500 °C. The pre-existing laminar and maze-like magnetic domain structures within the interdendritic did not significantly change. The inset shows the microstructural transformation from γ 2 to τ . This observation is consistent with the XRD patterns, as the only discernable changes were observed in the peaks corresponding to the γ 2 and τ phases.

3.2. Ternary Mn-Al-Ga Two-Step Heat Treatment

Further investigation was carried out on the two-step heat treatments of ternary Mn-Al-Ga initially annealed at 1050 °C, which yielded more ϵ phase and less γ 2 phase compared to annealing at 1150 °C. Annealing at 1050 °C did not completely transform the microstructure into a single ϵ phase as revealed by the reflections of γ 2 phase seen in Figure 5a. Likewise, residual γ 2 peaks remain after the low temperature 500 °C annealing. The alloy annealed at 1050 °C for 24 h was paramagnetic with a magnetic susceptibility of 3.91 × 10 3 . After the second annealing step at 500 °C for 24 h, the sample was ferromagnetic with a magnetization of 372 k A   m 1 measured at a magnetic field of 2 T. The application of the Bitter method provided additional insight (Figure 5b). Magnetic domains are seen with greater detail in the inset image.

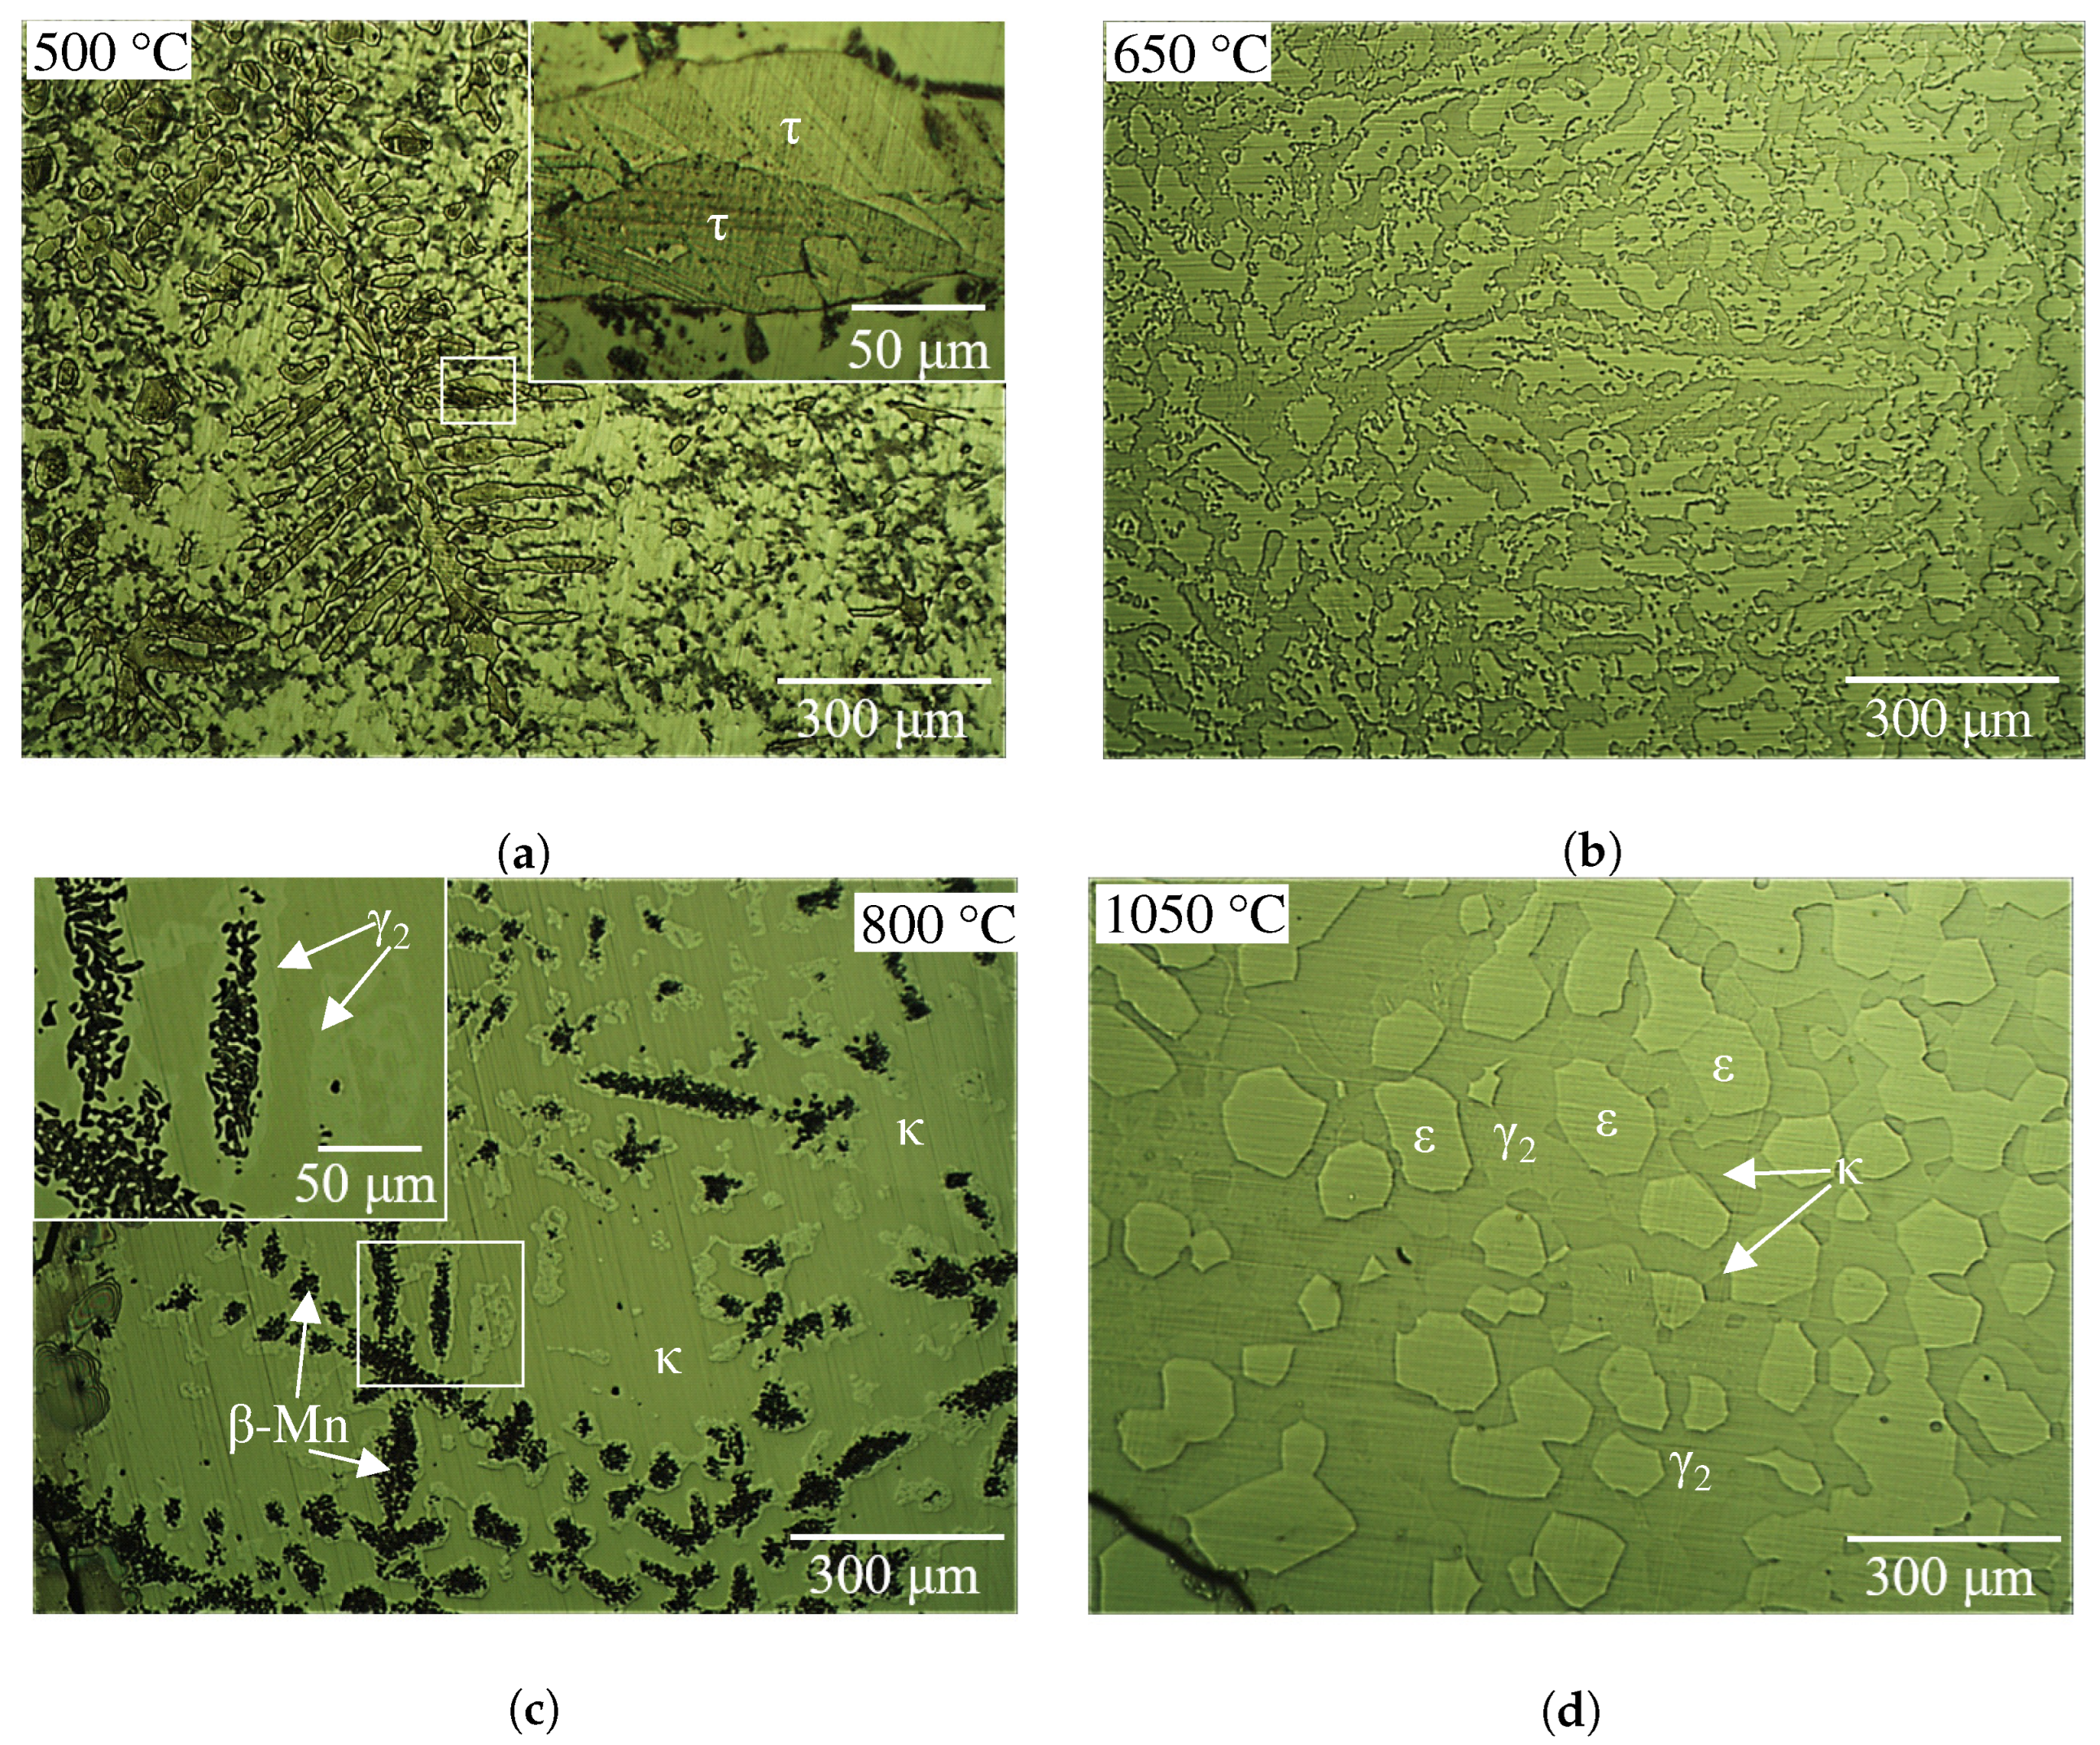
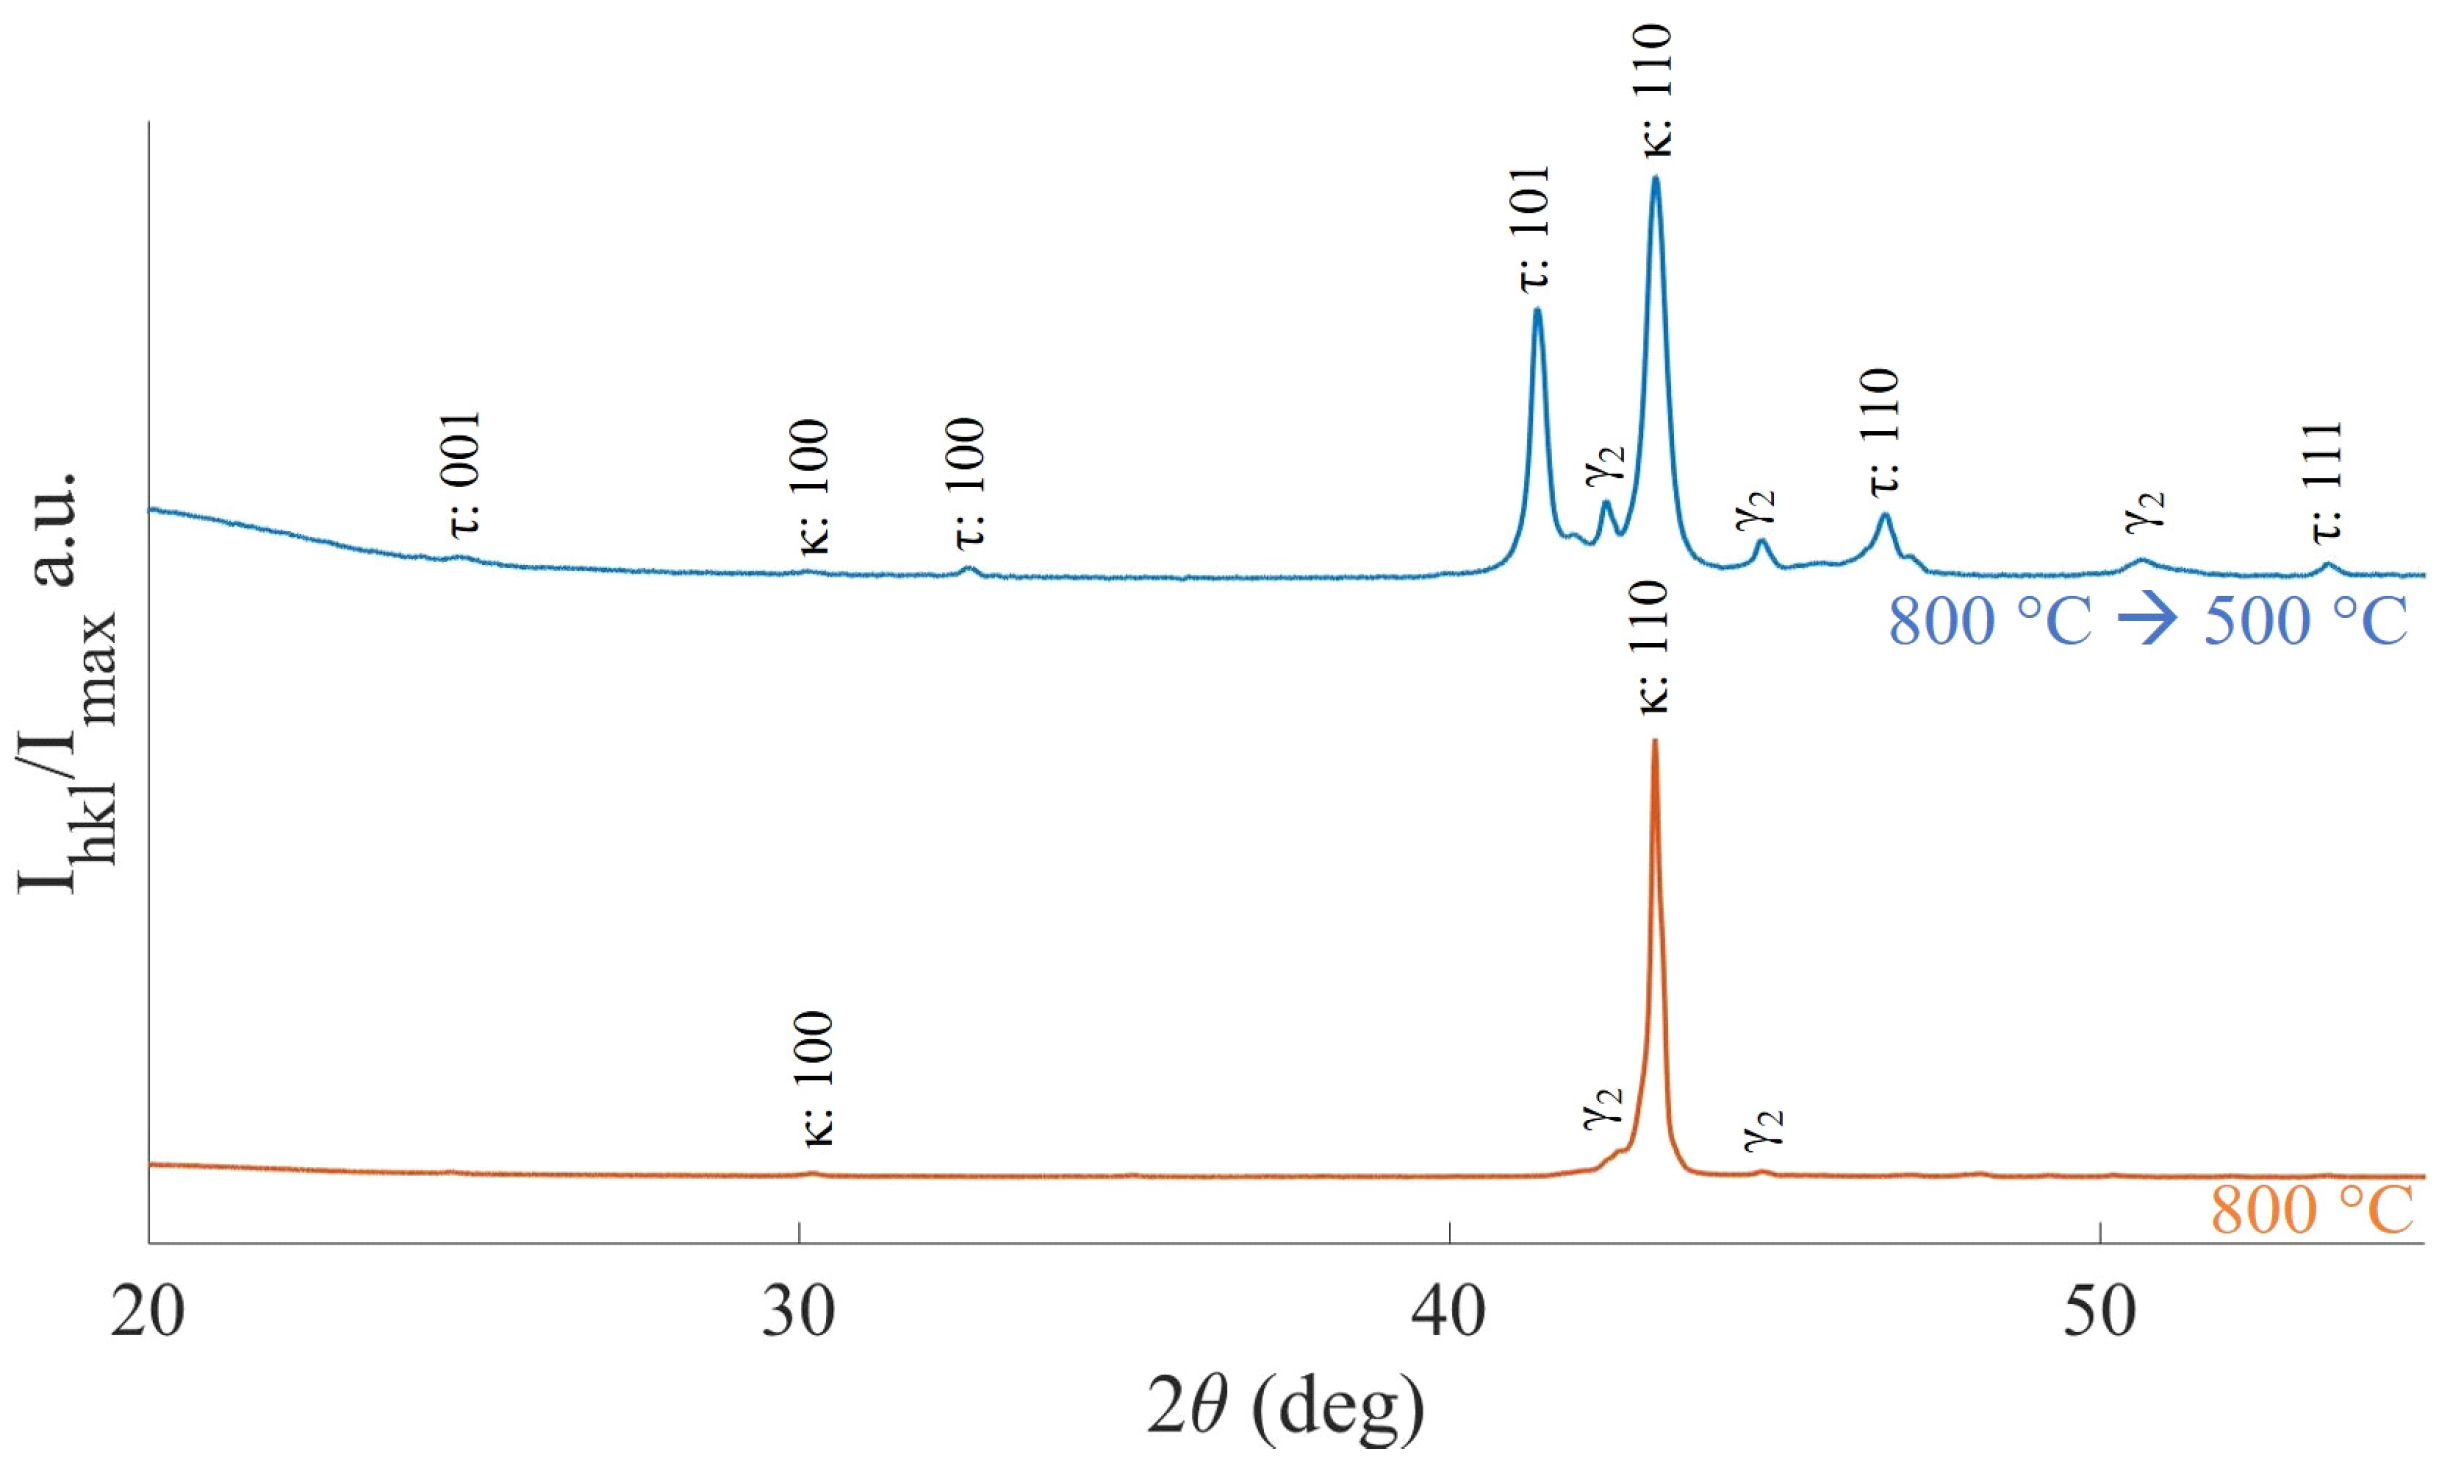
3.3. Mn-Al-Ga-Ni One-Step Heat Treatment

Optical micrographs of the Mn-Al-Ga-Ni alloy after the one-step heat treatment are shown in Figure 6. The 500 °C annealed sample (Figure 6a) had a dendritic microstructure. The inset image is an enlarged section of a dendrite branch that shows twin lamellae in the dendrite, which is an indication of the τ phase [23]. Figure 6b shows a sample annealed and polished after annealing at 650 °C with two phases; however, the XRD pattern indicates the formation of four phases (namely τ , κ , β -Mn, and γ 2). Attempted etching of the 650 °C sample did not provide clear visualization of these multiple phases.
Figure 6c shows a sample annealed at 800 °C with three phases identified as β -Mn, γ 2, and κ . A Mn-Al-Ga-Ni sample annealed at 1050 °C without etching is shown in Figure 6d. At least three different phases can be distinguished in this image with three different intensities. ϵ has a lighter contrast, κ has the darkest contrast, and the contrast of γ 2 is intermediate. The one-step heat-treated Mn-Al-Ga-Ni sample XRD measurements are shown in Figure S1 in the Supplementary Material. The initial non-heat-treated sample formed τ , κ , β -Mn, and γ 2 phases.
The magnetization curves up to a 2 T applied magnetic field are shown in Figure 7a. The Mn-Al-Ga-Ni sample’s magnetization increased from non-heat-treated to the 500 °C treatment by 19%.
After annealing at 650 °C, the magnetization remained unchanged relative to the non-heat-treated sample. The sample annealed at 800 °C exhibited softer ferromagnetism (i.e., a narrower hysteresis loop). The magnetization decreased by 30% from the non-heat-treated sample, and the slope of magnetic saturation decreased to virtually zero. Figure 7b shows the samples’ M-H curve results up to a 0.2 T applied magnetic field. Table 4 presents the magnetization, remanence, and coercivity of each sample of Mn-Al-Ga-Ni that was annealed following the one-step heat treatment.

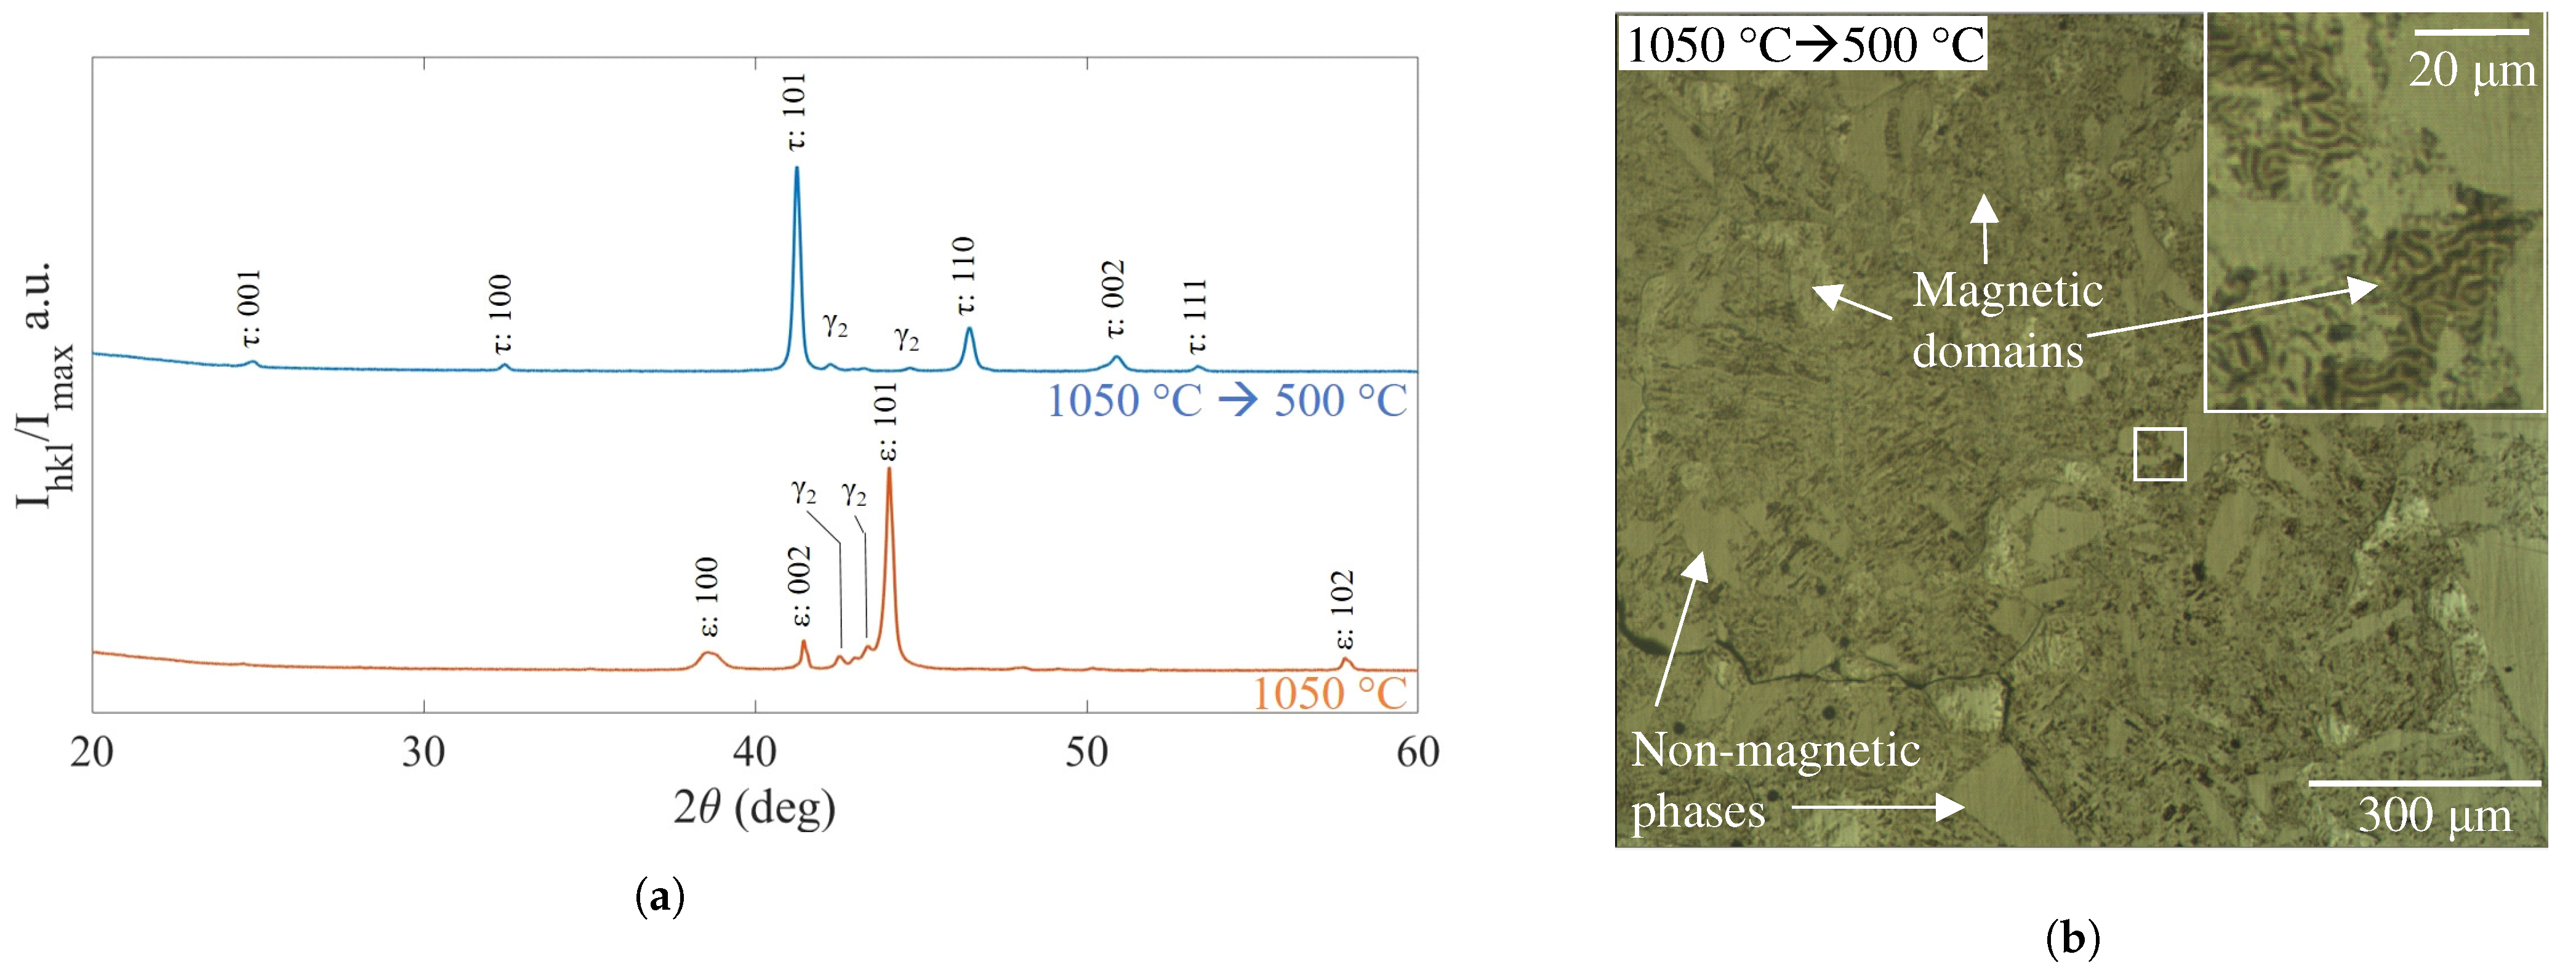
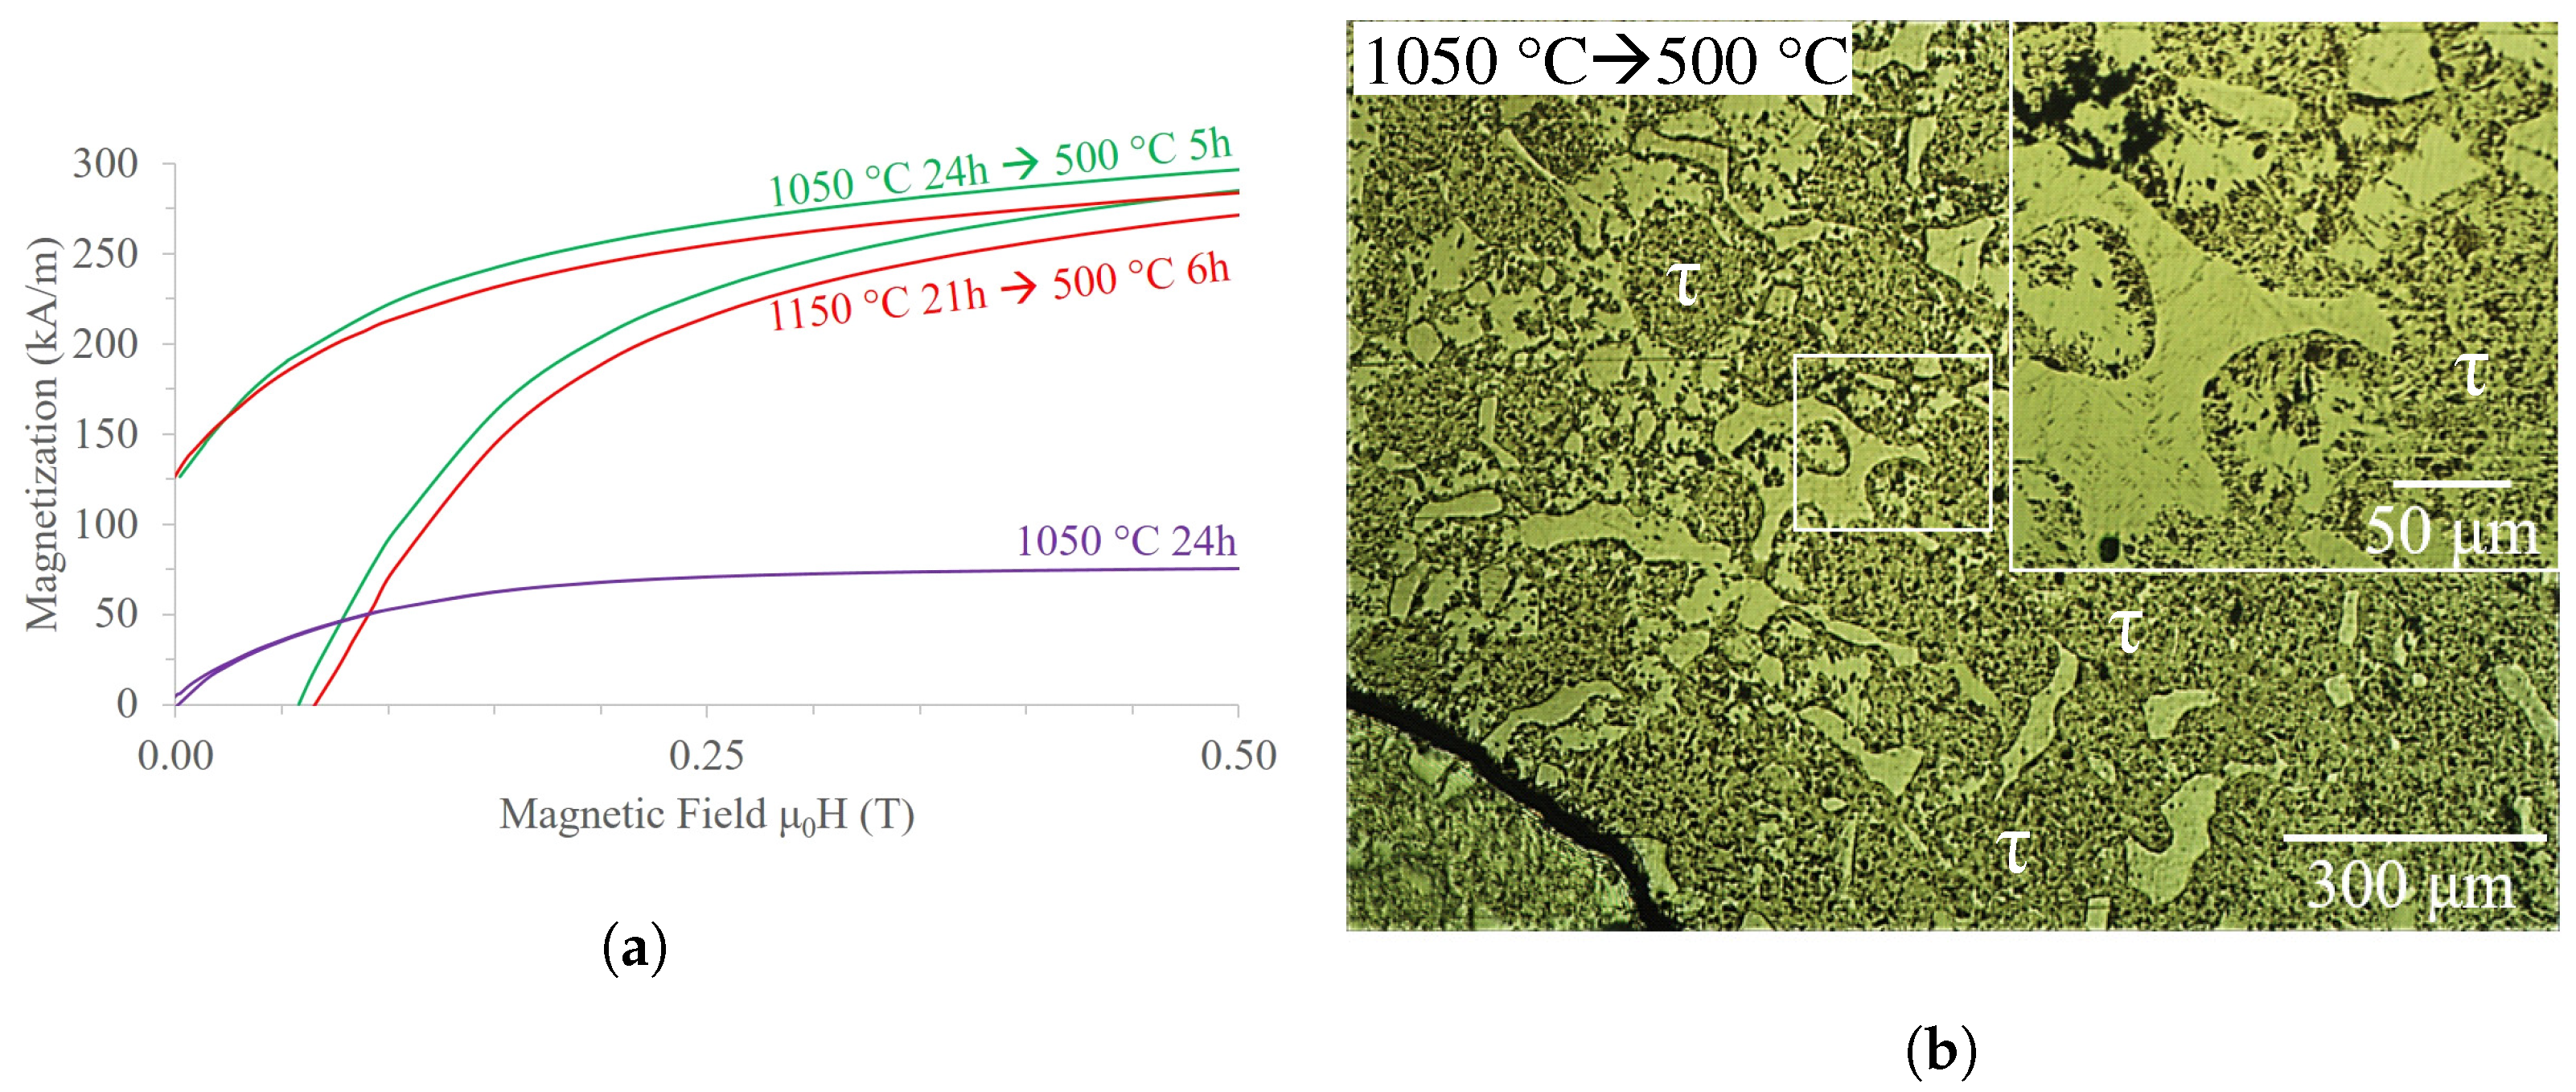
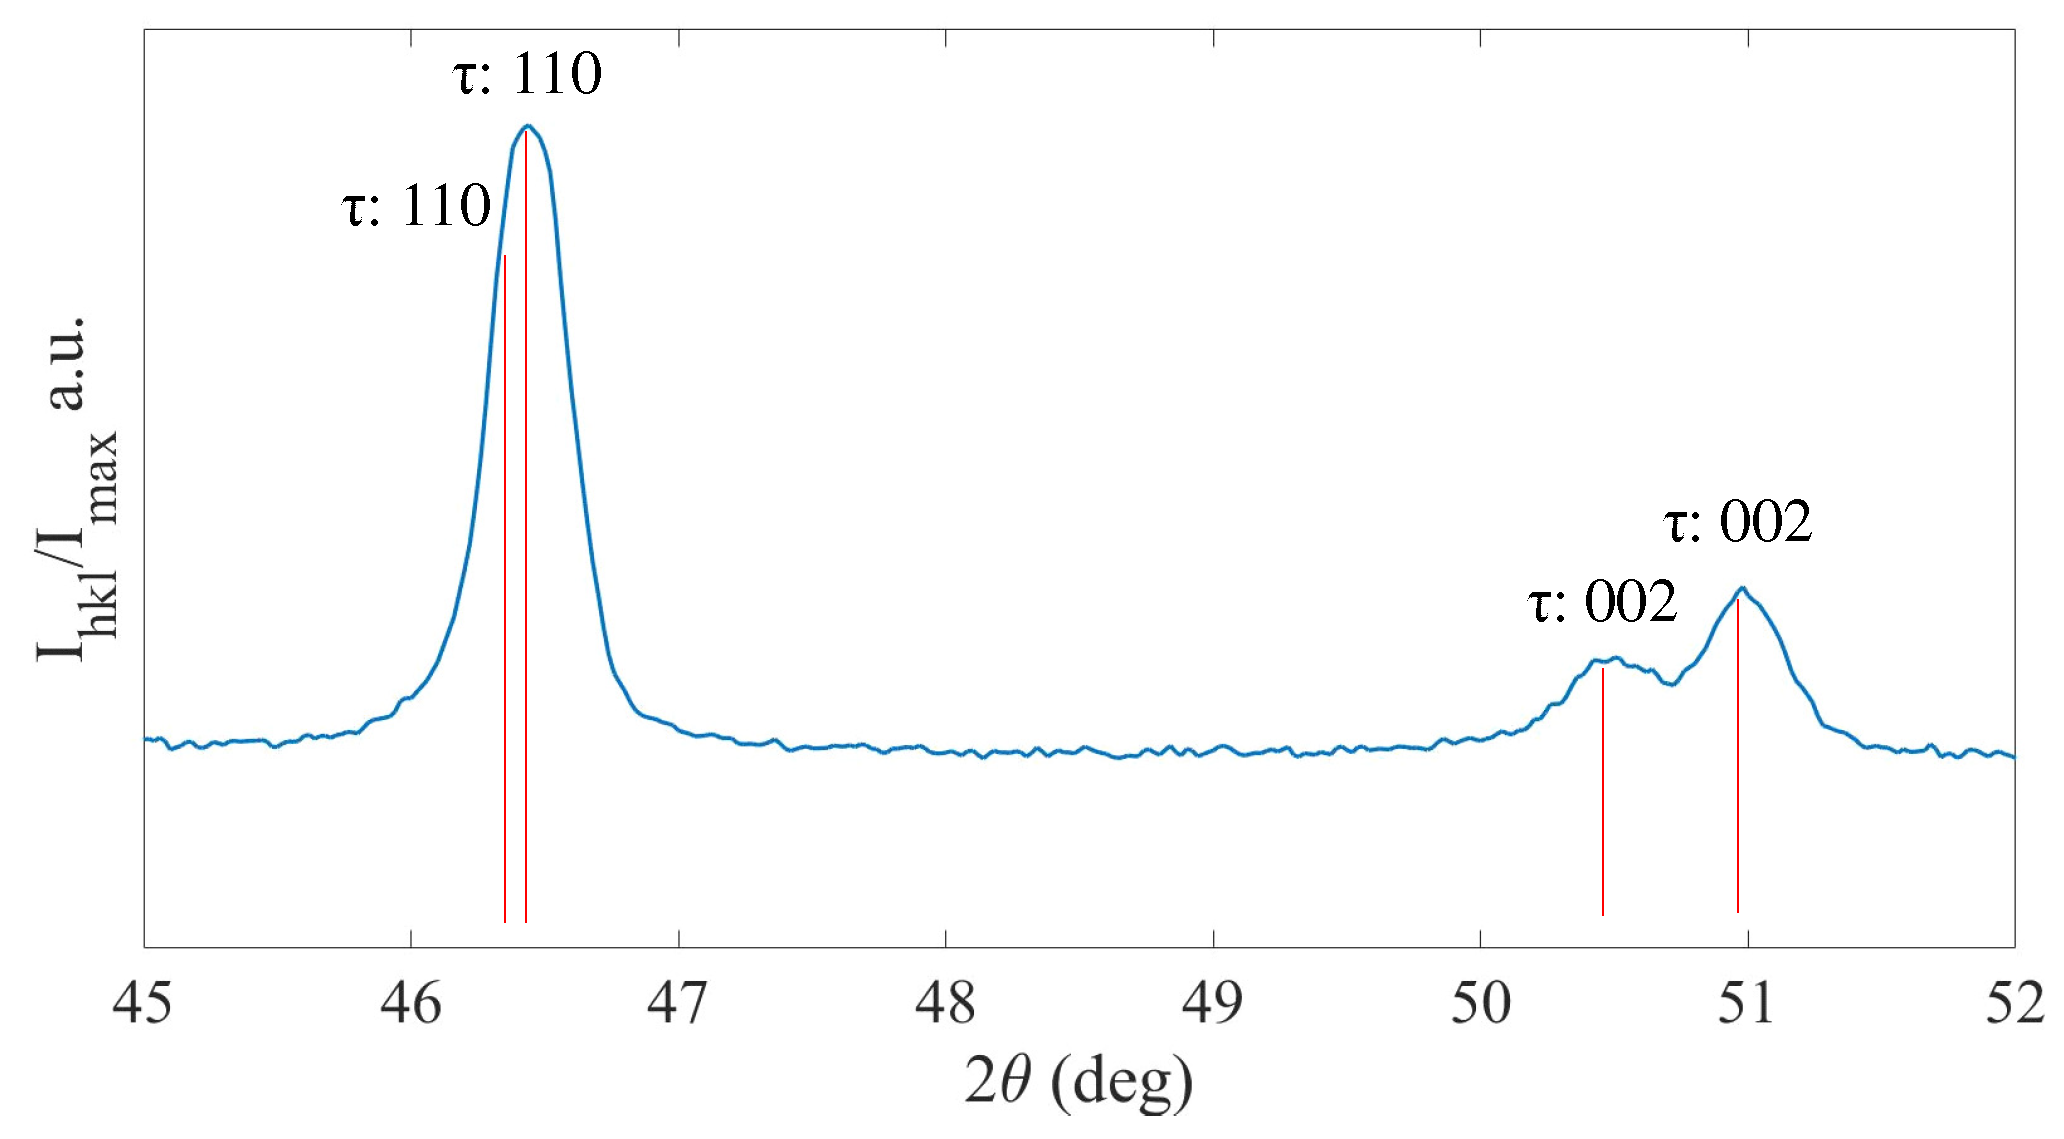
3.4. Mn-Al-Ga-Ni Two-Step Heat Treatment

Figure 8 is an SEM image of a sample of Mn-Al-Ga-Ni annealed at 1050 °C. Phase compositions were quantified from averaged EDS point scans. The SEM image shows two phases ( κ brighter and ϵ dark), while the XRD data have reflections of four phases ( β -Mn, κ , ϵ , and γ 2). The composition of κ and ϵ were measured with EDS shown in the inset of Figure 8. The BSE image positions S1 through S12 correspond to the inset spectrum. The κ phase is enriched in Mn compared to the ϵ phase.
XRD measurements for Mn-Al-Ga-Ni samples annealed at 1000 °C, 1050 °C, and 1100 °C are shown in Figure S2 in the Supplementary Material. Mn-Al-Ga-Ni XRD patterns for two-step annealed samples are also included in the Supplementary Material in Figure S3. The XRD pattern for the alloy annealed at 800 °C→500 °C showed that some κ phase does transform into τ phase with the 500 °C annealing treatment, as shown in Figure 9.
The magnetization curves up to a 0.5 T applied magnetic field for Mn-Al-Ga-Ni annealed with the two-step heat treatment are shown in Figure 10a. The sample annealed at 1050 °C (containing ϵ phase) is shown for reference. Figure 10b shows the microstructure of Mn-Al-Ga-Ni annealed at 1050 °C→500 °C with ferrofluid applied. The τ phase and non-magnetic phases are contrasted.
The highest magnetization measured for the two-step heat-treated Mn-Al-Ga-Ni was for the 1050 °C→500 °C treatment at 377 k A   m 1 in an applied magnetic field of 2 T. The 1150 °C→500 °C alloy measured 361 k A   m 1 at 2 T. Single-point measurements at 2 T for the 800 °C→500 °C, 1000 °C→500 °C, and the 1100 °C→500 °C treated alloys were 339 k A   m 1 , 321 k A   m 1 and 311 k A   m 1 , respectively. Table 5 includes the magnetization measurements for Mn-Al-Ga-Ni samples.
When heat-treated in two steps, the magnetization of Mn-Al-Ga-Ni was highest for the annealing temperatures 1050 °C→500 °C. The XRD measurement for this heat treatment indicates three phases, γ 2, τ , and κ .

4. Discussion

The search for Mn-Al based permanent magnets with improved BHmax motivated this study. We have applied alloying strategies with the goal to (i) stabilize the ferromagnetic τ phase, (ii) increase the magnetic order (i.e., the saturation magnetization and the magnetic remanence), and (iii) increase the magnetic hardness (i.e., coercivity). In this section, we discuss (1) the stability range of phases and phase transformation conditions and (2) the magnetic order, magnetic hysteresis, and paramagnetic properties.

4.1. Phase Stability and Phase Transformations of Binary Mn-Al

To discuss the formation of the microstructure of the ternary and Mn-Al-Ga-Ni samples, it is helpful to review the phase transformations occurring in a binary Mn55Al45 alloy. The binary phase diagram shows four stable phases for this composition region: ϵ , γ , γ 2, and β -Mn. The τ phase is metastable; it does not form when cooling in quasi-equilibrium. To form the τ phase, ϵ must be supercooled by quenching. Upon subsequent annealing at temperatures between 300 and 700 °C, the τ phase forms from ϵ by two distinct paths. At lower temperature (typically below 600 °C), the hexagonal close-packed ϵ orders and forms the orthorhombic ϵ ’. A shear transformation on close-packed (111) planes leads to a densely twinned τ phase [24]. At higher temperature (typically above 600 °C), τ forms by a massive transformation preferentially nucleated at grain boundaries [25].
When cooling at a finite rate, Mn segregates and accumulates in the solid phase. If the solidification is unstable such that dendrites form, the dendrites are enriched in Mn and depleted in Al. For a binary alloy with 55 at.-% Mn, the concentration of Mn in the dendrites ranges between 55 and 59 at.-%, and that of the interdendritic space varies between 49 and 55 at.-%. As a consequence of the compositional segregation in dendrites and interdendritic space, different phase reactions occur in the dendrites and in the interdendritic space. The dendrites contain more γ 2 than the interdendritic volume, and some of the β -Mn in the dendrites has a higher Mn concentration. Adding third and fourth components to the Mn-Al base alloy may shift the boundaries of phase fields and add other stable phases. Upon further discussing the results of these alloys, we assume that upon dendritic solidification, the dendrites enrich in Mn and the interdendritic space depletes in Mn. Therefore, the dendrites more readily form β -Mn, whereas the interdendritic space forms γ and γ 2 more readily.

4.2. Ternary Mn-Al-Ga

The composition of the ternary alloy Mn55Al39.4Ga5.6 was chosen to replicate the work of Mix et al. [14] and to expand on that study. The results agree with Mix’s report that Ga stabilizes the τ phase. Furthermore, cooling in the crucible from the molten results in dendritic solidification where the dendrites are enriched in Mn and the interdendritic space is depleted in Mn. As-solidified, non-heat-treated Mn-Al-Ga had three phases, namely τ , γ 2, and β -Mn. Upon annealing in a one-step treatment at 500 °C and 650 °C, γ 2 and β -Mn transformed into τ . The γ 2 to τ transformation was demonstrated and characterized via the Bitter method showing maze patterns of ferromagnetic domains for the τ phase. XRD data confirmed the formation of a single τ phase after annealing at 500 °C and a nearly single τ phase (with some minor γ 2 peaks) after annealing at 650 °C. Upon annealing at 800 °C, the stability range of the τ phase was exceeded, resulting in its decomposition into β -Mn and γ 2. Close to single-phase ϵ was formed when annealing at 1050 °C with some dendritic γ 2 (or γ ). Thus, the alloy Mn55Al39.4Ga5.6 has at least four stable solid phases: ϵ , β -Mn, γ 2, and τ .
The τ phase exists with two distinct tetragonality ratios δ 1 and δ 2 where δ = c/a. The body-centered tetragonal (bct) ratios are δ 1 = 1.307 and δ 2 = 1.292 obtained from the X-ray reflections for (110) and (002) (Figure 11). The face-centered tetragonal (fct) ratios are δ 1 = 0.924, and δ 2 = 0.914, which agree within an error of 1% with the FCT ratios reported by Mix et al., where δ 1 = 0.927 and δ 2 = 0.918 (i.e., Mix’s BCT ratios were δ 1 = 1.311 and δ 2 = 1.299) [14].

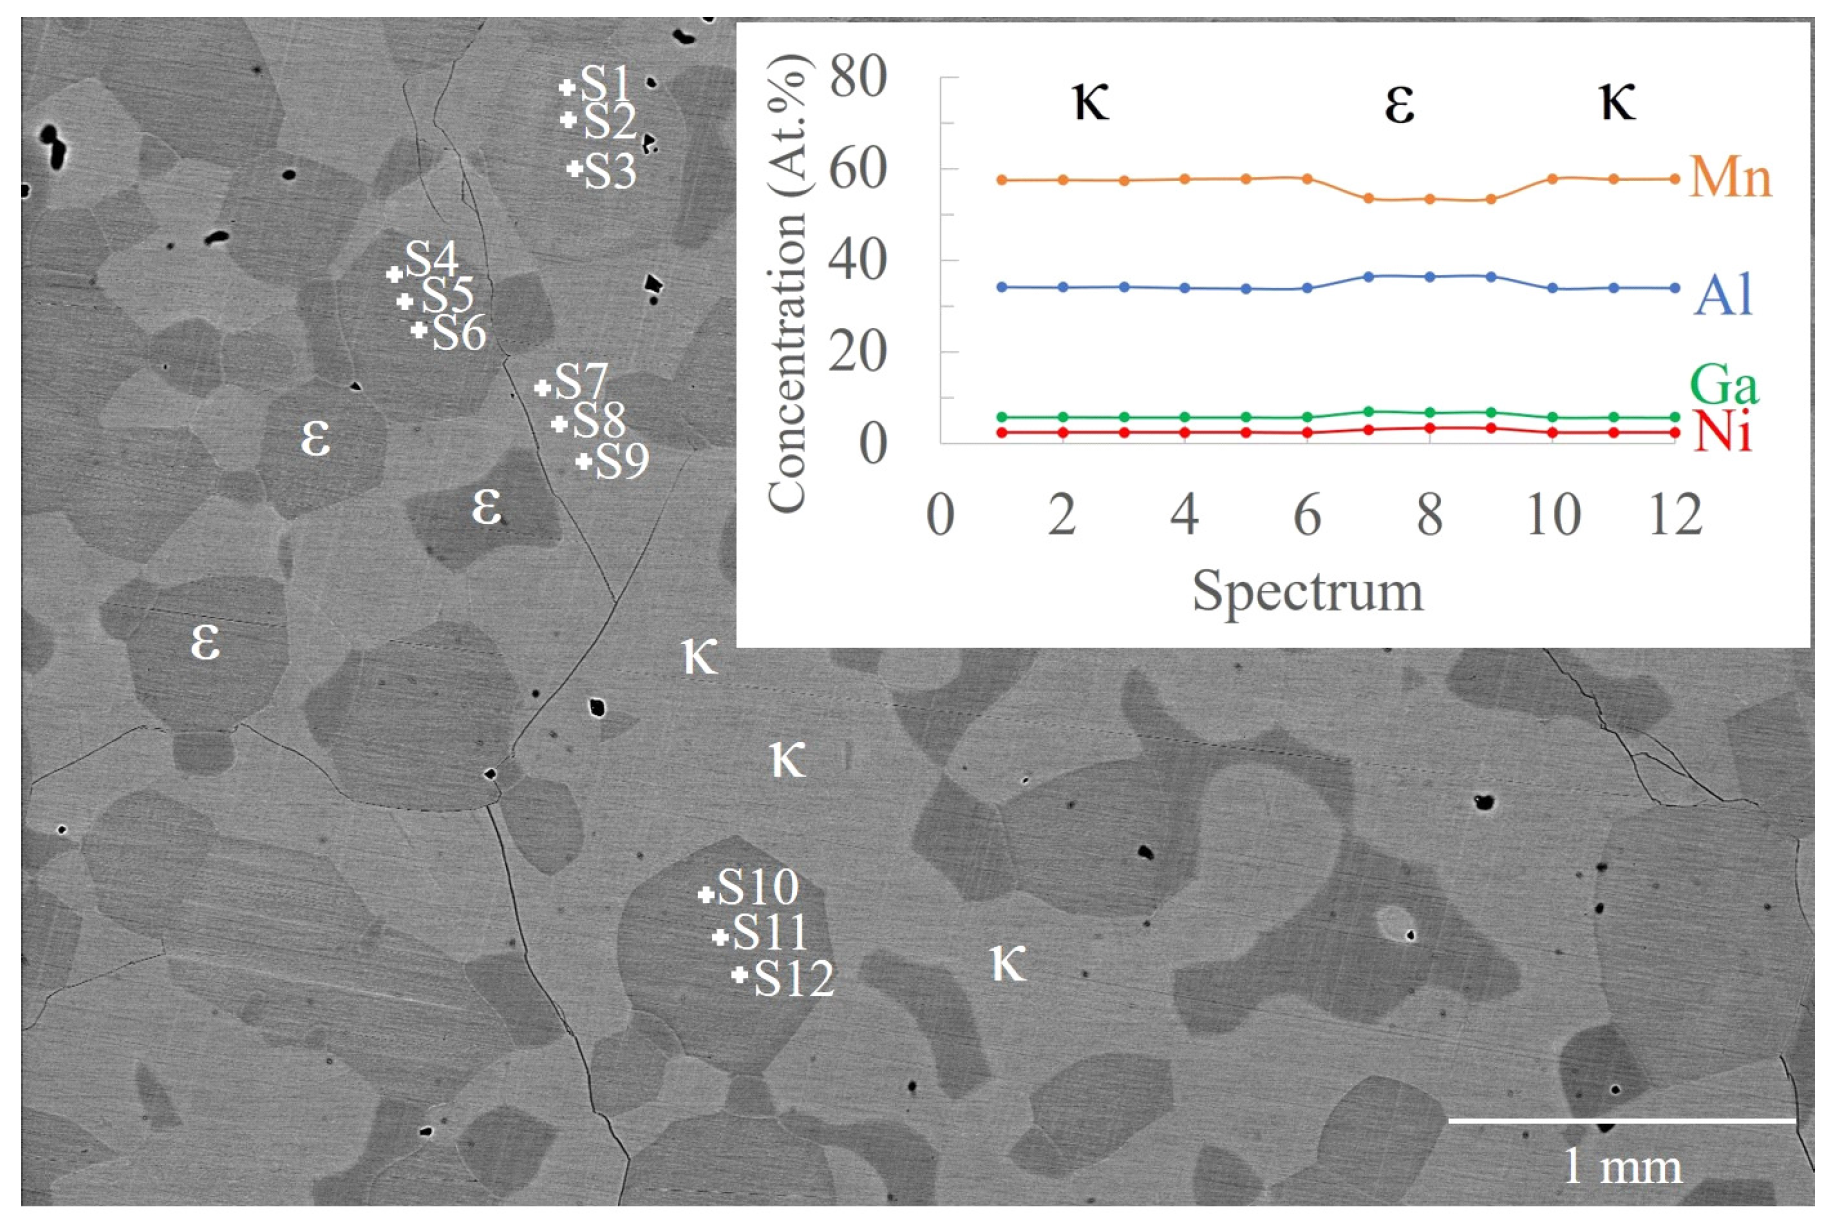
4.3. Mn-Al-Ga-Ni: Heat Treatments and Phase Transformations

Adding nickel to the Mn-Al-Ga alloy stabilized the primitive cubic κ phase. This phase did not form in the ternary alloy. When annealed at 800 °C, the Mn-Al-Ga-Ni sample had mostly κ with a small amount of β -Mn and γ 2. The EBSD results reported in Figure 8 show that the κ phase is enriched in Mn, indicating that it forms in the interdendritic space.
A new transformation pathway for the formation of the τ phase for Mn-Al-Ga-Ni was discovered. The heat treatment consisted of two steps: first, annealing at 800 °C for 24 h and second, annealing at 500 °C for 24 h. The XRD pattern of the 800 °C annealed sample (Figure 9) showed a nearly 100% κ phase. After the second anneal at 500 °C, Figure 9 showed the formation of τ and γ 2 phases. Thus, we demonstrated that the τ phase forms directly from the cubic κ phase. The heat treatment comparisons in Table 5 at different high temperatures followed by the low-temperature 500 °C anneal are interesting because the magnetization is very similar despite the transformation pathway happening via two different mechanisms. The traditional transformation mechanism is the high-temperature ϵ phase to τ phase (>1000 °C), where the new mechanism is the κ phase to τ phase at the lower temperature (800 °C).

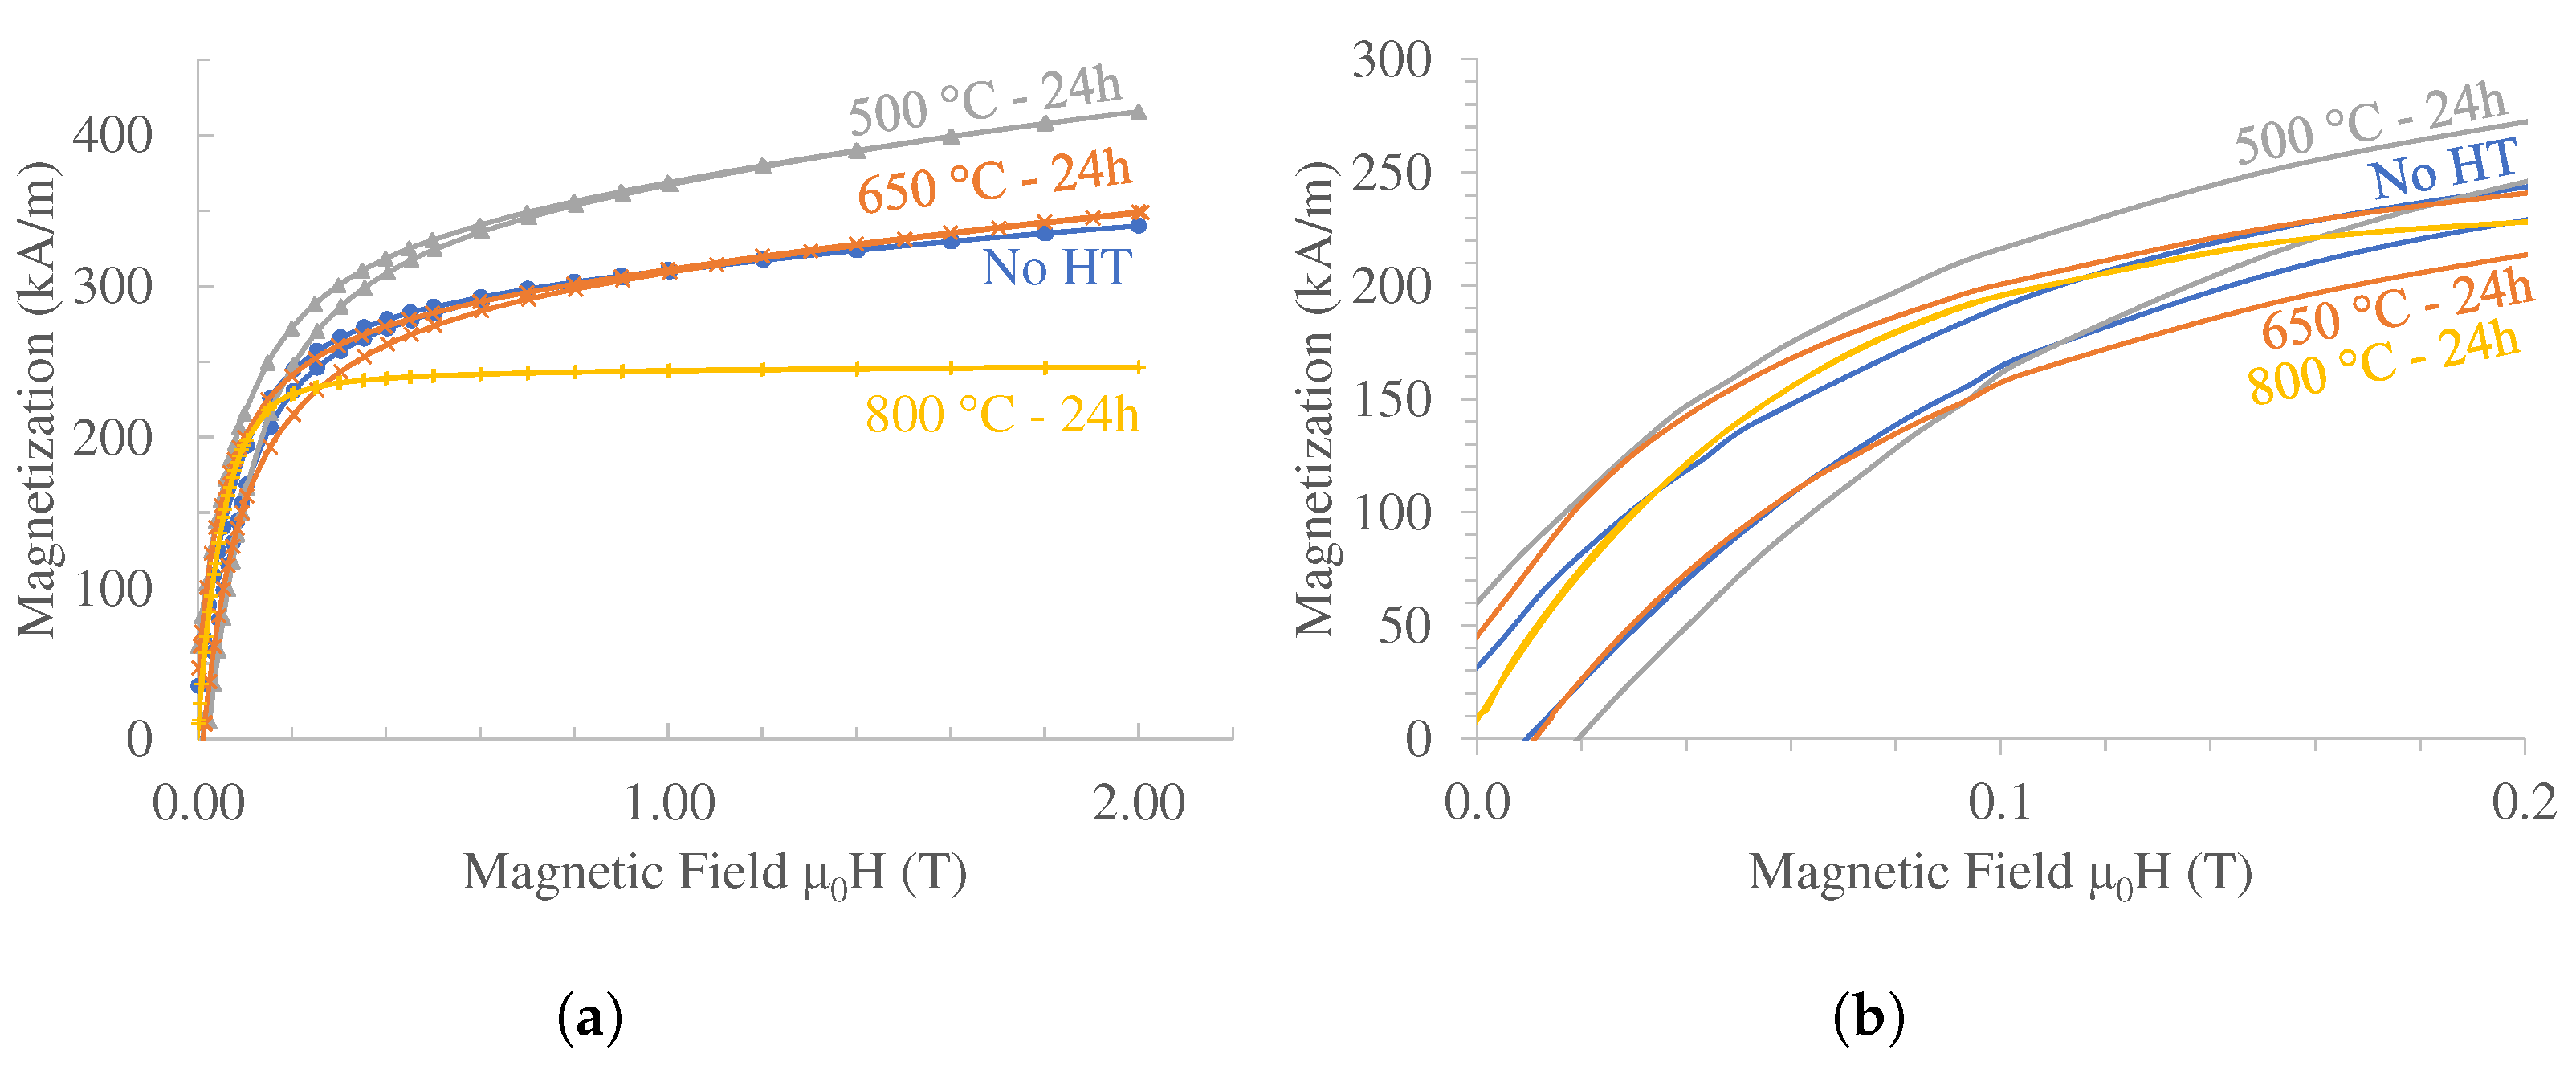
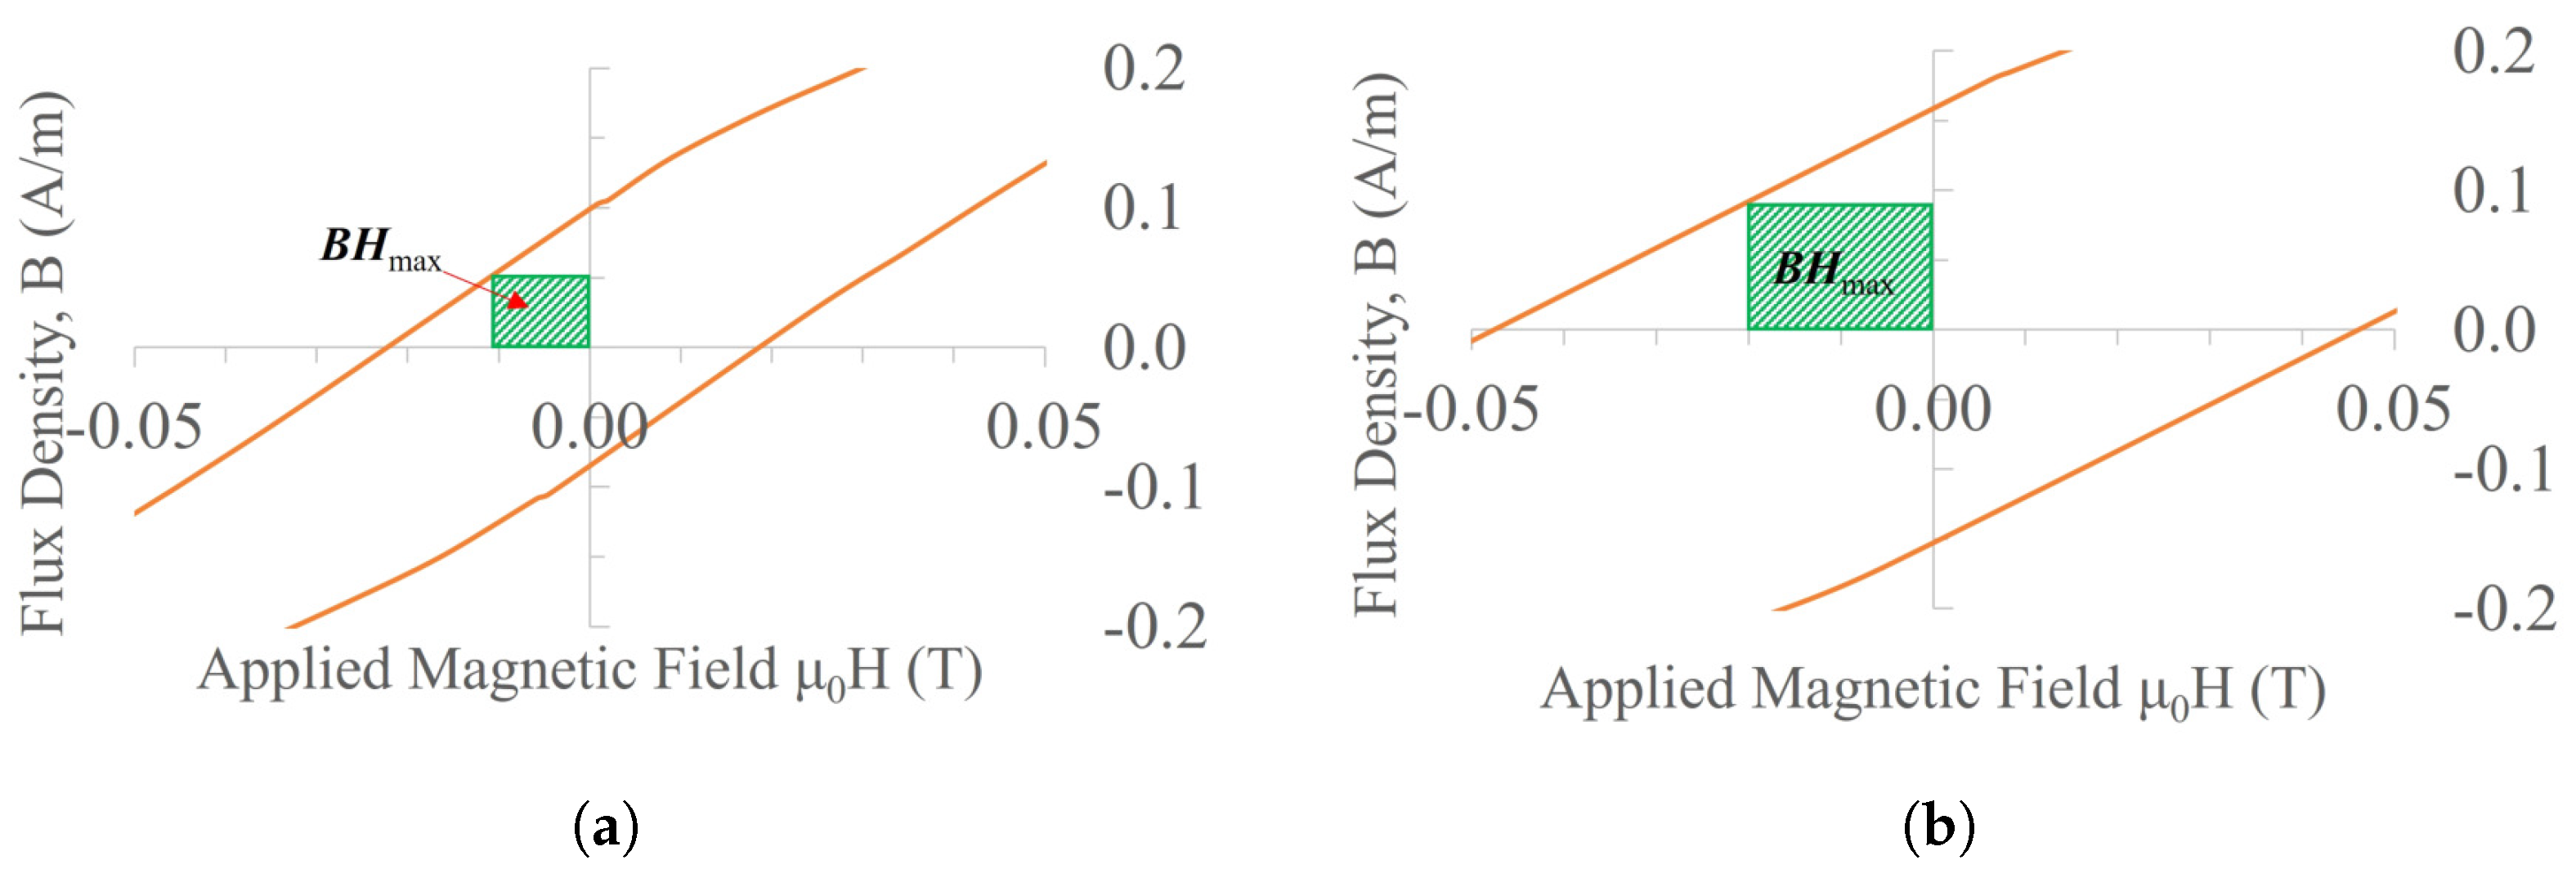
4.4. Magnetic Properties

Mix et al. report a saturation field and saturation magnetization of 14 T and 675 k A   m 1 , respectively, for the ternary alloy indicating a magnetic anisotropy constant of 1.51 M J   m 3 . The results of the ternary alloy saturation magnetization replicated those of Mix et al. to within 3% for the high-purity Mn and 9% for the low-purity Mn alloys. Albeit for magnetic properties, we measured up to 2 T while Mix et al. measured up to 14 T. The hysteresis loops of all materials studied here are narrow with coercivities below 200 k A   m 1 , and the hysteresis loops essentially closed at a magnetic field of 1 T. This means that the magnetization, M2T, measured at a magnetic field of 2 T accurately describes the order of materials when sorted by their saturation magnetization. The highest saturation magnetization for ternary Mn-Al-Ga samples for one-step and two-step annealed samples was, respectively, 450 k A   m 1 and 372 k A   m 1 . This difference of 20% in saturation magnetization indicates that the τ phase is either more stable when processed with the one-step heat treatment or it is more completely ordered (or both). The transformation of the γ 2 dendritic phase to τ phase is evident from the imaged magnetic domains shown in Figure 4. The pre-annealed γ 2 dendritic phases are clearly distinguished. After annealing, we see these γ 2 dendritic phases homogenize into the well-defined magnetic domains. The two-step annealed sample at 1050 °C for 24 h followed by 500 °C for 24 h in Figure 5b shows that a dendritic phase has transformed into the τ phase evident from the Bitter method. However, it is also clearly seen in Figure 5b that portions of the interdendritic ϵ phase have transformed into the γ 2 after the second annealing step. It is evident from Figure 4b that the volume of the τ phase in the one-step annealed sample was greater than that in the two-step annealed sample shown in Figure 5b. This is in agreement with the saturation magnetization measurements made for both ternary samples.
Mn-Al-Ga-Ni annealed at 800 °C had nearly 100% κ phase. The κ phase saturated at an approximate magnetic field of 0.5 T with a saturation magnetization of 246 k A   m 1 yielding a magnetocrystalline anisotropy energy of about 0.06 M J   m 3 . The much lower magnetocrystalline anisotropy constant (compared with that of K 1 = 1.51 M J   m 3 for τ phase [14]) results from the cubic symmetry of the κ phase. The highest magnetization measured for Mn-Al-Ga-Ni at a magnetic field of 2 T was M2T,Ni = 416 k A   m 1 for a sample annealed in a single step at 500 °C that contained τ , κ , β -Mn, and γ 2 phases. Mn-Al-Ga-Ni exhibited τ , κ , β -Mn, and γ 2 phases in the one-step treated samples annealed at 500 °C and 650 °C. Mn-Al-Ga-Ni annealed at 800 °C consisted of nearly single-phase κ . Figure 7a reveals that samples with a τ phase had greater coercivity and wider hysteresis than the samples with a mostly κ phase. The κ phase in the samples with coexisting τ and κ likely contributes to magnetic domain wall pinning, which increases the magnetic coercivity. The sample with mostly κ phase did not have much other phase content, so the particles of those phases could not effectively pin magnetic domain walls. The single κ phase exhibits low magnetic hardness. The two-step heat treatment applied to Mn-Al-Ga-Ni resulted in greater magnetic coercivity as well as higher magnetic remanence. The magnetization at 2 T for Mn-Al-Ga-Ni two-step treatment annealed at 800 °C→500 °C was 339 k A   m 1 , which is a 38% improvement over the one-step annealed sample. Mn-Al-Ga-Ni with a two-step treatment at 1150 °C for 21 h followed by 500 °C for 6 h yielded the highest magnetic remanence and coercivity. Magnetic remanence and coercivity was 131 k A   m 1 and 0.07 T , respectively. Mn-Al-Ga-Ni annealed at 1050 °C for 24 h and 500 °C for 5 h measured nearly the same. The hysteresis in these M-H curves indicates that the two-step heat treatment provides a transformation pathway which improves magnetic remanence and coercivity. The phase transformation from ϵ to τ cracked Mn-Al-Ga-Ni when annealed above 1000 °C, indicating the presence of transformation strains. The transformation strain may increase the dislocation density and, thus, the density of pinning sites for domain walls resulting in increased magnetic remanence and coercivity.
Figure 12 shows B-H curves for (a) Mn-Al-Ga (ternary) and (b) Mn-Al-Ga-Ni (with Ni) where their BHmax was 0.4 k J   m 3 and 1.8 k J   m 3 , respectively. This BHmax is about two orders of magnitude smaller than the theoretical BHmax [26]. While the BHmax of Mn-Al-Ga-Ni is very small, the heat treatment has improved the value by a factor of 4.5 over the BHmax of the ternary alloy.
As reviewed by Keller and Baker [2], Mn-Al based permanent magnets may find applications for permanent magnet motors and generators. To qualify for such applications, the coercivity of these alloys needs to be further improved. We presented one strategy to do that. Our strategy may be combined with other mechanisms such as introducing defects via severe plastic deformation and the pinning of domain walls by additional impurities [2,3,27].
By comparing the microstructures of the ternary Mn-Al-Ga alloy and Mn-Al-Ga-Ni, we can identify the following differences. Figure 4 shows that the ternary microstructure transformed into a majority of τ phase with a minor amount of dendritic γ 2 phase. The micrograph of Mn-Al-Ga-Ni in Figure 10b revealed that a majority of the τ phase was maintained. However, the ratio of dendritic phases γ 2 and κ to the τ phase increased. These inclusions effectively act as pinning sites which impede domain wall motion [27]. The ternary sample did not exhibit fractures in contrast to Mn-Al-Ga-Ni. Fracture is a result of transformation strains that occur during the two-step heat treatment. Therefore, we cannot attribute the improved BHmax to the effect of Ni on the phase formation path. The two-step heat treatment drives the phase transformation of ϵ to τ and contributes to increased BHmax. This demonstrates that domain wall pinning through other phases is an effective mechanism for increasing the BHmax. In this study, we limited the treatments to thermal annealing. Other treatments such as thermomechanical treatments and severe plastic deformation followed by annealing may introduce a much higher density of defects, further increasing BHmax.

5. Conclusions

We demonstrated the γ 2 to τ phase transformation microscopically via the Bitter method for the ternary Mn-Al-Ga system. The magnetization of the ternary Mn-Al-Ga alloy increased by 20% to 450 k A   m 1 , which is the highest in this study with direct annealing at 500 °C. We conclude that the γ 2 to τ phase transformation was most effective at this temperature. For Mn-Al-Ga-Ni, only the sample annealed at 500 °C showed an increase in magnetization above the as-solidified sample, which is similar to the transformation pathway observed in the ternary Mn-Al-Ga alloy. Mn-Al-Ga-Ni formed a κ phase. XRD results suggest that the solubility limit of Ni into the τ phase was exceeded at 3 at.-% and resulted in the formation of the κ phase, which has a higher solubility for Ni. An alternative pathway was discovered for the formation of the τ phase via the 800 °C to 500 °C treatment. This is a new transformation mechanism since it involves a phase reaction from κ to τ . This transformation mechanism opens new opportunities for increasing the coercivity. We demonstrated a quadruple increase of the energy product of Mn-Al-Ga-Ni compared with the ternary alloy.

Supplementary Materials

The following supporting information can be downloaded at https://www.mdpi.com/article/10.3390/magnetochemistry9050128/s1, Figure S1: XRD patterns for one-step heat-treated samples of Mn-Al-Ga-Ni; Figure S2: XRD patterns for high-temperature annealed samples of Mn-Al-Ga-Ni; Figure S3: XRD patterns for two-step heat-treated samples of Mn-Al-Ga-Ni.

Author Contributions

Conceptualization, P.M. and S.P.; methodology, S.P. and J.M.; software, S.P., P.L and J.M.; validation, P.M.; formal analysis, P.M. and S.P.; investigation, S.P.; resources, P.M., P.L. and J.M.; data curation, S.P.; writing—original draft preparation, S.P.; writing—review and editing, P.M., P.L. and J.M.; visualization, S.P. and P.M.; supervision, P.M.; project administration, P.M.; funding acquisition, P.M. and S.P. All authors have read and agreed to the published version of the manuscript.

Funding

This research was funded in part by the Center for Advanced Energy Studies MaCS Seed Grant Program grant number CAES MSG 22-003.

Institutional Review Board Statement

Not applicable.

Acknowledgments

We wish to express gratitude for the technical support from Karthik Chinnathambi and Nick Bulloss as well as the laboratory equipment provided at crucial times by Harold Ackler.

Conflicts of Interest

The authors declare no conflict of interest.

References

  1. Patel, K.; Zhang, J.; Ren, S. Rare-earth-free high energy product manganese-based magnetic materials. Nanoscale 2018, 10, 11701–11718. [Google Scholar] [CrossRef] [PubMed]
  2. Keller, T.; Baker, I. Manganese-based permanent magnet materials. Prog. Mater. Sci. 2022, 124, 100872. [Google Scholar] [CrossRef]
  3. Cui, J.; Kramer, M.; Zhou, L.; Liu, F.; Gabay, A.; Hadjipanayis, G.; Balasubramanian, B.; Sellmyer, D. Current progress and future challenges in rare-earth-free permanent magnets. Acta Mater. 2018, 158, 118–137. [Google Scholar] [CrossRef]
  4. Park, J.; Hong, Y.; Bae, S.; Lee, J.; Jalli, J.; Abo, G.; Neveu, N.; Kim, S.; Choi, C.; Lee, J. Saturation magnetization and crystalline anisotropy calculations for MnAl permanent magnet. J. Appl. Phys. 2010, 107, 09A731. [Google Scholar] [CrossRef]
  5. Kōno, H. On the ferromagnetic phase in manganese-aluminum system. J. Phys. Soc. Jpn. 1958, 13, 1444–1451. [Google Scholar] [CrossRef]
  6. Pasko, A.; Mazaleyrat, F.; Lobue, M.; Fazakas, E.; Varga, L. Hard magnetic properties of melt-spun Mn-Al-C alloys. Epj Web Conf. 2013, 40, 06008. [Google Scholar] [CrossRef]
  7. Cardias, R.; Szilva, A.; Bergman, A.; Marco, I.D.; Katsnelson, M.; Lichtenstein, A.; Nordström, L.; Klautau, A.; Eriksson, O.; Kvashnin, Y.O. The Bethe-Slater curve revisited; new insights from electronic structure theory. Sci. Rep. 2017, 7, 4058. [Google Scholar] [CrossRef]
  8. Feng, L. Microstructure, Texture and Magnetic Properties of Powder Extruded Rare-Earth-Free MnAl-C-Ni Permanent Magnets. Ph.D. Thesis, Technische Universitat Dresden, Dresden, Germany, 2021. [Google Scholar]
  9. Matsumoto, M.; Morisako, A.; Kohshiro, N. Crystal Structure and Magnetic Properties of Mn-Al-Ni Ferromagnetic Films. IEEE Transl. J. Magn. Jpn. 1991, 6, 134–140. [Google Scholar] [CrossRef]
  10. Mican, S.; Benea, D.; Hirian, R.; Gavrea, R.; Isnard, O.; Pop, V.; Coldea, M. Structural, electronic and magnetic properties of the Mn50Al46Ni4 alloy. J. Magn. Magn. Mater. 2016, 401, 841–847. [Google Scholar] [CrossRef]
  11. Bohlmann, M.; Koo, J.; Wise, J. Mn-Al-C for permanent magnets. J. Appl. Phys. 1981, 52, 2542–2543. [Google Scholar] [CrossRef]
  12. Tsuboya, I.; Sugihara, M. The Magnetic Properties of the κ Phase in Mn–Al–Co System. J. Phys. Soc. Jpn. 1962, 17, 410. [Google Scholar] [CrossRef]
  13. Feng, L.; Nielsch, K.; Woodcock, T.G. Enhanced thermal stability of the τ-phase in MnAl-C alloys with Ni additions. J. Alloys Compd. 2021, 871, 159554. [Google Scholar] [CrossRef]
  14. Mix, T.; Bittner, F.; Müller, K.H.; Schultz, L.; Woodcock, T. Alloying with a few atomic percent of Ga makes MnAl thermodynamically stable. Acta Mater. 2017, 128, 160–165. [Google Scholar] [CrossRef]
  15. Mix, T.; Woodcock, T. Advanced thermal stability investigations of the Mn-Al-Ga system. Results Mater. 2020, 5, 100068. [Google Scholar] [CrossRef]
  16. Zhao, S.; Wu, Y.; Jiao, Z.; Jia, Y.; Xu, Y.; Wang, J.; Zhang, T.; Jiang, C. Evolution of intrinsic magnetic properties in L10 Mn-Al alloys doped with substitutional atoms and correlated mechanism: Experimental and theoretical studies. Phys. Rev. Appl. 2019, 11, 064008. [Google Scholar] [CrossRef]
  17. Zhao, H.; Yang, W.; Shao, Z.; Tian, G.; Zhou, D.; Chen, X.; Xia, Y.; Xie, L.; Liu, S.; Du, H.; et al. Structural evolution and magnetic properties of L10-type Mn54.5Al45.5−xGax (x = 0.0, 15.0, 25.0, 35.0, 45.5) phase. J. Alloys Compd. 2016, 680, 14–19. [Google Scholar] [CrossRef]
  18. Moze, O.; Pareti, L.; Ermakov, A. Neutron diffraction and magnetic investigations of Ga substituted MnAl permanent magnet materials. J. Appl. Phys. 1988, 63, 4616–4619. [Google Scholar] [CrossRef]
  19. Jia, Y.; Wu, Y.; Xu, Y.; Zheng, R.; Zhao, S.; Skokov, K.P.; Maccari, F.; Aubert, A.; Gutfleisch, O.; Wang, J.; et al. Roadmap towards optimal magnetic properties in L10-MnAl permanent magnets. Acta Mater. 2023, 245, 118654. [Google Scholar] [CrossRef]
  20. Coey, J. New permanent magnets; manganese compounds. J. Phys. Condens. Matter 2014, 26, 064211. [Google Scholar] [CrossRef]
  21. Kojima, S.; Ohtani, T.; Kato, N.; Kojima, K.; Sakamoto, Y.; Konno, I.; Tsukahara, M.; Kubo, T. Crystal transformation and orientation of Mn-Al-C hard magnetic alloy. In Proceedings of the AIP Conference Proceedings, American Institute of Physics, San Francisco, CA, USA, 3–6 December 1974; Volume 24, pp. 768–769. [Google Scholar]
  22. Van Den Broek, J.; Donkersloot, H.; Van Tendeloo, G.; Van Landuyt, J. Phase transformations in pure and carbon-doped Al45Mn55 alloys. Acta Metall. 1979, 27, 1497–1504. [Google Scholar] [CrossRef]
  23. Mix, T. Die L10-Struktur in Mn-Ga- und Mn-Al-Ga-Legierungen: Magnetische Eigenschaften und Phasenumwandlungen. Ph.D. Thesis, Technische Universitat Dresden, Dresden, Germany, 2018. [Google Scholar]
  24. Sologubenko, A.; Müllner, P.; Heinrich, H.; Kostorz, G. On the plate-like τ-phase formation in MnAl-C alloys. Z. Met. 2004, 95, 486–491. [Google Scholar] [CrossRef]
  25. Yanar, C.; Wiezorek, J.; Soffa, W.; Radmilovic, V. Massive transformation and the formation of the ferromagnetic L10 phase in manganese-aluminum-based alloys. Metall. Mater. Trans. 2002, 33, 2413–2423. [Google Scholar] [CrossRef]
  26. Popov, V.V.; Maccari, F.; Radulov, I.A.; Kovalevsky, A.; Katz-Demyanetz, A.; Bamberger, M. Microstructure and magnetic properties of Mn-Al-C permanent magnets produced by various techniques. Manuf. Rev. 2021, 8, 10. [Google Scholar] [CrossRef]
  27. Jiles, D. Introduction to Magnetism and Magnetic Materials; CRC Press: Boca Raton, FL, USA, 2016. [Google Scholar]
Figure 1. Time–temperature plot for one–step treatment.
Magnetochemistry 09 00128 g001
Figure 2. Time–temperature plot for two–step treatment.
Magnetochemistry 09 00128 g002
Figure 3. XRD patterns for the Mn-Al-Ga, one-step annealed samples.
Magnetochemistry 09 00128 g003
Figure 4. Mn-Al-Ga optical images: (a) non-annealed sample with ferrofluid applied and phases identified. Beak-shaped γ 2 phase area is highlighted in white and (b) 500 °C annealed sample with ferrofluid; inset shows transformation of γ 2 phase into τ phase of the beak-shaped phase.
Magnetochemistry 09 00128 g004
Figure 5. (a) XRD patterns for the two-step heat-treated Mn-Al-Ga samples and (b) microstructure imaged with ferrofluid for the two-step annealed sample.
Magnetochemistry 09 00128 g005
Figure 6. Mn-Al-Ga-Ni samples annealed at (a) 500 °C and etched, (b) 650 °C and non-etched, (c) 800 °C and etched, and (d) 1050 °C and non-etched.
Magnetochemistry 09 00128 g006
Figure 7. Mn-Al-Ga-Ni sample magnetic hysteresis measurements for one-step annealing temperatures (a) up to 2 T applied magnetic field and (b) up to 0.2 T applied magnetic field.
Magnetochemistry 09 00128 g007
Figure 8. BSE image for 1050 °C annealed Mn-Al-Ga-Ni sample showing formation of ϵ and κ phases and (inset) EDS data showing ϵ and κ phase compositions.
Magnetochemistry 09 00128 g008
Figure 9. XRD comparison indicating the κ to τ transformation of the two-step 800 °C→500 °C annealed Mn-Al-Ga-Ni.
Magnetochemistry 09 00128 g009
Figure 10. Mn-Al-Ga-Ni (a) M-H curves for the two-step heat treatment up to 0.5 T applied magnetic field and (b) annealed at 1050 °C→500 °C; ferrofluid contrasts τ and non-magnetic phases.
Magnetochemistry 09 00128 g010
Figure 11. XRD pattern for Mn-Al-Ga, one-step annealed sample at 500 °C displaying the (110) and (002) reflections with peak splitting.
Magnetochemistry 09 00128 g011
Figure 12. B−H curves for (a) the Mn-Al-Ga alloy annealed at 500 °C for 24 h and (b) Mn-Al-Ga-Ni annealed at 1150 °C for 21 h followed by 500 °C for 6 h.
Magnetochemistry 09 00128 g012
Table 1. Nominal compositions and measured masses of alloys.
SampleNom. Comp. (at.-%)Mn (g)Al (g)Ga (g)Al73.5Ni26.5 (g)
Mn-Al-Ga aMn55Al39.4Ga5.633.811.94.4-
Mn-Al-Ga-Ni aMn52Al39.4Ga5.6Ni331.99.34.44.5
a Alloy with low-purity Mn.
Table 2. Chemical analysis of Mn-Al-Ga alloy for phase identification compared to Mix et al. [14]. High-purity Mn was used for these measurements.
Nominal CompositionPhaseMean Composition (at.-%)Ref.
MnAlGa
Mn55Al39.375Ga5.625 τ 54.340.25.5[14]
Mn55Al39.4Ga5.6 τ 54.240.15.72-
Mn55Al38.57Ga6.43 γ 251.641.37.0[14]
Mn55Al39.4Ga5.6 γ 250.941.27.9-
Table 3. Low-purity and high-purity Mn-Al-Ga magnetization for various heat treatments.
SampleHeatM2T Mr Hc XV
Treatment a(kA m−1)(kA m−1)(T)(10−3)
Mn-Al-Ga bNo HT287---
500 °C-24 h482---
Mn-Al-Ga cNo HT28034.80.02-
500 °C-24 h45080.60.02-
650 °C-24 h44571.50.02-
800 °C-24 h2--1.22
1050 °C-24 h6--3.91
1150 °C-24 h7---
a Rapid quenching applied post-anneal; b High-purity Mn; c Low-purity Mn.
Table 4. Mn-Al-Ga-Ni magnetization after one-step heat treatments.
SampleHeat Treatment aM2T (kA m−1)Mr (kA m−1)Hc (T)
Mn-Al-Ga-NiNo HT351320.01
500 °C-24 h416600.02
650 °C-24 h349460.01
800 °C-24 h246--
a Rapid quenching applied post-anneal.
Table 5. Magnetization of Mn-Al-Ga-Ni with various two-step heat treatments.
SampleHeat Treatment aM2T (kA m−1)Mr (kA m−1)Hc (T)
Mn-Al-Ga-Ni1150 °C-21 h → 500 °C-6 h3611310.07
1100 °C-14 h → 500 °C-6 h311--
1100 °C-6 h → 500 °C-5 h260610.03
1050 °C-24 h → 500 °C-5 h3771260.06
1000 °C-6 h → 500 °C-6 h321--
800 °C-24 h → 500 °C-24 h339--
a Rapid quenching applied post-anneal.
Disclaimer/Publisher’s Note: The statements, opinions and data contained in all publications are solely those of the individual author(s) and contributor(s) and not of MDPI and/or the editor(s). MDPI and/or the editor(s) disclaim responsibility for any injury to people or property resulting from any ideas, methods, instructions or products referred to in the content.

