Article

The Phase Space Density Evolution of Radiation Belt Electrons under the Action of Solar Wind Dynamic Pressure

1
School of Physics and Materials Science, Nanchang University, Nanchang 330047, China
2
Institute of Space Science and Technology, Nanchang University, Nanchang 330047, China
3
Jiangxi Provincial Key Laboratory of Interdisciplinary Science, Nanchang University, Nanchang 330047, China
4
School of Resources and Environment, Nanchang University, Nanchang 330047, China
*
Author to whom correspondence should be addressed.
Magnetochemistry 2023, 9(2), 52; https://doi.org/10.3390/magnetochemistry9020052
Submission received: 20 November 2022 / Revised: 4 February 2023 / Accepted: 6 February 2023 / Published: 9 February 2023
(This article belongs to the Special Issue Magnetodynamics of Space Plasmas)

Abstract

:
Earth’s radiation belt and ring current are donut-shaped regions of energetic and relativistic particles, trapped by the geomagnetic field. The strengthened solar wind dynamic pressure (Pdyn) can alter the structure of the geomagnetic field, which can bring about the dynamic variation of radiation belt and ring current. In the study, we firstly utilize group test particle simulations to investigate the phase space density (PSD) under the varying geomagnetic field modeled by the International Geomagnetic Reference Field (IGRF) and T96 magnetic field models from 19 December 2015 to 20 December 2015. Combining the observation of the Van Allen Probe, we find that the PSD of outer radiation belt electrons evolves towards different states under different levels of Pdyn. In the first stage, the Pdyn (~7.94 nPa) results in the obvious rise of electron anisotropy. In the second stage, there is a significant reduction in PSD for energetic electrons at all energy levels and pitch angles under the action of intense Pdyn (~22 nPa), which suggests that the magnetopause shadowing and outward radial diffusion play important roles in the second process. The result of the study can help us further understand the dynamic evolution of the radiation belt and ring current during a period of geomagnetic disturbance.

1. Introduction

The radiation belts are areas of magnetically trapped energetic/relativistic electrons and ions surrounding the Earth [1]. These particles can cause serious damage to the satellites and astronauts working in space [2]. In addition, energetic particles from the radiation belt can precipitate into the atmosphere and have a significant impact on the chemistry and composition of the Earth’s atmosphere [3,4]. For example, Rodger et al. (2010) show that the electron precipitation can lead to a large increase in odd nitrogen (NOx) and odd hydrogen (HOx), and when the electron precipitation been deposited into the polar winter atmosphere, it would have led to >20% in situ decreases in O3 at 65–80 km altitudes through catalytic HOx cycles [4]. Duderstadt et al. (2021) show that higher energy electron precipitation cause important contributions to atmospheric ionization and modeled NOx concentrations in the mesosphere and upper stratosphere [5]. Studying the response of radiation belts electron flux to the solar wind dynamic pressure (Pdyn) can indirectly help us understand the potential chemical processes in the Earth’s atmosphere. In general, there are two distinct electron radiation belts, which are named inner and outer radiation belts. The inner belt is quite stable, which is centered at L~1.5 RE. In addition, the outer radiation belt spans from L~3 RE to L~8 RE. The status of the outer radiation belt significantly changes on various timescales, and the electron flux of outer radiation belt is dependent on the dynamic imbalance between the electron acceleration and loss processes [6]. Since the magnetospheric compression contributed by strengthened Pdyn can change the structure of the geomagnetic field, it may result in obvious variation in electron phase space density (PSD) in the outer radiation belt. For example, the strengthened Pdyn can increase the anisotropy and perpendicular heating of the radiation belt electrons owing to the conservation of the first adiabatic invariant under the condition of strengthened Pdyn. On the other hand, the more obvious day-night azimuthal asymmetry of the Earth’s magnetic field due to enhanced Pdyn can bring about the drift shell splitting of radiation electrons [7]; the electrons with smaller equatorial pitch angle (PA) drift at smaller radial distances that those with larger equatorial PA [8,9]. This induces the drop out of radiation belts electrons with PA near 90° during geomagnetic disturbance, because they may move from closed to open drift shells. Therefore, the drift shell splitting may also lead to the decrease in PSD of radiation belt electrons.
We can see that the Pdyn plays important roles in both energization and loss of radiation belt electrons, its influence on electron PSD is very complex due to the competition of various mechanisms. Using multi-satellite simultaneous observations, Xiang et al. (2016) analyze the delay of the electron radiation belt during a more intense Pdyn pulse [10]. Zong et al. (2022) suggest that the ultra-low frequency waves related to solar wind pulses affect the evolution of the electron radiation belt [11]. Smirnov et al. (2022) present an empirical model of the equatorial electron pitch angle distributions in the outer radiation belt, the model can be used for converting the long-term data sets of electron fluxes to PSD in terms of adiabatic invariants [12].
Test particle simulation is a useful method to analyze the motion of the charged particle in the magnetosphere, especially under the condition of varying magnetic and electric fields. For example, using test particles simulation, Ukhorskiy et al. (2006) suggest that the evolution of the magnetic field is one of the principal factors governing the global behavior of the storm time electron belt [13], Saito et al. (2010) examine the drift loss of relativistic electrons by magnetopause shadowing and suggest that magnetopause shadowing actually causes the loss of the outer radiation belt [14], Califf et al. (2017) proved that the measured electric fields can account for the energization of electrons up to at least 500 keV in the slot region through inward radial transport [15]. Wang et al. (2017) observed that a convective electric field penetrating into the inner magnetosphere can produce zebra striped structures of ions and electrons, whose time evolution is determined by the total drift velocity of ions and electrons [16].
In this study, unlike most previous studies on test particles simulation, we use the IGRF (internal source field) and T96 (external source field, controlled by solar wind parameters) magnetic field models for magnetospheric magnetic field construction instead of using the ideal dipole magnetic field model [17]. Using the group test particle simulations, we simulated the adiabatic motion of radiation belt electrons under a case of very intense Pdyn on 19 December 2015, and further analyzed the PSD evolution of the outer radiation belt electrons near noon side. Combining the observation of Van Allen Probe, we find that the PSD of outer radiation belt electrons evolving towards different states under different levels of Pdyn, and the adiabatic motions of radiation belt electrons can roughly explain the variation of outer radiation belt electron PSD under Pdyn, although the whistler mode waves also play a little role in the electron with lower energies. These results can help us understand how PSD of radiation belt electrons responds to intense Pdyn.

2. Data and Methods

2.1. Instrument and Data

In this study, the differential flux of energetic electrons is measured by the Magnetic Electron Ion Spectrometer (MagEIS, NASA, Washington, DC, USA) onboard Van Allen Probe satellites [18]. The Van Allen Probe satellites, which are also called Radiation Belt Storm Probes (RBSP, NASA, USA), were launched on 30 August 2012. These satellites operate around the Earth with a perigee of 1.1 RE and apogee of 5.8 RE in the inner magnetosphere [19], so they provided a good opportunity to observe the evolution of the radiation belt. In addition, the 1 min resolution OMNI data (from the Space Physics Data Facility (SPDF) of NASA’s Goddard Space Flight Center, Greenbelt, MA, USA) are utilized to analyze the solar wind parameters, including the interplanetary magnetic field (IMF), Pdyn.

2.2. Event Observations

Figure 1a–c show the overview of solar wind parameters and geomagnetic indices for the event which occurred from 04:39:26 UT on 19 December 2015 to 07:30:47 UT on 20 December 2015. Following the sudden increase of Pdyn (from ~2 nPa to ~10 nPa) at 16:30 UT on 19 December 2015, the SYM−H increased from ~−8 nT to 20 nT, and a substorm is triggered (as shown in Figure 1a). At 18:07 UT on 19 December, the Pdyn rises sharply for the second time (from 8 nPa to 22 nPa), which also triggered a substorm. As shown in Figure 1a,b, during the time interval, there is a distinct enhancement of the SYM−H index, and the z-component of IMF basically shows a positive value. Figure 1d shows the calculated distance between the Geocenter and magnetopause under the subsolar position. A function form as below is used to model the subsolar point of magnetopause [20,21]:
R 0 = 12.544 P dyn + P mag 0.194 1 + 0.305 × e x p 0.0573 × B z 1 e x p 2.178 × B z + 1
The calculation suggests that the two sudden enhancements of Pdyn obviously vary the position of magnetopause and intensities of magnetospheric magnetic field. As shown in Figure 1d, the subsolar point of magnetopause decreased from 10.8 RE to 7.4 RE while the first increase of Pdyn took place around 16:30 UT on 19 December 2015, and its position further decreased from 8.5 RE to 6.6 RE while the second increase of Pdyn around 18:07 UT on 19 December 2015.
The red and blue curves in Figure 1e indicate the magnetic local time (MLT, h) and L in RBSP-A orbit during the time interval. Figure 1f–i exhibits the electron differential flux with energies of 464.4 keV, 593 keV, 741.6 keV and 901.8 keV observed by RBSP-A, respectively. It implies that the fluxes and anisotropies of radiation belt electrons notably change under the contribution of strengthened Pdyn. Comparing with the PSDs of radiation belt electrons observed by RBSP-A during the first outbound orbit (indicated by the first black box while quiet Pdyn), the electron anisotropies with all energy levels RBSP-A during the second outbound orbit of RBSP-A (indicated by the second black box, affected by the first sudden increase of Pdyn) obviously increase. The differential fluxes of electrons with larger PA near 90° evidently raise, and the differential fluxes of electrons along the geomagnetic field line decrease. Interestingly, during the third outbound orbit of RBSP-A (indicated by the third black box, affected by the second sudden increase of Pdyn), the electron PSDs corresponding to all PAs and energy levels dramatically decrease, it seems that a huge amount of radiation belt electrons have been lost.

2.3. The Method of Test Particle Simulation

Then, we use group test particle simulations to analyze the evolution of radiation belt electron PSD under the action of intense Pdyn, and we simulate the particle drift motions about 40 minutes. Here, the first and second adiabatic invariants of electrons are considered conserved in the simulation. In order to exhibit the influence of intense Pdyn on the structure of the geomagnetic field, the tracing of geomagnetic field lines and corresponding field intensities are calculated by IGRF and T96 models. In order to reflect the change of the geomagnetic field from the quiet period to the disturbance period in the short time, we consider this change to be dynamic and approximately monotonic. The constructed magnetospheric magnetic field of the Earth is dynamically changed by the time-varying geomagnetic and solar wind parameters. In addition to varied magnetic fields, the motions of electrons are also contributed by the magnetospheric electric field, here we adopt stationary co-rotating electric field (Er) and dynamic convection electric field (Ec) [22].
The Er is expressed as follows:
E r = ω E × L × B 0
where ωE is the angular velocity of Earth’s rotation, B0 is the magnetic fields in the magnetic equator.
The Ec is described by the Volland–Stern potential field [23,24,25]. This convective electric field model considers the influence of the solar wind on the magnetospheric electric field and is widely used. The potential field formula as follows:
E c = Φ  
where Φ is convection electric potential,
Φ = 0.12 × E s w × r 2 × sin ϕ 6.62 × R e   V
where Esw is solar wind electric field, ϕ is geomagnetic longitude (ϕ = 0° corresponds to MLT = 0 h, ϕ = 90° corresponds to MLT = 6 h).
Using the above models, we calculate the motions of electrons as the combination of velocity due to gradient, curvature and E × B drifts [26,27]. The arbitrarily local velocity of gradient and curvature drift is expressed as:
V G C = V G + V C = m q B 3 v 2 2 + v 2 B × B + m v 2 q B 2 × B
where m as the relativistic mass m = m 0 × γ (m0 is rest mass; the Lorentz factor,   γ = 1   v / c 2 1 2 .
Then the bounce-averaged velocity of gradient and curvature drift is expressed as:
V 0 = 1 τ b 0 τ b V G C d t = 2 τ b s m s m V G C d s v s
where τb indicates the bouncing period,
τ b = 2 s m s m d s v s
Considering the contribution of magnetospheric electric field, the bounce-averaged velocity of the electron is assumed as:
V = V 0 + E 0 × B 0 B 0 2
where E0 and B0 indicates the electric and magnetic fields in the magnetic equator, respectively.
As an example, the trajectories of radiation belt electrons under the condition of SYM−H = 12.47 nT, Pdyn = 7.94 nPa, Bygsm = −3.56 nT, Bzgsm = 7.20 nT are shown in Figure 2. These electrons are emitted into the position with MLT ~0 h and L ~5 RE. The blue (red) curve indicates the trajectory of electron with initial energy ~600 keV and PA ~10° (60°). It takes about 10 min for these electrons to drift from midnight to noon. In addition, we can see that the electrons with larger initial PA drift to higher L shells on the dayside. As the adiabatic invariant conservation during the drift process, the electron with initial energy ~600 keV and PA ~10° evolves to one with energy ~280 keV and PA ~15° while it drifts to noon. On the other hand, the electron with initial energy ~600 keV and PA ~60° evolves to one with energy ~512 keV and PA ~85° while it drifts to noon. We can see that both the energies and PA of radiation belt electrons significantly change due to intense Pdyn driven distortion of the geomagnetic field.
By simulating the simulated magnetic field from IGRF and T96 magnetic field models under different geomagnetic conditions, we find that there is a difference between the simulated geomagnetic field and observed values under strong Pdyn. In order to match the magnetic field intensity data observed by RBSP-A, we made some simple modifications for the input parameters of the T96 model. For the event from 14:00 UT to 18:05 UT on 19 December 2015, the real time SYM−H, Bygsm, Bzgsm, and three times Pdyn are used as input parameters for the T96 model. The observed and modeled magnetic field intensities along the trajectory of RBSP-A are shown in Figure 3. The black curve displays the magnetic field intensities (BA2) observed by RBSP-A during the second outbound orbit, the blue discrete circles display the magnetic field intensities (Bmo) simulated by inputting the original geomagnetic parameters, and the red discrete circles display the magnetic field intensities (Bmc) simulated by inputting three times the Pdyn. We can see that the BA2 is much larger than Bmo, which is obtained with input from the original geomagnetic parameters. On the other hand, the Bmc is basically consistent with the observed magnetic field. So, the SYM−H, Bygsm, Bzgsm, and three times Pdyn are used as input parameters of the T96 model in the following simulation.
In order to investigate the mechanism of PSD evolution, we used group test particle simulations to simulate the variation of electron PSD under the action of intense Pdyn on 19 December 2015. We consider the distribution of flux is uniform over the MLT during quiet periods of geomagnetic. In order to obtain the initial electron flux distribution function (during quiet period of Pdyn), the observed differential flux of energetic electrons (at each energy channel measured by RBSP-A) from ~6:20 UT to ~9:10 UT (while the Pdyn is relatively low, the first outbound orbit indicated in Figure 1) as a function of L shell is fitted with the summation of several Maxwellian functions. Then, the fitted flux distribution is interpolated at 1 keV steps (from 400 keV to 900 keV). The distribution achieved by the above method is considered as the initial energetic electron distribution. Moreover, the initial electron flux is assumed to be the same at different MLTs. Then the test particles are emitted into the time-varying magnetic and electric fields. If the particles drift out of the model magnetopause, the particles are considered as a loss.

3. Results

Figure 4 shows the evolution of equatorial electron PSD (averaged from L ~5.4 RE to L ~5.8 RE) in the outer radiation belt as functions of PA and energy. Figure 4a shows the PSD (with energy from 450 to 770 keV, and PA from 0° to 90°) observed by RBSP-A during the first outbound orbit from 7:50 UT to 8:50 UT on 19 December 2015. It seems that the electrons with all energy levels display anisotropic distribution. Figure 4b shows the PSD observed by RBSP-A during the second outbound orbit from 16:20 UT to 17:15 UT on 19 December 2015. We can see that more electrons gather around PA ~90°, especially for the electrons in higher energy levels. On the other hand, the PSD of electrons with lower PAs is lower. Figure 4c shows the result of equatorial PSD from group test particle simulations under the action of realistic Pdyn from 16:10 UT to 16:40 UT. In the simulated model, the motions of electrons are assumed as adiabatic. It implies that the adiabatic motions of group test particles affected by intense Pdyn can roughly match the evolution of electron PSD from observation. Both the observation and simulation suggest that the anisotropies of electrons obviously increase.
In order to explain it better, Figure 4d shows the anisotropy AT as a function of energy from observations and test particle simulations. For electrons with energies of several hundreds keV, the relativistic effect needs to be considered, in this condition, the thermal pressure tensor ( P ) can be defined by the following formula [28,29,30,31]:
P i j = v i p j f p d 3 p = γ m 0 v i v j f v d 3 v ; i , j x , y , z
where the Lorentz factor γ = 1   v / c 2 1 2 ; f p is a function of the PSD associated with the momentum p , and   P z z = P ;   P x x , y y = P ;   P ij , i j = 0 ; f v is a function of the PSD associated with the particle velocity v .
Combining the relationship between the thermal pressure tensor ( P ) and the temperature, P = n k B T ;   P = n k B T ;   P = n k B T [28], where n is the hot plasma number density, the parallel and perpendicular temperatures can be defined per the following formulas:
T = P n k B = m 0 n k B γ v 2 f v d 3 v
T = P n k B = m 0 2 n k B γ v 2 f v d 3 v
The anisotropy can be defined as the following formula:
A T = T T 1 = m 0 2 n k B γ v 2 f v d 3 v m 0 n k B γ v 2 f v d 3 v 1 = γ v 2 f v d 3 v 2 γ v 2 f v d 3 v 1
According to the Equation (12), when the PSD distribution of particle is isotropic, A T = 0 .
The blue curve in Figure 4d indicates the averaged anisotropies of electron PSD in the outer radiation belt (averaged PSD from L ~5.4 RE to L ~5.8 RE) calculated from the observation from RBSP-A during the first outbound orbit from 7:50 UT to 8:50 UT on 19 December 2015. There is a slight upward trend of anisotropy with the increase in electron energy levels. The anisotropy for the electrons with energy ~464 keV is 0.18, and it is 0.21 for the electrons with energy ~742 keV. The red curve indicates the averaged anisotropies calculated from the observation of RBSP-A during the second outbound orbit from 16:20 UT to 17:15 UT on 19 December 2015, and the yellow curve indicates the corresponding anisotropies calculated from the test particle simulation result. Both observation and simulation results suggest that the anisotropies obviously increase. The enhancement of anisotropies is more notable for the electrons with higher energy levels, for example, the anisotropies of the electron with energy ~742 keV for both observation and simulation reach >0.7. Two mechanisms verified by the test particle simulation can explain the enhancement of anisotropy: (1) the enhanced magnetospheric compression due to strong Pdyn causes the perpendicular heating owing to conservation of the first adiabatic [32,33], (2) the enhanced z component of the magnetic field can cause the particles with high initial equatorial PA and mirror at high latitudes without passing through the equator, which is called as Shabansky orbits [34]. These also cause the enhancement of electron anisotropy near the geomagnetic equator.
Moreover, the anisotropies calculated from observation is slightly higher than that calculated from simulation result at lower energy channels (~462 keV to ~514 keV), it maybe because that electron PA scattering driven by whistler mode waves can transport the energetic electrons into the loss cone [35]. For example, chorus waves can cause efficient pitch angle scattering of electrons of 10 keV~1 MeV near the loss cone at a rate of the order of 10−3 s−1 [10]. However, the process of wave particle interaction is not considered in our simulation.
While 18:07 UT on 19 December 2015, the Pdyn further increase based on the previous. The Pdyn reaches a very high level, about 22 nPa. Following the further enhancement of Pdyn, the position of magnetopause reduces to 6.69 RE. From 18:07 UT to 22:35 UT, the RBSP-A operates with the inbound orbit (from apogee to perigee) on the afternoon side, so it hardly observes the variation in electron PSD in the outer radiation belt during the time interval. However, during the next outbound from 00:10 UT to 03:10 UT on 20 December, RBSP-A detected obvious dissipation with all PAs and energies (as shown in Figure 1), which maybe owing to the further enhancement of the compressed geomagnetic field and the reduction of magnetopause position.
Similar to Figure 4, the high-energy electron PSD evolution for L = 5.4 RE to 5.8 RE is shown in Figure 5 for the second Pdyn enhancement. Figure 5a displays the PSD observed by RBSP-A during the orbit from 16:20 UT to 17:15 UT on 19 December. Figure 5b shows the PSD observed by RBSP-A during the third outbound orbit from 01:38 UT to 02:30 UT on 19 December 2015. We can see that the PSD of electrons with energies from 450 keV to 770 keV is reduced more than three times. Figure 5c shows the result of equatorial PSD from group test particle simulations under the action of realistic Pdyn. In the simulated model, the motions of electrons are assumed adiabatic. It implies that the adiabatic motions of group test particles affected by intense Pdyn can roughly match the evolution of electron PSD from observation. Under the action of intense Pdyn, the electrons drift towards higher L shells on the dayside. Since the position of magnetopause decreased to 6.69 RE, a large number of electrons drift outside the magnetopause and loss into the interplanetary space. Figure 5d shows the variation in the anisotropy during this process. Compared to the variation during the second orbit, the electron PSD during the third orbit shows a significant reduction in the value of anisotropy at all energy levels. In addition, it seems that the higher the energy levels, the greater the decrease. The results of the test particle simulations show the same phenomenon.

4. Discussion

The evolution of energetic electrons in the inner magnetosphere is influenced by many mechanisms [36,37,38], including plasma sheet electron injections, wave-particle interactions, outward transport, magnetopause shadowing and changes in the structure of the geomagnetic field [39,40,41,42,43]. For radiation belt electrons, non-adiabatic processes are primarily associated with energy and momentum transfer during interactions with various magnetospheric waves [44,45,46,47]. In some previous studies on the wave-particle interaction of inner magnetospheric particles, for example, using multi-satellite simultaneous observations, Turner et al. (2014) show direct evidence of the competitive nature of different wave-particle interactions controlling the electron radiation belt relativistic electron fluxes [38].
Although non-adiabatic processes are very important and may play leading roles in radiation belt evolution in a lot of conditions. In this study, we mainly analyze the adiabatic processes in the condition that the structure of magnetospheric magnetic fields obviously change in a short time interval. As the strengthened Pdyn alters the structure of the geomagnetic field, this can change the drift shells, energy and PA of charged particles. This can result in acceleration and heating of electrons. In addition, the compression of geomagnetic field under the action of Pdyn can lead to the outward radial diffusion of energetic particles, especially for the energetic particles with high PAs. These energetic particles may drift outside the magnetopause and loss into the interplanetary space. Ni et al. (2016) suggests that the occurrence rate of outer-zone relativistic electron butterfly distribution is closely related to the intensity of Pdyn, because the intense Pdyn can lead to obvious loss of relativistic electrons with PAs near 90° [48].
In the study, using the method of group test particle simulations, an example from 04:39:26 UT on 19 December 2015 to 07:30:47 UT on 20 December 2015 is analyzed to investigate the adiabatic evolution process of energetic electrons (from 450 keV to 770 keV) in the inner magnetosphere under the action of strong Pdyn. During this event, we focused on the two enhancements in the Pdyn. The Pdyn enhancement leads to the earthward compression of the magnetopause, and the structure of geomagnetic field is obviously changed. Fortunately, the apogee of the RBSP-A was located at L ~5.9 RE and MLT ~12 h, it provides a good opportunity to observe the evolution of relativistic electron PSD in the outer radiation belt. The result suggests that there is a significant difference in the particle PSD evolution under the two Pdyn enhancements.
In the first stage, the Pdyn (~7.94 nPa) results in the obvious change in PSD and enhanced anisotropy. The PSD of high PA electrons is enhanced, while the PSD of low PA electrons is reduced, and the higher the energy levels, the larger rise of anisotropy. By performing group test particle simulations during the first stage, we find that with the conservation of the first adiabatic invariant, the enhanced magnetic field causes the acceleration of the electron in the vertical direction. Furthermore, the enhanced z component of magnetic field can cause the Shabansky orbits of electrons. These can lead to a significant rise of anisotropy.
In the second stage, there is a significant reduction in PSD for energetic electrons at all energy levels and PAs under the action of intense Pdyn (~22 nPa). The Pdyn is three times higher than the first, resulting in too much earthward compression of the magnetopause. A large number of electrons move from closed to open drift shells and loss into interplanetary. In addition, the electrons with smaller equatorial PA drift at smaller L shells than those with larger equatorial PA. As a result, a more significant reduction in electron PSD with high PAs is observed, which leads to a reduction in electron anisotropy.
It implies that the particle acceleration mechanism plays a dominant role in the first stage under the action of enhanced Pdyn. On the other hand, the particle loss mechanism plays a dominant role in the second stage. The group test particle simulations of the electron adiabatic process well reproduce the observed PSD evolution.

5. Conclusions

The present study is dedicated to investigate the behaviors of the outer radiation belt electron PSD in response to two intense Pdyn enhancements on 19 December 2015. The PSD observed by RBSP-A and modeled by the group test particle simulations show that the evolution of the electron flux in the Earth’s outer radiation belt is strongly related to the structure of the inner magnetosphere magnetic field. The main conclusions are summarized as follows:
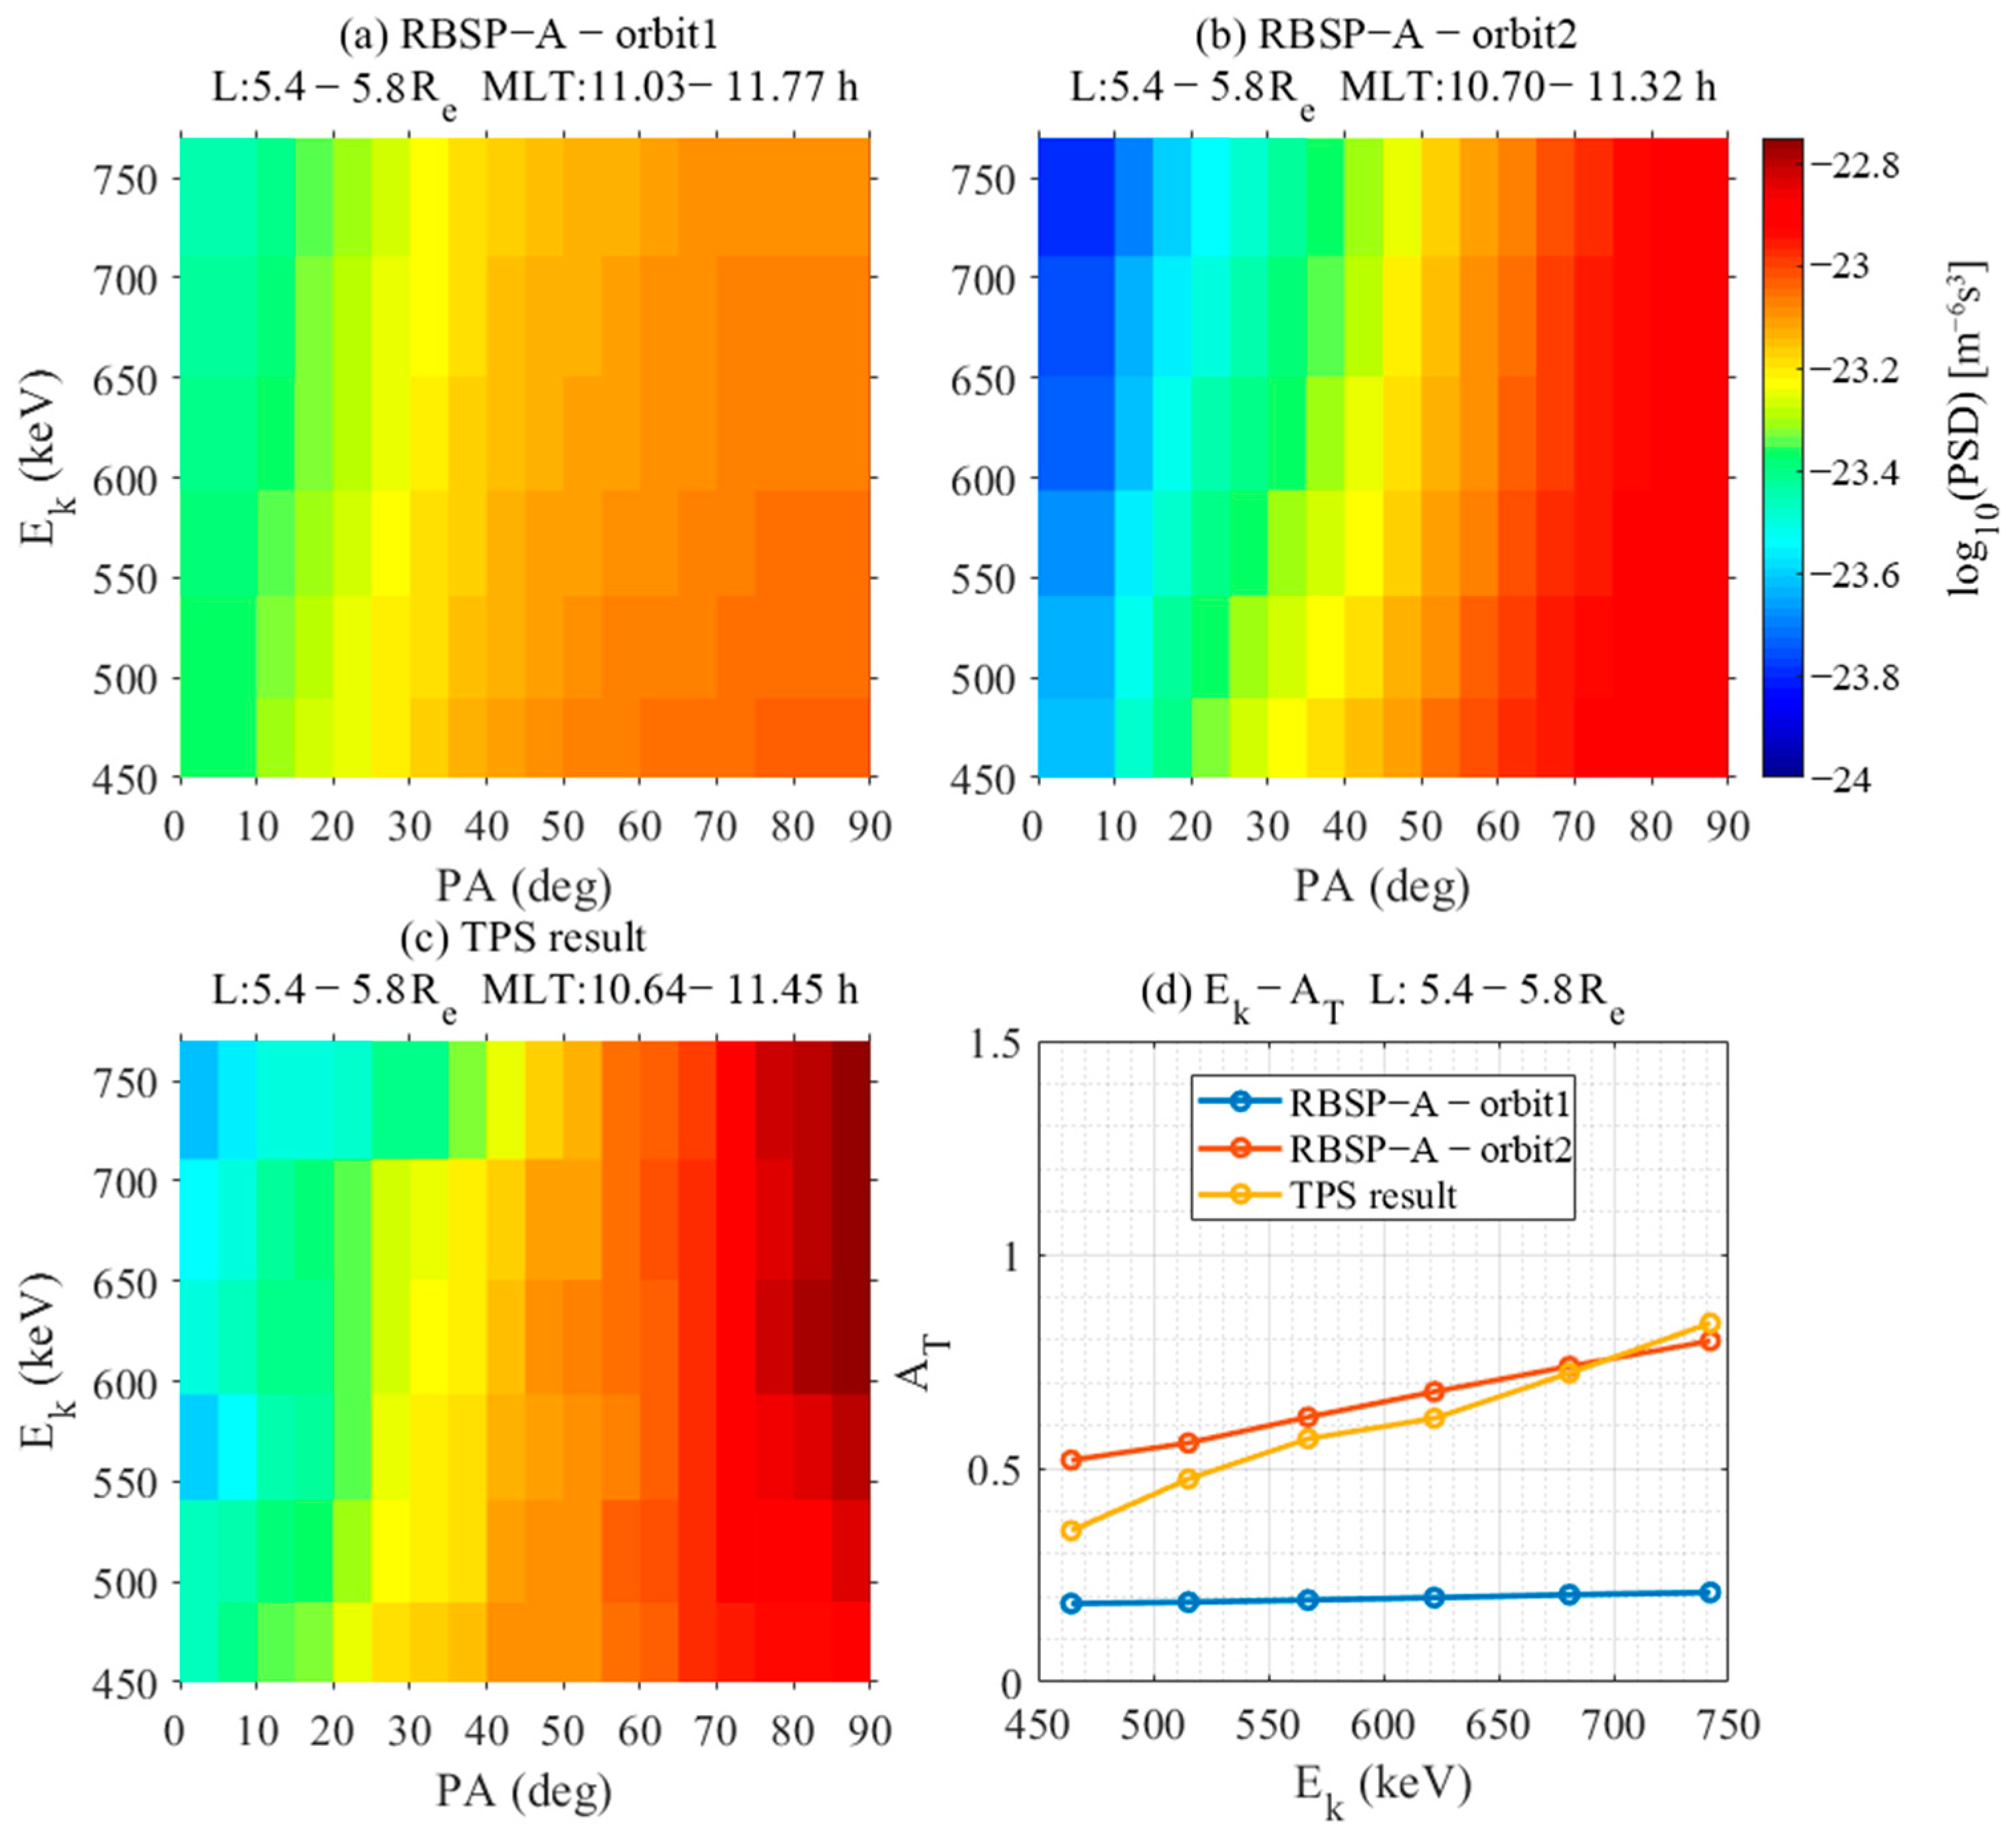
  • The electron PSD in the outer radiation belt is sensitive to the change of the geomagnetic field structure, which is controlled by solar wind. The RBSP-A observations on 16:20 UT 19 December 2015 demonstrate that the sharp increase of Pdyn leads to the electron flux in the energy range of 464–901 keV enhance by about 0.3 orders of magnitude within 10 min;
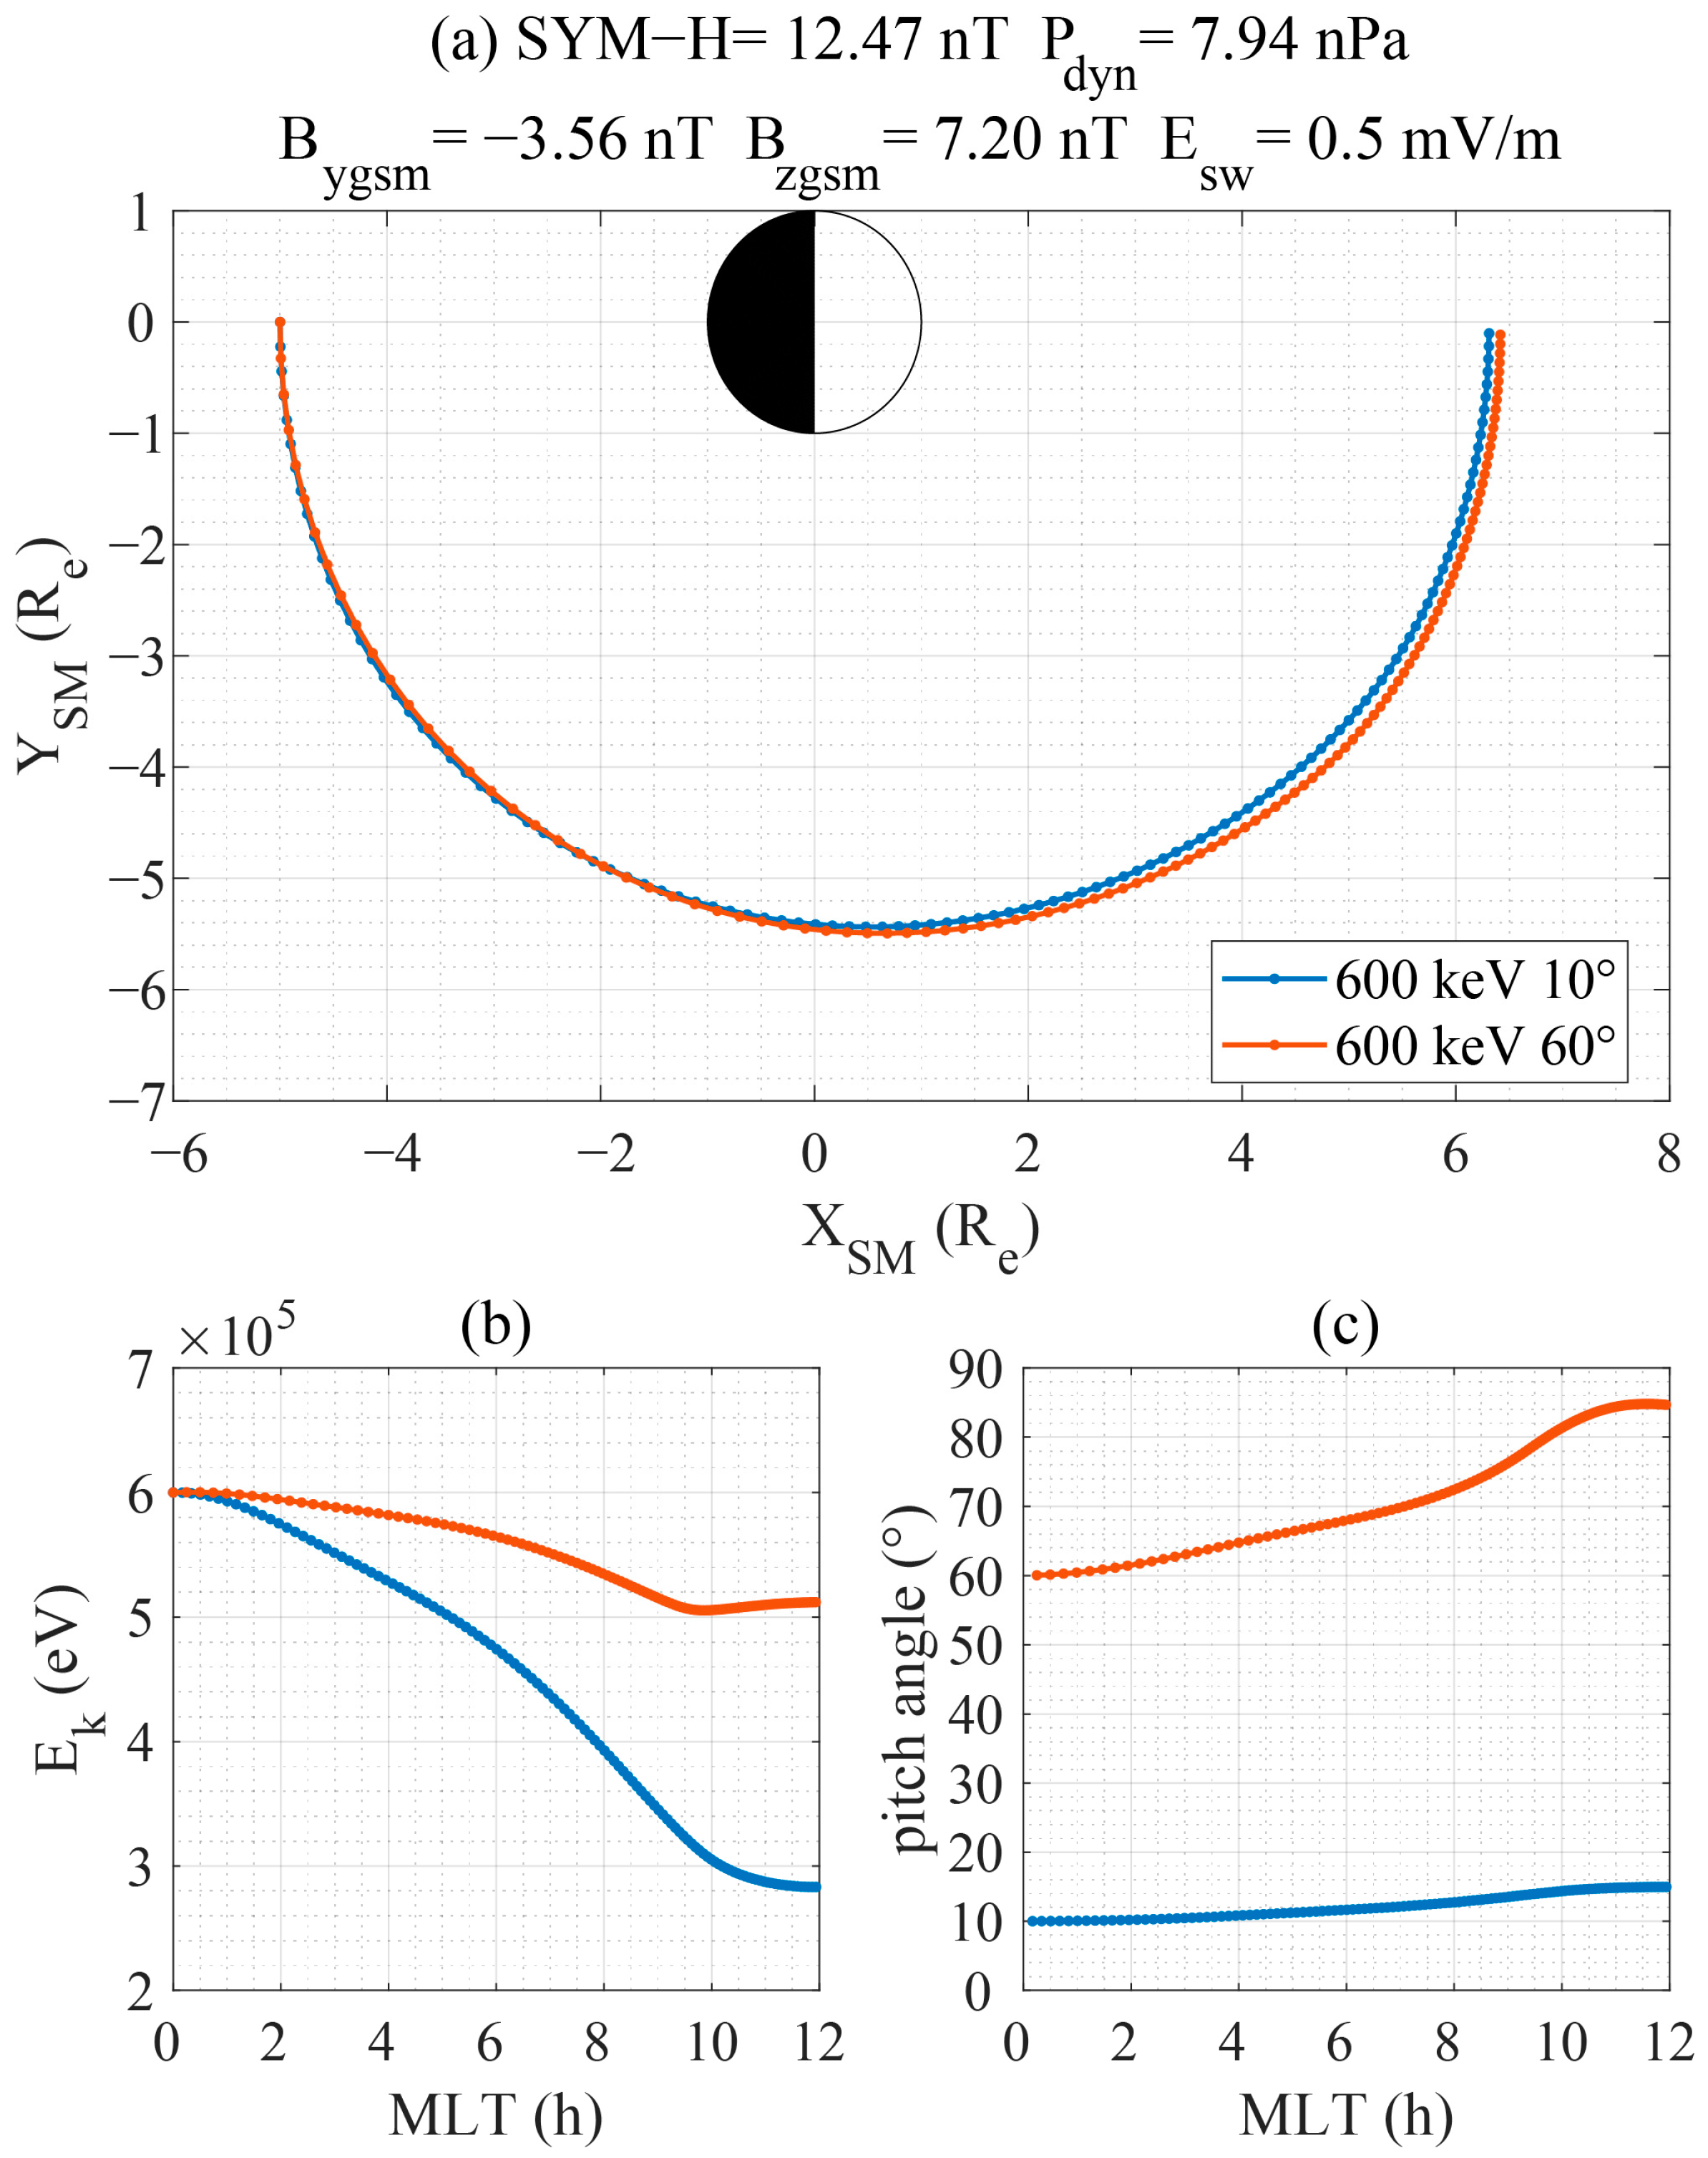
  • Under the action of medium Pdyn enhancement (~8 nPa), the electron PSD at high PAs and the energetic electron AT obviously increases. The increase is more obvious for electrons with higher energy levels;
  • Under the action of very intense Pdyn (~22 nPa), the electron PSD at all energy and PAs reduce. The anisotropy also decreases by about 0.25, which is related to the magnetopause shadowing effect.

Author Contributions

Conceptualization, H.L. and P.H.; methodology, H.L.; software, P.H. and L.S.; validation, Z.O., L.S., B.F. and W.Z.; investigation, H.L. and P.H.; resources, H.L.; data curation, P.H., Y.W. and A.Y.; writing—original draft preparation, H.L. and P.H.; writing—review and editing, H.L.; visualization, P.H.; supervision, R.T.; project administration, R.T. and H.L.; funding acquisition, H.L. All authors have read and agreed to the published version of the manuscript.

Funding

This work was supported by NSFC grants 42064009.

Data Availability Statement

The authors acknowledge use of the measurement from Van Allen Probes. The Van Allen Probes MagEIS data are publicly available at https://spdf.gsfc.nasa.gov/pub/data/rbsp/rbspa/l3/ect/mageis/ (accessed on 25 November 2021), the EFW data can be found at https://spdf.gsfc.nasa.gov/pub/data/rbsp/rbspa/l3/efw/ (accessed on 6 July 2022), and OMNI data are located at https://spdf.gsfc.nasa.gov/pub/data/omni (accessed on 23 April 2020).

Acknowledgments

This research is supported by the Natural Science Foundation of China (Nos. 42064009).

Conflicts of Interest

The authors declare no conflict of interest.

References

  1. Van Allen, J.A.; Frank, L.A. Radiation around the Earth to a radial distance of 107,400 km. Nature 1959, 183, 430–434. [Google Scholar] [CrossRef]
  2. Baker, D.N.; Jaynes, A.N.; Li, X.; Henderson, M.G.; Kanekal, S.G.; Reeves, G.D.; Spence, H.E.; Claudepierre, S.G.; Fennell, J.F.; Hudson, M.K.; et al. Gradual diffusion and punctuated phase space density enhancements of highly relativistic electrons: Van Allen Probes observations. Geophys. Res. Lett. 2014, 41, 1351–1358. [Google Scholar] [CrossRef]
  3. Horne, R.B.; Lam, M.M.; Green, J.C. Energetic electron precipitation from the outer radiation belt during geomagnetic storms. Geophys. Res. Lett. 2009, 36. [Google Scholar] [CrossRef]
  4. Rodger, C.J.; Clilverd, M.A.; Seppälä, A.; Thomson, N.R.; Gamble, R.J.; Parrot, M.; Sauvaud, J.-A.; Ulich, T. Radiation belt electron precipitation due to geomagnetic storms: Significance to middle atmosphere ozone chemistry. J. Geophys. Res. Space Phys. 2010, 115. [Google Scholar] [CrossRef]
  5. Duderstadt, K.A.; Huang, C.L.; Spence, H.E.; Smith, S.; Blake, J.B.; Crew, A.B.; Johnson, A.T.; Klumpar, D.M.; Marsh, D.R.; Sample, J.G.; et al. Estimating the Impacts of Radiation Belt Electrons on Atmospheric Chemistry Using FIREBIRD II and Van Allen Probes Observations. J. Geophys. Res. Atmos. 2021, 126, e2020JD033098. [Google Scholar] [CrossRef]
  6. Goldstein, J.; Sandel, B.R.; Forrester, W.T.; Thomsen, M.F.; Hairston, M.R. Global plasmasphere evolution 22–23 April 2001. J. Geophys. Res. 2005, 110. [Google Scholar] [CrossRef]
  7. Xiao, F.; Yang, C.; Su, Z.; Zhou, Q.; He, Z.; He, Y.; Baker, D.N.; Spence, H.E.; Funsten, H.O.; Blake, J.B. Wave-driven butterfly distribution of Van Allen belt relativistic electrons. Nat. Commun. 2015, 6, 8590. [Google Scholar] [CrossRef]
  8. West, H.I.; Buck, R.M.; Walton, J.R. Electron pitch angle distributions throughout the magnetosphere as observed on Ogo 5. J. Geophys. Res. 1973, 78, 1064–1081. [Google Scholar] [CrossRef]
  9. Schulz, M.; Lanzerotti, L.J. Particle Diffusion in the Radiation Belts; Springer Science & Business Media: New York city, NY, USA, 1974. [Google Scholar]
  10. Xiang, Z.; Ni, B.; Zhou, C.; Zou, Z.; Gu, X.; Zhao, Z.; Zhang, X.; Zhang, X.; Zhang, S.; Li, X.; et al. Multi-satellite simultaneous observations of magnetopause and atmospheric losses of radiation belt electrons during an intense solar wind dynamic pressure pulse. Ann. Geophys. 2016, 34, 493–509. [Google Scholar] [CrossRef]
  11. Zong, Q. Magnetospheric response to solar wind forcing: Ultra-low-frequency wave-particle interaction perspective. J. Geophys. Res. Space Phys. 2022, 40, 121–150. [Google Scholar] [CrossRef]
  12. Smirnov, A.; Shprits, Y.Y.; Allison, H.; Aseev, N.; Drozdov, A.; Kollmann, P.; Wang, D.; Saikin, A. An Empirical Model of the Equatorial Electron Pitch Angle Distributions in Earth’s Outer Radiation Belt. Space Weather 2022, 20. [Google Scholar] [CrossRef]
  13. Ukhorskiy, A.Y.; Anderson, B.J.; Brandt, P.C.; Tsyganenko, N.A. Storm time evolution of the outer radiation belt: Transport and losses. J. Geophys. Res. 2006, 111. [Google Scholar] [CrossRef]
  14. Saito, S.; Miyoshi, Y.; Seki, K. A split in the outer radiation belt by magnetopause shadowing: Test particle simulations. J. Geophys. Res. Space Phys. 2010, 115. [Google Scholar] [CrossRef]
  15. Califf, S.; Li, X.; Zhao, H.; Kellerman, A.; Sarris, T.E.; Jaynes, A.; Malaspina, D.M. The role of the convection electric field in filling the slot region between the inner and outer radiation belts. J. Geophys. Res. Space Phys. 2017, 122, 2051–2068. [Google Scholar] [CrossRef]
  16. Wang, Y.; Zong, Q.; Zhou, X. Test particle simulation on the ion and electron zebra stripes and their time evolution in inner radiation belt. Sci. China Technol. Sci. 2017, 61, 623–632. [Google Scholar] [CrossRef]
  17. Tsyganenko, N.A.; Stern, D.P. Modeling the global magnetic field of the large-scale Birkeland current systems. J. Geophys. Res. Space Phys. 1996, 101, 27187–27198. [Google Scholar] [CrossRef]
  18. Blake, J.B.; Carranza, P.A.; Claudepierre, S.G.; Clemmons, J.H.; Crain, W.R.; Dotan, Y.; Fennell, J.F.; Fuentes, F.H.; Galvan, R.M.; George, J.S.; et al. The Magnetic Electron Ion Spectrometer (MagEIS) Instruments Aboard the Radiation Belt Storm Probes (RBSP) Spacecraft. Space Sci. Rev. 2013, 179, 383–421. [Google Scholar] [CrossRef]
  19. Mauk, B.H.; Fox, N.J.; Kanekal, S.G.; Kessel, R.L.; Sibeck, D.G.; Ukhorskiy, A. Science Objectives and Rationale for the Radiation Belt Storm Probes Mission. Space Sci. Rev. 2012, 179, 3–27. [Google Scholar] [CrossRef]
  20. Lin, R.L.; Zhang, X.X.; Liu, S.Q.; Wang, Y.L.; Gong, J.C. A three-dimensional asymmetric magnetopause model. J. Geophys. Res. Space Phys. 2010, 115. [Google Scholar] [CrossRef]
  21. Samsonov, A.A.; Bogdanova, Y.V.; Branduardi--Raymont, G.; Xu, L.; Zhang, J.; Sormakov, D.; Troshichev, O.A.; Forsyth, C. Geosynchronous Magnetopause Crossings and Their Relationships With Magnetic Storms and Substorms. Space Weather 2021, 19, e2020SW002704. [Google Scholar] [CrossRef]
  22. Goldstein, J.; Sandel, B.R.; Hairston, M.R.; Reiff, P.H. Control of plasmaspheric dynamics by both convection and sub-auroral polarization stream. Geophys. Res. Lett. 2003, 30. [Google Scholar] [CrossRef]
  23. Volland, H. A semiempirical model of large-scale magnetospheric electric fields. J. Geophys. Res. 1973, 78, 171–180. [Google Scholar] [CrossRef]
  24. Stern, D.P. The motion of a proton in the equatorial magnetosphere. J. Geophys. Res. 1975, 80, 595–599. [Google Scholar] [CrossRef]
  25. Goldstein, J.; Burch, J.L.; Sandel, B.R. Magnetospheric model of subauroral polarization stream. J. Geophys. Res. Space Phys. 2005, 110. [Google Scholar] [CrossRef]
  26. Roederer, J.G. Dynamics of Geomagnetically Trapped Radiation; Springer: New York city, NY, USA, 1970. [Google Scholar]
  27. Ganushkina, N.Y.; Pulkkinen, T.I.; Fritz, T. Role of substorm-associated impulsive electric fields in the ring current development during storms. Ann. Geophys. 2005, 23, 579–591. [Google Scholar] [CrossRef]
  28. Shen, C.; Ren, N.; Qureshi, M.N.S.; Guo, Y. On the Temperatures of Planetary Magnetosheaths at the Subsolar Points. J. Geophys. Res. Space Phys. 2022, 127, e2022JA030782. [Google Scholar] [CrossRef]
  29. Baumjohann, W.; Treumann, R.A. Basic Space Plasma Physics; Imperial College Press: London, UK, 2012. [Google Scholar]
  30. Kasper, J.C. Solar Wind Plasma: Kinetic Properties and Micro-Instabilities. Ph.D. Thesis, Massachusetts Institute of Technology, Cambridge, MA, USA, February 2003. [Google Scholar]
  31. Kaang, H.H.; Ryu, C.-M.; Yoon, P.H. Nonlinear saturation of relativistic Weibel instability driven by thermal anisotropy. Phys. Plasmas 2009, 16, 082103. [Google Scholar] [CrossRef]
  32. Zhou, X.; Tsurutani, B.T. Rapid intensification and propagation of the dayside aurora: Large scale interplanetary pressure pulses (fast shocks). Geophys. Res. Lett. 1999, 26, 1097–1100. [Google Scholar] [CrossRef]
  33. Tsurutani, B.T.; Zhou, X.Y.; Arballo, J.K.; Gonzalez, W.D.; Lakhina, G.S.; Vasyliunas, V.; Berdichevsky, D. Auroral zone dayside precipitation during magnetic storminitial phases. J. Atmos. Sol.-Terr. Phys. 2001, 63, 513–522. [Google Scholar] [CrossRef]
  34. Shabansky, V.P. Some processes in the magnetosphere. Space Sci. Rev. 1971, 12, 299–418. [Google Scholar]
  35. Li, H.; Yuan, Z.; Yu, X.; Huang, S.; Wang, D.; Wang, Z.; Qiao, Z.; Wygant, J.R. The enhancement of cosmic radio noise absorption due to hiss--driven energetic electron precipitation during substorms. J. Geophys. Res. Space Phys. 2015, 120, 5393–5407. [Google Scholar] [CrossRef]
  36. Reeves, G.D.; McAdams, K.L.; Friedel, R.H.W.; O’Brien, T.P. Acceleration and loss of relativistic electrons during geomagnetic storms. Geophys. Res. Lett. 2003, 30. [Google Scholar] [CrossRef]
  37. Turner, D.L.; Angelopoulos, V.; Morley, S.K.; Henderson, M.G.; Reeves, G.D.; Li, W.; Baker, D.N.; Huang, C.L.; Boyd, A.; Spence, H.E.; et al. On the cause and extent of outer radiation belt losses during the 30 September 2012 dropout event. J. Geophys. Res. Space Phys. 2014, 119, 1530–1540. [Google Scholar] [CrossRef]
  38. Turner, D.L.; Angelopoulos, V.; Li, W.; Bortnik, J.; Ni, B.; Ma, Q.; Thorne, R.M.; Morley, S.K.; Henderson, M.G.; Reeves, G.D.; et al. Competing source and loss mechanisms due to wave--particle interactions in Earth’s outer radiation belt during the 30 September to 3 October 2012 geomagnetic storm. J. Geophys. Res. Space Phys. 2014, 119, 1960–1979. [Google Scholar] [CrossRef]
  39. Li, X.; Sarris, T.E.; Baker, D.N.; Peterson, W.K.; Singer, H.J. Simulation of energetic particle injections associated with a substorm on August 27, 2001. Geophys. Res. Lett. 2003, 30, 4-1-4-4. [Google Scholar] [CrossRef]
  40. Shprits, Y.Y.; Thorne, R.M.; Friedel, R.; Reeves, G.D.; Fennell, J.; Baker, D.N.; Kanekal, S.G. Outward radial diffusion driven by losses at magnetopause. J. Geophys. Res. 2006, 111. [Google Scholar] [CrossRef]
  41. Millan, R.M.; Thorne, R.M. Review of radiation belt relativistic electron losses. J. Atmos. Sol.-Terr. Phys. 2007, 69, 362–377. [Google Scholar] [CrossRef]
  42. Thorne, R.M.; Li, W.; Ni, B.; Ma, Q.; Bortnik, J.; Chen, L.; Baker, D.N.; Spence, H.E.; Reeves, G.D.; Henderson, M.G.; et al. Rapid local acceleration of relativistic radiation-belt electrons by magnetospheric chorus. Nature 2013, 504, 411–414. [Google Scholar] [CrossRef]
  43. Boyd, A.J.; Spence, H.E.; Claudepierre, S.G.; Fennell, J.F.; Blake, J.B.; Baker, D.N.; Reeves, G.D.; Turner, D.L. Quantifying the radiation belt seed population in the 17 March 2013 electron acceleration event. Geophys. Res. Lett. 2014, 41, 2275–2281. [Google Scholar] [CrossRef]
  44. Thorne, R.M. Radiation belt dynamics: The importance of wave-particle interactions. Geophys. Res. Lett. 2010, 37. [Google Scholar] [CrossRef]
  45. Su, Z.; Xiao, F.; Zheng, H.; Wang, S. Radiation belt electron dynamics driven by adiabatic transport, radial diffusion, and wave-particle interactions. J. Geophys. Res. Space Phys. 2011, 116. [Google Scholar] [CrossRef]
  46. Murphy, K.R.; Mann, I.R.; Rae, I.J.; Sibeck, D.G.; Watt, C.E. Accurately characterizing the importance of wave-particle interactions in radiation belt dynamics: The pitfalls of statistical wave representations. J. Geophys. Res. Space Phys. 2016, 121, 7895–7899. [Google Scholar] [CrossRef]
  47. Summers, D.; Ni, B.; Meredith, N.P. Timescales for radiation belt electron acceleration and loss due to resonant wave-particle interactions: 2. Evaluation for VLF chorus, ELF hiss, and electromagnetic ion cyclotron waves. J. Geophys. Res. Space Phys. 2007, 112. [Google Scholar] [CrossRef]
  48. Ni, B.; Zou, Z.; Li, X.; Bortnik, J.; Xie, L.; Gu, X. Occurrence characteristics of outer zone relativistic electron butterfly distribution: A survey of Van Allen Probes REPT measurements. Geophys. Res. Lett. 2016, 43, 5644–5652. [Google Scholar] [CrossRef] [Green Version]
Figure 1. The overview for the event which occurred from 04:39:26 UT on 19 December 2015 to 07:30:47 UT on 20 December 2015. (a) SYM−H and AE (the blue dotted line marks SYM−H = −30 nT), (b) Bz in GSM coordinate (the red dotted line marks Bz = −10 nT), and (c) Pdyn; (d) the calculated distance R0 that between the Geocenter and magnetopause under the subsolar position (the red dotted line marks R0 = 6 RE and R0 = 10 RE, respectively); (e) the orbital L shell and MLT for RBSP-A (the blue dotted line marks L = 3 and the red dotted line marks MLT = 12 h, respectively); (fi) exhibit the electron differential flux with energies of 464.4 keV, 593 keV, 741.6 keV and 901.8 keV observed by RBSP−A, respectively. Three black rectangles mark our selected cases.
Magnetochemistry 09 00052 g001
Figure 2. Single-particle test results of the bounce-averaged drift simulation program. The initial positions of both particles are L ~5 RE and MLT ~0 h, the initial energies are 600 keV, and the initial pitch angles are different, the blue lines correspond to 10° and the red lines correspond to 60°. (a) particle trajectory in Solar Magnetic Coordinates (SM), the title shows the geomagnetic parameters used in the simulation; (b) energy and (c) pitch angle variation with MLT.
Magnetochemistry 09 00052 g002
Figure 3. Observed and simulated values of magnetic field intensity along the second orbital trajectory of the satellite. The solid black curve displays the magnetic field intensities observed by RBSP-A during the second outbound orbit, the blue discrete circles display the magnetic field intensities simulated by inputting the original geomagnetic parameters, and the red discrete circles display the magnetic field intensities simulated by inputting three times the Pdyn.
Magnetochemistry 09 00052 g003
Figure 4. The evolution of equatorial electron PSD (averaged PSD from L ~5.4 RE to L ~5.8 RE) as functions of PA and energy. (a) PSD data observed by RBSP-A during the first outbound orbit, (b) PSD data observed by RBSP−A during the second outbound orbit, (c) PSD data obtained from the group test particle simulations. (d) The anisotropic rate as a function of energy from observations and group test particle simulations. The blue line corresponds to (a), the red line corresponds to (b), and the yellow line corresponds to (c).
Magnetochemistry 09 00052 g004
Figure 5. The evolution of equatorial electron PSD (averaged PSD from L ~5.4 RE to L ~5.8 RE) as functions of PA and energy. (a) PSD data observed by RBSP-A during the second outbound orbit, (b) PSD data observed by RBSP-A during the third outbound orbit, (c) PSD data obtained from the group test particle simulations. (d) The anisotropic rate as a function of energy from observations and group test particle simulations. The blue line corresponds to (a), the red line corresponds to (b), and the yellow line corresponds to (c).
Magnetochemistry 09 00052 g005
Disclaimer/Publisher’s Note: The statements, opinions and data contained in all publications are solely those of the individual author(s) and contributor(s) and not of MDPI and/or the editor(s). MDPI and/or the editor(s) disclaim responsibility for any injury to people or property resulting from any ideas, methods, instructions or products referred to in the content.

