Article

Genomic Colinearity and Transcriptional Regulatory Networks of BES1 Gene Family in Horticultural Plants Particularly Kiwifruit and Peach

1
Horticulture Institute, Ningxia Academy of Agricultural and Forestry Sciences, Yinchuan 750001, China
2
College of Horticulture, Northwest A&F University, Yangling 712100, China
3
Apple Research and Development Center, Luochuan 727400, China
*
Authors to whom correspondence should be addressed.
These authors contributed equally to this work.
Horticulturae 2023, 9(9), 971; https://doi.org/10.3390/horticulturae9090971
Submission received: 23 July 2023 / Revised: 21 August 2023 / Accepted: 25 August 2023 / Published: 28 August 2023
(This article belongs to the Collection Advances in Fruit Quality Formation and Regulation)

Abstract

:
The BES1 transcription factor family was unique and critical in plants. The BES1s played roles in the Brassinosteroid (BR) signaling pathway and participated in the plant’s development, maturation, and stress response process. This study investigated the function of the BES1 gene family of 48 horticultural crops by phylogenetic and genomic colinearity network analysis. In addition, the transcriptional regulatory networks had analyzed the process during biotic stress, abiotic stress, fruit development, and postharvest of kiwifruit and peach. The study illustrated a comprehensive understanding of the phylogenetic relationships of the BES1 family in plant genomes and the prediction of growth and development of kiwifruit and peach fruits and maturation-related BES1 members, laying the foundation for further functional studies of BES1 genes in the future.

1. Introduction

BES1 (BRI1-EMSSUPPRESSOR1) is a family of plant-specific transcription factors (TF) that bind and regulate Brassinosteroid (BR) response genes [1]. The BES1 gene family participats in the biological processes of development, maturation, and response to stresses in plants. The BES1 TFs performed functions through specific sequence structures that could be dephosphorylated by PP2A and regulated gene expression by binding to the gene promoter’s E-BOX (CANNTG) and BRRE elements (CGTGT/CG) in plants. The BES1 family proteins have conserved structures that include a putative Nuclear localization sequence (NLS), a highly conserved amino acid terminal region (N), a BIN2 phosphorylation domain (P), a PEST motif, and a carboxyl structure. Phosphorylation and dephosphorylation of the BES1 protein mediate BR signal transduction.
Previous studies have shown that BES1s play roles in hormonal signals and physiological regulation. Research showed that BES1 could regulate the BR signaling pathway and affect plant development and yield by combining with the promoter of frizzy panicle (FZP), a key gene for gibberellin biosynthesis [2]. The BR is a class of sterol compounds essential to plant growth, development, and stress response. BRs widely exist in the plant kingdom [3]. Studies have found that BR is contained in various organs and growth stages of plants, and the content of BR in vigorous or young tissues is generally relatively high [4]. The BRs regulated plant growth and developmental processes such as photomorphogenesis, seed germination, flowering, stomatal formation, and stem elongation [5]. BRs play vital roles in stress response, which can enhance the resistance to drought, high temperature, low temperature, high salt, and pathogenic bacteria [6]. BR treatment could enhance fruit ripening, anthocyanin synthesis, and soluble solids accumulation [7]. Abscisic acid (ABA, an important stress hormone) could interact with BR through BES1. BES1 could tightly bind to the G-box motif of the ABI5 promoter region of the ABA signaling pathway and inhibit the expression of ABI5, thus resisting biological stress [8]. BR also participated in ethylene-regulated stress defense in plants, that ethylene induced xylanase (EIX) is a receptor for defense signals, and the function of LeEix2 would be inhibited by BAK1 [9]. BES1s and their homologous protein BZR1s (Brassinosteroid signaling positive regulator) shared similar functions and 88% similar amino acid sequences [10]. The BES1s and BZR1s act as core transcription factors in the BR signaling pathway [11,12,13].
The BES1 was studied to perform significant functions in biological processes of development, maturation, and response to stresses. JUB1 could be inhibited by BES1 to regulate the synthesis of BR in plant growth pathways. Studies have shown that JUB1 could delay plant aging and enhance plant resistance to salt and heat [14]. BES1, as the core component of BR, also participated in the response of plants to freezing stress. The mutant of BES1 had good cold resistance [15]. RD26 was induced to express under drought, and it can interact with BES1 to regulate the response to drought at different levels [16]. In bananas, MaBZR1/2 regulates fruit ripening and softening by binding to BRRE elements on the promoters of MaACS1, MaACO13, MaACO14, MaEXP2, MaPL2, and MaXET5, inhibiting their promoter activity [17,18]. BES1/BZR1 was involved in the processes of BR and photomorphogenesis, and BES1/BZR1 could bind to the promoter of photosignaling pathway genes to inhibit photomorphogenesis [5]. In Arabidopsis and rice, BR deficient mutants exhibited a phenotype of reduced grain size, which indicated that BR can promote seed development [19,20].
The BES1 transcription factor gene family has been reported to have genome-wide distribution in most species, such as Arabidopsis thaliana, tomato (Solanum lycopersicum), maize (Zea mays), Chinese Cabbage (Brassica rapa), cotton (Gossypium hirsutum), and Brassica napus [21,22,23]. Only a few preliminary studies of the function of the BES1 transcription factor have been performed, and many unknown functions remain to be discovered, all of which provide a potential basis for comparative analysis to infer the function of members of the BES1 family in other species. Therefore, this study was intended to investigate the function of the BES1 family through phylogenetic analysis of 48 horticultural crops combined with genomic colinearity network and transcriptional regulatory network analysis. It is desirable to have a comprehensive understanding of the phylogenetic relationships of the BES1 family in plant genomes and the prediction of growth and development of kiwifruit and peach fruits, laying the foundation for further functional studies of BES1 genes in the future.

2. Materials and Methods

2.1. Identification of the BES1 Family Members in 48 Species

To identify BES1 family members in 48 plant species, Arabidopsis thaliana was chosen as the model plant species. The AtBES1 transcription factor protein sequences were downloaded from the TAIR database [24]. Genomic sequences of other species were downloaded from the Ensemble database [25]. The Blast-P program aligned (parameter E ≤ 1 × 10⁻⁵) the AtBES1 protein sequences of Arabidopsis with those of other species. The conserved domain of BES1 (DUF822) was used to identify candidate proteins belonging to the BES1 family in those species. The amino acid sequences of the identified family members were submitted to the NCBI Conserved Domain Database (CDD) and SMART (http://smart.emblheidelberg.de/, accessed on 10 December 2022) to further confirm which candidates belonged to the BES1 gene family.

2.2. Multiple Sequence Alignment, Phylogenetic Analysis, and Gene Structure Analysis of BES1 Family

The multi-sequence alignments of BES1 proteins were performed with Mafft v7.471 software [26] under the default parameters. Then, for constructing the evolutionary trees, the multi-sequence alignments were submitted to FastTree (version v2.1.8) software [27] with the neighbor-joining (NJ) algorithm, and the bootstrap value was set to 1000. Finally, the evolutionary tree visualized by Figtree (version v1.4.4) and iTOL (version v5.0) software. The evolution tree of 48 species was constructed for evolutionary lineage analysis based on information from the taxonomy database of the NCBI.
The position information of BES1 genes were obtained from the species genome database by Perl script, and the MG2C website was used to map the position of the gene on the chromosome [28]. For cis-element analysis, the promoter sequences (2000 bp upstream from the translation start site) of the BES1 genes were obtained kiwifruit and peach genomes. In order to more accurately predict the cis-acting elements and the cis-elements were predicted by PlantPAN4.0 (http://plantpan.itps.ncku.edu.tw/plantpan4/index.html, accessed on 17 August 2023) and PlantCARE (http://bioinformatics.psb.ugent.be/webtools/plantcare/html/, accessed on 18 August 2023) based on these promoter sequences. [29].

2.3. Collinearity Network Analysis and Conserved Motif Identification of BES1 Family

The collinearity of the BES1 genes family within six representative plants were constructed using McScanX (https://github.com/tanghaibao/jcvi/wiki/MCscan-(Python-version), accessed on 18 November 2022) [30]. Specifically, the protein sequences of these species were compared all-against-all using the BLASTP comparison (E-value ≤ 1 × 10⁻⁵). Then, MCScanX with default parameters was used to detect collinear blocks. Finally, the MCScanX algorithm in McScan was used to identify potential duplicated genes (Segmental duplication and Tandem duplication). The conserved motifs of BES1 family genes from six representative plants were used for Multiple Expectation-Maximization for Motif Elicitation (MEME) with default parameters, and the number of motifs was set to 10 [31].
To future estimate the selection pattern of BES1 genes in five representative fruit tree species, the ratio of nonsynonymous to synonymous nucleotide substitutions (Ka/Ks) of all orthologous gene pairs was calculated [32]. To detect the selection pressure, the Ka/Ks ratio, which was greater than 1, less than 1, and equal to 1, represented positive selection, negative/stable selection, and neutral selection, respectively.

2.4. Transcriptional Profiling and Regulatory Network Analysis of BES1 Family

The Plant Transcription Factor Database (PlantTFDB) was used to establish the transcriptional regulatory network of BES1 genes and predict the regulatory relationship between the BES1 gene and the target gene [33]. The CDS sequences of the BES1 genes were submitted to PmiREN (https://www.pmiren.com/, accessed on 16 May 2023). To predict the accuracy results of the target miRNA, the miRNAs with scores greater than 25 are selected, and other parameters are defaulted. The network was visualized by Cytoscape (version 6.1) software.
The RNA-seq data was used to analyze the gene expression of kiwifruit and peach. Large-scale expression datasets of various hormone treatments, developmental and postharvest stages, and adversity were obtained from the SRA database of the NCBI. We collected 70 samples, including the expression data of different tissues of kiwifruit as well as different development periods of fruit from growth to postharvest storage [34,35]. Data from 45 transcriptome samples of kiwifruit during postharvest storage treated with ethylene (ETH) and 1-methylcyclopropene (1-MCP, an ethylene inhibitor) were obtained from SRA (accession numbers: PRJNA638129, PRJNA445209, and PRJNA593865). A total of 37 transcriptome samples of biological and abiotic stress were from SRA (accession number: PRJNA602928, PRJNA726005, and PRJNA681641). Specifically: the biological stress data of kiwifruit infected with Botrytis cinerea inoculated; Secondly, expression data of kiwifruit roots stressed by brassinolide hormone and Brassinazole (BRZ, a brassinolide inhibitor); Finally, the transcriptome expression data of kiwifruit subjected to low-temperature stress were analyzed. The gene expression values were normalized as fragments per kilobase of transcript per million mapped reads (FPKM) [36]. The R language was used to demonstrate Heatmaps of gene expression.

3. Results

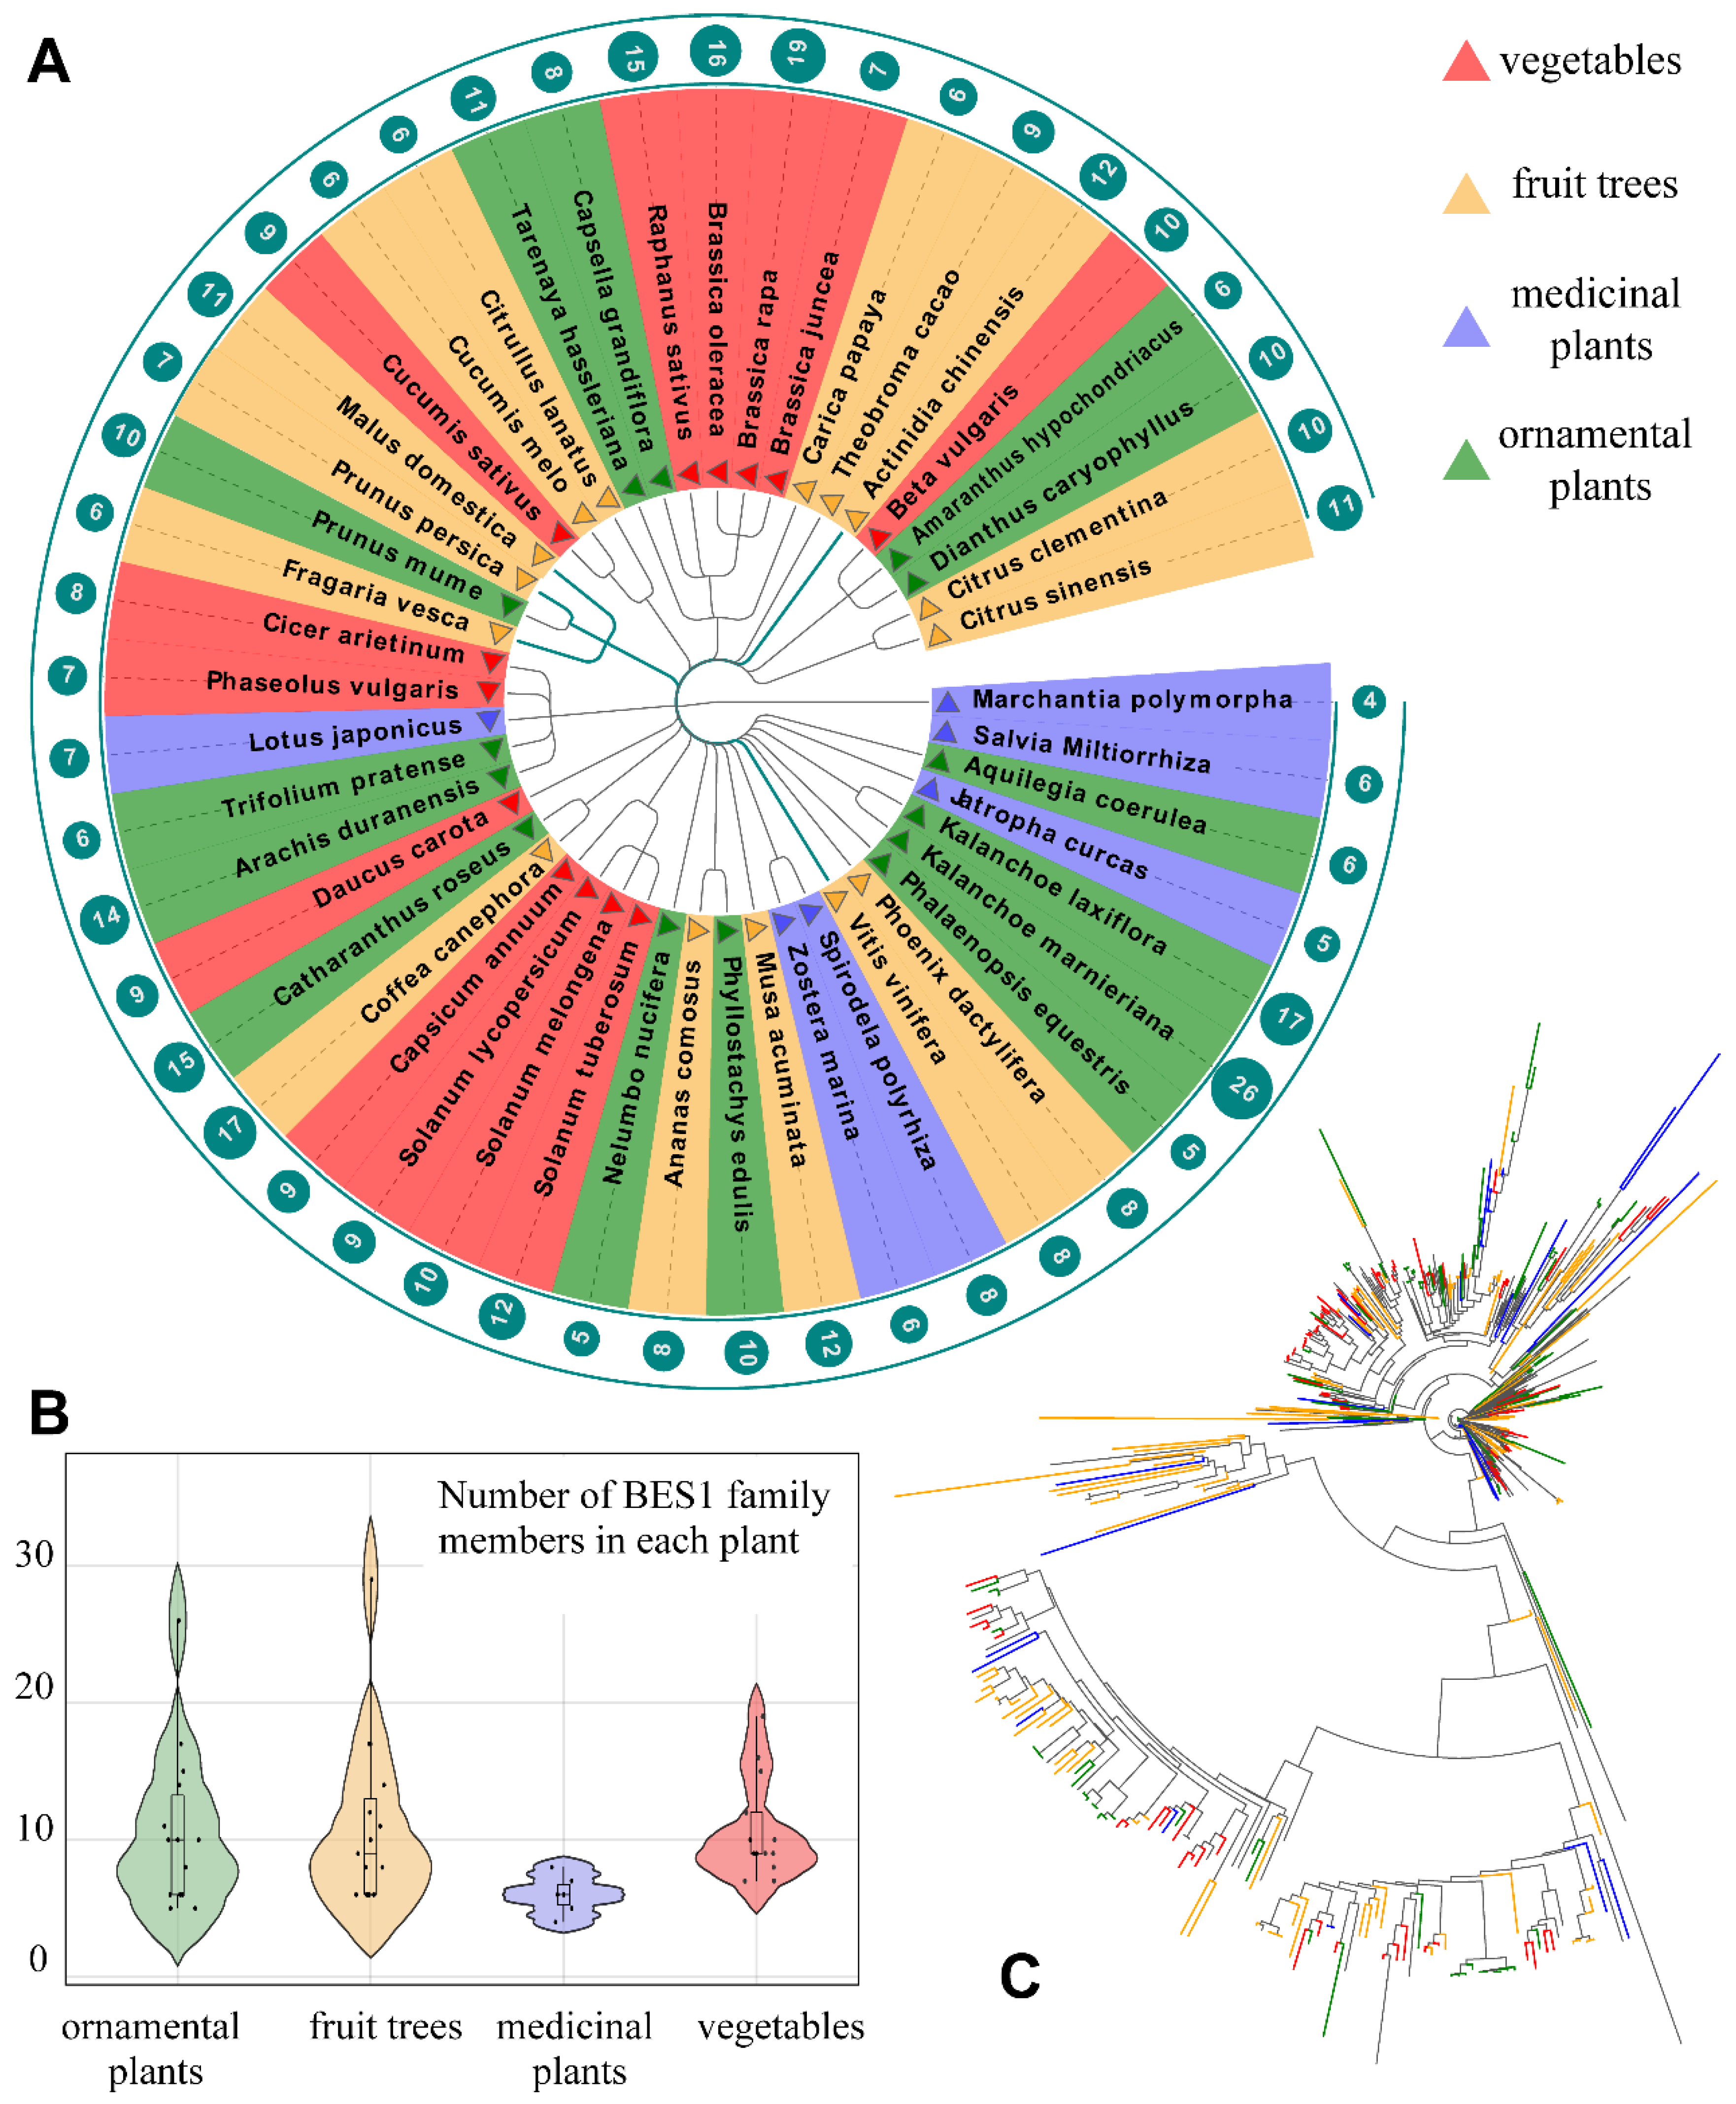
3.1. Identification and System Evolution of the BES1 Family in Horticultural Crops

The BES1 TFs play roles in the physiology and regulation of BR the signaling pathway. The BES1 transcription factors had relatively conserved structures and were widely distributed in plant species. In this study, all 440 BES1 family members were identified in 48 horticultural crops based on protein sequence similarity and conserved domain structure (Table 1; Figure 1A; Supplement Table S1). 48 horticultural crops were identified, including 15 fruit tree species, 13 vegetable species, 14 ornamental-plant species, and 6 medicinal-plant species. There was diversity in the number of BES1 member, and the average BES1 family gene number was 9 (The largest numbers of BES1s was 26 in Kalanchoe marnieriana, and the smallest number was 4 in Marchantia polymorpha). In four horticultural categories, the members of BES1 gene families tended to be less than 10 (Figure 1B), while the number of BES1 gene families in the classification of medicinal plants were relatively more concentrated. In general, the numbers of BES1 gene families in horticultural crops were not much different.
To study the systematic evolution of the BES1 family, we constructed an evolutionary tree using the BES1 protein sequences of the 48 species identified (Figure 1C). The results showed that in four categories of plants, most branches of the evolutionary tree contained members in the BES1 protein family of fruit trees, vegetables, ornamental plants, and medicinal plants, which reveals that BES1 genes in different species have different evolutionary patterns after differentiation. Some branches only contain the same taxonomic species. These results indicated that some BES1 proteins were relatively conserved during evolution.

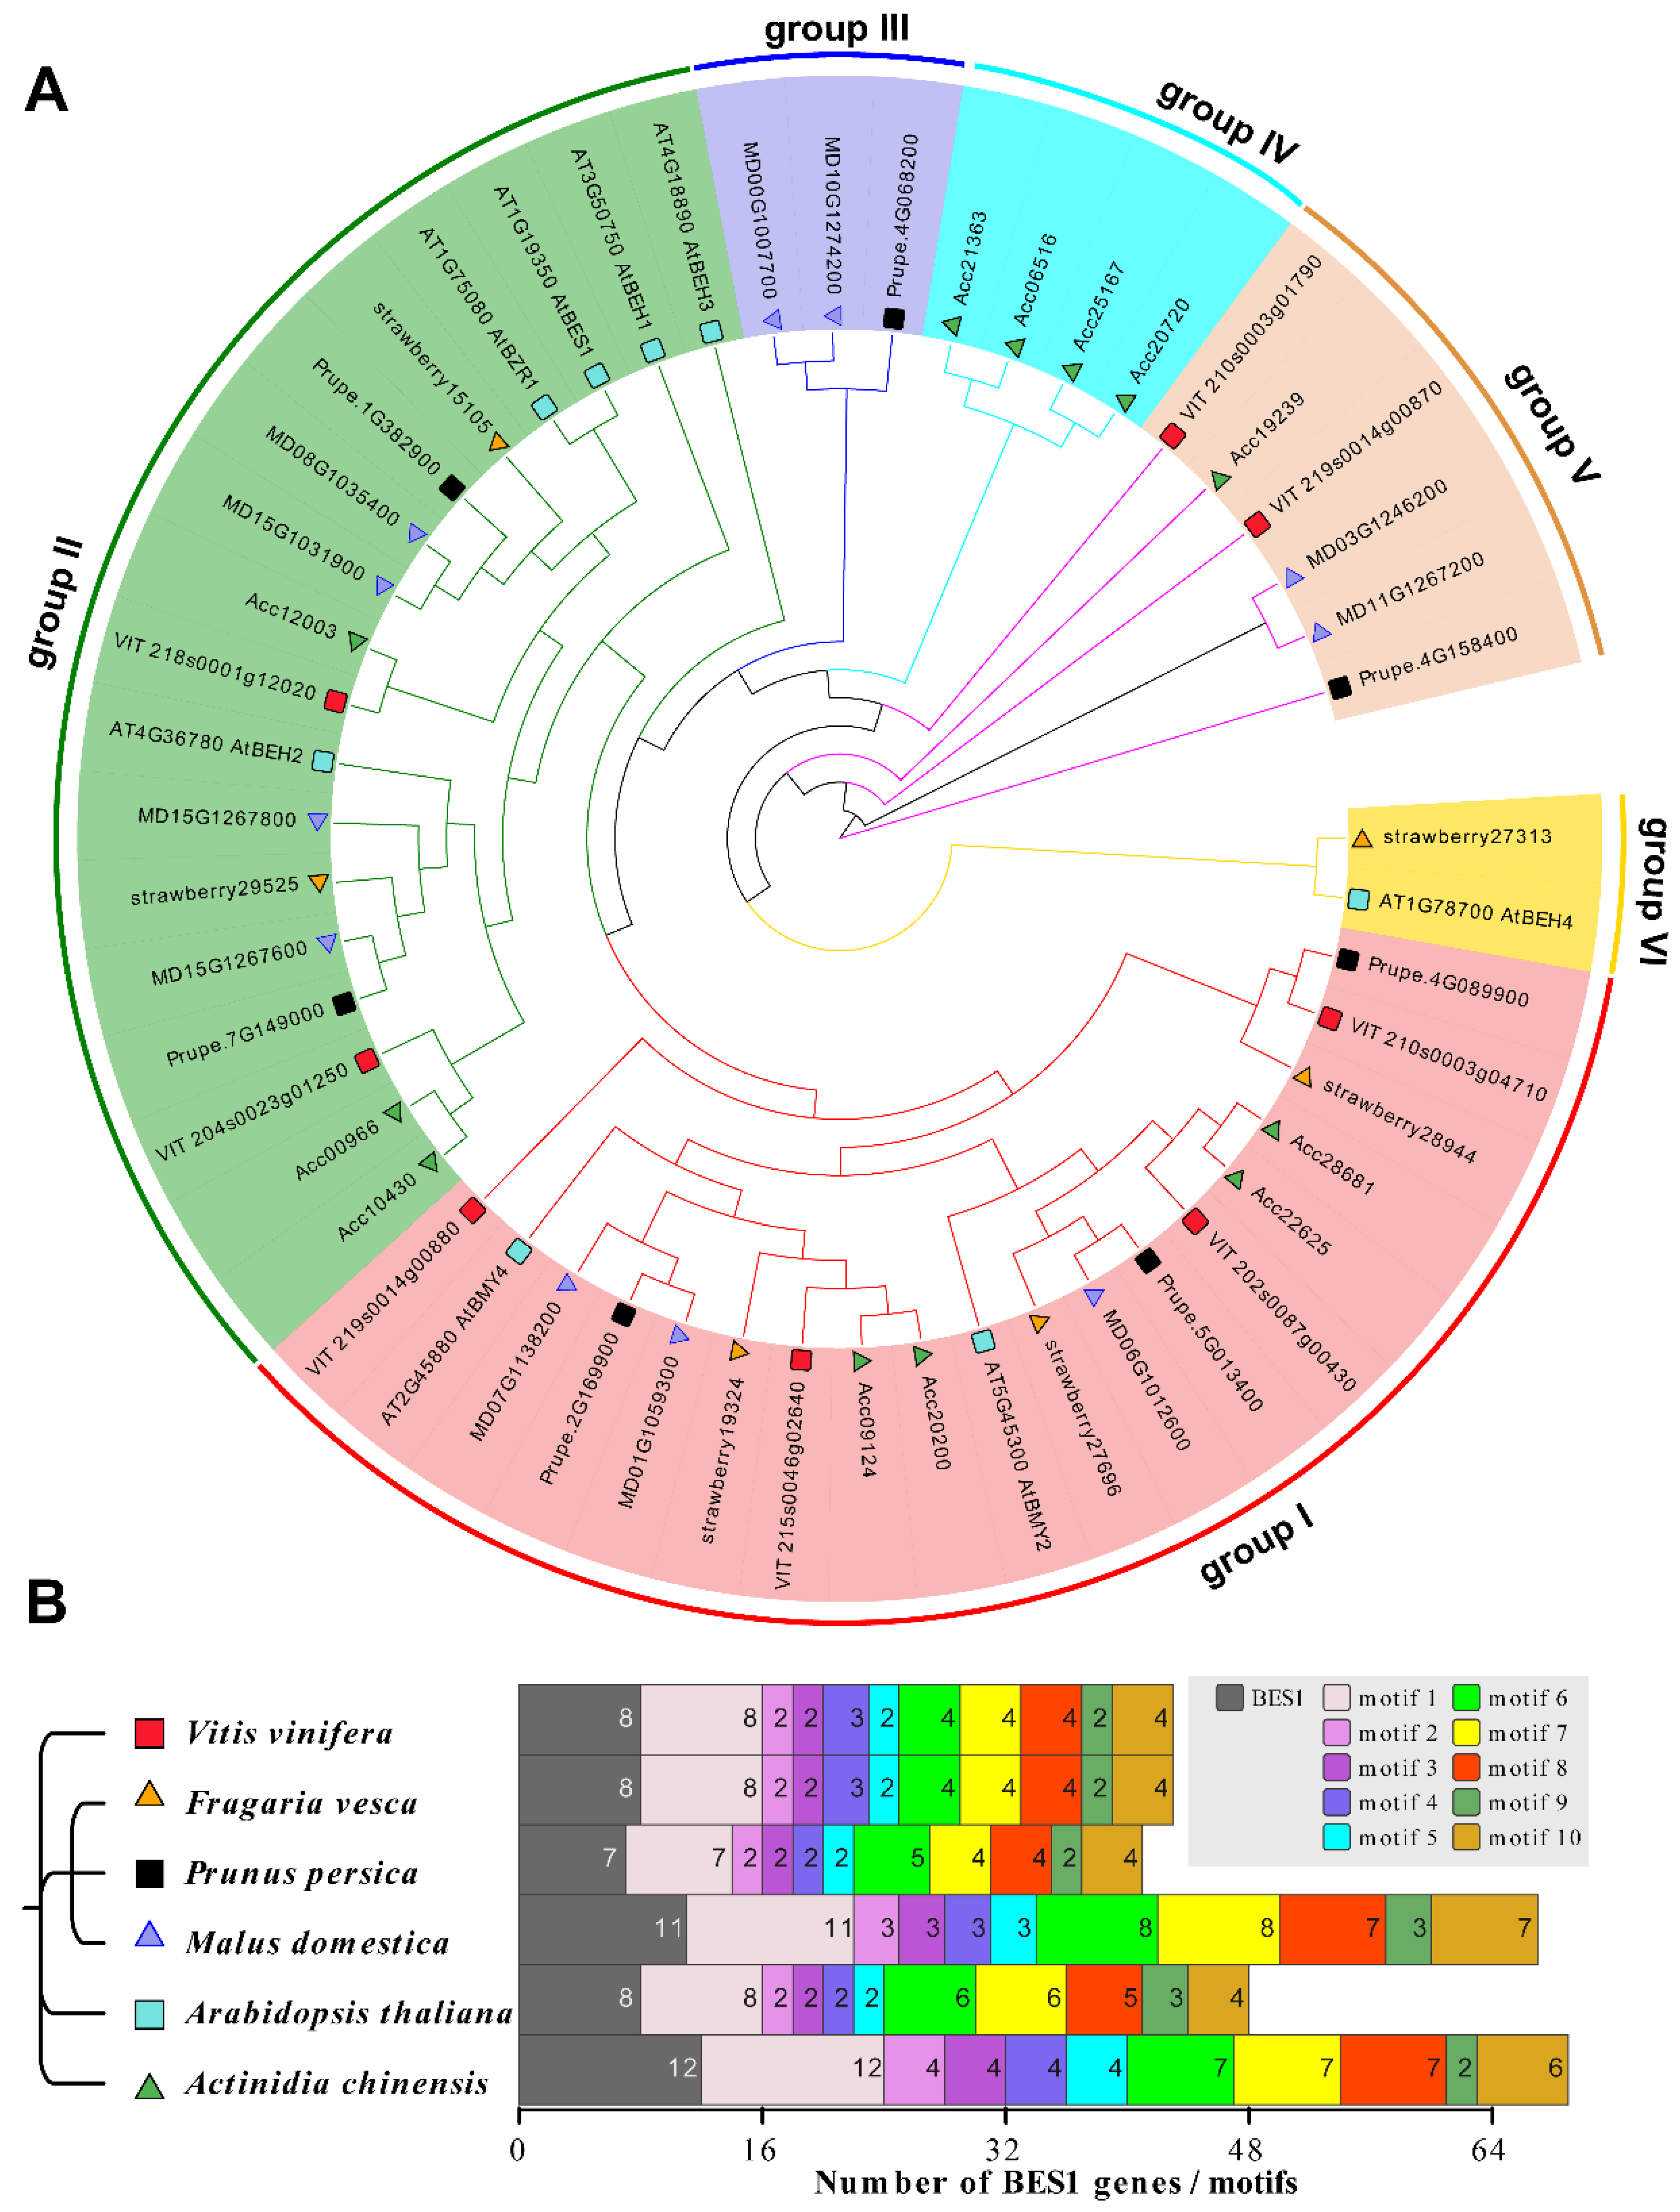
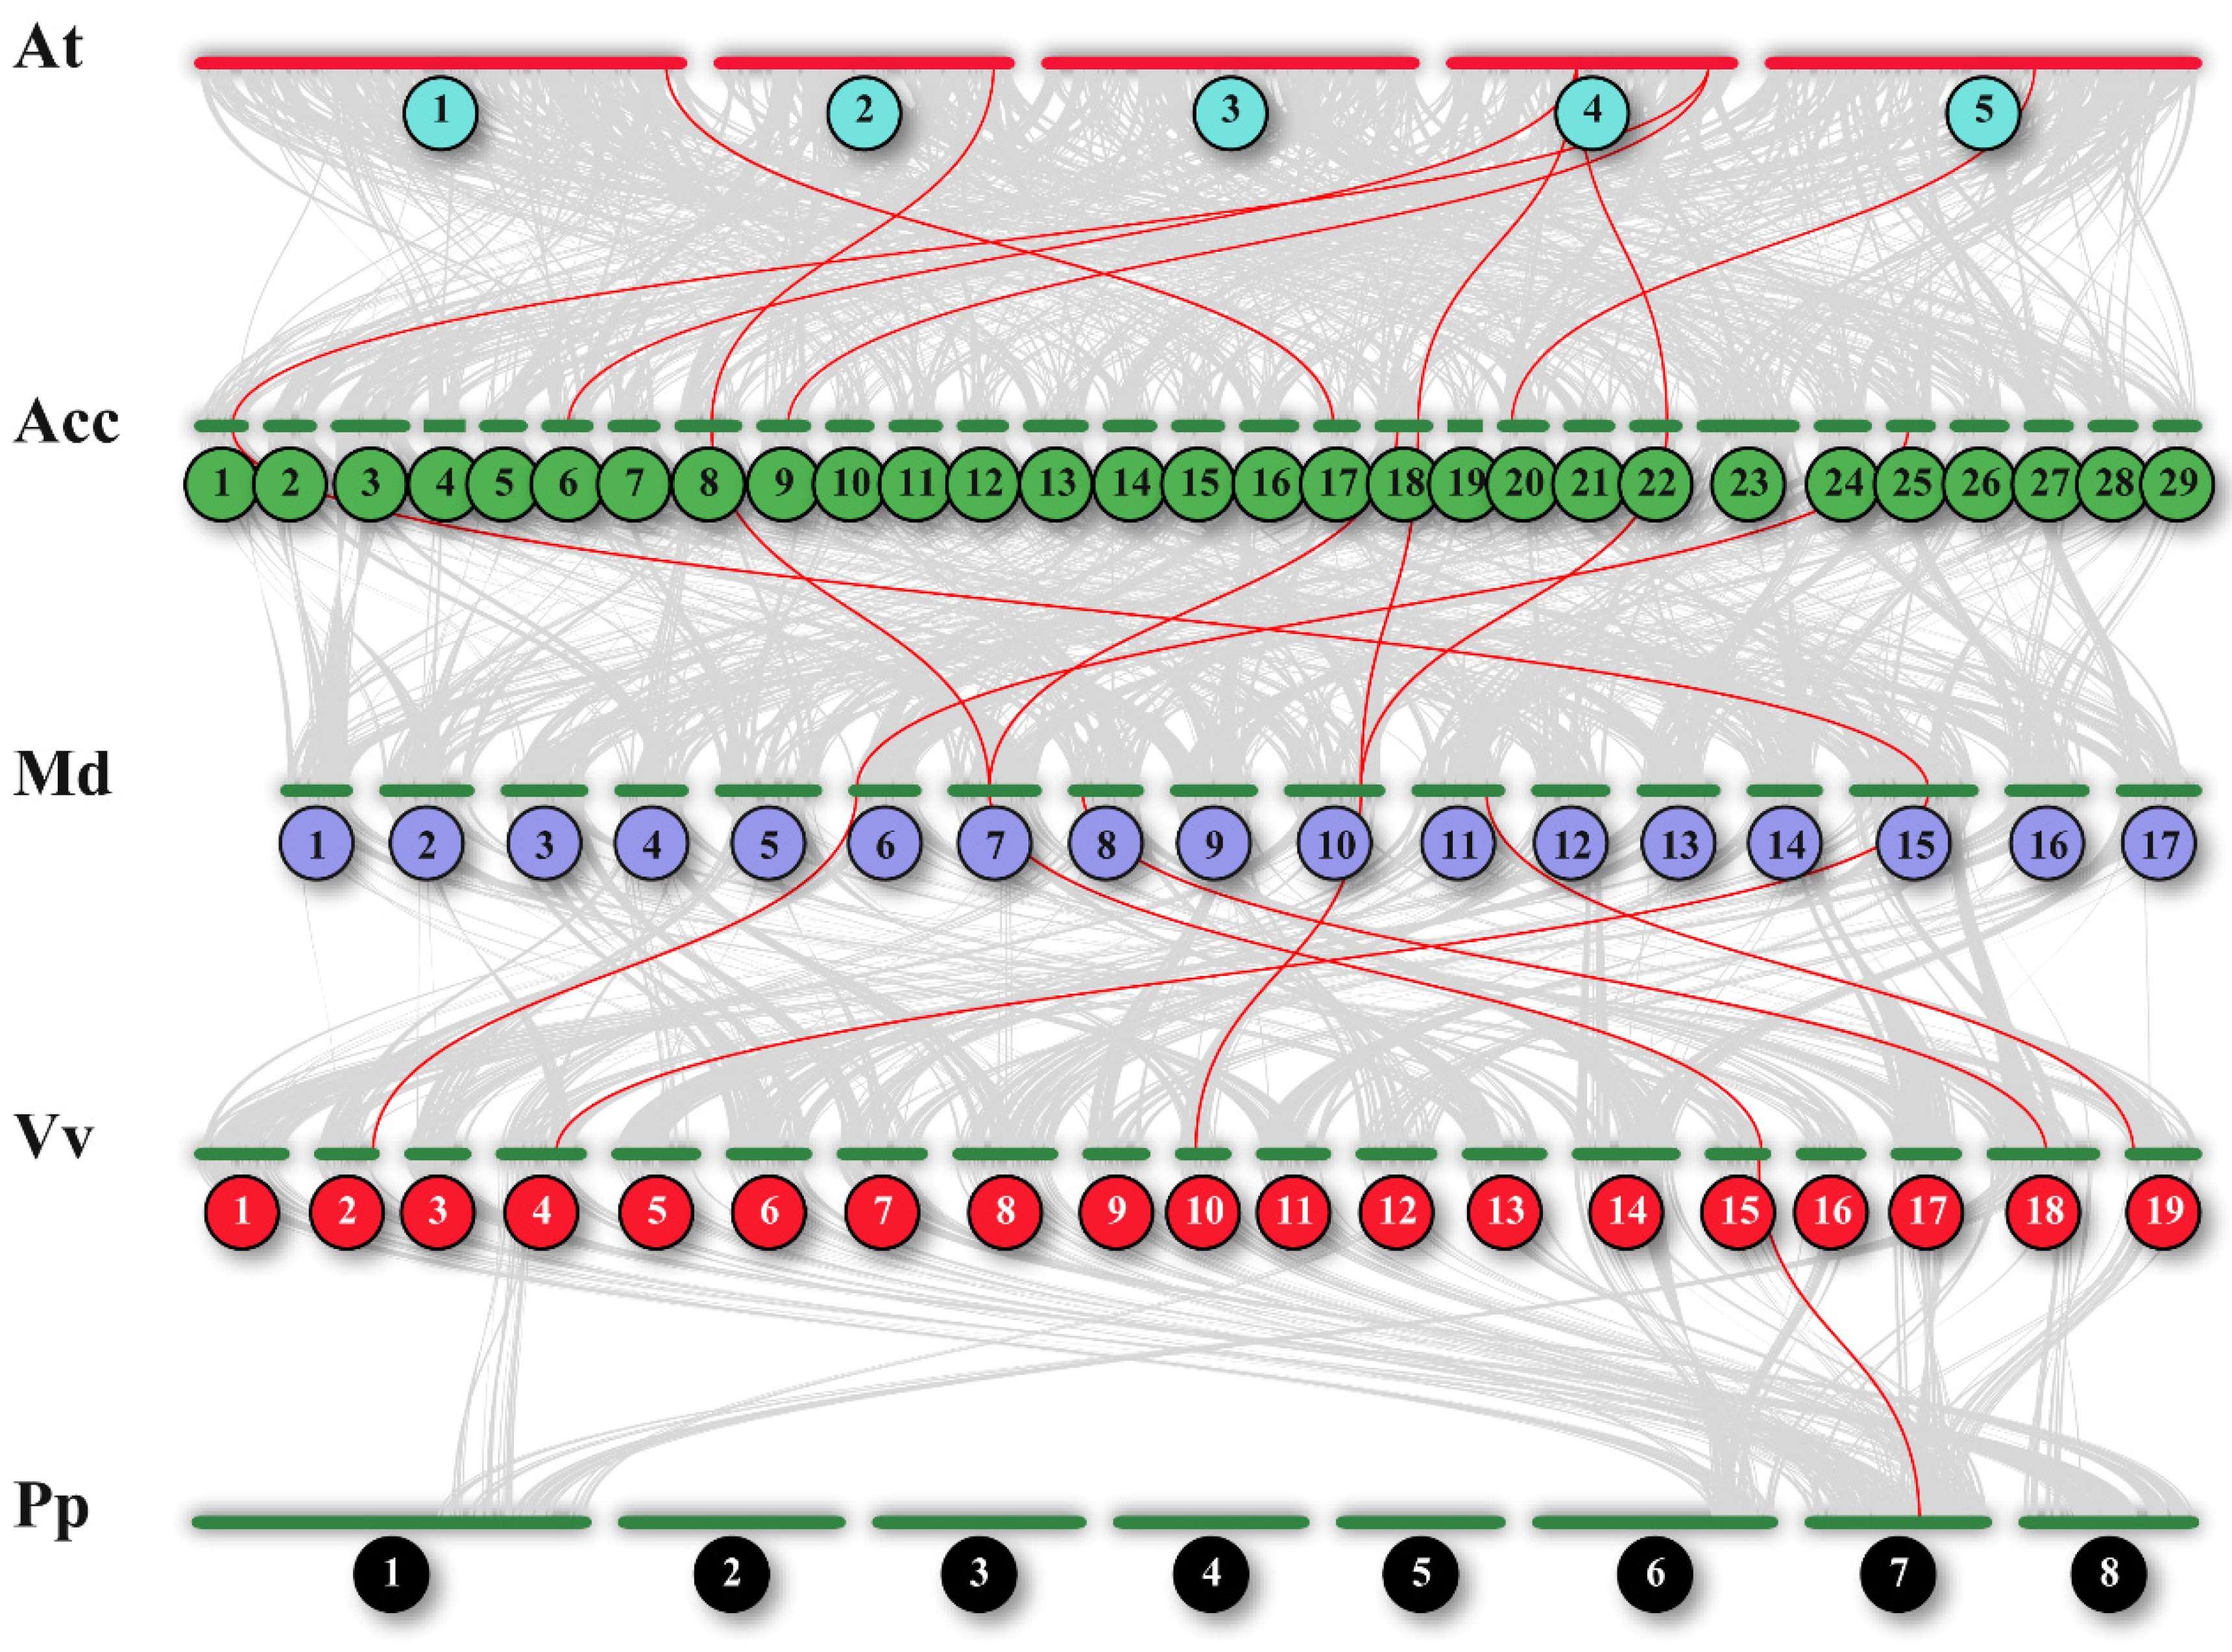
3.2. The BES1 Family Characteristic Revealed by Phylogenetic Relationship and Genomic Collinearity Networks in Six Species

In order to get an accurate phylogenetic relationship in the BES1 family, we selected six plant species (Arabidopsis and five fruits) for constructing the BES1 family, including Arabidopsis thaliana (At), strawberry (Fragaria vesca, Fv), apple (Malus domestica, Md), peach (Prunus persica, Pp), kiwifruit (Actinidia chinensis, Acc), and grape (Vitis vinifera, Vv) (Figure 2A). In this study, a total of 52 BES1 protein sequences were used to construct evolutionary trees (Supplement Table S2). The phylogenetic tree showed that all BES1 genes were classified into six groups: The Groups I and II all contained the BES1 family in six species; their Subgroups contained five BES1 family members in Arabidopsis (AtBZR1, AtBES1, AtBEH1, AtBEH2, AtBEH3), and there was collinearity between the two BES1 genes (Acc00966, Acc10403) in kiwifruit and AtBEH2 at the genomic level; The Group V was divided into separate clades, and six genes comprising four species were clustered into one cluster; The Group VI was the smallest group, containing only two genes (AT1G78700 AtBEH4, strawberry27313). This result indicated that the BES1 family of different species might have undergone functional differentiation in evolution.
We analyzed the 10 motifs shared in the BES1 protein sequence of six species (Figure 2B, Supplement Table S3). The conserved motif modules showed that motif 1 was a crucial domain in the BES1 family, and motif 1 was found in all BES1 members of six representative species. The other nine motifs were missing to varying degrees among the members of the six species. For example, there were 5 BES1 members in kiwifruit and 8 BES1 members in peach that lacked motif 4. Generally, genes containing the same conserved motif may have similar functions. The motifs in the six representative species have both similarities and differences. These results indicated that both functional similarity and functional differentiation exist in the representative species, which is similar to the results of evolutionary tree branching.
To further understand the gene replication mechanism of the BES1 gene family, we constructed a comparative genomics analysis of Arabidopsis and four representative economic fruit trees, including one dicotyledon (Arabidopsis thaliana) and three economic fruit trees (kiwifruit, peach, grape and apple) (Figure 3). A total of 8 pairs of collinearity genes were found between Arabidopsis and Kiwifruit; 6 pairs of collinearity genes were found between Kiwifruit and Apple, 6 pairs of BES1 genes had collinearity relationships in apple and grape genomes; and Only 1 pair of BES1 genes had collinearity relationships in grape and peach genomes, indicating that BES1 might exhibit high evolutionary differentiation among different species. However, the BES1 gene still retains similar biological properties in some species.
The Ka/Ks ratio represents the type of gene selection pressure and its evolutionary rate. If Ka/Ks = 0 represents the selection neutral; Ka/Ks < 1 indicates purification selection, and Ka/Ks > 1 indicates positive selection. Among kiwifruit, apple, grape, and strawberry species, these ratios suggested that the BES1 gene family of these species evolved under pure selection (Supplement Table S4). However, in apples, 3 out of 4 pairs of collinear relationships have a Ka/Ks ratio greater than 1, and only 1 pair has a Ka/Ks ratio greater than 1. Among the five representative species, the replication type of collinear relationship pairs is mainly fragment replication.

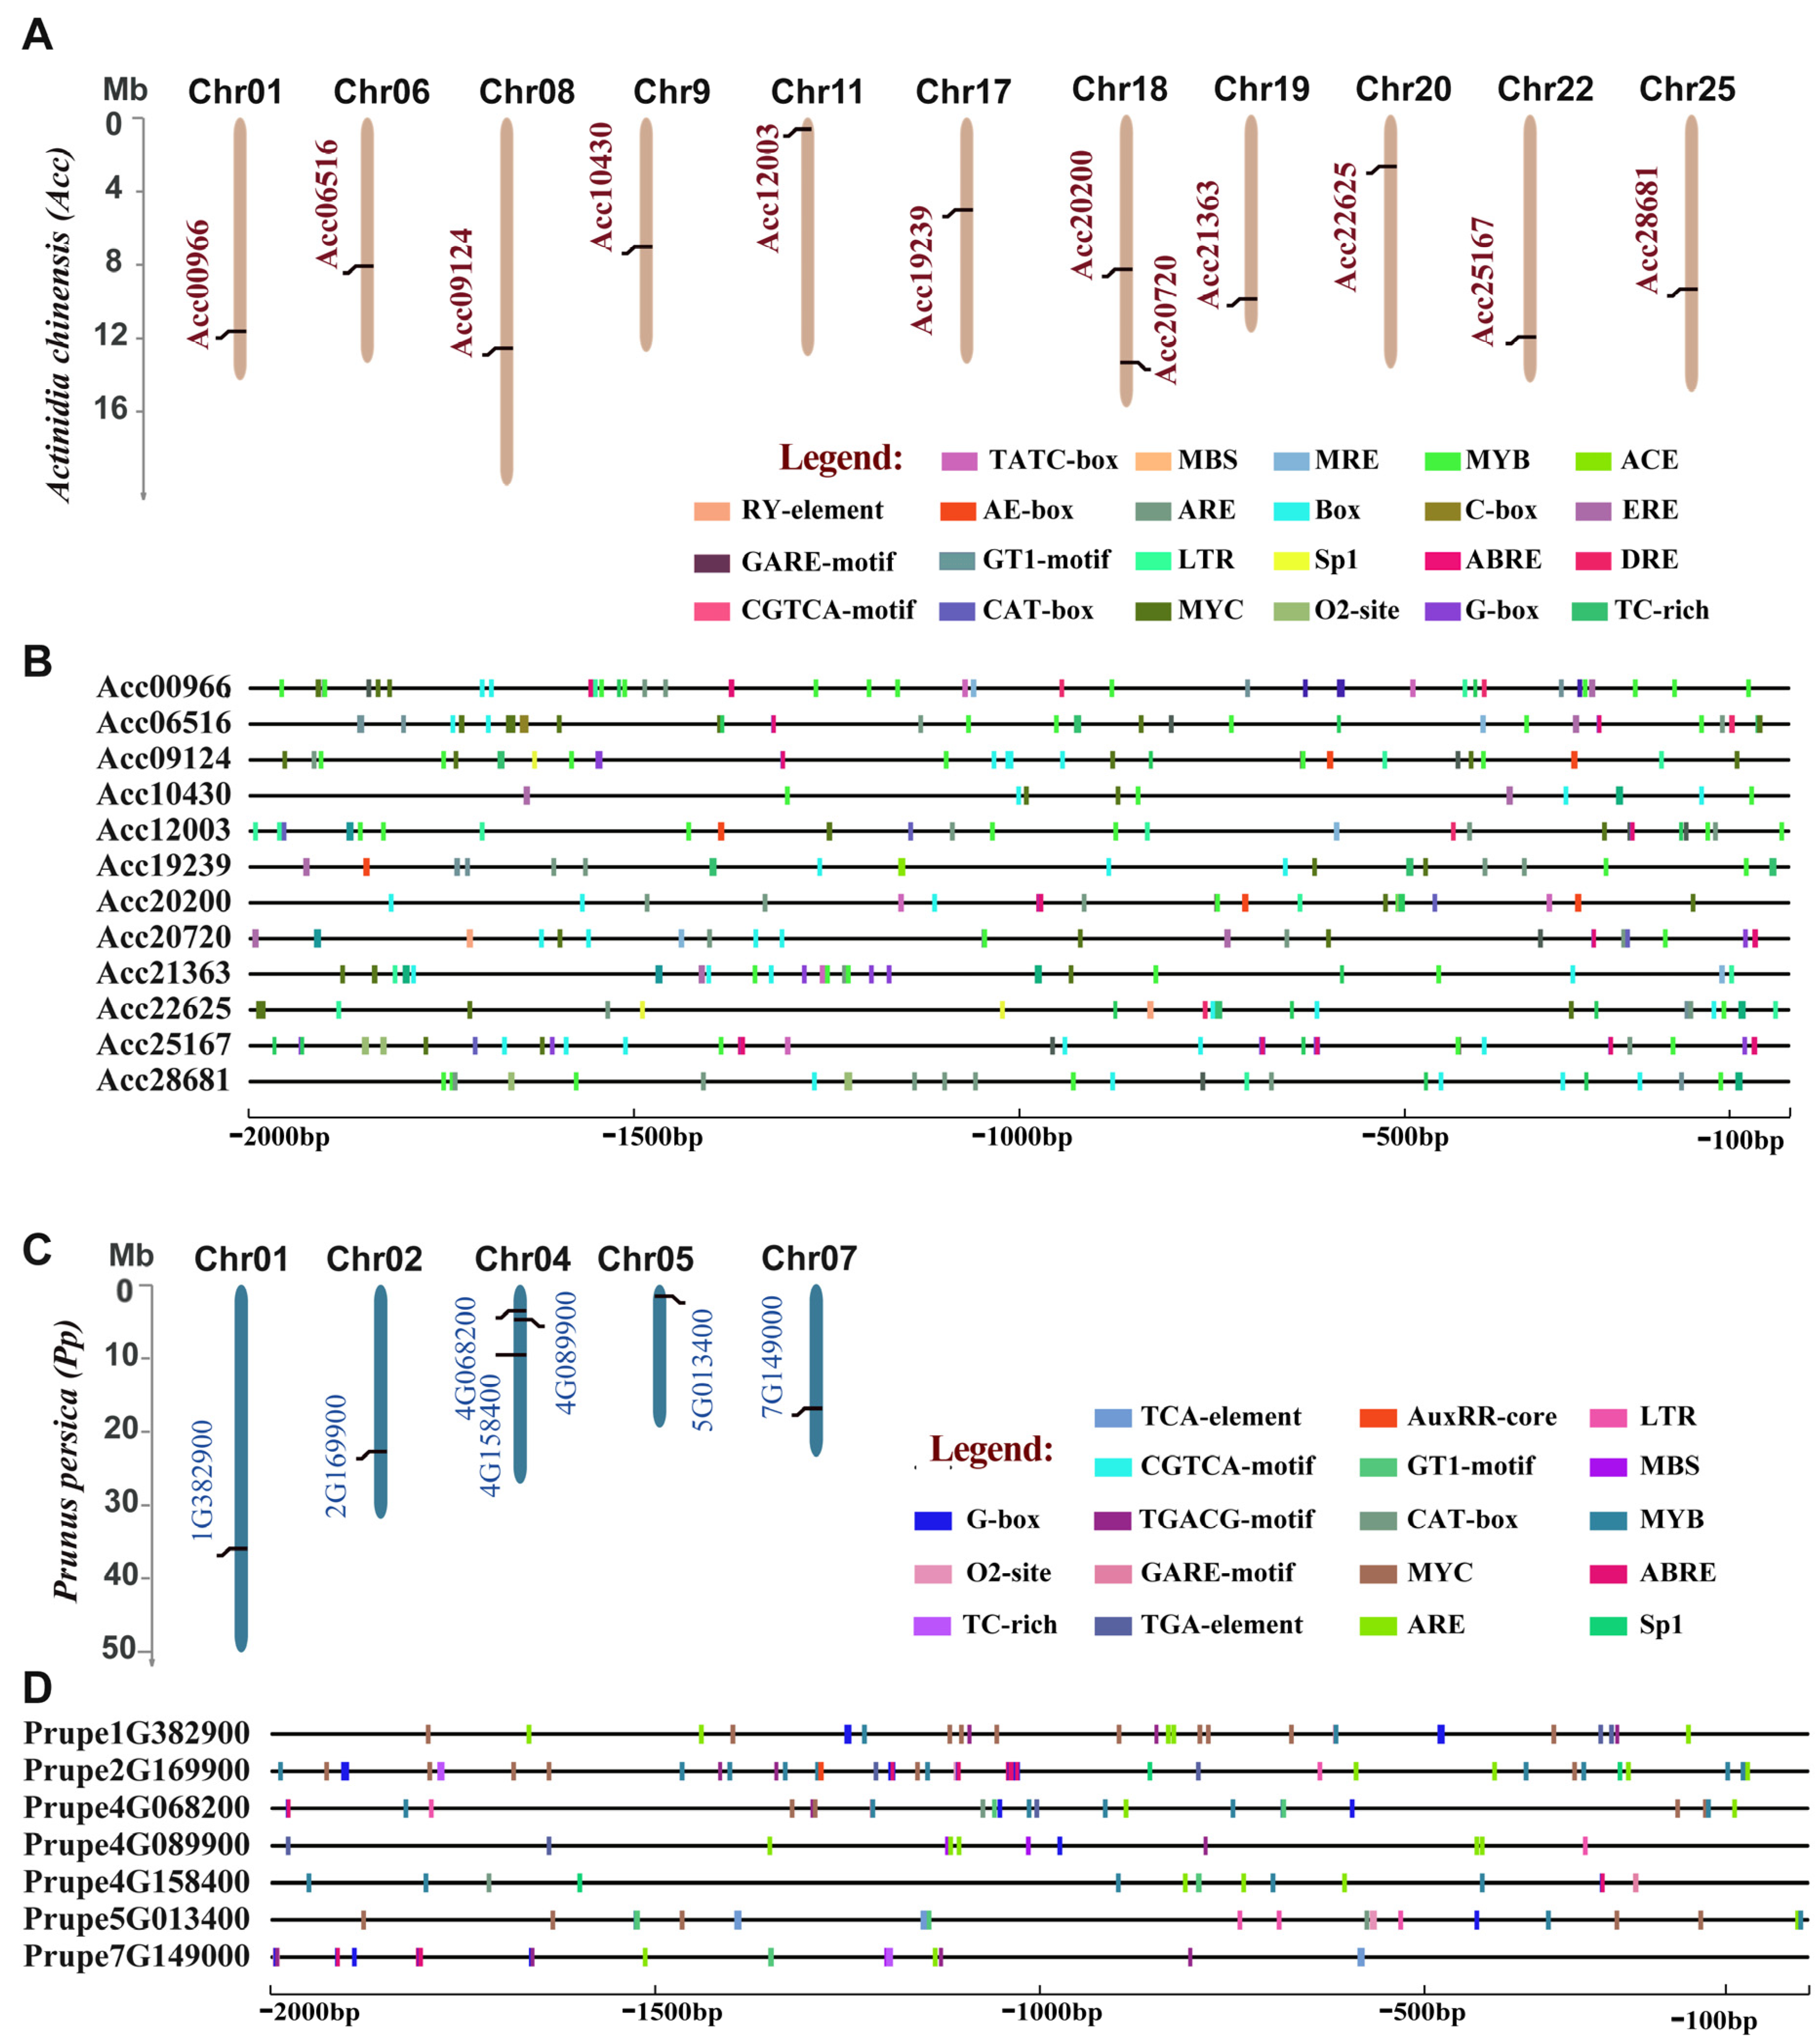
3.3. Genome-Wide Identification of BES1 Family in Kiwifruit and Peach

We focused on analyzing the BES1 gene family of kiwifruit and peachs. To determine the distribution of the BES1 gene on different chromosomes of kiwifruit and peach, we constructed a chromosome map using the information from the kiwifruit ‘Red5’ and peach genomes (Figure 4A,C). The results showed that the BES1 gene in kiwifruit was unevenly located on 11 chromosomes, while two genes (Acc20200 and Acc20720) were located on chromosome 18. In peach, 7 BES1 genes were distributed on 5 different chromosomes, among which 3 genes (4G06820, 4G15840, and 4G089900) were distributed on chromosome 4 of peach.
To understand the regulatory of the BES1 gene family, the common cis-elements in the promoter region of the BES1 gene family in kiwifruit and peach were analyzed (Figure 4B,D; Supplement Table S5). We searched for 2000 bp upstream of members of the BES1 gene family in kiwifruit and peach from the Transcription Start Site. The analysis of cis-elements in the BES1 family genes of kiwifruit and peach showed that there were elements in the promoter region that responded to plant hormones (auxin, abscisic acid, methyl jasmonate). It was also found that plant growth, development and stress response elements existed in the promoter regions of all BES1 genes. Among these cis-elements, the main included ABRE, G-BOX, LTR etc., which were related to abscisic acid, light response and low temperature, indicated that the BES1 gene might be induced by abiotic stress, thereby participating in plant stress resistance. In addition, cis-elements regulated by MYB and MYC were also found on the BES1 gene promote. These results indicated that the BES1 family genes might participate in various stress and plant hormone response processes, effectively promoting plant growth and stress resistance and have important biological functions.

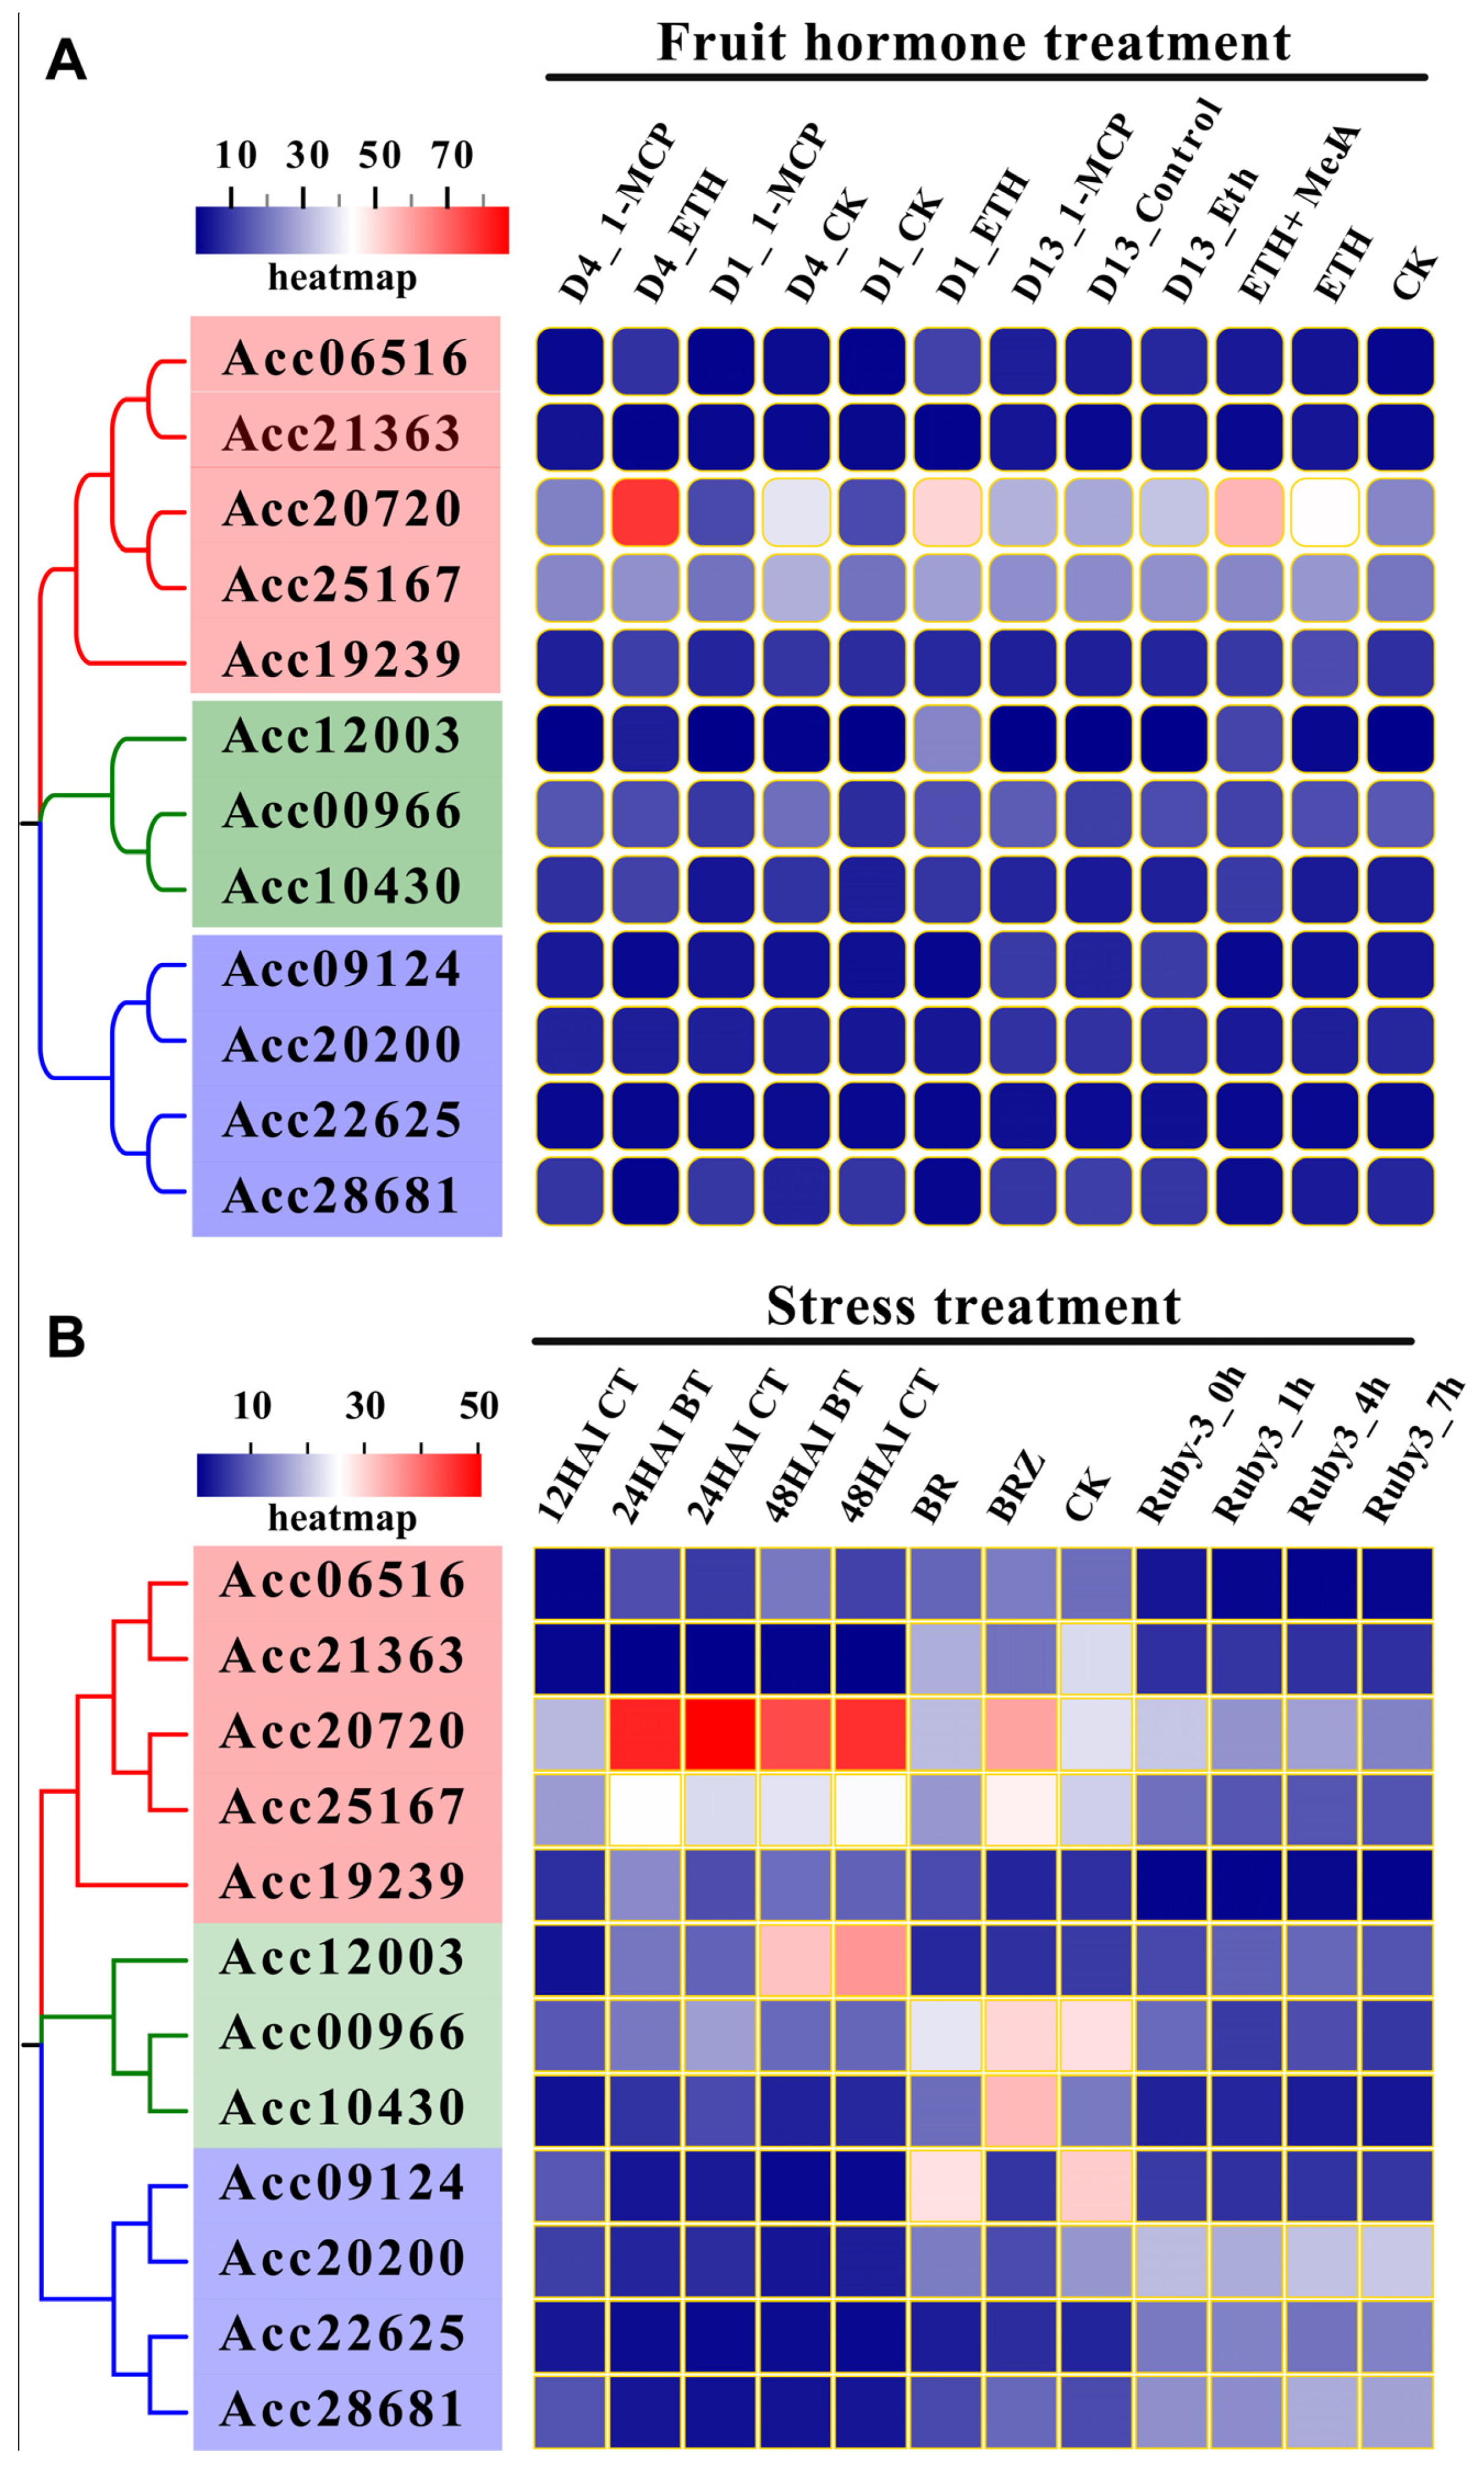
3.4. Expression Analysis and Transcriptional Regulatory Networks of BES1 Family in Kiwifruit

A large-scale transcriptome dataset was evaluated to evaluate the expression pattern of the BES1 genes in different conditions. We illustrated the expression patterns of BES1 genes in multiple states, including various stressors, the development process, and postharvest stages. using kiwifruit species as an example. We collected 136 samples of kiwifruit under various stress conditions (Staphylococcus griseus infection, brassinolide treatment, cold treatment), different developmental stages (root, stem, leaf, flower, fruit), and postharvest senescence (ethylene and 1-MCP treatment). 12 BES1 genes families were identified in the kiwifruit family. Cluster heat map results showed that under fruit hormone treatment (Figure 5), the gene expression of 2 BES1 genes (Acc20720 and Acc25167) in ethylene and methyl jasmonate combined treatment was higher than that of other BES1 members. Among them, Acc20720 was significantly induced by ethylene.
Under pathogen stress, three BES1 genes (Acc20720, Acc25167, and Acc12003) were significantly induced. Under the brassinolide treatment, the expression levels of four genes (Acc20720, Acc25167, Acc00966, and Acc10430) were higher than those of other BES1 family members under BRZ (a brassinolide inhibitor) treatment, which indicated that these four genes may be negatively regulated by brassinolide. Under cold stress, there was no significant change in the expression level of family members, indicating that BES1 family members were not sensitive to cold stress. The above results indicated that members of the BES1 family played different functions under different treatments, and these results also indicated that BES1 members might have undergone functional differentiation, similar to the results of evolutionary trees.
To evaluate the tissue specificity of members of the BES1 gene family, we constructed expression profiles in different tissues and fruit development stages. The results (Figure 6) indicated that different family members were diverse in expression levels in different tissues (roots, stems, leaves, flowers, and fruits). Therefore, two BES1 genes (Acc19239 and Acc00966) were significantly overexpressed in flower buds, three BES1 genes (Acc20720, Acc25167, and Acc10430) were specifically expressed during fruit development. These results indicated that different members of the BES1 gene family of kiwifruit play different functions in different tissues and development stages and participate in the growth and development of plants.
In addition to the expression profile of the BES1 gene family, we further studied the biological function of the BES1 gene from the perspective of the transcriptional regulation network. Through database prediction, we obtained a regulatory network consisting of 3 BES1 TFs in kiwifruit and 916 target genes (Supplement Figure S1). Among these target genes, some genes were regulated by a single BES1 transcription factor, while others were co-regulated by multiple transcription factors, and there was a regulatory relationship between these BES1 transcription factors. In addition, there were some transcription factors in 916 target genes, such as 11 AP2/ERF transcription factors, 6 MYB transcription factors, 5 bHLH transcription factors, and some structural genes, such as 7 P450 family members. Then we conducted GO functional enrichment analysis on these target genes (Supplement Figure S2), which found that these target genes were mainly enriched in cell components related to photosynthesis in plant growth and development.
To understand whether the BES1 gene is regulated by miRNAs, we measured the regulatory relationship of BES1 targeted by miRNAs (Supplement Figure S3). The results showed that 12 BES1 genes were predicted as target genes for miRNA. All BES1 genes were targeted by multiple miRNAs, of which Acc22625 was composed of 15 miRNAs. These results indicated that the BES1 family might play an important role in participating in miRNA and regulating stress responses in plants.

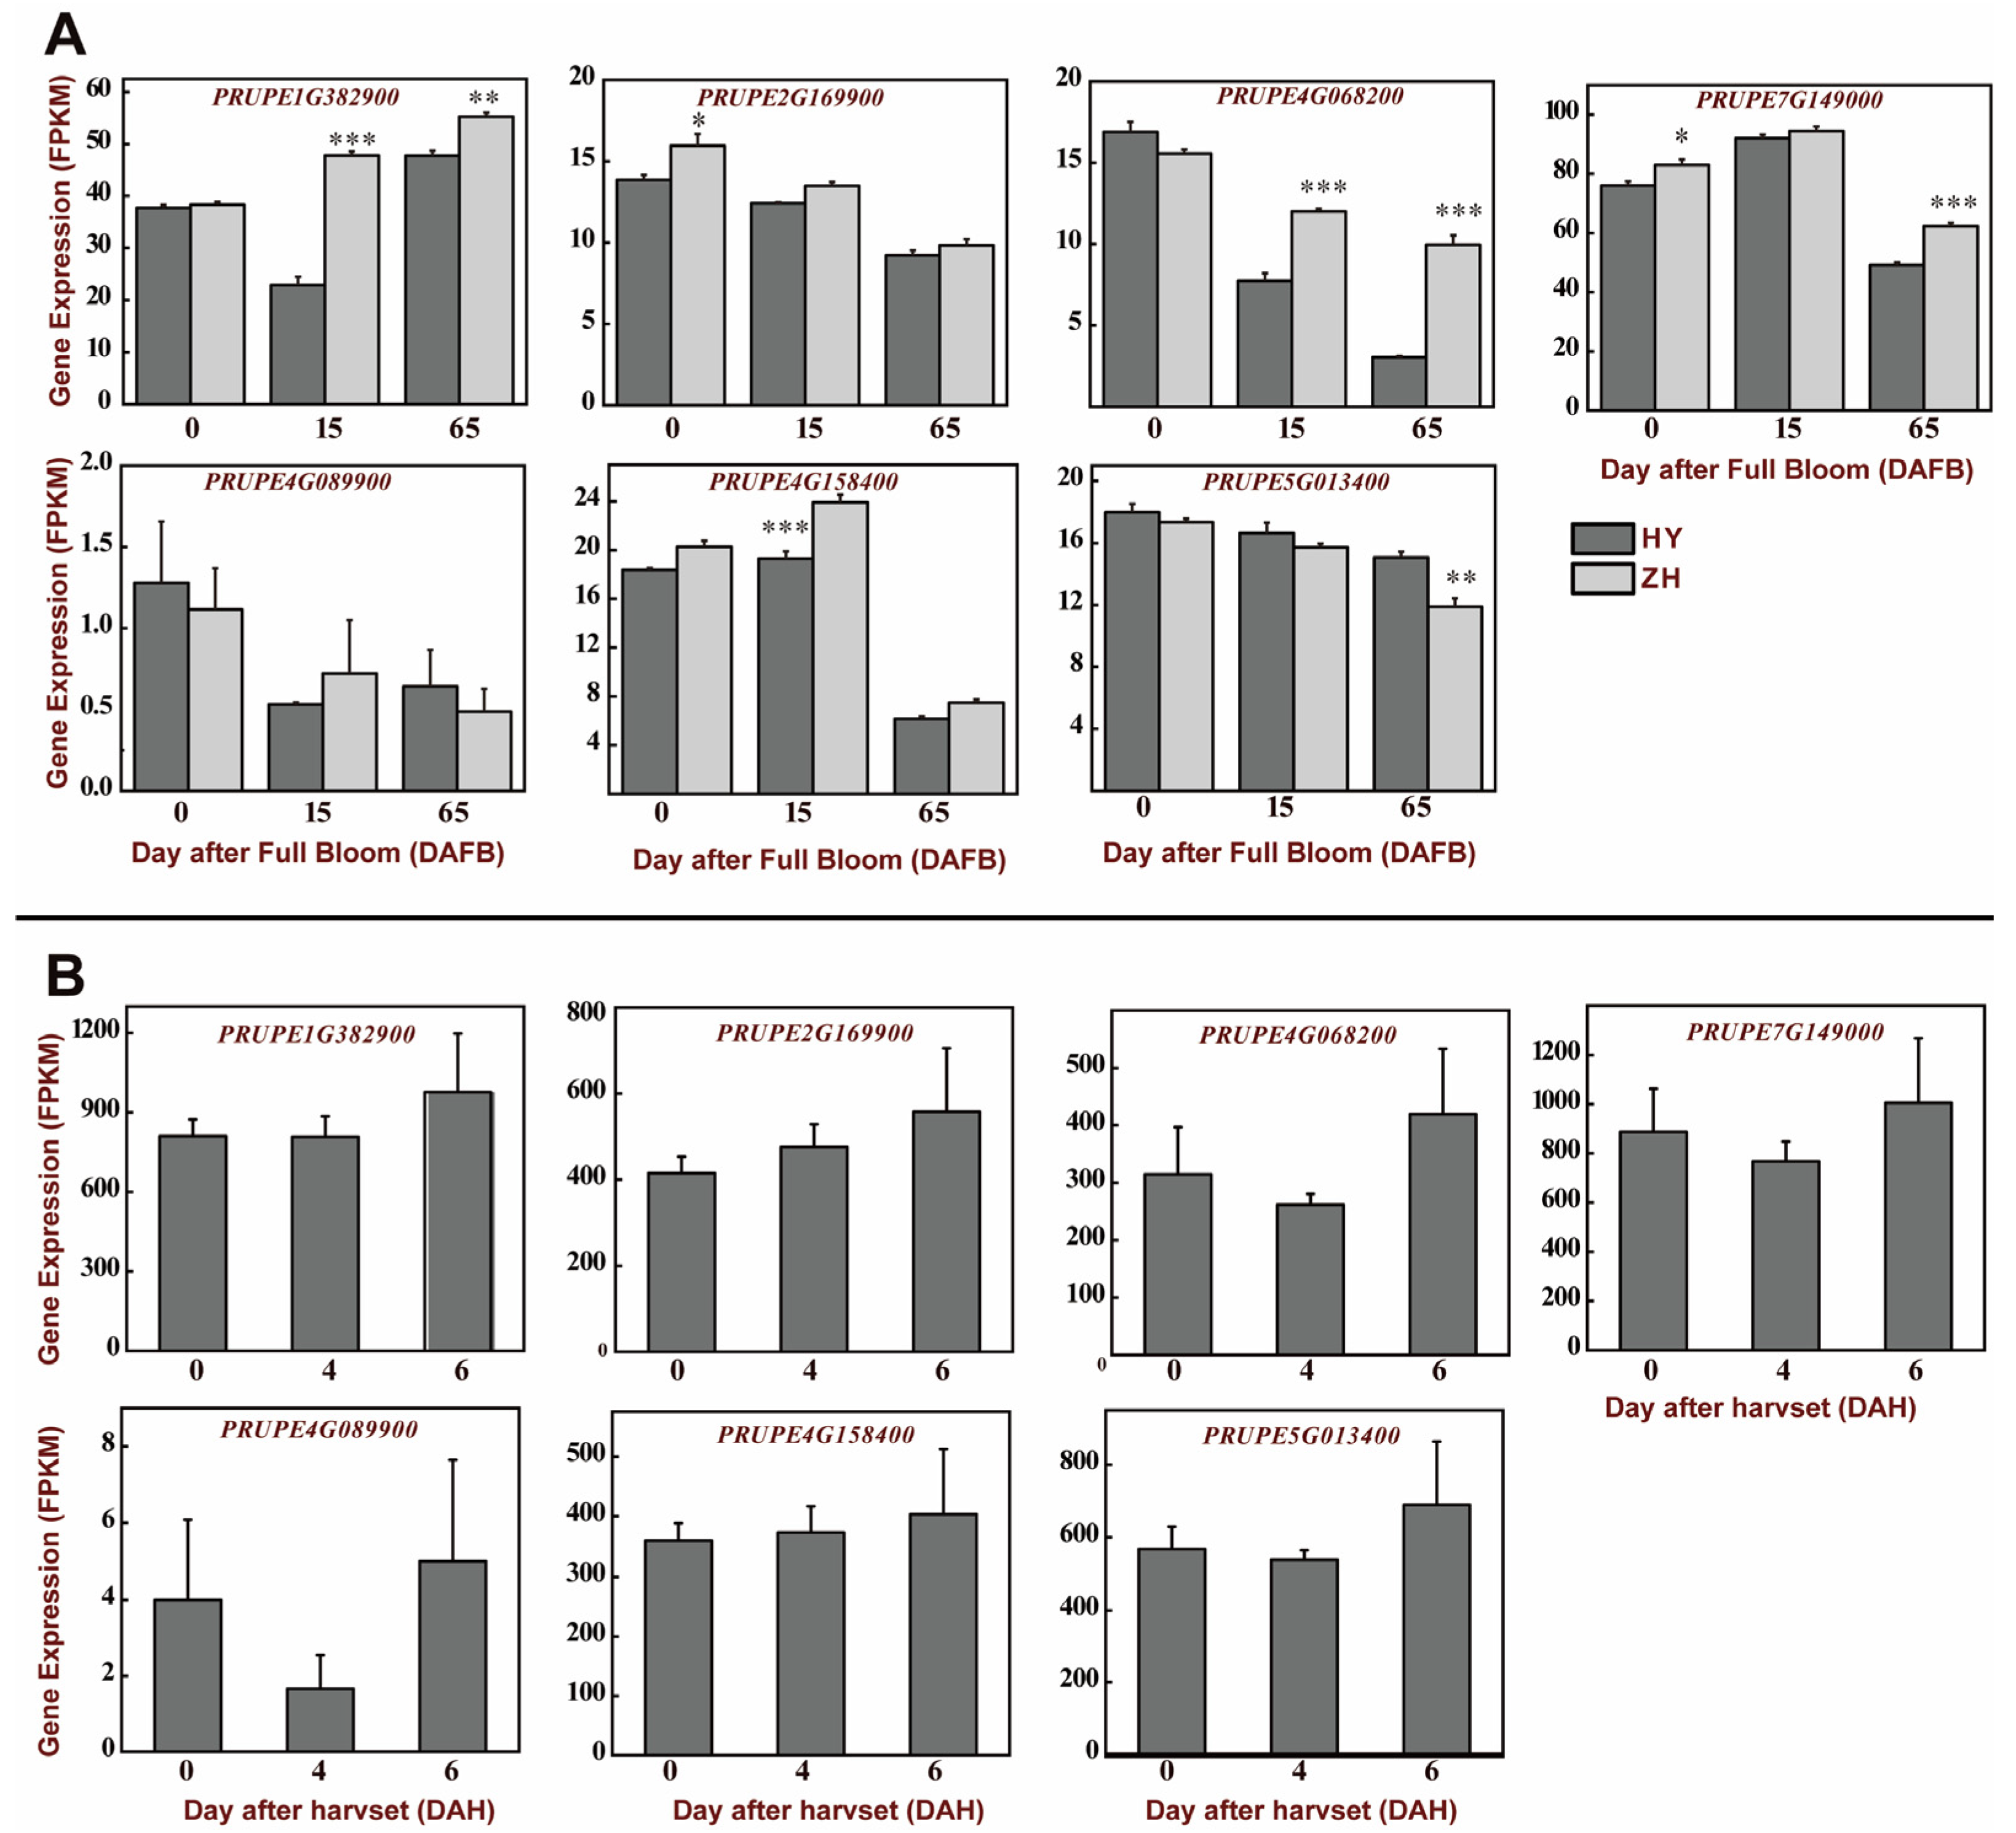
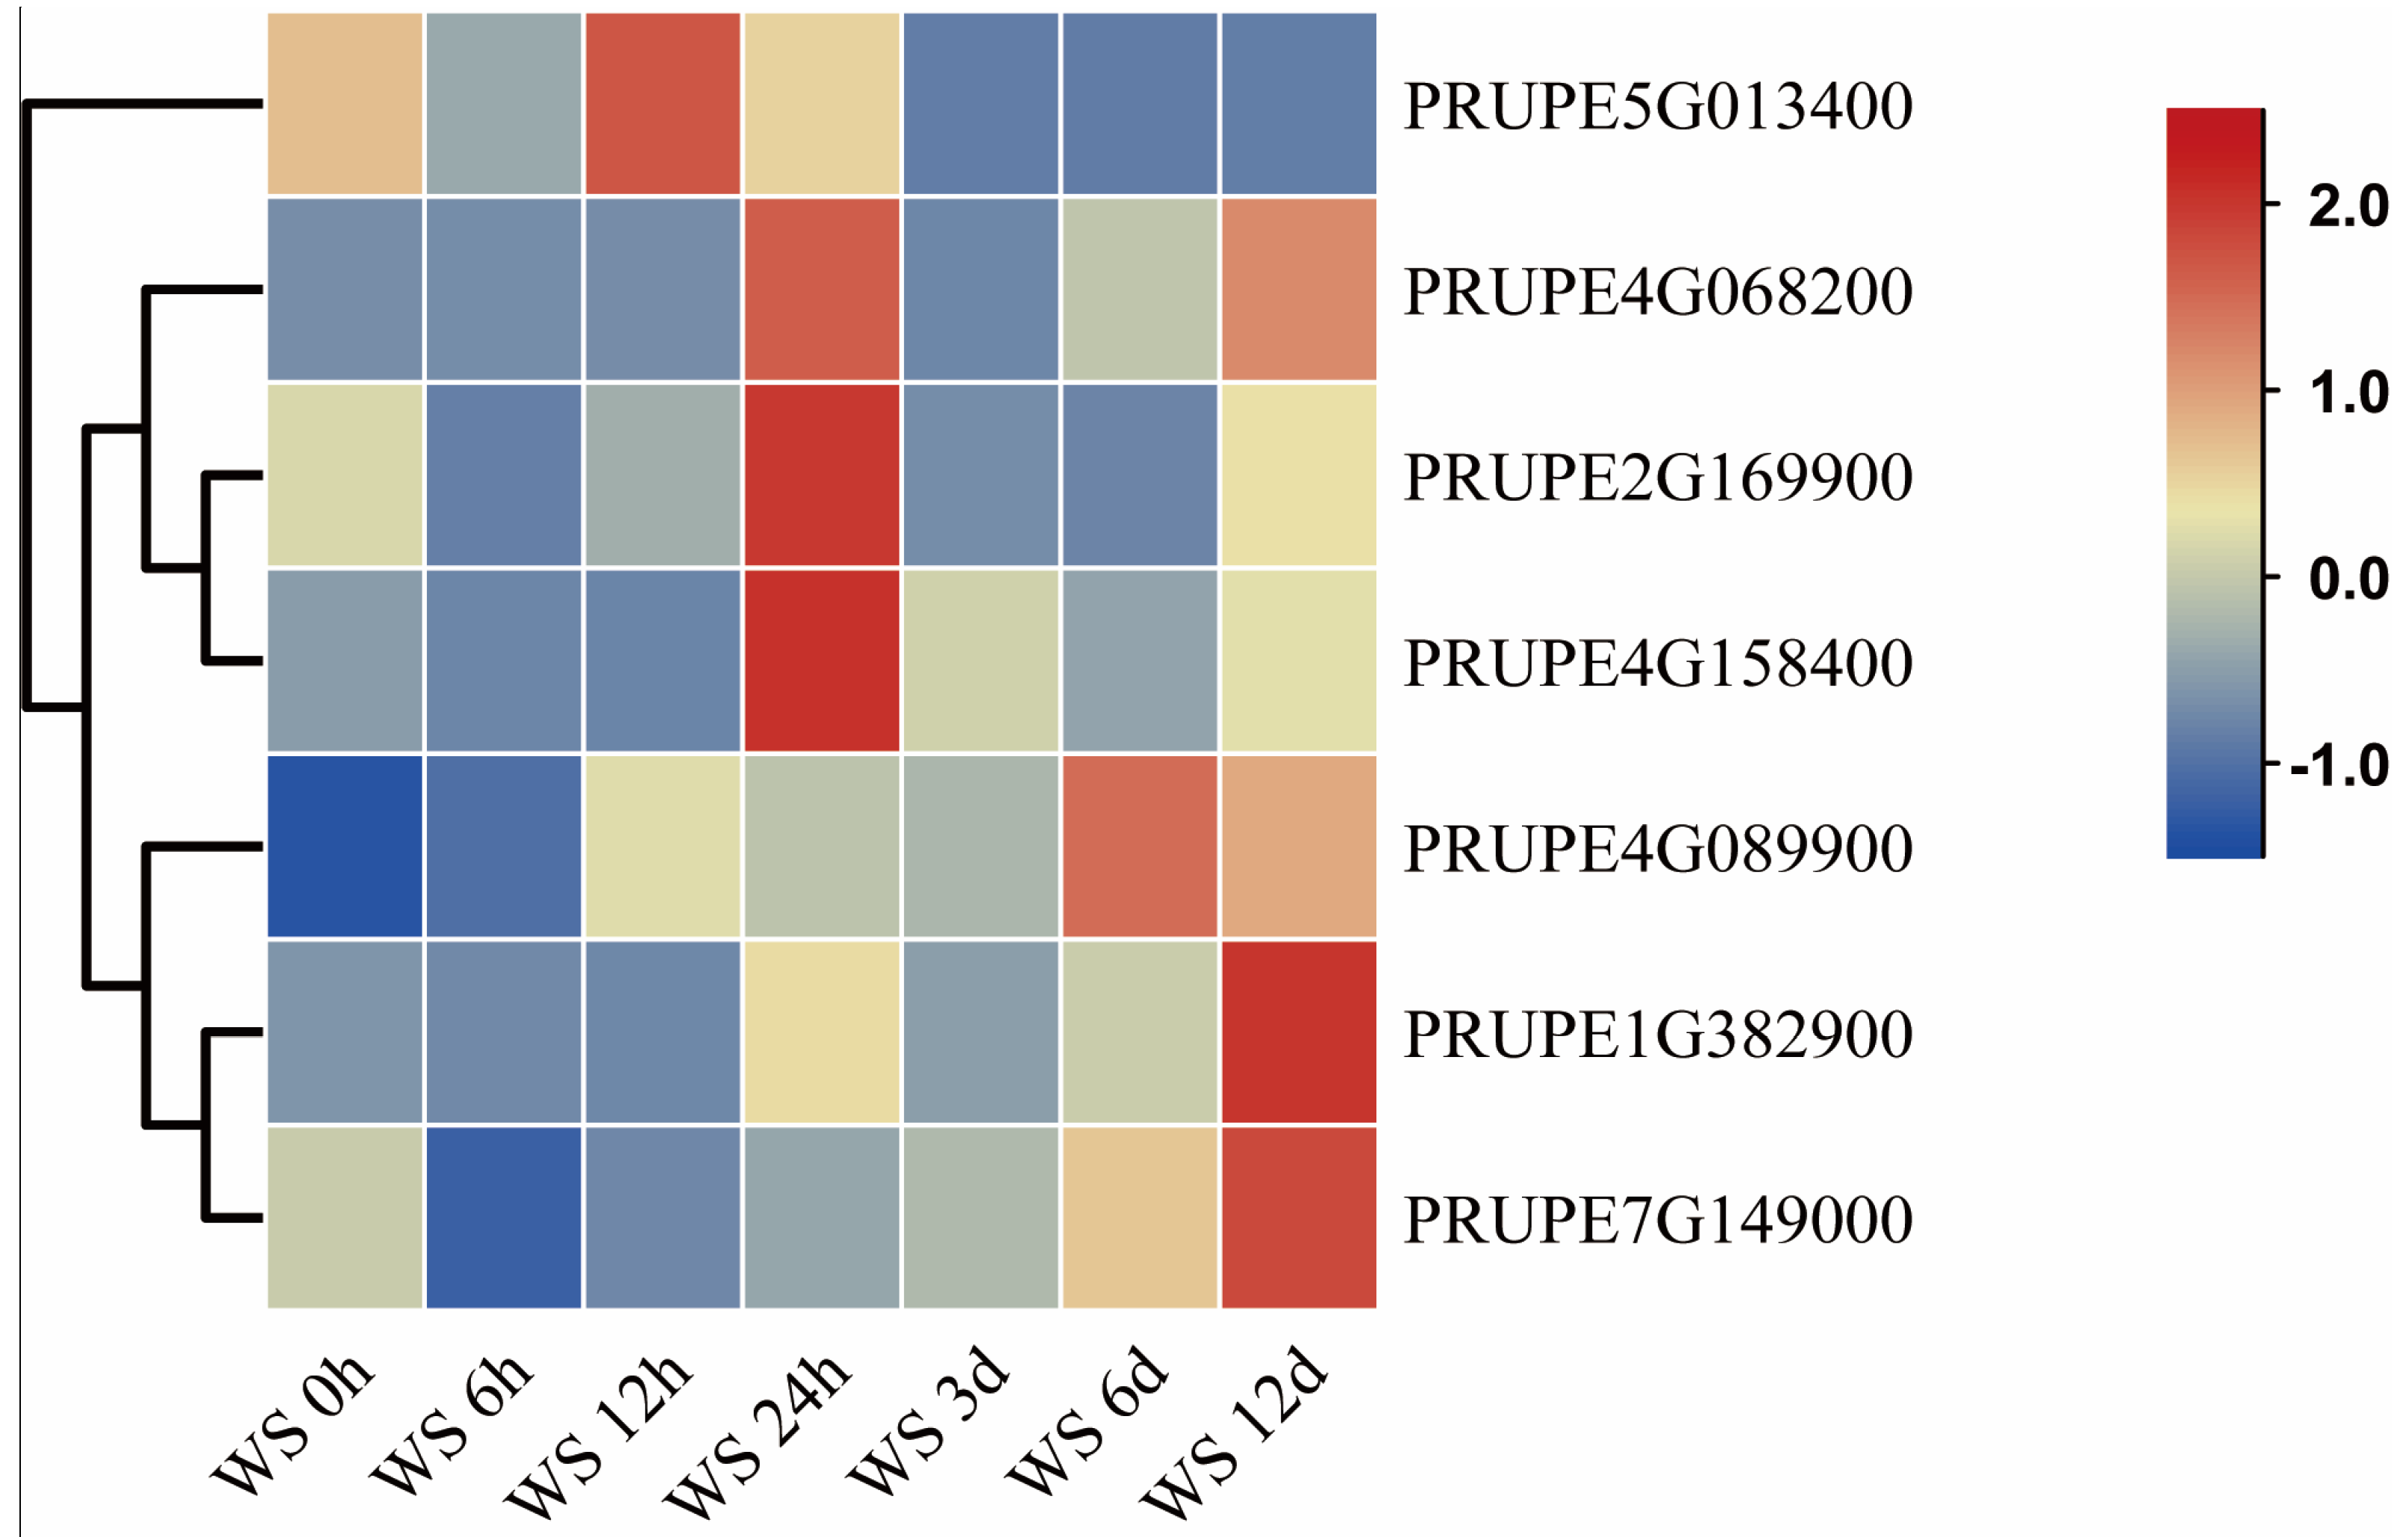
3.5. Expression Analysis of BES1 Genes in Peach Development and Postharvest Stages

The expression patterns of BES1 members in the peach family during development were also explored. The results of transcriptome data showed that (Figure 7A): the expression level of PRUPE1G382900 was gradually increasing. However, the expression levels of PRUPE4G089900, PRUPE4G068200, and PRUPE5G013400 gradually decreased during development. These results were similar to the expression trend of BES1 members in peach during development.
To further evaluate the expression pattern of the BES1 gene, we collected transcriptome data from two peach cultivars during postharvest storage (Figure 7B). The results showed that the expression of PRUPE1G382900 and PRUPE2G16990 genes gradually increased at different postharvest stages. During the postharvest stage, the expression levels of PRUPE4G068200 and PRUPE4G008290 were gradually descending and then ascending. Other genes exhibited fluctuating trends, indicating that different BES1 genes play different functions in different stages of peach postharvest.
According to the analysis of gene expression patterns of BES1 family members in peaches under water stress conditions (Figure 8), about 57% of genes respond in the early stages of water stress, mainly reaching their peak expression at 24 h. The expression levels of other genes were higher on the 6th and 12th days after stress. The different expression patterns in response to stress indicate that BES1 members play different functions under water stress.

4. Discussion

In this study, we identified 440 BES1 family genes from the entire genome of 48 horticultural plants. We also conducted a systematic comparative analysis of these species, revealing their basic characteristics, conserved motifs, evolution, expression patterns, regulatory networks, and phylogenetic relationships. In this study, we found differences in the number of members of the BES1 Gene family in 48 horticultural crops. The number of BES1 in fruit trees was relatively large, while the number of BES1 in medicinal plants was relatively small. Gene replication is considered the main driving force of evolution, leading to functional divergence and diversification [37,38]. In this study, we found that among the five representative fruit tree species, the replication type is mainly fragment replication (Supplement Table S4). The gene structure is a typical feature of the Gene family, representing its evolutionary process [39]. A comprehensive analysis of the protein motif and phylogenetic relationship of BES1 gene in five representative horticultural crop species showed that the genes in the same subgroup were Elevation conserved, indicating that the genes in this subgroup might have similar biological functions. There are also differences in motif and evolution among different species, indicating differences in the degree of BES1 gene replication and functional differentiation among each species.
Research shows that cis-elements play an important role in the transcriptional regulation signal pathway of plants under various biotic and abiotic stresses [40]. There is an antagonistic relationship between BR and ABA in regulating growth and development. For example, Research has shown that BES1 inhibited the expression of ABI3 (a transcription factor for ABA signaling), thereby inhibiting the activation of downstream ABI5 transcription factors by ABI3, leading to ABA signal transduction and delayed seedling development [41]. BR is very similar to IAA and is an important hormone that regulates the size of maternal tissue. Research has shown that during the development of seeds and ovules, ANT can increase the number of ovules, AP2 inhibits the number of ovules, and BES1 directly binds to the promoters of ANT and AP2 to regulate their expression [42,43]. Studies have shown that BES1 directly binds to the cis-elements of the promoter of gibberellin related genes GA20ox-2, GA3ox-2 to regulate expression, thereby affecting seed germination, cell division, and other growth processes [44,45]. In this study, the promoter regions of the BES1 gene family in kiwifruit and peach were analyzed. The analysis of cis-elements in the BES1 family genes indicated that the BES1 transcription factor promoter responds to elements, such as methyl jasmonate (CGTCA motif), abscisic acid (ABRE), gibberellin (GARE motif), salicylic acid (TCA element) and auxin (TGA element). In addition, there were cis-elements on the BES1 transcription factor promoter that were involved in responding to stress, such as low light, low temperature and drought. We speculate that the BES1 genes are not only related to the growth and development of flowers and fruits, but also participates in various stress and plant hormone response processes, effectively promoting plant growth and stress resistance and have important biological functions.
Many experiments have shown that the BES1 genes exhibit different responses to BR, methyl jasmonate, and ethylene treatments. Recent studies have shown that BR regulates ethylene biosynthesis in a dose-dependent manner. Low levels of BR inhibit ACS transcription and ethylene production by increasing the activity of BES1, while high levels of BR stimulate ethylene release by enhancing the stability of ACS or affecting the auxin pathway that regulates ethylene [46]. In pear, overexpression of the PuBZR1 inhibits the expression of transcription factor PuERF2, indirectly inhibiting the transcription of the ethylene biosynthesis genes PuACO1 and PuACS1a [47]. In this study, after BR treatment, the expression of four BES1 genes (Acc20720, Acc25167, Acc00966, and Acc10430) in kiwifruit seedlings were significantly higher than that in BRZ treatment (Figure 5), indicating that the BES1s transcription factors were induced by BR. We believe that since BES1 is the only transcription factor involved in BR signal transduction, BR has a positive regulatory effect on the expression of the BES1 gene. Transcriptome data analysis showed that Acc20720, a member of BES1, was significantly induced by ethylene and methyl jasmonate during fruit ripening, indicating that it may be related to the softening mechanism of fruit ripening, which is similar to previous experimental results. BR participates in the GA pathway and has interactions that regulate plant growth and development. In dark environments, GA deficient mutants also exhibit a de yellowing photomorphogenetic phenotype [48]. BES1/BZR1 can regulate plant growth and development by regulating gene expression. Combining BES1/BZR1 with the promoter of the key gene FZP for GA biosynthesis to regulate plant development and yield [2]. BES1 regulates the development of the primary phloem of the main root by regulating the expression of BRL3 [49]. In this study, the BES1 genes were highly expressed in flowers, young fruits, and mature fruits, indicating an important role in their development process. Studies have found that BES1/BZR1 participates in plant stress response by mediating BR [50]. In rapeseed, the expression of BrBZR gene was induced by low temperature, salt, drought stress, and ABA treatment [6]. In this study, under pathogen stress, members of the BES1 family (Acc20720, Acc25167, and Acc12003) were significantly induced. In water stress, BES1 members in peaches play a more important role in the early stages of stress. Overall, the differences in gene expression among members of the BES1 gene family in different tissues and under different stresses may significantly improve the species’ tolerance to biotic and abiotic stresses, as well as their ability to better adapt to the environment to meet their own growth and development processes.
In conclusion, we identified and analyzed the BES1 Gene family of the 48 horticultural plants and the representative species of the BES1 family in terms of expression mode, evolutionary relationship, gene structure, etc., providing a theoretical basis for future research on the function of this important BES1 Gene family.

Supplementary Materials

The following supporting information can be downloaded at: https://www.mdpi.com/article/10.3390/horticulturae9090971/s1, Table S1. The information of identified BES1 family genes in 48 plants; Table S2. The protein sequences of BES1 gene family in 6 representative species; Table S3. Analysis and distribution of conserved motifs in 6 representative plants; Table S4. Ka/Ks analysis of gene pairs in 5 representative fruit trees; Table S5. Cis-elements in the promoters of kiwifruit and peach putative BES1 genes. Figure S1. The transcriptional regulatory network of BES1 genes in Kiwifruit; Figure S2. GO enrichment of BES1 target genes in Kiwifruit; Figure S3. Schematic representation of the regulatory network relationships between the putative miRNAs and their targeted BES1 genes of Kiwifruit.

Author Contributions

Y.D. and J.T. designed the experiments. H.Y., Y.Y., G.C. and S.R., carried out the experiments and performed the data processing. Analysis and interpretation of data: Y.Y., J.W., X.S., Q.L., S.R., Q.Z., H.Y., Y.D. and X.R. wrote and revised the article. Y.D. and J.T. directed the study. All authors have read and agreed to the published version of the manuscript.

Funding

This research was funded by Key Development Project of Ningxia Hui Autonomous Region (2021BBF02014); Demonstration project of scientific and technological innovation in agricultural high-quality development and ecological protection of Ningxia Academy of Agricultural and Forestry Sciences (NGSB-2021-1); Natural Science Basic Research Program of Shaanxi (Program No. 2022JQ-178).

Institutional Review Board Statement

The study did not require ethical approval.

Informed Consent Statement

Not applicable.

Data Availability Statement

All data are displayed in the manuscript and Supplementary Files.

Conflicts of Interest

The authors declare no conflict of interest.

References

  1. Zhao, J.; Peng, P.; Schmitz, R.J.; Decker, A.D.; Tax, F.E.; Li, J.M. Two putative BIN2 substrates are nuclear components of brassinosteroid signaling. Plant Physiol. 2002, 130, 1221–1229. [Google Scholar] [CrossRef] [PubMed]
  2. Bai, X.; Huang, Y.; Hu, Y.; Liu, H.; Zhang, B.; Smaczniak, C.; Hu, G.; Han, Z.; Xing, Y. Duplication of an upstream silencer of FZP increases grain yield in rice. Nat. Plants 2017, 3, 885–893. [Google Scholar] [CrossRef] [PubMed]
  3. Clouse, S.D.; Langford, M.; McMorris, T.C. A Brassinosteroid-Insensitive Mutant in Arabidopsis thaliana Exhibits Multiple Defects in Growth and Development. Plant Physiol. 1996, 111, 671–678. [Google Scholar] [CrossRef]
  4. Bajguz, A.; Tretyn, A. The chemical characteristic and distribution of brassinosteroids in plants. Phytochemistry 2003, 62, 1027–1046. [Google Scholar] [CrossRef]
  5. Wang, Z.-Y.; Bai, M.-Y.; Oh, E.; Zhu, J.-Y. Brassinosteroid Signaling Network and Regulation of Photomorphogenesis. Annu. Rev. Genet. 2012, 46, 701–724. [Google Scholar] [CrossRef]
  6. Sahni, S.; Prasad, B.D.; Liu, Q.; Grbic, V.; Sharpe, A.; Singh, S.P.; Krishna, P. Overexpression of the brassinosteroid biosynthetic gene DWF4 in Brassica napus simultaneously increases seed yield and stress tolerance. Sci. Rep. 2016, 6, 28298. [Google Scholar] [CrossRef]
  7. Symons, G.M.; Davies, C.; Shavrukov, Y.; Dry, I.B.; Reid, J.B.; Thomas, M.R. Grapes on Steroids. Brassinosteroids Are Involved in Grape Berry Ripening. Plant Physiol. 2005, 140, 150–158. [Google Scholar] [CrossRef]
  8. Yang, X.; Bai, Y.; Shang, J.; Xin, R.; Tang, W. The antagonistic regulation of abscisic acid-inhibited root growth by brassinosteroids is partially mediated via direct suppression of ABSCISIC ACID INSENSITIVE 5 expression by BRASSINAZOLE RESISTANT 1. Plant Cell Environ. 2016, 39, 1994–2003. [Google Scholar] [CrossRef]
  9. Bar, M.; Sharfman, M.; Avni, A. LeEix1 functions as a decoy receptor to attenuate LeEix2 signaling. Plant Signal. Behav. 2011, 6, 455–457. [Google Scholar] [CrossRef]
  10. Wang, Z.Y.; Nakano, T.; Gendron, J.; He, J.X.; Chen, M.; Vafeados, D.; Yang, Y.L.; Fujioka, S.; Yoshida, S.; Asami, T.; et al. Nuclear-localized BZR1 mediates brassinosteroid-induced growth and feedback suppression of brassinosteroid biosynthesis. Dev. Cell 2002, 2, 505–513. [Google Scholar] [CrossRef]
  11. Sun, Y.; Fan, X.-Y.; Cao, D.-M.; Tang, W.; He, K.; Zhu, J.-Y.; He, J.-X.; Bai, M.-Y.; Zhu, S.; Oh, E.; et al. Integration of Brassinosteroid Signal Transduction with the Transcription Network for Plant Growth Regulation in Arabidopsis. Dev. Cell 2010, 19, 765–777. [Google Scholar] [CrossRef] [PubMed]
  12. Yu, X.; Li, L.; Li, L.; Guo, M.; Chory, J.; Yin, Y. Modulation of brassinosteroid-regulated gene expression by jumonji domain-containing proteins ELF6 and REF6 in Arabidopsis. Proc. Natl. Acad. Sci. USA 2008, 105, 7618–7623. [Google Scholar] [CrossRef]
  13. Yu, X.; Li, L.; Zola, J.; Aluru, M.; Ye, H.; Foudree, A.; Guo, H.; Anderson, S.; Aluru, S.; Liu, P.; et al. A brassinosteroid transcriptional network revealed by genome-wide identification of BESI target genes in Arabidopsis thaliana. Plant J. 2011, 65, 634–646. [Google Scholar] [CrossRef] [PubMed]
  14. Shahnejat-Bushehri, S.; Tarkowska, D.; Sakuraba, Y.; Balazadeh, S. Arabidopsis NAC transcription factor JUB1 regulates GA/BR metabolism and signalling. Nat. Plants 2016, 2, 16013. [Google Scholar] [CrossRef] [PubMed]
  15. Li, H.; Ye, K.; Shi, Y.; Cheng, J.; Zhang, X.; Yang, S. BZR1 Positively Regulates Freezing Tolerance via CBF-Dependent and CBF-Independent Pathways in Arabidopsis. Mol. Plant 2017, 10, 545–559. [Google Scholar] [CrossRef] [PubMed]
  16. Ye, H.; Liu, S.; Tang, B.; Chen, J.; Xie, Z.; Nolan, T.M.; Jiang, H.; Guo, H.; Lin, H.-Y.; Li, L.; et al. RD26 mediates crosstalk between drought and brassinosteroid signalling pathways. Nat. Commun. 2017, 8, 14573. [Google Scholar] [CrossRef]
  17. Guo, Y.-F.; Shan, W.; Liang, S.-M.; Wu, C.-J.; Wei, W.; Chen, J.-Y.; Lu, W.-J.; Kuang, J.-F. MaBZR1/2 act as transcriptional repressors of ethylene biosynthetic genes in banana fruit. Physiol. Plant. 2019, 165, 555–568. [Google Scholar] [CrossRef]
  18. Shan, W.; Guo, Y.-F.; Wei, W.; Chen, J.-Y.; Lu, W.-J.; Yuan, D.-B.; Su, X.-G.; Kuang, J.-F. Banana MaBZR1/2 associate with MaMPK14 to modulate cell wall modifying genes during fruit ripening. Plant Cell Rep. 2020, 39, 35–46. [Google Scholar] [CrossRef]
  19. Hong, Z.; Ueguchi-Tanaka, M.; Fujioka, S.; Takatsuto, S.; Yoshida, S.; Hasegawa, Y.; Ashikari, M.; Kitano, H.; Matsuoka, M. The Rice brassinosteroid-deficient dwarf2 Mutant, Defective in the Rice Homolog of Arabidopsis DIMINUTO/DWARF1, Is Rescued by the Endogenously Accumulated Alternative Bioactive Brassinosteroid, Dolichosterone. Plant Cell 2005, 17, 2243–2254. [Google Scholar] [CrossRef]
  20. Tanabe, S.; Ashikari, M.; Fujioka, S.; Takatsuto, S.; Yoshida, S.; Yano, M.; Yoshimura, A.; Kitano, H.; Matsuoka, M.; Fujisawa, Y.; et al. A Novel Cytochrome P450 Is Implicated in Brassinosteroid Biosynthesis via the Characterization of a Rice Dwarf Mutant, dwarf11, with Reduced Seed Length. Plant Cell 2005, 17, 776–790. [Google Scholar] [CrossRef]
  21. Wu, P.; Song, X.; Wang, Z.; Duan, W.; Hu, R.; Wang, W.; Li, Y.; Hou, X. Genome-wide analysis of the BES1 transcription factor family in Chinese cabbage (Brassica rapa ssp. pekinensis). Plant Growth Regul. 2016, 80, 291–301. [Google Scholar] [CrossRef]
  22. Song, X.; Ma, X.; Li, C.; Hu, J.; Yang, Q.; Wang, T.; Wang, L.; Wang, J.; Guo, D.; Ge, W.; et al. Comprehensive analyses of the BES1 gene family in Brassica napus and examination of their evolutionary pattern in representative species. BMC Genom. 2018, 19, 346. [Google Scholar] [CrossRef] [PubMed]
  23. Yu, H.; Feng, W.; Sun, F.; Zhang, Y.; Qu, J.; Liu, B.; Lu, F.; Yang, L.; Fu, F.; Li, W. Cloning and characterization of BES1/BZR1 transcription factor genes in maize. Plant Growth Regul. 2018, 86, 235–249. [Google Scholar] [CrossRef]
  24. Poole, R.L. The TAIR database. Methods Mol. Biol. 2007, 406, 179–212. [Google Scholar] [CrossRef]
  25. Varadi, M.; Tompa, P. The Protein Ensemble Database. Adv. Exp. Med. Biol. 2015, 870, 335–349. [Google Scholar] [CrossRef]
  26. Katoh, K.; Toh, H. Parallelization of the MAFFT multiple sequence alignment program. Bioinformatics 2010, 26, 1899–1900. [Google Scholar] [CrossRef]
  27. Price, M.N.; Dehal, P.S.; Arkin, A.P. FastTree 2-Approximately Maximum-Likelihood Trees for Large Alignments. PLoS ONE 2010, 5, e9490. [Google Scholar] [CrossRef]
  28. Jiangtao, C.; Yingzhen, K.; Qian, W.; Yuhe, S.; Daping, G.; Jing, L.; Guanshan, L. MapGene2Chrom, a tool to draw gene physical map based on Perl and SVG languages. Yi Chuan 2015, 37, 91–97. [Google Scholar] [CrossRef]
  29. Lescot, M.; Dehais, P.; Thijs, G.; Marchal, K.; Moreau, Y.; Van de Peer, Y.; Rouze, P.; Rombauts, S. PlantCARE, a database of plant cis-acting regulatory elements and a portal to tools for in silico analysis of promoter sequences. Nucleic Acids Res. 2002, 30, 325–327. [Google Scholar] [CrossRef]
  30. Wang, Y.; Tang, H.; DeBarry, J.D.; Tan, X.; Li, J.; Wang, X.; Lee, T.-h.; Jin, H.; Marler, B.; Guo, H.; et al. MCScanX: A toolkit for detection and evolutionary analysis of gene synteny and collinearity. Nucleic Acids Res. 2012, 40, e49. [Google Scholar] [CrossRef]
  31. Bailey, T.L.; Williams, N.; Misleh, C.; Li, W.W. MEME: Discovering and analyzing DNA and protein sequence motifs. Nucleic Acids Res. 2006, 34, W369–W373. [Google Scholar] [CrossRef] [PubMed]
  32. Zhang, Z. KaKs_Calculator 3.0: Calculating Selective Pressure on Coding and Non-coding Sequences. Genom. Proteom. Bioinform. 2022, 20, 536–540. [Google Scholar] [CrossRef] [PubMed]
  33. Jin, J.; Tian, F.; Yang, D.-C.; Meng, Y.-Q.; Kong, L.; Luo, J.; Gao, G. PlantTFDB 4.0: Toward a central hub for transcription factors and regulatory interactions in plants. Nucleic Acids Res. 2017, 45, D1040–D1045. [Google Scholar] [CrossRef] [PubMed]
  34. Wang, R.; Shu, P.; Zhang, C.; Zhang, J.; Chen, Y.; Zhang, Y.; Du, K.; Xie, Y.; Li, M.; Ma, T.; et al. Integrative analyses of metabolome and genome-wide transcriptome reveal the regulatory network governing flavor formation in kiwifruit (Actinidia chinensis). New Phytol. 2022, 233, 373–389. [Google Scholar] [CrossRef] [PubMed]
  35. Salazar, J.A.; Vergara-Pulgar, C.; Jorquera, C.; Zapata, P.; Ruiz, D.; Martínez-Gómez, P.; Infante, R.; Meneses, C. De Novo Transcriptome Sequencing in Kiwifruit (Actinidia chinensis var. deliciosa (A Chev) Liang et Ferguson) and Development of Tissue-Specific Transcriptomic Resources Agronomy 2021, 11, 919. [Google Scholar]
  36. Trapnell, C.; Williams, B.A.; Pertea, G.; Mortazavi, A.; Kwan, G.; van Baren, M.J.; Salzberg, S.L.; Wold, B.J.; Pachter, L. Transcript assembly and quantification by RNA-Seq reveals unannotated transcripts and isoform switching during cell differentiation. Nat. Biotechnol. 2010, 28, 511-U174. [Google Scholar] [CrossRef]
  37. Lynch, M.; Conery, J.S. The Evolutionary Fate and Consequences of Duplicate Genes. Science 2000, 290, 1151–1155. [Google Scholar] [CrossRef]
  38. Moore, R.C.; Purugganan, M.D. The early stages of duplicate gene evolution. Proc. Natl. Acad. Sci. USA 2003, 100, 15682–15687. [Google Scholar] [CrossRef]
  39. Roy, S.W.; Penny, D. A Very High Fraction of Unique Intron Positions in the Intron-Rich Diatom Thalassiosira pseudonana Indicates Widespread Intron Gain. Mol. Biol. Evol. 2007, 24, 1447–1457. [Google Scholar] [CrossRef]
  40. Bernard, V.; Brunaud, V.; Lecharny, A. TC-motifs at the TATA-box expected position in plant genes: A novel class of motifs involved in the transcription regulation. BMC Genom. 2010, 11, 166. [Google Scholar] [CrossRef]
  41. Lopez-Molina, L.; Mongrand, S.; McLachlin, D.T.; Chait, B.T.; Chua, N.-H. ABI5 acts downstream of ABI3 to execute an ABA-dependent growth arrest during germination. Plant J. 2002, 32, 317–328. [Google Scholar] [CrossRef] [PubMed]
  42. Huang, H.-Y.; Jiang, W.-B.; Hu, Y.-W.; Wu, P.; Zhu, J.-Y.; Liang, W.-Q.; Wang, Z.-Y.; Lin, W.-H. BR Signal Influences Arabidopsis Ovule and Seed Number through Regulating Related Genes Expression by BZR1. Mol. Plant 2013, 6, 456–469. [Google Scholar] [CrossRef] [PubMed]
  43. Western, T.L.; Haughn, G.W. BELL1 and AGAMOUS genes promote ovule identity in Arabidopsis thaliana. Plant J. 1999, 18, 329–336. [Google Scholar] [CrossRef]
  44. Vishal, B.; Kumar, P.P. Regulation of Seed Germination and Abiotic Stresses by Gibberellins and Abscisic Acid. Front. Plant Sci. 2018, 9, 838. [Google Scholar] [CrossRef] [PubMed]
  45. Tong, H.; Xiao, Y.; Liu, D.; Gao, S.; Liu, L.; Yin, Y.; Jin, Y.; Qian, Q.; Chu, C. Brassinosteroid Regulates Cell Elongation by Modulating Gibberellin Metabolism in Rice. Plant Cell 2014, 26, 4376–4393. [Google Scholar] [CrossRef]
  46. Lv, B.; Tian, H.; Zhang, F.; Liu, J.; Lu, S.; Bai, M.; Li, C.; Ding, Z. Brassinosteroids regulate root growth by controlling reactive oxygen species homeostasis and dual effect on ethylene synthesis in Arabidopsis. PLoS Genet. 2018, 14, e1007144. [Google Scholar] [CrossRef]
  47. Ji, Y.; Qu, Y.; Jiang, Z.; Yan, J.; Chu, J.; Xu, M.; Su, X.; Yuan, H.; Wang, A. The mechanism for brassinosteroids suppressing climacteric fruit ripening. Plant Physiol. 2021, 185, 1875–1893. [Google Scholar] [CrossRef]
  48. Achard, P.; Liao, L.; Jiang, C.; Desnos, T.; Bartlett, J.; Fu, X.; Harberd, N.P. DELLAs Contribute to Plant Photomorphogenesis. Plant Physiol. 2007, 143, 1163–1172. [Google Scholar] [CrossRef]
  49. Unterholzner, S.J.; Rozhon, W.; Papacek, M.; Ciomas, J.; Lange, T.; Kugler, K.G.; Mayer, K.F.; Sieberer, T.; Poppenberger, B. Brassinosteroids Are Master Regulators of Gibberellin Biosynthesis in Arabidopsis. Plant Cell 2015, 27, 2261–2272. [Google Scholar] [CrossRef]
  50. Sekhon, R.S.; Lin, H.; Childs, K.L.; Hansey, C.N.; Buell, C.R.; de Leon, N.; Kaeppler, S.M. Genome-wide atlas of transcription during maize development. Plant J. 2011, 66, 553–563. [Google Scholar] [CrossRef]
Figure 1. System Evolution of the BES1 Family in Horticultural Crops. (A) Taxonomic tree of BES1 family genes in 48 plant species. Triangles of different colors represent four horticultural categories, including vegetables, fruit trees, ornamental plants, and medicinal plants. The numbers in the outer circle represent the number of gene family members in the identified specie. (B) Violin plots of BES1 gene number for different categories of plants. (C) Phylogenetic tree of the BES1 family members (440) in the 48 plants constructed by the protein sequences.
Horticulturae 09 00971 g001
Figure 2. The Characteristic of BES1 Family. (A) The phylogenetic tree of BES1 proteins in Arabidopsis thaliana, Actinidia chinensis, Fragaria vesca, Malus domestica, Prunus persica, and Vitis vinifera. The Group I–VI referred to the phylogenetic tree clusters. (B) Species evolution relationship of six representative species and conserved motifs of BES1 gene family. Different numbers represented the number of conservative motifs. The grey module represents the number of all BES1 genes in the species.
Horticulturae 09 00971 g002
Figure 3. Synteny analysis of BES1 genes between Arabidopsis thaliana (At), Actinidia chinensis (Acc), Malus domestica (Md), Vitis vinifera (Vv), and Prunus persica (Pp). The gray lines in the background indicated the collinear blocks within rice and other plant genomes, while the red lines highlight the syntenic BES1 gene pairs. The green bars represented the chromosomes. The chromosome number is labeled at the top or bottom of each chromosome.
Horticulturae 09 00971 g003
Figure 4. The illustration of Chromosomal locations (A,C) and predicted cis-elements in the promoter regions (B,D) of BES1 genes in kiwifruit and peach. In (A,C), chromosome numbers were shown at the tops of the bar; BES1 genes were labeled at the sides of the chromosomes; The scale bar on the left indicates the chromosome lengths (Mb). Predicted cis-elements in the promoter regions of the BES1 genes (B,D). In (B,D), all promoter sequences (−2000 bp) were analyzed. The BES1s were initiated on the left side of the lines. The scale bar at the bottom indicated the length of the promoter sequences.
Horticulturae 09 00971 g004
Figure 5. The expression level of BES1 family genes of kiwifruit in different conditions. (A) The BES1 family genes were treated with hormones at the postharvest stage of fruits (D1, D4, and D13 represented the days after treatment during postharvest; ETH: ethylene treatment, 1-MCP: 1-MCP treatment; ETH + MeJA: the combined treatment of ethylene and methyl jasmonic acid). (B) The absolute expression value of BES1 family genes under different biotic stress (HAI: 12, 24, and 48 h after inoculation; BT: treat with B. cinerea inoculated; CT: mock inoculated fruits; BR represented brassinolide treatment; BRZ: Brassinazole, an inhibitor of brassinolide; Ruby3 represents kiwifruit varieties, and 0 h, 1 h, 4 h, and 7 h represent different cold treatment times).
Horticulturae 09 00971 g005
Figure 6. Expression of Kiwifruit BES1 genes family in different tissues and development stages. DAP: Days after pollination; DAH: Days after harvest, Different numbers represent days.
Horticulturae 09 00971 g006
Figure 7. BES1 gene expression in peach development (A) and postharvest stages (B) in the one round (HY) and one flat (ZH) peach cultivar. Data represented the average FPKM value of three independent experiments + SD. Standard errors are shown as bars above columns. Error bars show the standard deviation of the three replicates, and the asterisk indicates a significant difference. (Student’s t-test; * p < 0.05; ** p < 0.01; *** p < 0.001.).
Horticulturae 09 00971 g007
Figure 8. Expression level of BES1 Gene family members in peach under water stress. WS: Water stress.
Horticulturae 09 00971 g008
Table 1. list of 48 species for identification of the BES1 gene family.
Class (Numbers)Species
Fruit tree species (15)Actinidia chinensis, Ananas comosus, Carica papaya, Citrullus lanatus, Citrus clementina, Citrus sinensis, Coffea canephora, Cucumis melo, Fragaria vesca, Malus domestica, Musa acuminate, Phoenix dactylifera, Prunus persica, Theobroma cacao, Vitis vinifera
Vegetables species (13)Beta vulgaris, Brassica juncea, Brassica oleracea, Brassica rapa, Capsicum annuum, Cicer arietinum, Cucumis sativus, Daucus carota, Phaseolus vulgaris, Raphanus sativus, Solanum lycopersicum, Solanum melongena, Solanum tuberosum
Ornamental plants species (14)Amaranthus hypochondriacus, Aquilegia coerulea, Arachis duranensis, Capsella grandiflora, Catharanthus roseus, Dianthus caryophyllus, Kalanchoe laxiflora, Kalanchoe marnieriana, Nelumbo nucifera, Phalaenopsis equestris, Phyllostachys edulis, Prunus mume, Tarenaya hassleriana, Trifolium pratense
Medicinal plants species (6)Jatropha curcas, Lotus japonicus, Marchantia polymorpha, Salvia miltiorrhiza, Spirodela polyrhiza, Zostera marina
Disclaimer/Publisher’s Note: The statements, opinions and data contained in all publications are solely those of the individual author(s) and contributor(s) and not of MDPI and/or the editor(s). MDPI and/or the editor(s) disclaim responsibility for any injury to people or property resulting from any ideas, methods, instructions or products referred to in the content.

