Article

Estimating Nitrogen Release from Organic Fertilizers for Soilless Production by Analysis of C and N Pools

1
Institute for Horticulture, Weihenstephan-Triesdorf University of Applied Science, Am Staudengarten 14, 85354 Freising, Germany
2
INRES—Institute of Crop Science and Resource Conservation, Division of Horticultural Sciences, University of Bonn, 53121 Bonn, Germany
*
Author to whom correspondence should be addressed.
Horticulturae 2023, 9(7), 767; https://doi.org/10.3390/horticulturae9070767
Submission received: 25 May 2023 / Revised: 22 June 2023 / Accepted: 29 June 2023 / Published: 4 July 2023

Abstract

:
The use of organic fertilizers in soilless pot plant production has sharply increased in recent years. However, there is still a lack of methods for characterizing the N release from organic fertilizers. This bears the risk of an inadequate nutrient supply and, thus, a waste of resources. Therefore, the current research analyzed fourteen commercial organic fertilizers for various C and N pools by extraction in cold and hot water, acid hydrolysis, and thermal fractionation. Furthermore, we conducted an incubation test using a growing medium (80 vol% peat plus 20 vol% green waste compost) and fitted the nitrogen release to different kinetic models. Finally, we calculated the correlations among the best-suited kinetic model parameters and the C and N pools. The C and N pools soluble in water and weak hydrochloride acid varied significantly among the fourteen fertilizers but were closely correlated with each other. The N release from most organic fertilizers could be described very well using the Gompertz function (R² > 0.9), and the parameters of the Gompertz function showed significant correlations with the C and N pools. Hydrolyzable C and N pools provided valuable information about the N release characteristics of organic fertilizers.

1. Introduction

In the last two decades, organic greenhouse production has rapidly grown, mainly focusing on producing fruits and vegetables in soil. However, consumers’ demand for soilless products, such as vegetables, herbs, and ornamentals, is also increasing [1,2,3,4]. A survey by Burnett and Stack [5] revealed fertilization as a significant issue in the organic cultivation of bedding plants. This is particularly true for nitrogen (N) supply, as N applied with organic fertilizers must be mineralized first, and thus, it becomes plant-available only with a delay. To ensure an adequate N supply, growers need reliable information about the time course of the N release from the applied fertilizer [6].
The decomposition pattern of organic residue has been extensively characterized in the literature using various mathematical models. These models include simple first and second-order rate equations [7,8,9], consecutive reaction models that combine multiple first-order rate equations [10,11,12], and flexible sigmoid-shaped functions, such as the Richards, Gompertz, and Weibull functions [13,14,15,16,17,18]. However, simple first-order rate models, which assume N mineralization as a simple function of the substrate N concentration, and consecutive models, which assume two or more pools with different rate coefficients (e.g., labile and refractory fractions), regularly overestimate N release at the beginning [10,11,15,17]. This initial lag phase, which might be due to inhibitory compounds, such as polyphenols [11,19], or by the initial acclimation and regrouping of microbial biomass [14], is quite well-modeled by the unitless and scale-independent shape factor in flexible functions [18]. Subsequently, kinetic parameters can be correlated to the biochemical characteristics of the material [19].
The importance of biochemical characteristics for predicting mineralization rates has been shown in various studies for crop residues and other organic input materials, such as manure [9,20,21,22,23,24,25,26] and, to a lesser extent, for commercial organic fertilizers [27,28,29,30,31]. In addition, countless studies have examined the correlations between the biochemical properties of soil organic matter (SOM) and nitrogen turnover in soils [32]. In all cases—for crop residues and organic fertilizers, as well as for SOM—the most common parameters were the total nitrogen (TN), as well as the total organic carbon (TOC) or total carbon (TC) and the resulting C/N ratios. However, these parameters only show a rough correlation to the nitrogen release of organic fertilizers [27]. A more suitable approach seems to be the characterization of individual nitrogen and carbon pools either by extraction procedures with both hot and cold water, saline, acidic, or alkaline solutions or by thermal analytical techniques, such as thermogravimetry, analysis of evolved gas, or Rock-Eval pyrolysis. Von Lützow et al. [33] gave a detailed overview of the mentioned techniques. De Neve and Hofman [9] used the sequential procedure proposed by Stevenson [34] to characterize the N and C pools of vegetable crop residues whose N mineralization was fitted to a first-order rate equation. The potentially mineralizable nitrogen (NP) was closely correlated to the C/N ratio of the lignin, lignin content, and water-soluble N. Furthermore, Jensen et al. [24] reported close correlations between water-soluble N and early N mineralization. In addition, the NP was well described by amounts of various N fractions, whereas the correlations of the NP to the C/N ratio of the lignin and lignin content were relatively poor. However, they did not describe the N mineralization by kinetic models but correlated the N mineralization at defined dates to analyze the C and N pools. Moreover, De Neve and Hofman [9] and Jensen et al. [24] have reported close correlations between N mineralization and the total N content, and the rate constant was significantly correlated to the percentage of organic N. This is likely attributed to the common practice of applying residues on a dry matter basis, resulting in an increased application of nitrogen (N) as the percentage of organic N increases.
As outlined by Jensen et al. [24], the physiochemical and biochemical properties of the soil used for incubation can significantly affect mineralization patterns. Thus, the results of the listed studies with different mineral soils are hardly comparable and cannot be transferred to growing media for soilless cultivation as their physiochemical and biochemical properties are quite different from those of mineral soils. Therefore, the current research aimed to characterize the N release of various commercial organic fertilizers in a peat-based growing medium by a single kinetic model, and subsequently, to describe the kinetic parameters of C and N pools analyzed by several extraction procedures and evolved gas analysis under pyrolytic conditions.

2. Materials and Methods

2.1. Commercial Organic Fertilizers

Fourteen solid organic fertilizers were purchased from various companies. Six were unprocessed raw materials, three were of animal origin, and three were coarsely ground legumes. Four fertilizers were made of processed plant material, e.g., from the production of starch adhesives. No detailed information about the origin was available for the remaining four fertilizers. In the following section, the fertilizers and their analyzed N, P, K, Mg, and S contents (in brackets), suppliers, raw materials, and pre-processing methods—as far as they are available—are summarized.
  • Coarse horn meal (CHM; 13.8 + 0.6 + 0.0 + 0.1 + 2.0): CHM is made of the horns and hooves of slaughtered ungulates, mainly cattle, with minor adhesions of fur, meat, bones, blood, and manure. According to the regulations of the European Union, hygienization by heating or treatment with propionic acid is mandatory [35]. The main component of horns and hooves is keratin, a group of fibrous proteins [36]. The CHM was purchased from Beckmann & Brehm GmbH (Beckeln/Germany).
  • Sheep wool pellets (SWPs; 9.7 + 0.1 + 3.5 + 0.1 + 2.1): SWPs were obtained from Düngepellet Produkt und Vertriebs GmbH (Lauchammer/Germany). Raw and uncleaned wool is a waste product from sheep husbandry and it is pelletized by a thermal–mechanical process. The primary N source of SWPs is keratin. However, the usually unwashed wool contains many waxes, dirt, and feces [37].
  • Pig bristle pellets (PBPs; 13.9 + 0.1 + 0.1 + 0 + 2.1): PBPs, also named hair meal pellets, are slaughterhouse waste. The bristles are removed from slaughtered carcasses and typically pasteurized, dried, ground, and pelletized [35]. As with CHM and SWPs, keratin is the primary N source of PBPs. However, pig bristles are less soiled than CHM and SWPs, respectively. The pig bristles were purchased from Beckmann & Brehm GmbH (Beckeln/Germany).
  • Fodder pea grist (FPG; 4.3 + 0.3 + 1 + 0.1 + 0.1): The seeds of fodder peas were crushed by us in a malt mill, as this is the current practice for legumes used as fertilizers in organic agriculture [35].
  • Faba bean grist (FBG; 3.2 + 0.2 + 0.8 + 0.1 + 0.1): Similar to the seeds of fodder peas, faba bean seeds were also crushed by us.
  • Lupine grist (LG; 5.2 + 0.2 + 0.7 + 0.2 + 0.3): Similar to the fodder pea and faba bean seeds, lupine seeds were crushed by us.
  • Phytomalz (PHZ; 5.8 + 0.7 + 1.1 + 0.2 + 0.6): Provita® Phytomalz (Beckmann & Brehm, Beckeln/Germany) is made from protein-rich residues from the food-processing industry. The principal components are malt culms and corn, which are pressed into small pellets, with the addition of vinasse.
  • Phytogran (PHN; 5.3 + 0.5 + 1.7 + 0.5 + 0.5): Provita® Phytogran (Beckmann & Brehm, Beckeln/Germany) is a granulate with a particle size of 2–5 mm. The raw material (residues from the food-processing industry) is dissolved in water, steam-sterilized, and fermented by yeasts. Afterwards, the fermented biomass is dried at about 100 °C, mixed with molasses, and granulated.
  • Phytogrieß (PHS; 6.2 + 0.8 + 0.8 + 0.2 + 1.1): Provita® Phytogrieß (Beckmann & Brehm, Beckeln/Germany) is derived from the fermented residues and glucose of corn gluten production. The granules have a particle size between 0.2 and 2 mm.
  • Maltaflor (MAF; 4.9 + 0.6 + 1.2 + 0.4 + 0.7): Maltaflor® (Maltaflor EUROPA GmbH, Boppard/Germany) is made of malt culms from breweries, vinasse, and vinasse–potassium, as well as grain hulls. After the malting process, the culms are dried, pelletized, and mixed with the vinasse [35].
  • OPF granular (OPF; 7.0 + 1.2 + 8.8 + 0.2 + 7): According to the supplier (Plant Health Cure B.V., Oisterwijk/Netherlands), OPF is made of various herbal substances, e.g., fermented sugar beets, and is adjusted to promote the growth of beneficial soil bacteria and mycorrhizal fungi. Most of the nitrogen is amino-derived. The British Soil Association tests all raw materials.
  • UP—fruit and vegetables (UP; 8.3 + 1 + 4.6 + 0.2 + 3.8): UP was purchased from Umweltpionier GmbH (Perg/Austria). Similar to OPF, no specific information about the raw materials and processing was available. However, according to the supplier, the fertilizer is a mixture of plant material, clay minerals, and microorganisms. A unique feature of UP is its classification as a foodstuff.
  • Cuxin Xtra-1 (CX1; 10.7 + 0.1 + 3.3 + 0.7 + 4.8): DCM ECO-XTRA® 1 (Deutsche CUXIN Marketing GmbH, Telgte/Germany) is a mixture of animal residues (slaughterhouse waste according to EU ordinance No. 1069/2009), residues of the food, beverage, and feed industry, and tannins from forestry. CX1 is formulated as fine granules, with a particle size between 0.8 and 2.5 mm.
  • Cuxin Eco-Mix 4 (CE4; 6.3 + 0.1 + 0.3 + 0.2 + 0.6): DCM Öko-Mix® 4 (Deutsche CUXIN Marketing GmbH, Telgte/Germany), similar to CX1, is a mixture of animal residues (slaughterhouse waste according to EU ordinance No. 1069/2009), residues of the food, beverage, and feed industry, and cocoa shells or vinasse. The particle size of CE4 is similar to that of CX1.

2.2. Characterization of Carbon and Nitrogen Pools

The total nitrogen (TN) was measured by the Dumas method (TrueSpec N, LECO Cooperation, Moenchengladbach/Germany; according to the VDLUFA Methods Book II.1, No. 3.5.2.7; [38]). The total organic and total carbon (TOC and TC) were measured by combustion under oxygen at 550 and 1000 °C, respectively, and by evolved gas analysis (VDLUFA Methods Book I; No. A 4.1.3.2 and No. A 4.1.3.1; [39]) using an RC 612 elemental analyzer (LECO Cooperation, Moenchengladbach/Germany). Furthermore, the nitrogen was extracted in cold and hot water (CW_N and HW_N) according to the analysis of slow-release urea fertilizers (VDLUFA Methods Book II.1, No. 3.10; [38]). Additionally, nitrogen and carbon hydrolyzable in 0.005 M and 1 M hydrochloric acid (0.005 HA_N/HA_C and 1 HA_N/HA_C) were analyzed [40].
For all extracts, the total soluble nitrogen was measured spectrophotometrically as nitrate after UV-assisted digestion [41] on an AA3 continuous flow analyzer (Bran+Lübbe, Norderstedt/Germany). Furthermore, we analyzed the mineral nitrogen (MN) as a sum of ammonium- and nitrate-N in the cold water extract using the same AA3 continuous flow analyzer. Finally, the soluble organic N (ON) was calculated in all extracts as the difference between the total soluble N in the respective extract and the cold-water-soluble MN.
The determination of the organic carbon hydrolyzable in hydrochloric acid was carried out by ICP-OES (iCAP 6300 Duo, Thermo Scientific, Dreieich/Germany) at 193 nm after strong acidification with nitric acid and purging with high-purity argon [42]. Additionally, the organic carbon pools were characterized by stepwise combustion under pyrolytic conditions at 250, 300, 350, 400, 450, 500, 600, and 1000 °C and subsequent analysis of the evolved CO2 (Py-TA-EGA; [43]) using a modified RC 612 elemental analyzer (LECO Cooperation, Moenchengladbach/Germany).
The TN, TOC, and TC analyses, Py-TA-EGA, and cold and hot water extractions were conducted in duplicate. Hydrolysis in hydrochloric acid, on the other hand, was performed in triplicate. Control samples (e.g., standard materials) were included in each analytical run to ensure the quality of the analysis and to maintain analytical precision.

2.3. Incubation Experiment

The incubation experiment was conducted according to the procedure proposed by the association of German agricultural analysis and research institutes (VDLUFA) for testing the N dynamics of organic growing media constituents (VDLUFA Methods Book I; No. A 13.5.1; [39]). The organic fertilizers were added on the basis of 1000 mg total N per liter of growing medium consisting of 80% peat (H3-H5 [44]) and 20% green waste compost by volume. The compost successfully fulfilled the growing media compost type II requirements of the German Federal Compost Quality Association [45]. The growing medium was limed to a pH of 5.5 (determined in a CaCl2 suspension according to the VDLUFA Methods Book I, No. A 5.1.1; [39]). Due to the compost amendment, no other fertilizers except commercial organic fertilizers were added. All fertilizers were incubated in two ways to assess the influence of the particle size. Firstly, the fertilizers were used as received, and only large particles (especially the sheep wool pellets) were carefully crushed by hand to ensure their homogeneous addition to the incubation vessels. Secondly, the fertilizers were chopped in a cutting mill using a 0.5 mm bottom sieve (ZM 1, Retsch, Haan/Germany). This allowed for the evaluation of the effects of the particle size on the nitrogen release.
The Incubation ran for 58 days at 25 °C and 90% relative humidity in the dark. First, the growing medium was moistened with deionized water to 60% of the maximum water capacity (determined according to the VDLUFA Methods Book I, No. A 13.6; [39]), which is assumed to be well suited for microbial activity. Then, the water loss of the growing medium was compensated three times a week during the entire incubation period. On eight dates (days 0, 3, 7, 10, 16, 23, 37, and 58), three incubation vessels per treatment were taken from the incubator and analyzed for CaCl2/DTPA-soluble ammonium- and nitrate-N photometrically (VDLUFA Methods Book I, No. A 6.1.4.1; [39]). As a basis for the N release calculation, the controls without fertilizer and those with 500 mg N per liter as ammonium nitrate were treated similarly.
On each analysis day, the net mineralization of the fertilizers was calculated as the difference between the ammonium- and nitrate-N contents in the treatments with and without the respective fertilizers. Furthermore, the data from the control fertilized with ammonium nitrate were used to estimate the N turnover (mobilization and immobilization) in the growing media, as the results of the incubation experiment might be less reliable at high nitrogen turnover rates.

2.4. Calculations and Statistical Analyses

First, various kinetic models used in the literature to describe the decomposition of organic residues in mineral soils (Table 1) were fitted to the N release pattern of the fourteen commercial organic fertilizers. Fitting was performed by an iterative non-linear approach using the generalized reduced gradient algorithm of Microsoft’s SOLVER [46,47]. The starting conditions were set by hand identically for each fertilizer, and the first fitting was calculated. The results obtained were taken as the starting conditions for a new run in the next step. This procedure was repeated four times. As the fitness-of-purpose criterion of the models, the total sum of squares (TSSQ) of the fourteen fertilizers was used.
Furthermore, fitting the fertilizer-specific equations to the N mineralization data was visually rated, and the coefficient of determination (R²) was calculated for each fertilizer. Additionally, the parameters of the most suitable model and some selected points characterizing the time course of the N mineralization were computed by calculating the first and second derivations: (i) the turning point (T) of the original function, which defines the maximum mineralization rate, and (ii) the turning points of the first derivation, indicating the start (E1) and the end (E2) of the phase with the maximum mineralization rate. Furthermore, the time until the release of 90% of the potentially mineralizable nitrogen (N90) was calculated. Finally, correlations of the analyzed N and C pools and the C/N ratios to the parameters of the model that best describe the course of N mineralization were computed to identify the pools that were well suited for characterizing the N release of the organic fertilizers. Thereby, correlations were calculated for the entire dataset and after removing the outliers determined by Cook’s distance, with 4/n as the cut-off point [48]. The fitting and visualization of the kinetic models were carried out with MS Excel 2016 (version 16.0, Microsoft Corporation, Redmond, WA, USA). The software package Minitab21 (Minitab, LLC, State College, PA, USA) was used to visualize the C and N pools and to calculate the correlations.
Table 1. Kinetic models for characterization of net N release (NR in mg L−1) from organic fertilizers in relation to incubation period (t) in days; parameters NP and NE represent the potentially and mineralizable N (mg L−1), respectively, parameters h, k, and k(1,2) represent the specific rate constants (mg L−1 d−1), k0 is the zero-order rate constant for recalcitrant N pools (mg L−1 d−1), F is the proportion of NP with fast turnover in a simultaneous reaction model, and d and c are unitless shape factors in Richards and Weibull functions (for details, refer to the given references).
Kinetic Model
(Number of Parameters)
Equation [Reference]
First-order kinetic
(2)
N R = N P   ( 1 e k t ) [7]
First-order kinetic plus readily available N (NE) (3) N R = N P   ( 1 e k t ) + N E [49]
Power function
(2)
N R = h t k [50]
Three-half-order kinetic model
(3)
N R = N P 1 e k 1 t 0.5 k 2 t 2 [51]
Three-half-order kinetic model plus zero order rate constant (k0) (4) N R = N P 1 e k 1 t 0.5 k 2 t 2 + k 0 t [51]
Simultaneous reaction model
(4)
N R = N P F 1 e h t + N P 1 F ( 1 e k t ) [52]
Consecutive reaction model
(3)
N R = N P N P ( k e h t h e k t k h ) [53]
Consecutive reaction model with rate constants h = k (2) N R = N P N P e k t ( k t + 1 ) [53]
Gompertz function
(3)
N R = N P   e e ( h k t ) [14]
Gompertz function + NE
(4)
N R = N P   e e h k t + N E [14]
Gompertz function + k0
(4)
N R = N P   e e h k t + k 0 t [14]
Gompertz function + NE + K0
(5)
N R = N P   e e h k t + N E   + k 0 t [14]
Richards function
(4)
N R = N P ( 1 + d e k ( h t ) ) ( 1 d )     [54]
Richards function + NE
(5)
N R = N P ( 1 + d e k ( h t ) ) ( 1 d ) + N E   [54]
Richards function + k0
(5)
N R = N P ( 1 + d e k ( h t ) ) ( 1 d ) + k 0 t   [54]
Richards function + NE + K0
(6)
N R = N P ( 1 + d e k ( h t ) ) ( 1 d ) + N E + k 0 t   [54]
Weibull function
(3)
N R = N P   ( 1 e k t c ) [15]
Weibull function + NE
(4)
N R = N P   1 e k t c + N E [15]
Weibull function + k0
(4)
N R = N P   1 e k t c + k 0 t [15]
Weibull function + NE + K0
(5)
N R = N P   1 e k t c + N E + k 0 t [15]

3. Results and Discussion

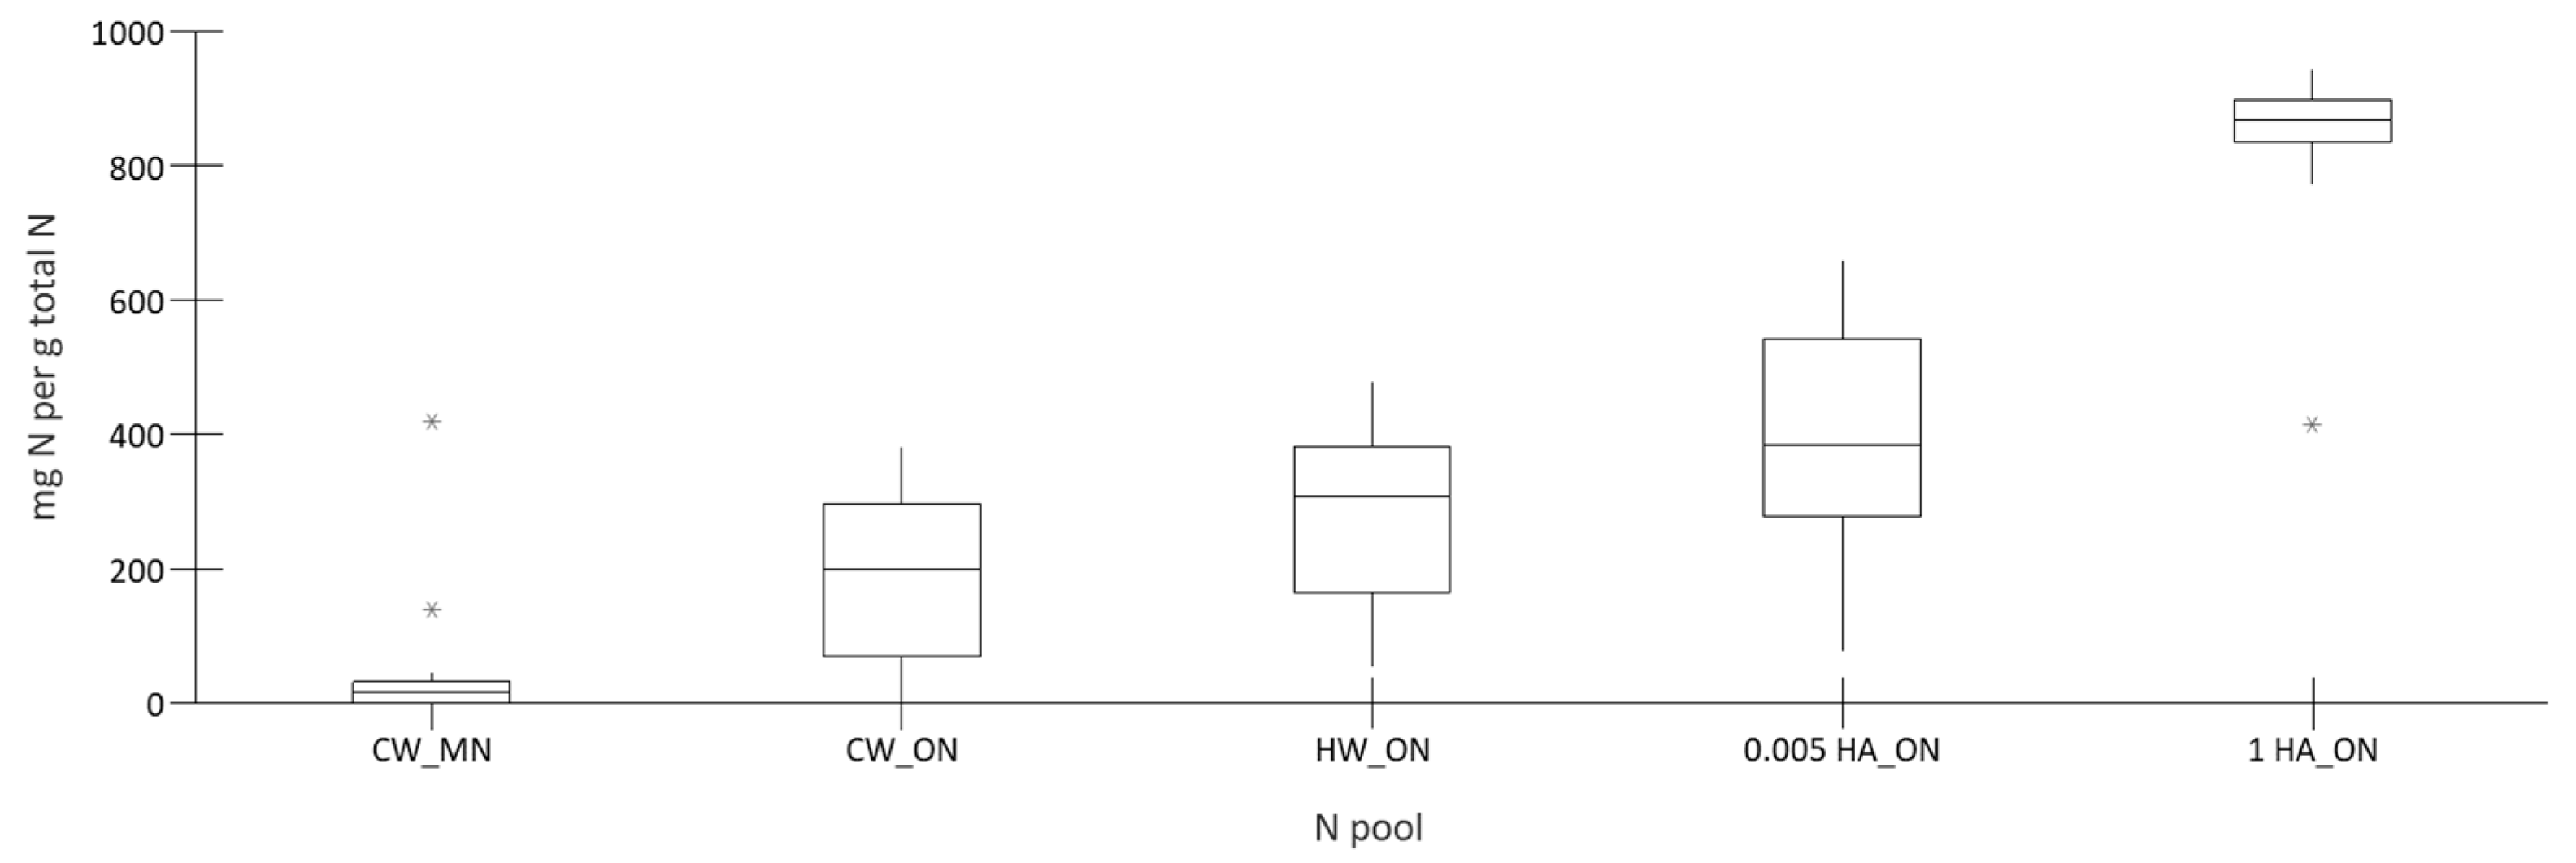
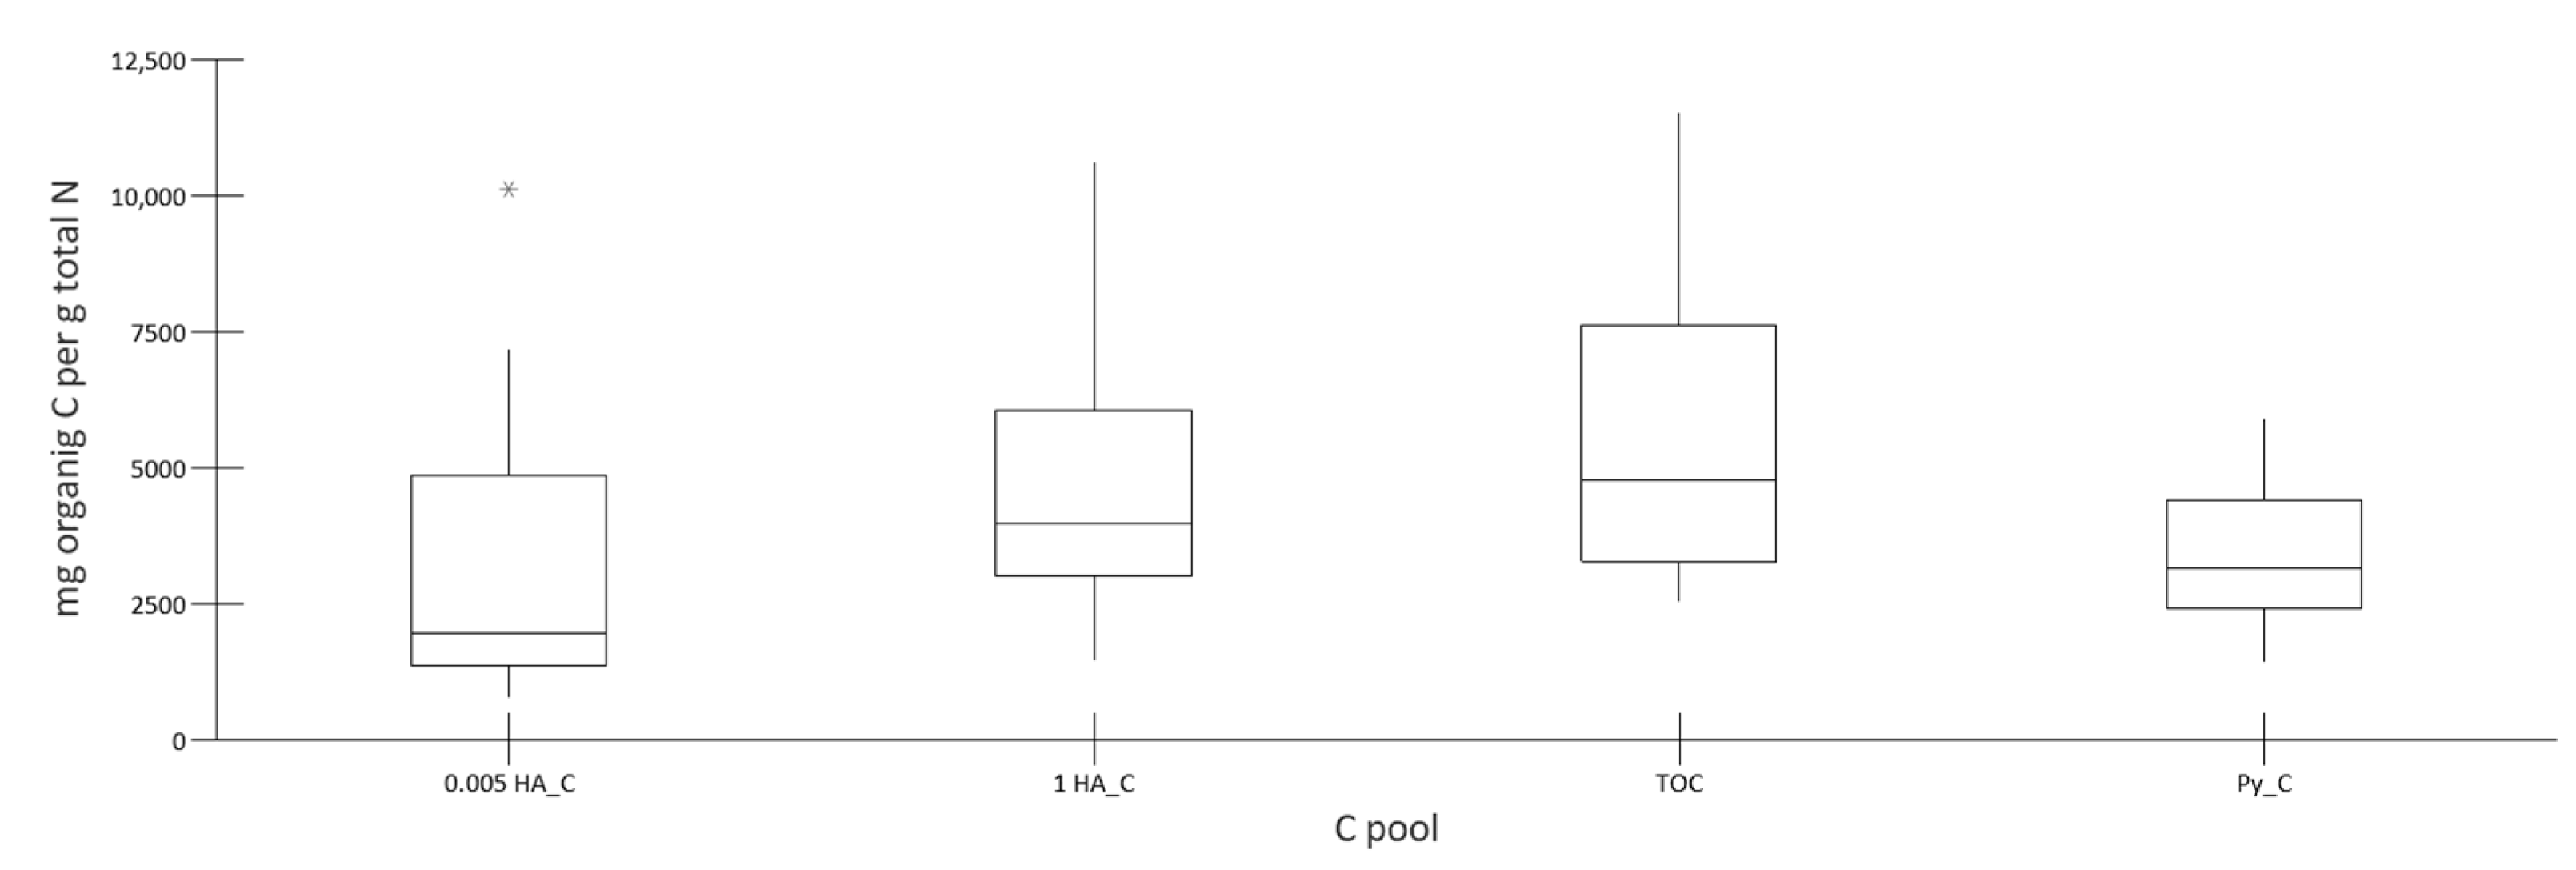
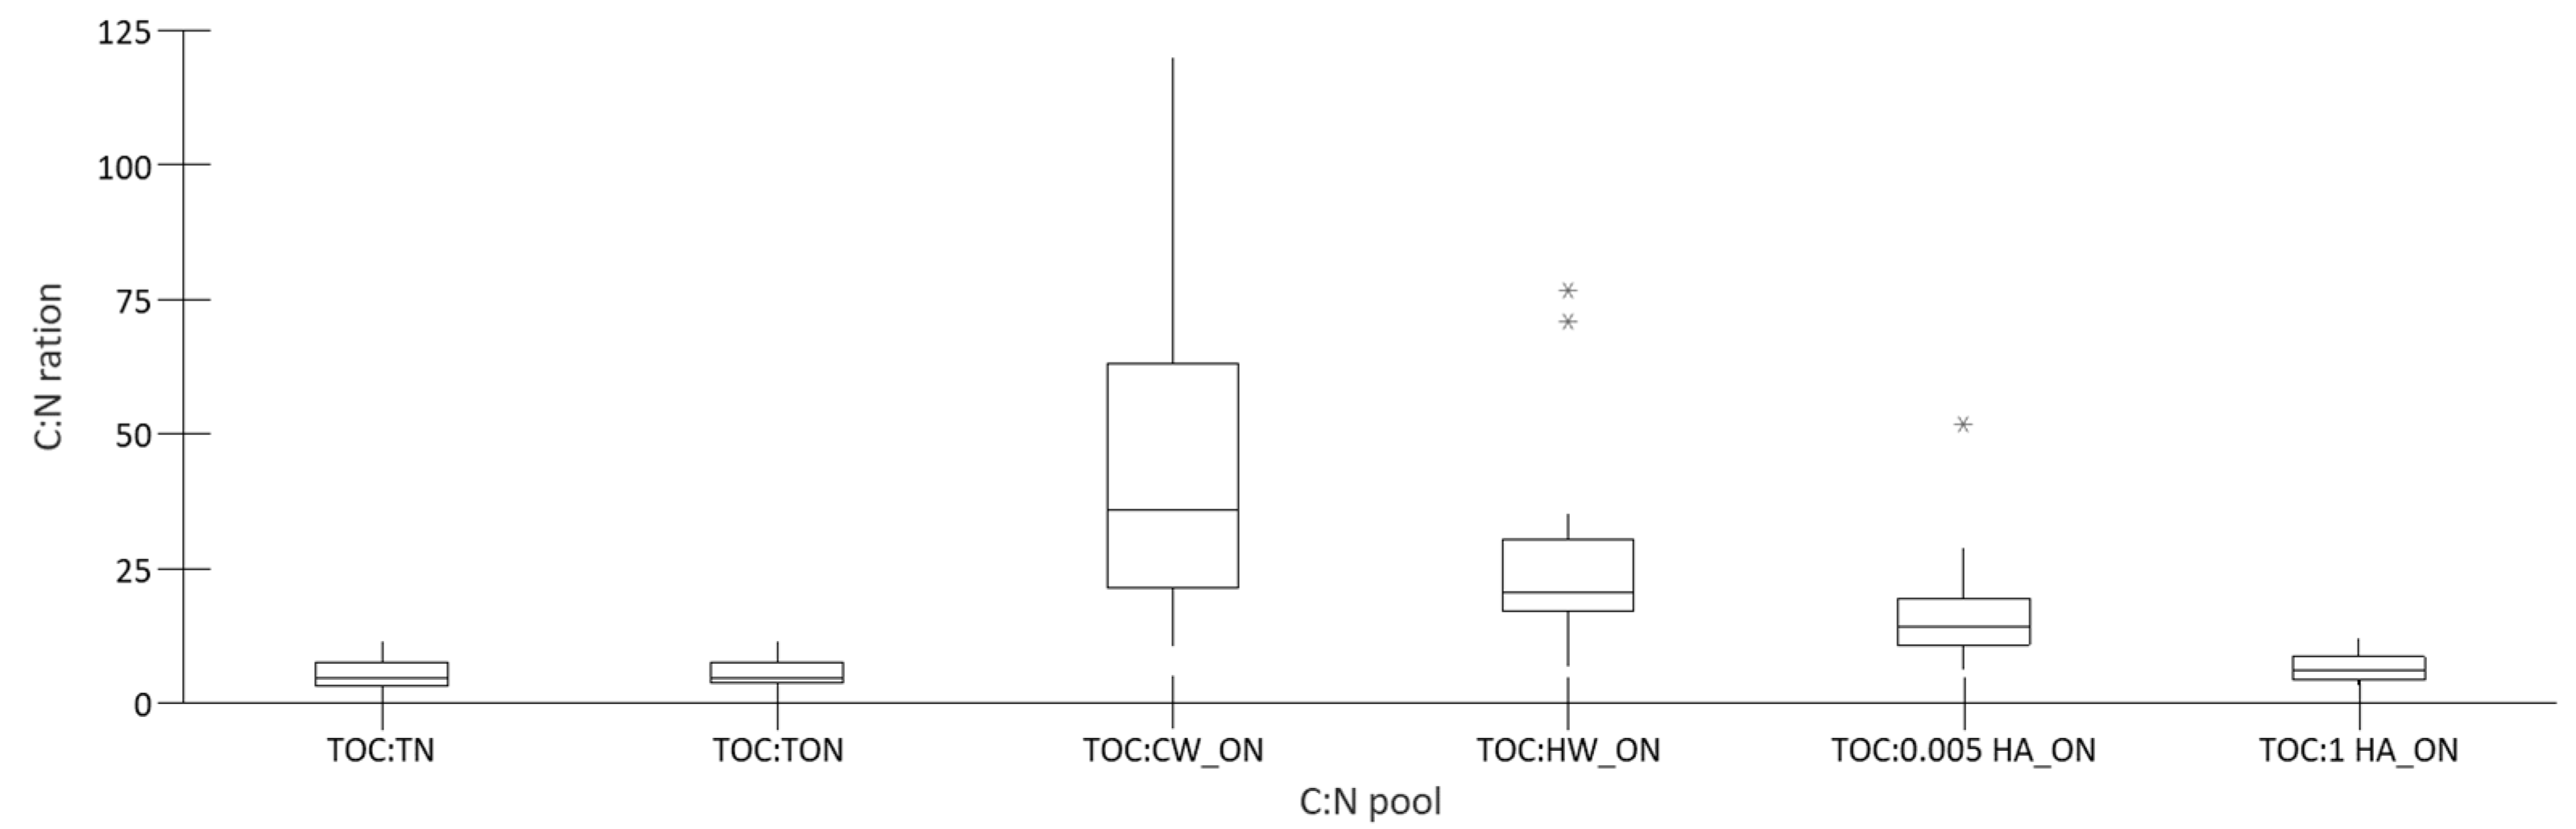
3.1. Characterization of Nitrogen and Carbon Pools

As fertilizers were added to the incubation experiment on the basis of the TN, the nitrogen and carbon pools were also related to the TN. As shown in Figure 1, most of the fertilizers contained nearly no mineral nitrogen (<50 mg N per g TN), whereas very high amounts of ammonium-N (419 mg N per g TN) were found in the OPF and, to a lesser extent (138 mg N per g TN), in the MAF. Except for 1 HA_ON, the soluble organic N pools differed considerably among the fertilizers. Their proportions of TN ranged from 3.8% to 38% for CW_ON and from 5.3% to 48% for HW_ON, comparable to the values reported by Rubins and Bear [55] for various raw and processed plant (7.0% to 47.5%) and animal (0.2% to 39.3%) products. Using 0.005 M hydrochloric acid gave slightly higher (7.9% to 66%) values and 1 M hydrochloric acid gave remarkably higher (42% to 94%) values, whereas the lowest values were found for the OPF (42%) and MAF (77%) due to their high contents of mineral N.
Due to the low amount of mineral nitrogen in most fertilizers, the percentages of the total soluble N of the TN were equivalent to those of the soluble organic N of the TN. In addition to their similar ranges, the cold water-, hot water-, and 0.005 hydrochloric acid-soluble N pools were highly correlated with each other but not with the 1 M_HA pool (Table 2).
The variation in the organic C pools hydrolyzable in HA, and the TOC and organic carbon analyzed by Py-TA-EGA (POC), are summarized in Figure 2. The absolute values of TOC ranged between 2523 mg per g TN for the OPF and 11,514 mg per g TN for the FPG. Also, the amounts among the other organic C pools varied considerably from 19% to 88%, 57% to 96%, and 51% to 88% of TOC for 0.005 HA_C, 1 HA_C, and POC, respectively (Figure 2). Most organic carbon pools, whether analyzed by acid hydrolysis or by Py-TA-EGA, were positively correlated with each other (r ≥ 0.87, p < 0.01). This indicates that Py-TA-EGA provided no more information about the organic carbon quality than acid hydrolysis.
With the exception of the TOC/TN ratio, for the calculation of the C/N ratios, only the organic N pools (CW_ON, HW_ON, 0.005 HA_ON, 1 HA_ON, TON)—calculated as the difference between the respective total N and the cold-water-soluble ammonium-N and nitrate-N—were used. The ratios of TOC to TN, TON, and 1 HA_ON, respectively, ranged from 3 to 12 and were quite similar to the values reported by Stadler et al. [30]. With the increasing strength of the extractant (CW < HW < 0.005 M HCl < 1 M HCl), the range of the TOC/ON ratios decreased. This was also true for the ratios of the organic C and organic N pools, both hydrolyzable in 0.005 (0.005 HA_C/ON) and 1 M hydrochloric acid (1 HA_C/ON), respectively (Figure 3).
Due to the described correlations among the different pools of N and C and among several N and C pools whose data are not shown, the ratios of TOC to organic N pools soluble in weak extractants (CW, HW, and 0.005 M HA) were highly correlated with each other (Table 3). Furthermore, the TOC to organic N hydrolyzable ratio in 1 M hydrochloric acid (1 HA_ON) was correlated to the TOC/TN and TOC/TON ratios, respectively, which were also closely correlated. A comparably high correlation was found for the ratios of 1 HA_C/ON to TOC/TN, TOC/TON, and TOC/1 HA_ON, respectively. Additionally, a significant correlation existed between the ratios of C/ON analyzed in 0.005 and 1 M HA. This indicates that all tested weak extractants (cold water, hot water, and 0.005 M hydrochloric acid) provided more or less the same information about the organic N and C pools of the organic fertilizers and that in 1 M hydrochloric acid, the hydrolyzable organic C and N are more related to the total content than to the specific pools. This is quite different from other findings on the characterization of soil organic matter [56] but might be explainable by the higher proportion of readily degradable nitrogen-containing compounds in the organic fertilizers compared to soil organic matter. In contrast to soils, where approximately one-third of the organic nitrogen (N) remained non-hydrolyzable even after treatment with 6 M hydrochloric acid [57], the organic fertilizers contained a significantly higher proportion of hydrolyzable N (88 ± 1.5% using 1 M hydrochloric acid).

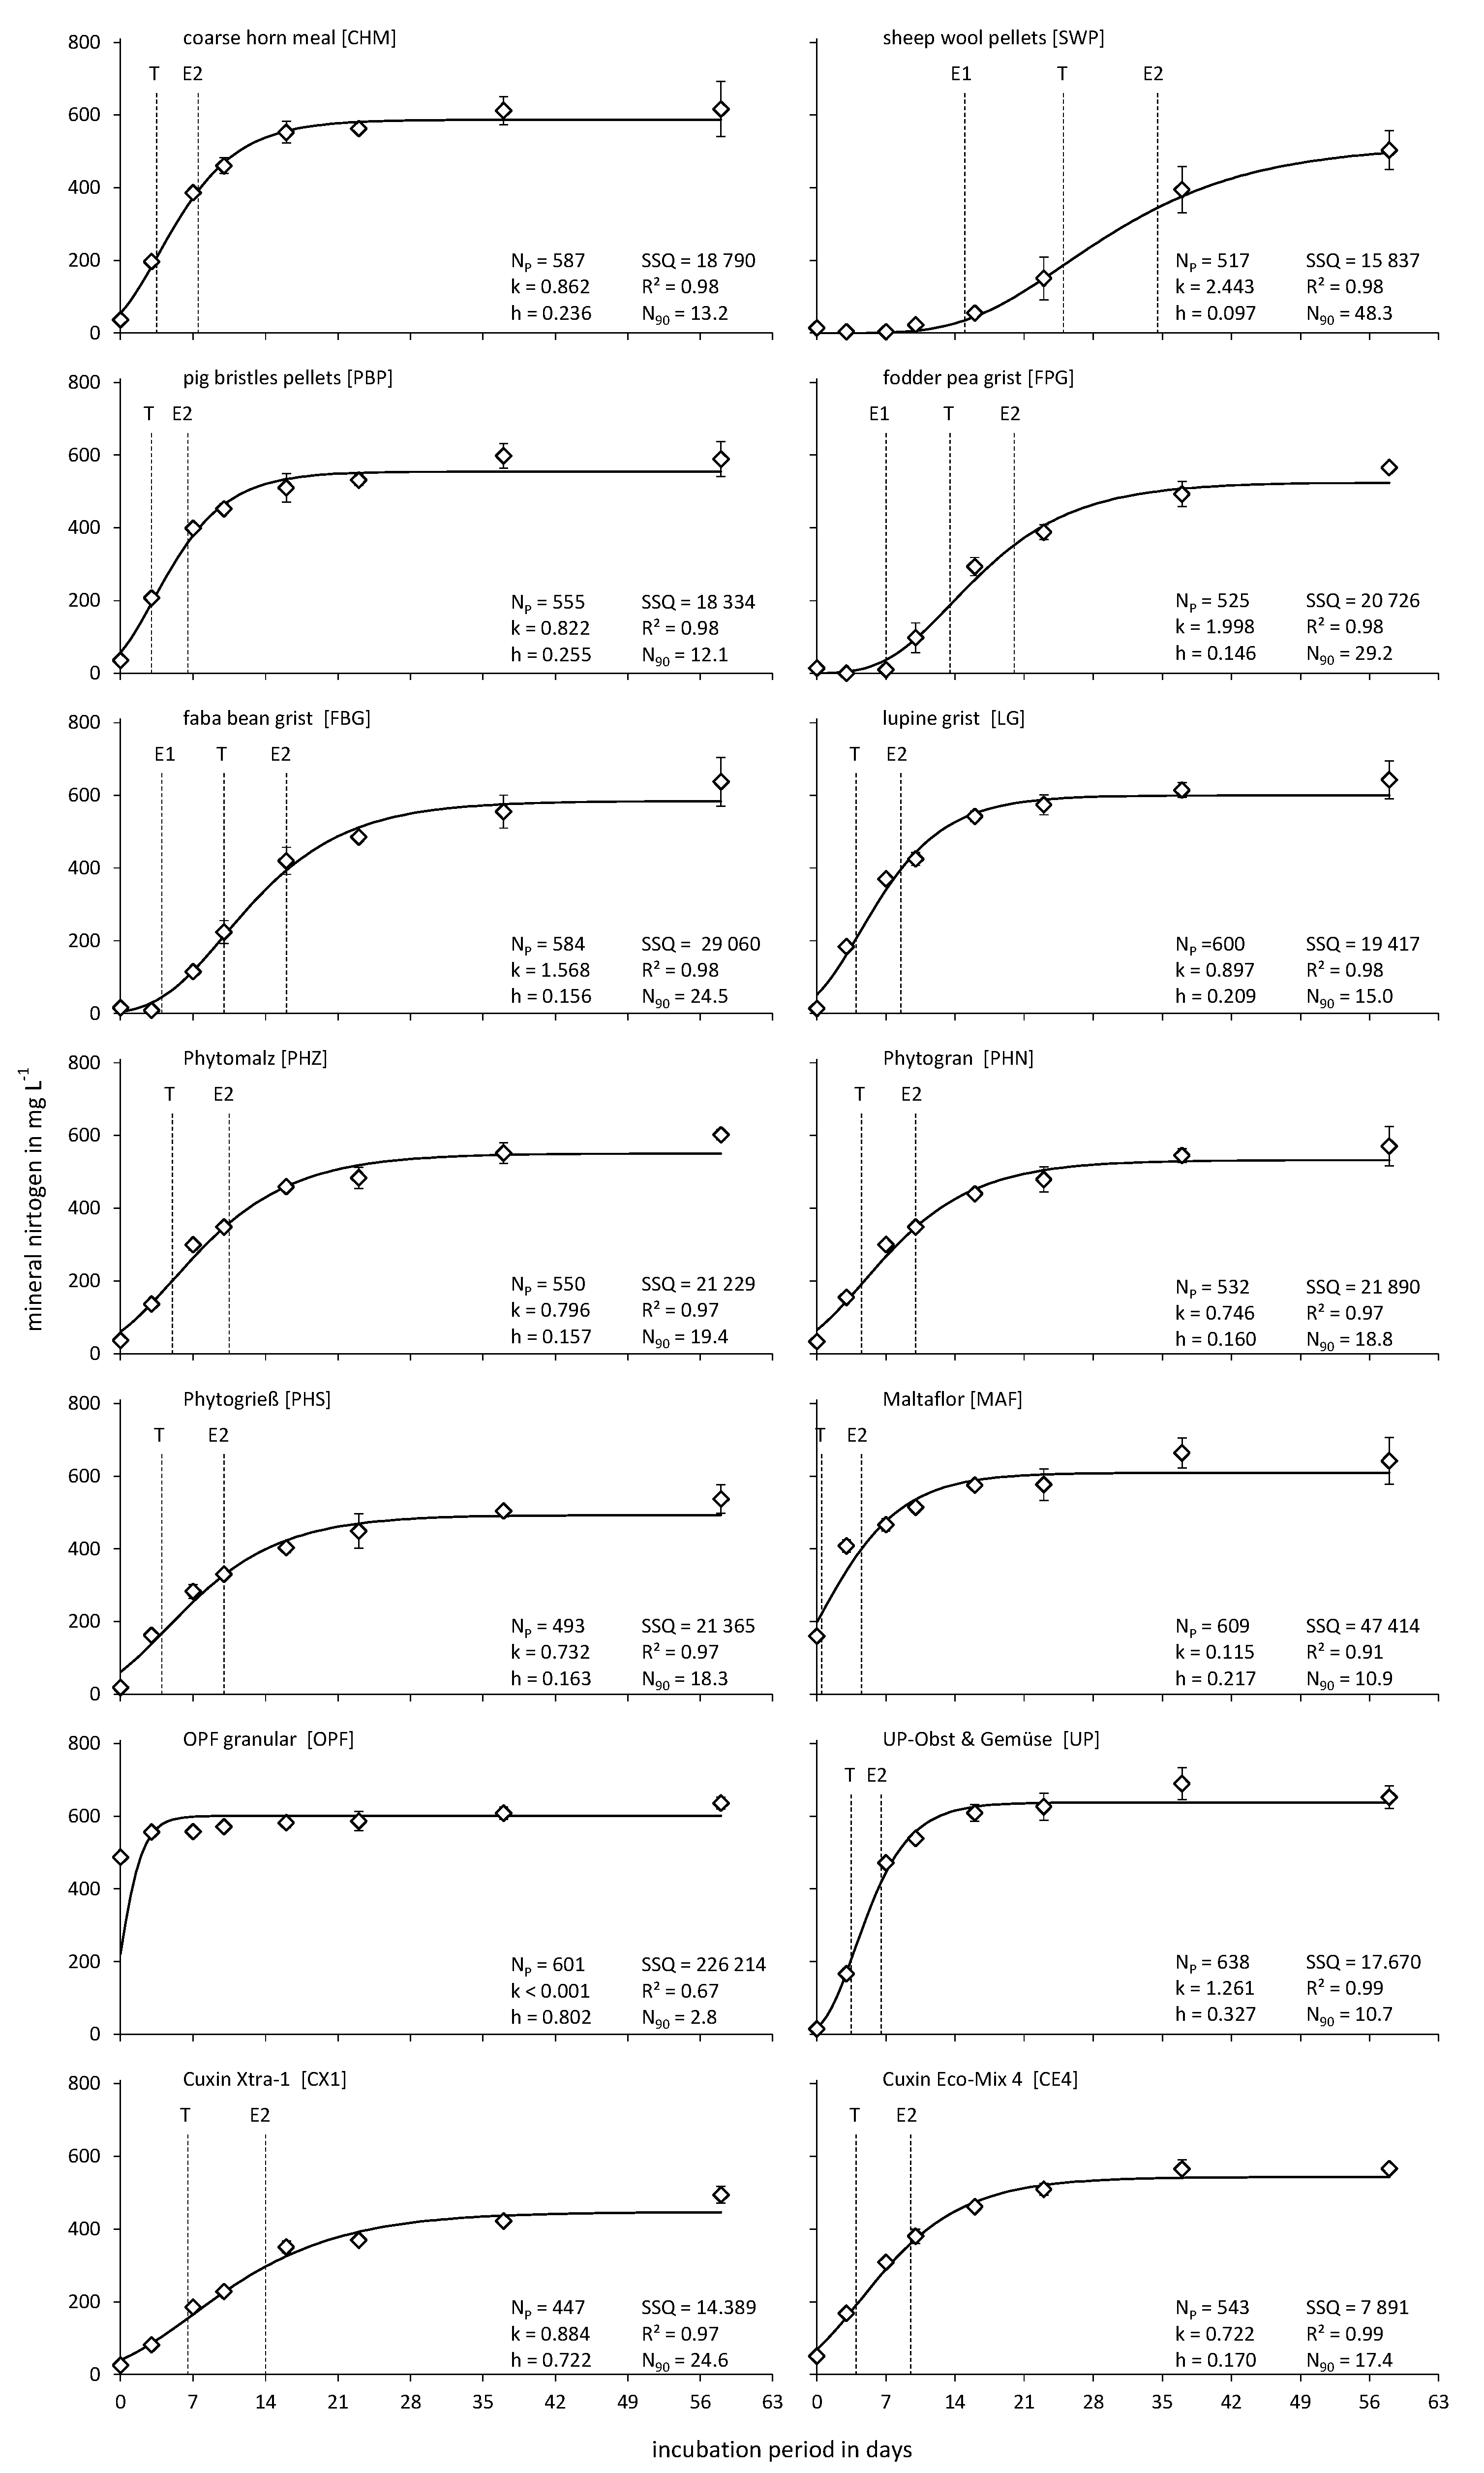
3.2. Nitrogen Release

Overall, the nitrogen turnover in the control treatments without fertilizer and with 500 mg N per liter as ammonium nitrate was negligible, respectively. In the unfertilized control, the mineral N increased slightly from 14 ± 0.5 at the beginning up to 35 ± 12.0 mg L−1 after 58 days. Nevertheless, the N release from organic fertilizers was corrected for the mineral N in the unfertilized control at each date. No clear trend was observed in the control fertilized with ammonium nitrate. The mineral N oscillated at each date closely (484 ± 17.4 mg L−1) around the target value of 500 mg N per liter. Furthermore, differences in the N release patterns between the chopped and unchopped fertilizers were rather small, and no systematic effect of particle size was found. This result was confirmed in a more detailed subsequent examination using horn shavings milled to defined grain sizes (<1 mm, 1–2 mm, and 2–4 mm). Only in the first two weeks was a slightly faster N release from finer materials observed. In the following four weeks, no differences were apparent [58]. Due to the slightly better reproducibility, only the N release from the chopped fertilizers was considered in the following.
The N release from organic fertilizers is described best by flexible sigmoid-shaped functions, in particular by the Richards and Gompertz functions. As found by Rahn and Lillywhite [59] and Nendel and Reuter [11], for brassica leaves and grape stalks, some fertilizers have shown a lag of mineralization within the first several days of incubation experiments. This was most pronounced for the SWPs, where no mineral N was found within the first seven days. Following the results of Simard and N’dayegamiye [16] for meadows, and of Hara [54] for coated urea fertilizers, this lag phase could not be described by first- or second-order rate equations or by consecutive reaction models but by flexible sigmoid Gompertz and Richards functions. As the parameter d in the Richards function was zero for most fertilizers—except for the OPF and SWPs—the Richards function is almost identical to the Gompertz function [54].
Furthermore, the TSSQ, more than twofold higher for the Gompertz compared to the Richards function (Figure 4), is nearly exclusively due to the relatively poor fitting of the Gompertz function to the N release from OPF. In this case, the SSQ for the OPF (226·10³) contributed nearly half of the TSSQ (500·10³). However, due to the significant proportion of cold-water-soluble ammonium-N discussed in the previous section, it appears that OPF functioned more as a mineral rather than as an organic nitrogen fertilizer. This observation aligns with the fact that 500 out of the 1000 mg TN L−1 added was already present as CAT-soluble mineral N at the start of the 58-day incubation experiment. Despite this, the N mineralization only amounted to approximately 150 mg L−1 by the end of the experiment. Consequently, the subsequent paragraphs only minimally address the OPF.
As shown in Figure 4, adding a term for the easily mineralizable N pool (NE) did not remarkably reduce the TSSQ for the remaining 13 fertilizers for the Gompertz function (274·10³ to 273·10³) but did for the Richards function (274·10³ to 162·10³). However, as described before, parameter d of the Richards function remained near zero for most fertilizers. This was also true when a zero-order rate constant (k0) for less degradable N pools was added, which reduced the TSSQ remarkably for both the Gompertz and Richards functions. Finally, as the Richards function is nearly identically to the Gompertz function and the fitting was already very good for the simpler Gompertz function using only the three parameters NP, h, and k (R² > 0.91, with an exception for OPF: R² = 0.67), this function was selected as the most suitable one. In addition, Gompertz’s function also has a biological justification: The application of easily degradable organic carbon to soils triggers a rapid increase in microbial biomass [60,61,62]. As a result, especially the growth rate of bacteria is significantly enhanced [62]. Concurrently, the Gompertz function has been demonstrated as a reliable model for bacterial growth. The parameters of this function have physiological significance as they can be traced back to the three phases of bacterial growth: the initial lag phase (parameter h), the phase of the maximum growth rate (parameter k), and the stationary phase in which the maximum population density (parameter NP) is reached [63,64].
Figure 5 shows the fitting of the Gompertz function to the N release from the 14 organic fertilizers. The turning point (T) indicates the day when the maximum mineralization rate was reached, as well as the beginning (E1) and end (E2) of the nearly linear N release phase. Additionally, the goodness of fit (SSQ and R²) and the period until a 90% release of NP (N90) are listed. The percentage of mineralizable organic nitrogen was around 55% of the total added N; it was the lowest for CX1, with 45%, and the highest for UP, with 63%. The same range has been reported for various commercial organic fertilizers by Prasad et al. [65] and Dion et al. [66], using peat-based growing media for incubation experiments, as well as by Müller and von Fragstein und Niemsdorff [28] and Stadler et al. [30], who conducted incubation experiments in mineral soils. Furthermore, Koch et al. [67] and Heuberger et al. [27] calculated only a slightly higher N efficiency (between 40% and 60% of the total added N) for organic fertilizer in pot experiments with pelargonium and basil, respectively. Thus, to ensure a sufficient nitrogen supply, growers have to fertilize on a total N basis, which is about twice the demand of the plants. Except for the SWPs and, to a lesser extent, the FPG and FBG, the fertilizers did not have a lag phase (indicated by parameter k), so linear mineralization started directly after adding the fertilizers (E1 < 1). The maximum daily N mineralization rate (indicated by parameter h) was lowest for the SWPs, with 16, and highest for UP, with 65 mg L−1 d−1. For the SWPs, due to the already mentioned lag phase of nearly two weeks and the low daily mineralization rate, it took nearly five weeks until two-thirds of the total mineralized nitrogen was released. For the FPG and FBG, which had a lag phase of several days and also a relatively low daily N mineralization rate (<30 mg L−1 d−1), and for CX1, which had no remarkable lag phase but a similar low daily N mineralization rate (18 mg L−1 d−1) to the SWPs, this point was reached within 14 to 20 days. All other fertilizers passed the 66% level within ten days. The CHM, PBPs, MAF, and UP exceeded 90% within 14 days. In addition to the relatively poor nitrogen efficiency, most organic fertilizers’ high velocity of N release might be problematic for growers. For instance, in the cultivation of potted basil, if the entire N demand of about 1000 mg total N per liter [27] is applied at the date of sowing, two weeks later, the mineral N in the growing medium will be between 250 and 500 mg L−1. However, by this date, the seedlings will have just emerged and might be harmed, in particular due to osmotic stress. Thus, complete stockpiling, as recommended by Heuberger et al. [27], is quite risky. Furthermore, in the case of missing nitrification, ammonium-N will accumulate, damaging plants [68]. However, in the current research—except for the OPF—nitrification already started within the first week of incubation. This was probably mainly due to the addition of compost. A similar enhancement of nitrification by compost amendment has been found, e.g., by Delics et al. [58] and Frerichs et al. [68]. However, in contrast to nitrification, neither reported a clear effect of compost amendment on the height or time course of the N mineralization. This might have been due to the fact that none of the composts used in these experiments contained remarkable amounts of mineral N [69].

3.3. Relative Importance of N and C Pools

As mentioned before, OPF is a mineral rather than an organic fertilizer. Thus, we excluded it from the following evaluation of the importance of N and C pools for N release from organic fertilizers. The level of N release to the total applied N (indicated by parameter NP of the Gompertz function) was closely correlated to the easily soluble N pools (cold water, hot water, and 0.005 M hydrochloric acid) for most fertilizers. The only exception was UP, which had a very high N release in relation to the soluble N pool compared to all other fertilizers. As Cook’s D for UP exceeded the cut-off point more than twice, correlations between the N release and the soluble N pools were calculated with and without the consideration of UP. When all fertilizers were included, the amount of mineralizable nitrogen (NP) was not significantly correlated to the soluble N pools (r ≤ 0.48; p ≥ 0.08). However, omitting the UP resulted in highly significant correlations for the three named N pools (r ≥ 0.69; p < 0.01), of which the relationship was closest for the total cold-water-soluble N (Figure 6a). A positive relationship between the easily soluble N pools and the mineralization potential was also shown by Iratani and Arnold [20], who found water-soluble N to be twice as influential as water-insoluble N in affecting the N release from various crop residues. Rubins and Bear [55] also emphasized a positive correlation between water-soluble N and N release. Furthermore, they reported decreasing net mineralization with an increasing C/N ratio of the non-lignin fraction. Even immobilization was observed if the C/N ratio was above 20. Coincidentally, a positive correlation between the ratios of the C and N pools hydrolyzable in weak hydrochloric acid and the lag phase of mineralization (described by parameter k) was found (Figure 6b). The hypothesis that the ratio of hydrolyzable C and N pools might be a reliable indicator for short-term net mineralization is supported by the results of Jensen et al. [24], Bushong et al. [70], and Ahn et al. [71]. All authors have reported positive relationships of soluble N and C pools with the short-term mineralization of organic matter. Thus, in products such as FBG, UP, and FPG, with higher ratios of C and N pools in the readily decomposable pools, even the net immobilization might occur within the first days, whereas for products with a lower ratio, the net N mineralization was found right from the beginning. However, the exceptionally high value of k for the SWPs (2.44 mg L−1 d−1) and, thus, the lag phase of nearly 14 days, could not be solely attributed to the ratio of carbon and nitrogen in the easily decomposable pools. The discrepancy between the SWPs and all other fertilizers was confirmed by a Cook’s D > 4/n for the SWPs. One possible reason might be the high amount of wool wax—mainly lanolin—in sheep wool. As the percentages of lanolin and total N are similar in raw sheep wool [72], the amount of added lanolin in the incubation experiment was about 1 g L−1. According to Arunkumar et al. [73], only certain groups of bacteria effectively degrade such wax-rich agricultural residues. Studies on wood fibers have shown that waxes can additionally act as physical and bio-chemical protection against microbial breakdown [72,74,75]. The extended lag phase of the SWPs might be related to the time needed to develop such a wax-degrading bacterial population. Furthermore, keratins—the fibrous proteins forming sheep wool—are highly resistant to hydrolysis by common proteolytic enzymes [76]. This seems, at first sight, contradictory to the fact that hooves (CHM) and pig bristles (PBPs), which also mainly consist of keratins, had no lag phase, and their daily N mineralization rates (45 and 47 mg L−1 d−1) were among the highest of all fertilizers. However, the degradability of keratin-rich residues is closely related to the percentage of different keratin groups (α-, β-, and γ-keratins), the amino acid composition, and the amount of sulfur [76,77,78], which all differ among hooves, hairs, and feathers [37,77,78]. As a coincidence, the amount of easily (0.005 M hydrochloric acid) hydrolyzable organic nitrogen was about five times higher in the CHM and PBPs than in the SWPs. In contrast, the amount of organic nitrogen soluble in 1 M hydrochloric acid was the same for all three fertilizers. Moreover, as for the NP mentioned before, the maximum daily N mineralization rate (indicated by parameter h of the Gompertz function) of easily hydrolyzable organic N pools was significantly higher for the UP than for the remaining twelve fertilizers. However, for the remaining fertilizers, quickly hydrolyzable organic N pools were only a rough indicator of the maximum daily N mineralization rate (Figure 6c). Thus, the results present here are useful as indicators of the N release from organic fertilizers but cannot be used for a precise prediction thereof.
Before transferring the results to the greenhouse, the influence of plants should be considered as an additional factor. Plant exudate and the microbiology within the rootzone can contribute to this effect [79]. For instance, the study by Gruda and Schnitzler [80] indicated that immobilized nitrogen levels were higher in experiments with plants than those without plants. In addition, root exudates affect the root and shoot growth of plants by attracting beneficial microbiota, chelating nutrients in the rootzone, modulating rootzone pH, and enhancing the availability of specific nutrient elements [79,81]. Furthermore, Helal and Sauerbeck [82] demonstrated that the activation of microorganisms, especially in proximity to the roots, might enhance carbon mobilization from the organic matter. Consequently, the demand for nitrogen increases to support the proliferation of microorganisms. Furthermore, the ongoing substitution of peat in growing media to other organic materials will make the topic more complex, as not only the N release from organic fertilizers but also N immobilization by growing media constituents, such as wood fiber, and the interaction between both processes are of increasing importance [69]. This should be addressed in detail in future research, in which the role of microbial activity and the structure of the microbial community have to be considered.

4. Conclusions

Water-soluble and easily hydrolyzable N and C pools of organic fertilizers are valuable indicators for the potentially mineralizable N and the time course of N release, which can be estimated very well by flexible-shaped sigmoid growth functions—mainly the Gompertz function. This makes organic fertilizers more comparable and can help match the N supply and demand better, thus increasing the efficiency and sustainability of organic pot plant production. In contrast to chemical composition, the particle size was less important for the time course of N release under the test conditions. Furthermore, the presented data highlight the two main challenges growers face when applying organic N fertilizers. First, growers must consider that the N release is only about half of the total applied N; thus, they must double the N supply compared to the N demand. Secondly, N release is relatively fast, which might cause salt damage and make the complete application of nitrogen before planting impossible.

Author Contributions

Conceptualization and methodology, D.L. and E.M.; formal analysis, investigation, data curation, writing—original draft preparation, D.L.; writing—review and editing, E.M. and N.S.G.; visualization, D.L.; supervision, E.M.; project administration, E.M. All authors have read and agreed to the published version of the manuscript.

Funding

This research received no external funding.

Data Availability Statement

The data supporting this study’s findings are available from the corresponding author upon reasonable request.

Acknowledgments

The authors like to thank Jakob Burmann for his assistance in the lab work and data acquisition.

Conflicts of Interest

The authors declare no conflict of interest.

References

  1. Granatstein, D.; Kirby, E.; Willer, H. Organic horticulture expands globally. Chron. Hortic. 2010, 50, 31–38. [Google Scholar]
  2. Yue, C.; Dennis, J.H.; Behe, B.K.; Hall, C.R.; Campbell, B.L.; Lopez, R.G. Investigating consumer preference for organic, local, or sustainable plants. HortScience 2011, 46, 610–615. [Google Scholar] [CrossRef] [Green Version]
  3. Reganold, J.P.; Wachter, J.M. Organic agriculture in the twenty-first century. Nat. Plants 2016, 2, 15221. [Google Scholar] [CrossRef]
  4. Willer, H.; Lernoud, J. The World of Organic Agriculture. Statistics and Emerging Trends; Research Institute of Organic Agriculture FiBL: Frick, Switzerland; IFOAM-Organics International: Bonn, Germany, 2017; pp. 1–336. [Google Scholar]
  5. Burnett, S.E.; Stack, L.B. Survey of the research needs of the potential organic ornamental bedding plant industry in Maine. HortTechnology 2009, 19, 743–747. [Google Scholar] [CrossRef] [Green Version]
  6. Bergstrand, K.J. Organic fertilizers in greenhouse production systems–A review. Sci. Hortic. 2022, 295, 110855. [Google Scholar] [CrossRef]
  7. Stanford, G.; Smith, S.J. Nitrogen mineralization potentials of soils. Soil Sci. Soc. Am. J. 1972, 36, 465–472. [Google Scholar] [CrossRef]
  8. Frankenberger, W.T.; Abdelmagid, H.M. Kinetic parameters of nitrogen mineralization rates of leguminous crops incorporated into soil. Plant Soil 1985, 87, 257–271. [Google Scholar] [CrossRef]
  9. De Neve, S.; Hofman, G. Modelling N mineralization of vegetable crop residues during laboratory incubations. Soil Biol. Biochem. 1996, 28, 1451–1457. [Google Scholar] [CrossRef]
  10. Cabrera, M.L.; Kissel, D.E.; Vigil, M.F. Nitrogen mineralization from organic residues: Research opportunities. J. Environ. Qual. 2005, 34, 75–79. [Google Scholar] [CrossRef] [Green Version]
  11. Nendel, C.; Reuter, S. Kinetics of net nitrogen mineralisation from soil-applied grape residues. Nutr. Cycl. Agroecosyst. 2007, 79, 233–241. [Google Scholar] [CrossRef]
  12. Nakhone, L.N.; Tabatabai, M.A. Nitrogen mineralization of leguminous crops in soils. J. Plant Nutr. Soil Sci. 2008, 171, 231–241. [Google Scholar] [CrossRef]
  13. Diaz-Fierros, F.; Villar, M.C.; Gil, F.; Carballas, M.; Leiros, M.C.; Carballas, T.; Cabaneiro, A. Effect of cattle slurry fractions on nitrogen mineralization in soil. J. Agric. Sci. 1988, 110, 491–497. [Google Scholar] [CrossRef]
  14. Ellert, B.H.; Bettany, J.R. Comparison of kinetic models for describing net sulfur and nitrogen mineralization. Soil Sci. Soc. Am. J. 1988, 52, 1692–1702. [Google Scholar] [CrossRef]
  15. White, C.S.; Marinakis, Y.D. A flexible model for quantitative comparisons of nitrogen mineralization patterns. Biol. Fertil. Soils 1991, 11, 239–244. [Google Scholar] [CrossRef]
  16. Simard, R.R.; N’dayegamiye, A. Nitrogen-mineralization potential of meadow soils. Can. J. Soil Sci. 1993, 73, 27–38. [Google Scholar] [CrossRef] [Green Version]
  17. Agbenin, J.O.; Agbaji, E.B.; Suleiman, I.; Agbaji, A.S. Assessment of nitrogen mineralization potential and availability from neem seed residue in a savanna soil. Biol. Fertil. Soils 1999, 29, 408–412. [Google Scholar] [CrossRef]
  18. Deenik, J.L.; Yost, R.S. Nitrogen mineralization potential and nutrient availability from five organic materials in an atoll soil from the Marshall Islands. Soil Sci. 2008, 173, 54–68. [Google Scholar] [CrossRef]
  19. Trinsoutrot, I.; Recous, S.; Bentz, B.; Linères, M.; Chèneby, D.; Nicolardot, B. Biochemical quality of crop residues and carbon and nitrogen mineralization kinetics under nonlimiting nitrogen conditions. Soil Sci. Soc. Am. J. 2000, 64, 918–926. [Google Scholar] [CrossRef]
  20. Iritani, W.M. The Nitrogen Release of Vegetable Crop Residues During Incubation as Related to Their Chemical Composition. Ph.D. Thesis, University of Illinois at Urbana-Champaign, Champaign, IL, USA, 1958. [Google Scholar]
  21. Fox, R.H.; Myers, R.J.K.; Vallis, I. The nitrogen mineralization rate of legume residues in soil as influenced by their polyphenol, lignin, and nitrogen contents. Plant Soil 1990, 129, 251–259. [Google Scholar] [CrossRef]
  22. Henriksen, T.M.; Breland, T.A. Evaluation of criteria for describing crop residue degradability in a model of carbon and nitrogen turnover in soil. Soil Biol. Biochem. 1999, 31, 1135–1149. [Google Scholar] [CrossRef]
  23. Pansu, M.; Thuriès, L.; Larré-Larrouy, M.C.; Bottner, P. Predicting N transformations from organic inputs in soil in relation to incubation time and biochemical composition. Soil Biol. Biochem. 2003, 35, 353–363. [Google Scholar] [CrossRef]
  24. Jensen, L.S.; Salo, T.; Palmason, F.; Breland, T.A.; Henriksen, T.M.; Stenberg, B.; Pedersen, A.; Lundström, C.; Esala, M. Influence of biochemical quality on C and N mineralisation from a broad variety of plant materials in soil. Plant Soil 2005, 273, 307–326. [Google Scholar] [CrossRef]
  25. Redin, M.; Recous, S.; Aita, C.; Dietrich, G.; Skolaude, A.C.; Ludke, W.H.; Schmatz, R.; Giacomini, S.J. How the chemical composition and heterogeneity of crop residue mixtures decomposing at the soil surface affects C and N mineralization. Soil Biol. Biochem. 2014, 78, 65–75. [Google Scholar] [CrossRef]
  26. Noirot-Cosson, P.E.; Dhaouadi, K.; Etievant, V.; Vaudour, E.; Houot, S. Parameterisation of the NCSOIL model to simulate C and N short-term mineralisation of exogenous organic matter in different soils. Soil Biol. Biochem. 2017, 104, 128–140. [Google Scholar] [CrossRef]
  27. Heuberger, H.; Kreuzmair, A.; Weh, F.; Schnitzler, W.H. Vegetabile Dünger als Stickstoffquelle für Topfbasilikum.-Freisetzung und Aufnahme von Stickstoff aus vegetabilen Düngern bei Basilikum (Ocimum basilicum L.) in Topfkultur. Z. Für Arznei-Und Gewürzpflanzen 2005, 10, 140–143. [Google Scholar]
  28. Müller, T.; von Fragstein und Niemsdorff, P. Organic fertilizers derived from plant materials Part I: Turnover in soil at low and moderate temperatures. J. Plant Nutr. Soil Sci. 2006, 169, 255–264. [Google Scholar] [CrossRef]
  29. Müller, T.; von Fragstein und Niemsdorff, P. Organic fertilizers derived from plant materials Part II: Turnover in field trials. J. Plant Nutr. Soil Sci. 2006, 169, 265–273. [Google Scholar] [CrossRef]
  30. Stadler, C.; Von Tucher, S.; Schmidhalter, U.; Gutser, R.; Heuwinkel, H. Nitrogen release from plant-derived and industrially processed organic fertilizers used in organic horticulture. J. Plant Nutr. Soil Sci. 2006, 169, 549–556. [Google Scholar] [CrossRef]
  31. Lü, H.; He, H.; Zhao, J.; Zhang, W.; Xie, H.; Hu, G.; Liu, X.; Wu, Y.; Zhang, X. Dynamics of fertilizer-derived organic nitrogen fractions in an arable soil during a growing season. Plant Soil 2013, 373, 595–607. [Google Scholar] [CrossRef]
  32. Ros, G.H.; Hanegraaf, M.C.; Hoffland, E.; van Riemsdijk, W.H. Predicting soil N mineralization: Relevance of organic matter fractions and soil properties. Soil Biol. Biochem. 2011, 43, 1714–1722. [Google Scholar] [CrossRef]
  33. Von Lützow, M.; Kögel-Knabner, I.; Ekschmitt, K.; Flessa, H.; Guggenberger, G.; Matzner, E.; Marschner, B. SOM fractionation methods: Relevance to functional pools and to stabilization mechanisms. Soil Biol. Biochem. 2007, 39, 2183–2207. [Google Scholar] [CrossRef]
  34. Stevenson, F.J. Gross Chemical Fractionation of Organic Matter. Methods of Soil Analysis: Part 2 Chemical and Microbiological Properties; American Society of Agronomy: Madison, WI, USA, 1965; pp. 1409–1421. [Google Scholar] [CrossRef]
  35. Möller, K.; Schultheiß, U. Organische Handelsdüngemittel Tierischer und Pflanzlicher Herkunft für den Ökologischen Landbau—Charakterisierung und Empfehlungen für die Praxis. Kuratorium für Technik und Bauwesen in der Landwirtschaft (KTBL) e.V.: Darmstadt, Germany, 2013. [Google Scholar]
  36. Block, R.J.; Bolling, D. The amino acid composition of keratins: The composition of gorgonin, spongin, turtle scutes, and other keratins. J. Biol. Chem. 1939, 127, 685–693. [Google Scholar] [CrossRef]
  37. Górecki, R.S.; Górecki, M.T. Utilization of waste wool as substrate amendment in pot cultivation of tomato, sweet pepper, and eggplant. Pol. J. Environ. Stud. 2010, 19, 1083–1087. [Google Scholar]
  38. VDLUFA Method Book II.1: Analysis of Fertilizers, 4th ed.; with 1–6 Supplement; VDLUFA-Verlag: Darmstadt, Germany, 2014.
  39. VDLUFA Method Book I: Analysis of Soils, 4th ed.; with 1–7 Supplements; VDLUFA-Verlag: Darmstadt, Germany, 2016.
  40. Meinken, E.; Lohr, D.; Wöck, C. Colonization of growing media by saprophytic fungi-importance of carbon and nitrogen fractions. Acta Hortic. 2017, 1168, 325–332. [Google Scholar] [CrossRef]
  41. Kroon, H. Determination of nitrogen in water: Comparison of a continuous-flow method with on-line UV digestion with the original Kjeldahl method. Anal. Chim. Acta 1993, 276, 287–293. [Google Scholar] [CrossRef]
  42. Oweczkin, I.J.; Kerven, G.L.; Ostatek-Boczynski, Z. Determination of dissolved organic carbon by inductively coupled plasma atomic emission spectrometry. Commun. Soil Sci. Plant Anal. 1995, 26, 2739–2747. [Google Scholar] [CrossRef]
  43. Lohr, D.; Wöck, C.; Meinken, E. Pyrolytic combustion analysis of carbon-a new approach for characterizing growing media. Acta Hortic. 2017, 1168, 341–348. [Google Scholar] [CrossRef]
  44. DIN 11540:2019-03; Peats for Horticulture and Landscape Gardening—Properties, Test Methods, Specifications. Beuth Verlag GmbH: Berlin, Germany, 2019.
  45. Methodbook for Analysis of Organic Fertilizers, Soil Improvers and Growing Media, 1st ed.; with 1–6 Supplements; Bundesgütegemeinschaft Kompost (BGK): Köln, Germany, 2021.
  46. Brown, A.M. A step-by-step guide to non-linear regression analysis of experimental data using a Microsoft Excel spreadsheet. Comput. Methods Programs Biomed. 2001, 65, 191–200. [Google Scholar] [CrossRef]
  47. Kemmer, G.; Keller, S. Nonlinear least-squares data fitting in Excel spreadsheets. Nat. Protoc. 2010, 5, 267–281. [Google Scholar] [CrossRef]
  48. Blatná, D. Outliers in regression. Trutnov 2006, 30, 1–6. [Google Scholar]
  49. Jones, C.A. Estimation of an active fraction of soil nitrogen. Commun. Soil Sci. Plant Anal. 1984, 15, 23–32. [Google Scholar] [CrossRef]
  50. Pal, D.; Broadbent, F.E. Kinetics of rice straw decomposition in soils. J. Environ.-Qual. 1975, 4, 256–260. [Google Scholar] [CrossRef]
  51. Brunner, W.; Focht, D.D. Deterministic three-half-order kinetic model for microbial degradation of added carbon substrates in soil. Appl. Environ. Microbiol. 1984, 47, 167–172. [Google Scholar] [CrossRef] [Green Version]
  52. Molina, J.A.E.; Clapp, C.E.; Larson, W.E. Potentially mineralizable nitrogen in soil: The simple exponential model does not apply for the first 12 weeks of incubation. Soil Sci. Soc. Am. J. 1980, 44, 442–443. [Google Scholar] [CrossRef] [Green Version]
  53. Noggle, J.H. Chapter 9 Physical Chemistry; Little, Brown and Company: Boston, MA, USA, 1985; pp. 445–449. [Google Scholar]
  54. Hara, Y. Application of the Richards function to nitrogen release from coated urea at a constant temperature and relationships among the calculated parameters. Soil Sci. Plant Nutr. 2000, 46, 683–691. [Google Scholar] [CrossRef]
  55. Rubins, E.J.; Bear, F.E. Carbon-nitrogen ratios in organic fertilizer materials in relation to the availability of their nitrogen. Soil Sci. 1942, 54, 411–424. [Google Scholar] [CrossRef]
  56. Silveira, M.L.; Comerford, N.B.; Reddy, K.R.; Cooper, W.T.; El-Rifai, H. Characterization of soil organic carbon pools by acid hydrolysis. Geoderma 2008, 144, 405–414. [Google Scholar] [CrossRef]
  57. Leinweber, P.; Schulten, H.R. Nonhydrolyzable forms of soil organic nitrogen: Extractability and composition. J. Plant Nutr. Soil Sci. 2000, 163, 433–439. [Google Scholar] [CrossRef]
  58. Delics, B.; Lohr, D.; Meinken, E. Nitrogen mineralization and subsequent nitrification of horn as affected by particle size and compost amendment to the growing medium. DGG-Proceedings 2017, 7, 1–5. [Google Scholar] [CrossRef]
  59. Rahn, C.R.; Lillywhite, R.D. A study of the quality factors affecting the short-term decomposition of field vegetable residues. J. Sci. Food Agric. 2002, 82, 19–26. [Google Scholar] [CrossRef]
  60. Arancon, N.Q.; Edwards, C.A.; Bierman, P. Influences of vermicomposts on field strawberries: Part 2. Effects on soil microbiological and chemical properties. Bioresour. Technol. 2006, 97, 831–840. [Google Scholar] [CrossRef] [PubMed]
  61. Dinesh, R.; Srinivasan, V.; Hamza, S.; Manjusha, A. Short-term incorporation of organic manures and biofertilizers influences biochemical and microbial characteristics of soils under an annual crop [Turmeric (Curcuma longa L.)]. Bioresour. Technol. 2010, 101, 4697–4702. [Google Scholar] [CrossRef] [PubMed]
  62. Lazcano, C.; Gómez-Brandón, M.; Revilla, P.; Domínguez, J. Short-term effects of organic and inorganic fertilizers on soil microbial community structure and function: A field study with sweet corn. Biol. Fertil. Soils 2013, 49, 723–733. [Google Scholar] [CrossRef]
  63. Zwietering, M.H.; Jongenburger, I.; Rombouts, F.M.; Van’t Riet, K.J.A.E.M. Modeling of the bacterial growth curve. Appl. Environ. Microbiol. 1990, 56, 1875–1881. [Google Scholar] [CrossRef] [PubMed] [Green Version]
  64. Buchanan, R.L.; Whiting, R.C.; Damert, W.C. When is simple good enough: A comparison of the Gompertz, Baranyi, and three-phase linear models for fitting bacterial growth curves. Food Microbiol. 1997, 14, 313–326. [Google Scholar] [CrossRef]
  65. Prasad, M.; Simmons, P.; Maher, M.J. Release characteristics of organic fertilizers. Acta Hortic. 2004, 644, 163–170. [Google Scholar] [CrossRef]
  66. Dion, P.P.; Jeanne, T.; Thériault, M.; Hogue, R.; Pepin, S.; Dorais, M. Nitrogen release from five organic fertilizers commonly used in greenhouse organic horticulture with contrasting effects on bacterial communities. Can. J. Soil Sci. 2020, 100, 120–135. [Google Scholar] [CrossRef]
  67. Koch, R.; Emmel, M.; Lohr, D.; Frankenberg, A.; Degen, B.; Meinken, E.; Haas, H.P.; Fischinger, S. Organische Dünger in Topfkulturen auf dem Prüfstand—Wie steht es mit der Stickstofffreisetzung? In Beiträge zu 14. Wissenschaftstagung Ökologischer Landbau, N-Düngung und Verluste; Dr. Köster: Berlin, Germany, 2017; pp. 334–337. [Google Scholar]
  68. Frerichs, C.; Daum, D.; Pacholski, A.S. Ammonia and ammonium exposure of basil (Ocimum basilicum L.) growing in an organically fertilized peat substrate and strategies to mitigate related harmful impacts on plant growth. Front. Plant Sci. 2020, 10, 1696. [Google Scholar] [CrossRef] [Green Version]
  69. Vandecasteele, B.; Van Loo, K.; Ommeslag, S.; Vierendeels, S.; Rooseleer, M.; Vandaele, E. Sustainable growing media blends with woody green composts: Optimizing the n release with organic fertilizers and interaction with microbial biomass. Agronomy 2022, 12, 422. [Google Scholar] [CrossRef]
  70. Bushong, J.T.; Roberts, T.L.; Ross, W.J.; Norman, R.J.; Slaton, N.A.; Wilson, C.E., Jr. Evaluation of distillation and diffusion techniques for estimating hydrolyzable amino sugar-nitrogen as a means of predicting nitrogen mineralization. Soil Sci. Soc. Am. J. 2008, 72, 992–999. [Google Scholar] [CrossRef] [Green Version]
  71. Ahn, M.Y.; Zimmerman, A.R.; Comerford, N.B.; Sickman, J.O.; Grunwald, S. Carbon mineralization and labile organic carbon pools in the sandy soils of a North Florida watershed. Ecosystems 2009, 12, 672–685. [Google Scholar] [CrossRef]
  72. Zoccola, M.; Montarsolo, A.; Mossotti, R.; Patrucco, A.; Tonin, C. Green hydrolysis as an emerging technology to turn wool waste into organic nitrogen fertilizer. Waste Biomass Valorization 2015, 6, 891–897. [Google Scholar] [CrossRef]
  73. Arunkumar, N.; Gulsar Banu, J.; Gopalakrishnan, N.; Prakash, A.H. Wax degrading bacteria: Scope and applications in agriculture. Int. J. Curr. Microbiol. Appl. Sci. 2017, 6, 649–664. [Google Scholar] [CrossRef] [Green Version]
  74. Goodrich, B.S.; Roberts, D.S. Antimicrobial factors in wool wax. Aust. J. Chem. 1971, 24, 153–159. [Google Scholar] [CrossRef]
  75. Sengupta, A.; Behera, J. Comprehensive view on chemistry, manufacturing and applications of lanolin extracted from wool pretreatment. Am. J. Eng. Res. 2014, 3, 33–43. [Google Scholar]
  76. Zaghloul, T.I.; Embaby, A.M.; Elmahdy, A.R. Key determinants affecting sheep wool biodegradation directed by a keratinase-producing Bacillus subtilis recombinant strain. Biodegradation 2011, 22, 111–128. [Google Scholar] [CrossRef]
  77. Fellahi, S.; Zaghloul, T.I.; Feuk-Lagerstedt, E.; Taherzadeh, M.J. A Bacillus strain able to hydrolyze alpha-and beta-keratin. J. Bioprocess. Biotech. 2014, 4, 1–7. [Google Scholar] [CrossRef] [Green Version]
  78. Sharma, S.; Gupta, A. Sustainable management of keratin waste biomass: Applications and future perspectives. Braz. Arch. Biol. Technol. 2016, 59, 1–14. [Google Scholar] [CrossRef] [Green Version]
  79. Balliu, A.; Zheng, Y.; Sallaku, G.; Fernández, J.A.; Gruda, N.S.; Tuzel, Y. Environmental and cultivation factors affect the morphology, architecture and performance of root systems in soilless grown plants. Horticulturae 2021, 7, 243. [Google Scholar] [CrossRef]
  80. Gruda, N.; Schnitzler, W.H. Influence of wood fiber substrates and application rates on the growth of tomato transplants. Adv. Hortic. Sci. 1999, 13, 20–24. [Google Scholar]
  81. Vives-Peris, V.; De Ollas, C.; Gómez-Cadenas, A.; Pérez-Clemente, R.M. Root exudates: From plant to rhizosphere and beyond. Plant Cell Rep. 2020, 39, 3–17. [Google Scholar] [CrossRef] [PubMed]
  82. Helal, H.M.; Sauerbeck, D. Effect of plant roots on carbon metabolism of soil microbial biomass. Z. Für Pflanz. Und Bodenkd. 1986, 149, 181–188. [Google Scholar] [CrossRef]
Figure 1. Variation in cold-soluble mineral nitrogen (CW_MN), cold- and hot-water-soluble organic nitrogen (CW_ON and HW_ON), and organic nitrogen hydrolyzable in 0.005 and 1 M hydrochloric acid (0.005 HA_N and 1 HA_N) among the fourteen organic fertilizers in relation to the total nitrogen (asterisks indicate outliers).
Horticulturae 09 00767 g001
Figure 2. Variation in organic carbon hydrolyzable in 0.005 and 1 M hydrochloric acid (0.005 HA_C and 1 HA_C) and in total organic carbon (TOC) and organic carbon measured by pyrolytic combustion (POC) among the fourteen organic fertilizers in relation to the total nitrogen (asterisks indicate outliers).
Horticulturae 09 00767 g002
Figure 3. Variation in ratios of different carbon and nitrogen pools among the fourteen organic fertilizers (TOC = total organic carbon, TN = total nitrogen, TON = total organic nitrogen, CW_ON = cold-water-soluble organic nitrogen, HW_ON = hot-water-soluble organic nitrogen, 0.005 HA_ON = organic nitrogen hydrolyzable in 0.005 M hydrochloric acid, 1 HA_ON = organic nitrogen hydrolyzable in 1 M hydrochloric acid, 0.005 HA_C/ON = ratio of organic carbon and organic nitrogen hydrolyzable in 0.005 M hydrochloric acid, HA_C/ON = ratio of organic carbon and organic nitrogen hydrolyzable in 1 M hydrochloric acid; asterisks indicate outliers).
Horticulturae 09 00767 g003
Figure 4. Sum of squares (SSQ multiplied by 1000) for fitting of different kinetic models to the N release of the fourteen organic fertilizers (for details of kinetic models, refer to Table 1; numbers above box plots indicate the total sum of squares (TSSQ) for all fertilizers except OPF for each kinetic model; asterisks indicate outliers).
Horticulturae 09 00767 g004
Figure 5. Fitting of Gompertz growth function to the N release of the 14 organic fertilizers (rhombs mark measures values of mineral N and error bars indicate 2·SE at each date (n = 3); vertical dashed lines mark points E1 and E2 = days until start and end of nearly linear mineralization, and T = days until maximum mineralization rate) and parameters of the Gompertz function (NP = potentially mineralizable N in mg L−1, k, and h = rate constants in mg L−1 d−1), goodness of fit (SSQ = sum of the square of each fertilizer, R² = coefficient of determination), and days until the release of 90% of NP (N90).
Horticulturae 09 00767 g005
Figure 6. Correlations among parameters (a) NP, (b) k, and (c) h of Gompertz function and particular C and N pools (Pearson’s coefficient of correlation once calculated for all organic fertilizers with the exception of OPF (all) and a second time additionally without outliers according to Cook’s D (rout), which are plotted as void symbols and labeled with acronyms).
Horticulturae 09 00767 g006
Table 2. Correlations between total soluble and organic N pools for the fourteen organic fertilizers (Pearson’s correlation coefficient, numbers in brackets indicate significance levels).
Total N Soluble inOrganic N Soluble in
Cold WaterHot Water0.005 M HClCold WaterHot Water0.005 M HCl
Hot water0.98
(<0.01)
0.95
(<0.01)
0.005 M HCl0.94
(<0.01)
0.94
(<0.01)
0.92
(<0.01)
0.91
(<0.01)
1 M HCl0.01
(0.99)
−0.10
(0.75)
0.09
(0.76)
−0.09
(0.77)
−0.20
(0.48)
0.03
(0.91)
Table 3. Correlations among C/N ratios calculated from different C and N pools (TOC = total organic carbon, TN = total nitrogen, TON = total organic nitrogen, CW_ON = cold-water-soluble organic nitrogen, HW_ON = hot-water-soluble organic nitrogen, 0.005/1 HA C/ON = organic carbon/organic nitrogen hydrolyzable in 0.005/1 M hydrochloric acid) of the fourteen organic fertilizers (Pearson’s correlation coefficient, numbers in brackets indicate significance levels).
TOC/
TN
TOC/
TON
TOC/
CW_ON
TOC/
HW_ON
TOC/
0.005 HA_ON
TOC/
1 HA_ON
0.005 HA C/ON
TOC/TON0.98
(<0.01)
TOC/
CW_ON
−0.19
(0.51)
−0.29
(0.31)
TOC/
HW_ON
0.01
(0.99)
−0.08
(0.79)
0.90
(<0.01)
TOC/
0.005H A_ON
0.04
(0.88)
−0.03
(0.92)
0.77
(<0.01)
0.93
(<0.01)
TOC/
1 HA_ON
0.95
(<0.01)
0.99
(<0.01)
−0.34
(0.24)
−0.13
(0.67)
0.08
(0.80)
0.005 HA_C/ ON0.76
(<0.01)
0.71
(<0.01)
0.33
(0.25)
0.54
(0.04)
0.46
(0.10)
0.66
(0.01)
1 HA_C/ON0.98
(<0.01)
0.98
(<0.01)
−0.25
(0.39)
−0.04
(0.96)
−0.01
(0.96)
0.96
(<0.01)
0.77
(<0.01)
Disclaimer/Publisher’s Note: The statements, opinions and data contained in all publications are solely those of the individual author(s) and contributor(s) and not of MDPI and/or the editor(s). MDPI and/or the editor(s) disclaim responsibility for any injury to people or property resulting from any ideas, methods, instructions or products referred to in the content.

