Article

Quantification and Prediction with Near Infrared Spectroscopy of Carbohydrates throughout Apple Fruit Development

1
Mountain Horticultural Crops Research and Extension Center, Department of Horticultural Sciences, North Carolina State University, Mills River, NC 28759, USA
2
Plants for Human Health Institute, Department of Horticultural Sciences, North Carolina State University, Kannapolis, NC 28081, USA
*
Author to whom correspondence should be addressed.
Horticulturae 2023, 9(2), 279; https://doi.org/10.3390/horticulturae9020279
Submission received: 12 January 2023 / Revised: 6 February 2023 / Accepted: 11 February 2023 / Published: 18 February 2023
(This article belongs to the Special Issue Research Advances in Horticultural Crop Physiology and Stress)

Abstract

:
Carbohydrates play a key role in apple fruit growth and development. Carbohydrates are needed for cell division/expansion, regulate fruitlet abscission, and influence fruit maturation and quality. Current methods to quantify fruit carbohydrates are labor intensive and expensive. We quantified carbohydrates throughout a growing season in two cultivars and evaluated the use of near infrared spectroscopy (NIR) to predict apple carbohydrate content throughout changes in fruit development. Carbohydrates were quantified with high performance liquid chromatography (HPLC) at five timepoints between early fruitlet growth and harvest in ‘Gala’ and ‘Red Delicious’ apples. NIR spectra was collected for freeze-dried fruit samples using a benchtop near infrared spectrometer. Sorbitol was the major carbohydrate early in the growing season (~40% of total carbohydrates). However, the relative contribution of sorbitol to total carbohydrates rapidly decreased by 59 days after full bloom (<10%). The proportion of fructose to total carbohydrates increased throughout fruit development (40–50%). Three distinct periods of fruit development, early, mid-season, and late, were found over all sampling dates using principal component analysis. The first (PC1) and second (PC2) principal components accounted for 90% of the variation in the data, samples separated among sampling date along PC1. Partial least squares regression was used to build the models by calibrating carbohydrates quantified with HPLC and measured reflectance spectra. The NIR models reliably predicted the content of fructose, glucose, sorbitol, sucrose, starch, and total soluble sugars for both ‘Gala’ and ‘Red Delicious’; r2 ranged from 0.60 to 0.96. These results show that NIR can accurately estimate carbohydrates throughout the growing season and offers an efficient alternative to liquid or gas chromatography.

1. Introduction

Carbohydrates are critical for apple fruit growth, abscission, quality at harvest, and storage life [1,2,3,4,5]. Carbohydrate shortage has been identified as a key signal in the cascade of events that lead to fruitlet abscission [3,5]. Early reduction of crop load increases carbohydrate availability and size of remaining fruit [1]. Carbohydrates continue to play a role following harvest, as dry matter content at harvest influence soluble solids content following fruit storage [4].
Carbohydrate reserves stored in roots and woody tissues support development in early spring [6,7]. As stored carbohydrates are exhausted after the bloom phase, early fruit growth is supported by spur leaves [8]. Apples and other fruit have limited photosynthetic capacity, primarily relying on imported carbohydrates for metabolism [9]. Carbohydrates are most limiting early in the season as the pool of produced carbohydrates is relatively low and there are newly developing shoots and fruits are competing for carbohydrates along with roots and storage tissues [8,10]. Bourse shoot leaves become an increasingly larger contributor of carbohydrates as the growing season continues (Figure 1). Extension shoots (those developing from the terminal bud of the main branch) begin to export carbohydrates to fruit once 10–12 leaves have fully expanded [8]. Carbohydrates are transported to actively growing shoot tips until the terminal bud is set, typically within a couple of months after bloom. Fruit are a major sink for carbohydrates until they are harvested. Carbohydrates are transported to support root growth and respiration throughout the growing season. Following harvest, most carbohydrates are transported to roots and storage tissue to support respiration during dormancy [11].
The primary carbohydrate translocated to apple fruit is sorbitol, a sugar-alcohol, which is then metabolized into fructose, galactose, glucose, myo-inositol, raffinose, stachyose, starch, or sucrose in the fruit [2,10]. For the first three weeks after bloom, carbohydrates fuel cell division. Accumulation of sugars in the vacuole supports cell expansion by creating osmotic pressure, pulling water into the cell. Starches and organic acids are stored during mid-season fruit growth for use in fruit maturation and ripening. Carbohydrates also provide the carbon source for amino acids and secondary metabolites [12] that aid development of aroma and flavor volatiles.
Environmental, physiological, and genetic factors contribute to variability in apple fruit carbohydrate levels. ‘McIntosh’, ‘Gala’, and ‘Mutsu’ fruit positioned in sun-exposed portions of the canopy had lower starch, sorbitol and sucrose levels than interior, shaded, fruit [13]. Sun exposed fruit had correspondingly higher levels of glucose and fructose than interior fruit [13]. The increased sugars of sun-exposed fruit may result from higher metabolic rates and carbohydrate transport from leaves with higher rates of photosynthesis [13].
Apple fruits develop from clusters of 5–6 flowers (Figure 1). The central (king) flower blooms first and is developmentally advanced relative to the lateral fruitlets. King fruitlets have higher levels of carbohydrates compared to lateral fruitlets at bloom [14], and these early differences in carbohydrate availability and growth rates can lead to larger fruit at harvest [1]. Additionally, carbohydrate levels vary within the fruit tissue. Starch, glucose, and sucrose levels were found to be higher in the peel than in the cortex [13], while sorbitol concentrations are lower in the cortex than in the pith throughout fruit development [2].
Carbohydrate levels vary among cultivars. Feng et al. [13] found that ‘McIntosh’ apples had lower concentrations of starch, but higher glucose and fructose than ‘Gala’ and ‘Mutsu’ at harvest. In a comparison of seven apple cultivars, total soluble carbohydrates ranged between 615–716 g kg−1 dry matter [15]. A general inverse relationship was found between sucrose and glucose/fructose levels, as cultivars with higher levels of sucrose at harvest had lower levels of glucose and fructose [15].
Jing and Malladi [2] used principal component analysis to identify three distinct periods of fruit development in ‘Golden Delicious’ metabolite concentration. These periods were defined in respect to days after full bloom (DAFB) and categorized as early (11–37 DAFB); middle (37–58 DAFB); and late (58–118 DAFB) fruit development. Changes in concentration of fructose, glucose and sorbitol contributed most to these temporal groupings [2]. In ‘Honeycrisp’, a rapid decrease in fruit sorbitol content was found over the growing season [16]. In contrast, fructose and sucrose concentration increased throughout the growing season, while starch reached a maximum at and then rapidly decreased ~7 weeks before harvest.
The multiple factors affecting type and amount of apple fruit carbohydrates poses challenges when designing studies, as sugar extraction, identification, and quantification by wet chemistry is laborious and costly. Efforts to provide low-cost, efficient methods to study carbohydrates rely on reflectance spectroscopy that relate the absorbance of light by carbohydrates to the prediction of their quantity in a sample. Organic constituents and water absorb light differentially in these wavelengths and statistical models can be developed to estimate constituent quantity of a sample based on differences in reflectance/transmittance. The multivariate regression techniques of principal component regression, partial least squares regression (PLS), or artificial neural networks are typically used to “calibrate” NIR spectra to a destructive measurement [17].
Several spectroscopic methods have been evaluated for application in fruit. Fourier-transformed infrared spectroscopy accurately estimated individual carbohydrate content in multiple fruit juices [18]. An iodine stain was used to improve detection of starch in woody with visible light spectroscopy [19]. Near infrared spectroscopy (NIRs) has been used as a method to predict non-structural carbohydrate levels efficiently and rapidly in multiple tree tissue types (e.g., woody and leaf) [14,20]; protein, water, and oil content of soybean seeds [21]; and dry matter content in many fruit species [22]. NIRs measures the reflectance or transmittance spectra of a sample with wavelengths between ~780 to 2600 nm. NIR has accurately predicted apple vitamin C, polyphenol, and soluble solids content in mature fruit of 37 cultivars [23]. NIR models have also been built to predict individual carbohydrates, including glucose, xylose, sucrose, and fructose, in ‘Braeburn’ and ‘Cripps Pink’ at harvest and throughout fruit storage [24]. Collectively, these works show the utility of spectroscopy to predict plant constituents in a range of situations.
Development of NIR models to predict carbohydrate content throughout the growing season for multiple cultivars offers a more efficient method to study apple carbohydrate content. The goals of this study were to: (1) quantify carbohydrates throughout a growing season in two cultivars and (2) develop robust NIR models that could be to predict carbohydrate content. To the best of our knowledge, NIR models to predict carbohydrate content throughout the growing season for multiple apple cultivars have not been developed. In this study, carbohydrates in apple fruit of two cultivars at five sampling dates and two fruit cluster positions were quantified by high performance liquid chromatography (HPLC). The NIR models were developed by calibrating NIR spectra and carbohydrates obtained from HPLC. The models were evaluated by model statistics.

2. Materials and Methods
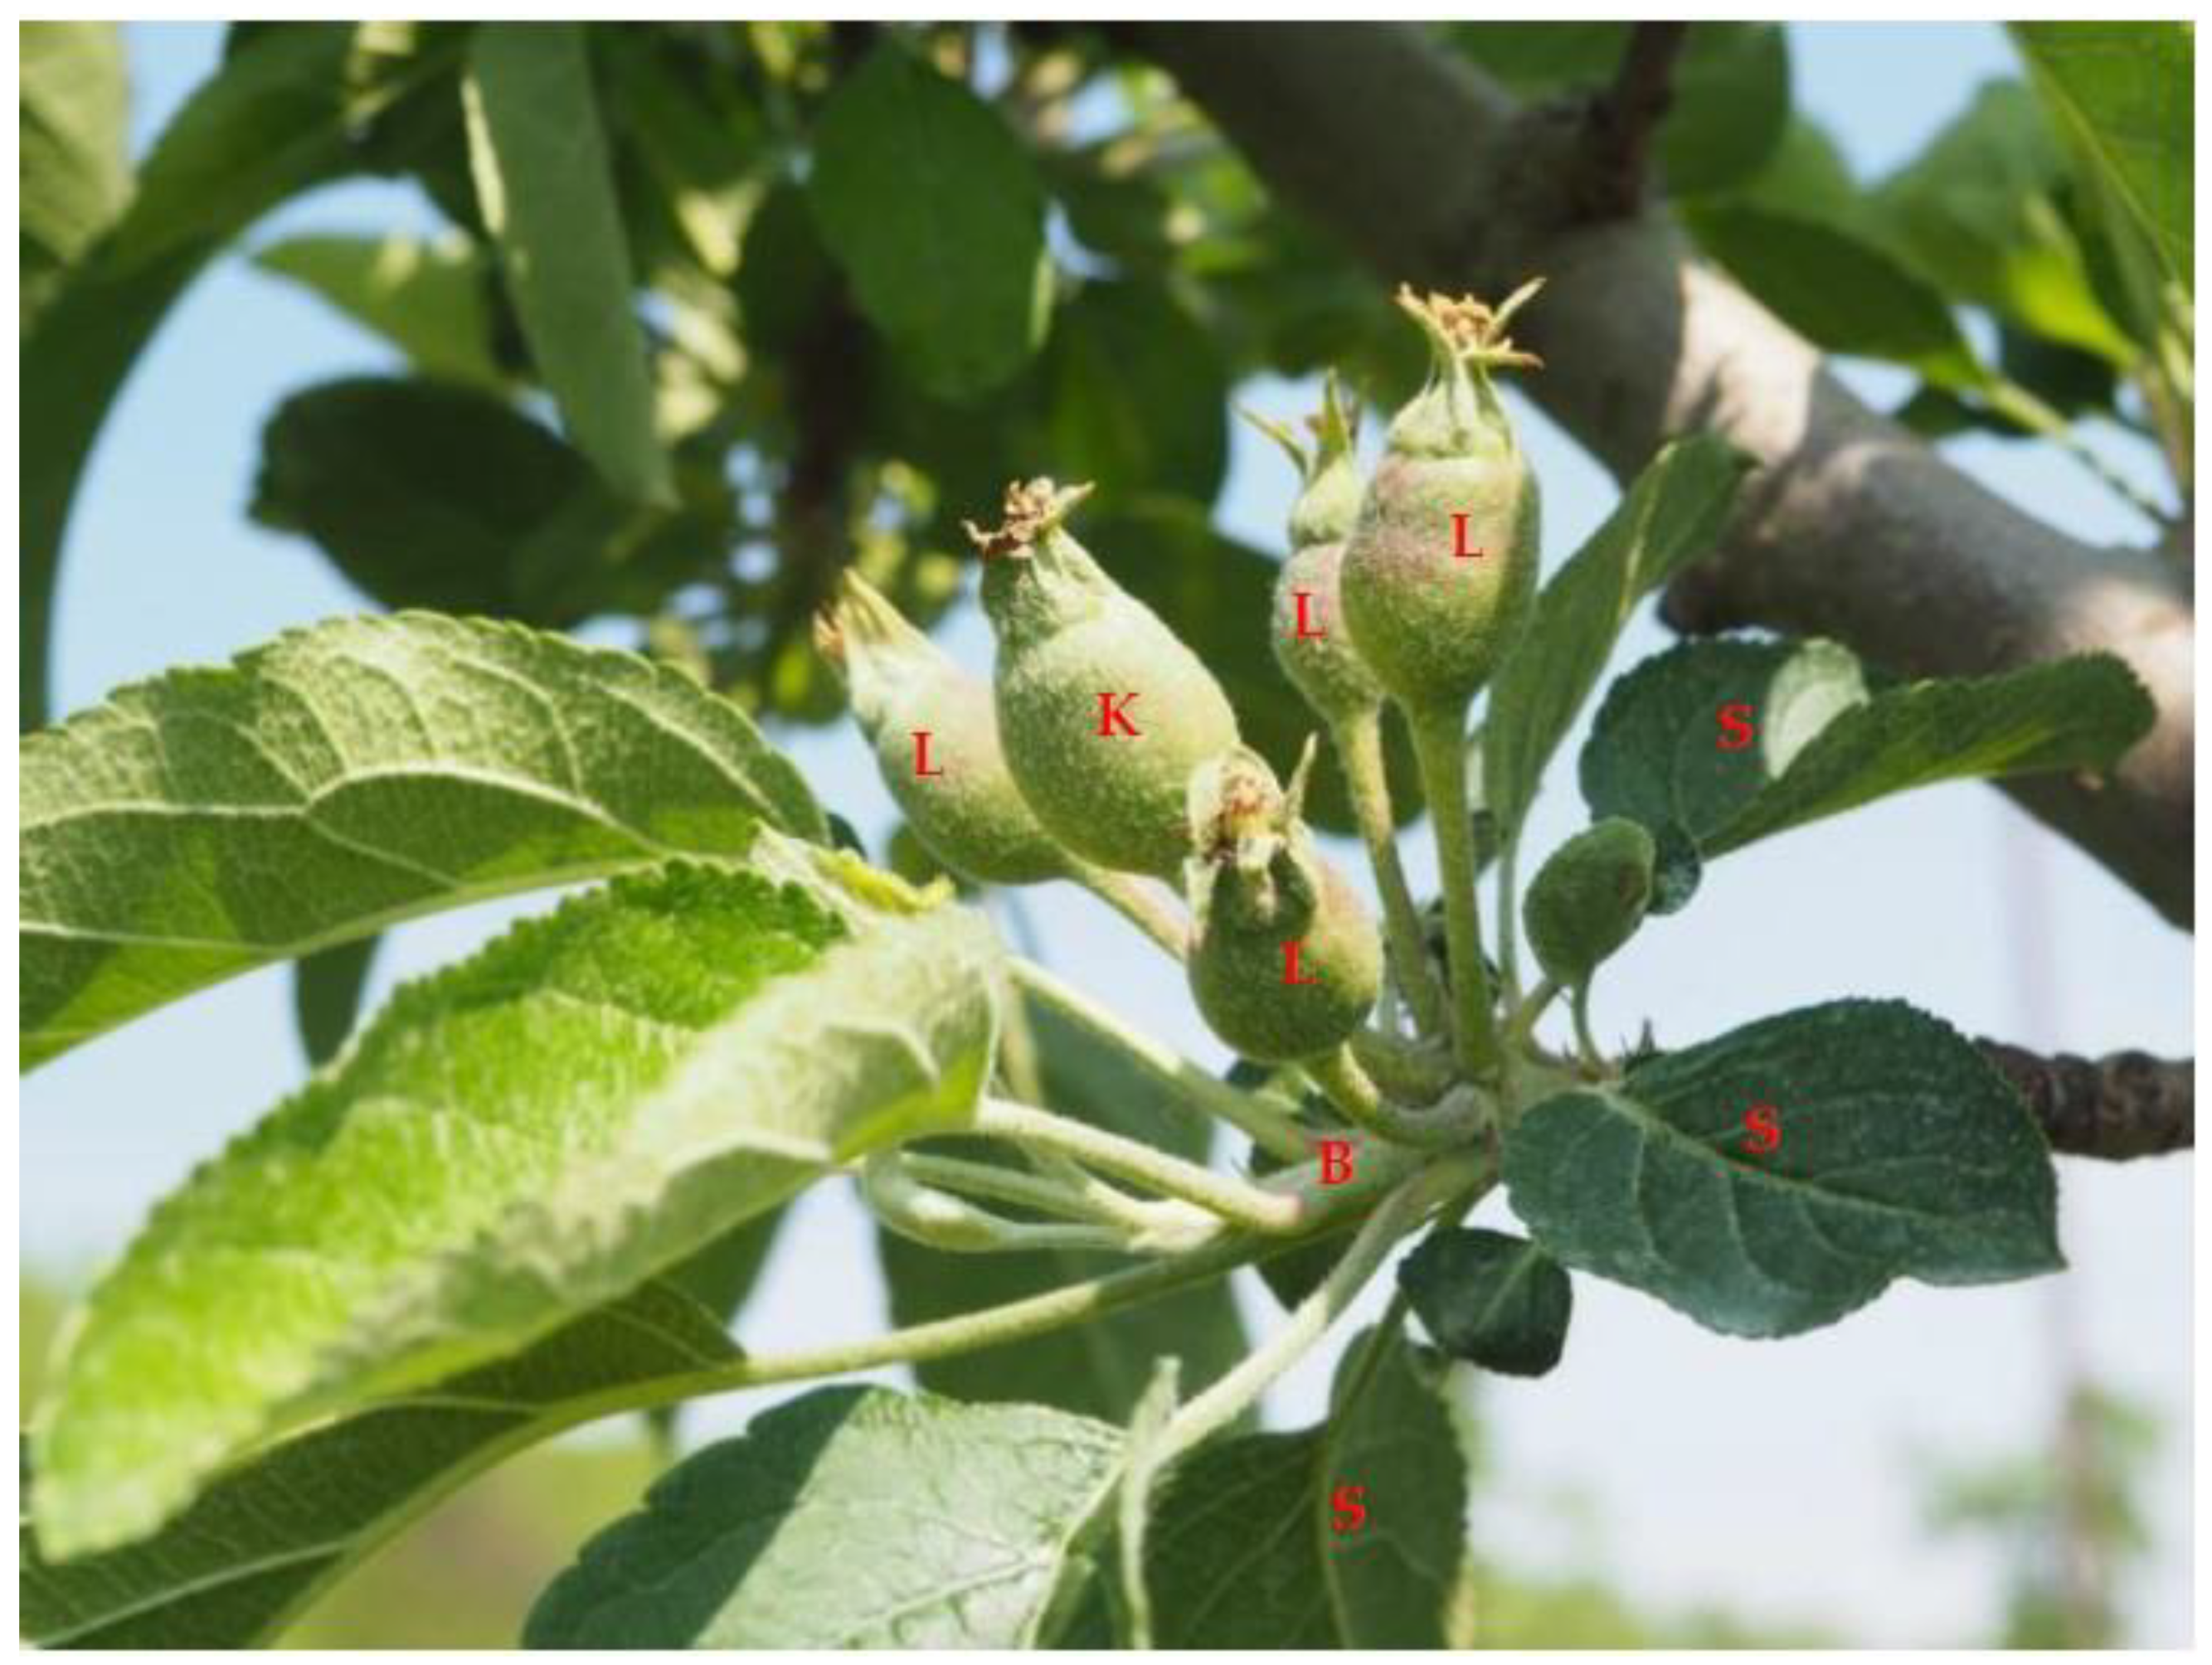
2.1. Plant Material

All fruit were collected from mature ‘Red Delicious Oregon Spur II’/‘MM.111′ and ‘Ultima Gala’/‘M.9′ trees at North Carolina State University’s Mountain Horticultural Research and Extension Center in Mills River, NC (35.3884° N, 82.5668° W). ‘Red Delicious’ and ‘Gala’ blocks were eighteen and seven years old, respectively. Full bloom date was 7 April 2020 for both cultivars. Trees were maintained in accordance with local recommendations. In 2020, twenty king and twenty lateral fruits were randomly collected throughout each block for each cultivar on 28 April, 6 May, 2 June, 13 July, and 4 August. There were no ‘Red Delicious’ king fruits collected on June 2 and no ‘Red Delicious’ collected on 4 August. Sampling dates are summarized in Table 1. Upon collection, fruit were punctured with a dissecting needle in multiple positions to aid in freeze-drying, stored at −20 °C then transported to Plant for Human Health Institute, Kannapolis NC on ice. Samples were held at −80 °C overnight, then freeze dried (VirTis LyoTroll, SP Scientific, Warminster, PA, USA).

2.2. Near Infrared Spectroscopy and Carbohydrate Quantification

NIR spectra from 3594 to 12,489 cm−1 were collected with a FT-NIR Spectrometer (Multipurpose Analyzer (MPA); Bruker Optics, Billerica, MA, USA) in reflectance mode. The MPA was equipped with an integrating sphere to provide diffuse reflectance measurements and was controlled by OPUS software version 7.5.18 (Bruker Optics, Billerica, MA, USA). More than 3 g of the frozen dried powder was transferred into NIR glass vials (I17723; Bruker Optics, Billerica, MA, USA) and measured with resolution of 16 cm−1 and 64 scans. Spectral measurement was obtained at room temperature (22–23 °C) and 35–40% relative humidity.
For the first three harvest dates, freeze-dried whole fruit were crushed in plastic bags and transferred to 50 mL centrifuge tubes. Two 9 mm stainless steel balls were added, and material was ground to a fine powder using a genogrinder (SPEX 2010, Metuchen, NJ, USA). Fruit powders were combined, and 3 g of tissue measured into glass vials for NIR analysis. For later harvest dates where apples were larger, each freeze-dried apple’s spectra was captured with NIR, then 0.8 cm plug of cortex material was removed with a cork borer, samples ground and measured on NIR as described above.
Soluble sugars (fructose, sucrose, glucose) and starch were extracted from 0.01 g of powdered sample using a hot ethanol extraction method [25]. Starch was analyzed by enzymatic digestion to glucose using α-amylase (Ref 10102914001; Sigma-Aldrich, St. Louis, MO, USA) and α-amyloglucosidase (A4720–25MG; Sigma-Aldrich, St. Louis, MO, USA) [25]. The glucose was analyzed by HPLC and expressed as glucose equivalents. Sugar and starch identification and quantification was done by HPLC (Hitachi LaChrom, Hitachi Ltd., Tokoyo, Japan), following the method outlined in [26]. Briefly, the HPLC system was equipped with a refractive index detector, controlled temperature auto sampler (4 °C), and column compartment (65 °C). A Rezex RCM-Monosaccharide Ca + 2 (8%), OOH0130-KO column with Carbo-Ca 4 × 3.0 mm ID, AJO4493 guard cartridge (Phenomenex) was used to separate sugars using a distilled deionized water mobile phase at a flow rate of 0.6 mL min−1.

2.3. Statistical Analyses

One-way analysis of variance (ANOVA) was used to identify significant differences between king and lateral fruits within each cultivar and sampling date combination. Principal components analysis (PCA) was conducted on concentration of individual carbohydrates from each sample (two cultivars, two cluster positions, and five sampling dates). Principal components were calculated using the PCA function in FactoMineR package in RStudio (21; Version 3.6.0). Principal components analysis (PCA) was done on concentration of individual carbohydrates from each sample (two cultivars, two cluster positions, and five sampling dates). NIR models were built by calibrating NIR spectra against carbohydrate content with partial least squares (PLS) regression [27].

3. Results and Discussion

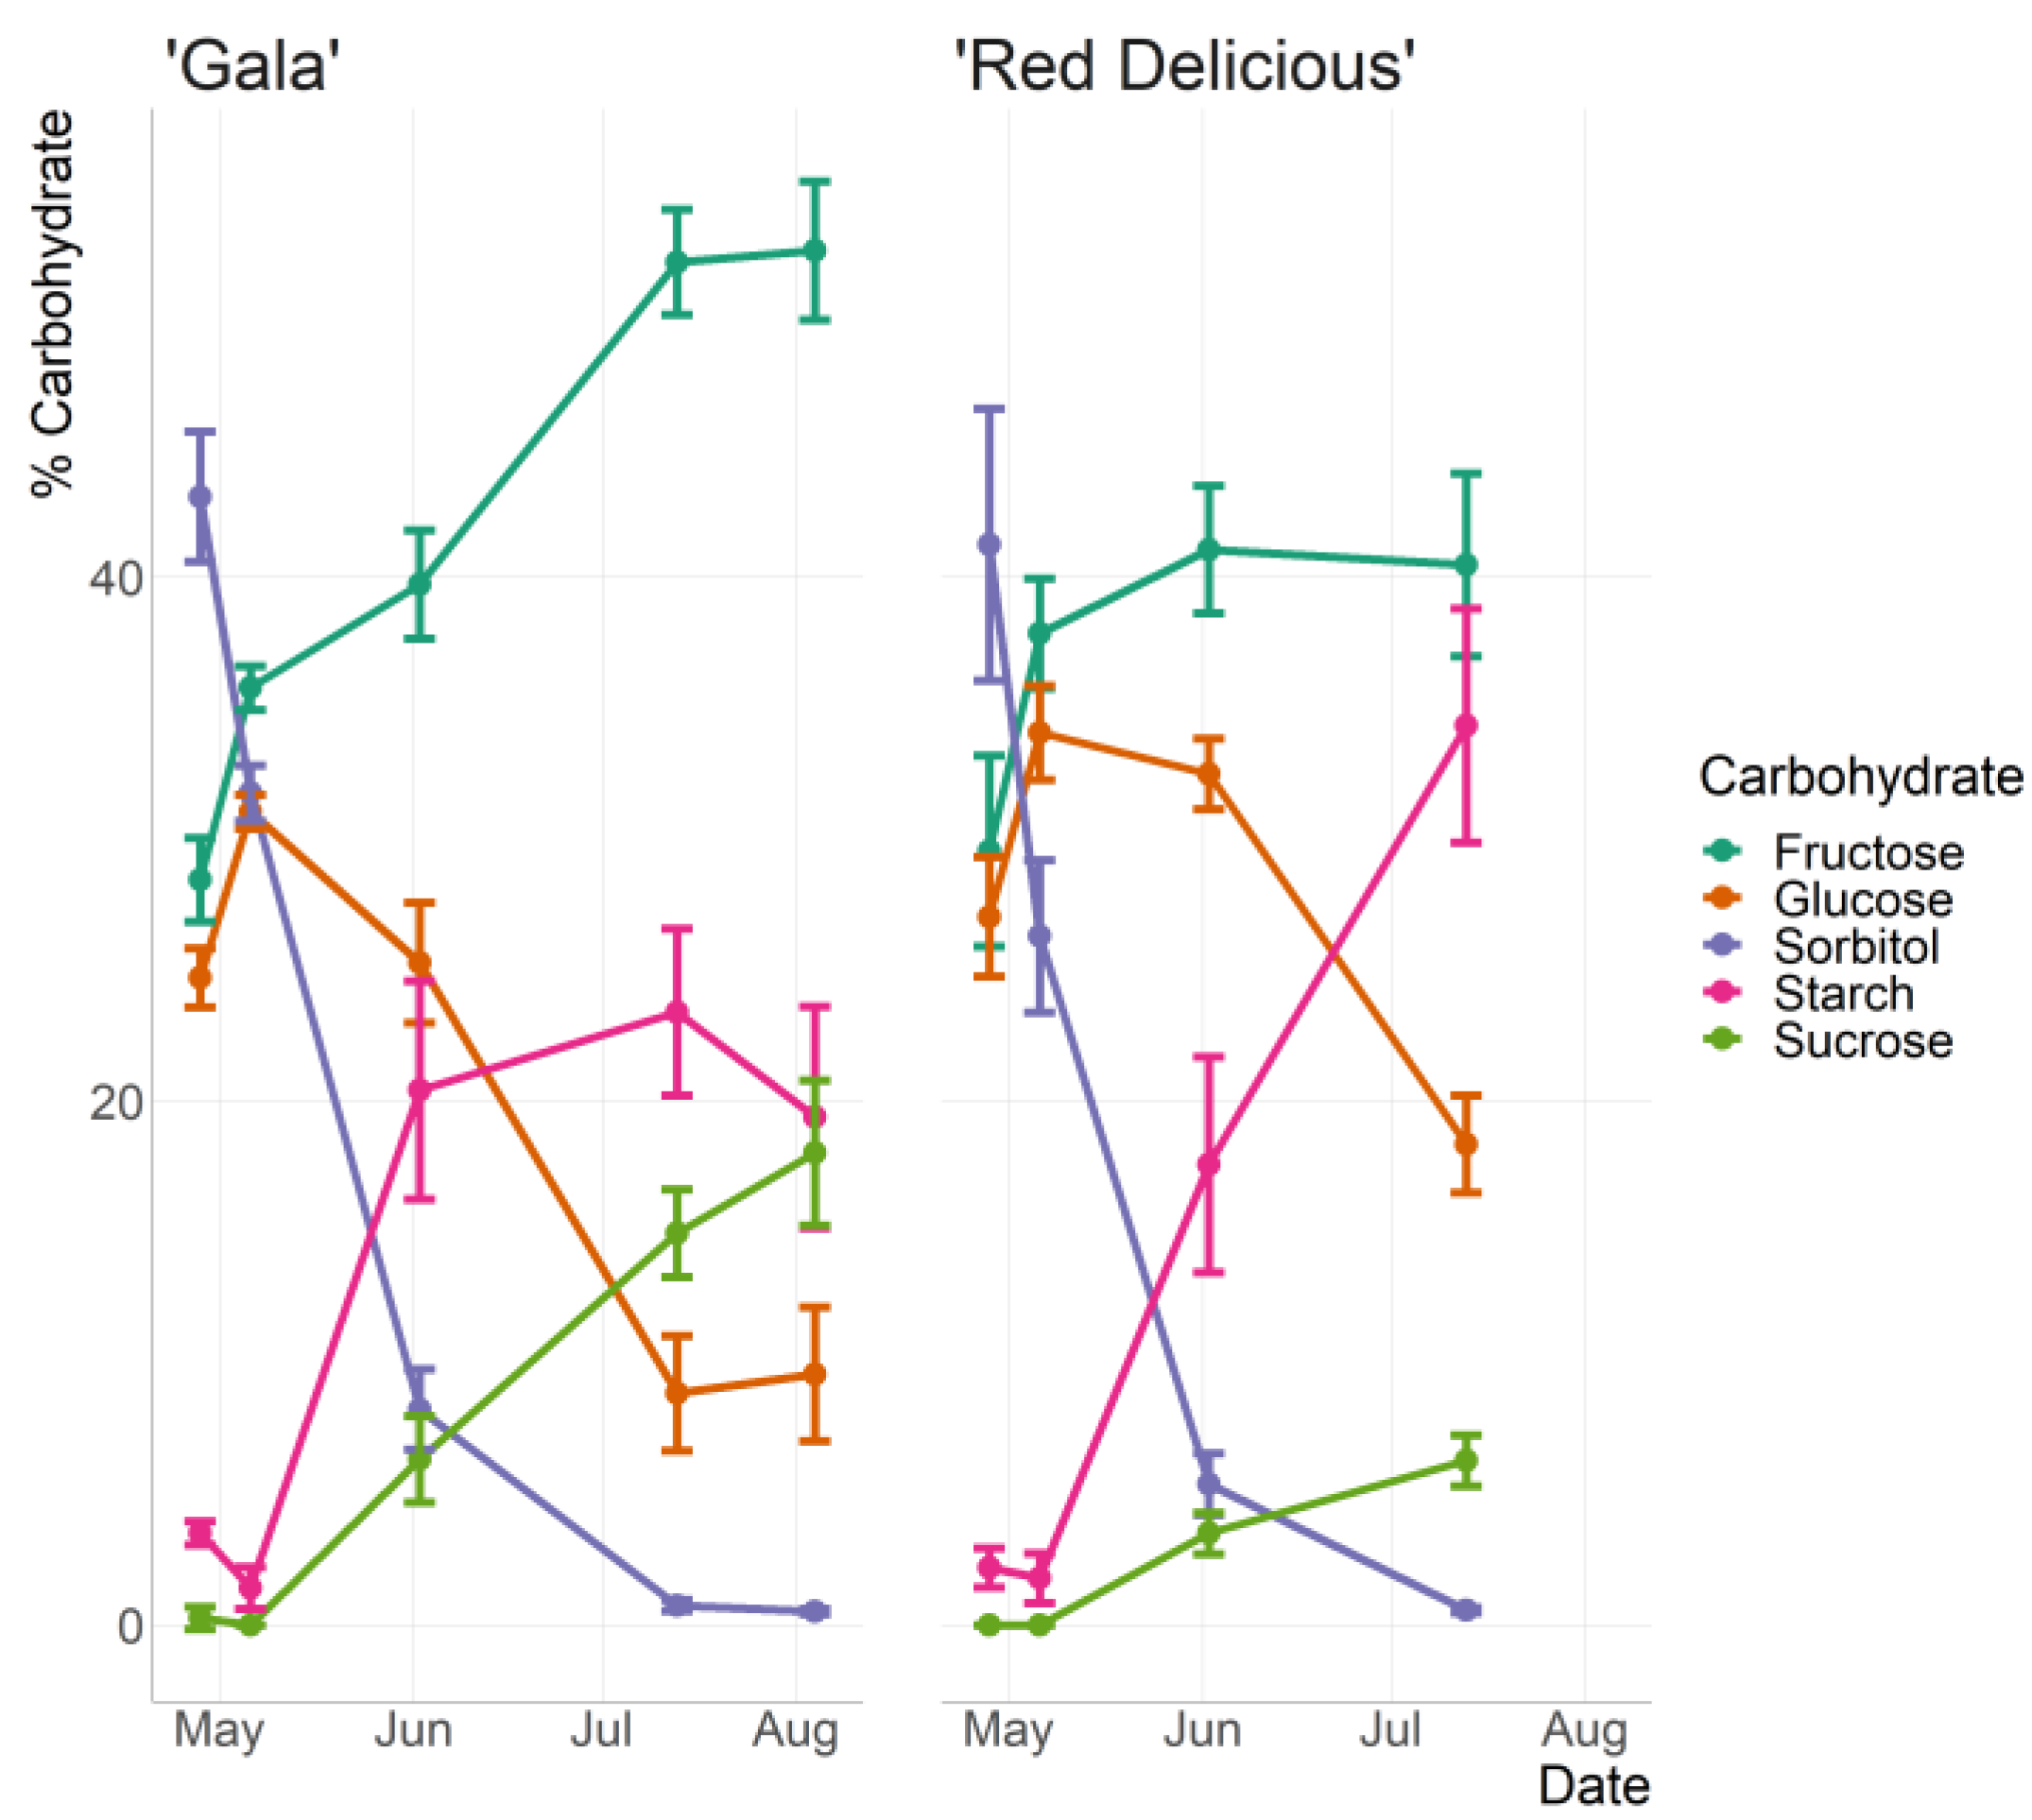
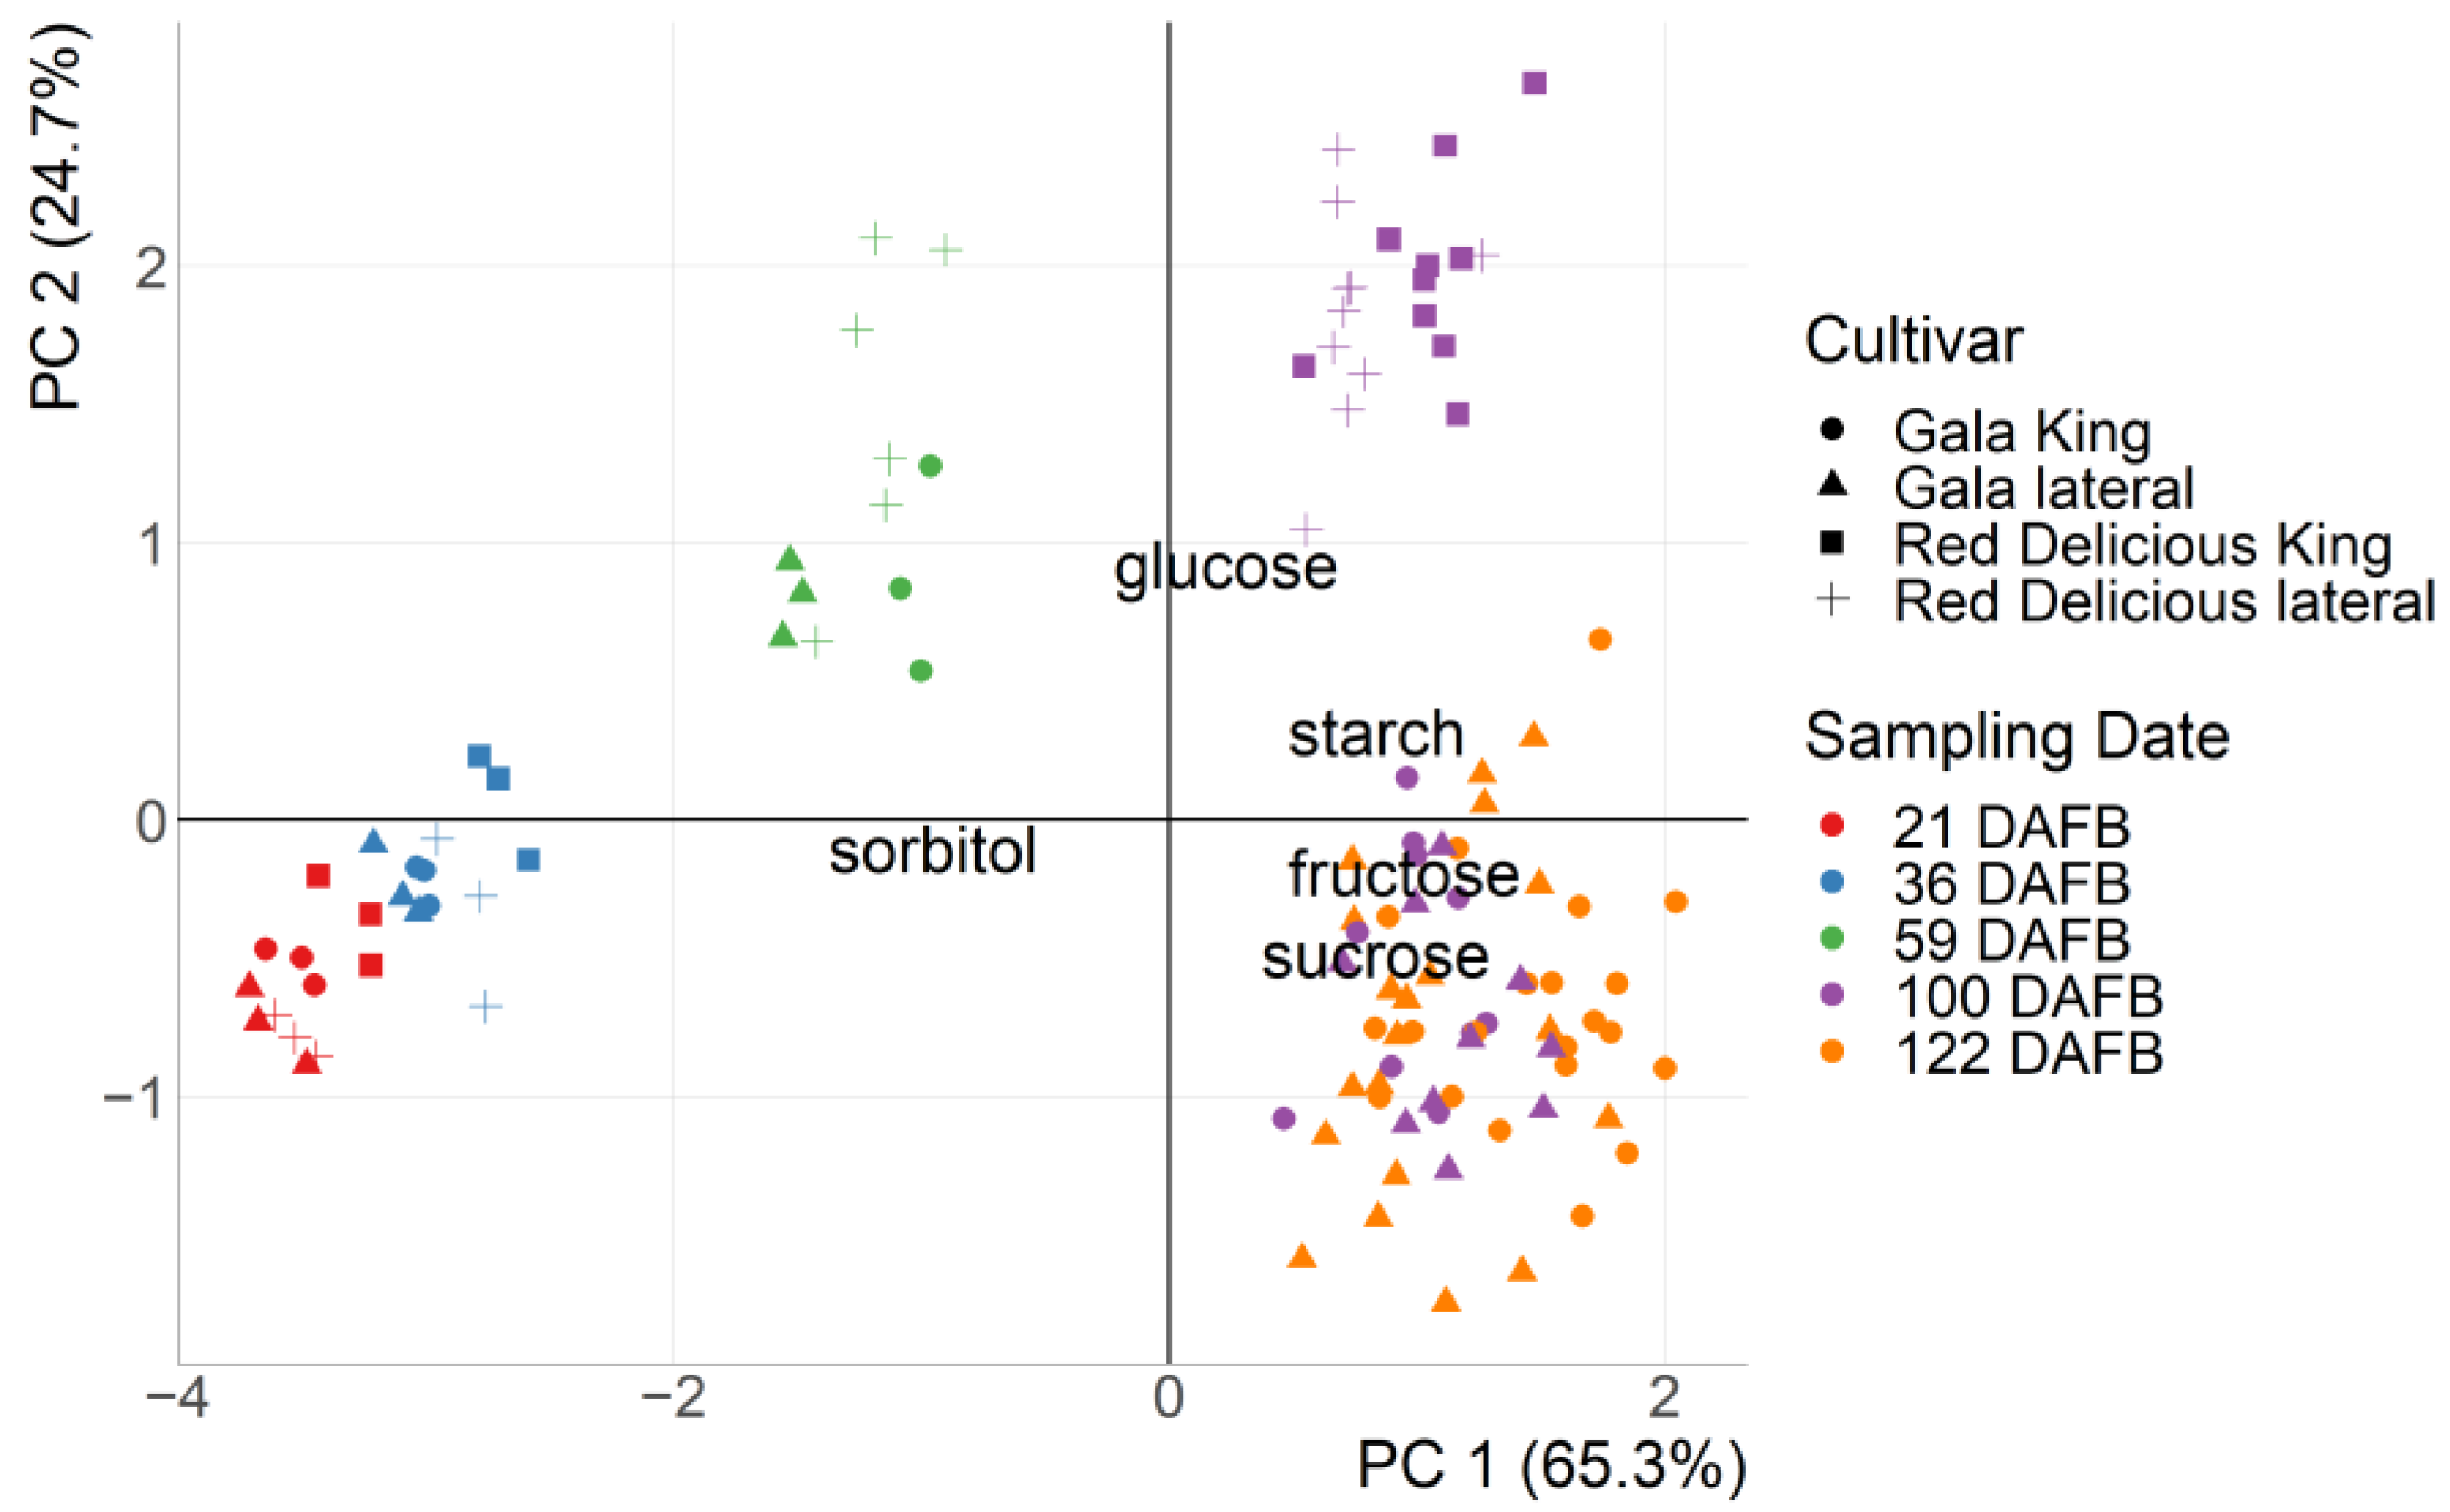
3.1. Measured Carbohydrate Content with HPLC

‘Red Delicious’ and ‘Gala’ had similar patterns of accumulation of individual carbohydrates using HPLC data (Figure 2). Sorbitol was the main carbohydrate during early fruit development, accounting for ~40% of total carbohydrates (Figure 2). Sorbitol levels then rapidly decreased in the remaining sampling dates. In contrast, fructose and sucrose increased throughout the growing season, with fructose the primary constituent from June until the last sampling date. Although glucose content increased for ‘Red Delicious’ with sampling date, it remained mostly constant for ‘Gala’ (Table 2). Starch levels increased for both cultivars until July, then began to degrade for ‘Gala’ (Table 2). ‘Gala’ was ripe by the last sampling date; a similar starch degradation pattern might have been seen just before harvest for the later ripening ‘Red Delicious’. Similar trends in individual carbohydrates throughout the growing season for ‘Golden Delicious’ [2], ‘Greensleeves’ [28], ‘Honeycrisp’ [16], and ‘McIntosh’ [29].
Carbohydrate content was similar between fruit position (king vs. lateral) within sampling dates and cultivar for all but a few instances (Table 2). Starch concentrations were higher for king fruit at 36 and 59 DAFB for ‘Gala’ and 21 and 100 DAFB for ‘Red Delicious’. ‘Gala’ lateral fruit had higher starch levels at 100 DAFB. ‘Red Delicious’ king fruit collected on 21 DAFB had higher fructose and glucose concentrations than lateral fruit. Sucrose levels were higher in ‘Gala’ king fruit compared to lateral fruit at 59 and 122 DAFB. Inconsistent carbohydrate differences between king and lateral fruit throughout development align with previous results [11]. Early in fruit development carbohydrates are consumed to support cell division and accumulate to drive cell expansion. The higher levels of glucose and fructose at 21 DAFB in king ‘Red Delicious’ fruit may signal higher cell expansion rates than in lateral fruit at this stage.
Principal component analysis (PCA) was used to analyze carbohydrate composition between two cultivars, five sampling dates, and two fruit positions in the spur. Ninety percent of the variance was explained by the principal components PC1 (65.3%) and PC2 (24.7%) that were derived from PCA. Variations among sampling dates accounted for the major separations in data, separated across PC1 (Figure 3). The data grouped into three areas consisting of: (1) 21 and 36 DAFB (early fruit development; EFD); (2) 59 DAFB (mid-fruit development; MFD); (3) 100 and 122 DAFB (late fruit development; LFD). Cultivars had minimal differences for EFD and MFD; the difference between cultivars expanded LFD. These three temporal phases of fruit development align with results of Jing and Malladi in ‘Golden Delicious’ [2] and distinct periods of metabolism in multiple fruit species [30,31]. Accordingly, the nomenclature for EFD, MFD, and LFD is borrowed from Jing and Malladi [2]. In this study and that of Jing and Malladi [2], fruit were grown in the Southern Appalachian region of the United States, which is the southern commercial most apple growing region in North America. Other growing regions, particularly those with cooler nights than in the Southern Appalachian region, may have lengthened ripening periods and a different temporal pattern of carbohydrate composition.
Sorbitol contributed most to variations along PC1 (Figure 3). The clear separation of sorbitol from glucose, starch, fructose, and sucrose along PC1, which is the axis associated with variations throughout the season, supports the finding that sorbitol is the major constituent during EFD and then rapidly decreases. This temporal separation of sorbitol from the other carbohydrates analyzed in this study was also reported by Jing and Malladi [2]. Individual carbohydrates, aside from sorbitol, separated along PC2 (Figure 3). Glucose contributed most to PC2 and was clearly separated from fructose and sucrose, which clustered together (Figure 3). This finding differs from Jing and Malladi [2], who found greater separation of sucrose from glucose and fructose along PC2 in ‘Golden Delicious’. The relative contribution of fructose, glucose, and sucrose to total carbohydrates appears to differ among apple cultivars. Suni et al. [15] found that seven apple cultivars with high levels of sucrose at harvest had low glucose/fructose, while those higher in glucose/fructose had lower sucrose. This variation in the inverse relationship between sucrose and glucose/fructose between cultivars may contribute to the discrepancy between the Jing and Malladi [2] and the current study in the relative contribution of sucrose and glucose to temporal patterns in carbohydrate content.
During LFD, cultivars separated along PC2. At 100 DAFB there is a clear separation along PC2 of ‘Gala’ and ‘Red Delicious’. From the loading plot, glucose is contributing most to variation along PC2. Glucose and starch concentrations at 100 DAFB are most likely contributing to separation of cultivars at this time point (Figure 3). At 100 DAFB, concentrations of glucose and starch were ~ 132 and 250 mg × g−1DW for ‘Red Delicious’ compared to ~ 66 and 170 mg × g−1DW, respectively, for ‘Gala’ (Table 2). We hypothesize that this is mainly due to early degradation of starch and glucose in the earlier ripening ‘Gala’. These temporal patterns in carbohydrates signals that prediction of carbohydrates destructively or non-destructively with NIR would be a valuable tool to forecast apple maturity date.

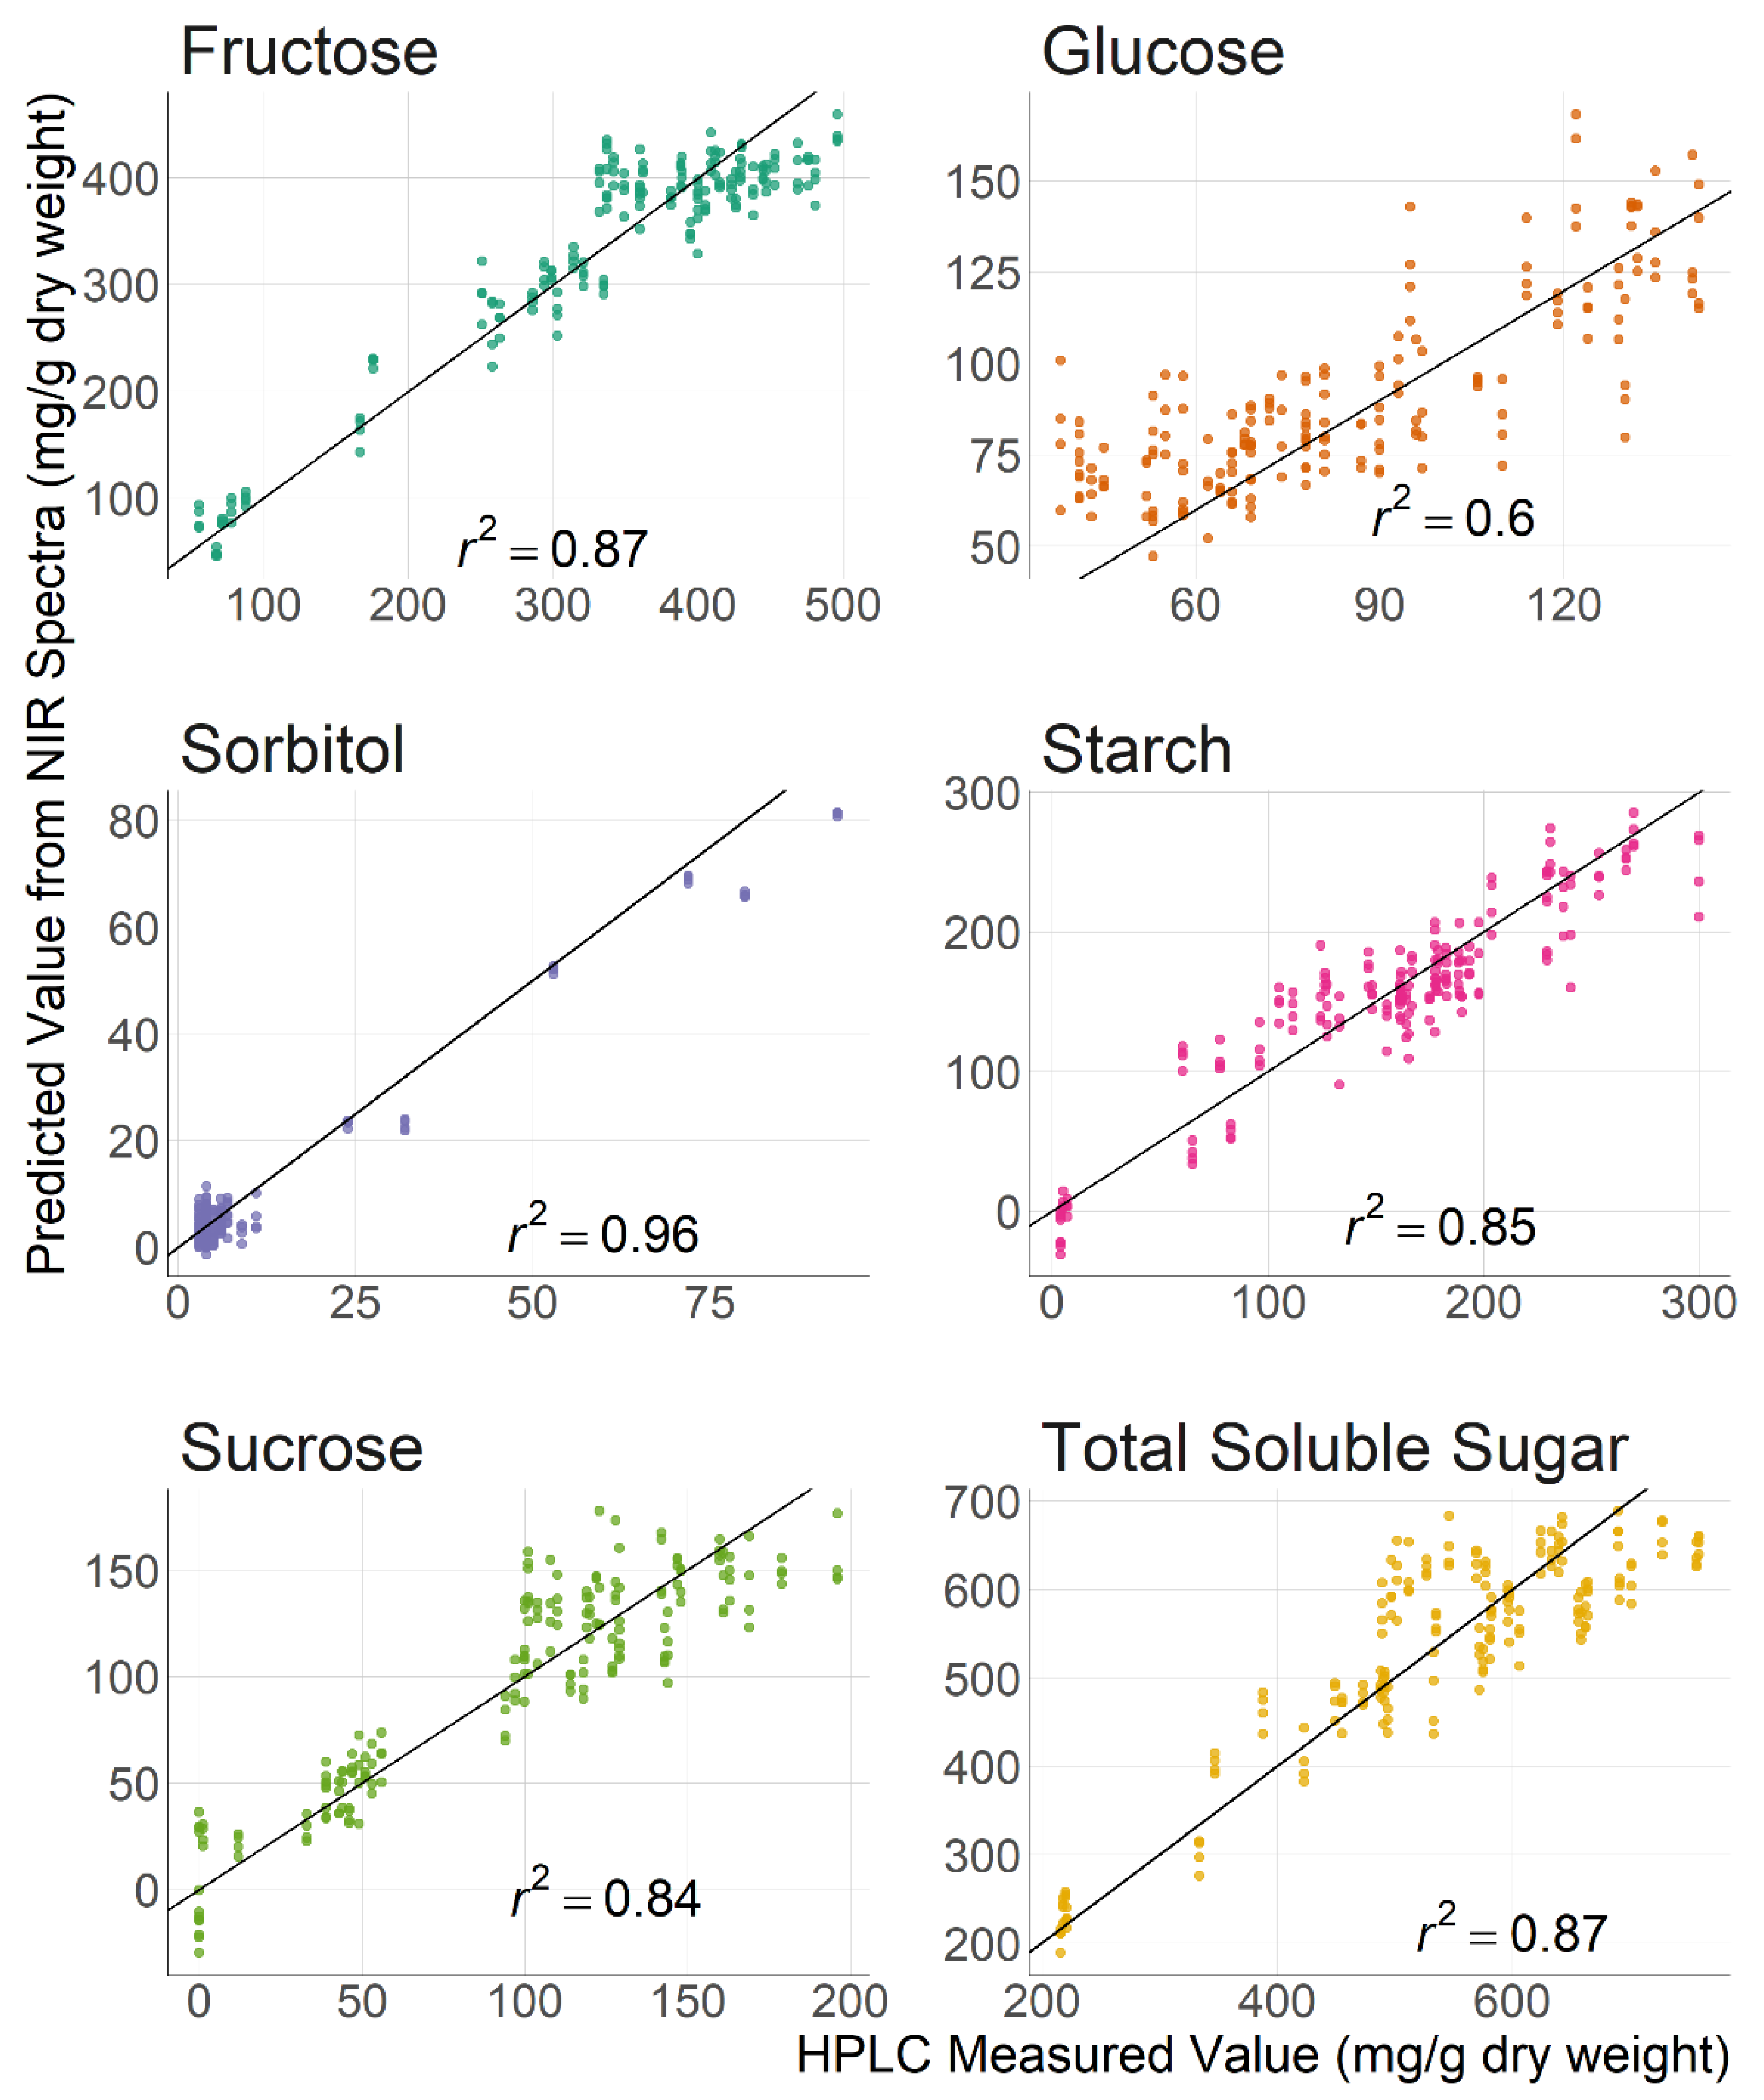
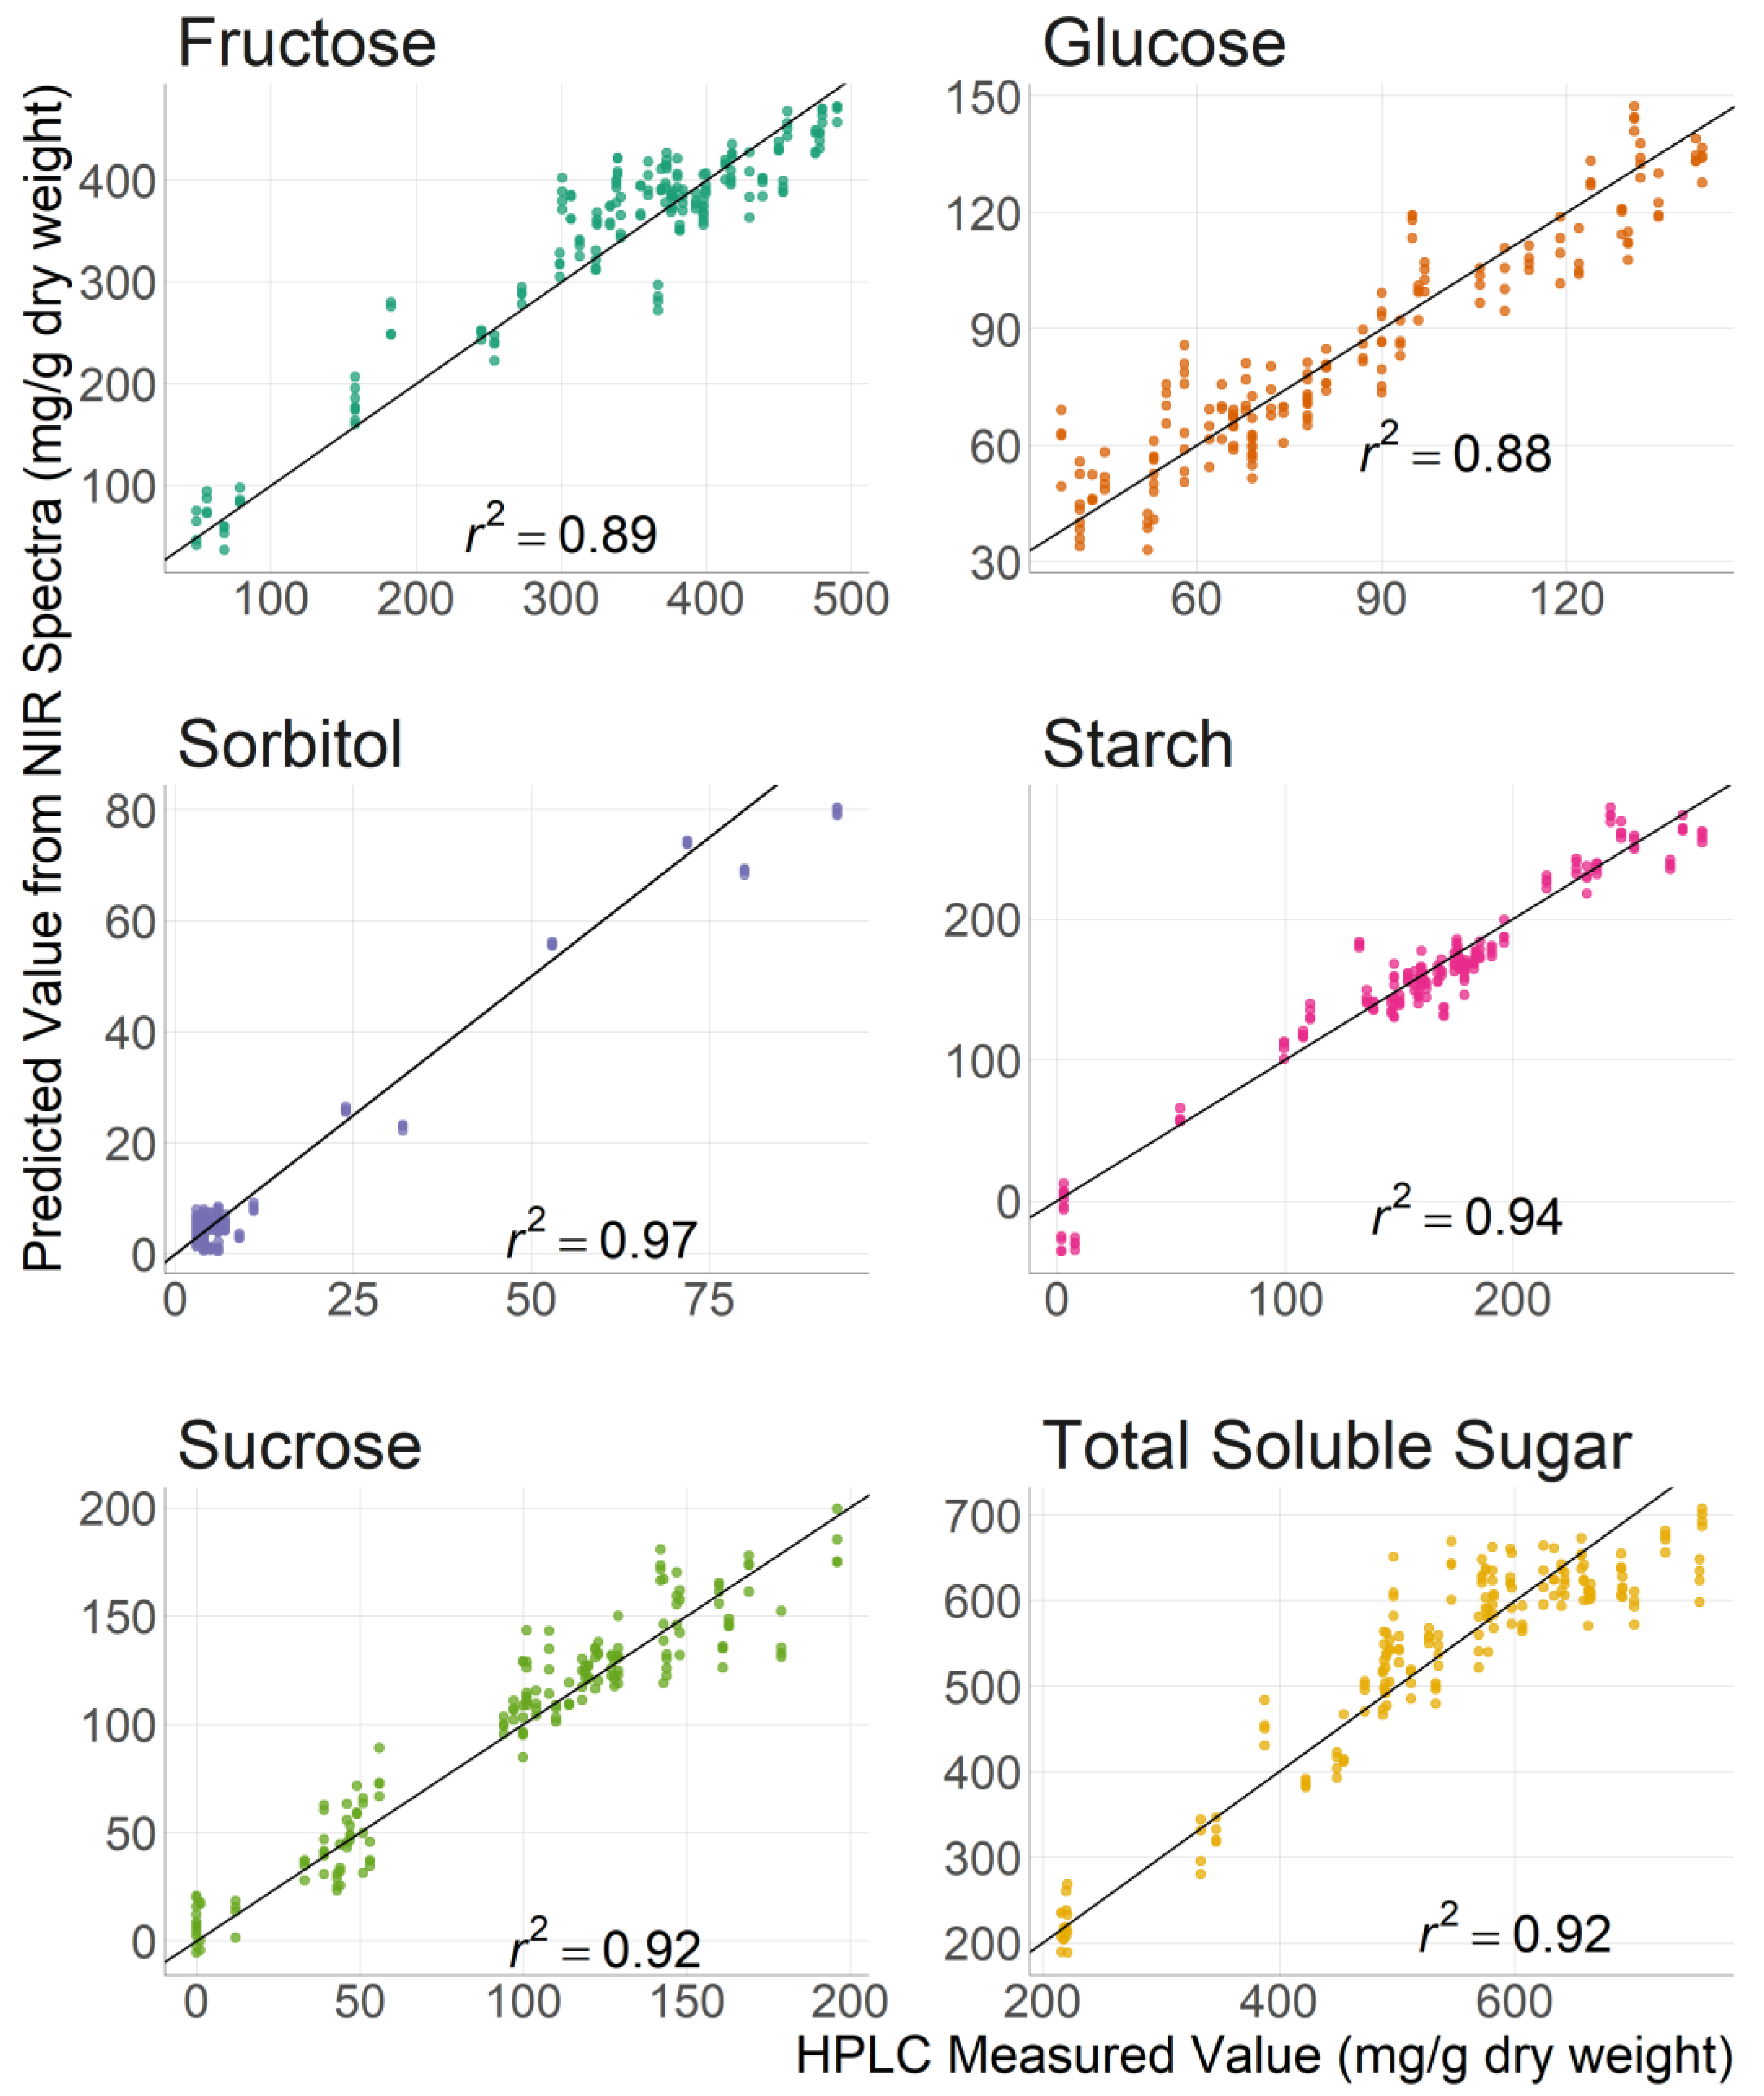
3.2. Carbohydrate Prediction with Near Infrared Spectroscopy

Near infrared spectroscopy accurately predicted individual carbohydrate and total soluble sugars (TSS) content across all measurement dates, cultivars, and fruit positions for whole fruit samples (Figure 4). Table 3 summarizes the average, minimum, and maximum measured values of carbohydrates determined using HPLC analysis of apple cultivars across the growing season (n = 93). These values were used to construct and validate the NIRs model. r2 values between predicted and measured carbohydrates ranged from 0.97 for sorbitol to 0.64 for glucose (Table 4). The usefulness and accuracy of developed NIRs models is evaluated using the coefficient of determination (r2) and residual prediction deviation (RPD) values [32]. Models with a r2 of 0.60–0.82 can be used for screening and approximate quantitative predictions, models with r2 values between 0.83 and 0.90 can be used for many applications, while models with r2 value of 0.92–0.96 are suitable for most applications including quality assurance [32].
The prediction accuracies seen with benchtop NIR in the current study were higher than a previous study using a portable visible/NIR spectrophotometer [33]. Zhang et al. [33] built individual models for 8 cultivars to predict TSS and dry matter content for fruit at harvest and following storage. The r2 values for TSS were 0.81 and 0.06 for the ‘Gala’ and ‘Red Delicious’ models, respectively [33]. The r2 values for the models developed in this study for TSS were 0.92 and 0.87 for the cortex-only and whole fruit scanned dataset, respectively (Table 4). These differences in prediction accuracy are likely due to greater variability in reflectance spectra and the influence of water content with non-destructively sampled fruit compared to freeze dried tissue used in the current study.
Better prediction was obtained with the models constructed from NIR spectra obtained from cortex-only, freeze dried powder samples compared to whole fruit samples (Figure 4 and Figure 5). Sufficient cortex was only available for fruit at 100 and 122 DAFB. Whole fruits were ground and spectra were captured for 21, 36, and 59 DAFB and this spectra was used for calibration of both the cortex-only and whole fruit prediction models. Jing and Malladi [2] found that carbohydrate content varied from cortex to pith and Feng et al. [13] saw greater starch concentrations in the peel than in the cortex. The variations among tissues might contribute to the higher accuracy of cortex-only samples, due to those tissues being more homogenous. Glucose values differed the most between values from HPLC and those from NIR whole fruit samples (r2 = 0.64) or NIR cortex only (r2 = 0.88). For all other carbohydrates and total soluble sugar, the difference in r2 was less than 0.07 between whole fruit and cortex-only NIR models. NIR models developed by Eisenstecken et al. [24] for combined ‘Braeburn’ and ‘Cripps Pink’ had similar r2 to predict glucose (r2 = 0.83), and lower r2 values for sucrose (r2 = 0.74) and fructose (r2 = 0.55) than in the current study.
Whole fruit compared to cortex-only samples showed a relatively small decrease in accuracy of carbohydrate prediction with the exception of glucose. Feng et al. [13] found that glucose, starch, and sucrose had higher concentrations in the peel than in the flesh, while fructose was higher in the flesh than in the peel. These results may similarly explain the drop in r2 for glucose, starch, and sucrose. The differences across tissue type for glucose, starch, and sucrose may have added greater variability for the whole fruit compared to cortex-only samples. As cortex tissue was the major constituent of samples, higher levels of fructose in the cortex may indicate that fructose levels between cortex-only and whole fruit samples differ minimally.
Using freeze dried whole fruits offer the advantage of increased efficiency compared to preparing cortex-only samples. The decrease in accuracy between cortex-only and whole fruit models may have been further increased had sufficient cortex tissue been able to be sampled for NIR measurement on the first three measurement dates. In this case the cortex-only model would have more tissue specific over the entire growing season. A cortex-only sample may be more appropriate where higher accuracy with NIR is needed, particularly in early season fruit development when the cortex is a smaller constituent of the fruit and differences between tissue types are magnified.

4. Conclusions

This study was designed to follow the changes in apple fruit carbohydrate content and the ability of NIR to efficiently predict carbohydrates throughout a growing season in two economically important cultivars. In this experiment using ‘Gala’ and ‘Red Delicious’ apples grown in the Southeastern United States, the seasonal stage of growth contributed the most to fruit carbohydrate composition. The temporal patterns in fruit carbohydrate concentration throughout the growing season align with numerous studies in other cultivars. Sorbitol was the main constituent of carbohydrates early in the growing season, and decreased through the rest of fruit development. Sucrose and fructose increased throughout the growing season. Starch and glucose concentrations increased until mid-season, then glucose remained constant and starch decreased. This study supports the findings of Jing and Malladi [2] who established an early, middle, and late developmental period for apple fruit. Carbohydrate variation occurred between cultivars and appeared to relate to ripening patterns, while fruit carbohydrate composition was similar between physical positions of king or lateral fruit cluster position. NIR offers a rapid method for researchers to quantify carbohydrates and robustly predicted individual carbohydrates and total soluble sugars between apple cultivars, fruit cluster position, and fruit development throughout the growing season. NIR can facilitate more efficient study of individual carbohydrates as it relates to support for cell division/expansion, ripening patterns of starch degradation, and fruit quality parameters during harvest and fruit storage.

Author Contributions

Conceptualization, J.E.L., P.P.-V., G.M. and T.M.K.; methodology, J.E.L., P.P.-V., G.M. and T.M.K.; investigation, J.E.L. and G.M.; writing—original draft preparation, J.E.L.; writing—review and editing, P.P.-V., G.M. and T.M.K. All authors have read and agreed to the published version of the manuscript.

Funding

Funding and support was provided by USDA NIFA SCRI Grant #2020-51181-32197, USDA Multistate Project NE1836 and the USDA National Institute of Food and Agriculture, Hatch Project 7003225.

Data Availability Statement

Data can be found in the following GitHub repository: https://github.com/LarsonJimmy/NIR_thinning (accessed on 6 February 2023).

Acknowledgments

The authors would like to thank Christopher Clavet for assistance colleting samples, and Joyce O’Neal and Erin Deaton for assistance in sample preparation.

Conflicts of Interest

The authors declare no conflict of interest.

References

  1. Dash, M.; Johnson, L.K.; Malladi, A. Reduction of Fruit Load Affects Early Fruit Growth in Apple by Enhancing Carbohydrate Availability, Altering the Expression of Cell Production-related Genes, and Increasing Cell Production. J. Am. Soc. Hortic. Sci. 2013, 138, 253–262. [Google Scholar] [CrossRef] [Green Version]
  2. Jing, S.; Malladi, A. Higher growth of the apple (Malus × domestica Borkh.) fruit cortex is supported by resource intensive metabolism during early development. BMC Plant Biol. 2020, 20, 75. [Google Scholar] [CrossRef] [PubMed] [Green Version]
  3. Botton, A.; Eccher, G.; Forcato, C.; Ferrarini, A.; Begheldo, M.; Zermiani, M.; Moscatello, S.; Battistelli, A.; Velasco, R.; Ruperti, B.; et al. Signaling Pathways Mediating the Induction of Apple Fruitlet Abscission. Plant Physiol. 2011, 155, 185–208. [Google Scholar] [CrossRef] [Green Version]
  4. McGlone, A.; Jordan, R.B.; Seelye, R.; Clark, C. Dry-matter—A better predictor of the post-storage soluble solids in apples? Postharvest Biol. Technol. 2003, 28, 431–435. [Google Scholar] [CrossRef]
  5. Larson, J.E.; Kon, T.M.; Malladi, A. Apple Fruitlet Abscission Mechanisms. Hortic. Rev. 2022, 49, 243–274. [Google Scholar] [CrossRef]
  6. DeJong, T.M. Concepts for Understanding Fruit Trees; CABI: Wallingford, UK, 2021. [Google Scholar]
  7. Priestly, C.A. The importance of autumn foliage to carbohydrate status and root growth of apple trees. Annu. Rep. East Malling Res. Stn. 1964, 104–106. [Google Scholar]
  8. Oliveira, C.M.; Priestley, C.A. Carbohydrate Reserves in Deciduous Fruit Trees. Hortic. Revies 1988, 10, 403–430. [Google Scholar] [CrossRef]
  9. Lakso, A.N.; Goffinet, M.C. Advances in understanding apple fruit development. In Achieving Sustainable Cultivation of Apples; Burleigh Dodds Science Publishing: Cambridge, UK, 2017; pp. 127–158. [Google Scholar]
  10. Breen, K.; Tustin, S.; Palmer, J.; Boldingh, H.; Close, D. Revisiting the role of carbohydrate reserves in fruit set and early-season growth of apple. Sci. Hortic. 2020, 261, 109034. [Google Scholar] [CrossRef]
  11. Blanke, M.M.; Lenz, F. Fruit photosynthesis. Plant Cell Environ. 1989, 12, 31–46. [Google Scholar] [CrossRef]
  12. Tijero, V.; Girardi, F.; Botton, A. Fruit Development and Primary Metabolism in Apple. Agronomy 2021, 11, 1160. [Google Scholar] [CrossRef]
  13. Feng, F.; Li, M.; Ma, F.; Cheng, L. Effects of location within the tree canopy on carbohydrates, organic acids, amino acids and phenolic compounds in the fruit peel and flesh from three apple (Malus× domestica) cultivars. Hortic. Res. 2014, 1, 14019. [Google Scholar] [CrossRef] [Green Version]
  14. Ackerman, M.; Samach, A. Doubts regarding carbohydrate shortage as a trigger toward abscission of specific Apple (Malus domestica) fruitlets. New Negat. Plant Sci. 2015, 1–2, 46–52. [Google Scholar] [CrossRef] [Green Version]
  15. Suni, M.; Nyman, M.; Eriksson, N.A.; Björk, L.; Björck, I. Carbohydrate composition and content of organic acids in fresh and stored apples. J. Sci. Food. Agric. 2000, 80, 1538–1544. [Google Scholar] [CrossRef]
  16. Zhang, Y.; Li, P.; Cheng, L. Developmental changes of carbohydrates, organic acids, amino acids, and phenolic compounds in ‘Honeycrisp’apple flesh. Food Chem. 2010, 123, 1013–1018. [Google Scholar] [CrossRef]
  17. Ramirez, J.A.; Posada, J.M.; Handa, I.T.; Hoch, G.; Vohland, M.; Messier, C.; Reu, B. Near-infrared spectroscopy (NIRS) predicts non-structural carbohydrate concentrations in different tissue types of a broad range of tree species. Methods Ecol. Evol. 2015, 6, 1018–1025. [Google Scholar] [CrossRef]
  18. Leopold, L.F.; Leopold, N.; Diehl, H.-A.; Socaciu, C. Quantification of carbohydrates in fruit juices using FTIR spectroscopy and multivariate analysis. Spectrosc. 2011, 26, 93–104. [Google Scholar] [CrossRef]
  19. Rustioni, L.; Ciacciulli, A.; Zulini, L.; Zuliani, E.; Sivilotti, P.; Herrera, J.C. Starch quantification in woody tissues by reflectance spectroscopy and on-solid iodine complexation. Sci. Hortic. 2017, 226, 117–121. [Google Scholar] [CrossRef]
  20. De Bei, R.; Fuentes, S.; Sullivan, W.; Edwards, E.; Tyerman, S.; Cozzolino, D. Rapid measurement of total non-structural carbohydrate concentration in grapevine trunk and leaf tissues using near infrared spectroscopy. Comput. Electron. Agric. 2017, 136, 176–183. [Google Scholar] [CrossRef]
  21. Baianu, I.; Guo, J. NIR calibrations for soybean seeds and soy food composition analysis: Total carbohydrates, oil, proteins and water contents. Nat. Proc. 2011, 661, 1. [Google Scholar]
  22. Nicolaï, B.M.; Beullens, K.; Bobelyn, E.; Peirs, A.; Saeys, W.; Theron, K.I.; Lammertyn, J. Nondestructive measurement of fruit and vegetable quality by means of NIR spectroscopy: A review. Postharvest Biol. Technol. 2007, 46, 99–118. [Google Scholar] [CrossRef]
  23. Pissard, A.; Fernández Pierna, J.A.; Baeten, V.; Sinnaeve, G.; Lognay, G.; Mouteau, A.; Dupont, P.; Rondia, A.; Lateur, M. Non-destructive measurement of vitamin C, total polyphenol and sugar content in apples using near-infrared spectroscopy. J. Sci. Food Agric. 2013, 93, 238–244. [Google Scholar] [CrossRef] [PubMed]
  24. Eisenstecken, D.; Panarese, A.; Robatscher, P.; Huck, C.W.; Zanella, A.; Oberhuber, M. A near infrared spectroscopy (NIRS) and chemometric approach to improve apple fruit quality management: A case study on the cultivars “Cripps Pink” and “Braeburn”. Molecules 2015, 20, 13603–13619. [Google Scholar] [CrossRef] [Green Version]
  25. Smith, A.M.; Zeeman, S. Quantification of starch in plant tissues. Nat. Protoc. 2006, 1, 1342–1345. [Google Scholar] [CrossRef]
  26. Fall, L.A.; Perkins-Veazie, P.; Ma, G.; McGregor, C. QTLs associated with flesh quality traits in an elite × elite watermelon population. Euphytica 2019, 215, 30. [Google Scholar] [CrossRef]
  27. R Core Team. R: A Language and Environment for Statistical Computing; R Foundation for Statistical Computing: Vienna, Austria, 2022; Available online: https://www.R-project.org/ (accessed on 8 September 2022).
  28. Li, M.; Feng, F.; Cheng, L. Expression Patterns of Genes Involved in Sugar Metabolism and Accumulation during Apple Fruit Development. PLoS ONE 2012, 7, e33055. [Google Scholar] [CrossRef] [PubMed] [Green Version]
  29. Chan, W.W.; Chong, C.; Taper, C.D. Sorbitol and other carbohydrate variation during growth and cold storage of mcintosh apple fruits. Can. J. Plant Sci. 1972, 52, 743–750. [Google Scholar] [CrossRef]
  30. Lombardo, V.A.; Osorio, S.; Borsani, J.; Lauxmann, M.; Bustamante, C.A.; Budde, C.O.; Andreo, C.S.; Lara, M.V.; Fernie, A.R.; Drincovich, M.F. Metabolic Profiling during Peach Fruit Development and Ripening Reveals the Metabolic Networks That Underpin Each Developmental Stage. Plant Physiol. 2011, 157, 1696–1710. [Google Scholar] [CrossRef] [Green Version]
  31. Dai, Z.; Léon, C.; Feil, R.; Lunn, J.E.; Delrot, S.; Gomès, E. Metabolic profiling reveals coordinated switches in primary carbohydrate metabolism in grape berry (Vitis vinifera L.), a non-climacteric fleshy fruit. J. Exp. Bot. 2013, 64, 1345–1355. [Google Scholar] [CrossRef]
  32. Williams, P. Observations on the use, in prediction of functionality in cereals, of weights derived during development of partial least squares regression. J. Near Infrared Spectrosc. 1996, 4, 175. [Google Scholar] [CrossRef]
  33. Zhang, Y.; Nock, J.F.; Al Shoffe, Y.; Watkins, C.B. Non-destructive prediction of soluble solids and dry matter contents in eight apple cultivars using near-infrared spectroscopy. Postharvest Biol. Technol. 2019, 151, 111–118. [Google Scholar] [CrossRef]
Figure 1. Apples develop in clusters of 5–6 fruit. Spur leaves emerge first and are the main source of photosynthates for early fruit development. As the bourse shoot develops, its larger leaves produce more photosynthates than the smaller spur leaves, contributing a greater percentage of photosynthates for fruit growth and development. K = king fruit; L = lateral fruit; S = spur leaf; B = bourse shoot.
Horticulturae 09 00279 g001
Figure 2. Percent contribution to total carbohydrates of fructose, glucose, sorbitol, starch, and sucrose from ‘Red Delicious’ and ‘Gala’ fruit collected throughout the 2020 growing season in Mills River, NC.
Horticulturae 09 00279 g002
Figure 3. Principal component analysis of carbohydrate content for ‘Red Delicious’ and ‘Gala’ fruit collected throughout the 2020 growing season in Mills River, NC. with loading plot of variables (individual carbohydrates) used for PCA.
Horticulturae 09 00279 g003
Figure 4. Fructose, glucose, sorbitol, starch, sucrose, and total soluble sugar obtained by HPLC quantification of cortex tissue versus NIR predicted values for all samples collected of ‘Gala’ and ‘Red Delicious’ fruit throughout the 2020 growing season in Mills River, NC. Samples for NIR models are from whole fruit (peel, cortex, and pith).
Horticulturae 09 00279 g004
Figure 5. Fructose, glucose, sorbitol, starch, sucrose, and total soluble sugar values from HPLC quantification of cortex tissue versus predicted value with NIR for all samples collected of ‘Gala’ and ‘Red Delicious’ fruit throughout the 2020 growing season in Mills River, NC. Samples for NIR models from cortex only for collection dates 100 and 122 days after full bloom.
Horticulturae 09 00279 g005
Table 1. Sampling date in Days after full bloom (DAFB) of ‘Gala’ and ‘Red Delicious’ fruit by fruit position in spur (king or lateral). Fruit collected from North Carolina State University’s Mountain Horticultural Crops Research Station in Mills River, NC in 2020.
‘Gala’‘Red Delicious’
Sampling DateKing zLateral zKing zLateral z
Sample 121 DAFB y21 DAFB21 DAFB21 DAFB
Sample 236 DAFB36 DAFB36 DAFB36 DAFB
Sample 359 DAFB59 DAFB-59 DAFB
Sample 4100 DAFB100 DAFB100 DAFB100 DAFB
Sample 5122 DAFB122 DAFB--
z 7 April 2020 is full bloom date; y DAFB = Days after full bloom.
Table 2. Total content of fructose, glucose, sorbitol, starch, and sucrose (g mg−1 dry weight) from ‘Red Delicious’ and ‘Gala’ fruit collected throughout the 2020 growing season in Mills River, NC.
‘Gala’
Fructose zGlucose zSorbitol zStarch zSucrose z
DAFB yKing xLateralKingLateralKingLateralKingLateralKingLateral
2168.056.258.549.393.393.67.867.30.70.4
3678.678.367.768.267.172.04.4 *1.8 *00
59176.7158.3106.4105.331.736.9108.3 **65.2 **33.4 *20.2 *
100386.6392.570.562.45.75.6164.8 *183.5 *106.9117.9
122422.1391.279.370.44.14.0157.2140.3150.9 *128.8 *
‘Red Delicious’
2172.2 *48.7 *63.9 *46.4 *80.385.23.3 *5.3 *00
3688.167.578.460.953.353.23.03.800
59-162.6-128.7-21.6-68.4-13.5
100306.4282.5134.3131.53.84.4264.1 **229.9 **45.945.4
z Concentration in mg × g−1DW; y DAFB = Days after full bloom; 7 April 2020 was full bloom date; x Fruit population compared within each cultivar and sampling date by position, king and lateral using one-way ANOVA; * p < 0.05; ** p < 0.001.
Table 3. Soluble carbohydrates, starch, and sorbitol values obtained by HPLC from freeze dried apple fruit powders (n = 93) used to construct NIR models.
SugarMean zMinimum zMaximum z
Fructose29143496
Glucose8537169
Sorbitol212101
Sucrose780207
Starch1331299
Total Soluble Sugar475136785
z Concentration in mg × g−1DW.
Table 4. Performance statistics for NIR models using partial least squares regression from reflectance spectra of cortex-only compared to whole apple (peel, cortex, and pith) samples (n = 93).
r2 zRMSEP yRPD x
SugarCortex wPeel, Cortex, PithCortexPeel, Cortex, PithCortexPeel, Cortex, Pith
Fructose0.890.8736.7039.403.122.80
Glucose0.880.6010.4022.402.921.60
Sorbitol0.970.963.623.975.725.47
Sucrose0.920.8415.0021.303.542.47
Starch0.940.8516.9026.804.052.63
Total Soluble Sugar0.920.8749.6061.903.582.83
z r2 = coefficient of determination; y RMSEP = Root Mean Square Error of prediction; x RPD = Residual Prediction Deviation; w Sufficient cortex tissue for measurement of NIR spectra could only be obtained on 100 and 122 days after full bloom.
Disclaimer/Publisher’s Note: The statements, opinions and data contained in all publications are solely those of the individual author(s) and contributor(s) and not of MDPI and/or the editor(s). MDPI and/or the editor(s) disclaim responsibility for any injury to people or property resulting from any ideas, methods, instructions or products referred to in the content.

