Article

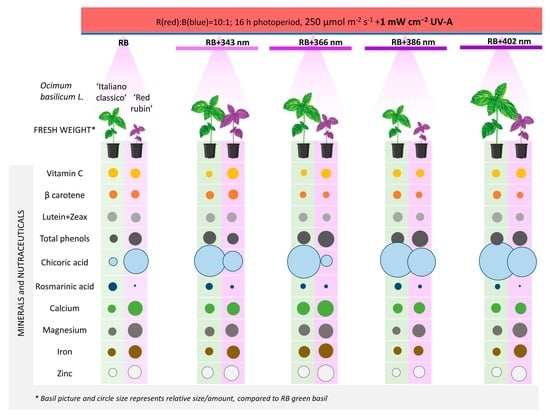
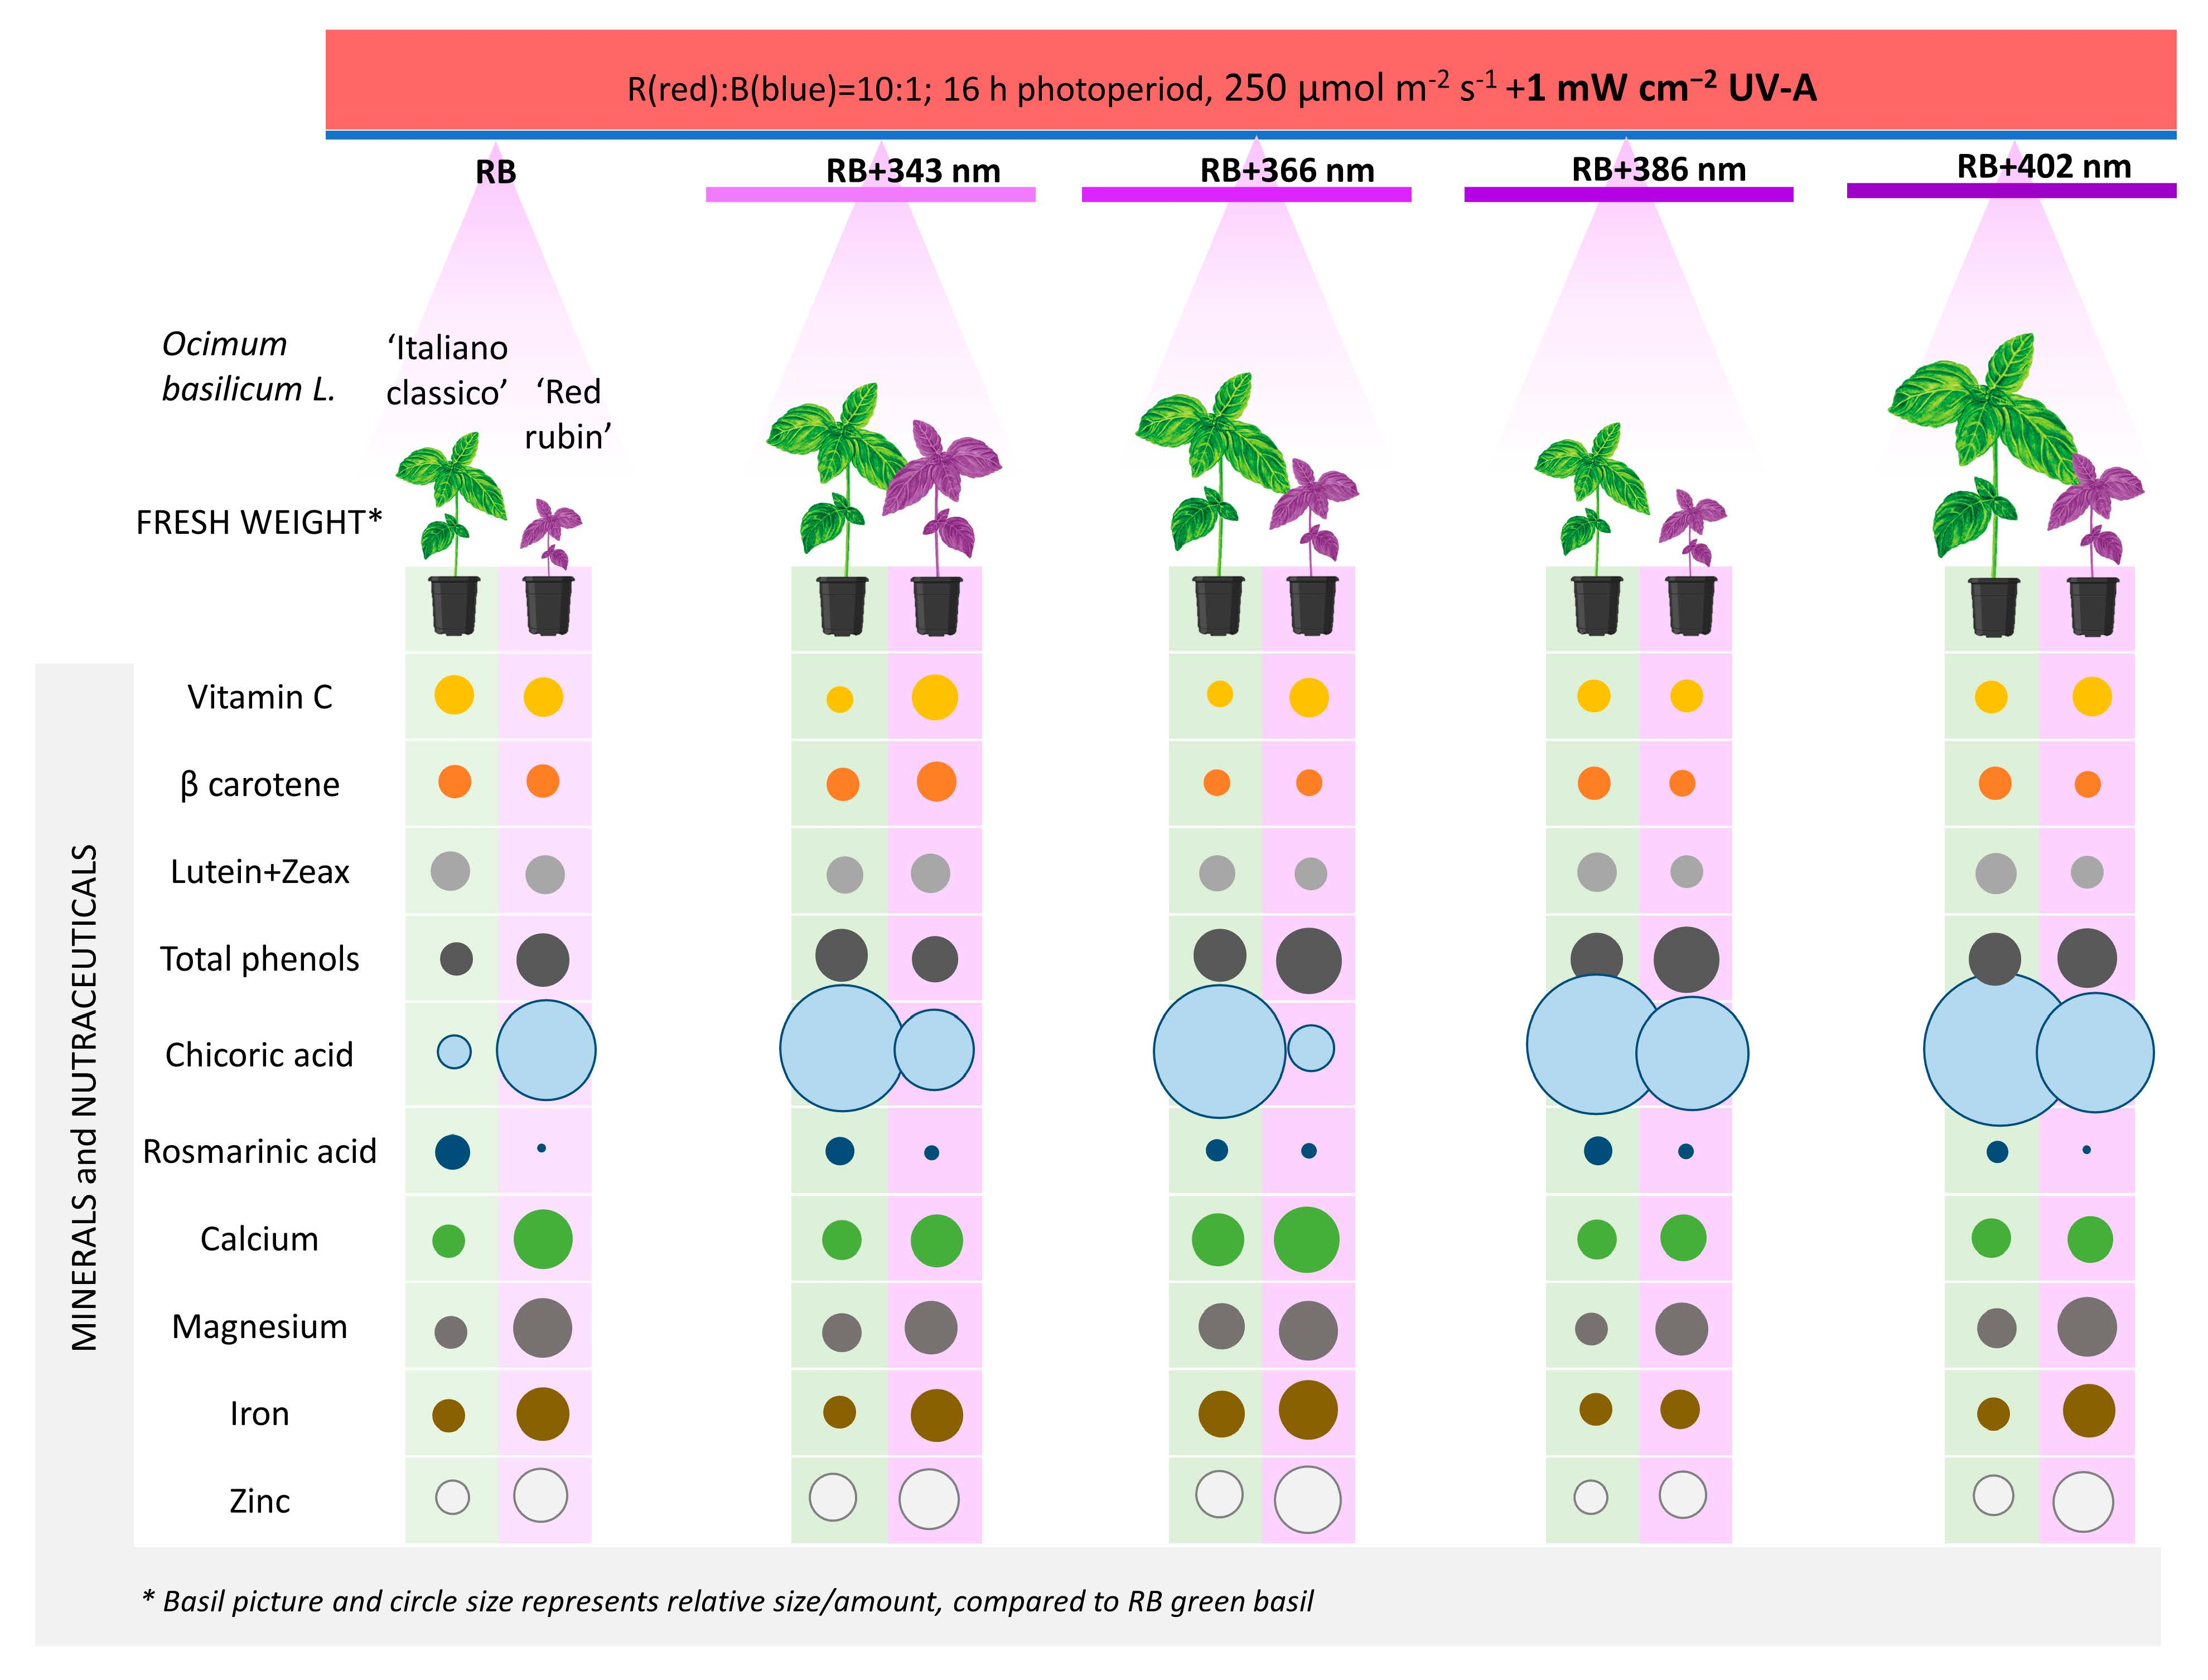
Distinct Impacts of UV-A Light Wavelengths on Nutraceutical and Mineral Contents in Green and Purple Basil Cultivated in a Controlled Environment

by
Akvilė Viršilė
*,
Kristina Laužikė
,
Rūta Sutulienė
,
Aušra Brazaitytė
,
Gediminas Kudirka
and
Giedrė Samuolienė
Institute of Horticulture, Lithuanian Research Centre for Agriculture and Forestry, Kaunas Str. 30, LT-54333 Babtai, Lithuania
*
Author to whom correspondence should be addressed.
Horticulturae 2023, 9(11), 1168; https://doi.org/10.3390/horticulturae9111168
Submission received: 22 September 2023 / Revised: 20 October 2023 / Accepted: 25 October 2023 / Published: 26 October 2023

Abstract

:
Controlled environment agricultural (CEA) systems create technological opportunities for the higher nutritional value of vegetables and herbs. It was hypothesized that UV-A light, supplementing basal light emitting diode (LED) illumination in CEA, would enhance growth and nutritional value (nutraceutical compounds and mineral element contents) in purple and green basil in a UV-A wavelength-specific manner. Therefore, blue (452 nm) and red (662 nm) 1:10 basal LED lighting (250 μmol m−2 s−1, 16 h) was supplemented with 1 mW cm−2 of 343, 366, 386, or 402 nm UV-A LED light for green ‘Italiano classico’ and purple ‘Red rubin’ basil cultivation. Different wavelengths have specific impacts for two basil genotypes, and certain light wavelengths should be selected to boost growth or to alter the contents of specific nutraceutical compounds. UV-A/violet 402 nm light enhanced growth, chicoric acid, β carotene, lutein, and zeaxanthin contents in green basil, while 343 nm UV-A light increased fresh weight, ascorbic acid, and carotenoid content in purple basil. UV-A light of 386 nm has the most negligible impact on reducing mineral element (P, Ca, Fe, K, Mg, Mn, and Zn) contents in basil. Understanding the wavelength dependence of plant responses to UV-A is essential for optimizing quality preservation and improving basil cultivation in controlled environment systems.

Graphical Abstract

1. Introduction

Vertical farming is a modern plant production system that enables local cultivation of high-quality vegetables through precise control of plant physiology and development processes by accurately managing growth conditions [1]. Plant cultivation in a controlled environment has several benefits, such as year-round crop production, improved resource use efficiency, protection from severe weather conditions, and increased plant productivity (76–116% compared to traditional farming) [2,3]. Contemporary horticulture is optimized for maximal productivity; however, it is also important to highlight the so-called “dilution effect”, which describes an inverse relationship between yield and concentrations of nutritionally important chemical constituents in vegetable tissues: an increase in biomass is often accompanied by a decrease in contents of minerals, proteins, vitamins, and other bioactive compounds [4,5]. However, consumer attitude towards crop quality, nutritional value, flavor, and postharvest longevity is rising [6]. It was stated that 90% of consumers are willing to pay more for crops with increased flavor, sensory properties, and nutritional value [6,7]. The resulting demand creates new scores to employ technological properties of controlled environment cultivation systems seeking to tailor plant growth and metabolism for higher vegetable nutritional value and increased profitability.
Light is one of the main controllable environmental factors affecting plant growth, morphology, and metabolism. Light emitting diode (LED) lighting is the more energy-efficient source for vertical farming. It enables improved performance and control compared to traditional high-pressure sodium or fluorescent plant lighting [8,9]. The spectrum, intensity, and duration of LED light are precisely controlled. Therefore, artificial light can be employed as a signal for tailoring specific physiological responses in plants. In vertical farming systems, plants are exposed to a restricted number of constant environmental parameters, including lighting, during the day [10]. The combinations of red (R) and blue (B) light-emitting diodes (LEDs) are used as the most efficient and sufficient light for normal plant growth and productivity [11,12].
Notwithstanding, natural solar radiation comprises a complex spectrum of light, ranging from ultraviolet (UV) and visible light to infrared radiation, that can modulate most of the plant’s biochemical and physiological processes in the plant [13]. Numerous studies have proved that other light colors of the visible spectrum, such as green, far-red, and orange have meaningful effects on various leafy vegetables in controlled environment horticultural systems [9,14]. Recent advances in UV-A LED technology and scientific research have enabled UV light as a trigger to induce eustress in horticultural crop production [15,16].
Solar UV radiation can be divided into UV-C (200 to 280 nm), UV-B (280 to 315 nm), and UV-A (315 to 400 nm). UV-A radiation accounts for ~95% of solar UV radiation at sea levels [13,17]. In natural sunlight and artificial lighting systems, the ratio of UVA/PAR (Photosynthetically Active Radiation) is up to 7–8% [17]. It was shown that low levels of UV-A radiation have stimulatory effects on the growth of some leafy vegetables [17,18,19,20]. Still, higher UV-A concentrations for UV-sensitive plants might result in growth inhibition [21]. Supplemental UV-A LED light often leads to higher total phenolic compound, anthocyanin, and ascorbic acid contents in leaves, and antiradical properties in leafy vegetables and herbs [16,18,22,23]. However, plant responses to UV-A radiation are still poorly understood due to the high variability of the research results; the available literature often contains contradictory information [16,17]. The differences in UV-A peak wavelength applied in different studies with UV-A dosage and parameters of the main light source may play a role in this controversy and the differential sensitivity of plant species to UV-A lighting. Therefore, the hypothesis was put forward that different UV-A light wavelengths have distinct, genotype-specific impacts on plant growth and metabolism, thus affecting their productivity and nutritional value. This hypothesis was tested with purple and green basil (Ocimum basilicum) genotypes. Basil is a valued horticultural crop that presents a complex nutraceutical and aroma compound profile, and there is an increasing interest in enhancing the synthesis of these health-beneficial phytochemical compounds to produce premium quality basil under a controlled environment [24]. Following that, the aim of this study was to compare the impacts of different UV-A LED wavelength lights on green and purple basil growth, nutraceutical, and mineral element contents in their leaves.

2. Materials and Methods

2.1. Plant Cultivation

Experiments were performed in a walk-in controlled-environment growth chamber (4 × 6 m). Day/night temperatures of 21 ± 2/17 ± 2 °C were maintained within a 16 h photoperiod and relative humidity of 50–60%. Two basil varieties (Ocimum basilicum L. ‘Italiano classico’ (green leaves) and ‘Red rubin’ (purple leaves); Sėklos, Didžioji Riešė, Lithuania) were cultivated in peat substrate (Profi 1, JSC Durpeta, Netoniai, Lithuania): pH 5.5–6.0, EC (electrical conductivity) 1.0–1.2 mS cm−1. The average amounts of nutrients in the substrate were: 110 mg L−1 N, 50 mg L−1 P2O5, 160 mg L−1K2O. Three seeds were seeded into a 120 mL vessel, 28 vessels for each light treatment replication. Plants were watered to maintain even soil moisture and, during the third week, fertilized with NPK 3-1-3 liquid fertilizer (Plagron, Ospel, The Netherlands).

2.2. Lighting Experiments

Experimental lighting was applied from the sowing time. Five light-emitting diode (LED) lighting treatments were performed parallelly in three replications. In each treatment, the main photosynthetic photon flux (PPF) was provided by blue 452 nm (B; LedEngin LZ1-00B200, Osram Sylvania Inc., Wilmington, NC, USA) and deep-red 662 nm (R; Luxeon Rebel LXM3-PD01-0300, Philips Lumileds Lighting Co., San Jose, CA, USA) LED wavelengths. In four of them, the main PPF (250 µmol m−2 s−1, 16 h photoperiod, R:B = 10:1) was supplemented with 1 mW cm−2 of different high-power UV-A LEDs emitting at 343 nm (CUD4AF1B, Seoul Viosys Co., Ltd., Ansan-city, Republic of Korea), 366 nm (LedEngin LZ4-04UV00, Osram Sylvania Inc., Wilmington, NC, USA), 386 nm (LedEngin LZ440UB00-U4, Osram Sylvania Inc., Wilmington, NC, USA), or 402 nm (LedEngin LZ440UB00-U7, Osram Sylvania Inc., Wilmington, NC, USA). The 402 nm light is on the boundary of UV-A and photosynthetically active radiation. Therefore, in this study, we sought to compare the effect of 402 nm light to the effects of defined (343, 366, 386 nm) UV-A wavelengths on plants. UV-A untreated plants (RB treatment) were considered as the control. Photosynthetic photon flux density (PPFD) was measured and adjusted at the plant top level (30 cm from the light source) using a photometer–radiometer (RF-100, Sonopan, Białystok, Poland); UV-A light intensity was adjusted using FLAME-S-UV-VIS-ES spectrometer (Ocean Optics, Ostfildern, Germany). Plants were randomly relocated twice a week to minimize the experimental error caused by the uneven light distribution.

2.3. Biometric Measurements

Sampling and measurements were performed 45 days after sowing. For biometric measurements, leaf area was measured using an automatic leaf area meter (AT Delta-T Devices, Cambridge, UK), and fresh and dry plant weight (DW) (dried at +55 °C for 48 h, Venticell-BMT, Brno-Zábrdovice, Czech Republic) was determined for 10 plants per treatment (n = 10) [25].
Extracts were prepared from the conjugated biological samples (mixed above-ground biomass) from not less than 5 plants per experimental replication. Each biochemical analysis was performed in 3 analytical replications.

2.4. Antioxidant Properties and Phenolic Compounds

Antioxidant properties of basil leaves were evaluated as the DPPH (2-diphenyl-1-picrylhydrazyl), ABTS (2,2′-azino-bis (3-ethylbenzothiazoline-6-sulphonic acid) diammonium salt) radical scavenging activities, and Fe2+ reducing antioxidant power assay (FRAP), and the total contents of phenolic compounds were determined. Extracts were prepared by diluting ground dry plant material with 80% methanol 1:10 (w:v). After 24 h, extracts were filtered through cellulose, then a 0.22 µm PTPE syringe filter (VWR International, Radnor, PA, USA).
The DPPH free radical scavenging activity [26] was determined by mixing the diluted extract with 0.06 M methanolic DPPH solution and radical quenching monitored every minute for 16 min measuring absorbance at 515 nm (M501, Camspec, Crawley, UK). The results are presented as DPPH free radical scavenging activity, µmol DPPH g−1 of plant DW.
The ABTS [27] radical solution was prepared by mixing 50 mL of 2 mM ABTS with 200 µL 70 mM K2S2O8, allowing the mixture to stand in the dark at room temperature for 16 h before use and diluting it to obtain an initial absorbance of AU 0.700 at 734 nm (M501, Camspec, Crawley, UK). Next, 100 µL of the sample was mixed with 2 mL ABTS solution, and absorbance was monitored for 11 min. The results are presented as ABTS free radical scavenging activity, µmol ABTS g−1 of plant DW.
FRAP [28] working reagent was prepared by mixing acetate buffer (300 mM, pH 3.6), a solution of 10 mM TPTZ (2,4,6-tripyridyl-s-triazine) in 40 mM HCl, and 20 mM FeCl3 × 6H2O at 10:1:1 (v/v/v). Next, 20 µL of the sample was mixed with 3 mL of working solution and incubated in the dark for 30 min. Then, absorbance at 593 nm was read (M501, Camspec, Crawley, UK). The antioxidant power is expressed as Trolox equivalent antioxidant capacity (µmol Trolox per g−1 of plant DW).
The extract was mixed with diluted Folin–Ciocâlteu reagent (1:10) and 7.5% sodium carbonate (Na2CO3) solution 1:1:2, respectively, for the total phenolic content [29]. After 20 min, the absorbance of the mixture was measured at 756 nm (M501, Camspec, Crawley, UK). The results were expressed in mg of gallic acid equivalents per g of dry basil material.
Target phenolic compounds (chicoric and rosmarinic acids) were identified and quantified in 80% methanolic extracts by high-performance liquid chromatography (HPLC) method with diode array detection (DAD) at 280 nm on Shimadzu 10A system (Shimadzu, Kyoto, Japan) and Nucleodur EC 150/4 3 µm column (Macherey-Nagel, Allentown, PA, USA). Injection volume 10 µL. Mobile phase gradient consisted of A (acetonitrile) and B (1% acetic acid in water): 95% B for 25 min, followed by a linear gradient to 70% B at 5 min, then to 5% B in 2 min and hold for 1 min, then elevated till 95% B in 7 min, and hold until the 40 min. Flow rate 1 mL min−1. The calibration method, using standard solutions of chicoric and rosmarinic acids, was used for phenolic compound quantification (mg g−1 in plant DW).

2.5. Determination of Carotenoids by HPLC

Β-carotene, lutein, and zeaxanthin contents were evaluated using the HPLC method with diode array detection (DAD) at 440 nm on Shimadzu 10A (Shimadzu, Japan) system. About 0.1 g of dry ground plant material was diluted with 80% acetone. The extraction was carried out for 24 h at +4 °C temperature. Then, the extract was centrifuged at 10,000 rpm for 10 min and filtered through a 0.22 µm PTFE syringe filter (VWR International, Radnor, PA, USA). Separation was performed on Chromegabond C30 3µ 120 Å, 15 cm × 2.1 mm column (ES Industries, West Berlin, NJ, USA). Injection volume 10 µL. Mobile phase gradient consisted of A (25% aqueous methanol) and B (ethyl acetate) at a flow rate of 0.2 mL min−1: 20% B for 2.5 min, followed by a linear gradient to 30% B at 5 min, holding 30% B for 5 min, then elevated until 80% B in 2.5 min, until 87% B in 7.5 min, and until 100% in 5 min, and again 20% B until the end of the run. The calibration method was used for β carotene, lutein, and zeaxanthin quantification (mg g−1 in plant DW).

2.6. Quantification of Ascorbic Acid by HPLC

Ascorbic acid contents were determined on Shimadzu 10A (Shimadzu, Japan) system with DAD detection at 230 nm, using a slightly modified analysis method, described by Romero Rodriguez et al. [30]. The sample was prepared by grinding fresh plant material and diluting it with water 1:10 (w:v). The extract was clarified by centrifugation at 10,000 rpm for 15 min and filtered through 0.22 µm PTFE syringe filter (VWR International, Radnor, PA, USA). Separation was performed on Lichrosorb RP-18 4.6 × 250 mm, 5 5 µm column (Altech, Nicholasville, KY, USA). The mobile phase was 0.05 M sulfuric acid, flow rate 0.5 mL min−1, injection volume 10 µL. The calibration method was used for ascorbic acid quantification—results presented in plant dry weight (mg g−1 in DW).

2.7. Determination of Mineral Elements

The mineral element contents in basil were determined by using a modified microwave-assisted digestion method combined with inductively coupled plasma optical emission spectrometry (ICP-OES) [31,32]. The complete digestion of dry basil material (0.5 g) with 65% nitric and 30% hydrogen peroxide (5:3) was performed in the microwave-assisted digestion system Multiwave GO (Anton Paar GmbH, Graz, Austria). Mineralized samples were diluted to 50 mL with deionized water and analyzed by ICP–OES spectrometer (Spectro Genesis, SPECTRO Analytical Instruments GmbH, Kleve, Germany) at 1300 W RF power, 12 L min−1 plasma flow, 1 L min−1 auxiliary flow, 0.8 L min−1 nebulizer flow, 1 mL min−1 sample uptake rate. P, Ca, Fe, K, Mg, Mn, and Zn were evaluated at 213.618, 445.478, 259.941, 766.491, 279.079, 259.373, and 213.856 nm analytical wavelengths, respectively, and quantified using the ICP-OES multi-elemental standard solution (Merck KGaA, Darmstadt, Germany). The contents of mineral elements in the dry weight of basil (mg g−1 DW) are presented.

2.8. Statistical Analysis

The results are presented as the average ± standard deviation of 3 experimental and 3 analytical replications, n = 9 per treatment. Data were processed using XLStat statistical software (Xlstat, Addinsoft, Paris, France, 2019) at the confidence level p = 0.05. One-way analysis of variance ANOVA, Tukey’s HSD test, and the principal component analysis (PCA) were used for UV-A light wavelength impact comparison, and Pearson correlation coefficients were calculated.

3. Results

UV-A light wavelengths had distinct impacts on basil growth and morphology (Figure 1). In green basil ‘Italiano calssico’, highest fresh weight (1.8 times higher, compared to BR control) was accumulated in plants treated with supplemental 402 nm UV-A light (RB + 402 nm; Figure 1a). The accumulated fresh biomass strongly correlates (R = 0.891; Appendix Table A1) with the leaf area in green basil (Figure 1c): In 402 nm illuminated plants, it was determined the highest (1.6 times higher) compared to the plants without supplemental UV-A. Dry weight percentage (Figure 1a) did not differ significantly between treatments. However, all supplemental UV-A wavelengths tended to increase basil plant height (Figure 1c).
In purple basil‚ ‘Red rubin’ (Figure 1b), the highest fresh weight was accumulated in plants cultivated under the shortest supplemental 343 nm UV-A wavelength (RB + 343 nm; 1.9 times higher, compared to RB). RB + 366 nm and RB + 402 treatments also resulted in higher purple basil fresh weight (1.4–1.5 times higher than in RB control), while the impact of 386 nm supplemental UV-A light did not differ from control. Similarly to the green genotype, fresh purple basil weight positively correlated with leaf area (R = 0.848; Appendix Table A2), and dry weight percentage (Figure 1b) did not differ significantly between treatments. Moreover, RB + 343 nm treatment increased purple basil height (Figure 1d).
Different UV-A wavelengths unevenly impacted the antioxidant properties of purple and green basil leaves (Table 1). All supplemental UV-A wavelengths in green basil ‘Italiano classico’ resulted in higher DPPH free radical scavenging activity, with RB + 402 nm treatment having the most pronounced (20% higher compared to RB) impact. ABTS free radical scavenging activity, 36 and 22% higher, was determined in green basils cultivated under supplemental 343 nm and 366 nm light, while no significant differences were determined in ferric reduction antioxidant power (FRAP). In purple basil, 402 nm light, on the boundary of UV-A and blue-violet visible light, did not significantly impact antioxidant properties compared to defined UV-A wavelengths of 343, 366, and 386 nm and did not significantly differ in green basil. In purple basil, illuminated with moderate (366 and 386 nm) UV-A wavelengths, FRAP antioxidant power and ABTS free radical scavenging activity tend to be 18–23% higher than other wavelengths. DPPH free radical scavenging activity in purple basil, contrary to green basil, was significantly lower under the 402 nm treatment. All three supplemental UV-A treatments resulted in ~30% higher DPPH free radical activity. The 366 nm and 386 nm light enhanced ABTS free radicals scavenging activity and FRAP power by 30% compared to RB control.
In green basil, DPPH free radical scavenging activity did not correlate with analyzed antioxidant compound content, while in purple basil, it had moderate strength of association (R = 0.638) with contents of phenolic compounds and both DPPH (R = 0.821) and FRAP (R = 0.800; Appendix Table A2) indices positively and strongly correlate with rosmarinic acid contents. This confirms the differential metabolic reaction of basil species to UV-A wavelengths, which results in distinct levels of the main antioxidant nutrients in basil leaves (Figure 2).
Different UV-A wavelengths did not have a statistically different impact (Figure 2a), but all of them resulted in ~1.8 times higher contents of total phenolic compounds in green basil. This coincided but did not correlate with the significant increase in rosmarinic acid contents: the longer the UV-A wavelength, the more pronounced impact was observed. Oppositely, chicoric acid contents were determined remarkably lower under supplemental UV-A treatment. In purple basil (Figure 2b), different UV-A wavelengths also did not significantly impact the total contents of phenolic compounds. At the same time, UV-A in the 343–386 nm range resulted in 1.7–2.9 times higher rosmarinic acid contents, and RB + 386 and RB + 402 treatments resulted in 10 and 20% higher chicoric acid contents, compared to RB.
In ‘Italiano classico’ green basil (Figure 2c), supplemental UV-A light, except 402 nm light, resulted in slightly decreased β carotene, lutein + zeaxanthin, and ascorbic acid contents. Meanwhile, no significant negative impact was observed in purple basil (Figure 2d). Contrarily, purple basil, cultivated under the shortest investigated UV-A wavelength, 343 nm, accumulated 23% and 8% more of β carotene and lutein + zeaxanthin, respectively.
UV-A light significantly affected mineral element contents (Table 2) in basil. In general, purple basil ‘Red rubin’ had 1.3–1.9 times higher contents of P, Ca, Fe, K, Mg, Mn, and Zn compared to green leaf ‘Italiano classico’. All supplemental UV-A wavelengths, including 402 nm light, reduced mineral element contents in both basil varieties. The 386 nm lighting resulted in the least negative impact. Ca and Mg contents in both basil varieties and P and K in green basil ‘Italiano classico’ were the most sensitive to the impact of different UV-A wavelengths. Moreover, Ca, Fe, K, and Mg in green basil (R = −0.607–−0.692) and P, Mg, Mn, and Zn in purple (R = −0.545–−0.768) showed moderate to strong negative correlation with basil fresh weight (Appendix Table A1 and Table A2).
Principal component analysis (PCA) confirmed (Figure 3) that green and purple basil species differentially react to supplemental UV-A lighting. For green leaf ‘Italian classico’ (Figure 3a), the PCA scatterplot shows that 343 nm and 366 nm UV-A light had a similar impact on growth and selected nutraceutical contents, but it was remarkably different from the control RB treatment. Compared to the control, 386 nm supplemental light did not have a pronounced impact, while 402 nm, which is on the boundary of UV-A and visible light, had quite a specific impact compared to other wavelengths. In purple basil ‘Red rubin’ (Figure 3b), each light treatment had a specific impact on growth, nutraceutical, and mineral contents, and the impact of 402 nm was not remarkably different from the impact of 343 nm light.

4. Discussion

In this study, three UV-A light wavelengths and UV-A/visible 402 nm light showed significant but differential impacts on growth, nutraceutical, and mineral element contents in green and purple basil cultivars. In agreement with other works, specific UV-A wavelengths significantly increased growth parameters in lettuce and other leafy greens at moderate dosages. It was summarized [17] that UV-A increased biomass production in lettuce, but only to an optimum, indicating that growth of indoor cultivated lettuce may have a saturating response to UV-A. Choi et al. (2022) reported that treatments with supplemental 395 and 405 nm at 30 Wm−2 for 7 days before harvest increased kale growth parameters and photosynthesis rate, compared to 365, 375, and 385 nm treatments [33]. Chen et al. (2019) demonstrated that 365 nm UV-A LEDs at intensities from 10 to 30 μmol m−2 s−1 promoted dry shoot weights from 15 to 27% and leaf area by 14 to 32% [17]. In our previous study [20], it was also explored that red-leaf lettuce acclimated to longer UV-A wavelengths by increasing biomass production. All these studies differ in cultivation peculiarities, UV-A light dosage, and the main lighting parameters; however, it proposes that UV-A light has a growth-promoting impact on various leafy vegetable genotypes, and longer UV-A wavelengths (≥385 nm) reveal the more pronounced impact. Similarly, in this study, green leaf basil biomass was the highest under supplemental 402 nm treatment. In contrast, in the purple basil genotype, both 343 nm and 402 had pronounced and, according to PCA results, comparable impact on plant fresh weight and leaf area. Moreover, an increase in growth parameter, fresh weight, and leaf area under the impact of these wavelengths negatively correlated with the contents of mineral elements (Ca, K, Mg) in both basil cultivars. Similar trends were observed in a previous study with brassica microgreens [34]. Ca, P, and Mg contents in tissues affected by different UV-A wavelengths in green and purple basil pose plants the risk of restrictions in mineral nutrition, with the more significant variation in mineral contents under different UV-A wavelengths in the green genotype. Therefore, mineral nutrition aspects should be essentially considered when developing UV-A lighting strategies for CEA.
UV radiation is generally considered an abiotic stress and, like some other abiotic stressors, is known to promote the accumulation of secondary metabolites [16,17]. The general impact of UV-A light on the higher contents of protective phenolic compounds is described in different horticultural plants [17,33,35,36], and also conforms to our study’s results. Appolloni et al. (2021) summarized that the increased rate of specialized metabolites in plants can result from the imbalance between the amount of irradiated light and energy consumed due to the limited supply of CO2 [37]. Our results show that shorter (343, 366 nm) UV-A wavelengths, having higher energy, have a more pronounced (either positive or negative) impact on nutraceutical secondary metabolite contents, compared to longer UV-A wavelengths (386, 402 nm). Notwithstanding, longer UV-A wavelengths are more inclined in stimulating accumulation of antioxidant compounds. Longer UV-A wavelength specific positive impacts on plant antioxidant system response and antioxidant contents were also explored in other plants. For example, 380 nm UV-A supplementation improved the flavonoid, polyphenol, and anthocyanin contents and DPPH free radical-scavenging rate in ‘Yanzhi’ and ‘Red butter’ lettuce [38]. In kale plants [33], total phenolic compounds, antioxidant capacity, and total flavonoid contents were significantly increased under all investigated 365, 375, 385, 395, and 405 nm UV-A wavelengths. In another study [39], 370 and 385 nm UV-A LEDs increased caffeic acid, ferulic acid, and kaempferol in kale even after a short-term 5-day treatment. In our experiment, longer 386 and 402 nm wavelength treatment resulted in enhanced chicoric acid contents in both basil cultivars, while lutein and zeaxanthin, β-carotene contents—only in green basil. Rosmarinic acid contents, which was also reported as the dominant phenolic compound responding to UV-A light exposure in perilla leaves [40], were significantly negatively affected by all investigated wavelengths, while in purple basil, its contents were remarkably higher in all UV-A treatments, excluding 402 nm. It both suggests that (1) different UV-A wavelengths do not affect all nutraceutical compounds in plants equally [41], and (2) leaf color type (green or purple) determines the metabolic response to UV-A wavelengths due to different qualitative and quantitative contents of protective antioxidants.
The differences in cultivar of different leaf color responses to UV-A light are distinct at the shorter UV-A wavelengths. Though in UV-A untreated (RB) purple and green leaf plants, the contents of investigated carotenoids were determined in comparable amounts, the UV-A impact was diverse. In purple basil, contrarily to green, carotenoid (β carotene, lutein, and zeaxanthin) and ascorbic acid contents were determined the highest under the shorter 343 nm light, while in the green cultivar, both 343 and 366 nm light resulted in significantly reduced contents of these compounds. No consensus exists in the literature concerning effects of UV exposure on carotenoids in plants; the effects depend on dose and wavelength dependencies, as well as on interactive effects with further environmental parameters [42]. Our study confirms these trends, as well as highlighting the cultivar importance. This, as well as other studies [37,43] on the differential green and purple basil cultivar reaction to lighting parameters, confirms that a strong interaction between genotype and environment (G × E) offers a better potential to control plant growth and metabolism by light in CEA cultivation systems [1]; therefore, further research on UV-A impacts on plants should be even more targeted for different plant cultivars and varieties. Moreover, UV-A wavelengths between 370 and 385 nm were most analyzed due to the availability of these wavelengths for the other application areas, while only a minority of research compares both shorter (315–360 nm) and longer (360–400 nm) UV-A impacts. Moreover, the comparison of the UV-A light’s impact on plants between different studies is restricted due to different experimental design, and, most importantly, due to differential main lighting spectra and intensity. For example, Goto et al. (2016) explored that the total ORAC values in red leaf lettuce ‘Red fire’ increased with decreasing shorter UV-A wavelengths 340 < 325 < 310 nm [22], but the results were not compared to the longer UV-A wavelengths. Therefore, the choice of optimal UV-A lighting parameters for improving nutraceutical contents in vegetables should be based on more comprehensive research.
According to our results, 386 nm supplemental UV-A light is the secure choice which induces phenolic compound accumulation with no pronounced negative impact on carotenoid, ascorbic acid, and mineral element contents in both basil genotypes. However, 343 nm UV-A light could be employed for the purple basil variety for a more pronounced positive impact on nutraceutical contents. In contrast, green basil’s phytochemical contents could be enhanced by UV-A/violet 402 nm light, whose pronounced impact for green cultivars is partially assigned by PAR functions, comparable to blue light [36].
UV-A light exposure could be a promising approach for augmenting the synthesis of phytochemicals in basil plants. Consistent with previous studies [18,44], when investigating the impact of UVA on plant metabolites and mineral element levels, it is crucial to examine changes in specific nutraceutical compounds. Furthermore, it is worthwhile to delve deeper into the plant physiological effects of wavelengths that are near the UV-A and visible light boundary.

5. Conclusions

Understanding the wavelength dependence of plant responses to UV-A is essential for optimizing quality preservation and improving basil cultivated in controlled environment cultivation systems. The impacts of UV-A light wavelengths on green and purple basil cannot be generalized and optimal lighting strategies require individual development for green and purple cultivar. UV-A light has a more pronounced effect on green basil than purple basil and different wavelengths have specific impacts on two basil genotypes. For nutraceutical-enriched green basil of high biomass productivity, supplemental 386 or 402 nm UV-A light is preferable, while for purple—shorter 343 nm light.
Further research on the wavelength-dependent plant responses to UV-A in the whole wavelength range of UV-A light is essential for optimizing quality preservation and improvement for basil cultivation in controlled environment systems.

Author Contributions

Conceptualization, A.V. and G.S.; methodology, A.V.; formal analysis K.L., R.S. and G.K.; investigation, A.B.; writing—original draft preparation, A.V.; writing—review and editing, R.S. and K.L.; supervision, project administration, and funding acquisition A.V. All authors have read and agreed to the published version of the manuscript.

Funding

This research was funded by the European Regional Development Fund according to the supported activity ‘Research Projects Implemented by World-class Researcher Groups’ under Measure No. 01.2.2-LMT-K-718-01-0049.

Data Availability Statement

Not applicable.

Conflicts of Interest

The authors declare no conflict of interest.

Appendix A

Table A1. Pearson correlation matrix of parameters, measured in green basil ‘Italiano classico’.
VariablesHeightLeaf AreaFresh WeightDM%β CaroteneLutein+ Zea-XanthinAscorbic AcidChicoric AcidRosmarinic AcidDPPHABTSPhenolsFRAPPCaFeKMgMnZn
Height10.3460.3080.002−0.306−0.414−0.6020.4750.1490.1590.6150.6170.049−0.749−0.764−0.546−0.666−0.681−0.586−0.561
Leaf area0.34610.8910.114−0.0450.220−0.1920.491−0.0770.5820.3030.2680.557−0.450−0.628−0.759−0.729−0.674−0.222−0.409
Fresh weight0.3080.89110.060−0.0520.203−0.2060.5510.0160.4710.3420.2320.607−0.478−0.625−0.686−0.692−0.653−0.245−0.447
DM%0.0020.1140.0601−0.243−0.314−0.2810.049−0.2330.3070.358−0.0520.072−0.289−0.243−0.448−0.334−0.342−0.400−0.279
β carotene−0.306−0.045−0.052−0.24310.7340.684−0.2770.5990.255−0.379−0.4240.1160.4050.2700.2060.1380.1390.264−0.068
Lutein + Zeaxanthin−0.4140.2200.203−0.3140.73410.8340.0080.3690.340−0.693−0.3020.1920.4960.3480.2310.1910.2110.5550.169
Ascorbic acid−0.602−0.192−0.206−0.2810.6840.8341−0.1220.4500.115−0.799−0.347−0.1560.6310.6070.5320.4970.4810.5430.262
Chicoric acid0.4750.4910.5510.049−0.2770.008−0.12210.4220.4600.2320.8530.068−0.747−0.714−0.509−0.673−0.705−0.538−0.676
Rosmarinic acid0.149−0.0770.016−0.2330.5990.3690.4500.42210.319−0.0950.343−0.168−0.245−0.2280.029−0.223−0.287−0.323−0.580
DPPH0.1590.5820.4710.3070.2550.3400.1150.4600.31910.2060.3000.325−0.298−0.427−0.483−0.540−0.517−0.323−0.458
ABTS0.6150.3030.3420.358−0.379−0.693−0.7990.232−0.0950.20610.3720.371−0.747−0.721−0.670−0.667−0.674−0.790−0.587
Phenols0.6170.2680.232−0.052−0.424−0.302−0.3470.8530.3430.3000.3721−0.029−0.779−0.711−0.370−0.583−0.621−0.593−0.573
FRAP0.0490.5570.6070.0720.1160.192−0.1560.068−0.1680.3250.371−0.0291−0.132−0.277−0.366−0.364−0.3230.004−0.099
P−0.749−0.450−0.478−0.2890.4050.4960.631−0.747−0.245−0.298−0.747−0.779−0.13210.9520.7700.8870.9180.8930.850
Ca−0.764−0.628−0.625−0.2430.2700.3480.607−0.714−0.228−0.427−0.721−0.711−0.2770.95210.8560.9650.9670.7970.842
Fe−0.546−0.759−0.686−0.4480.2060.2310.532−0.5090.029−0.483−0.670−0.370−0.3660.7700.85610.9350.9080.6890.752
K−0.666−0.729−0.692−0.3340.1380.1910.497−0.673−0.223−0.540−0.667−0.583−0.3640.8870.9650.93510.9930.7630.859
Mg−0.681−0.674−0.653−0.3420.1390.2110.481−0.705−0.287−0.517−0.674−0.621−0.3230.9180.9670.9080.99310.8080.896
Mn−0.586−0.222−0.245−0.4000.2640.5550.543−0.538−0.323−0.323−0.790−0.5930.0040.8930.7970.6890.7630.80810.864
Zn−0.561−0.409−0.447−0.279−0.0680.1690.262−0.676−0.580−0.458−0.587−0.573−0.0990.8500.8420.7520.8590.8960.8641
Values in bold are different from 0 with a significance level alpha = 0.05.
Table A2. Pearson correlation matrix of parameters, measured in purple basil ‘Red rubin’.
VariablesHeightLeaf AreaFresh WeightDM%β CaroteneLutein+Zea XanthinAscorbic AcidChicoric AcidRosmarinic AcidDPPHABTSPhenolsFRAPPCaFeKMgMnZn
Height10.4180.666−0.0390.2300.2750.279−0.6000.2990.5940.049−0.0790.212−0.660−0.321−0.1630.144−0.357−0.513−0.410
Leaf area0.41810.848−0.1730.3170.2600.316−0.0350.0420.2500.103−0.2060.079−0.666−0.412−0.353−0.246−0.480−0.588−0.702
Fresh weight0.6660.8481−0.2300.5120.4830.467−0.2870.0190.342−0.004−0.354−0.051−0.746−0.480−0.355−0.122−0.545−0.684−0.768
DM%−0.039−0.173−0.2301−0.706−0.739−0.692−0.2460.3220.3540.6460.6950.606−0.230−0.1430.0770.0430.023−0.1060.069
β carotene0.2300.3170.512−0.70610.9510.7440.079−0.1530.027−0.585−0.784−0.4730.0180.3180.1910.2640.1460.170−0.094
Lutein + Zeaxanthin0.2750.2600.483−0.7390.95110.767−0.046−0.259−0.025−0.721−0.844−0.5660.1180.2400.1620.3270.1060.155−0.032
Ascorbic acid0.2790.3160.467−0.6920.7440.7671−0.077−0.521−0.189−0.554−0.584−0.5390.077−0.016−0.0860.033−0.178−0.011−0.121
Chicoric acid−0.600−0.035−0.287−0.2460.079−0.046−0.0771−0.285−0.651−0.0360.040−0.2710.3540.233−0.197−0.5150.1150.321−0.001
Rosmarinic acid0.2990.0420.0190.322−0.153−0.259−0.521−0.28510.8210.4380.2860.800−0.4710.2700.3740.3480.256−0.058−0.011
DPPH0.5940.2500.3420.3540.027−0.025−0.189−0.6510.82110.3440.1080.713−0.6190.0930.3910.5140.143−0.208−0.085
ABTS0.0490.103−0.0040.646−0.585−0.721−0.554−0.0360.4380.34410.6380.746−0.550−0.265−0.234−0.261−0.272−0.406−0.397
Phenols−0.079−0.206−0.3540.695−0.784−0.844−0.5840.0400.2860.1080.63810.550−0.142−0.115−0.051−0.223−0.036−0.0870.037
FRAP0.2120.079−0.0510.606−0.473−0.566−0.539−0.2710.8000.7130.7460.5501−0.5020.0250.1350.1080.000−0.209−0.115
P−0.660−0.666−0.746−0.2300.0180.1180.0770.354−0.471−0.619−0.550−0.142−0.50210.5690.3910.2550.5790.8280.801
Ca−0.321−0.412−0.480−0.1430.3180.240−0.0160.2330.2700.093−0.265−0.1150.0250.56910.8350.6590.9050.9060.735
Fe−0.163−0.353−0.3550.0770.1910.162−0.086−0.1970.3740.391−0.234−0.0510.1350.3910.83510.8690.9230.7540.761
K0.144−0.246−0.1220.0430.2640.3270.033−0.5150.3480.514−0.261−0.2230.1080.2550.6590.86910.7200.5370.609
Mg−0.357−0.480−0.5450.0230.1460.106−0.1780.1150.2560.143−0.272−0.0360.0000.5790.9050.9230.72010.8970.848
Mn−0.513−0.588−0.684−0.1060.1700.155−0.0110.321−0.058−0.208−0.406−0.087−0.2090.8280.9060.7540.5370.89710.894
Zn−0.410−0.702−0.7680.069−0.094−0.032−0.121−0.001−0.011−0.085−0.3970.037−0.1150.8010.7350.7610.6090.8480.8941
Values in bold are different from 0 with a significance level alpha = 0.05.

References

  1. SharathKumar, M.; Heuvelink, E.; Marcelis, L.F.M. Vertical Farming: Moving from Genetic to Environmental Modification. Trends Plant Sci. 2020, 25, 724–727. [Google Scholar] [CrossRef] [PubMed]
  2. Beacham, A.M.; Vickers, L.H.; Monaghan, J.M. Vertical Farming: A Summary of Approaches to Growing Skywards. J. Hortic. Sci. Biotechnol. 2019, 94, 277–283. [Google Scholar] [CrossRef]
  3. Avgoustaki, D.D.; Li, J.; Xydis, G. Basil Plants Grown under Intermittent Light Stress in a Small-Scale Indoor Environment: Introducing Energy Demand Reduction Intelligent Technologies. Food Control 2020, 118, 107389. [Google Scholar] [CrossRef]
  4. Folta, K.M.; Klee, H.J. Sensory Sacrifices When We Mass-Produce Mass Produce. Hortic. Res. 2016, 3, 16032. [Google Scholar] [CrossRef]
  5. Johnson, A.J.; Meyerson, E.; De La Parra, J.; Savas, T.L.; Miikkulainen, R.; Harper, C.B. Flavor-Cyber-Agriculture: Optimization of Plant Metabolites in an Open-Source Control Environment through Surrogate Modeling. PLoS ONE 2019, 14, e0213918. [Google Scholar] [CrossRef]
  6. Walters, K.J.; Behe, B.K.; Currey, C.J.; Lopez, R.G. Historical, Current, and Future Perspectives for Controlled Environment Hydroponic Food Crop Production in the United States. Horts 2020, 55, 758–767. [Google Scholar] [CrossRef]
  7. Huang, L.C. Consumer Attitude, Concerns, and Brand Acceptance for the Vegetables Cultivated with Sustainable Plant Factory Production Systems. Sustainability 2019, 11, 4862. [Google Scholar] [CrossRef]
  8. Pattison, P.M.; Tsao, J.Y.; Brainard, G.C.; Bugbee, B. LEDs for Photons, Physiology and Food. Nature 2018, 563, 493–500. [Google Scholar] [CrossRef]
  9. Wong, C.E.; Teo, Z.W.N.; Shen, L.; Yu, H. Seeing the Lights for Leafy Greens in Indoor Vertical Farming. Trends Food Sci. Technol. 2020, 106, 48–63. [Google Scholar] [CrossRef]
  10. Annunziata, M.G.; Apelt, F.; Carillo, P.; Krause, U.; Feil, R.; Mengin, V.; Lauxmann, M.A.; Köhl, K.; Nikoloski, Z.; Stitt, M.; et al. Getting Back to Nature: A Reality Check for Experiments in Controlled Environments. J. Exp. Bot. 2017, 68, 4463–4477. [Google Scholar] [CrossRef]
  11. Viršilė, A.; Samuolienė, G.; Miliauskienė, J.; Duchovskis, P. Applications and Advances in LEDs for Horticulture and Crop Production. In Ultraviolet LED Technology for Food Applications; Elsevier: Amsterdam, The Netherlands, 2019; pp. 35–65. ISBN 9780128177945. [Google Scholar]
  12. Pennisi, G.; Pistillo, A.; Orsini, F.; Cellini, A.; Spinelli, F.; Nicola, S.; Fernandez, J.A.; Crepaldi, A.; Gianquinto, G.; Marcelis, L.F.M. Optimal Light Intensity for Sustainable Water and Energy Use in Indoor Cultivation of Lettuce and Basil under Red and Blue LEDs. Sci. Hortic. 2020, 272, 109508. [Google Scholar] [CrossRef]
  13. Ng, C.K.-Y. Plant Cell Biology: UVA on Guard. Curr. Biol. 2019, 29, R740–R742. [Google Scholar] [CrossRef]
  14. Viršilė, A.; Brazaitytė, A.; Vaštakaitė-Kairienė, V.; Miliauskienė, J.; Jankauskienė, J.; Novičkovas, A.; Laužikė, K.; Samuolienė, G. The Distinct Impact of Multi-Color LED Light on Nitrate, Amino Acid, Soluble Sugar and Organic Acid Contents in Red and Green Leaf Lettuce Cultivated in Controlled Environment. Food Chem. 2020, 310, 125799. [Google Scholar] [CrossRef] [PubMed]
  15. Wargent, J.J. UV LEDs in Horticulture: From Biology to Application. Acta Hortic. 2016, 1134, 25–32. [Google Scholar] [CrossRef]
  16. Neugart, S.; Schreiner, M. UVB and UVA as Eustressors in Horticultural and Agricultural Crops. Sci. Hortic. 2018, 234, 370–381. [Google Scholar] [CrossRef]
  17. Chen, Y.; Li, T.; Yang, Q.; Zhang, Y.; Zou, J.; Bian, Z.; Wen, X. UVA Radiation Is Beneficial for Yield and Quality of Indoor Cultivated Lettuce. Front. Plant Sci. 2019, 10, 1563. [Google Scholar] [CrossRef] [PubMed]
  18. Brazaitytė, A.; Viršilė, A.; Jankauskienė, J.; Sakalauskienė, S.; Samuolienė, G.; Sirtautas, R.; Novičkovas, A.; Dabašinskas, L.; Miliauskienė, J.; Vaštakaitė, V.; et al. Effect of Supplemental UV-A Irradiation in Solid-State Lighting on the Growth and Phytochemical Content of Microgreens. Int. Agrophysics 2015, 29, 13–22. [Google Scholar] [CrossRef]
  19. Mickens, M.A.; Torralba, M.; Robinson, S.A.; Spencer, L.E.; Romeyn, M.W.; Massa, G.D.; Wheeler, R.M. Growth of Red Pak Choi under Red and Blue, Supplemented White, and Artificial Sunlight Provided by LEDs. Sci. Hortic. 2019, 245, 200–209. [Google Scholar] [CrossRef]
  20. Samuoliene, G.; Virsile, A.; Miliauskienė, J.; Haimi, P.; Laužikė, K.; Jankauskienė, J.; Novičkovas, A.; Kupčinskienė, A.; Brazaitytė, A. The Photosynthetic Performance of Red Leaf Lettuce under UV-A Irradiation. Agronomy 2020, 10, 761. [Google Scholar] [CrossRef]
  21. Jensen, N.B.; Clausen, M.R.; Kjaer, K.H. Spectral Quality of Supplemental LED Grow Light Permanently Alters Stomatal Functioning and Chilling Tolerance in Basil (Ocimum basilicum L.). Sci. Hortic. 2018, 227, 38–47. [Google Scholar] [CrossRef]
  22. Goto, E.; Hayashi, K.; Furuyama, S.; Hikosaka, S.; Ishigami, Y. Effect of UV Light on Phytochemical Accumulation and Expression of Anthocyanin Biosynthesis Genes in Red Leaf Lettuce. Acta Hortic. 2016, 1134, 179–186. [Google Scholar] [CrossRef]
  23. Brazaitytė, A.; Viršilė, A.; Samuolienė, G.; Vaštakaitė-Kairienė, V.; Jankauskienė, J.; Miliauskienė, J.; Novičkovas, A.; Duchovskis, P. Response of Mustard Microgreens to Different Wavelengths and Durations of UV-A LEDs. Front. Plant Sci. 2019, 10, 1153. [Google Scholar] [CrossRef]
  24. Dou, H.; Niu, G.; Gu, M. Pre-Harvest UV-B Radiation and Photosynthetic Photon Flux Density Interactively Affect Plant Photosynthesis, Growth, and Secondary Metabolites Accumulation in Basil (Ocimum basilicum) Plants. Agronomy 2019, 9, 434. [Google Scholar] [CrossRef]
  25. Sęczyk, Ł.; Ozdemir, F.A.; Kołodziej, B. In Vitro Bioaccessibility and Activity of Basil (Ocimum basilicum L.) Phytochemicals as Affected by Cultivar and Postharvest Preservation Method–Convection Drying, Freezing, and Freeze-Drying. Food Chem. 2022, 382, 132363. [Google Scholar] [CrossRef] [PubMed]
  26. Sharma, O.P.; Bhat, T.K. DPPH Antioxidant Assay Revisited. Food Chem. 2009, 113, 1202–1205. [Google Scholar] [CrossRef]
  27. Re, R.; Pellegrini, N.; Proteggente, A.; Pannala, A.; Yang, M.; Rice-Evans, C. Antioxidant Activity Applying an Improved ABTS Radical Cation Decolorization Assay. Free Radic. Biol. Med. 1999, 26, 1231–1237. [Google Scholar] [CrossRef] [PubMed]
  28. Benzie, I.F.F.; Strain, J.J. The Ferric Reducing Ability of Plasma (FRAP) as a Measure of “Antioxidant Power”: The FRAP Assay. Anal. Biochem. 1996, 239, 70–76. [Google Scholar] [CrossRef] [PubMed]
  29. Kraujalytė, V.; Venskutonis, P.R.; Pukalskas, A.; Česonienė, L.; Daubaras, R. Antioxidant Properties and Polyphenolic Compositions of Fruits from Different European Cranberrybush (Viburnum opulus L.) Genotypes. Food Chem. 2013, 141, 3695–3702. [Google Scholar] [CrossRef]
  30. Romero Rodriguez, M.A.; Vazquez Oderiz, M.L.; Lopez Hernandez, J.; Lozano, J.S. Determination of Vitamin C and Organic Acids in Various Fruits by HPLC. J. Chromatogr. Sci. 1992, 30, 433–437. [Google Scholar] [CrossRef]
  31. Araújo, G.C.L.; Gonzalez, M.H.; Ferreira, A.G.; Nogueira, A.R.A.; Nóbrega, J.A. Effect of Acid Concentration on Closed-Vessel Microwave-Assisted Digestion of Plant Materials. Spectrochim. Acta Part B At. Spectrosc. 2002, 57, 2121–2132. [Google Scholar] [CrossRef]
  32. Barbosa, J.T.P.; Santos, C.M.M.; Peralva, V.N.; Flores, E.M.M.; Korn, M.; Nóbrega, J.A.; Korn, M.G.A. Microwave-Assisted Diluted Acid Digestion for Trace Elements Analysis of Edible Soybean Products. Food Chem. 2015, 175, 212–217. [Google Scholar] [CrossRef]
  33. Choi, D.-S.; Nguyen, T.K.L.; Oh, M.-M. Growth and Biochemical Responses of Kale to Supplementary Irradiation with Different Peak Wavelengths of UV-A Light-Emitting Diodes. Hortic. Environ. Biotechnol. 2022, 63, 65–76. [Google Scholar] [CrossRef]
  34. Brazaitytė, A.; Viršilė, A.; Samuolienė, G.; Vaštakaitė-Kairienė, V.; Miliauskienė, J.; Jankauskienė, J.; Duchovskis, P. Effect of Supplemental UV-A Radiation on Mineral Elements Content and Nitrate Variation in Brassica Microgreens. Acta Hortic. 2020, 1296, 675–682. [Google Scholar] [CrossRef]
  35. Appolloni, E.; Pennisi, G.; Zauli, I.; Carotti, L.; Paucek, I.; Quaini, S.; Orsini, F.; Gianquinto, G. Beyond Vegetables: Effects of Indoor LED Light on Specialized Metabolite Biosynthesis in Medicinal and Aromatic Plants, Edible Flowers, and Microgreens. J. Sci. Food Agric. 2022, 102, 472–487. [Google Scholar] [CrossRef]
  36. Mao, P.; Duan, F.; Zheng, Y.; Yang, Q. Blue and UV-A Light Wavelengths Positively Affected Accumulation Profiles of Healthy Compounds in Pak-choi. J. Sci. Food Agric. 2021, 101, 1676–1684. [Google Scholar] [CrossRef] [PubMed]
  37. Hosseini, A.; Zare Mehrjerdi, M.; Aliniaeifard, S.; Seif, M. Photosynthetic and Growth Responses of Green and Purple Basil Plants under Different Spectral Compositions. Physiol. Mol. Biol. Plants 2019, 25, 741–752. [Google Scholar] [CrossRef]
  38. He, R.; Zhang, Y.; Song, S.; Su, W.; Hao, Y.; Liu, H. UV-A and FR Irradiation Improves Growth and Nutritional Properties of Lettuce Grown in an Artificial Light Plant Factory. Food Chem. 2021, 345, 128727. [Google Scholar] [CrossRef] [PubMed]
  39. Lee, J.-H.; Oh, M.-M.; Son, K.-H. Short-Term Ultraviolet (UV)-A Light-Emitting Diode (LED) Radiation Improves Biomass and Bioactive Compounds of Kale. Front. Plant Sci. 2019, 10, 1042. [Google Scholar] [CrossRef]
  40. Iwai, M.; Ohta, M.; Tsuchiya, H.; Suzuki, T. Enhanced Accumulation of Caffeic Acid, Rosmarinic Acid and Luteolin-Glucoside in Red Perilla Cultivated under Red Diode Laser and Blue LED Illumination Followed by UV-A Irradiation. J. Funct. Foods 2010, 2, 66–70. [Google Scholar] [CrossRef]
  41. Li, Q.; Kubota, C. Effects of Supplemental Light Quality on Growth and Phytochemicals of Baby Leaf Lettuce. Environ. Exp. Bot. 2009, 67, 59–64. [Google Scholar] [CrossRef]
  42. Badmus, U.O.; Ač, A.; Klem, K.; Urban, O.; Jansen, M.A.K. A Meta-Analysis of the Effects of UV Radiation on the Plant Carotenoid Pool. Plant Physiol. Biochem. 2022, 183, 36–45. [Google Scholar] [CrossRef] [PubMed]
  43. Lin, K.-H.; Huang, M.-Y.; Hsu, M.-H. Morphological and Physiological Response in Green and Purple Basil Plants (Ocimum Basilicum) under Different Proportions of Red, Green, and Blue LED Lightings. Sci. Hortic. 2021, 275, 109677. [Google Scholar] [CrossRef]
  44. Verdaguer, D.; Jansen, M.A.K.; Llorens, L.; Morales, L.O.; Neugart, S. UV-A Radiation Effects on Higher Plants: Exploring the Known Unknown. Plant Sci. 2017, 255, 72–81. [Google Scholar] [CrossRef] [PubMed]
Figure 1. Growth parameters of green and purple basils, illuminated with red and blue LEDs (RB), supplemented with different UV-A wavelengths (nm) ( x ¯ ± S D ,   n = 9 ) . (a,b)—fresh weight and dry weight %, (c,d)—basil height and leaf area. (a,c)—green leaf basil ‘Italiano classico’. (b,d)—purple leaf basil ‘Red rubin’. Different letters indicate statistically significant differences between means according to Tukey’s HSD test at the confidence level p = 0.05.
Horticulturae 09 01168 g001aHorticulturae 09 01168 g001b
Figure 2. Nutraceutical contents in green and purple basils, illuminated with red and blue LEDs (RB), supplemented with different UV-A wavelengths (nm) ( x ¯ ± S D ,   n = 9 ) . (a,c)—green leaf basil ‘Italiano classico’. (b,d)—purple leaf basil ‘Red rubin’. Different letters indicate statistically significant differences between means according to Tukey’s HSD test at the confidence level p = 0.05.
Horticulturae 09 01168 g002
Figure 3. The PCA scatterplot, indicating distinct differences in green (a) and purple (b) basil (3 experimental replications), cultivated under red and blue LEDs (RB) lighting, supplemented with different UV-A wavelengths (nm).
Horticulturae 09 01168 g003
Table 1. The antioxidant properties of green and purple basil (DW), illuminated with red and blue LED light, supplemented with different UV-A wavelengths (nm) ( x ¯ ± S D ,   n = 9 ) . Different letters indicate statistically significant differences between means according to Tukey’s HSD test at the confidence level p = 0.05.
DPPH,
μmol g−1
ABTS,
μmol g−1
FRAP,
mmol Trolox g−1
‘Italiano classico’
RB388.0 c1113 b145.2 a
RB + 343416.2 b1521 a145.7 a
RB + 366406.4 b1363 ab145.7 a
RB + 386405.7 b1096 b138.1 a
RB + 402473.2 a1197 b152.3 a
‘Red rubin’
RB375.8 b1503 b141.4 c
RB + 343506.6 a1619 ab157.3 bc
RB + 366522.8 a1996 a183.9 ab
RB + 386495.32 a2058 a189.7 a
RB + 402378.8 b1881 ab154.5 c
Table 2. Mineral element contents in green and purple basil (DW), illuminated with red and blue LEDs (RB), supplemented with different UV-A wavelengths (nm) ( x ¯ ± S D ,   n = 9 ) . Different letters indicate statistically significant differences between means according to Tukey’s HSD test at the confidence level p = 0.05.
‘Italiano Classico’
mg g−1 DW:PCaFeKMgMnZn
RB10.54 a26.62 a0.09 a30.24 a8.18 a0.05 a0.04 a
RB + 3435.33 d14.64 e0.06 b22.30 c5.23 d0.03 b0.02 c
RB + 3666.62 c18.43 c0.06 b25.05 b6.32 c0.04 ab0.03 b
RB + 3867.97 b22.63 b0.09 a28.34 a7.22 b0.04 ab0.03 b
RB + 4027.15bc17.28 d0.06 b22.63 c5.51 cd0.04 ab0.02 c
‘Red Rubin’
mg g−1 DW:PCaFeKMgMnZn
RB15.40 a27.37 a0.10 a29.58 a9.58 a0.07 a0.05 a
RB + 3439.46 bc25.54 b0.10 a29.56 a9.03 abc0.06 b0.03 b
RB + 3669.33 c22.34 c0.09 a29.16 a8.68 bc0.05 b0.04 ab
RB + 38611.29 b28.39 a0.11 a29.05 a9.83 a0.07 a0.04 ab
RB + 40210.30 bc21.31 c0.07 b25.33 b8.17 c0.05 b0.03 b
Disclaimer/Publisher’s Note: The statements, opinions and data contained in all publications are solely those of the individual author(s) and contributor(s) and not of MDPI and/or the editor(s). MDPI and/or the editor(s) disclaim responsibility for any injury to people or property resulting from any ideas, methods, instructions or products referred to in the content.

