Article

‘Miguang’ Grape Response to Pergola and Single-Curtain Training Systems

1
State Key Laboratory of Crop Biology, Collaborative Innovation Center of Fruit & Vegetable Quality and Efficient Production in Shandong, College of Horticulture Science and Engineering, Shandong Agricultural University, Tai’an 271018, China
2
National Agricultural Science and Technology Park of the Yellow River Delta, Binzhou 256600, China
*
Authors to whom correspondence should be addressed.
These authors have contributed equally to this work.
Horticulturae 2023, 9(1), 113; https://doi.org/10.3390/horticulturae9010113
Submission received: 9 December 2022 / Revised: 7 January 2023 / Accepted: 11 January 2023 / Published: 14 January 2023
(This article belongs to the Special Issue Viticulture under Constantly Changing Climate Conditions)

Abstract

:
Background and Aims: Grapevine shoot growth and light utilization are typically adjusted through the use of canopy management strategies that are adapted to the local climate. In this study, we analyze the effects of a pergola (PER) and single-curtain training system (SCT) on the microclimate, light interception, photosynthetic capacity, and assimilate distribution of ‘Miguang’ grape in a rainy region of China. Methods and Results: We measured light interception, spectral absorptance, leaf area, chlorophyll content, photosynthetic rate, soluble sugar and starch content per cane, assimilate distribution berry weight, soluble solids, and titratable acid content. SCT produced a higher photosynthetic photon flux density in the cluster region, a canopy light absorptance in the 450–800 nm wavelength range, higher chlorophyll content, and larger leaf area of the middle node leaves. It produced lower basal and top leaves leaf areas. At berry expansion (E-L-31) and veraison (E-L-35), the net photosynthetic capacity of the leaves from the base to the middle nodes was higher with SCT than with the PER, and the net photosynthetic capacity of leaves near the top was reduced with SCT. At the harvest period, the net photosynthetic rate of the middle and top node leaves and the shoot photosynthetic rate were higher with SCT than with the PER. The distribution of assimilates to the fruit was higher with SCT. In addition, SCT produced a higher shoot soluble sugar and lower internode length from the fourth to sixth nodes, and it produced a higher shoot starch content and internode diameter in the fourth internode. Conclusions: SCT significantly improved photosynthetic photon flux density in the cluster, promoted assimilate distribution to fruit, decreased vegetative growth, increased chlorophyll content, increased the leaf size of the middle node on the primary shoot, and increased shoot soluble sugar from the fourth to sixth nodes. Significance of this Study: The results of this study can provide a relevant theoretical basis and technical support for grape canopy management.

1. Introduction

Grape is a type of perennial vine with soft shoots. In the primeval forest, it grows upward by means of its strong climbing ability. For example, in wild European grapevine (Vitis vinifera L. subsp. sylvestris (C.C. Gmel.) Hegi) natural habitats, grape often leans on supporter treetops and forms pendulous canopy shapes over supporter plants; thus, it is interesting to consider pendulous-type growth as a promising ‘survival’ mechanism and economical method of growth. Environmental factors, such as temperature and light, are the main factors that affect the growth and development of fruit trees [1]. Grapevine training systems can influence the light microclimate, temperature, humidity, other environmental factors, and vine performance [2,3,4], Different leaf canopies not only affect the growth of new shoots, but also influence light interception, environmental factors, and the photosynthesis of leaves [5,6]. An appropriate leaf canopy shape can improve environmental conditions, regulate grape vegetative and reproductive growth, and improve the utilization rate of light energy, which has an important influence on the quality and yield of grape berries [7]. For example, shoot growth on a vertical trellis system is more vigorous, whereas a pergola trellis can be used to reduce vigor [8]. To control grapevine growth and promote fruit quality, different canopy management practices adapted to the local climate are typically used to adjust grapevine shoot growth and berry quality [9]. The selection of the most efficient leaf canopy training system in an unfavorable climatic region is, therefore, highly important.
China has a marked continental monsoonal climate characterized by hot and rainysummers [10], and the synergistic effects of many factors, such as rain, insufficient light, and high air and soil humidity, together accelerate the growth of grape shoots, leading to more frequent pruning and poor fruit quality [11]. There is a marked trend towards the vigorous summer growth of grape shoots in most grape-producing areas of China, and the vigor of the vines must be controlled in order to ensure fruit quality and the vegetative balance of the plants [12]. Moreover, fungi spread rapidly and easily under humid and hot conditions, which induces grape disease occurrence and yield decline [13].
‘Miguang’ grape is a hybrid of Kyoho and Zaoheibao; a labor-saving variety, the natural berry is large and thinning-free, and it has more resistance to fungi disease than do V. vinifera varieties [14]. The objective of this study is to evaluate the effects of different vine architectures on the fruit microenvironment, light interception, leaf photosynthetic capacity, and photosynthate distribution of ‘Miguang’ grape in Shandong Province, China. Though canopy management is a relatively new concept and, commercially, the adoption of new techniques is relatively challenging, it is nevertheless important to investigate and find the most appropriate canopy, especially in light of climate change and local climate specificities, such as the rainy climate in China.

2. Materials and Methods

2.1. Experimental Field Site

A field experiment was conducted in Tai’an, Shandong Province, China (36°17′ N, 117°16′ E) during the 2020, 2021, and 2022 growing seasons. This region experiences a continental monsoon climate, with 2195.2 h of average sunshine annually and 697 mm of average precipitation. Most precipitation and high temperatures are concentrated in the grape-growing season. The vineyard soil is classified as a sandy loam soil.

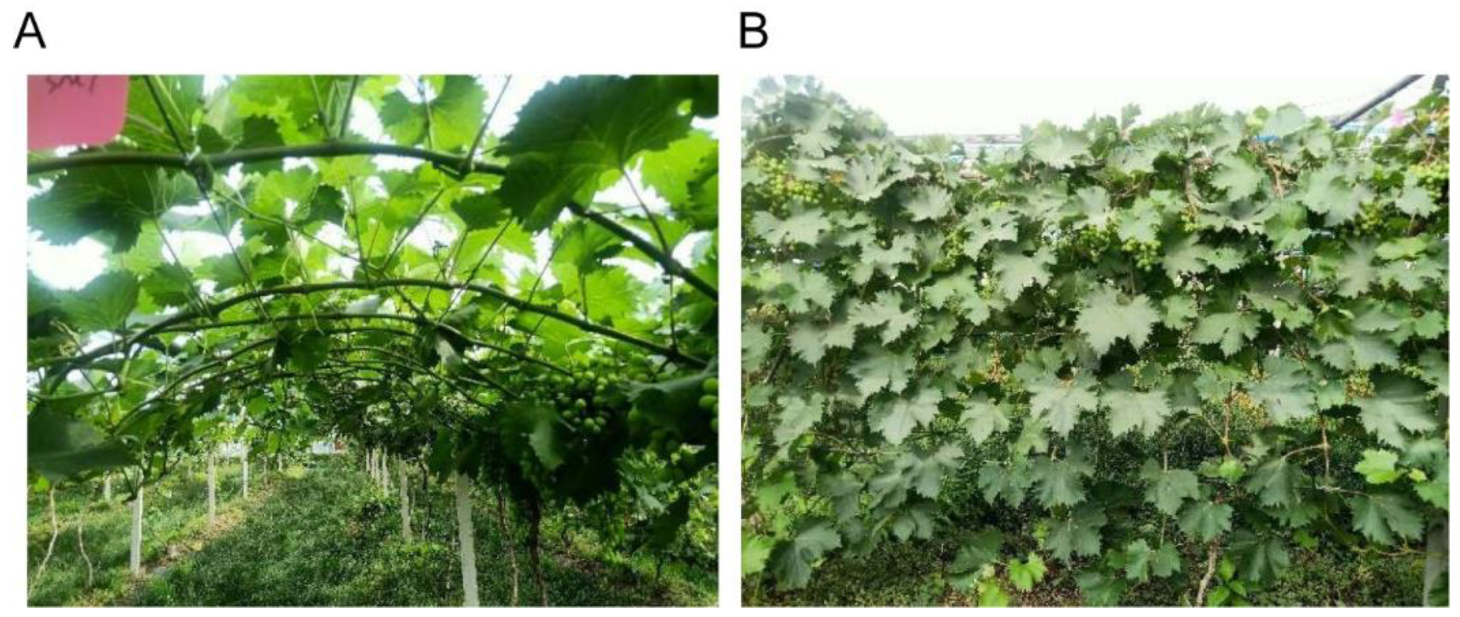
2.2. Experimental Design

Three-year-old ‘Miguang’ (Kyoho × Zaoheibao) grapevines grafted on ‘SA15′ rootstock and grown in a north–south orientation were used in this study. Drip-irrigation technology was used to easily control the amount of irrigation. The plant spacing was 1.5 m, the row spacing was 3 m, and the vine height was 1.8 m. The vines were separately trained to form two different training systems. The PER had one cane at 1.8 m above the ground, and all shoots were positioned into catch wires on a pergola trellis (Figure 1A). The experimental design used in this study was a completely randomized block design. SCT had one cane at 1.8 m above the ground, and all shoots were positioned to bend vertically downward (Figure 1B). We installed three replicates of each training system, with one row of 40 plants for each replicate. The primary shoot was pruned when the shoot length was about 150 cm; the lateral shoots from the trunk to the cluster position were simultaneously removed. The lateral shoots above the bunch were pruned, and one leaf per lateral shoot was left to increase the effective photosynthetic leaf area, except for that of the lateral shoot close to the shoot tip, and the total leaf number was 24 for each shoot after pruning. With shoot growth, the lateral shoot was pruned for the second time, and the winter bud of the lateral shoot was simultaneously removed. The leaf area index, light interception, spectral absorptance, leaf area, and chlorophyll content were measured at veraison (E-L-35), and the leaf net photosynthetic rate was measured at fruit expansion (5 weeks after flowering) (E-L-31), veraison (E-L-35), and harvest (13 weeks after flowering). The shoot net photosynthetic rate was determined at the harvest period. 13C labeling was performed at fruit expansion (5 weeks after flowering) and veraison (9 weeks after flowering). The soluble sugar content and starch content of the shoots were measured in late November.

2.3. Determination of Microclimate

Humidity and temperature data were collected hourly in each canopy using a commercial monitor (LUGE, L92-1, Hangzhou, Zhejiang, China); this device was placed inside the vine foliage in the cluster zone of each training system. The photosynthetic photon flux density (PPFD) was measured at 10:00 a.m. and 14:00 a.m. with a monitoring probe (PHFPH-5V-V2) placed around the cluster.

2.4. Determination of Light Interception

Canopy light interception was measured at veraison, as described in Montgomery [15]. At veraison, a 1.6 × 1.6 m quadrat with the trunk at the center was established. The photosynthetic photon flux density (PPFD) was measured at 11:00 a.m. on cloudless and windless sunny days. Five light intensity measurement instruments (Spectrum 3415F type) were mounted on five small self-leveling platforms on a pole with a distance of 0.4 m between the instruments. First, the instantaneous PPFD above the canopy was measured; then, the instantaneous PPFD on the ground below the canopy was measured. Light interception (% light interception) was calculated as ([above-canopy PPFD − below-canopy PPFD]/above-canopy PPFD) × 100.

2.5. Determination of Spectral Absorptance

Canopy hyperspectral measurements were conducted at veraison, as described in a previous report [16,17]. The measurements were performed on a sunny day with no visible cloud cover between 10:00 a.m. and 11:00 a.m., using a single-detector spectrometer (400–800 nm range with a 1 nm spectral resolution, UniSpec, PP Systems, Amesbury, MA, USA). Before measurement, the spectrometer was calibrated with a white panel. When the light intensity changed, the device was recalibrated. Light reflectance was measured 50 cm above the middle node leaves, and light transmittance was measured 50 cm below the middle node leaves. Light absorptance was calculated as Light absorptance = Natural spectrum − Light reflectance − Light transmittance. There were ten replicate measurements for each canopy treatment.

2.6. Determination of Leaf Area

At veraison, leaves were collected from every node, and their areas were measured using Digimizer software.

2.7. Determination of Chlorophyll and Carotenoid Contents

The chlorophyll content of even node leaves was measured at veraison, following the method described by Lichtenthaler [18] with minor modifications. A sample of fresh leaf tissue (0.2 g) was dried, cut up, and placed in a 25 mL glass test tube, 10 mL of 95% ethanol was added, and the tissue was extracted for 24 h in the dark. After 24 h, the volume was brought up to the 25 mL scale line with 95% ethanol. The extract was collected, and its absorbance at 649 nm, 665 nm, and 470 nm was compared to that of a blank. The amount of chlorophyll present in the sample was calculated by Shinano’s formula. Chl a (mg·g−1) = [(13.95 × A665) − (6.88 × A649)] × mL ethanol/mg leaf tissue. Chl b (mg·g−1) = [(24.96 × A649) − (7.32 × A665)] × ml ethanol/mg leaf tissue. Carotenoids (mg·g−1) = [(1000 × A470) − (2.05 × Chl a) − (114.8 × Chl b)]/245 × ml ethanol/mg leaf tissue. Total Chl = Chl a + Chl b.

2.8. Determination of Leaf Net Photosynthetic Rate

The CIRAS-3 portable photosynthesis system (PP Systems, Amesbury, MA, USA) was used to determine the net photosynthetic rate (Pn) of the leaves at the even-numbered nodes of the shoots at 9 a.m.–10 a.m. on a clear day during the berry expansion stage, the veraison, and harvest. The photosynthetic parameters of the photosynthesis meters were manual control CO2 concentration 385 ± 5 µmol·mol, a leaf temperature of 30 °C, light intensity 1200 µmol·m−2·s−1, and a relative humidity of 75 ± 5% in the sample chamber.

2.9. Determination of Shoot Net Photosynthetic Rate

The shoot net photosynthetic rate (Pn) was determined using a CIRAS-3 portable photosynthesis system (PP Systems, Amesbury, MA, USA) between 8:00 a.m. and 10:00 a.m. on a clear day during the harvest stage. The photosynthesis system was connected to a cylindrical acrylic plexiglass assimilation chamber (1.6 m high, 30 cm diameter, light transmittance > 92%) with an air pump. The following parameters and equations were used:
Pn (μmol·m−2·s−1) = (A × Area × Fb/Fc)/Aleaf
A: Photosynthetic rate (μmol·m−2·s−1)
Area: Area setting on photosynthetic apparatus (4 cm2)
Fb: Air pump flow rate (18 L/min)
Fc: Leaf chamber flow rate (0.2 L/min)
Aleaf: Total leaf area per shoot (cm2)

2.10. 13C Labeling and Calculation of 13C

At the fruit expansion and veraison periods, leaves of the primary shoot and the lateral shoot opposite a cluster on PER and SCT plants were treated with 13CO2, and the light intensity was 1100 umol·m−2·s−1. 13C pulse markers were applied in a labeling chamber made of transparent agricultural film to confirm the airtightness of the chamber before labeling. Then, 1 mL of 1 mol·L−1 HCl was injected with a syringe into a centrifuge tube that contained 0.5 g Ba13CO3. Additional HCl was injected every 0.5 h to maintain the CO2 concentration. The environmental CO2 concentration was 360 μmol·mol−1, and the labeling time was 4 h. The shoot bases were girdled to prevent carbohydrate transport to roots and other shoots. At the same time, three other plants were selected as controls (13C natural abundance). The berries, labeled leaves, and shoots were collected for 13C measurement on the third day after labeling.
The samples were dried, ground in an electric grinder, and filtered with a 0.25 mm mesh screen. The abundance of 13C was measured with a DELTA V Advantage mass spectrometer from the Hebei Academy of Agriculture and Forestry Sciences. Three replicates were conducted for each treatment. The formula was calculated according to a previously used method [19].
Calculation of 13C Abundance of 13C:
F i   % = δ 13 C   + 1000 × R P D B δ 13 C   + 1000 × R P D B + 1000 × 100 %
RPBD (standard ratio of carbon isotope) = 0.0112372
Carbon content of each organ: Ci = amount of dry matter (g) × total carbon content (%)
13C content of each organ: 13Ci (mg) = C i × F i F n l 100 × 1000
Fnl: no 13C labelling, natural abundance of 13C in each organ
13C distribution rate: 13C (%) =   13 C i   13 C n e t   a b s o r p t i o n   × 100%

2.11. Determination of Shoot Soluble Sugar and Starch Contents

The soluble sugar and starch contents of shoots were measured by anthrone method, following the method described by Montgomery [15].

2.12. Statistical Analysis

Data were analysed using Microsoft Excel 2007 and are presented as the means of replicates per treatment. One-way analysis of variance (ANOVA) and Duncan’s multiple range tests were performed in SAS 9.2 software (SAS Institute Inc., Cary, NC, USA) to determine the significance of differences among samples at the 0.05 significance level.

3. Results

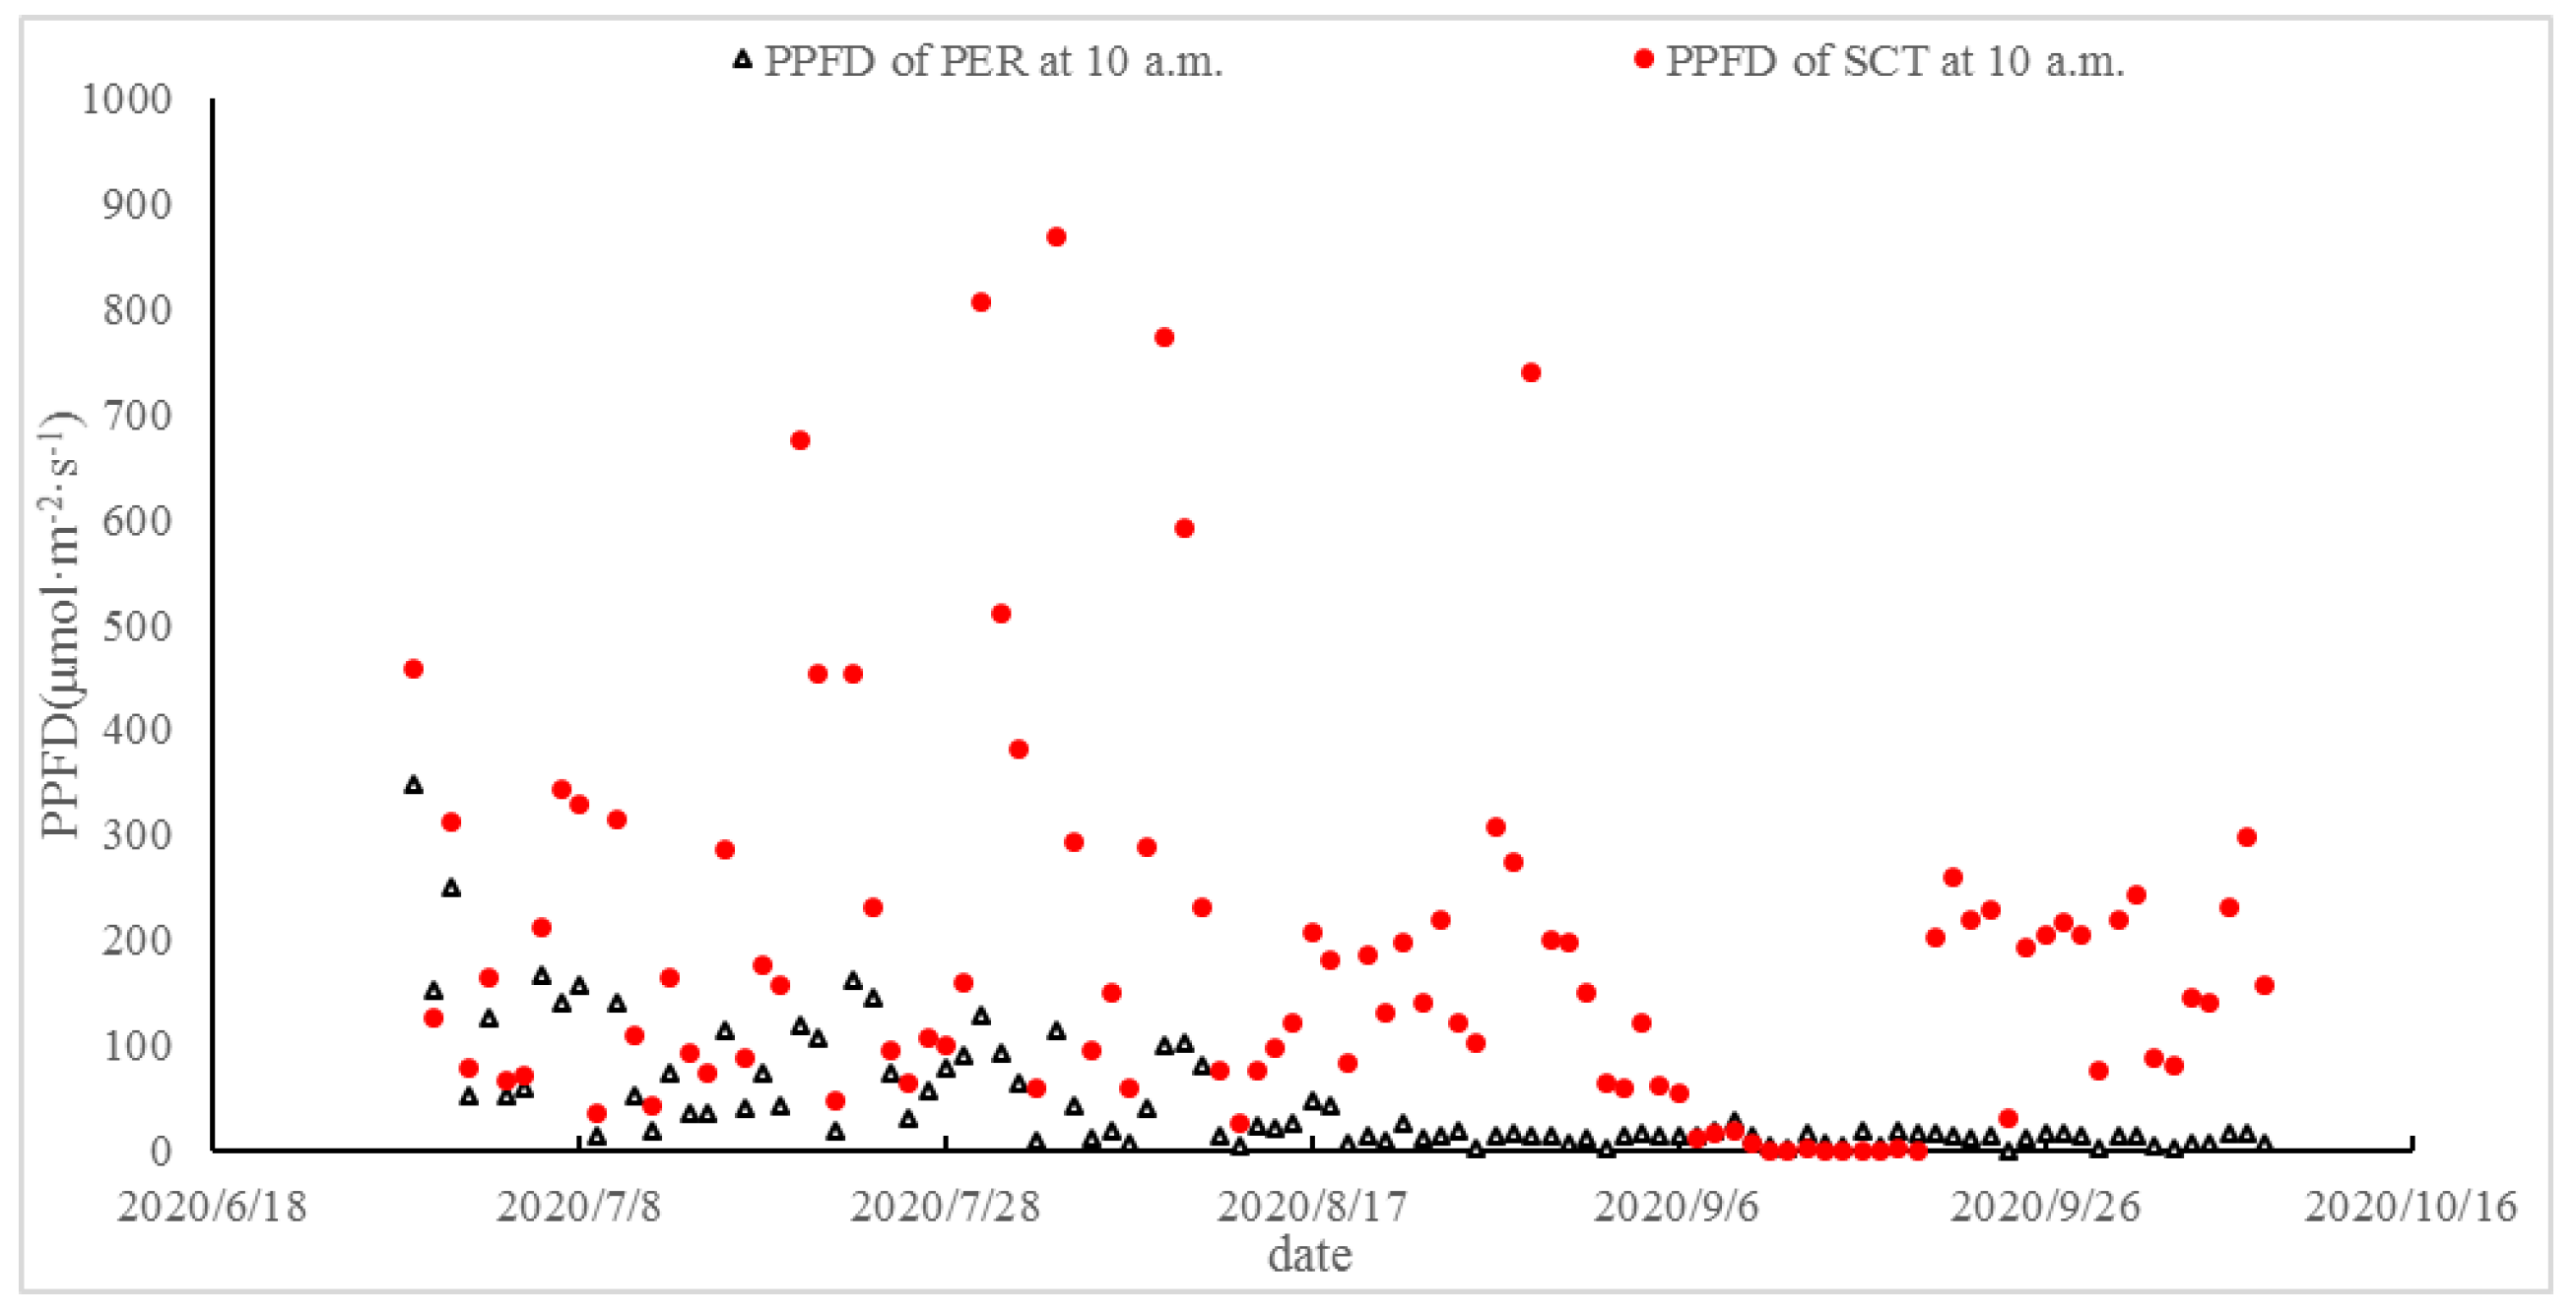
3.1. Effects of PER and SCT on the Light Intensity in the Cluster Zone

The PPFD near the grape clusters in the two canopy types is shown in Figure 2. The PPFD in the cluster zone was higher with SCT than with PER. With PER, the leaves above the cluster gradually formed a shaded area with time, and the light intensity in the cluster zone, therefore, gradually decreased with time. The light intensity in the cluster zone of SCT was less affected by shoot development, and the light intensity in the cluster zone was, therefore, higher in the single-curtain training system. The maximum daily light intensity in PER varied from 0 to 350 μmol·m−2·s−1 at 10:00 a.m., whereas the maximum light intensity in SCT varied from 0 to 900 μmol·m−2·s−1 at 10:00 a.m.

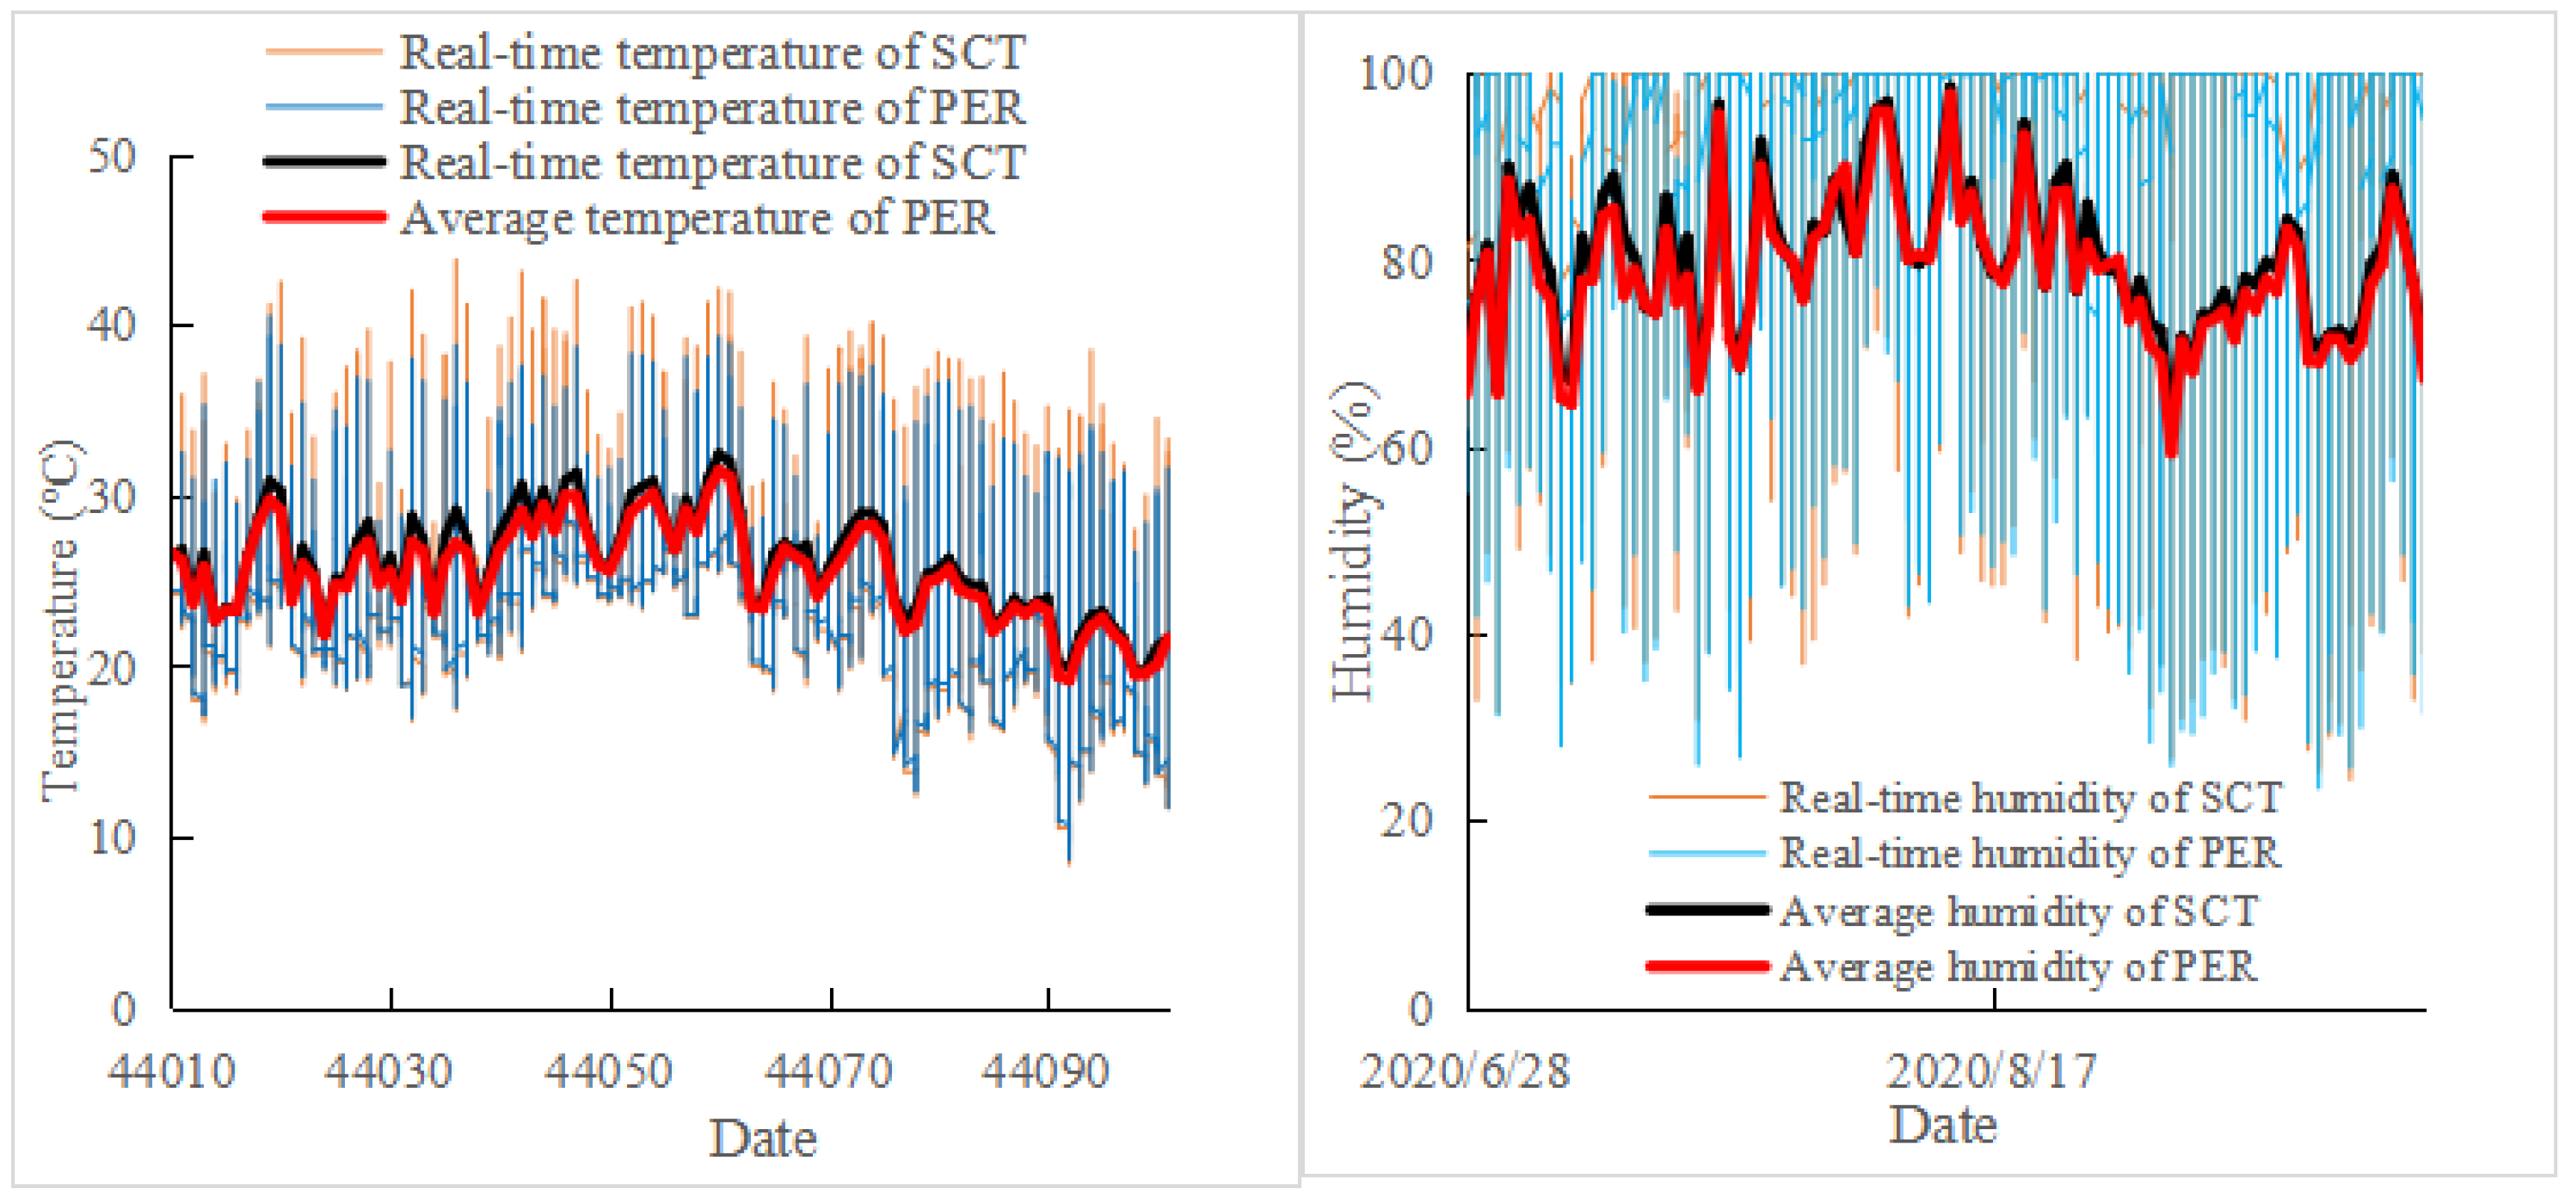
3.2. Effects of PER and SCT on Temperature in the Cluster Zone

The highest temperature and the average temperature of the cluster zone was higher in SCT than in the PER (Figure 3). The average temperature of SCT in July, August, and September was 0.7 °C, 0.63 °C, and 0.54 °C higher than that of the PER, respectively. In July, August, and September, the duration > 35 °C was 7.73%, 6.72%, and 3.89% higher in SCT than in the PER, respectively. The day–night temperature difference was 3.6 °C, 3.5 °C, and 2.9 °C higher in SCT than in the PER in July, August, and September, respectively. The average daily air humidity was higher in SCT than in the PER in early July and October, but there were no significant differences in air humidity between the PER and SCT in other months.

3.3. Effects of PER and SCT on Light Interception

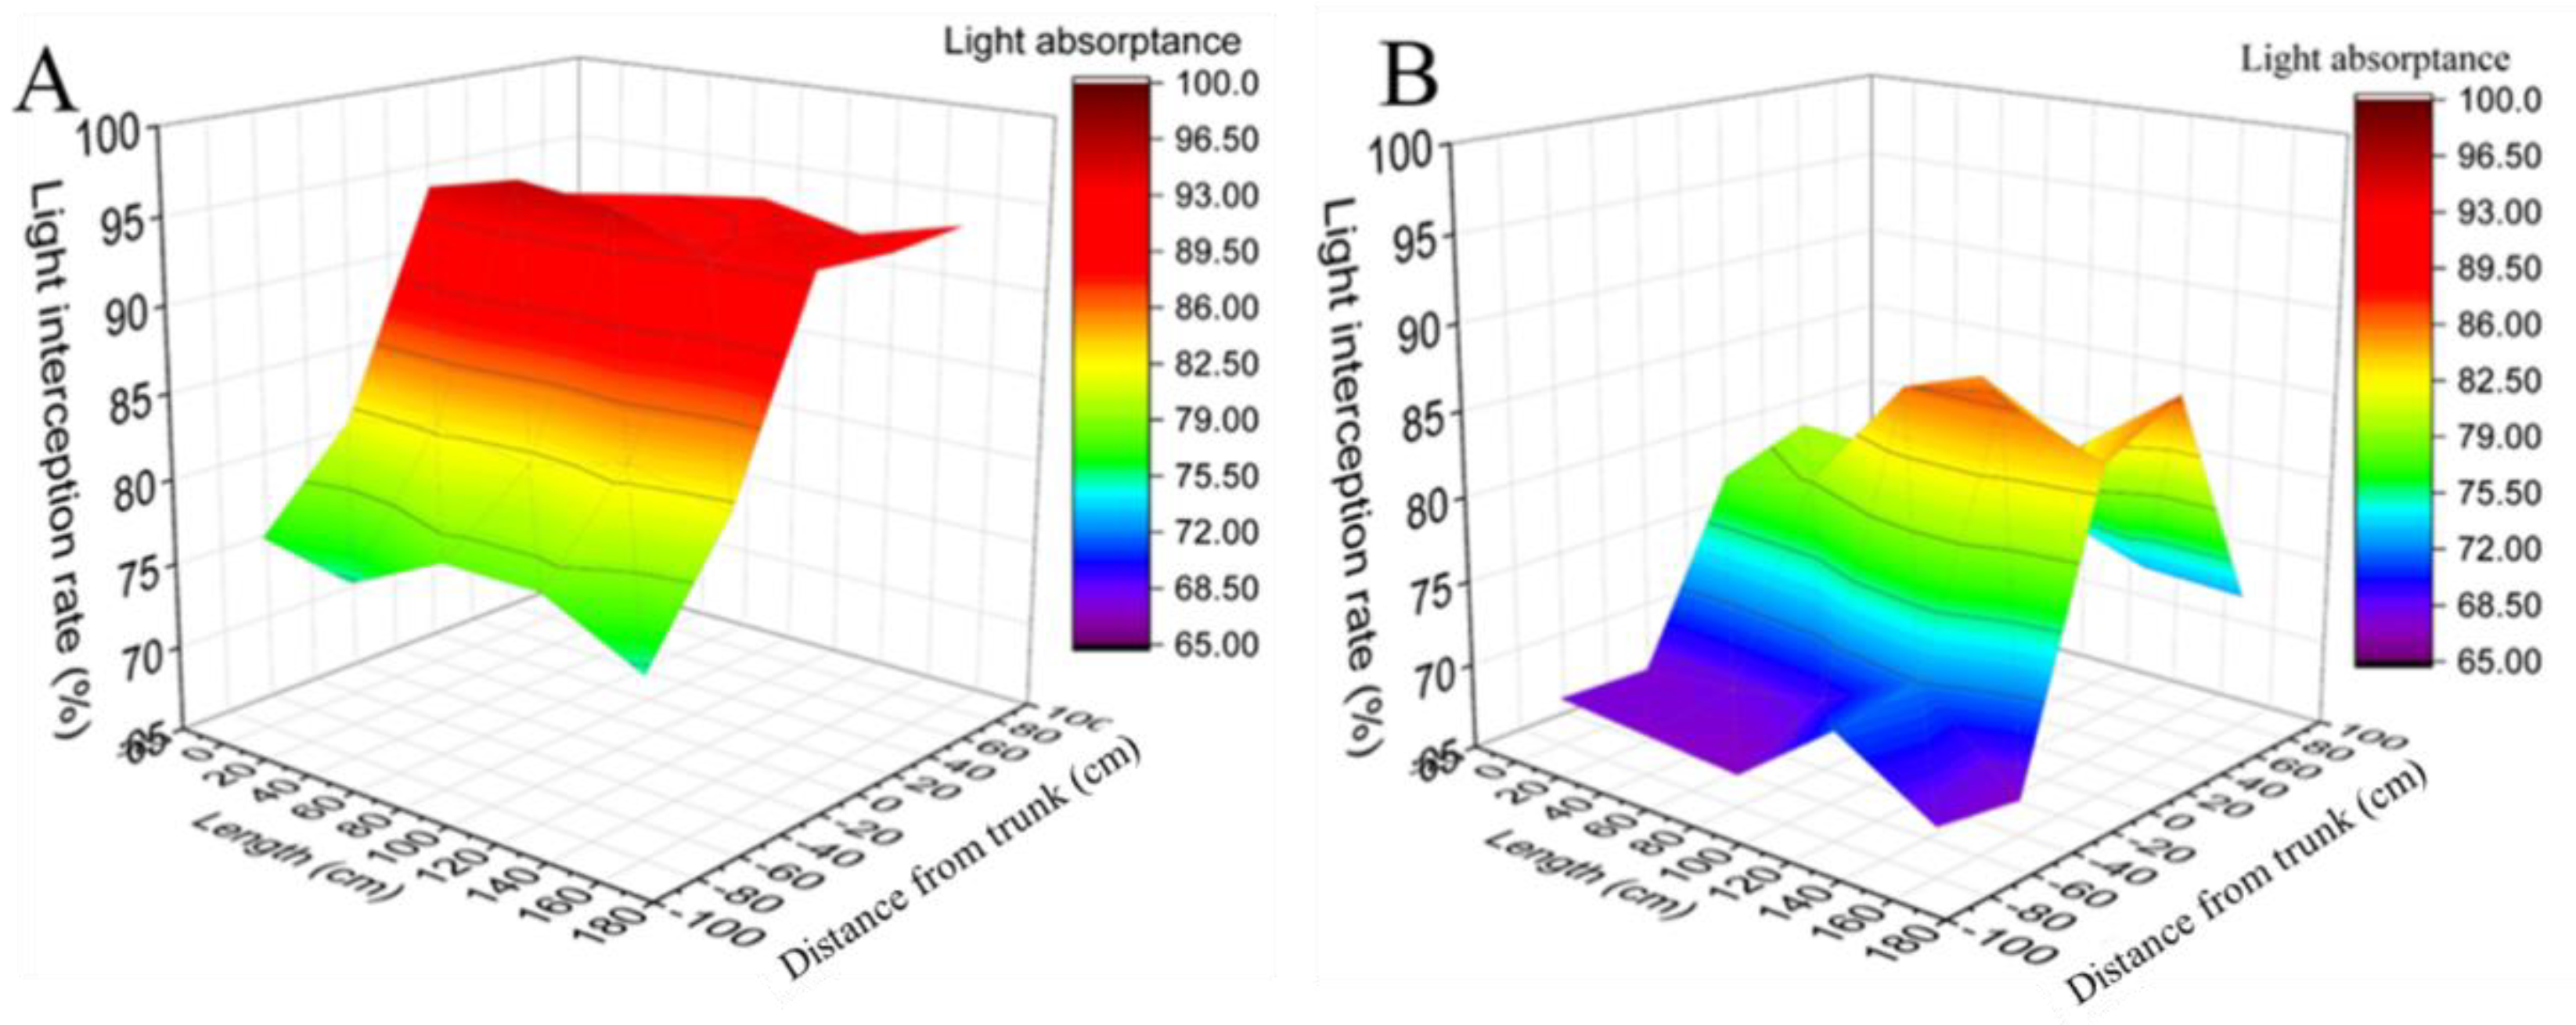
3.3.1. Light Interception Rate

The canopy-covered area of the single curtain was at an 80 cm distance from the trunk, and the PER-covered area was on the whole pergola surface. In the 80 cm distance to the trunk, the light interception rate of SCT was higher than that of the PER (Figure 4A,B). The average light interception rate of SCT was 12.735% higher than the PER, and the light interception rate of both canopies decreased with distance from the trunk. The light interception rate around the trunk of SCT was 94.51%, which was 11.79% higher than that of the PER. At a distance of 40 cm from the trunk, the light interception rate of SCT was 87.77%, which was 12.08% higher than that of the PER. At a distance of 80 cm from the trunk, the light interception rate of SCT was 84.79%, which was 13.39% higher than that of the PER.

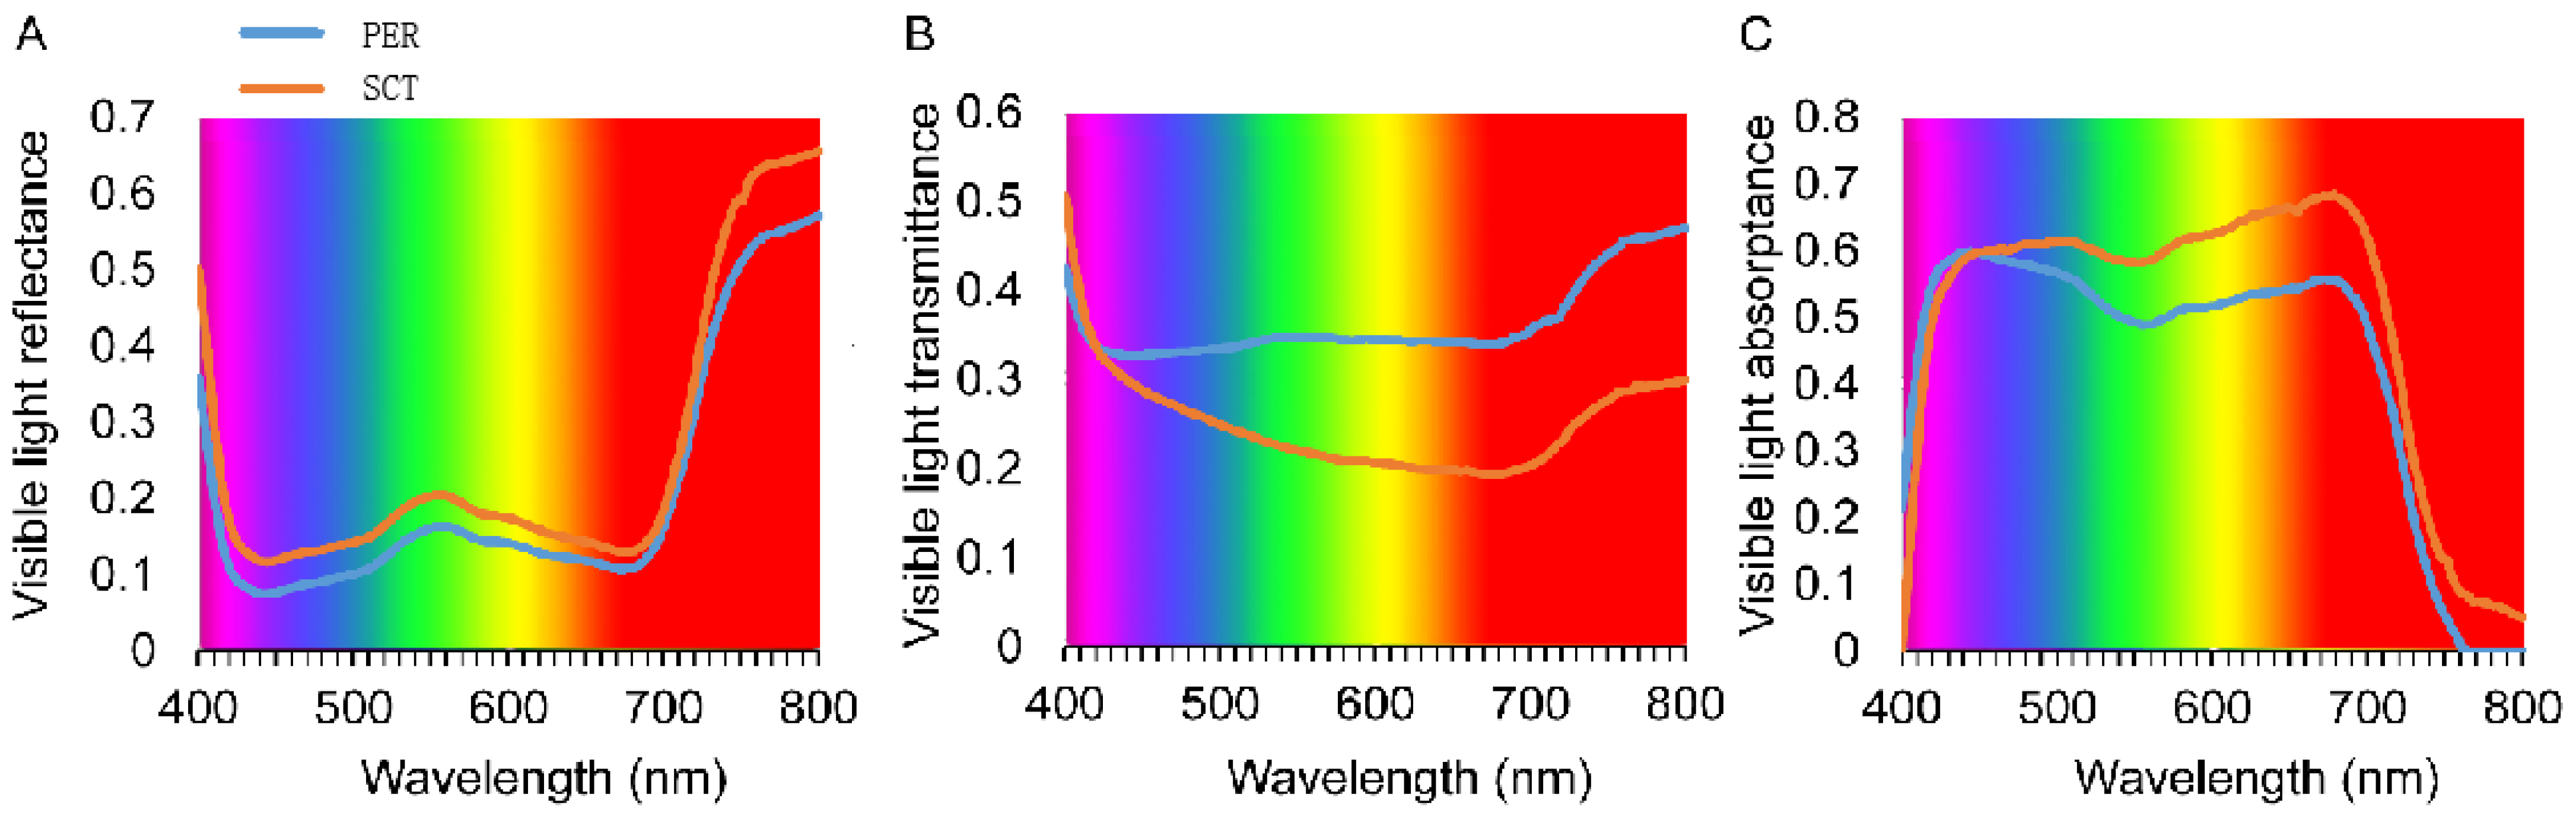
3.3.2. Spectral Reflectance, Transmittance, and Absorptance

Under continuous wavelength measurement (400–800 nm), grape leaves exhibit clear light reflectance peaks in the infrared region (740–800 nm) and the green region (520–560 nm), and the peak in the infrared region is the highest (Figure 5A). Light transmittance is lower in the red light region (660–680 nm) (Figure 5B). In general, the light reflectance of leaves was higher with SCT than with the PER, but light transmittance was lower with SCT (Figure 5A,B). Regarding the absorption spectrum, leaf absorptance in the 400–450 nm waveband was slightly lower with SCT than with PER, and higher than the PER leaves at 450–800 nm (Figure 5C). In addition, leaf absorptance with SCT was >49% in the 413–699 nm range, and leaf absorptance with the PER was >49% in the 419–714 nm range. SCT absorptance was, therefore, shifted 15 nm in the long wave direction relative to the PER.

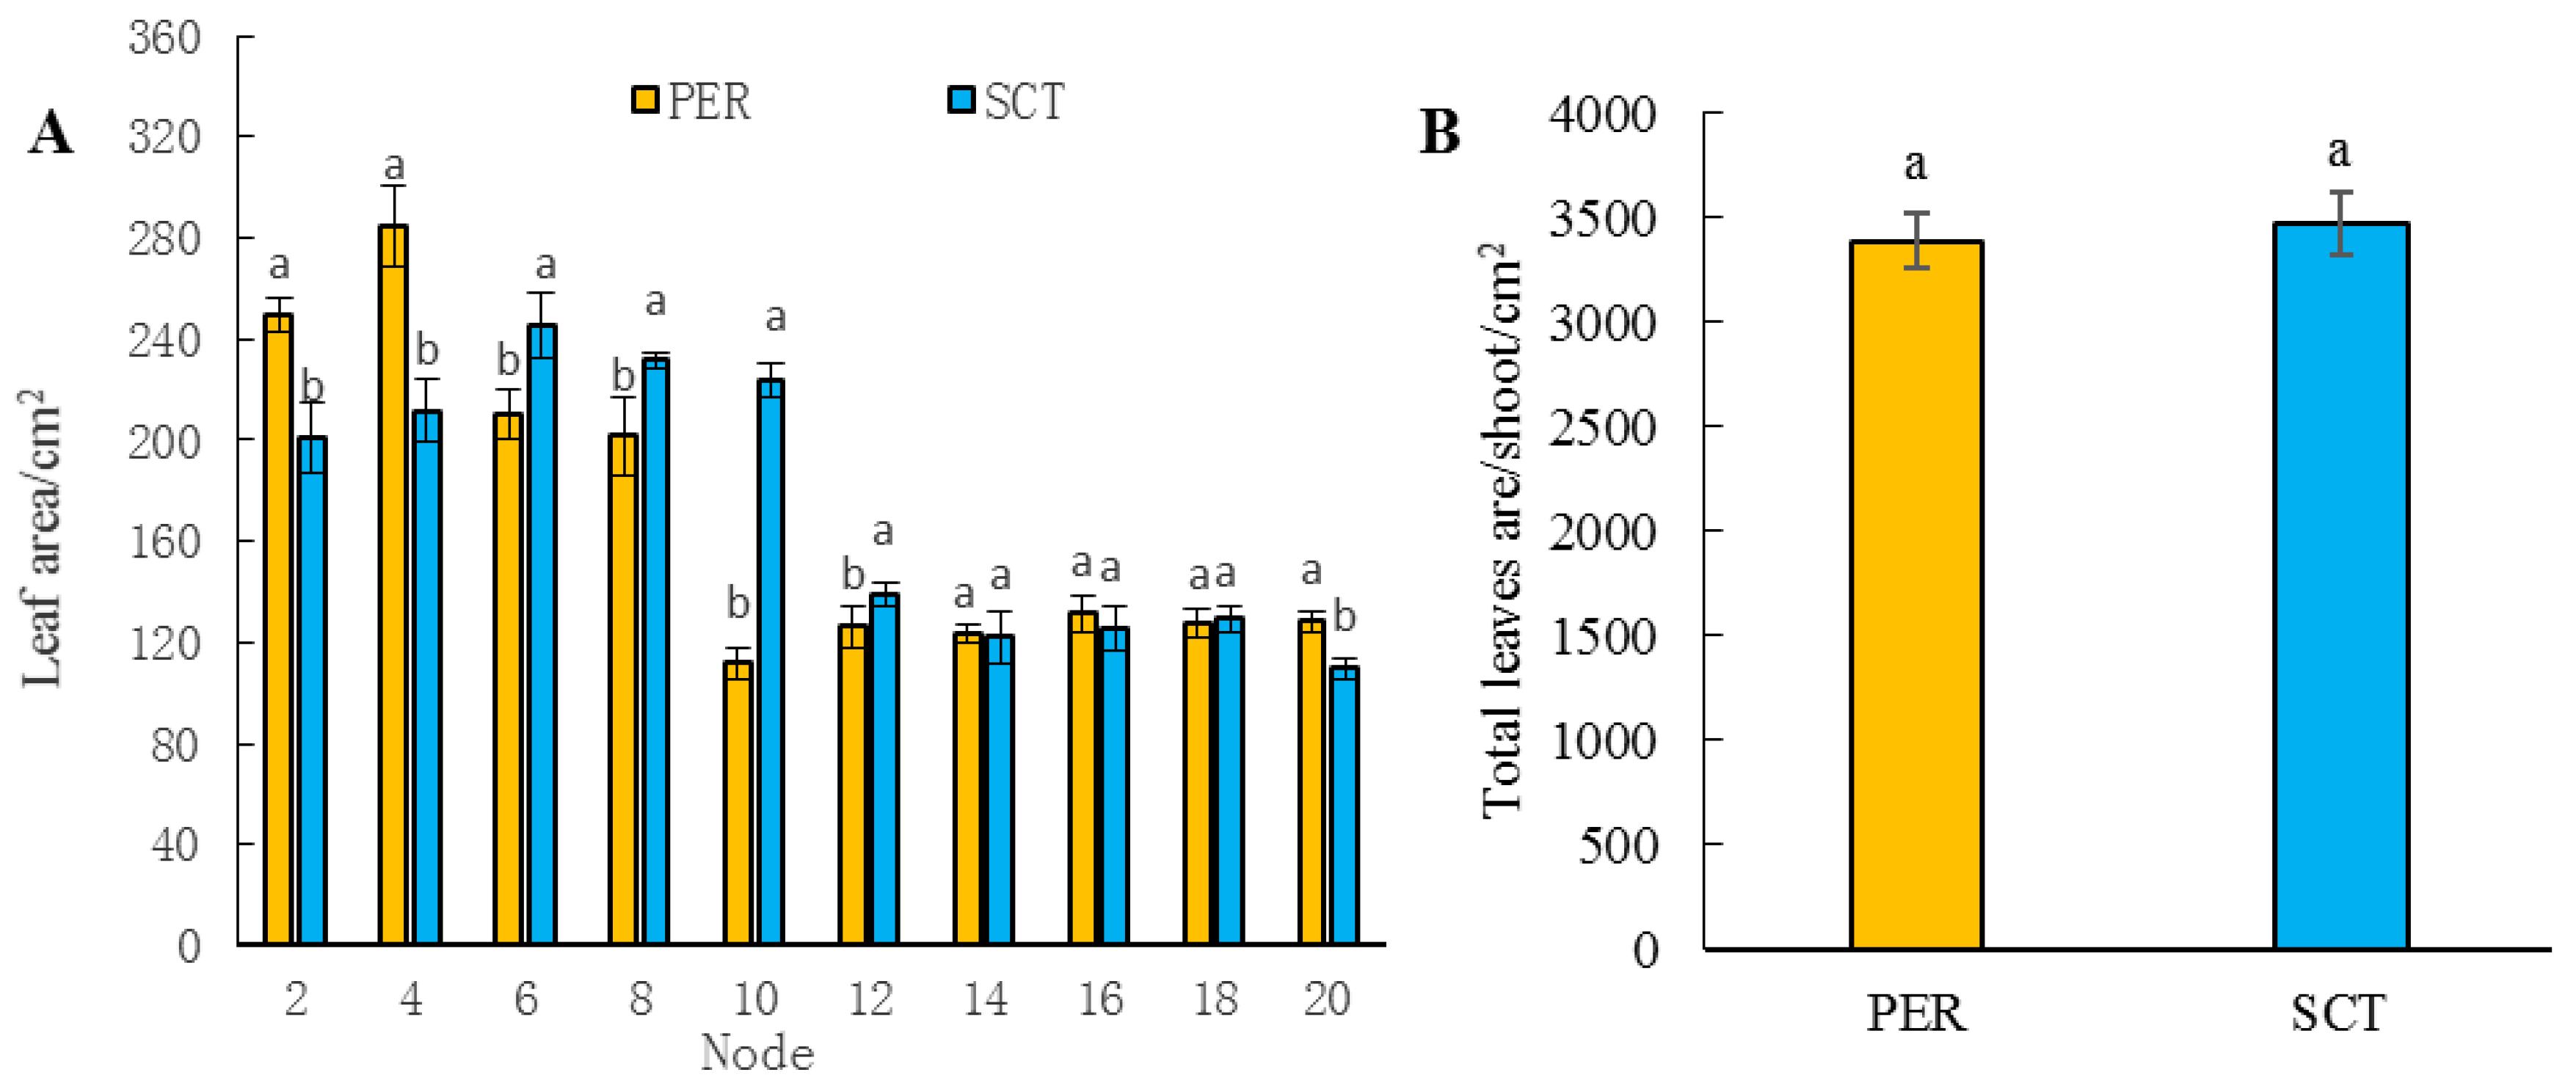
3.4. Effects of PER and SCT on Leaf Area

Compared with the PER, leaf sizes with SCT tended to be smaller at the 4 basal nodes, larger at the middle 6–12 nodes, and smaller at the top node (i.e., node 20) (Figure 6A). The leaf areas of nodes 2 and 4 were 19.58% and 25.76% lower in SCT than in PER, respectively. The leaf areas of nodes 6, 8, 10, and 12 were 16.59%, 14.90%, 100.08%, and 10.14% higher with SCT than with the PER, respectively. There was no significant difference in leaf size for nodes 14–18 between the two canopy types. The leaf area of node 20 was 14.77% lower with SCT than with the PER. The total leaf area of SCT was 2.51% higher than that of the PER, but this difference was not significant (Figure 6B).

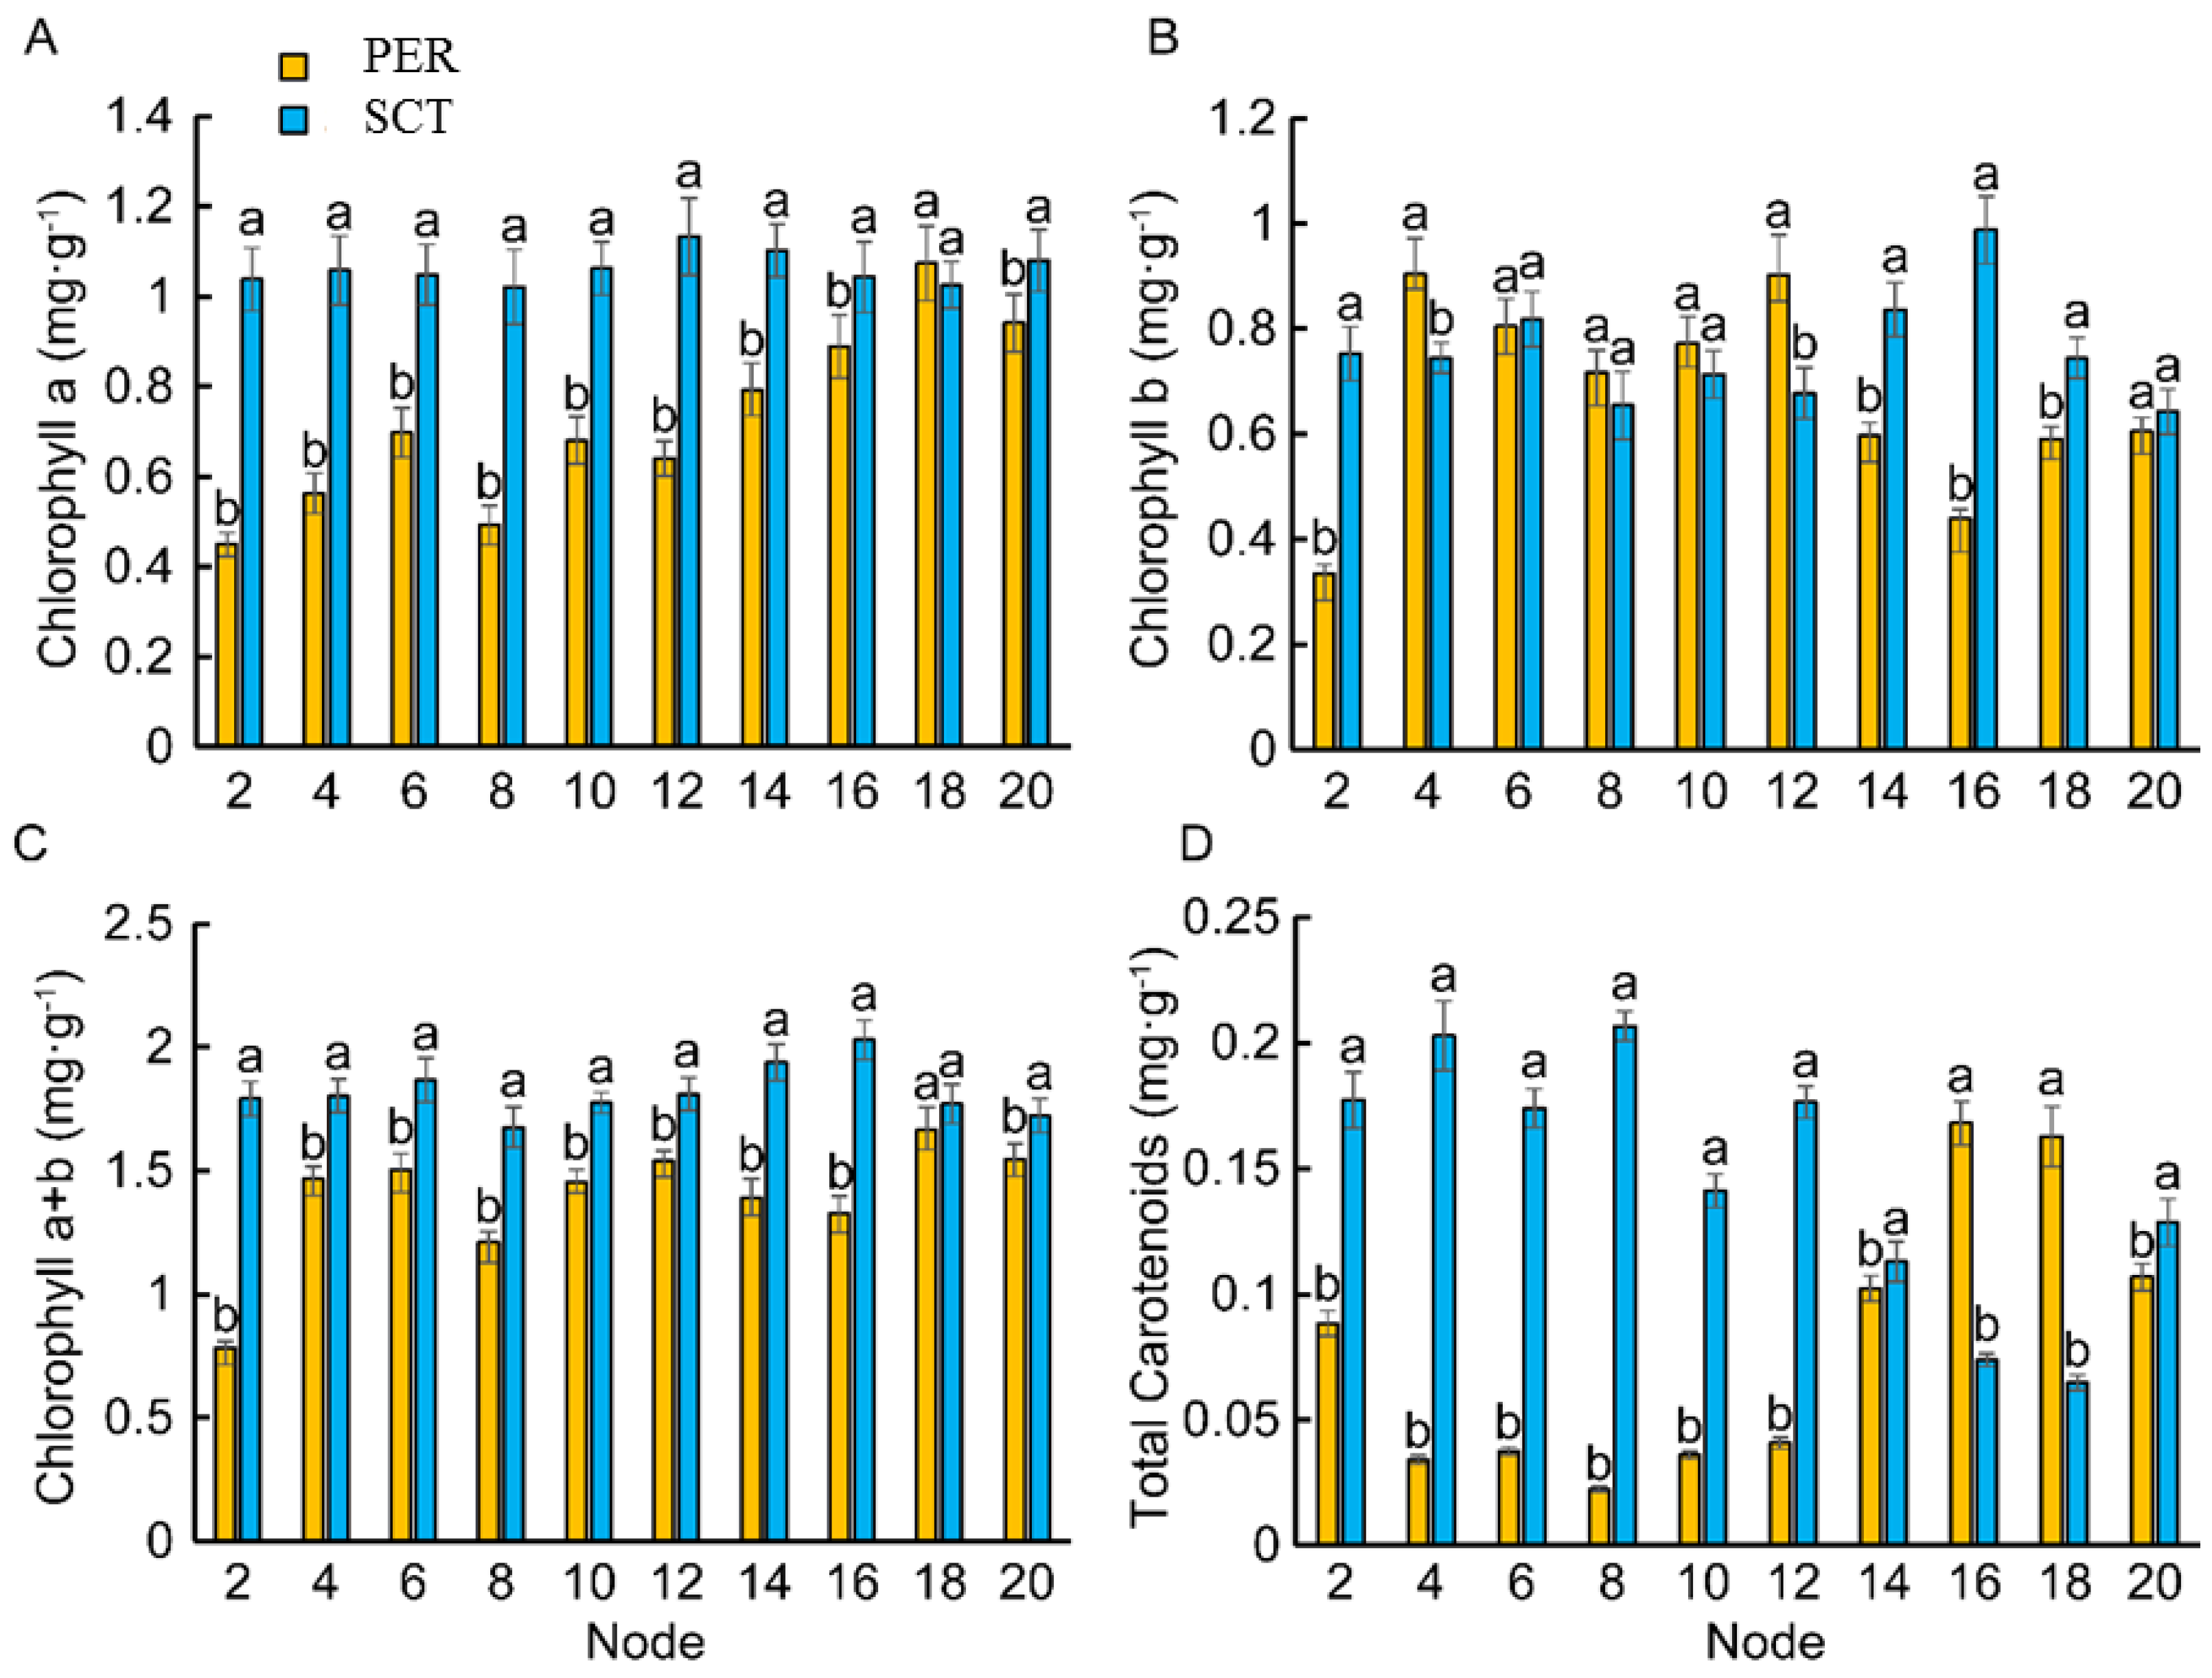
3.5. Effects of PER and SCT on Leaf Chlorophyll Content in Different Nodes

The chlorophyll a content was relatively similar among leaves at different nodes with the single-curtain training system, but it increased gradually with node number with the PER. The chlorophyll a content in the 2nd, 4th, 6th, 8th, 10th, 12th, 14th, 16th, and 20th nodes was 131.08%, 88.03%, 50.25%, 107.21%, 56.06%, 76.93%, 38.91%, 17.28%, and 14.68% higher with SCT than with the PER (Figure 7A), respectively. The chlorophyll b content in the top-node leaves of the PER was significantly lower than that of the middle-node leaves. The chlorophyll b content in leaves of the 2nd, 6th, 14th, 16th, 18th, and 20th nodes was 124.90%, 1.67%, 39.86%, 124.91%, 26.11%, and 6.25% higher with SCT than with the PER (Figure 7B), respectively. The total chlorophyll content of leaves from the 2nd, 4th, 6th, 8th, 10th, 12th, 14th, 16th, 18th, and 20th nodes was 128.44%, 22.91%, 24.24%, 38.47%, 22.23%, 17.44%, 39.32%, 52.85%, 6.38%, and 11.38% higher with SCT than with the PER (Figure 7C), respectively. With the PER, carotenoid content was significantly lower in the top-node leaves than in the middle- and lower-node leaves, but leaves with SCT showed the opposite trend. The carotenoid content in the leaves of the 2nd, 4th, 6th, 8th, 10th, 12th, 14th, 16th, 18th, and 20th nodes was 100.69%, 493.50%, 364.24%, 817.79%, 292.48%, 332.41%, 10.51%, and 20.25% higher with SCT than with the PER (Figure 7D).

3.6. Effects of PER and SCT on Leaf Photosynthetic Rates in Different Nodes

The photosynthetic capacity of the basal leaves developed earlier and declined earlier, and their net photosynthetic rate began to decline after the berry expansion stage (Table 1). At harvest, the net photosynthetic capacity of leaves at basal node 2 was negative. Above the 10th node, the leaf photosynthetic rate gradually increased with the developmental period.
Compared with PER, the photosynthetic capacity of leaves from the 16th node to the shoot tip on the primary shoot was lower at the berry expansion stage of SCT. As time went on, the photosynthetic capacity of leaves from the middle shoot to the shoot tip gradually developed and was significantly higher than the capacity of those with the PER (Table 1). The net photosynthetic rates of leaves at nodes 10, 12, 14, and 16 were 29.81%, 16.13%, 6.17%, and 43.55% higher with SCT than with the PER, respectively. The photosynthetic capacity of leaves from the middle and upper nodes of SCT was higher than that of PER at the harvest stage; the photosynthetic capacity of leaves at nodes 14–24 was significantly higher with SCT than with the PER by 28.89%, 16.27%, 20.25%, 17.21%, 19.55%, and 36.89%, respectively.
Shoot photosynthetic capacity can reflect the natural state of photosynthesis of all the leaves on a shoot. Here, the shoot photosynthetic rate was 1.71 times higher with SCT than with the PER (Table 1), indicating that the shoot photosynthetic capacity of SCT was higher and its leaves senesced more slowly.

3.7. Effects of PER and SCT on Assimilate Distribution

A 13C tracer experiment was performed to further investigate the effects of SCT on the sink: source relationship. The results showed that there was no significant difference in total 13C between the single curtain and PER, and fruit was an important carbon sink during both the berry expansion and veraison stages, accounting for a large proportion (35–50%) of assimilate distribution (Figure 8). The allocation of 13C to fruit was greater with SCT than with the PER during the berry expansion and veraison stages. The distribution of fixed 13C from primary and lateral shoot leaves to the fruit was 5.19% and 9.09% higher at the berry expansion stage, respectively, and 4.89% and 3.28% higher at veraison, respectively, with SCT than with the PER.

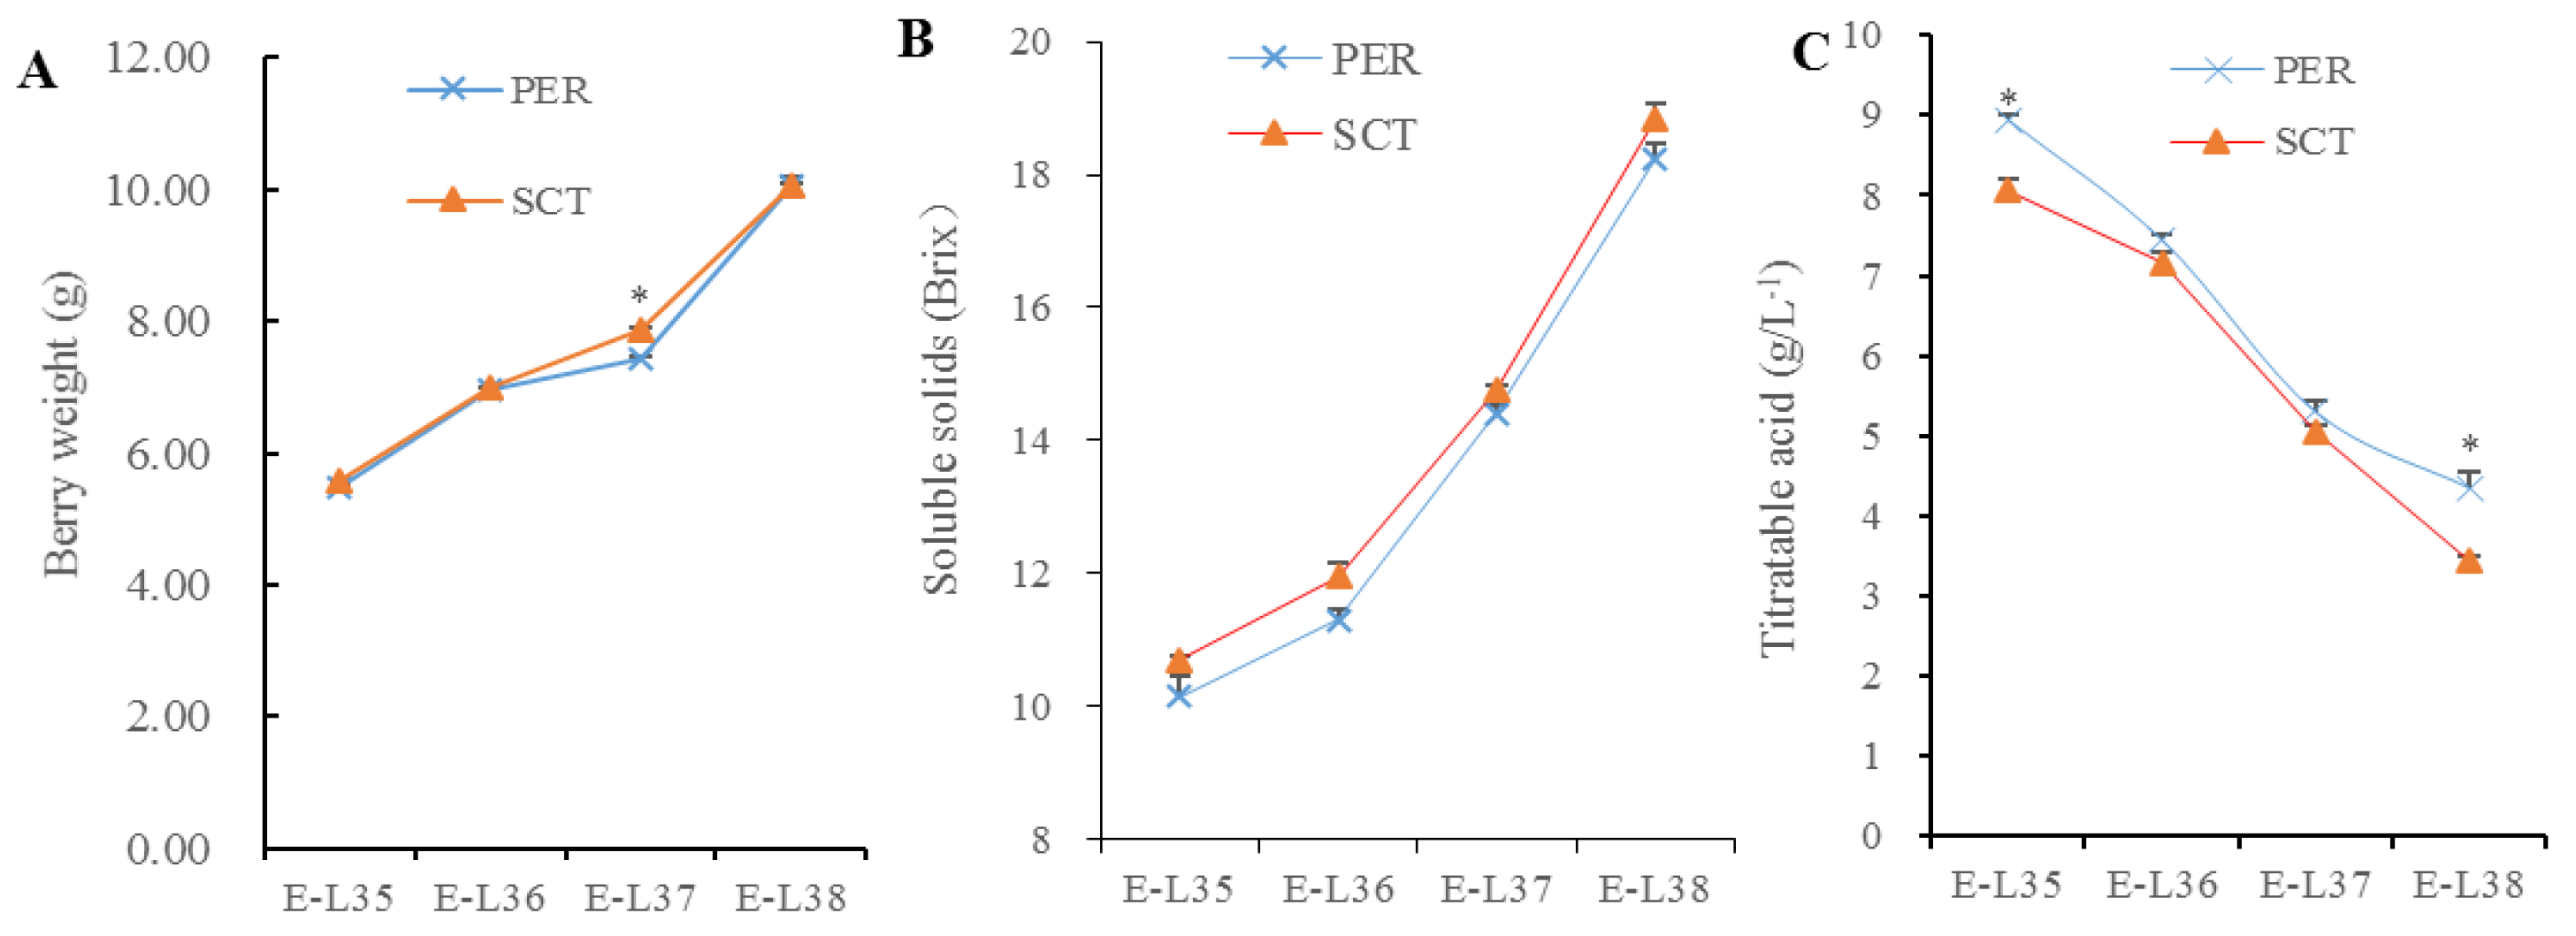
3.8. Effects of PER and SCT on Berry Weight, Soluble Solids, and Titratable Acid Content

In 2022, the berry weight and soluble solids of SCT were higher than those of PER from E-L35 to E-L38, and the berry weight alone had a significant difference at the E-L37 period. The titratable acid content of SCT was lower than that of PER from E-L35 to E-L38 (Figure 9).
In 2021, the berry weight and soluble solids of SCT were lower than those of PER, but there was no significant difference between the two canopies (Table 2).
The rainfall in June, July, and August in 2022 and 2021 was 623.4mm and 554.2mm, respectively; thus, SCT produced a good effect on sugar accumulation in rainy years.

3.9. Effects of PER and SCT on Sugar and Starch Storage in Canes

The lengths of the fourth, fifth, and sixth internodes were 12.06%, 7.40%, and 9.68% lower with SCT than with the PER (Table 3), respectively. SCT produced a higher soluble sugar content in the fourth, fifth, and sixth nodes: 130.76%, 37.42%, and 16.23% higher than those of PER, respectively. However, the soluble sugar content of the seventh node was 50.71% lower with SCT than with the PER. SCT produced a significantly higher starch content of the fourth node, being 26.91% higher than that of PER. However, the starch content of the fifth and seventh nodes was 7.40% and 16.11% lower with SCT than with the PER, respectively.

4. Discussion

In grapevines, apical dominance leads to primary stem elongation with less and shorter lateral branches. Viticulture practices need to control excessive vegetative developments [20]. Shoot bending inhibits apical dominance [21], resulting in a narrowing of the xylem vessels and, hence, a decrease in flow; a decreased water supply limits the rate of growth and metabolic activity in plants [22] and ultimately controls excessive vegetative growth. In this study, plant vigor was significantly lower with SCT than with the PER, the internode diameter decreased from the fifth internode, and the average length of new shoot internodes was 19.77% lower in the single-curtain training system. A study by Mamun [23] also showed that branch bending resulted in stem tension generation under a bent position and affected the phloem function, which induced photosynthetic products to pass slowly and resulted in an increased C: N ratio [21]. N limitation inhibits shoot growth [24], which reduced the number of leaf cells and the leaf size, explaining the smaller leaf areas of the lower and top nodes in this study. Both primary shoot and lateral shoot growth was also slower with SCT than with the PER, which reduced shoot pruning times. More importantly, SCT can promote the development of mechanized orchard management technology better than can PER, including technology for the pruning of lateral shoots.
Though the shoot growth of the SCT culture was inhibited in this study, the soluble solids of fruit were not decreased and even showed a slightly increasing trend. This may have been related to the higher distribution of assimilates to the fruit during the fruit expansion and veraison stages. Moreover, a study by Samant [21] showed that fruit total soluble solid and vitamin C content were also improved by branch bending. Canopy photosynthetic capacity is necessary for increasing crop production [25], and the net photosynthetic rate is closely related to high chlorophyll content [26]. PS II and PS I have a series of photosynthetic pigments closely connected to the thylakoid membrane. Changes in chlorophyll content directly affect their photosynthetic ability. In this study, we found that SCT produced significantly higher net photosynthetic rates, chlorophyll content, and leaf areas of node 6–12 leaves at the veraison, and the net photosynthetic rates of 8–16 node SCT leaves were higher than those of the PER leaves, indicating that SCT was beneficial to the development of middle node leaves and improved the photosynthetic carbon assimilation capacity of the whole shoot at the veraison. Regarding the mature period, the high-efficiency net photosynthetic rate at nodes 8–24 of SCT indicates that the SCT leaves at the upper node were better developed, and the higher shoot photosynthetic capacity of SCT indicated that the leaves of SCT senesced slowly.
Most training practices are based on the concept that increasing leaf area and the total leaf area to exploit all sources of photosynthetically active radiation (PAR) determines vine photosynthesis, including the interception of diffuse radiationand sunflecks by leaves in the interior of the canopy [27]. Light interception is a fundamental requirement for biomass production and carbon uptake, and light interception ability is one of the most direct contributors to light energy utilization efficiency. In this study, the average light interception rate of SCT was 12.74% higher than that of the PER. The higher light interception of pendulous canopies probably does not cause a sunburn problem in ‘Miguang’ due to its red varieties that are more resistant to sunburn [28]; however, sunburn is a problem in more drought-prone areas (Gambetta et al., 2021). Moreover, the canopy distribution distance in this study was 80 cm to the trunk, meaning that row space could be reduced. Theoretically, planting density with SCT could be increased, thereby doubling the fruit yield. This would improve both light energy and land utilization rates.

5. Conclusions

SCT increased the light interception rate with a distribution distance of 80 cm to the trunk, promoted assimilate distribution to fruit, and decreased vegetative growth. The results of this study provide a relevant theoretical basis and technical support for grape canopy management.

Author Contributions

W.D.; validation, writing—review and editing, S.L.; formal analysis, methodology and data curation, T.D.; validation, W.H., Y.Z., H.K. and Y.Y.; investigation, Z.G.; supervisionand, Y.D.; project administration and funding acquisition. All authors have read and agreed to the published version of the manuscript.

Funding

This research was funded by [Key R&D Plan of Shandong Province] grant number [2022TZXD0010], and [China Agriculture Research System of MOF and MARA] grant number [CARS-29].

Data Availability Statement

The data that support the findings of this study are available on request from the corresponding author.

Acknowledgments

I wish to thank Zhai H for advice on experimental design.

Conflicts of Interest

The authors declare that they have no competing interests.

References

  1. Willaume, M.; Lauri, P.; Sinoquet, H. Light interception in apple trees influenced by canopy architecture manipulation. Trees 2004, 18, 705–713. [Google Scholar] [CrossRef]
  2. Gladstone, E.A.; Dokoozlian, N.K. Influence of leaf area density and trellis/training system on the light microclimate within grapevine canopies. Vitis 2003, 42, 123–131. [Google Scholar]
  3. Reynolds, A.G.; Heuvel, J.E.V. Influence of Grapevine Training Systems on Vine Growth and Fruit Composition: A Review. Am. J. Enol. Vitic. 2009, 60, 251–268. [Google Scholar] [CrossRef]
  4. Wolf, T.K.; Dry, P.R.; Iland, P.G.; Botting, D.; Dick, J.; Kennedy, U.; Ristic, R. Response of Shiraz grapevines to five different training systems in the Barossa Valley, Australia. Aust. J. Grape Wine Res. 2003, 9, 82–95. [Google Scholar] [CrossRef]
  5. Stewart, D.W.; Costa, C.; Dwyer, L.M.; Smith, D.L.; Hamilton, R.I.; Ma, B.L. Canopy Structure, Light Interception, and Photosynthesis in Maize. Agron. J. 2003, 95, 1465–1474. [Google Scholar] [CrossRef]
  6. Wünsche, J.; Lakso, A.N. Apple tree physiology: Implications for orchard and tree management. Compact. Fruit Tree 2000, 33, 82–88. [Google Scholar]
  7. Gregan, S.M.; Wargent, J.J.; Liu, L.; Shinkle, J.; Hofann, R.; Winefield, C.; Troutht, M.; Jordan, B. Effects of solar ultraviolet radiation and canopy manipulation on the biochemical composition of Sauvignon Blanc grapes. Aust. J. Grape Wine Res. 2012, 18, 227–238. [Google Scholar] [CrossRef]
  8. Fira, A.; Joshee, N.; Cristea, V.; Simu, M.; Monica, H.; Pamfil, D.; Clapa, D. Optimization of Micropropagation Protocol for Goji Berry (Lycium barbarum L.). Bulletin of University of Agricultural Sciences and Veterinary Medicine Cluj-Napoca. Horticulture 2016, 73, 141–150. [Google Scholar]
  9. Liu, M.Y.; Chi, M.; Tang, Y.H.; Song, C.Z.; Xi, Z.M.; Zhang, Z.W. Effect of Three Training Systems on Grapes in a Wet Region of China: Yield, Incidence of Disease and Anthocyanin Compositions of Vitis vinifera cv. Cabernet Sauvignon. Molecules 2015, 20, 18967–18987. [Google Scholar] [CrossRef] [Green Version]
  10. Wang, X.Q.; Xie, X.L.; Chen, N.; Wang, H.; Li, H. Study on current status and climatic characteristics of wine regions in China. Vitis 2018, 57, 9–16. [Google Scholar]
  11. Meng, J.F.; Ning, P.F.; Xu, T.F.; Zhang, Z.W. Effect of rain-shelter cultivation of Vitis vinifera cv. Cabernet Gernischet on the phenolic profile of berry skins and the incidence of grape diseases. Molecules 2012, 18, 381–397. [Google Scholar] [CrossRef]
  12. Di Lorenzo, R.; Gambino, C.; Scafidi, P. Summer pruning in table grape. Adv. Hortic. Sci. 2011, 25, 143–150. [Google Scholar]
  13. He, L.F.; Li, X.X.; Gao, Y.Y.; Li, B.X.; Mu, W.; Liu, F. Characterization and fungicide sensitivity of Colletotrichum spp. from different hosts in Shandong, China. Plant Dis. 2019, 103, 34–43. [Google Scholar] [CrossRef] [PubMed] [Green Version]
  14. Han, J.Y.; Zhang, Y.; Cao, X.J.; Guo, R.R.; Lin, L.; Cheng, C.F. Introduction Performance of New Labor-Saving Grape Variety Miguang in Southern Guangxi and Its Two-Harvest-A-Year Cultivation Technique. Asian Agric. Res. 2020, 12, 49–51. [Google Scholar]
  15. Montgomery, R.A.; Chazdon, R.L. Forest Structure, Canopy Architecture, and Light Transmittance in Tropical Wet Forests. Ecology 2001, 82, 2707–2718. [Google Scholar] [CrossRef]
  16. Gao, X.X.; Dong, S.K.; Li, S.; Xu, Y.D.; Liu, S.L.; Zhao, H.D.; Yeomans, J.; Li, Y.; Shen, H.; Wu, S.N.; et al. Using the random forest model and validated MODIS with the field spectrometer measurement promote the accuracy of estimating aboveground biomass and coverage of alpine grasslands on the Qinghai-Tibetan Plateau. Ecol. Indic. 2020, 112, 106114. [Google Scholar] [CrossRef]
  17. Serrano, M.A.; Moreno, J.C. Spectral transmission of solar radiation by plastic and glass materials. J. Photochem. Photobiol. B Biol. 2020, 208, 111894. [Google Scholar] [CrossRef]
  18. Lichtenthaler, H.K. Chlorophylls and carotenoids: Pigments of photosynthetic biomembranes. Method Enzymol. 1987, 148, 350–382. [Google Scholar]
  19. Wang, F.; Sha, J.; Chen, Q.; Xu, X.; Zhu, Z.; Ge, S.; Jiang, Y. Exogenous Abscisic Acid Regulates Distribution of 13C and 15N and Anthocyanin Synthesis in ‘Red Fuji’ Apple Fruit under High Nitrogen Supply. Front. Plant Sci. 2020, 10, 1738. [Google Scholar] [CrossRef] [Green Version]
  20. Torregrosa, L.; Carbonneau, A.; Kelner, J.J. The shoot system architecture of Vitis vinifera ssp. sativa. Sci. Hortic. 2021, 288, 110404. [Google Scholar] [CrossRef]
  21. Samant, D.; Kishore, K.; Singh, H.S. Branch Bending for Crop Regulation in Guava under Hot and Humid Climate of Eastern India. J. Indian Soc. Coast. Agric. Res. 2016, 34, 92–96. [Google Scholar]
  22. McIntyre, G. The role of water in the regulation of plant development. Can. J. Bot. 1987, 65, 1287–1298. [Google Scholar] [CrossRef]
  23. Mamun, A.A.; Rahman, M.H.; Farooque, A.M. Effect of bending and fruit thinning for offseason production of guava. J. Agrof. Environ. 2012, 1, 111–116. [Google Scholar]
  24. Zheng, Z.L. Carbon and nitrogen nutrient balance signaling in plants. Plant Signal. Behav. 2009, 4, 584–591. [Google Scholar] [CrossRef] [PubMed] [Green Version]
  25. Yao, H.; Zhang, Y.; Yi, X.; Zhang, X.; Zhang, W. Cotton responds to different plant population densities by adjusting specific leaf area to optimize canopy photosynthetic use efficiency of light and nitrogen. Field Crops Res. 2016, 188, 10–16. [Google Scholar] [CrossRef]
  26. Buttery, B.R.; Buzzell, R.I. The relationship between chlorophyll content and rate of photosynthesis in soybeans. Can. J. Plant Sci. 1977, 57, 1–5. [Google Scholar] [CrossRef]
  27. Smart, R.E. Sunlight interception by vineyard. Am. J. Enol. Vitic. 1973, 24, 141–147. [Google Scholar]
  28. Ferrari, V.; Disegna, E.; Dellacass, E.; Coniberti, A. Influence of timing and intensity of fruit zone leaf removal and kaolin applications on bunch rot control and quality improvement of Sauvignon blanc grapes, and wines, in a temperate humid climate. Sci. Hortic. 2017, 223, 62–71. [Google Scholar] [CrossRef]
Figure 1. PER (pergola) (A) and SCT (single-curtain training system) (B) of ‘Miguang’ grape.
Horticulturae 09 00113 g001
Figure 2. PPFD (photosynthetic photon flux density) around grape clusters of PER (pergola) and SCT (single-curtain training system) from July to October.
Horticulturae 09 00113 g002
Figure 3. Real-time temperature (A) and humidity (B) around fruit clusters of PER (pergola) and SCT (single-curtain training system) from July to October.
Horticulturae 09 00113 g003
Figure 4. Light interception rates of SCT (single-curtain training system) (A) and PER (pergola) and SCT (B) at veraison. Data are means ± SD of three independent replicates. Different letters indicate a significant difference at p < 0.05 as determined by Duncan’s multiple range test.
Horticulturae 09 00113 g004
Figure 5. Spectral reflectance (A), transmittance (B), and absorptance (C) of the PER (pergola) and SCT (single-curtain training system) at veraison.
Horticulturae 09 00113 g005
Figure 6. The leaf area at different nodes (A) and the total leaf area (B) under PER (pergola) and SCT (single-curtain training system) at veraison. Data are means ± SD from three independent replicates. Different letters indicate a significant difference at p < 0.05 as determined by Duncan’s multiple range test.
Horticulturae 09 00113 g006
Figure 7. The chlorophyll and carotenoid content of leaves at different node positions with PER (pergola) and SCT (single-curtain training system) at veraison. (A) chlorophyll a content, (B) chlorophyll b content, (C) total chlorophyll content, (D) carotenoid content. Data are means ± SD from three independent replicates. Different letters indicate a significant difference at p < 0.05 as determined by Duncan’s multiple range test.
Horticulturae 09 00113 g007
Figure 8. 13C content (A,D) and assimilate distribution (B,C,E,F) 13C distribution under lateral shoot 13CO2 label treatment at veraison. (D) 13C content of shoot leaves and berries at veraison. (E)13C distribution under primary shoot 13CO2 label treatment at veraison. (F)13C distribution under lateral shoot 13CO2 label treatment at veraison. Data are means ± SD from three independent replicates. Different letters indicate a statistical difference at p < 0.05 between PER (pergola) and SCT (single-curtain training system).
Horticulturae 09 00113 g008
Figure 9. The effects of PER (pergola) and SCT (single-curtain training system) on berry weight (A), soluble solids (B), and titratable acid (C) content in 2022. * indicates a statistical difference at p < 0.05 between PER and single-curtain training system.
Horticulturae 09 00113 g009
Table 1. Photosynthetic rates (μmol·m−2·s−1) of leaves from different nodes at different growth stages of PER (pergola) and SCT (single-curtain training system).
NodeBerry Expansion StageVeraisonHarvest
PERSCTPERSCTPERSCT
2nd5.6 ± 0.32b8.4 ± 0.43a3.4 ± 0.12b3.7 ± 0.25a−2.7 ± 0.18a−3 ± 0.12a
4th7.2 ± 0.55b8.8 ± 0.28a4.7 ± 0.32a5.1 ± 0.43a3.6 ± 0.20a2.0 ± 0.15b
6th10.5 ± 0.43b16.1 ± 0.19a4.1 ± 0.24a4.4 ± 0.36a4.1 ± 0.23a3.3 ± 0.29b
8th9.3 ± 0.46b10.8 ± 0.21a8.4 ± 0.33a6.1 ± 0.42b8.3 ± 0.34b9.4 ± 0.45a
10th9.8 ± 0.49a9.5 ± 0.79a10.4 ± 0.94b13.5 ± 0.85a16.5 ± 0.89a16.6 ± 0.67a
12th8.2 ± 0.58a8.8 ± 0.14a15.5 ± 0.55b18.0 ± 0.76a17.2 ± 0.96a16.9 ± 1.03a
14th7.9 ± 0.67a8.2 ± 0.51a16.2 ± 0.52b17.2 ± 0.68a18.0 ± 0.86b23.2 ± 0.97a
16th12.7 ± 0.94a7.9 ± 0.39b12.4 ± 0.66b17.8 ± 1.06a16.6 ± 1.09b19.3 ± 1.23a
18th13.1 ± 0.68a5.6 ± 0.24b13.8 ± 0.49a14.6 ± 0.34a16.3 ± 0.77b19.6 ± 0.99a
20th6.9 ± 0.33a2.3 ± 0.19b12.2 ± 0.73a10.7 ± 0.55b12.2 ± 0.51b14.3 ± 0.76a
22nd————6.6 ± 0.21a5.1 ± 0.13b13.3 ± 0.34b15.9 ± 0.92a
24th————2.7 ± 0.14a2.0 ± 0.09b10.3 ± 0.86b14.1 ± 0.44a
Shoot photosynthetic capacity 3.1 ± 0.14 b5.3 ± 0.22 a
Data are means ± SD from three independent replicates. Different letters indicate a significant difference at p < 0.05 as determined by Duncan’s multiple range test.
Table 2. The effects of PER (pergola) and SCT (single-curtain training system) on berry weight, soluble solids, and titratable acid content in 2021.
PERSCT
Berry weight g8.13 ± 1.86a7.92 ± 1.58a
Soluble solids Brix18.47 ± 0.22a18.20 ± 0.36a
Titratable acid g/L5.33 ± 0.21a5.21 ± 0.43a
Data are means ± SD from three independent replicates. Different letters indicate a significant difference at p < 0.05 between PER and single-curtain training system.
Table 3. Soluble sugar content, starch content, internode length, and diameter of canes with PER (pergola) and SCT (single-curtain training system).
IndexTreatment4th5th6th7th
Soluble sugar (mg/g)PER124.63 ± 10.54b217.77 ± 7.1b233.45 ± 6.92b315.42 ± 20.05a
SCT287.60 ± 19.05a299.25 ± 13.27a271.34 ± 8.15a209.29 ± 13.84b
Starch (mg/g)PER77.03 ± 4.91b59.76 ± 2.28a49.30 ± 1.99a47.93 ± 1.69a
SCT97.76 ± 5.68a47.04 ± 2.97b44.88 ± 3.64a41.28 ± 0.78b
Internode length (cm)PER9.01 ± 0.24a8.56 ± 0.17a8.95 ± 0.14a8.72 ± 0.34a
SCT8.04 ± 0.33b7.97 ± 0.49b8.16 ± 0.24b8.89 ± 0.41a
Internode diameter (mm)PER11.67 ± 0.24b11.52 ± 0.15a11.69 ± 0.63a12.05 ± 0.21a
SCT12.27 ± 0.42a11.81 ± 0.38a11.43 ± 0.45a11.37 ± 0.27b
Data are means ± SD from three independent replicates. Different letters indicate a significant difference at p < 0.05 as determined by Duncan’s multiple range test.
Disclaimer/Publisher’s Note: The statements, opinions and data contained in all publications are solely those of the individual author(s) and contributor(s) and not of MDPI and/or the editor(s). MDPI and/or the editor(s) disclaim responsibility for any injury to people or property resulting from any ideas, methods, instructions or products referred to in the content.

