Article

Analysis of Relative Expression of Key Enzyme Genes and Enzyme Activity in Nitrogen Metabolic Pathway of Two Genotypes of Potato (Solanum tuberosum L.) under Different Nitrogen Supply Levels

1
College of Horticulture, Jilin Agricultural University, Changchun 130118, China
2
Jilin Provincial Research Institute of Vegetables and Flowers, Changchun 130119, China
3
College of Resources and Environment, Jilin Agricultural University, Changchun 130118, China
*
Authors to whom correspondence should be addressed.
Horticulturae 2022, 8(9), 769; https://doi.org/10.3390/horticulturae8090769
Submission received: 14 July 2022 / Revised: 19 August 2022 / Accepted: 23 August 2022 / Published: 26 August 2022

Abstract

:
Nitrogen (N) plays an important role in the growth cycle of the potato, and is an important guarantee of yield and quality. Rational N application is one of the key ways to improve a crop’s high and stable yield and economic and environmental benefits. The N nutrition level of potato regulates the gene expression of enzymes related to the N metabolism pathway, which shows the change of the activity of key enzymes in N metabolism, and finally realizes the regulation of N absorption and utilization. In this study, the key enzyme genes and enzyme activity of different genotypes of potato under different N supply treatments were identified, which laid a foundation for further exploration of the functions of each gene in the potato N metabolism pathway and provided theoretical basis for rational N application. The results showed that the relative expression levels of StNRT1.5, StNR, StNiR in leaves, StNRT2.5, StNRT2.4, StGS1-2 in roots and StNRT2.7, StGS1-3, StGS2, StGS1-4, StFd-GOGAT in leaves and roots showed that the levels of N-inefficient potato Atlantic (A) were higher than the N-efficient potato Yanshu 4 (Y), while the relative expression levels of StNRT2.5, StGS1-2 in leaves, StNRT1.5 StNR, StNiR in roots and StGDH, StNADH-GOGAT in leaves and roots showed that levels in Yanshu 4 (Y) were higher than in Atlantic (A). At the same time, we especially found that the GDH activity in the leaves of the two genotypes of potato were higher at low N levels. Additionally, the activity of NR and NiR, and the activity of GS and GOGAT were correlated. In addition, the changes of key enzymes in different N metabolism showed a certain continuity with the advancement of growth and development, and some gene expression rules and enzyme activity changes also showed a certain consistency.

1. Introduction

Potato (Solanum tuberosum L.) is the fourth largest grain economic crop, and N plays a crucial role in its growth cycle [1,2]. Reasonable N application means a reasonable supply of nutrients, which is the key to a high and stable yield of potato. It is one of the key ways to improve economic and environmental benefits [3,4].
Studies have shown that there were significant differences in the N absorption and utilization efficiency of different genotypes of potato cultivars under different N supply levels, which was mainly related to the N content in their bodies. N-efficient potato cultivation could be carried out normally at lower N levels, while the N-inefficient potato was the opposite [5,6,7]. It was shown that the root structure of N-efficient cultivars was larger, and the growth ability was significantly higher than that of N-inefficient cultivars [8]. Zhang found that the N accumulation rate of N-efficient cultivars at the budding stage was much higher than that of N-inefficient cultivars, and the N efficiency of each genotype of potato was improved after N application [9]. In addition, the application of N fertilizer in different growth stages would have different effects on the accumulation of dry matter in various parts of the plant [10]. Studies have shown that N application before the budding stage could promote the establishment of the plant’s root system and the growth of the above-ground parts, thereby improving the emergence rate and plant stress resistance [11]. Huang found that N application at the tuber expansion stage could enhance the N assimilation ability of leaves, prolong photosynthesis, and, thus, increase the leaf area index [12], while Sarkar believed that applying a lower level of N at this stage would be more effective in terms of tuber yield and quality. It was beneficial to tuber formation [13].
N is involved in various physiological and biochemical reactions in plants, and also plays a crucial role in the synthesis of enzymes of different properties [14]. These key enzymes of N metabolism are involved in N absorption, transport, assimilation, and during plant senescence processes such as recycling and remigration [15,16]. Potato contains more carbohydrates and is an ammonium N-loving crops. It has a strong ability to absorb ammonium N, which is conducive to the synthesis of organic N compounds from ammonium N. Glutamate synthase (GOGAT) and glutamate dehydrogenase (GDH) directly participate in this process and assimilate it into amino acids [17]. In addition, more than 90% of the nitrate absorbed by the root system of crops goes to the roots and stems through N assimilation, and is further reduced to ammonium by nitrate reductase (NR), nitrite reductase (NiR) and glutamine synthase (GS). Research showed that the activity of NR decreased with increasing application of ammonium N [18,19]. The content and activity of NR, GS, and GOGAT were positively correlated with yield and N application level [20,21]. Wang found that under low N conditions, low-N and high-efficiency cultivars of maize could maintain high NR, NiR, GS, and GOGAT activity [22].
The N metabolism pathway map obtained by Kyoto Encyclopedia of Genes and Genomes (KEGG) analysis shows that the biological process of the N metabolism pathway is a complex interaction between different reactions, in which the core N cycle involves four reduction pathways: N fixation, assimilated nitrate reduction, dissimilatory nitrate reduction and denitrification. In addition, it involves two oxidation pathways: nitrification and anammox. However, not all reactions occur in plants, and the key enzyme genes and transporters of the N metabolism pathway are mainly concentrated in the assimilation or dissimilatory nitrate reduction and denitrification processes. Studies have shown that the N efficiency of rice 35S:NADH-GOGAT-OE plants can be effectively improved [23], while GDH promoted the ammonia assimilation ability of rice under low N stress to improve N use efficiency [24]. In addition, there were differences in the expression levels of key enzymes of N metabolism under different treatments. Zhang found that the changes in the expression levels of GS2, GDH1, and NR in flue-cured tobacco tended to be consistent [25]. Research analyzed the expression levels of NR, GS, and GOGAT in different genotypes of tea cultivars. It was found that the gene expression differs significantly among different cultivars [26].
The changes of key enzyme activity of N metabolism are closely related to key enzyme genes in the N metabolism pathway. This experiment is expected to clarify the changes of key enzyme genes and enzyme activity of the N metabolism pathway in potato under different N supply levels, and to explore the relationship between them. We also expect to explore the differences between the different N efficiency genotypes of potato. This will lay a foundation for the subsequent in-depth exploration of the function of each gene in the N metabolism pathway of potato, and provide a theoretical basis for rational N application.

2. Materials and Methods

2.1. Material

Plant materials: The N-efficient potato Yanshu 4 and the N-inefficient potato Atlantic.
Reagents: MiniBEST Universal RNA Extraction Kit (TAKARA 9767), PrimeScript RT reagent Kit with gDNA Eraser (Perfect Real Time) (TAKARA RR047A), TB Green® Premix Ex Taq (Tli RNaseH Plus) (TAKARA RR420A), Nitrate Reductase (NR) Test Kit (comin NR-2-W), nitrite reductase (NiR) Test Kit (comin NIR-2-G), glutamine synthase (GS) Test Kit (comin GS-2-Y), glutamate synthase (GOGAT) Test Kit (comin GOGAT-1-Y), glutamate dehydrogenase (GDH) Test Kit (comin GDH-2-Y).
The above plant materials and reagents are preserved and provided by the Potato Innovation Team of Jilin Agricultural University.

2.2. Methods

2.2.1. Test Treatment and Sampling

Yanshu 4 (Y) and Atlantic (A) were pre-germinated and seeded, and were potted in the vegetable base of Jilin Agricultural University using a two-factor random block design. Take the base field soil and peat and mix them at a ratio of 4:1, and set 3 N supply levels for each cultivar: low N, normal N, and excess N, which are represented by N, N, and N+, respectively, and urea (containing N 46%) 0, 18, 25 kg/667 m2 (0, 6.5, 10.3 g/pot); uniformly apply calcium superphosphate (containing P2O5 46%) 18 kg/667 m2 (9.8 g/pot), sulfuric acid potassium (containing K2O 50%) 36 kg/667 m2 (16.3 g/pot). All fertilizers were applied once before sowing, with 10 pots per treatment, repeated 3 times.
Growth was divided into the following 4 stages according to the metabolism indexes and growth characteristics of potato during the growth process: Seedling stage (S) approximately 15 days after emergence; Budding stage (B) approximately 30 days after emergence; Tuber expansion stage (T) approximately 40 days after emergence; Mature stage (M) stems and leaves were basically withered, and the whole plant showed senescence. Plants with the same growth vigor were randomly selected, fresh leaves (L) and roots (R) of each stage were washed with deionized water, quick-frozen in liquid nitrogen and stored in -80°C for use, and repeated 3 times.

2.2.2. Obtaining Key Enzyme Gene Sequences

The N metabolism pathway map was obtained by KEGG software analysis (https://www.kegg.jp/kegg/kegg2.html accessed on 15 February 2020). Combined with the previous research conducted by the research group at the transcriptome level, it was found that there were 14 key enzyme genes in potato. Therefore, the gene sequence was obtained from the laboratory transcriptome database.

2.2.3. Quantitative Real-Time PCR

Total RNA was extracted from the leaves and roots of Yanshu 4 and Atlantic at each stage, and the first strand of cDNA was synthesized by reverse transcription. Primer 6.0 was used to design qRT-PCR primers for 14 genes and internal reference genes (Table 1). The reaction system: TB Green Premix Ex Taq 10.0 μL, ROX Reference Dye 0.4 μL, cDNA 2.0 μL, upstream primer 0.8 μL, downstream primer 0.8 μL, ddH2O 6.0 μL. qRT-PCR reaction program: pre-denaturation at 95 °C for 30 s; denaturation at 95 °C for 5 s, annealing at 59 °C for 30 s, 40 cycles; melting segment at 95 °C for 15 s, 59°C for 1 min, and 95 °C for 15 s. Three repetitions were set.

2.2.4. Determination of Key Enzyme Activity of N Metabolism

The enzyme activity of leaves of Yanshu 4 and Atlantic at different stages were measured. Nitrate reductase (NR) activity was measured using a Nitrate Reductase (NR) Test Kit (comin NR-2-W); it was expressed by measuring the amount of NADH reduction. Nitrite reductase (NiR) activity was measured using a Nitrite Reductase (NiR) Test Kit (comin NIR-2-G); it was expressed by measuring the amount of NO2 reduction. Glutamine synthase (GS) activity was measured using a Glutamine Synthase (GS) Test Kit (comin GS-2-Y); it was expressed by measuring the amount of γ-glutamyl hydroxamic acid produced. Glutamate synthase (GOGAT) activity was measured using a Glutamate Synthase (GOGAT) Test Kit (comin GOGAT-1-Y); it was expressed by measuring the amount of NADH reduction. Glutamate dehydrogenase (GDH) activity was measured using a Glutamate Dehydrogenase (GDH) Test Kit (comin GDH-2-Y); it was expressed by measuring the amount of NADH reduction. They were measured using the spectrophotometric method. The specific steps were operated in accordance with the instructions of the kit, and three repetitions were set.

2.2.5. Statistical Analysis

The quantitative real-time PCR test data were processed by the method of 2−∆∆Ct, and it analyzed for significance using DPS7.05. Significant analysis was performed using the t test method, p < 0.05. Enzyme activity was calculated according to the instructions of each kit.

3. Results

3.1. Acquisition of Key Enzyme Genes of Potato N Metabolism Pathway

Through KEGG software analysis combined with previous research at the transcriptome level, 14 key enzyme genes in the N metabolism pathway were obtained [27], namely nitrate reductase gene StNR, nitrite reductase gene StNiR, and glutamine synthase gene StGSs, glutamate synthase gene StGOGATs, glutamate dehydrogenase gene StGDH, and StNRTs protein family. Among them, StGSs are divided into StGS1, StGS1-2, StGS1-3, StGS1-4, and StGS2; StGOGATs are divided into StFd-GOGAT and StNADH-GOGAT; StNRTs protein family members include StNRT1.5, StNRT2.4, StNRT2.5, and StNRT2.7.

3.2. Relative Expression Analysis of Key Enzyme Genes in the N Metabolism Pathway of Two Genotypes of Potato under Different N Supply Levels

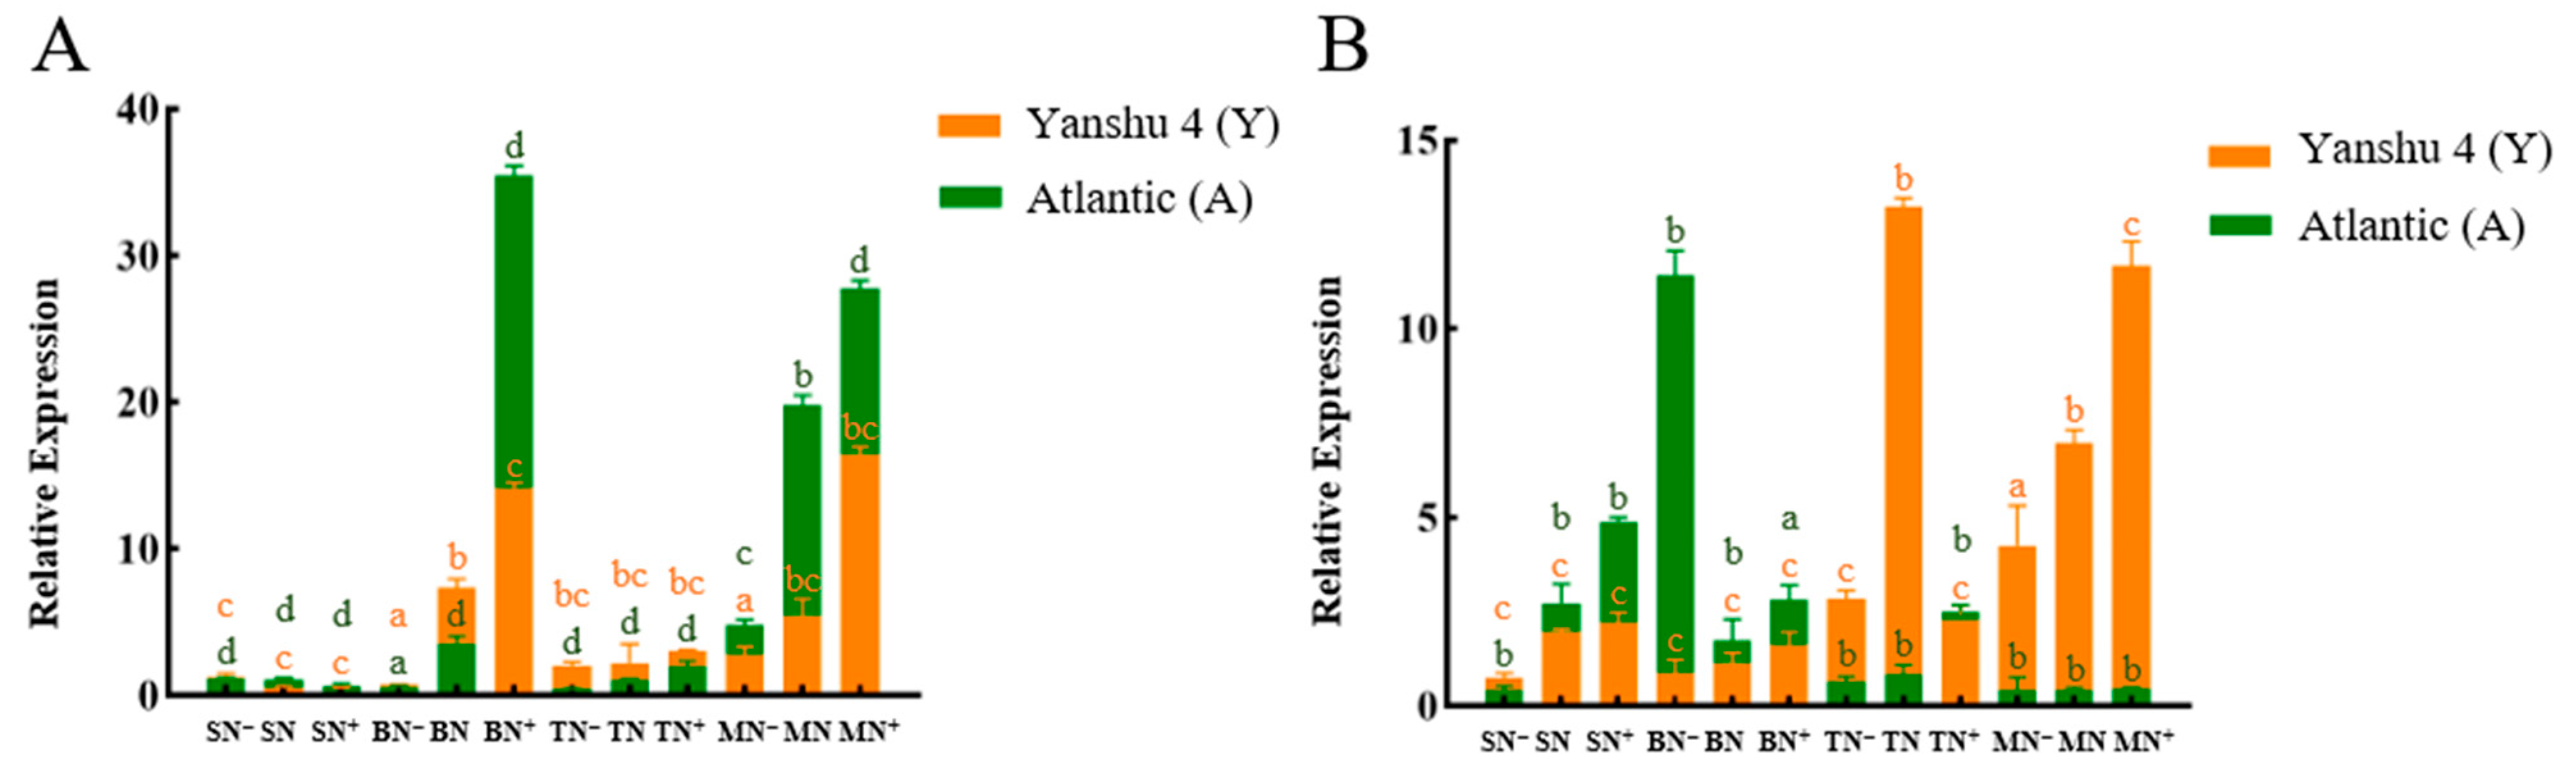
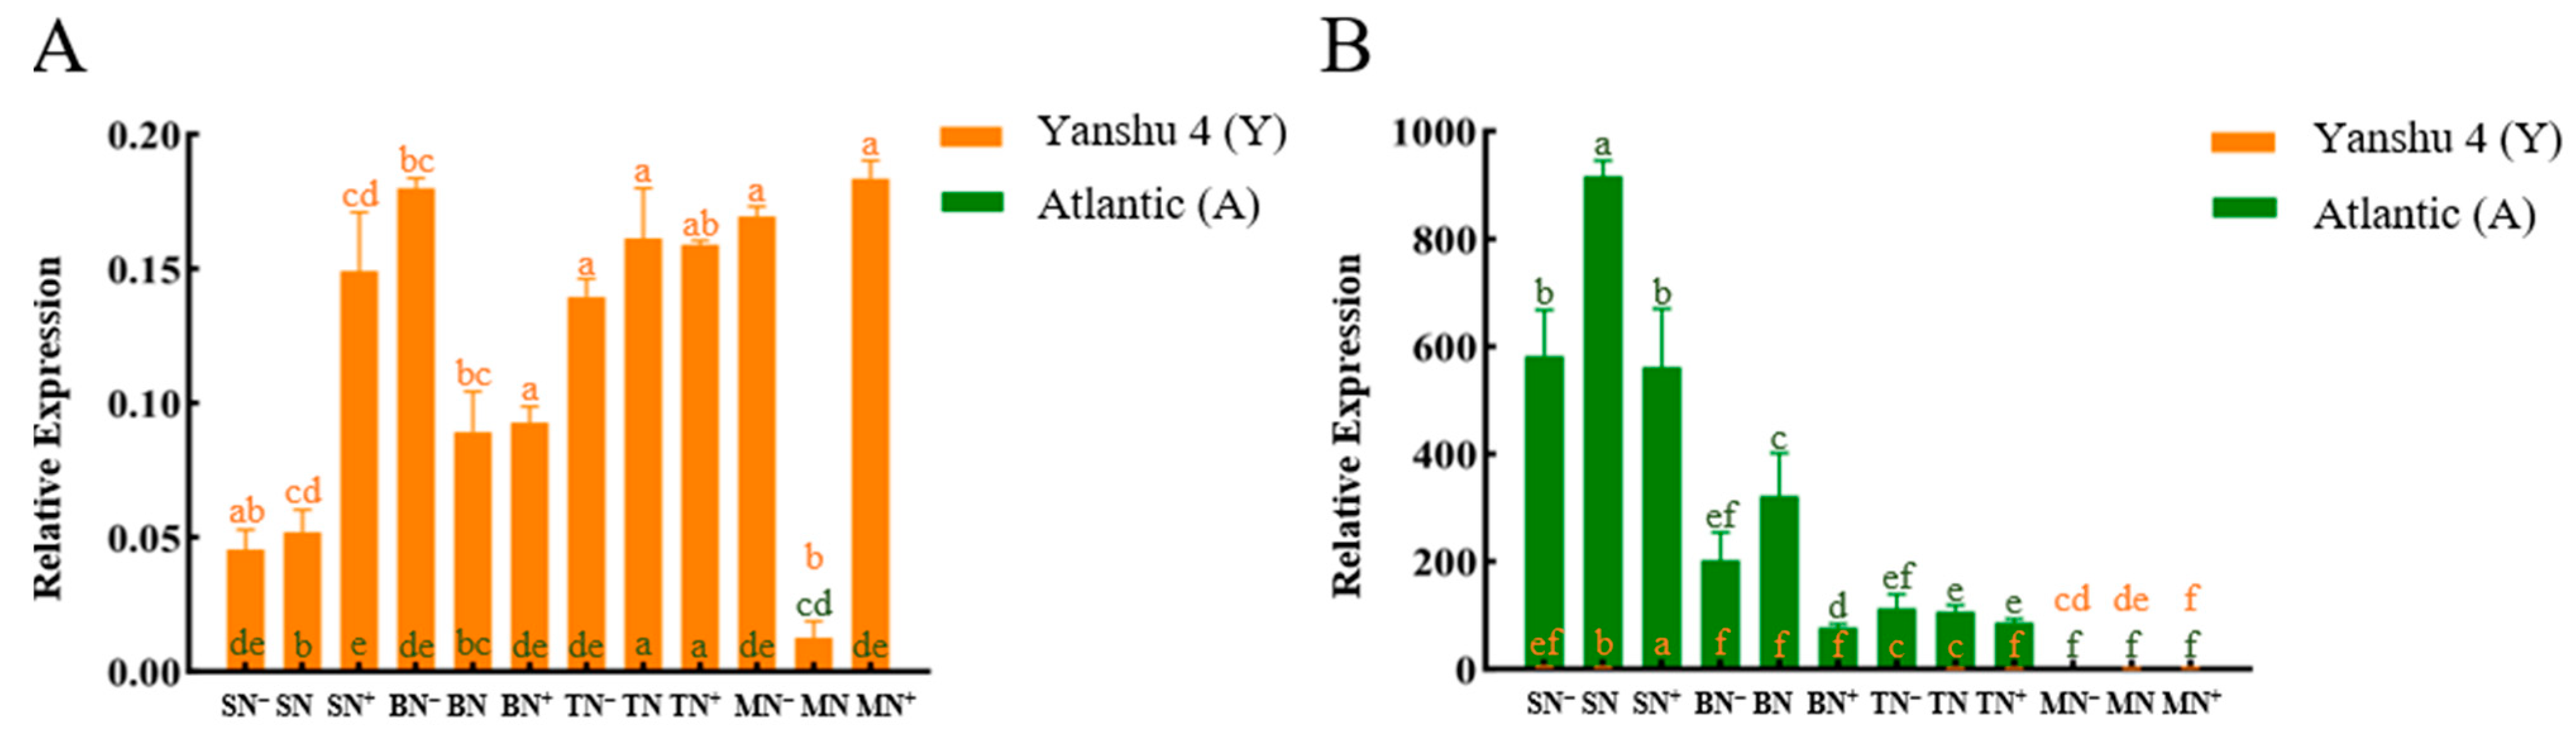
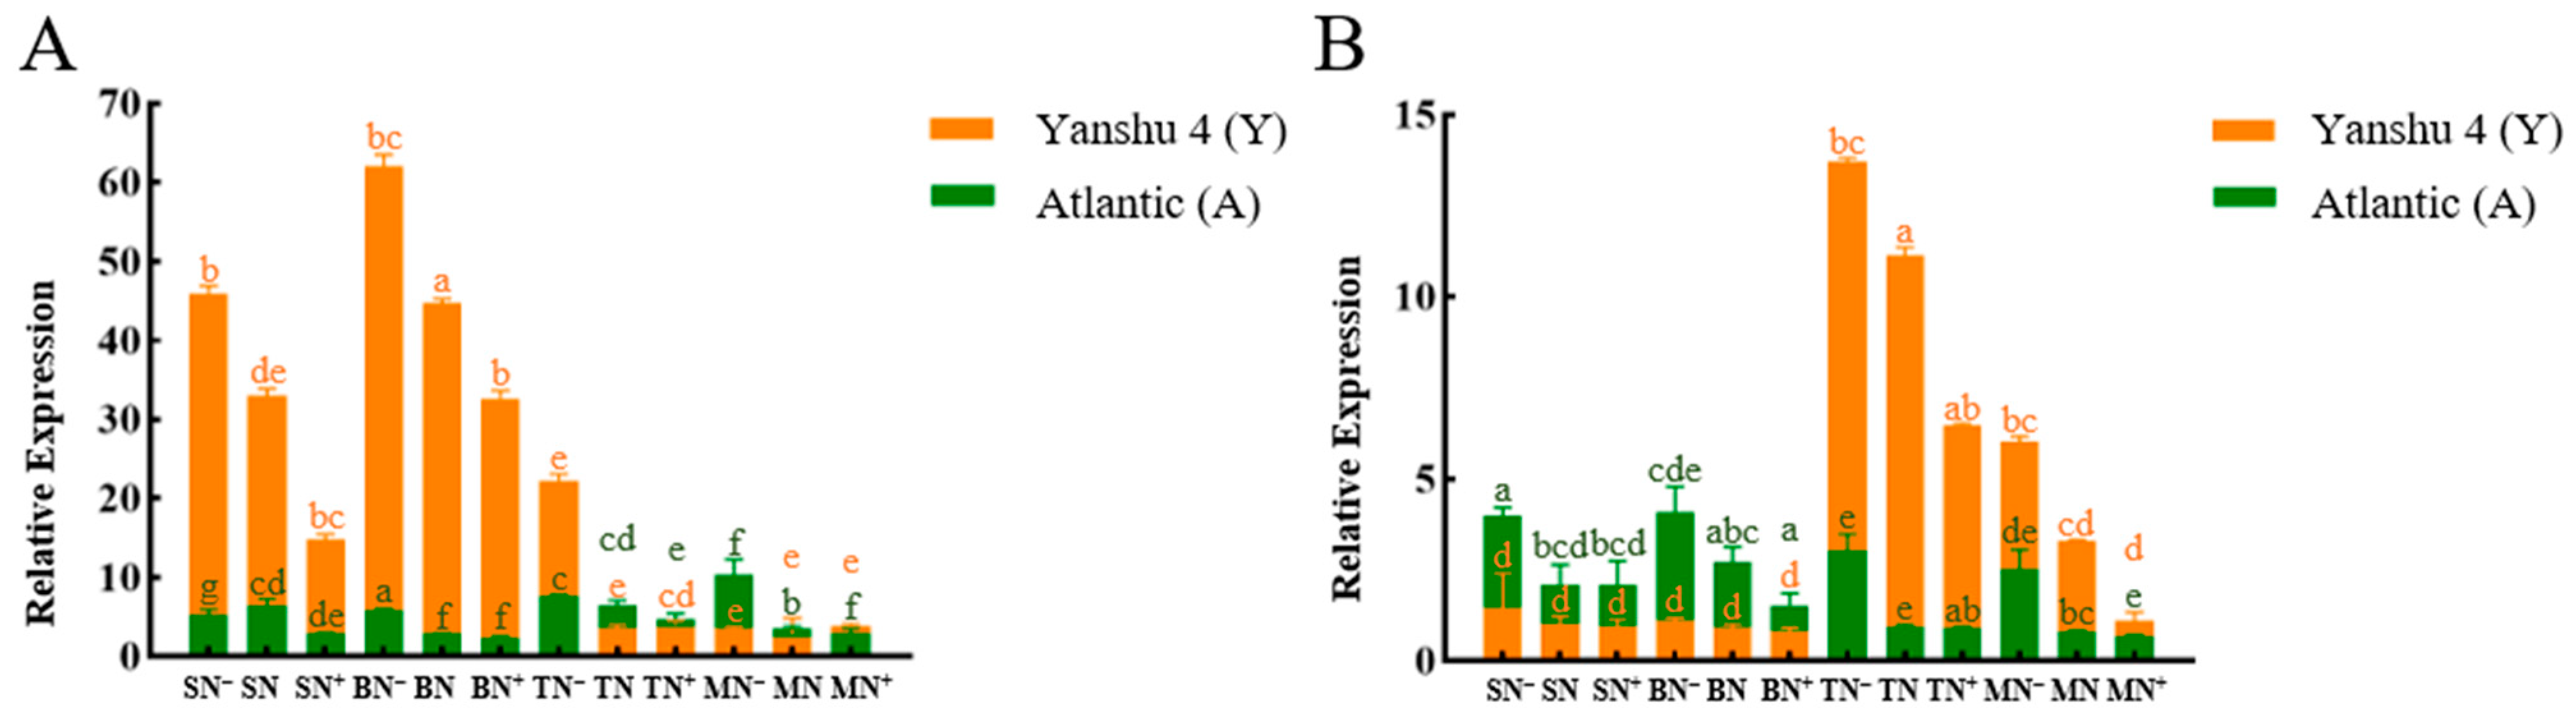
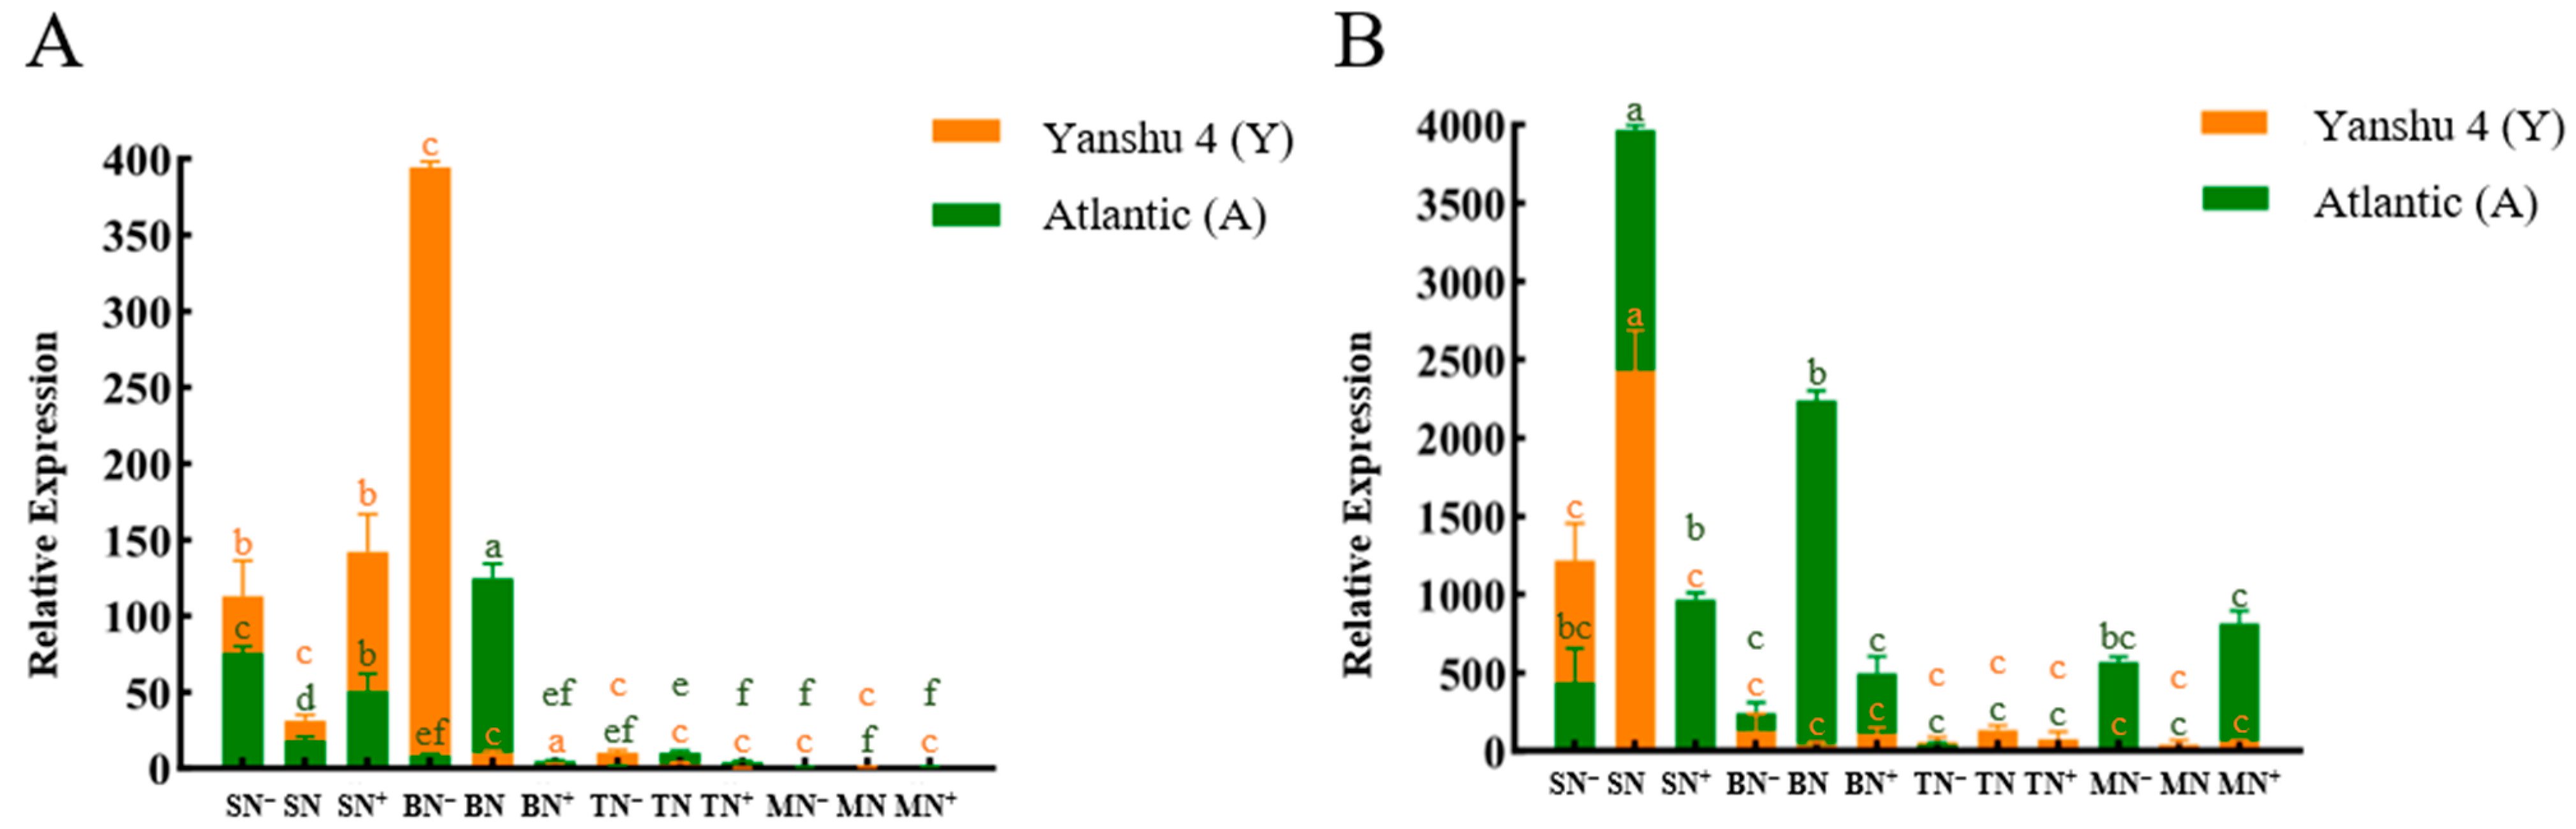
3.2.1. Analysis of Relative Expression of Nitrate Reductase Gene StNR in Two Genotypes of Potato under Different N Supply Levels

Analysis of the relative expression of StNR in two different genotypes of potato under different N supply levels showed that in leaves (Figure 1A), the expression trends of N-efficient cultivar Y and N-inefficient cultivar A were basically the same. The expression of StNR increased gradually in the B, T, and M stages, but the overall expression level was lower in the S and T stages. Y reached a peak value under N+ treatment in the M stage, A reached its peak under N+ treatment in the B stage, and the overall expression level in A was significantly higher than that in Y. In roots (Figure 1B), the expression of StNR gradually increased in the S, B, and M stages of Y, and the S and T stages of A with the increase in N application. Y first increased and then decreased during the T stage and reached a peak under N treatment. A first decreased and then increased in the B stage and reached a peak under N treatment, and the overall expression level in the T and M stages of Y was significantly higher than that of A. The expression of StNR generally showed an upward trend with the increase in N application, indicating that excessive N application could promote the expression of StNR. It may be that the increase in N application accelerated the assimilation of nitrate and catalyzed the conversion of nitrate to nitrite.

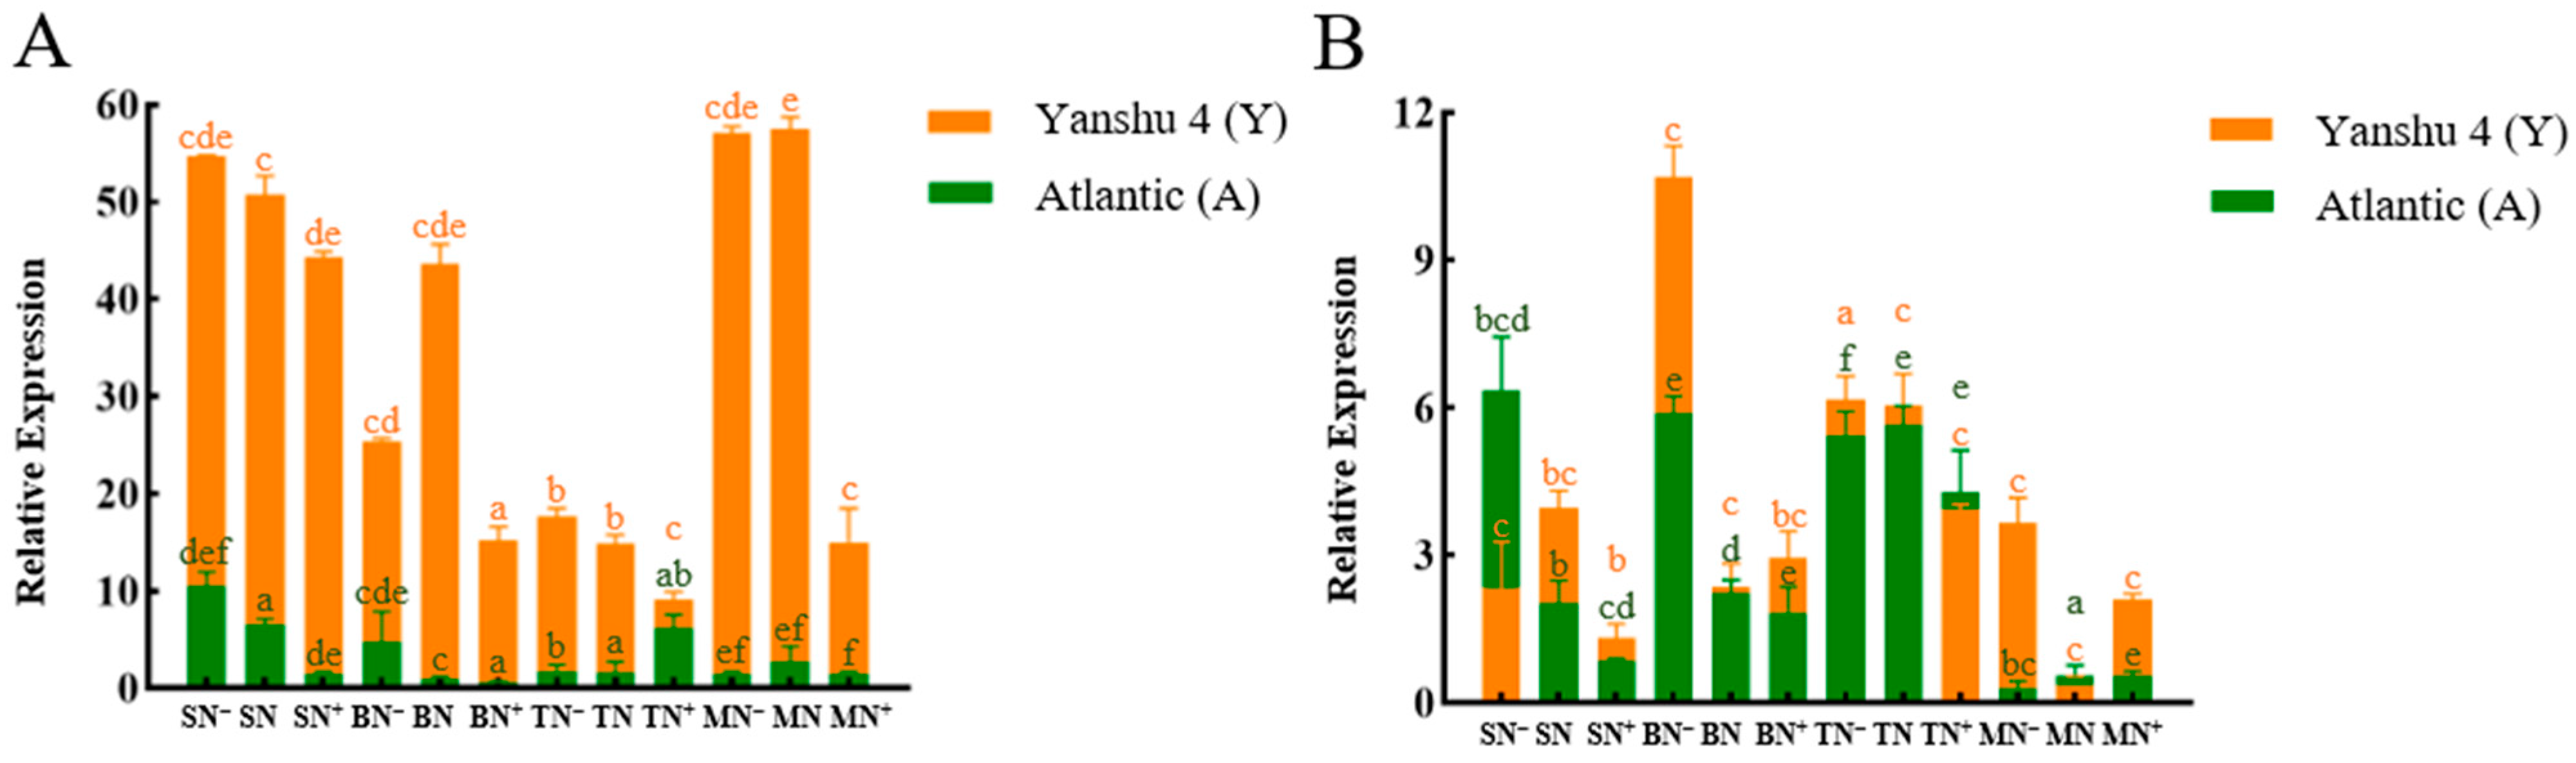
3.2.2. Analysis of Relative Expression of Nitrite Reductase Gene StNiR in Two Genotypes of Potato under Different N Supply Levels

The analysis of the relative expression of StNiR in two different genotypes of potato under different N supply levels showed that in leaves (Figure 2A) with the increase in N application, the overall StNiR expression of the two potato cultivars showed an upward trend. The expression level of A was higher than that of Y, and the expression level of A was significantly higher in the M stage than in other stages, and reached the peak under N+ treatment. While the StNiR expression in Y is basically not expressed in the S stage, and the expression level in the whole growth stage is also low. Additionally, in the B stage, the peak value was reached under N+ treatment. In roots (Figure 2B), the expression level of StNiR in Y was higher than that in A except for the M stage, and the expression trend and peak value of StNiR in the two genotypes of potato were the same as those in leaves with the increase in N application rate. In addition, it could be found from the figure that the expression trend of StNiR was basically the same as that of StNR, indicating that excessive N application could also promote the expression of StNiR. StNiR participates in the second step of nitrate assimilation after StNR, converting nitrate to ammonia in the chloroplast.

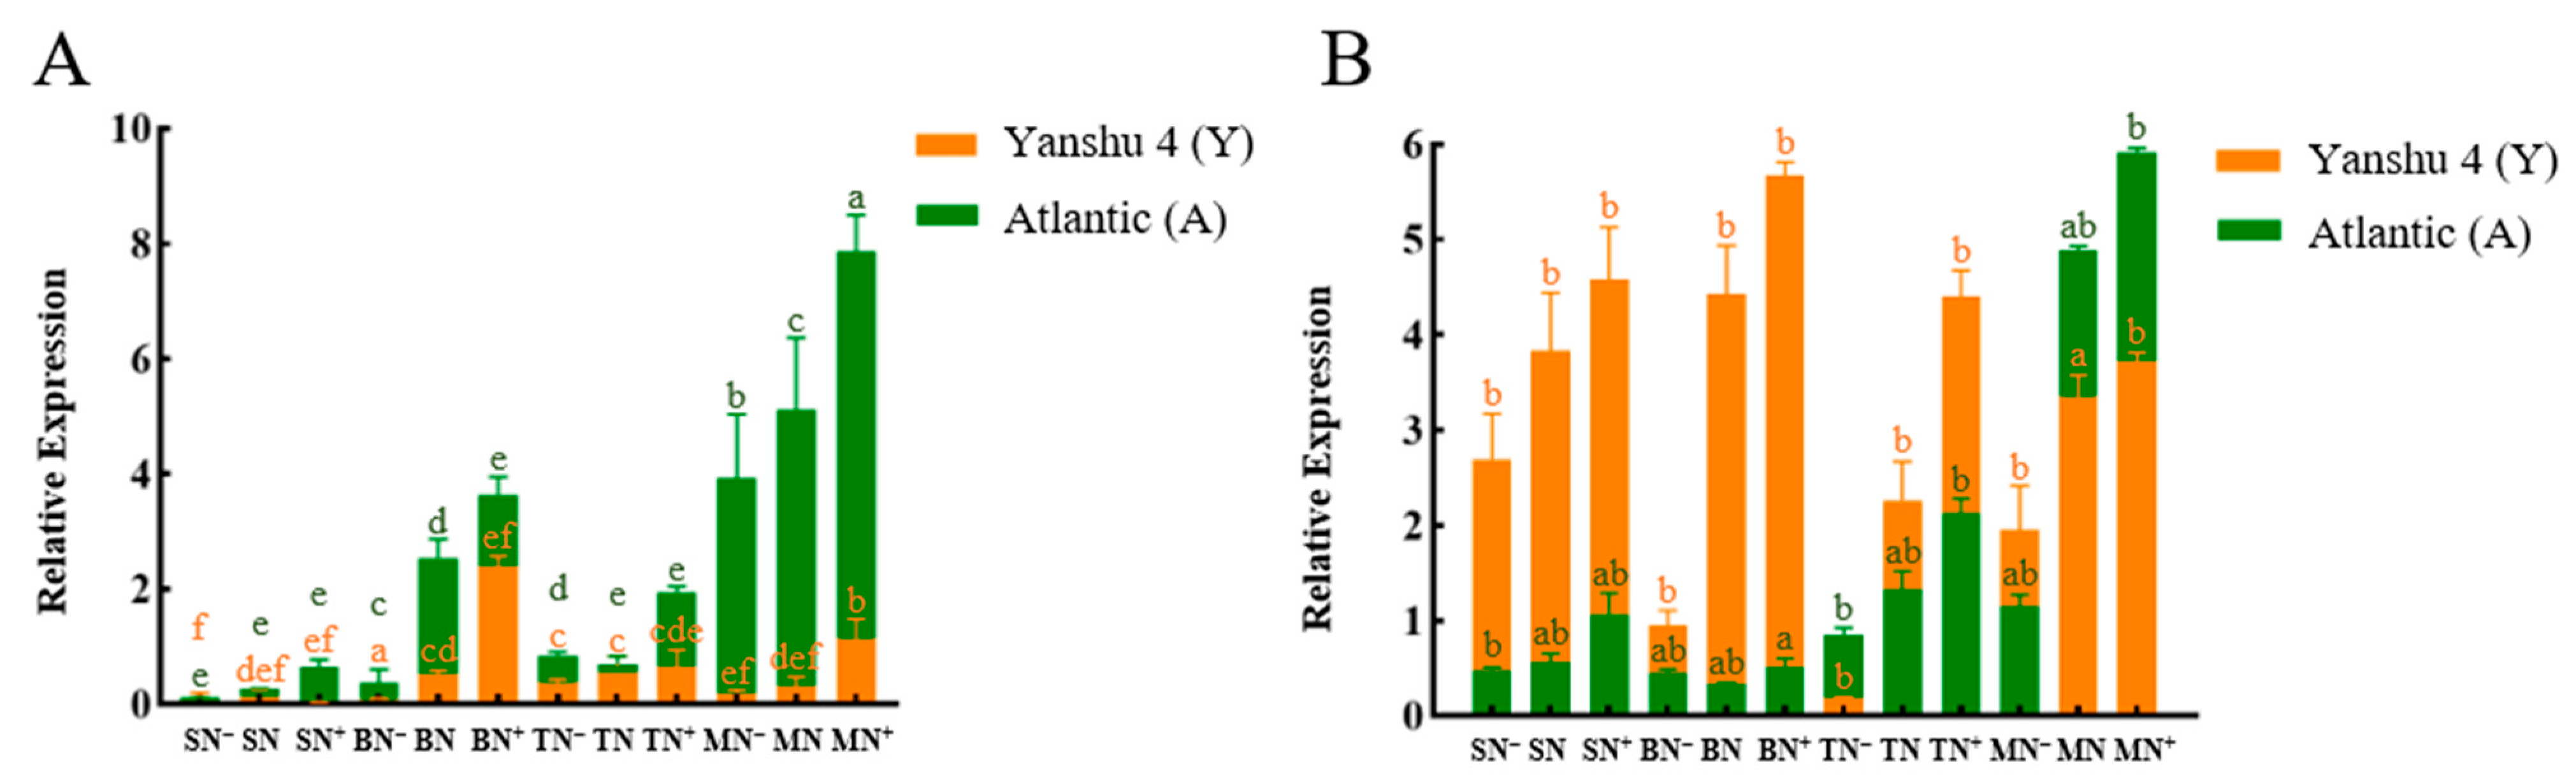
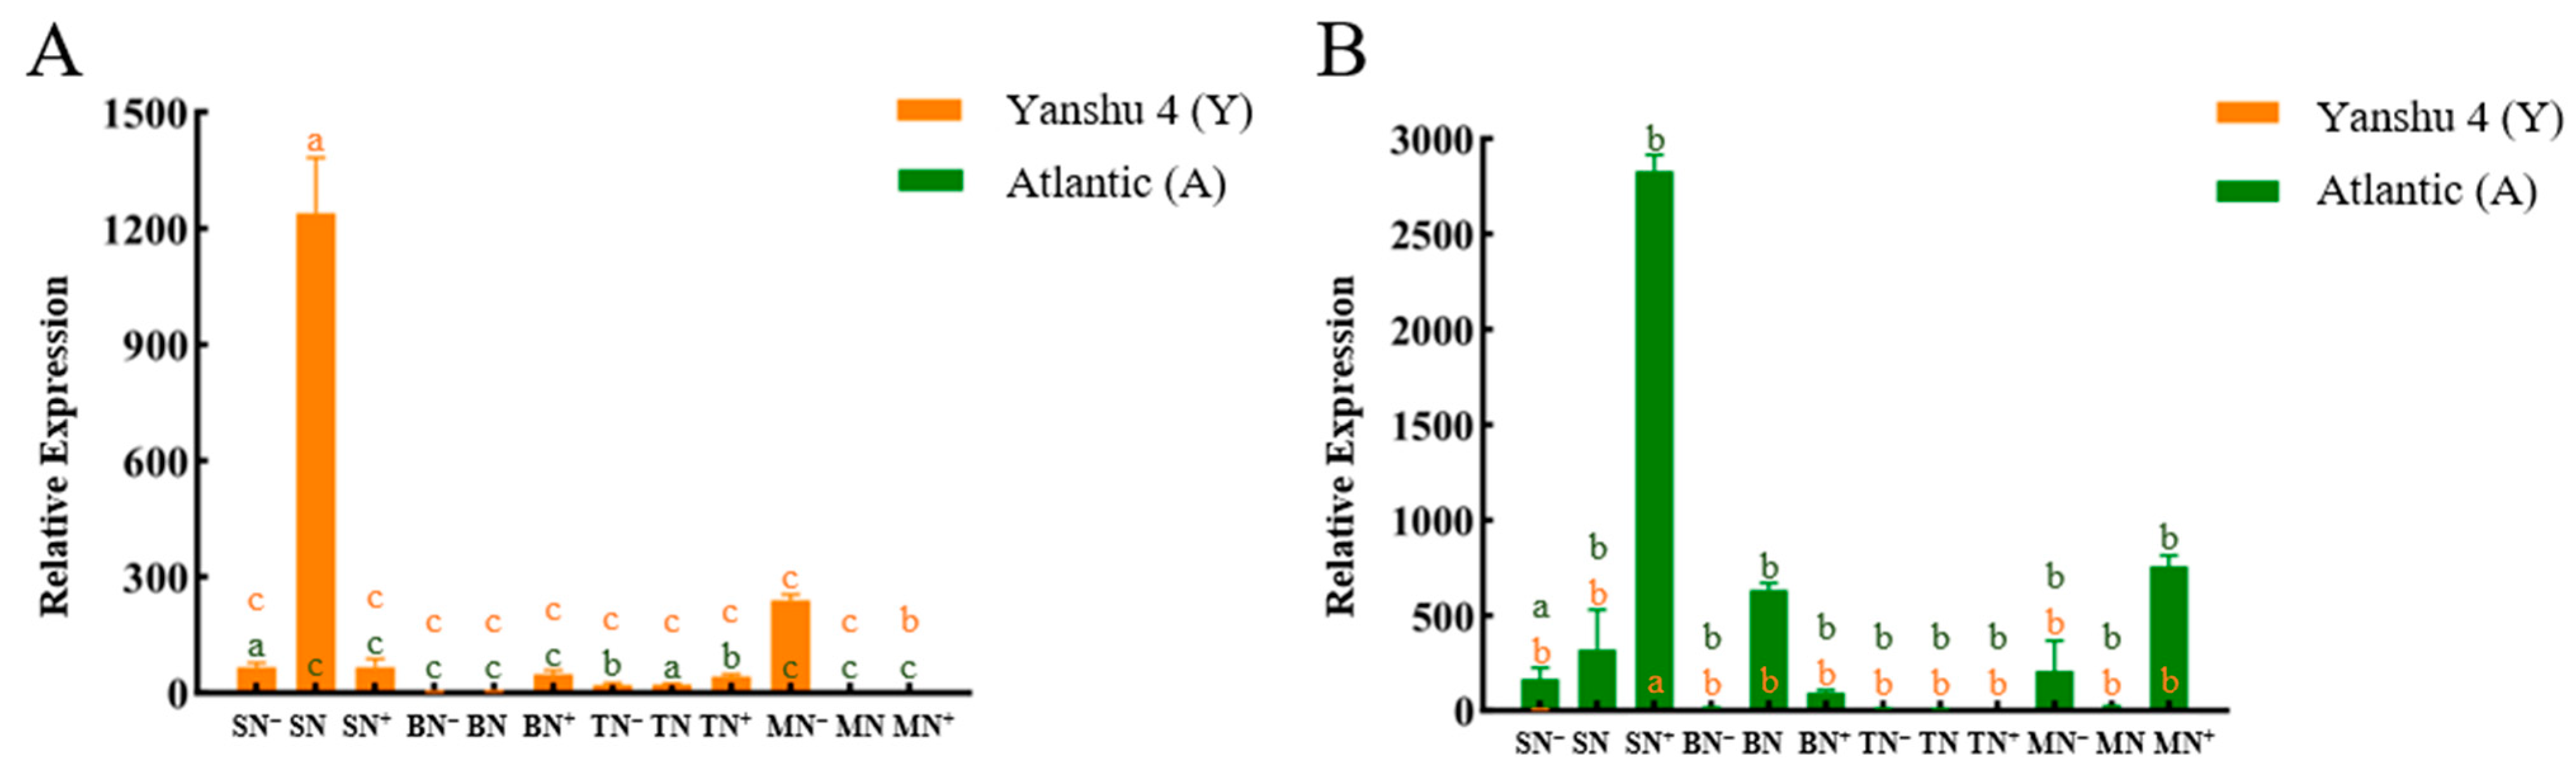
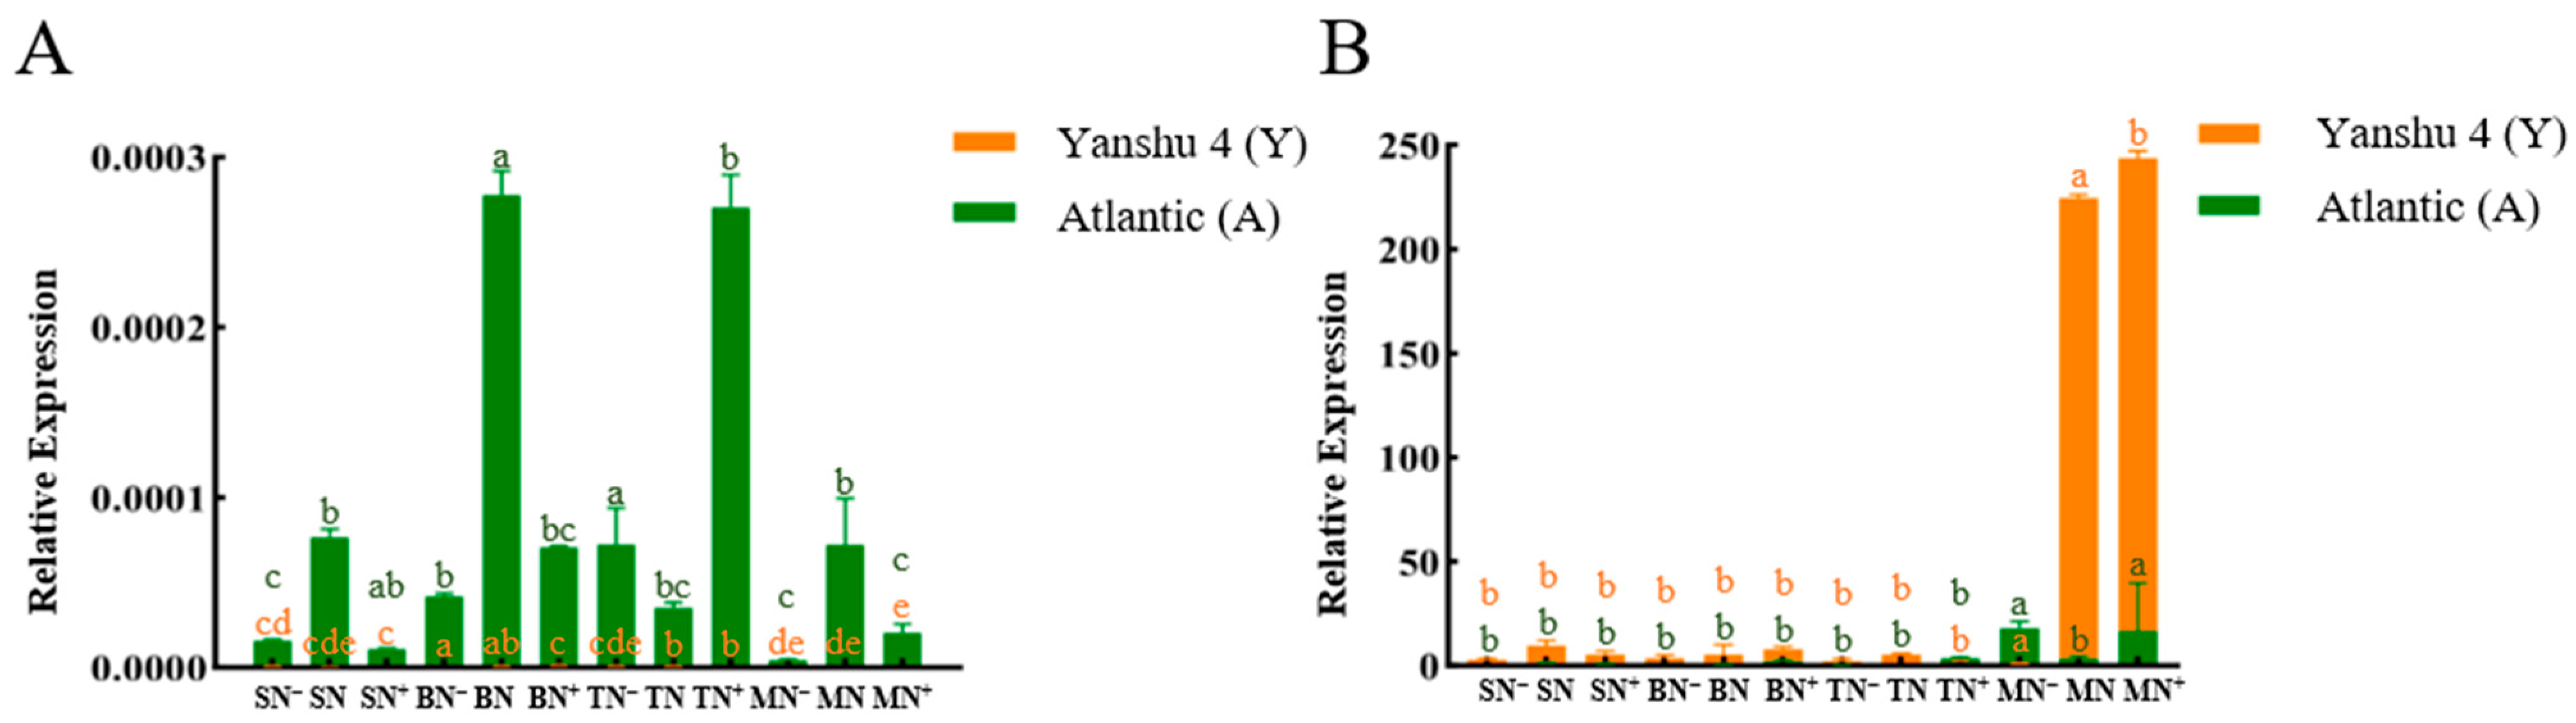
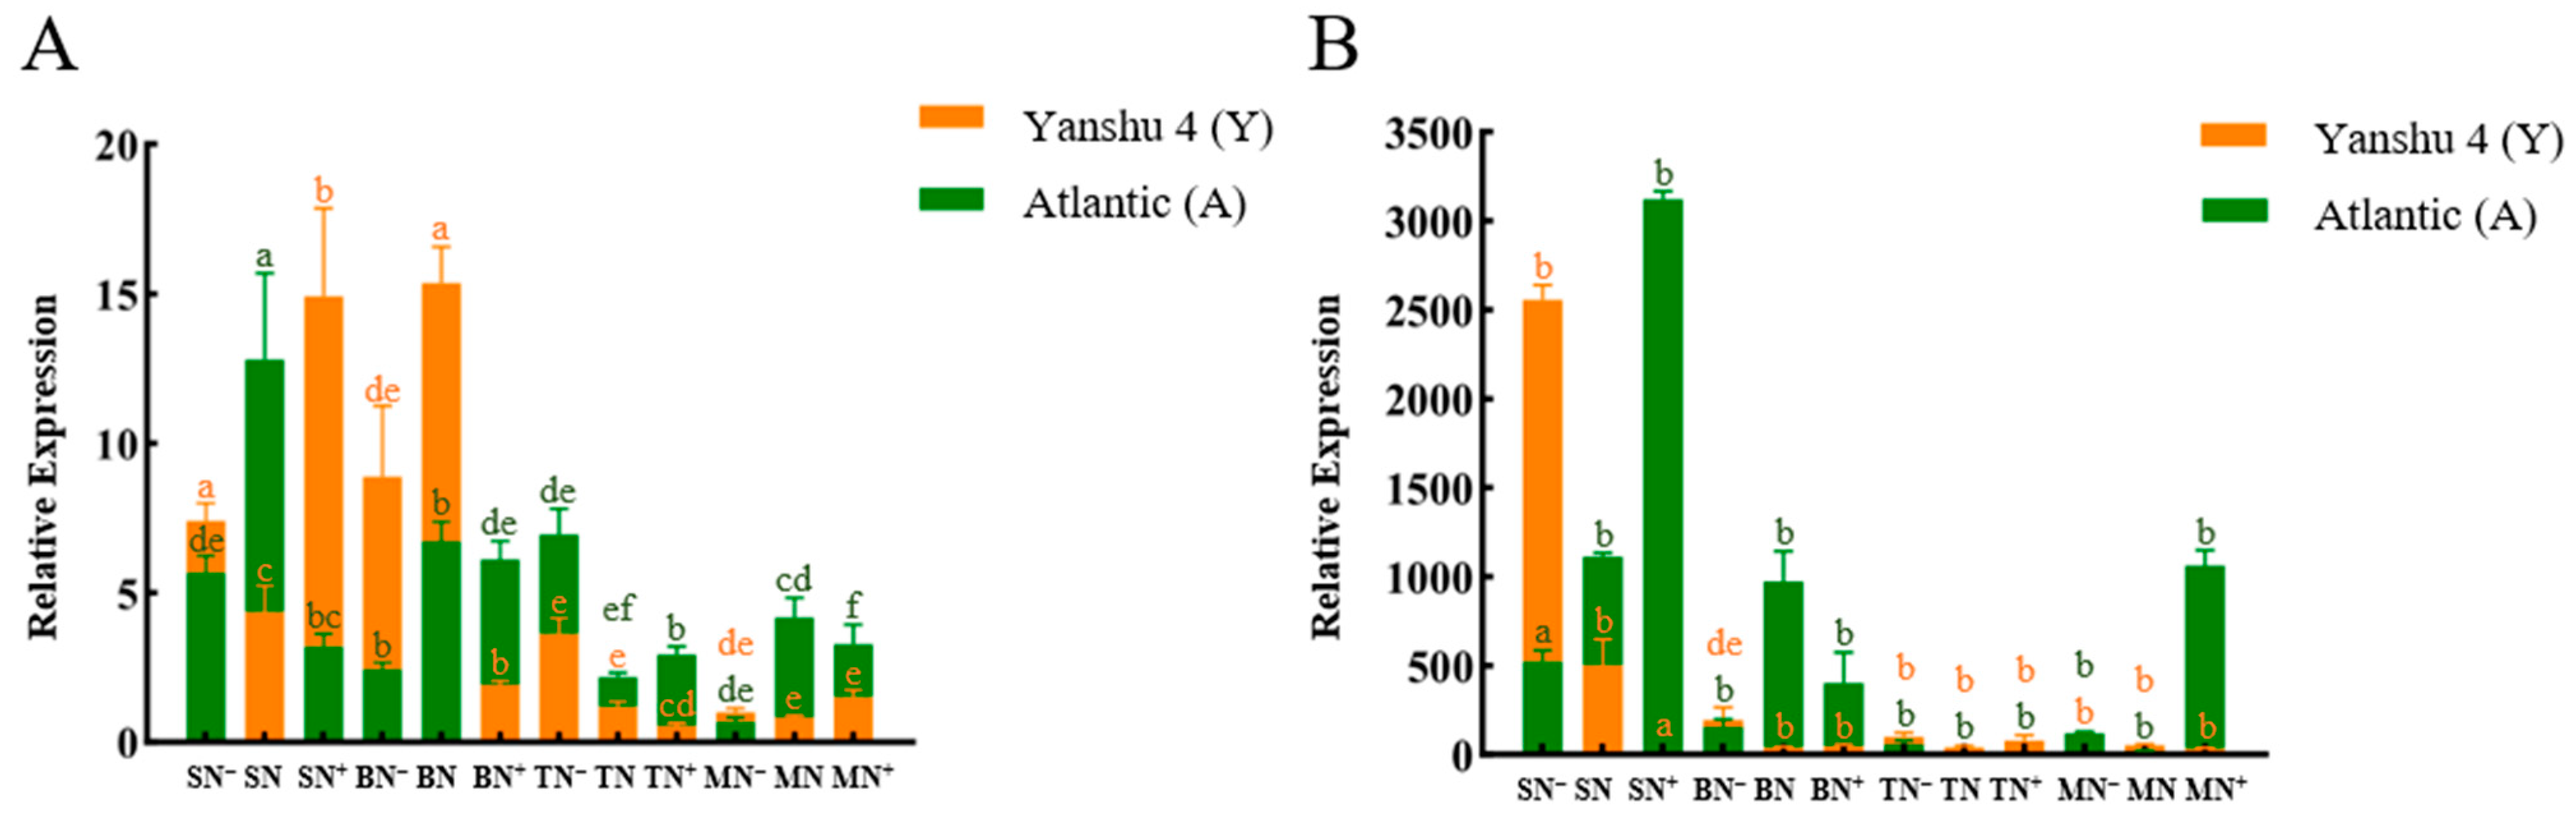
3.2.3. Relative Expression Analysis of Glutamine Synthase Gene StGSs in Two Genotypes of Potato under Different N Supply Levels

StGSs are genes necessary for ammonia assimilation, which can promote the conversion of inorganic N into organic N. StGSs are divided into StGS1, StGS1-2, StGS1-3, StGS1-4, and StGS2. The relative expression levels of StGSs in two different genotypes of potato under different N supply levels were analyzed. With the increase in N application rate, the expression of StGS1 in leaves (Figure 3A) showed an upward trend in Y except the T stage, and reached a peak under N+ treatment in the B stage. A showed a trend of first increase and then decrease except in the M stage. The peak value was reached under the N treatment in the S stage. In roots (Figure 3B) it showed an upward trend in the B and M stages of Y, in the S and M stages of A. The S stage of Y and the B stage of A first decreased and then increased, and both cultivars showed the trend of rising and then falling in the T stage, and all reached the peak value under the N+ treatment in the B stage. With the increase in N application rate, the expression of StGS1-3 in leaves (Figure 4A) was lower in the S and B stages of Y, and the S and T stages of A, while the expression levels of Y in the T stage and A in the M stage showed an upward trend and reached the peak under the N+ treatment. In roots (Figure 4B), the peak stage of Y and A was the same as that in leaves. The expression of Y was the most significant under the N treatment in the T stage, while the expression of A was the most significant under the N treatment in the M stage, and there was no significant difference in other stages.
StGS1-2 and StGS1-4 showed significant differences in the expression sites, roots and leaves. It could be found that it was basically not expressed in the leaves of N-inefficient cultivar A, while it was basically not expressed in the roots of N-efficient cultivar Y. Although StGS1-2 was expressed in Y leaves (Figure 5A), the expression level was low overall, and reached the peak under N+ treatment in the M stage. However, the expression of A was higher in roots (Figure 5B) during the S, B, and T stages. With the increase in N application rate, the overall expression increased first and then decreased, and reached the peak under the N treatment in the S stage. StGS1-4 peaked in Y leaves (Figure 6A) under N treatment in the S stage, and in A roots (Figure 6B) under N+ treatment at the same stage, and the expression levels were relatively low in other stages.
The overall expression of StGS2 in roots and leaves of A was higher than that of Y, indicating that it was more abundantly expressed in N-inefficient cultivars, but not expressed in Y roots. In leaves (Figure 7A) Y peaked under N treatment at the T stage and A under N+ treatment at the M stage. In roots (Figure 7B), with the increase in N application rate, it showed a trend of first increase and then decrease in each stage, and the expression level was the highest under N treatment in the S stage, followed by the M stage.

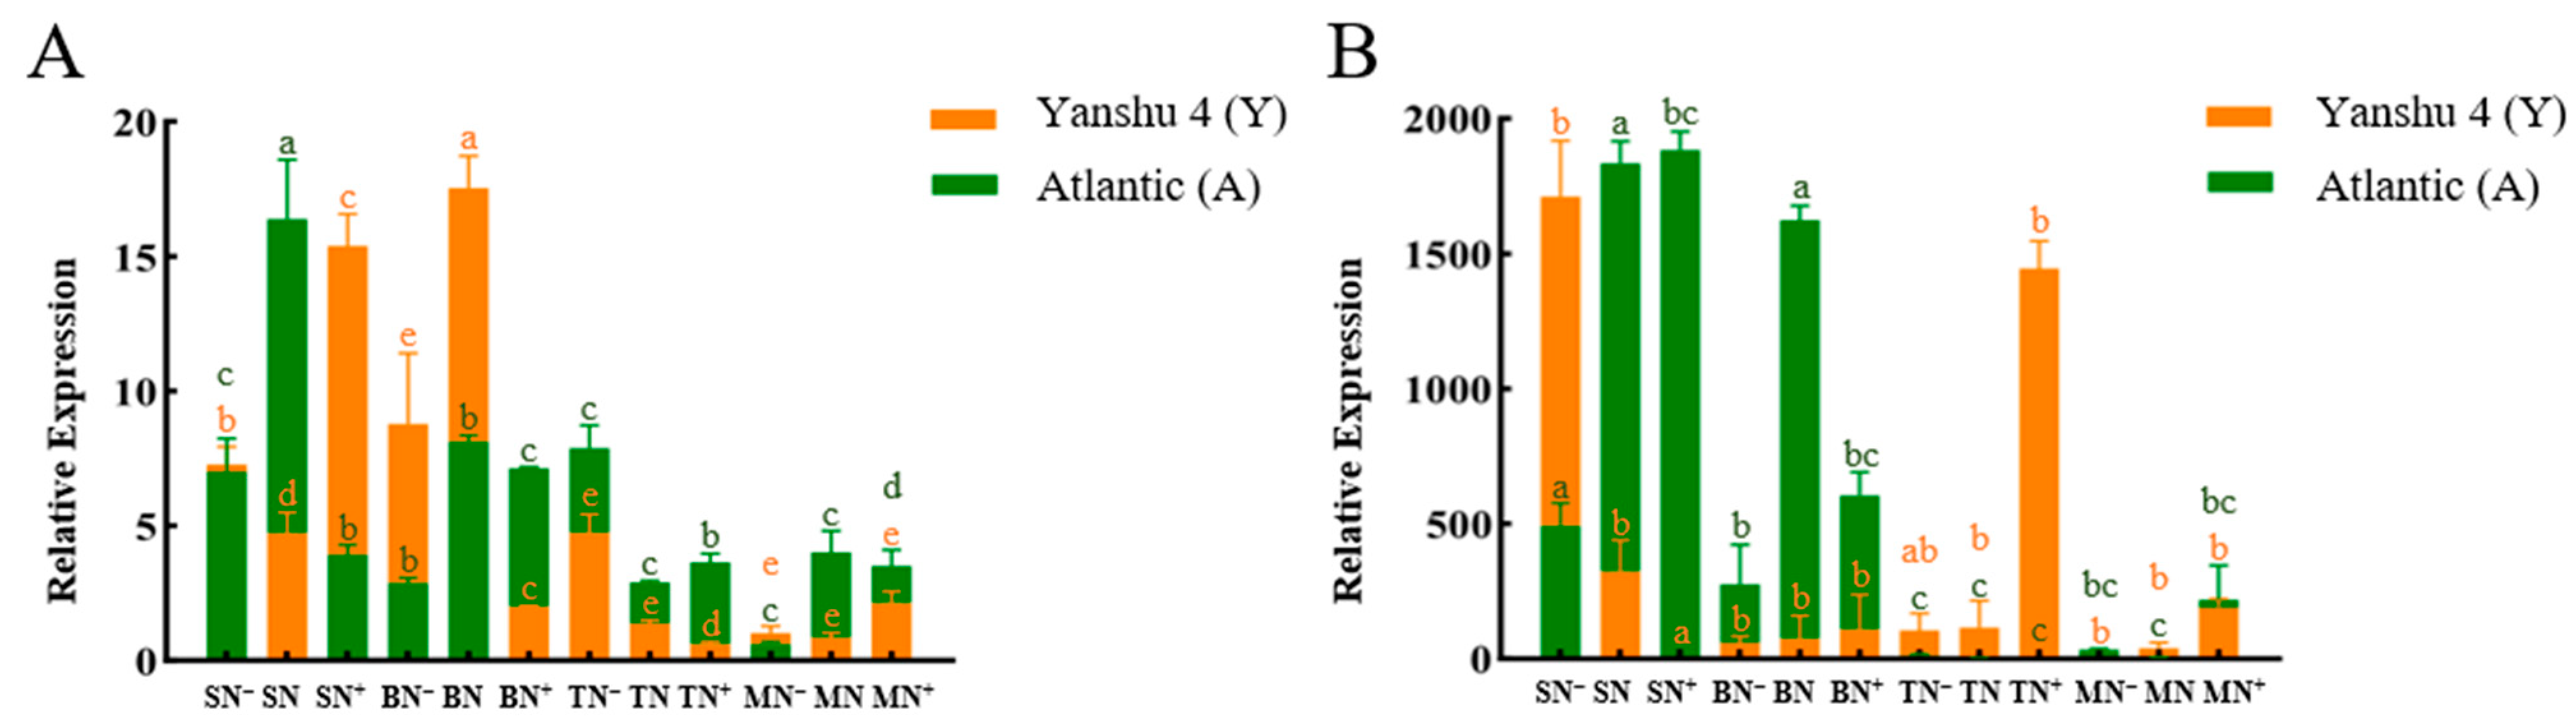
3.2.4. Relative Expression Analysis of Glutamate Synthase Gene StGOGATs in the Two Genotypes of Potato under Different N Supply Levels

StGOGATs are rate-limiting enzyme genes in the N assimilation GS/GOGAT pathway, and are divided into StFd-GOGAT with ferredoxin Fd as the electron donor and StNADH-GOGAT with NADH as the electron donor. The relative expression levels of StFd-GOGAT in two different genotypes of potato under different N supply levels were analyzed. Overall, the expression levels of A in roots and leaves were higher than those of Y, and the trend was more obvious in roots. With the increase in N application rate, the expression trend in leaves (Figure 8A) was relatively consistent at each stage. In Y and A, it first decreased and then increased, and the expression level in the B stage was relatively high and reached the level under N+ treatment. In addition, the expression level in each stage was the highest under N+ treatment, while the lowest under N treatment, indicating that the increase in external N concentration could promote the expression of this gene in leaves and accelerate N assimilation. In roots (Figure 8B), the expression of Y showed an upward trend in the S, B, and M stages and reached the peak under the N treatment in the S stage, and first increased and then decreased in the T stage. The expression of A in the S, T, and M stages gradually decreased with the increase in N application rate, and vice versa in the B stage. It reached the peak under the N+ treatment in the M stage. This indicated that high N in roots could promote the expression of StFd-GOGAT in N-inefficient cultivar A, while low N could promote the expression of this gene in N-efficient cultivar Y, which might be caused by the differences in genotypes of cultivars in response to N concentration.
With the increase in N application rate, the relative expression of StNADH-GOGAT in Y and A leaves (Figure 9A) showed a downward trend at each stage, the expression level was lower in the T and M stages, and the level expressed in the S and B stages in Y was significantly higher than that of A, indicating that the expression of StNADH-GOGAT was relatively abundant in the first half of the growth stage in Y leaves, while the expression level of A was relatively low throughout the growth stage. In roots (Figure 9B), the expression trend at each stage was consistent with that in leaves, showing a downward trend. The expression level of A was higher than that of Y in the S and B stages, while the expression level of Y was significantly higher than that of A in the T and M stages, which indicated that the expression level of A was significantly higher than that of leaves. In contrast, the expression of StNADH-GOGAT was more abundant in the second half of the mid-growth stage of Y roots. In addition, low N could promote the expression of StNADH-GOGAT in both roots and leaves.

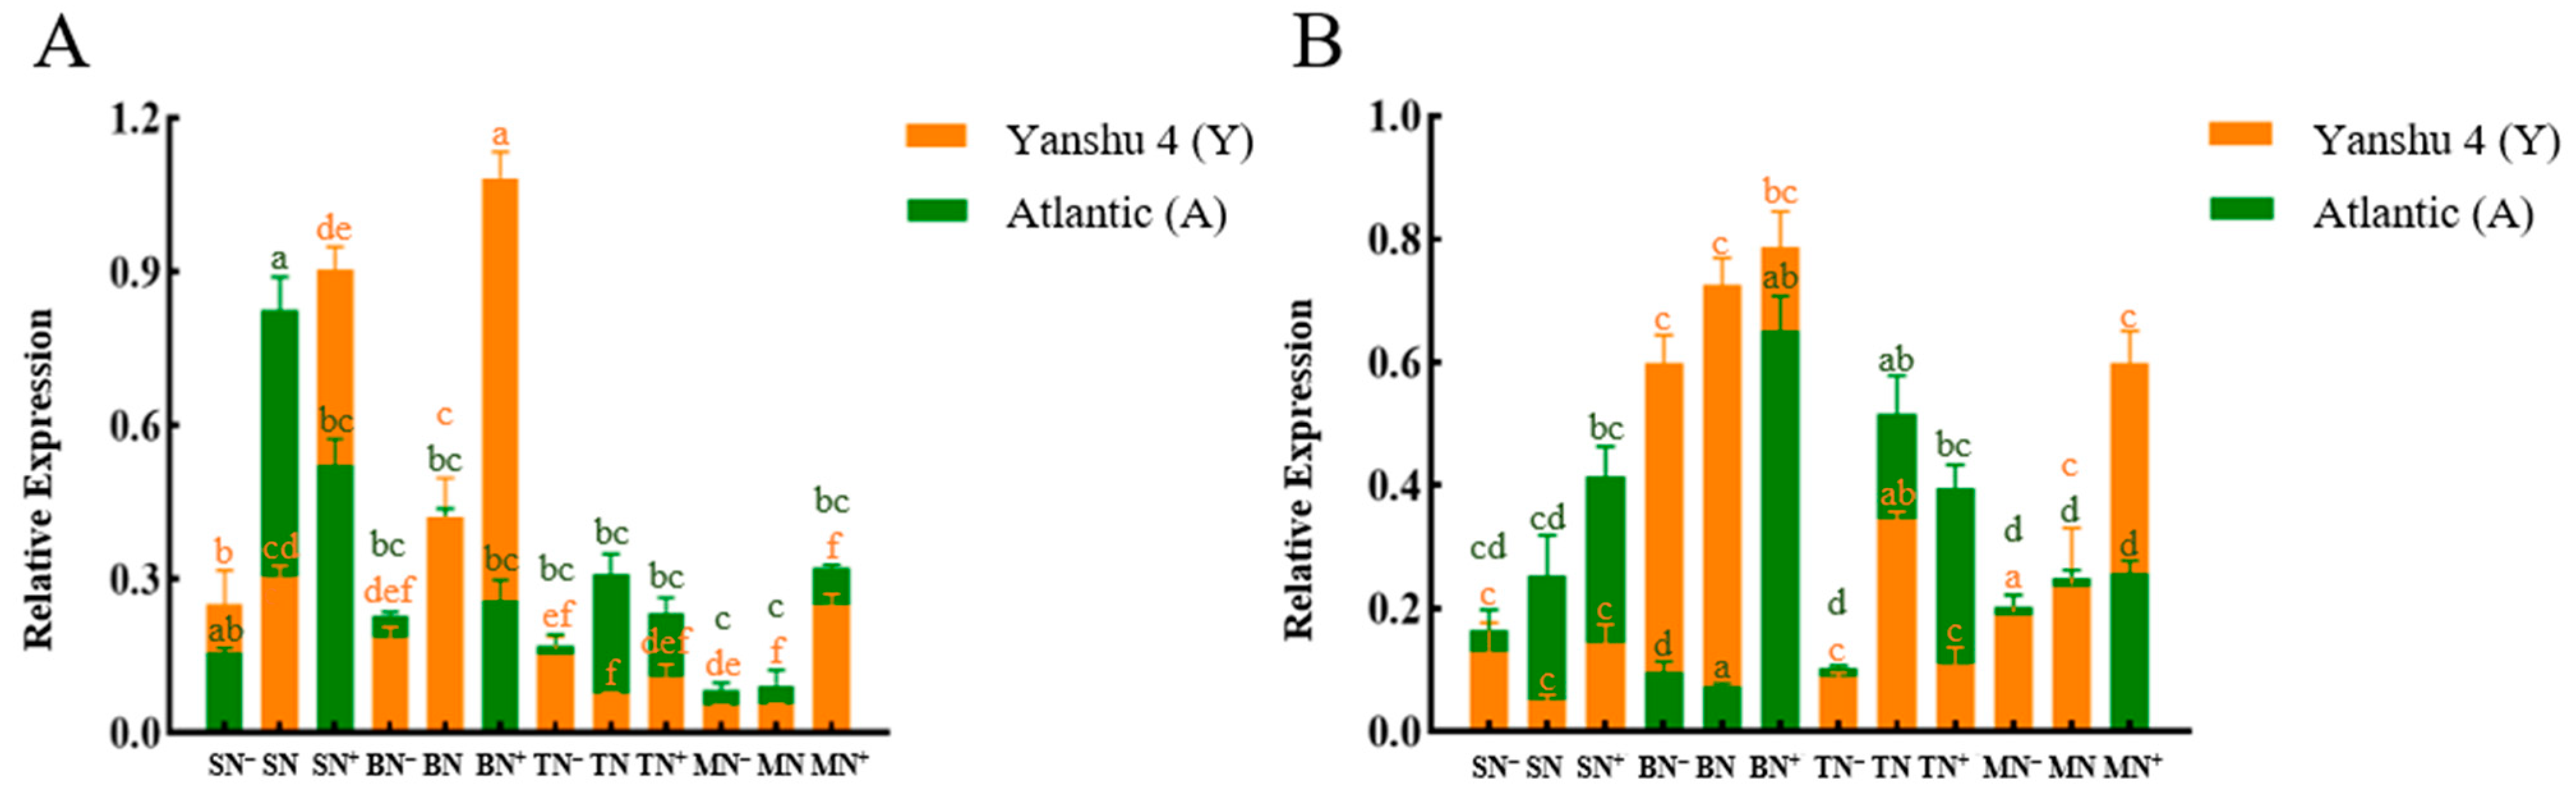
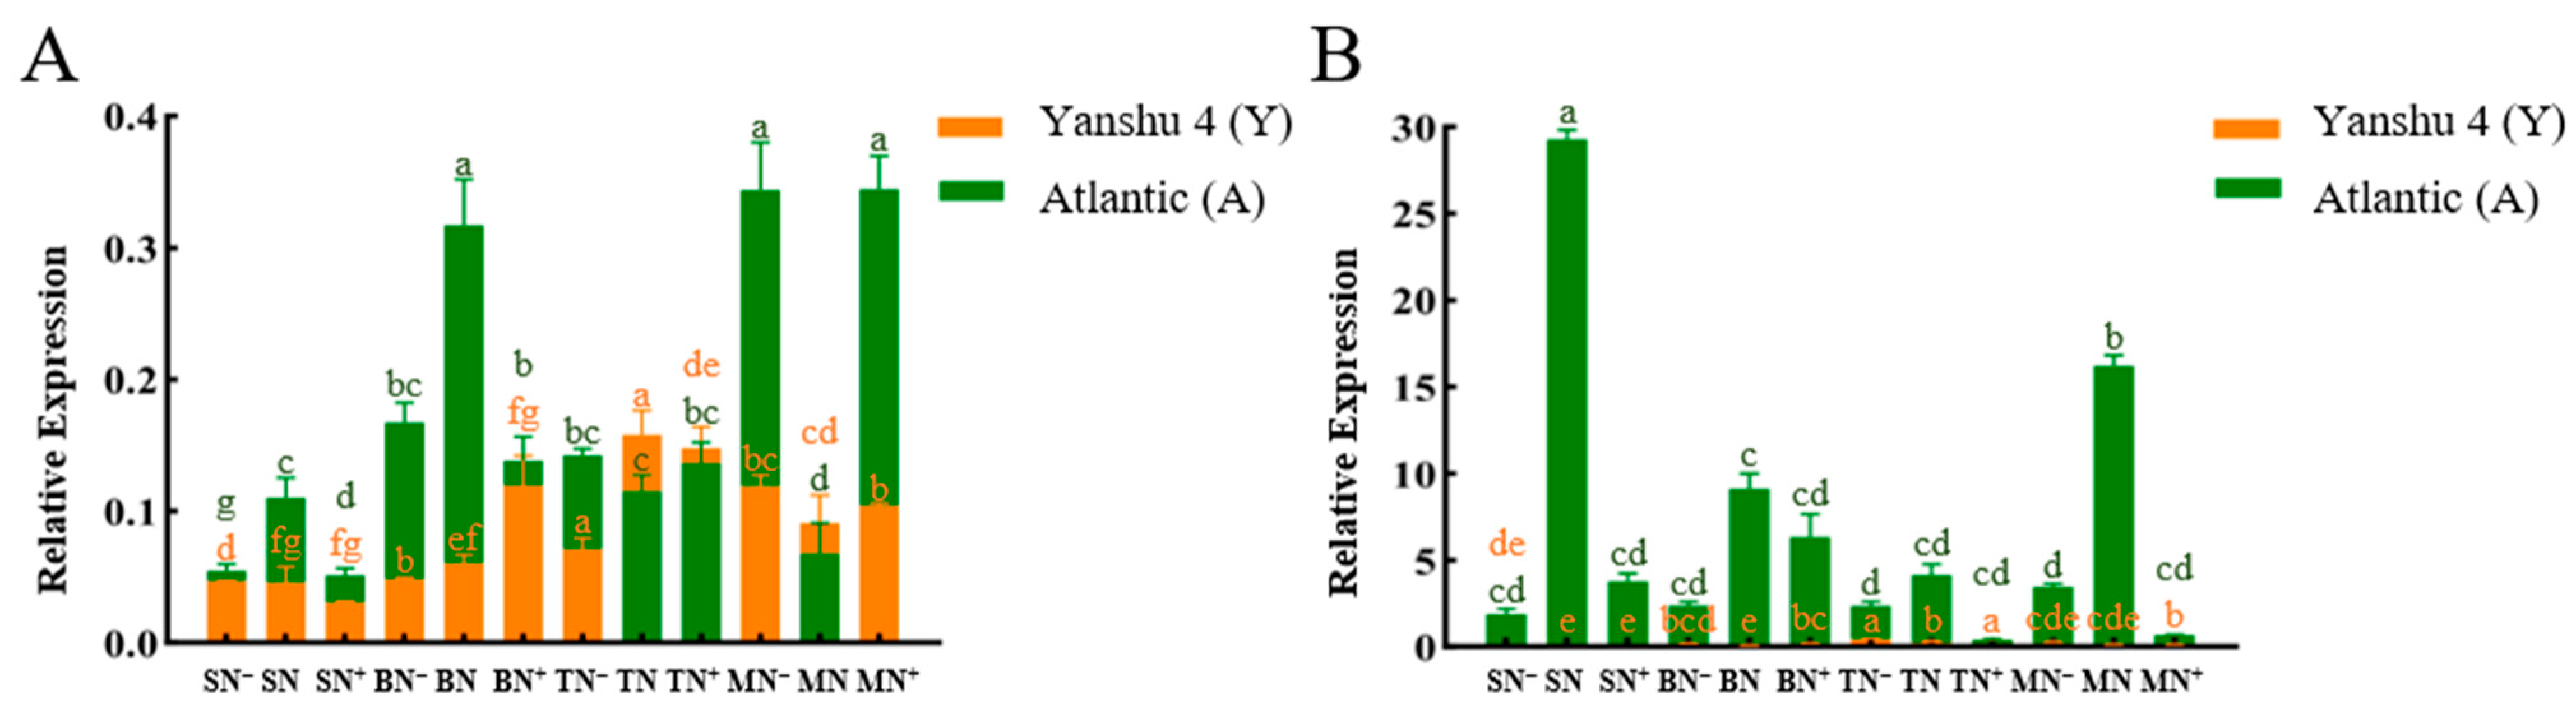
3.2.5. Analysis of Relative Expression of Glutamate Dehydrogenase Gene StGDH in Two Genotypes of Potato under Different N Supply Levels

StGDH is a key enzyme gene that catalyzes the deamination of glutamate to produce α-ketoglutarate and participates in the TCA cycle, thereby affecting N assimilation. The relative expression levels of StGDH in two different genotypes of potato under different N supply levels were analyzed. In leaves (Figure 10A), the expression level of StGDH of Y was higher than that of A, indicating that the gene was more expressed in the leaves of N-efficient cultivars. With the increase in N application rate, the expression level of StGDH in Y gradually decreased in the S and T stages, and the expression level in the T stage was relatively low, while in the B and M stages, it first increased and then decreased, and reached a peak under N treatment in the M stage. The expression level of A was relatively low with no significant difference in each stage, and reached the peak under N treatment in the S stage. In roots (Figure 10B), the expression of StGDH first increased and then decreased in Y in the S stage, and in A in the T and M stages, and the expression of StGDH in Y in the T stage, in A in the S and B stages, and vice versa. Meanwhile, Y in the T stage showed a downward trend, and Y and A reached their peaks under the N treatment in the B stage and the S stage, respectively. To sum up, it could be found that the peak was mostly reached under N treatment, and low N stress could promote the expression of StGDH.

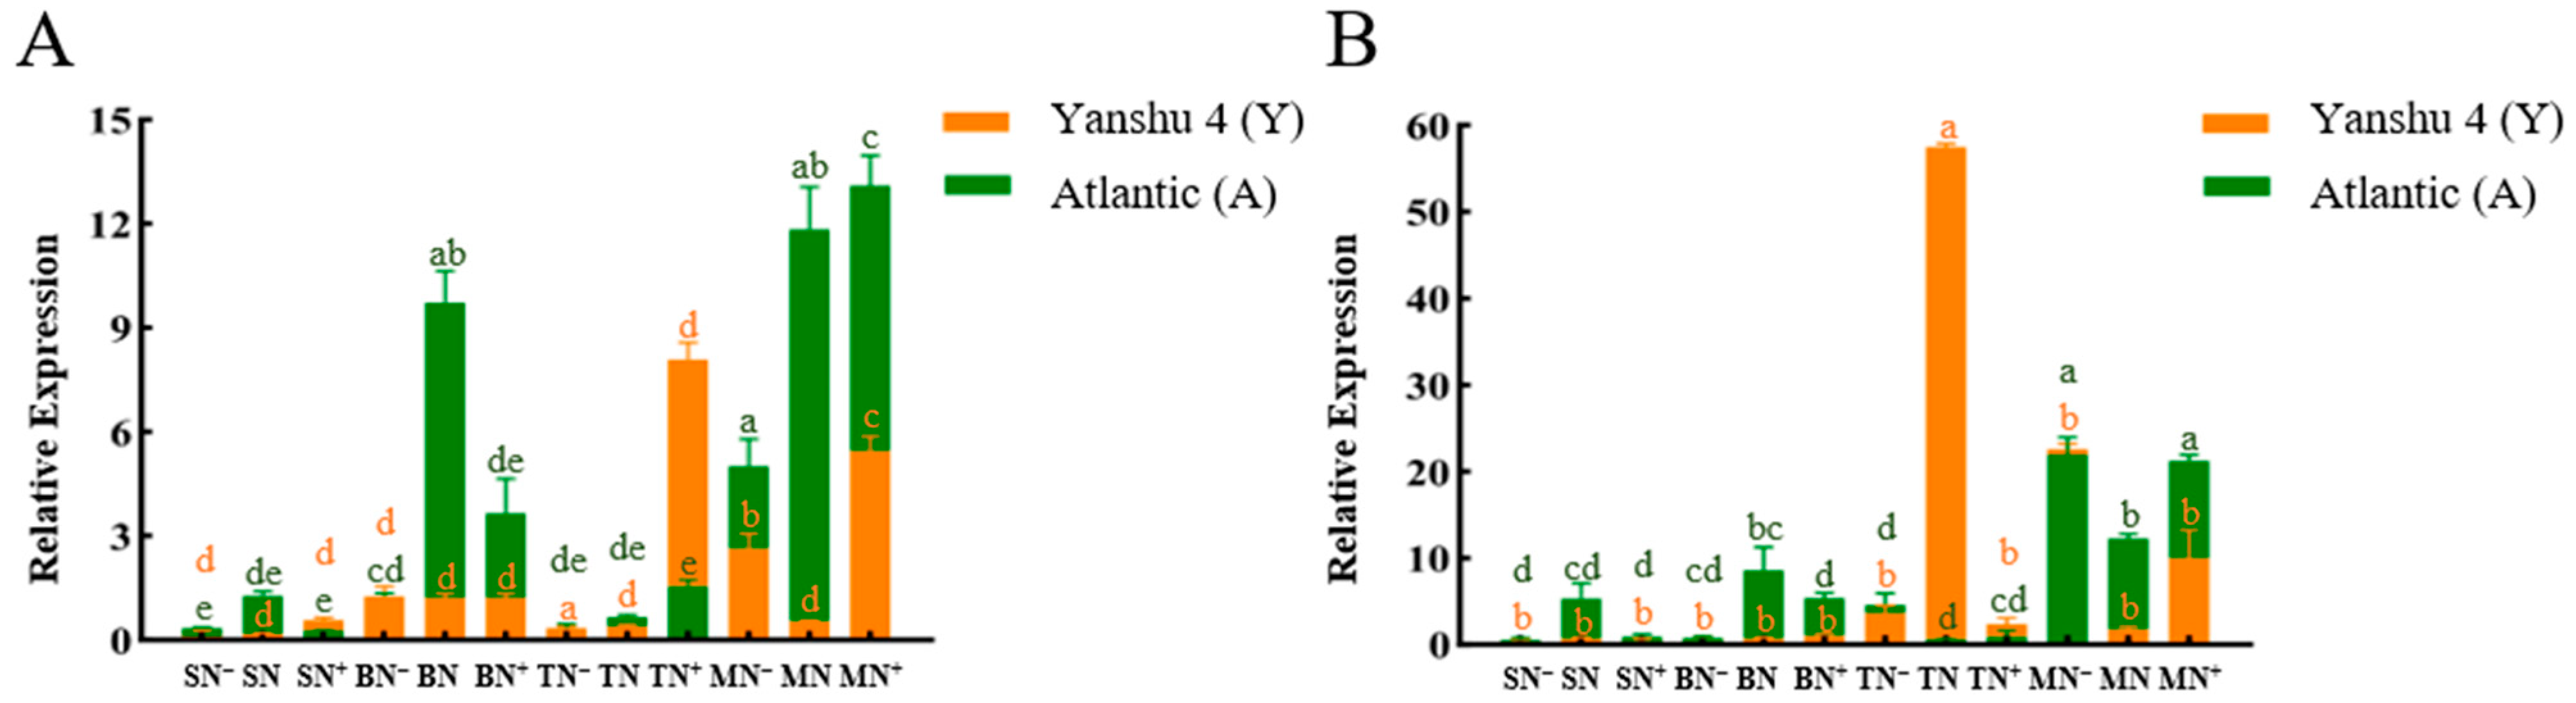
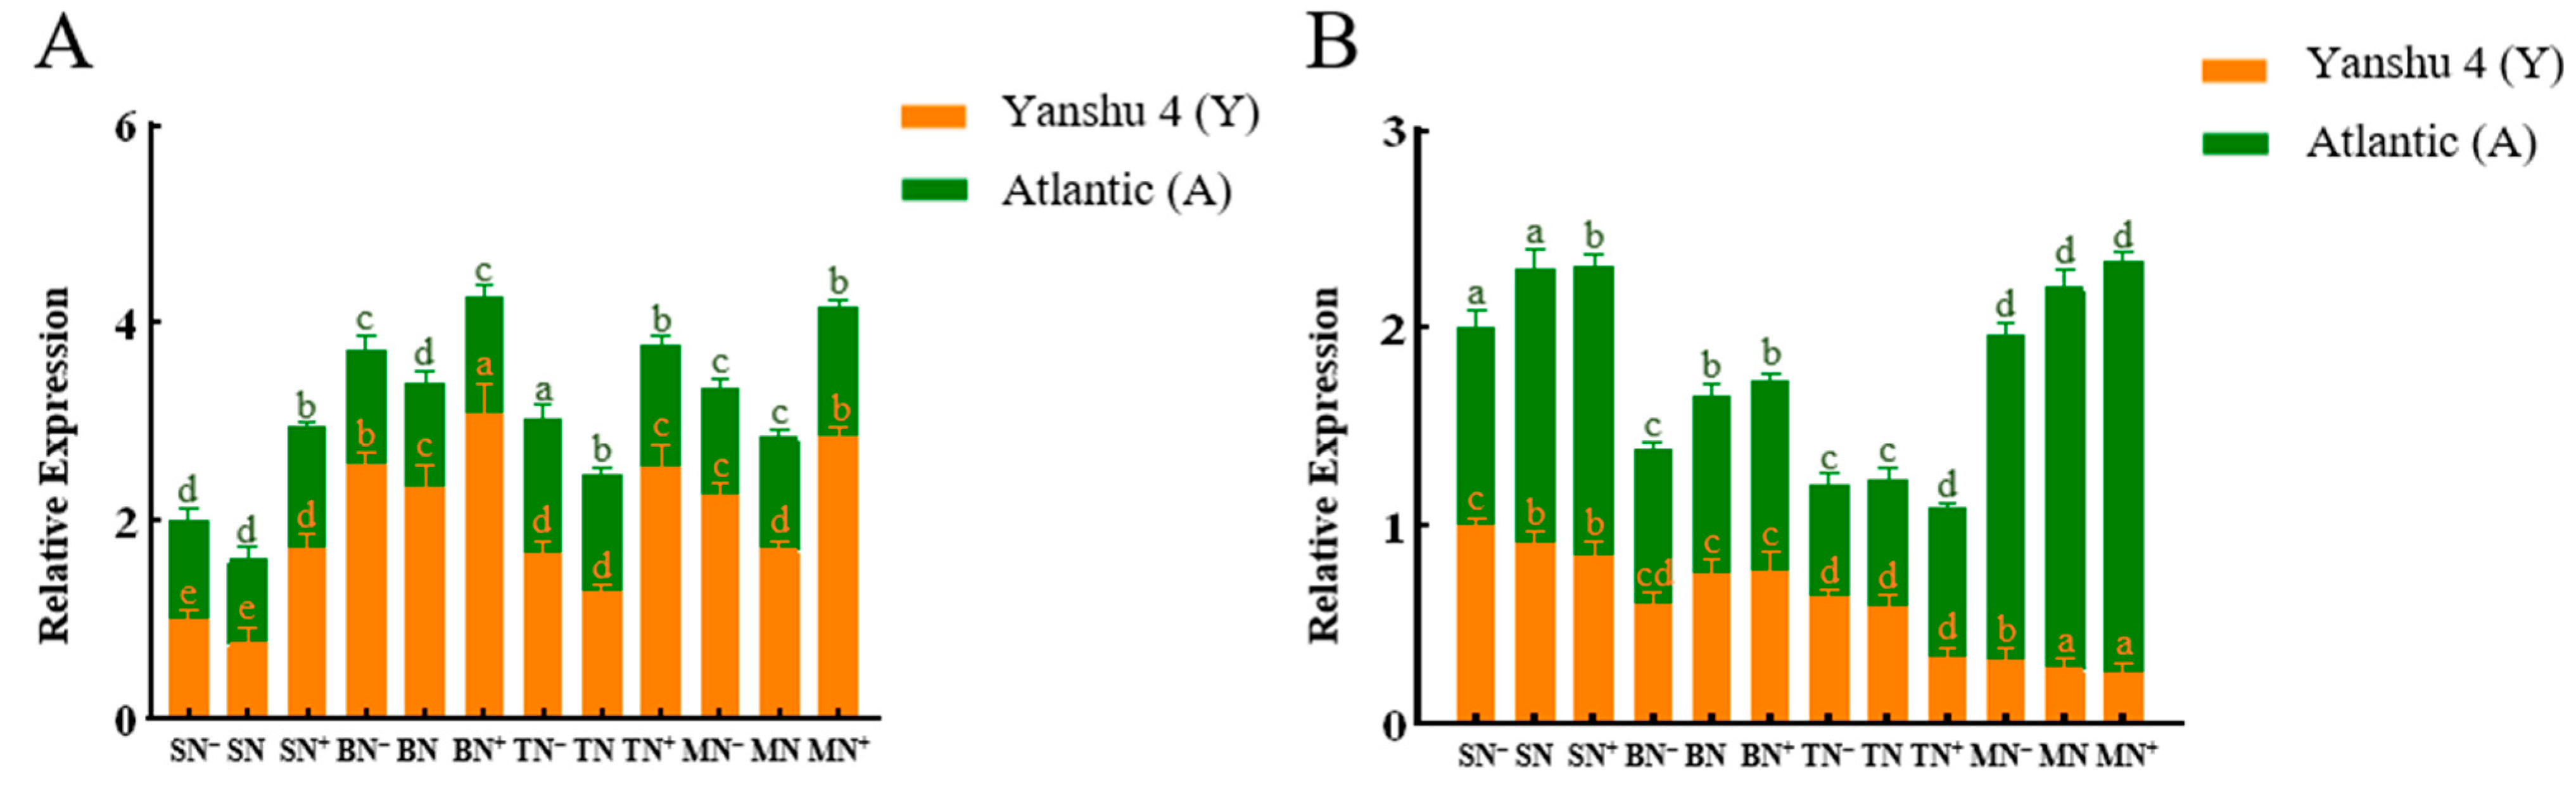
3.2.6. Relative Expression Analysis of Nitrate Transporter StNRTs in Two Genotypes of Potato under Different N Supply Levels

StNRTs are nitrate transporters that sense external N signals, participate in the absorption and transport of nitrate N, and promote plant growth. StNRTs include StNRT1.5, StNRT2.4, StNRT2.5, and StNRT2.7. The relative expression levels of StNRT1.5 in two different genotypes of potato under different N supply levels were analyzed. It was basically not expressed in Y leaves (Figure 11A), and the expression level in A was also lower. The increase in N application showed a trend of first increase and then decrease, and reached the peak under N treatment in the B stage, which also indicated that both high N and low N stresses outside affected the expression of this gene in leaves. In roots (Figure 11B), Y and A were relatively low in the S, B, and T stages, and most abundant in the M stage. A was highly expressed under N and N+ treatments, while Y was expressed in N and N+ treatments. It was significantly higher than other stages and treatments, both of which reached their peaks under N+ treatment.
The relative expression levels of StNRT2.4, StNRT2.5, and StNRT2.7 in roots and leaves were relatively high in the S and B stages, which also indicated that the two different genotypes of potato were both in the first two stages; the transport demand of the element was high. With the increase in N application, the expression of StNRT2.4 in leaves (Figure 12A) in Y and A as a whole showed a trend of the highest or lowest expression under N treatment at each stage, compared with N and N+ treatments. The expression trend of N treatment was the same; Y reached the peak value in the B stage and A in the S stage under N treatment. In roots (Figure 12B), Y showed an upward trend in the S stage and reached the peak under the N+ treatment, and showed a trend of first increasing and then decreasing in the B stage, while the opposite was true in the M stage, and the expression level was relatively lowest in the T stage. The expression level of A was different from Y in the S stage. Y showed a downward trend and reached the peak under N treatment, while in the B, T, and M stages, the expression level was on the contrary, and the expression level in the B stage was lower.
With the increase in N application rate, the expression level of StNRT2.5 in leaves (Figure 13A) of both Y and A in the S stage showed a trend of first decreasing and then increasing, in the B stage Y showed a decreasing trend, while A showed first an increase and then a decrease. The expression levels in other stages were low and insignificant. Y and A reached their peaks under N and N treatments in the B stage, respectively. In roots (Figure 13B), the overall expression level of A was higher than that of Y, and both showed a trend of increasing first and then decreasing in the S stage and reached the peak under the N treatment. In addition, the expression level of A in the B stage under the N treatment was also relatively high. Additionally, the expression levels of the two cultivars in the T stage were significantly lower than those in the other stages.
With the increase in N application rate, the expression level of StNRT2.7 in leaves (Figure 14A) of Y showed a trend of first decreasing and then increasing in the S and M stages, conversely in the B stage and reached the peak under the N treatment, and in the T stage it showed a downward trend. A showed a trend of rising first and then falling in the S, B, and M stages, and conversely in the T stage, and reached the peak under the N treatment in the S stage. In roots (Figure 14B), the expression of Y was the highest in the S stage, and reached the peak under the N treatment. It gradually decreased with the progress of the growth stage, and continued to show a lower trend in the later stage. The expression level of A was high for the duration of the the S and B stages and the M stage under the N+ treatment, and reached the peak under the N+ treatment in the S stage.
From the overall analysis, it was found that the relative expression levels of the four genes in roots were higher than those in leaves, which might be due to the fact that roots could first and directly perceive external N signals, thereby regulating N absorption and transport.

3.3. Analysis of Key Enzyme Activity of N Metabolism in Leaves of Two Genotypes of Potato under Different N Supply Levels

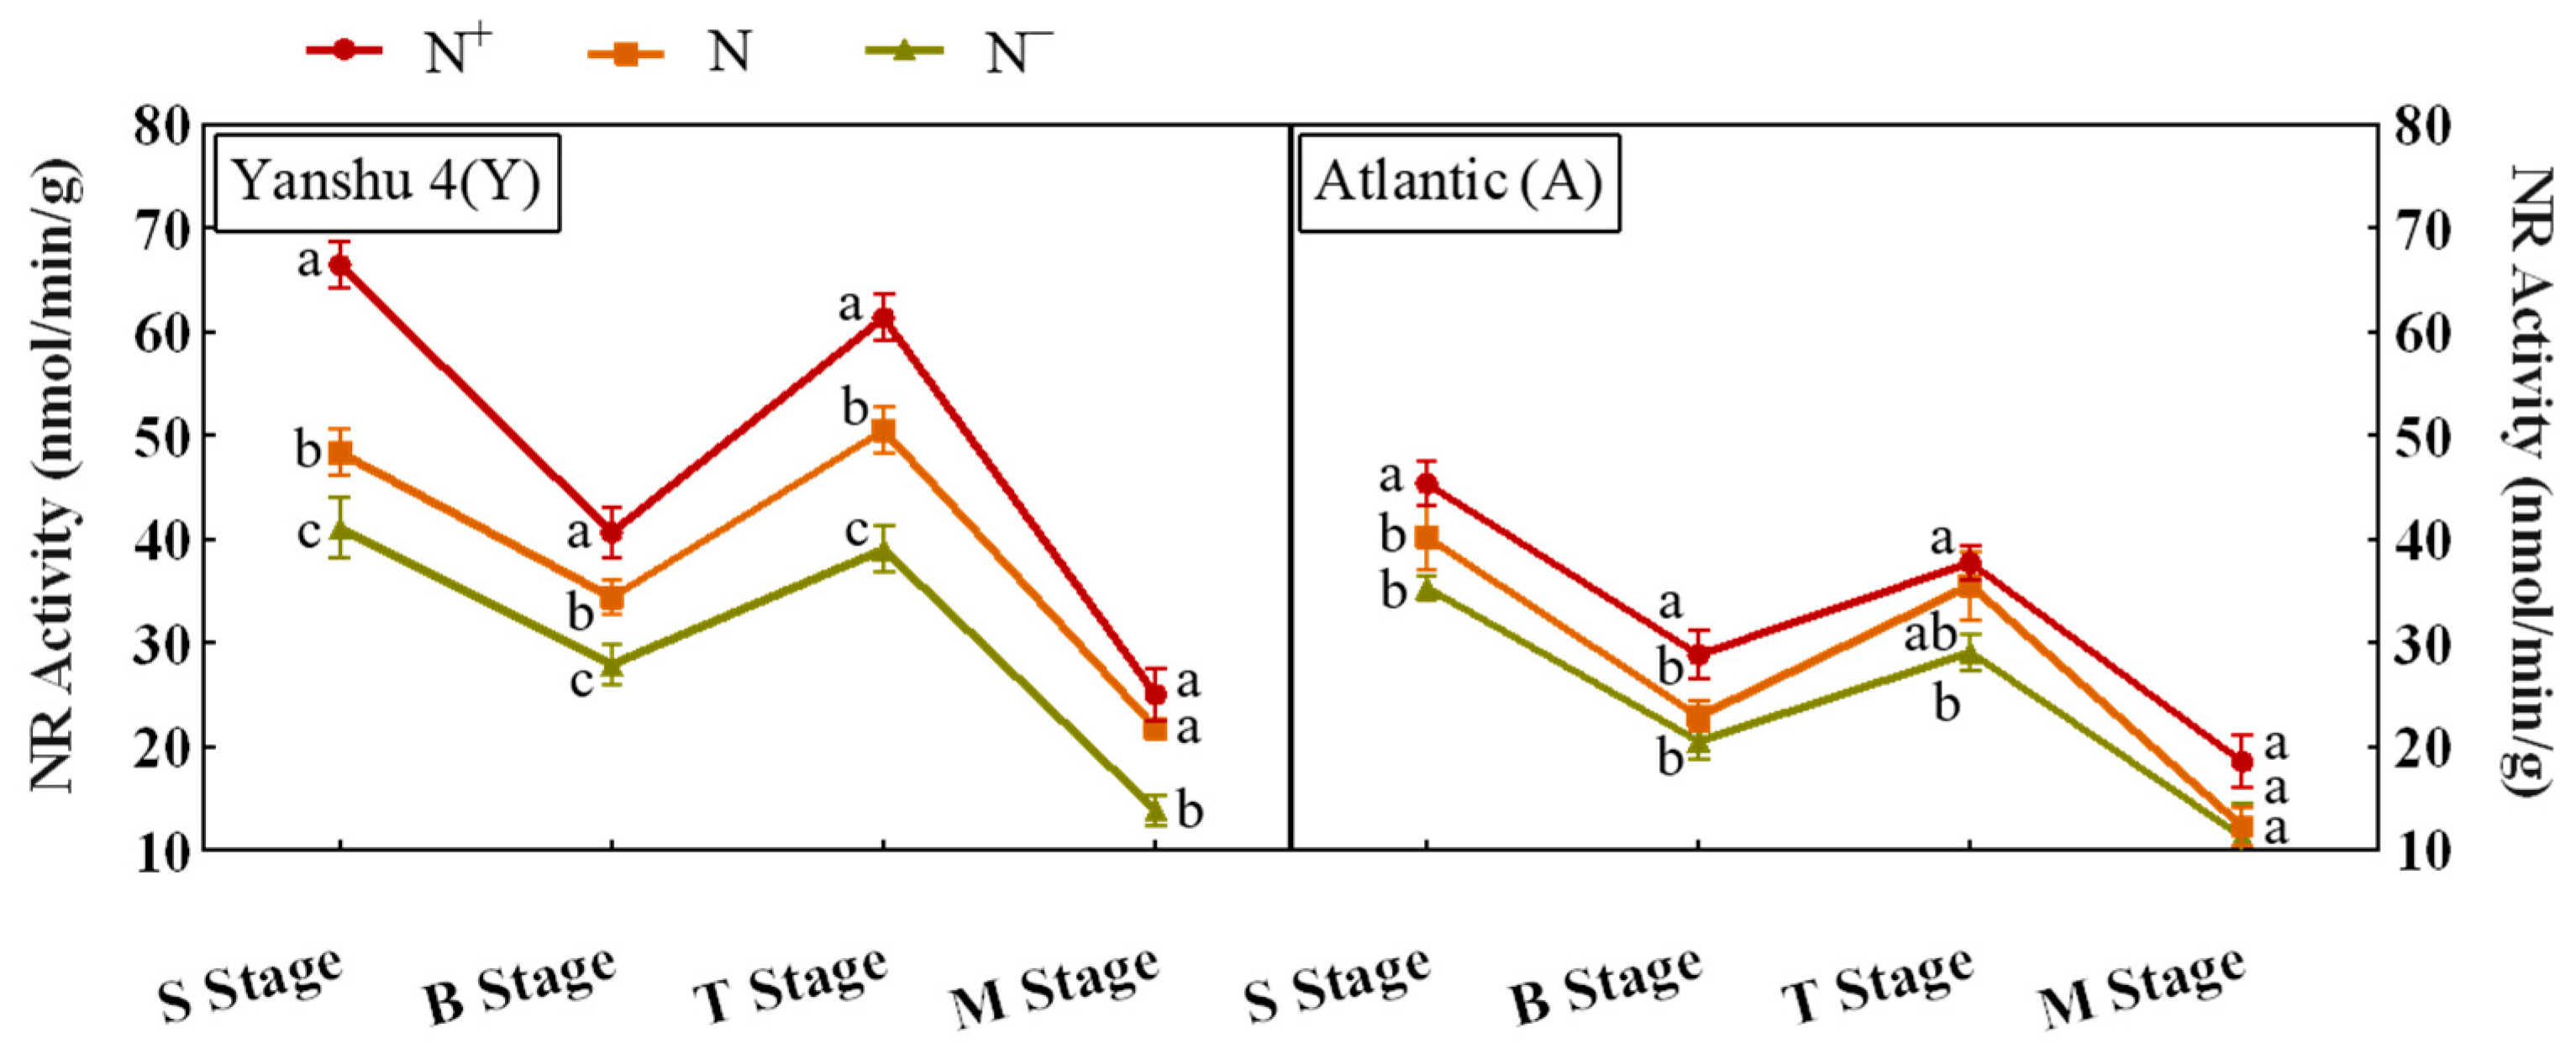
3.3.1. Analysis of Nitrate Reductase (NR) Activity in Leaves of Two Genotypes of Potato under Different N Supply Levels

Nitrate reductase (NR) is the rate-limiting enzyme in the process of nitrate N assimilation; it is able to reduce nitrate (NO3) absorbed from soil to nitrite (NO2). The analysis of NR activity in the leaves of two different genotypes of potato under different N supply levels showed that it was positively correlated with N use efficiency (Figure 15). The NR activity of Y was always significantly higher than that of A throughout the growth stage, and the NR activity of Y was 1.48, 1.39, and 1.26 times that of A under N+, N, and N treatments, respectively. In addition, Y and A both showed a trend of first decreasing, then increasing and then decreasing, reaching their peaks in the S and T stages. The S stage was the beginning of the morphological establishment of potato plants, and the T stage entered the stage of rapid tuber growth. Both stages required a lot of N. Nutrients are assimilated to provide nutrition. In addition, the NR activity of Y and A in each stage were N+ treatment > N treatment > N treatment. The NR activity of Y in the S and T stages under N+ treatment increased by 38.3% and 36.5% compared with N treatment. The NR activity of in the S and T stages under N+ treatment increased by 19.6% and 23.2% compared with the N treatment, indicating that with the increase in the external N concentration, the NR activity in the potato leaves was also higher.

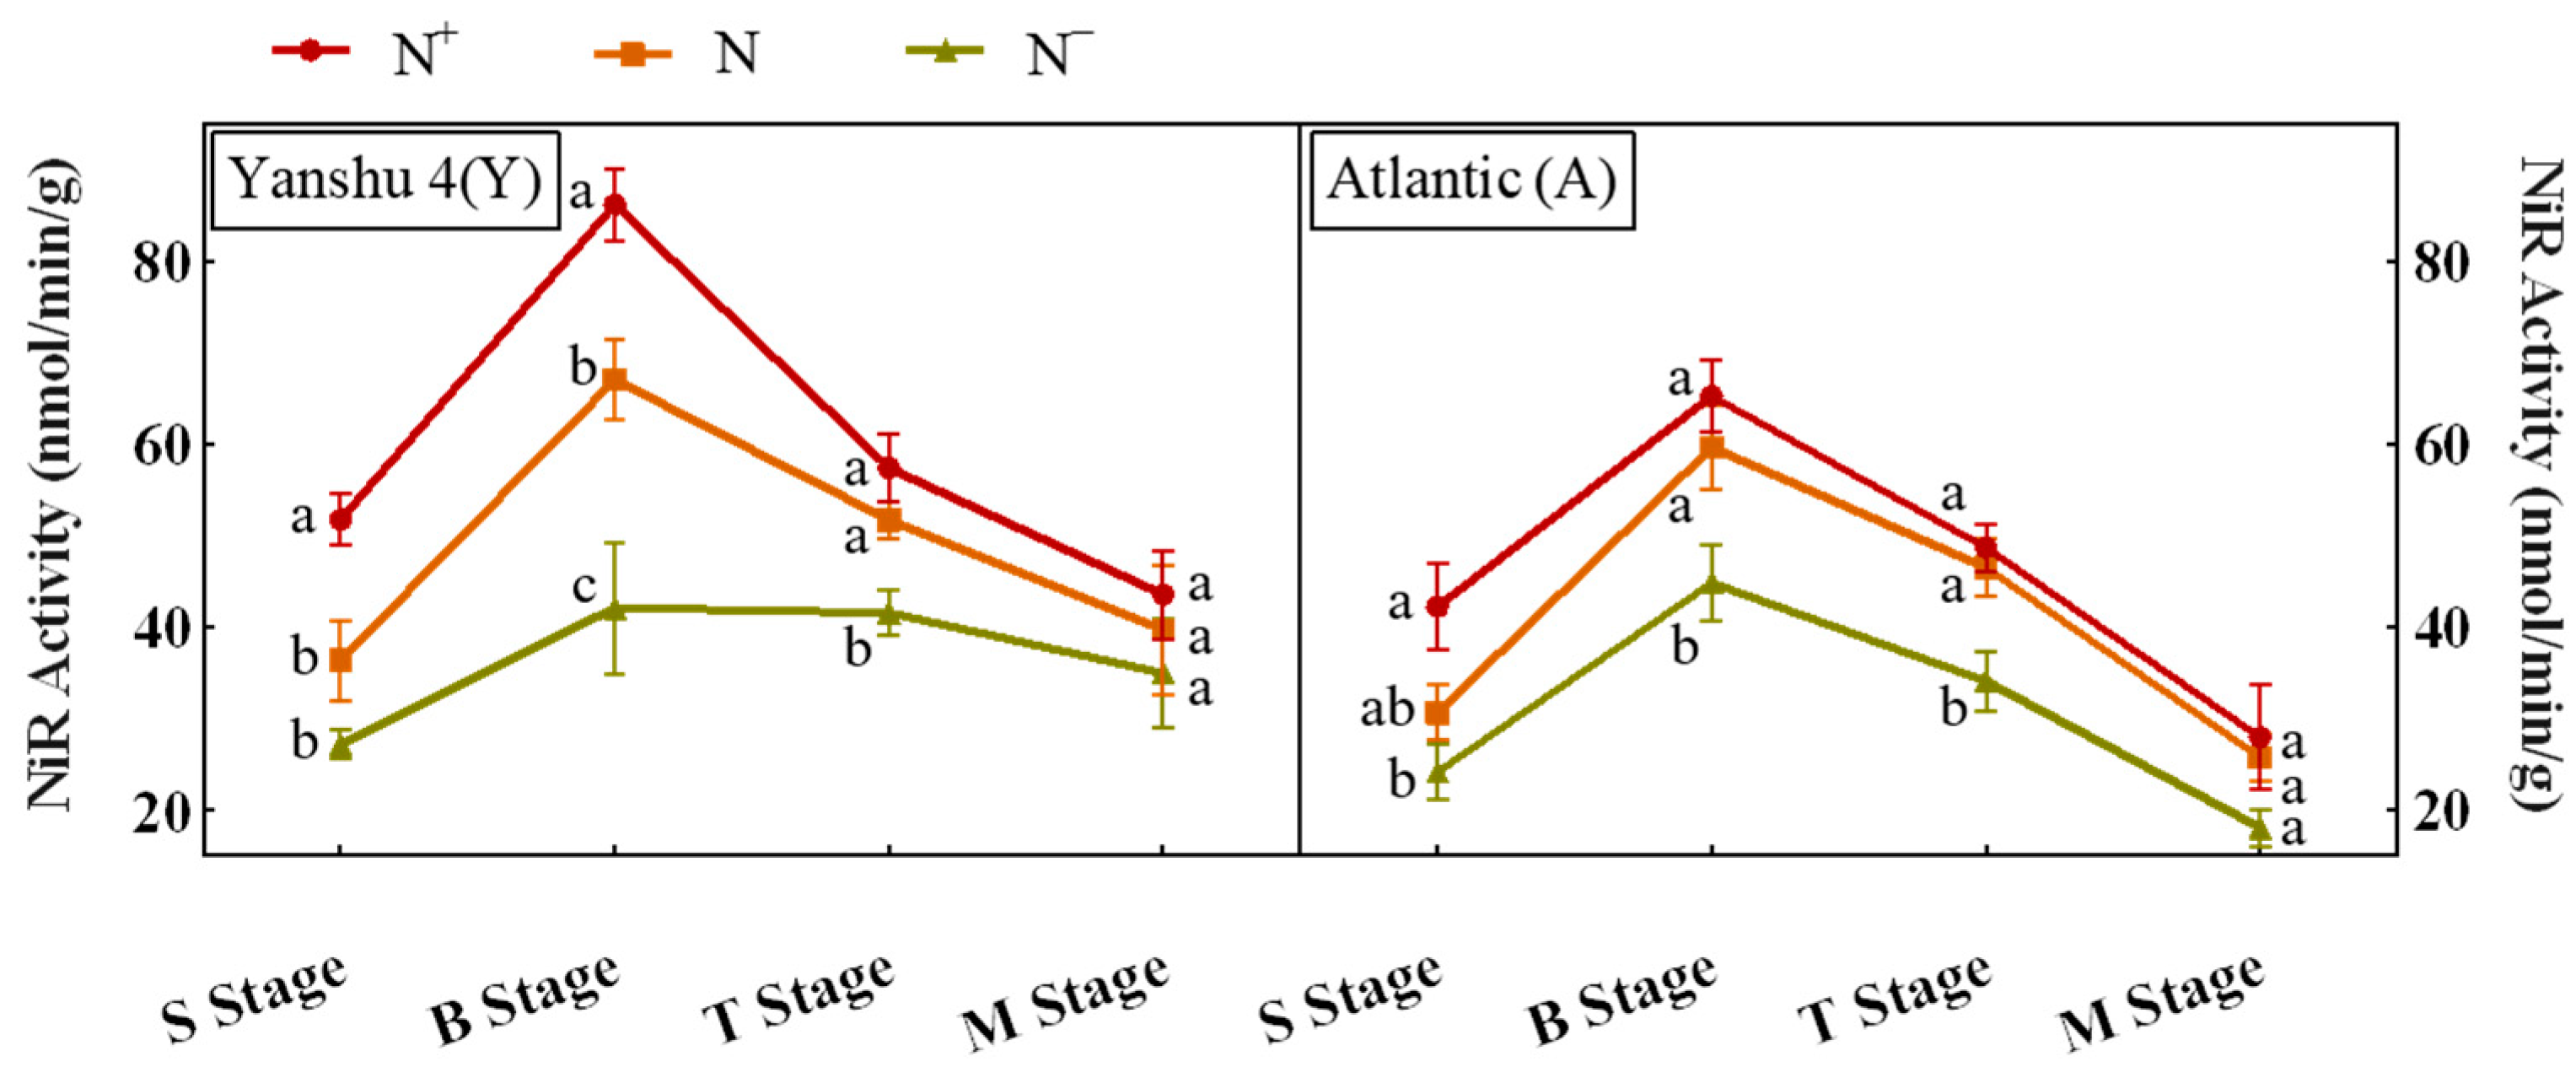
3.3.2. Analysis of Nitrite Reductase (NiR) Activity in Leaves of Two Genotypes of Potato under Different N Supply Levels

Nitrite reductase (NiR) can reduce nitrite (NO2) produced by nitrate reductase (NR), to form NH4+, and the NiR activity in the leaves of two different genotypes of potato under different N supply levels was analyzed and found (Figure 16). All showed a trend of rising first and then falling, reaching a peak in the B stage, and its activity in Y was higher than that in A. In addition, the NiR activity of Y and A in each stage were N+ treatment > N treatment > N treatment, which was consistent with the trend of NR activity. The NiR activity of Y under N+ treatment in the B stage was 22.3% and 51.6% higher than those under N and N treatments, respectively. In addition, A under N+ treatment was 12.5% and 17.6% higher than those under N and N treatments, respectively. In other stages, the increase was between 23.1% and 48.3%, while A was between 19.8% and 37%. The increase in Y was higher than that in A, indicating that the NiR activity in Y was more sensitive to changes in N concentration.

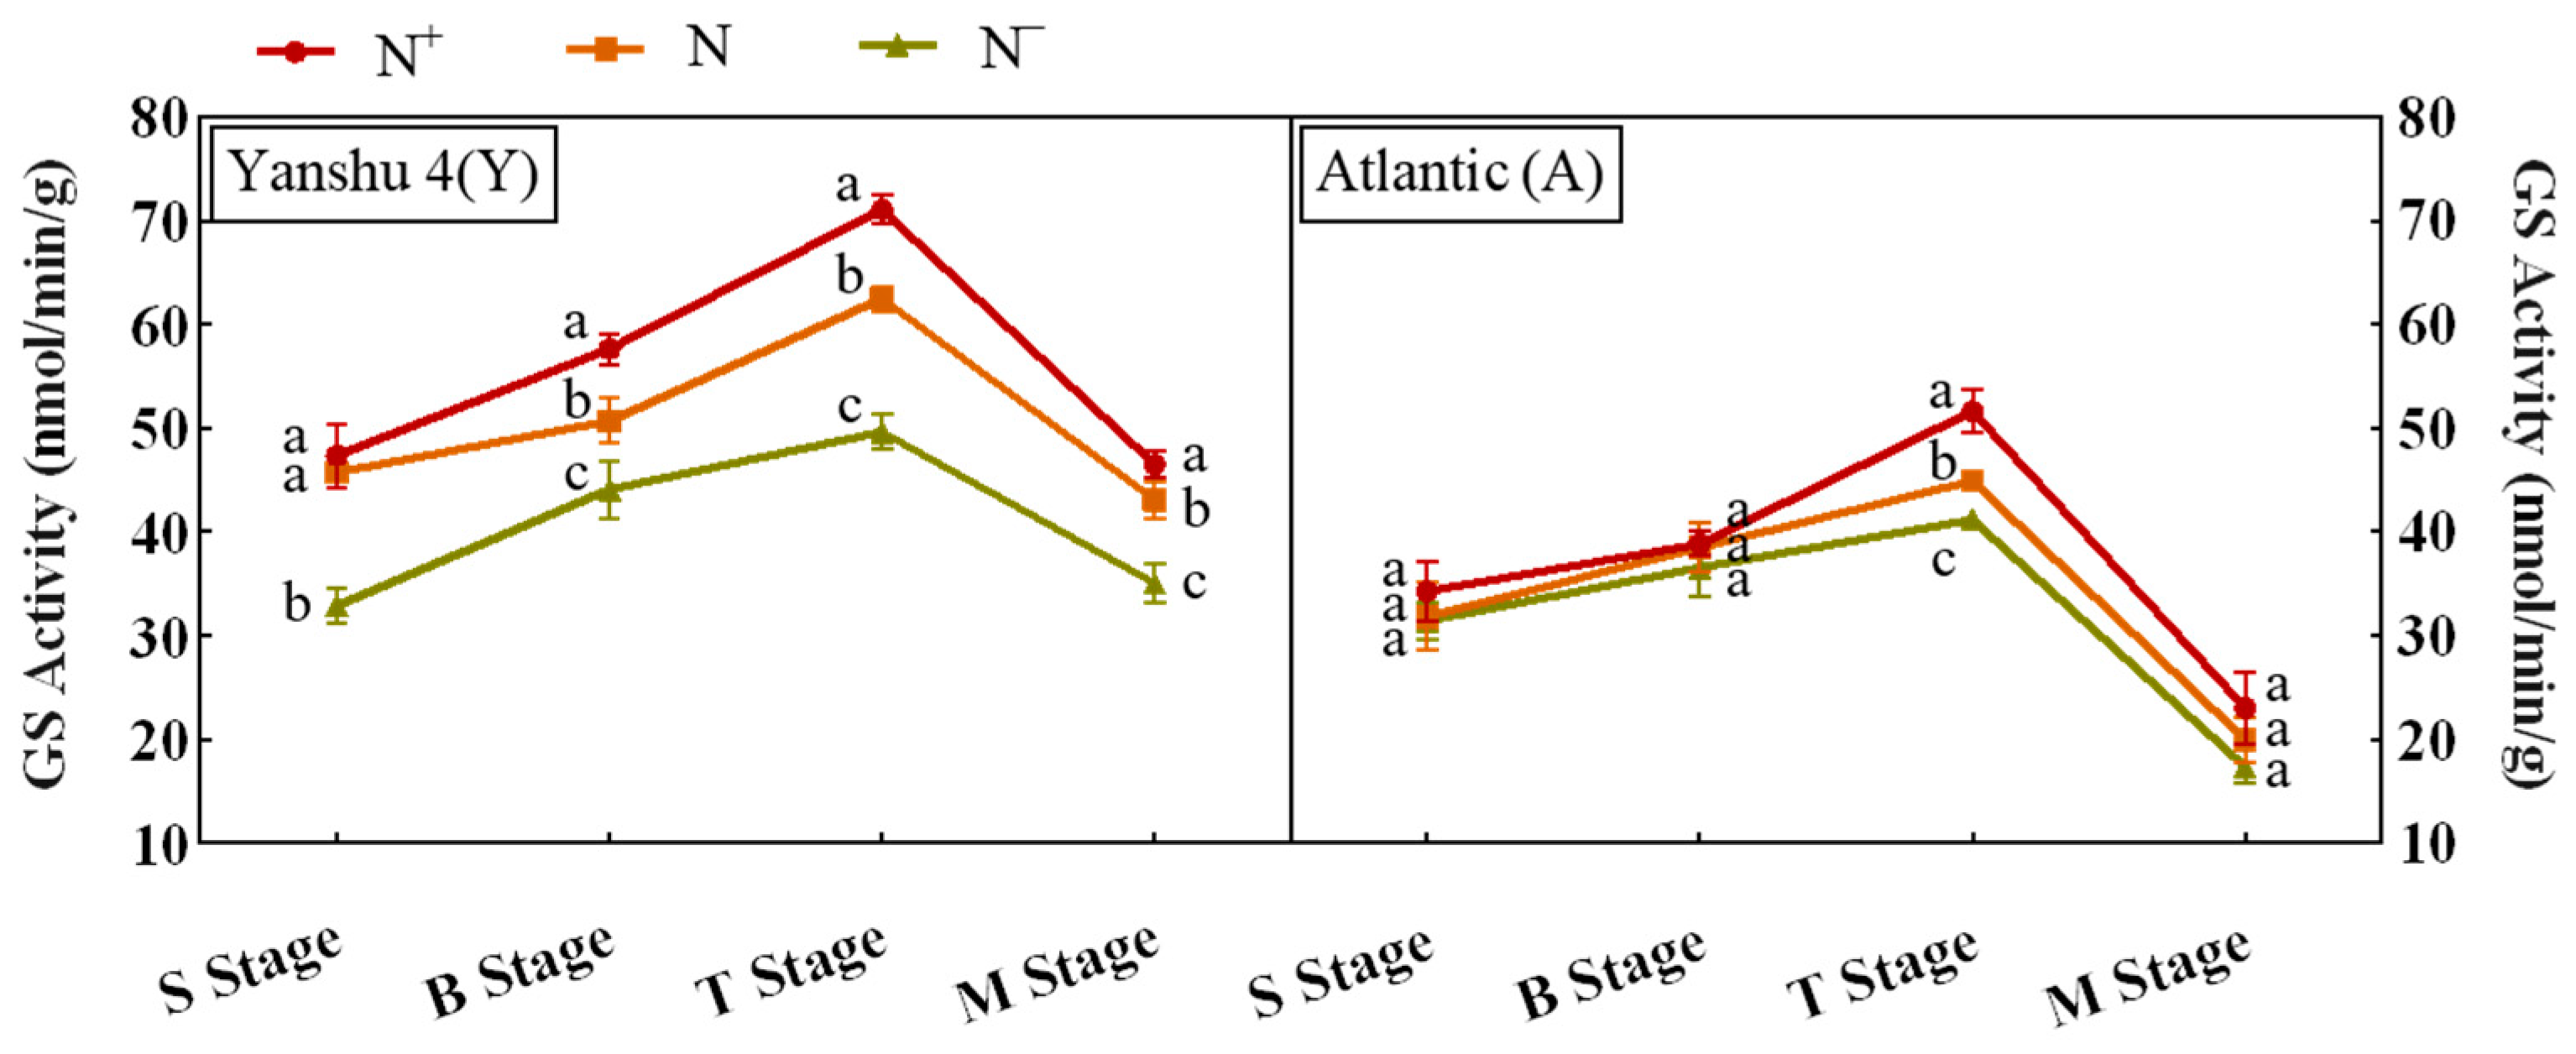
3.3.3. Analysis of Glutamine Synthase (GS) Activity in Leaves of Two Genotypes of Potato under Different N Supply Levels

Glutamine synthase (GS) catalyzes the synthesis of glutamine from glutamate and ammonium ions; it affects plant N absorption and utilization. The higher the GS activity, the stronger the N absorption and utilization ability. The analysis of GS activity in leaves of two different genotypes of potato under different N supply levels showed that (Figure 17) Y and A showed a trend of first increase and then decrease throughout the growth stage, and reached the peak in the T stage, and in Y its activity was higher than that of A, indicating that the N high-efficiency cultivar had a stronger ability to transform and absorb N. In addition, the GS activity of Y and A in each stage were N+ treatment > N treatment > N treatment. The GS activity of Y in the T stage under N+, N, and N treatment increased by 34.4%, 27.3%, 32.8% compared with the B stage. The GS activity of A was increased by 28.6%, 26.8%, and 21.6% under the N+, N, and N treatments in the T stage compared with the B stage. However, in the M stage, the GS activity was significantly decreased; the decrease of Y was between 28.8% and 33.3%, and the decrease of A was between 47.6% and 57.8%.

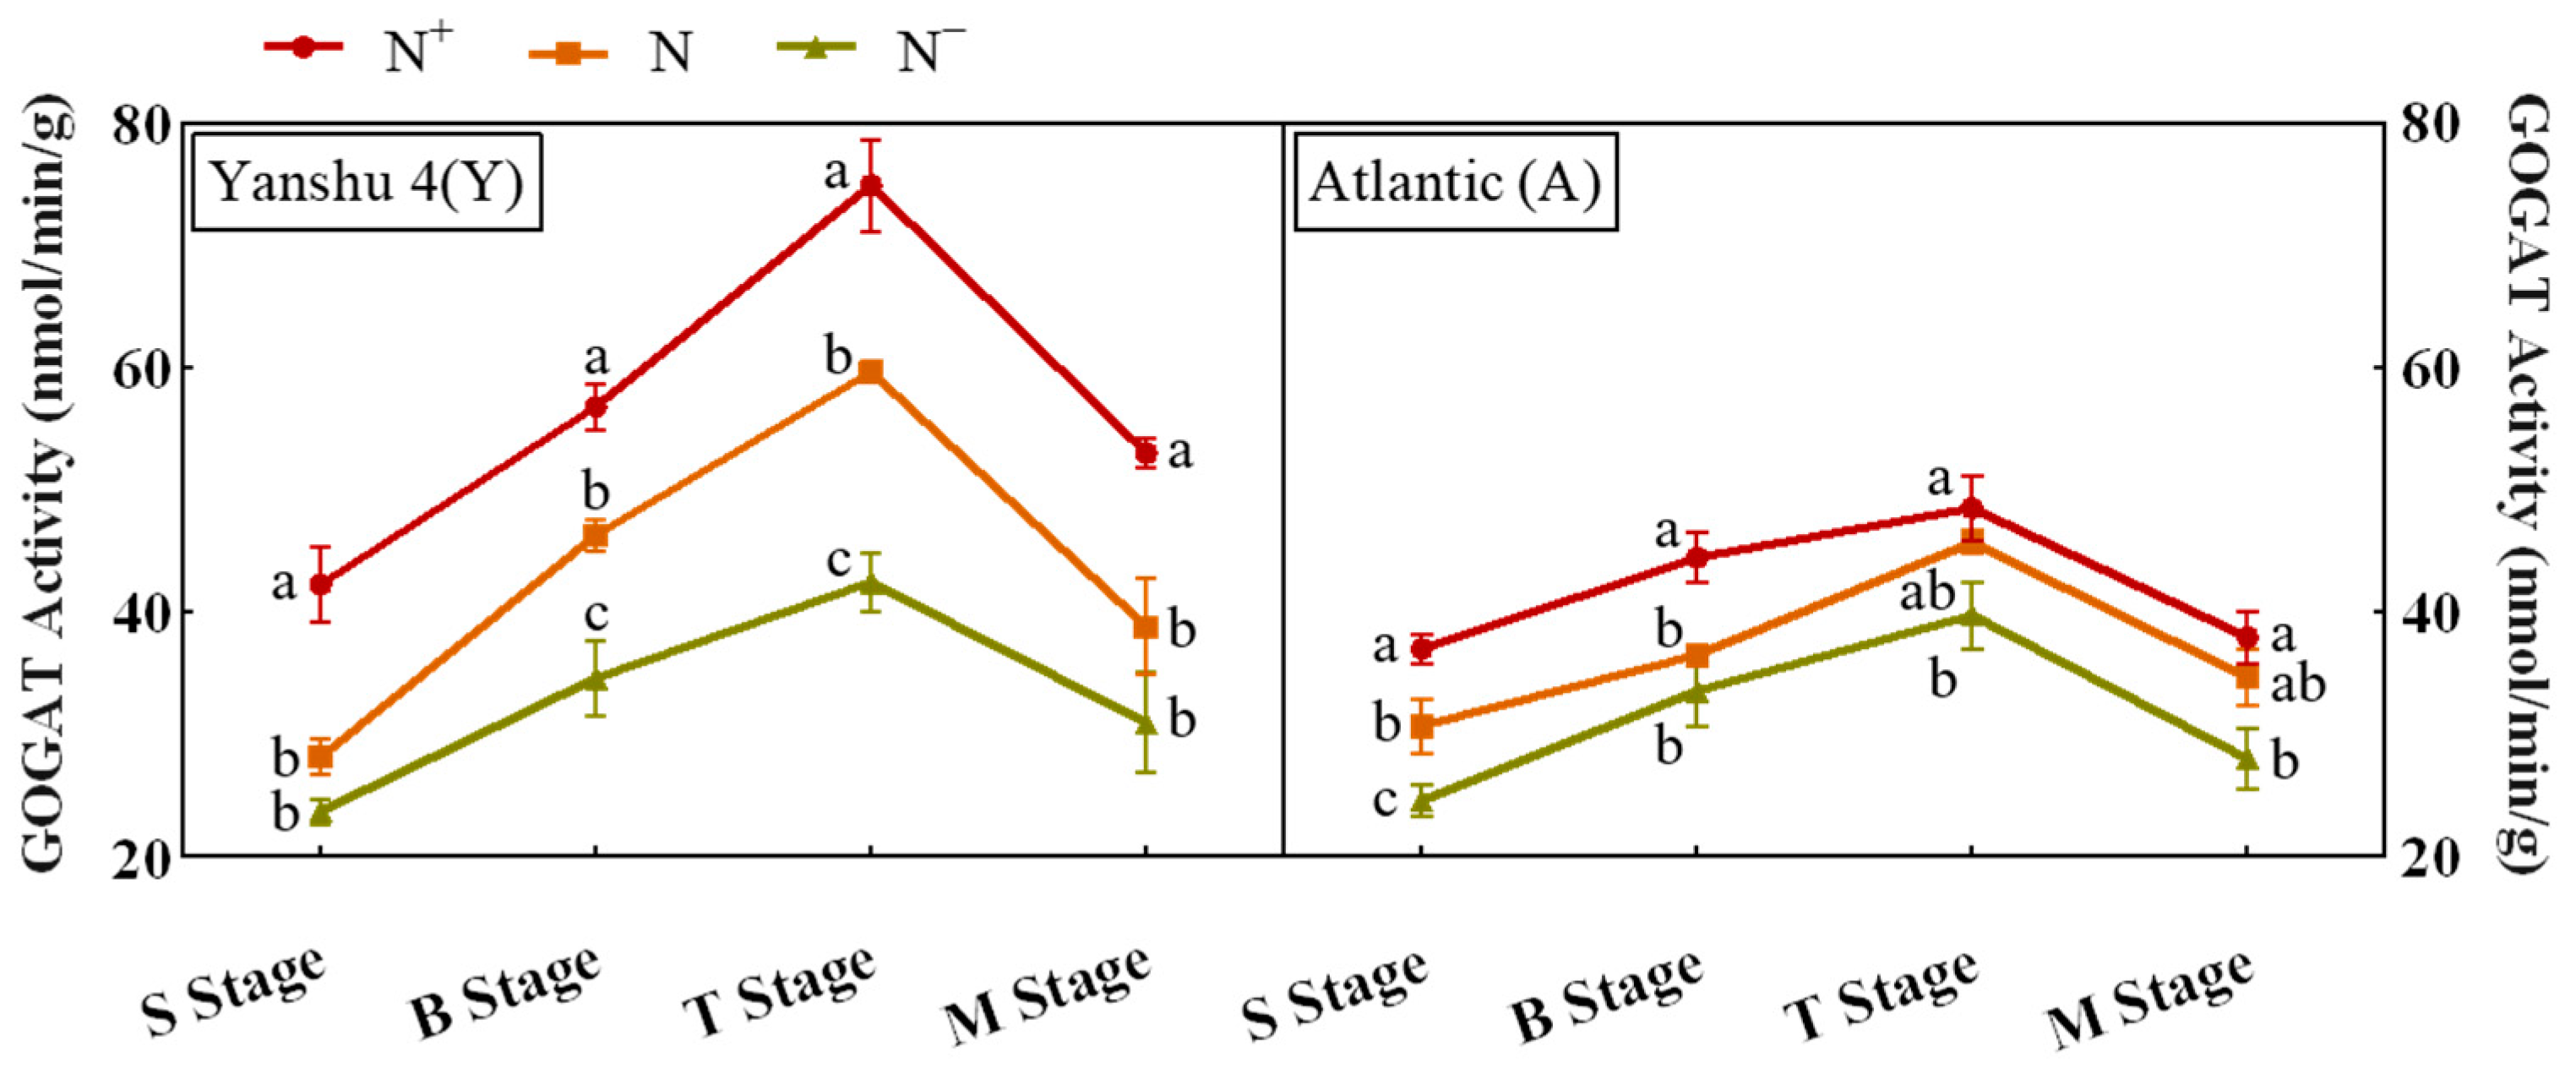
3.3.4. Activity Analysis of Glutamate Synthase (GOGAT) in Leaves of Two Genotypes of Potato under Different N Supply Levels

Glutamate synthase (GOGAT) catalyzes the formation of glutamate from glutamine and α-ketoglutarate; it can convert inorganic N absorbed from the outside into organic N, which is then absorbed and utilized by plants. The analysis of GOGAT activity in leaves of two different genotypes of potato under different N supply levels showed that (Figure 18) Y and A had a trend of first increase and then decrease throughout the growth stage, and reached the peak in the T stage, which entered into the tuber formation stage. The growth was relatively vigorous, and a large amount of nutrients were required, and the activity of Y was significantly higher than that of A. In addition, the GOGAT activity of Y and A in each stage was N+ treatment > N treatment > N treatment, which was consistent with the trend in GS activity. The GOGAT activity of Y in the T stage under N+ treatment was 1.25 and 1.76 times more than under N and N treatment, respectively. A under the N+ treatment was 1.05 and 1.22 times more than under the N and N treatments, respectively, which indicated that the increase in the GOGAT activity of the N-efficient cultivar with the increase in N application rate was larger than that of the N-inefficient cultivar, and the conversion efficiency of inorganic nitrides to organic nitrides was high.

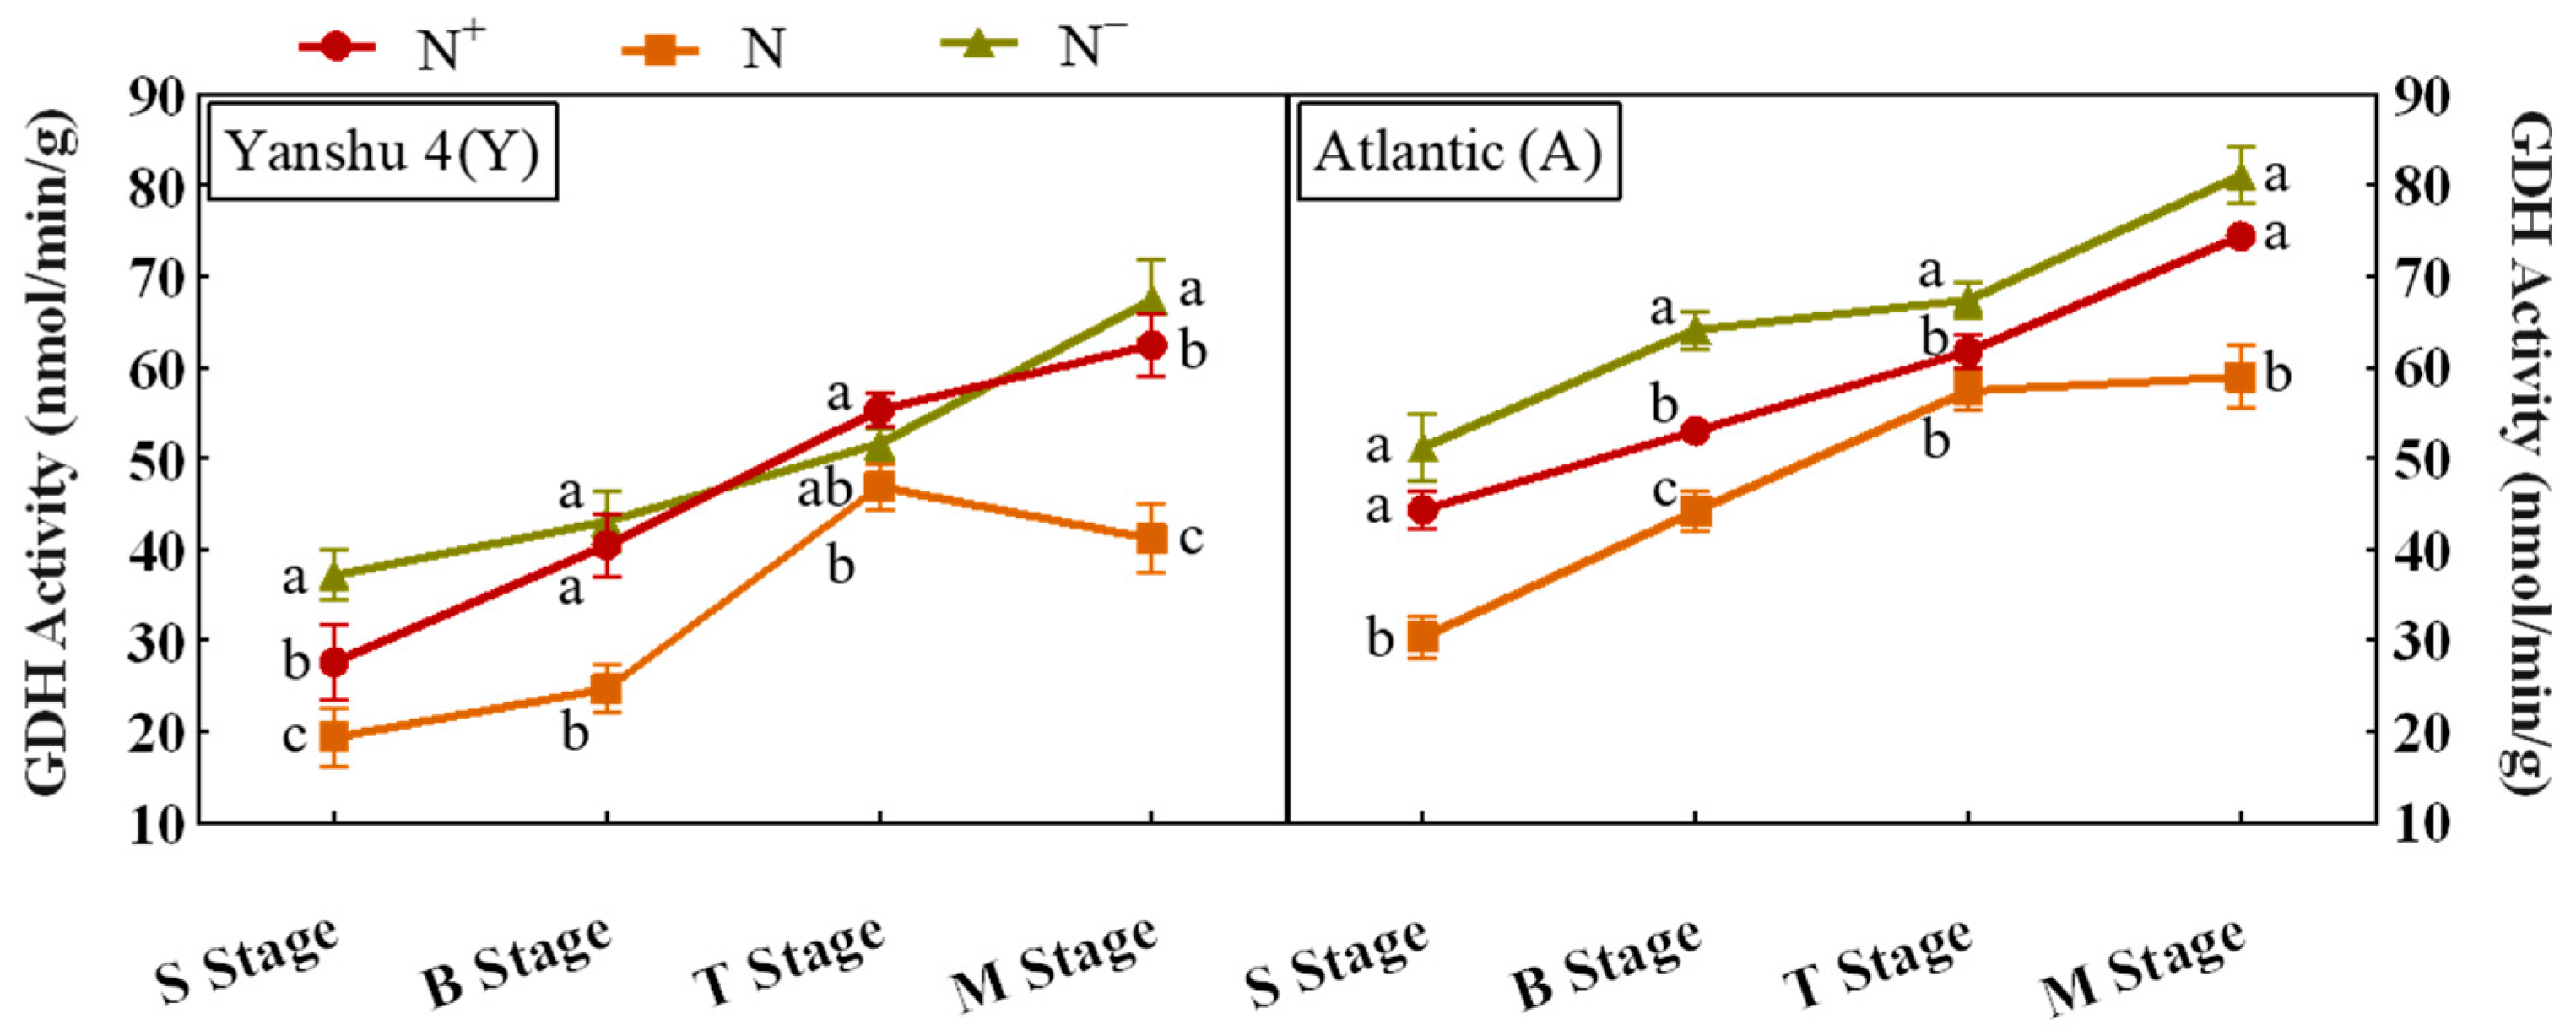
3.3.5. Analysis of Glutamate Dehydrogenase (GDH) Activity in Leaves of Two Genotypes of Potato under Different N Supply Levels

Glutamate dehydrogenase (GDH) catalyzes the reductive fixation of ammonia to α-ketoglutarate to form glutamate. The pathway of GDH is an auxiliary branch pathway of the GS/GOGAT cycle, which can assimilate the excessive accumulation of NH4+ in cells under stress. The analysis of GDH activity in leaves of two different genotypes of potato under different N supply levels showed that (Figure 19) Y and A showed a continuous upward trend throughout the growth stage, and reached the highest peak in the M stage, which was different from the other four enzyme activity. It was seen that the activity of A was always higher than that of Y in each stage. In addition, the GDH activity of Y and A under the N+ and N treatments in each stage was higher than that under the N treatment. The activity of Y under the N treatment in the M stage was 34.13% and 42.72% lower than that under the N+ and N treatments, respectively. When A under the N treatment was compared with the N+ and N treatments, the reductions were 20.82% and 27.16%, respectively, which indicated that the high-N or low-N stress environment could promote the increase in GDH activity in leaves of two genotypes of potato.

4. Discussion

The level of N nutrition in potato regulates the gene expression of key enzymes in the N metabolism pathway, which is manifested as changes in the activity of key enzymes in N metabolism, and finally realizes the regulation of N absorption and utilization. The relative expression levels of key enzyme genes in the N metabolism pathway were different under different N supply levels. Gelli showed that the expression level of sorghum NRT2.5 was higher under low N treatment [28]. Zhang found that the expression level of GOGAT in sugar beet leaves increased with the increase in N application rate [29]. In this study, the expression trends of StNR and StNiR in the same genotype of potato were basically the same. Excessive N application could promote the expression of StNR and StNiR, indicating that excess N accelerated the assimilation of nitrate to nitrite, which was converted into ammonia in chloroplasts. We also found that low N could promote the expression of StGOGATs, thereby promoting the GS/GOGAT cycle, converting ammonium N into organic N and being absorbed and utilized by the potato. It indicated that the expression abundance of key enzyme genes in the N metabolism pathway was significantly affected by N concentration. In addition, one of the main reasons for the different N efficiency of different genotypes of potato was the significant difference in the expression of key enzymes of N metabolism. This study showed that the relative expression levels of StFd-GOGAT, StNiR, and StGS2 in the N-inefficient cultivar Atlantic were higher than those in the N-efficient cultivar Yanshu 4 under the same N supply level, while the opposite was true for StGDH in leaves.
There were differences in the expression organs of key enzyme genes in the N metabolism pathway. Previous studies have shown that NRT2.4 had the highest expression in tobacco roots [30]. Lezhneval found that NRT2.5 expression in roots was higher than in shoots [31]. Orsel found that Arabidopsis NRT2.5 was mainly expressed in roots [32]. Yu found that rapeseed GOGAT had the highest expression in leaves, embryos and other plant organs [33]. There are two isoenzyme genes in higher plants; GS1 is cytosolic GS encoded by 3 to 5 nuclear genes, while GS2 is plastid GS encoded by only one gene. In potato, we found 4 StGSs and 1 StGS2 jointly regulate GS activity. Analysis of the significant differences in their expression in different organs of potato showed that StGS1-2 and StGS1-4 were basically not expressed in the leaves of the N-inefficient cultivar Atlantic, but were normally expressed in the roots. StGS1-2, StGS1-4, and StGS2 were basically not expressed in the roots of the N-efficient cultivar Yanshu 4, and vice versa in the leaves. In addition, StNRT1.5 in the NRT protein family was also basically not expressed in the leaves of Yanshu 4. Therefore, the localization of each gene needs to be further explored.
There were differences in the activity of key enzymes of N metabolism under different N supply levels, and studies had shown that NR activity, GS activity and N application amount are positively correlated [34,35,36,37]. In this study, it was found that the increase in N application rate could promote the increase of the activity of NR, NiR, GS, and GOGAT, thereby accelerating the absorption and utilization of N, and the relative expression of StNR and StNiR showed an upward trend as a whole with the increase of N application rate, which tended to be consistent with the changes in the activity of key enzymes in N metabolism. However, the difference was that the increase in N application reduces the activity of GDH, which was related to the lower expression of StGDH under high N application, and low N promoted the activity of GDH. In addition, there were differences in the activity of key enzymes of N metabolism among different genotypes of potato cultivars. It was found that the activity of NR and NiR were higher in N-efficient cultivars than in N-inefficient cultivars [38,39]. This study showed that in leaves, the overall activity of key enzymes in the N-efficient cultivar Yanshu 4 was significantly higher than that of the N-inefficient cultivar Atlantic, which was consistent with the previous research results. This indicates that the N-efficient cultivars had a stronger ability of assimilating NO3 in leaves, and the N accumulation rate was higher than that of N-inefficient cultivars, which increased the dry matter weight of plants, and improved the quality and yield [5]. In addition, there was a coupling regulation between the key enzymes of N metabolism. Studies had shown that the changes in the activity of NR and NiR generally tend to be consistent, and the research found that the changes in the activity of GS and GOGAT in rice were basically the same [40]. In this study, the changes of NR and NiR activity and GS and GOGAT activity in leaves of each cultivar were also consistent with the change of N application rate, which proved the correlation between the key enzymes of N metabolism with similar functions.
The key enzymes of N metabolism showed significant differences in different growth and development stages and showed a certain continuity. The activity of NR peaked at the seedling stage, indicating that the reaction of NR to reduce nitrate was the strongest during this period. With the accumulation of nitrite, the activity of NiR was the strongest at the budding stage, which meant that the reaction of reduction to ammonium ions was the strongest. Correspondingly, in Yanshu 4, the relative expression of StNiR was also the highest at the budding stage. With the production of ammonium ions, the activity of GS and GOGAT showed the same trend, their activity peaked in the tuber expansion stage, and the relative expression levels of StGS1-3 and StGS2 were also highest during this period. The GDH activity increased with the advancement of the growth and development period and reached the peak at the mature stage, while the relative expression of StGDH in the leaves of Yanshu 4 reached the highest at the mature stage. This also illustrated the consistency of partial gene expression and enzymatic activity.
In conclusion, through the above analysis of the relative expression and enzyme activity of key enzyme genes of the N metabolism pathway in the two genotypes of potato under different N supply levels, it was found that the N absorption and utilization efficiency of different N-efficiency genotypes in potato were different, which came from the common regulatory effect of many genes. The relative expression levels of StNRT1.5, StNR, StNiR in leaves, StNRT2.5, StNRT2.4, StGS1-2 in roots and StNRT2.7, StGS1-3, StGS2, StGS1-4, StFd-GOGAT in leaves and roots showed that the levels of the N-inefficient potato Atlantic (A) were higher than the N-efficient potato Yanshu 4 (Y). Meanwhile, the relative expression levels of StNRT2.5, StGS1-2 in leaves, StNRT1.5 StNR, StNiR in roots and StGDH, StNADH-GOGAT in leaves and roots showed that levels in Yanshu 4 (Y) were higher than in Atlantic (A). At the same time, we especially found that the GDH activity in the leaves of the two genotypes of potato were higher at low N levels. Additionally, the activity of NR and NiR and the activity of GS and GOGAT were correlated. In addition, the changes of key enzymes in different N metabolism showed a certain continuity with the advancement of growth and development, and some gene expression rules and enzyme activity changes also showed a certain consistency. This study clarified the change rules of key enzyme genes and enzyme activity in the N metabolism pathway of different genotypes of potato under different N supply levels, laying a foundation for the subsequent in-depth exploration of the functions of each gene in the potato N metabolism pathway, and providing a theoretical basis for rational N application.

Supplementary Materials

The following supporting information can be downloaded at: https://www.mdpi.com/article/10.3390/horticulturae8090769/s1.

Author Contributions

Conceptualization, Y.H. and J.Z.; Methodology, J.Z.; Software, Y.L.; Validation, Y.Z., Y.W., and Z.H. (Zhijun Han); Resources, Z.H. (Zhongcai Han); Data Curation, Z.H. (Zhijun Han); Writing—Original Draft Preparation, Z.H. (Zhijun Han); Writing—Review and Editing, J.Z.; Supervision, J.Z.; Project Administration, Y.H.; Funding Acquisition, Y.H. All authors have read and agreed to the published version of the manuscript.

Funding

This study was funded by the Jilin Provincial Department of Science and Technology. The funded project is the Jilin potato genetic breeding and improved seed breeding innovation team (20200301025RQ). The funder is Yuzhu Han.

Institutional Review Board Statement

Not applicable.

Informed Consent Statement

Not applicable.

Data Availability Statement

The data presented in this study are available in Supplementary Materials.

Conflicts of Interest

The authors declare no conflict of interest.

References

  1. Yang, Y.; Guo, Y.; Sun, J. The development status and future prospects of my country’s potato industry. J. Agric. Sci. Technol. 2017, 19, 29–36. [Google Scholar]
  2. Li, S.; Li, S.; Wang, Y.; Mou, B.; Zhao, Y.; Li, T.; Han, Y. Genetic diversity analysis of phenotypic traits of potato germplasm resources. Jilin Agric. Univ. 2020, 42, 269–279. [Google Scholar]
  3. Huang, F.; Zhang, L.; Li, X.; Cai, D. Current Situation and Countermeasures of China’s Potato Industry Development. Agric. Outlook 2017, 13, 25–31. [Google Scholar]
  4. Swaney, D.; Howarth, R.; Hong, B. Nitrogen use efficiency and crop production: Patterns of regional variation in the United States, 1987–2012. Sci. Total Environ. 2018, 635, 498–511. [Google Scholar] [PubMed]
  5. He, D. Genotypic Differences in Nitrogen Uptake and Use Efficiency in Potato. Master’s Thesis, Inner Mongolia Agricultural University, Hohhot, China, 2018. [Google Scholar]
  6. Jiao, J.; Wei, Q.; Pei, J.; Guo, Y.; Tang, L.; Shi, Y. Differences in response to nitrogen in different genotypes of potato. Acta Agric. Boreali-Sin. 2018, 33, 203–208. [Google Scholar]
  7. Wei, Q.; Cao, M.; Shi, Y.; Chen, B.; Zhang, L. Effects of nitrogen application levels on growth, development and quality traits of different potato varieties. Shenyang Agric. Univ. 2017, 48, 152–158. [Google Scholar]
  8. Williams, L.; Miller, A. Transporters responsible for the uptake and partitioning of nitrogenous solutes. Annu. Rev. Plant Phys. 2001, 52, 659–688. [Google Scholar]
  9. Zhang, L.; Deng, L.; Xu, N.; Pan, Z.; Li, Y.; Yang, Q. Differences in yield and nitrogen uptake and utilization of potato with different genotypes. Crop. Res. 2020, 34, 44–48. [Google Scholar]
  10. Zheng, S.; Li, G.; Yang, S.; Yuan, J.; Hao, K. Effects of nitrogen application amount and topdressing ratio on growth period and dry matter accumulation of winter potato. Sichuan Agric. Univ. 2009, 27, 270–274. [Google Scholar]
  11. Wei, D.; Wei, J.; Xiong, J.; Liang, H. Research progress on nitrogen nutrition in potato. Guangdong Agric. Sci. 2011, 38, 56–60. [Google Scholar]
  12. Huang, J.; Peng, Z.; Yu, J.; Wu, X.; Lin, Z.; Yang, L. Effects of Different Nitrogen Fertilizer Amounts on Yield, Quality and Nitrogen Utilization Efficiency of Winter Potato. J. Trop. Crops 2014, 35, 266–270. [Google Scholar]
  13. Sarkar, D.; Naik, P.S. Effect of inorganic nitrogen nutrition on cytokinein-induced potato microtuber production in vitro. Potato Res. 1998, 41, 211–217. [Google Scholar]
  14. Liu, H.; Zhao, Z. Research progress of plant nitrogen nutrition efficient genotype screening index. Anhui Agric. Sci. 2006, 34, 3265–3267. [Google Scholar]
  15. Masclaux-Daubresse, C.; Daniel-Vedele, F.; Dechorgnat, J.; Chardon, F.; Gaufichon, L.; Suzuki, A. Nitrogen uptake, assimilation and remobilization in plants: Challenges for sustainable and productive agriculture. Ann. Bot. 2010, 105, 1141–1157. [Google Scholar]
  16. McAllister, C.H.; Beatty, P.H.; Good, A.G. Engineering nitrogen use efficient crop plants: The current status. Plant Biotechnol. J. 2012, 10, 1011–1025. [Google Scholar] [PubMed]
  17. Liu, X.; Gong, Z. Research progress on nitrogen absorption and utilization by plants. Mod. Agric. 2012, 8, 20–21. [Google Scholar]
  18. Cheng, H. Screening of Potato Varieties with High Nitrogen Nutrient Utilization and Research on Their Physiological Mechanism. Master’s Thesis, Sichuan Agricultural University, Ya’an, China, 2010. [Google Scholar]
  19. Guo, Z.; Shen, A.; Kou, C.; Ma, Z.; Wang, S. The relationship between nitrate reductase activity and nitrogen efficiency after flowering in different wheat varieties. Chin. Agric. Sci. Bull. 2008, 5, 219–223. [Google Scholar]
  20. Liu, L.; Jing, W.; Han, Z.; Sun, X.; Lu, Y. Molecular analyses of tomato GS, GOGAT and GDH gene families and their response to abiotic stresses. Acta Physiol. Plant 2016, 38, 229. [Google Scholar]
  21. Masclaux-Daubresse, C.; Reisdorf-Cren, M.; Pageau, K.; Lelandais, M.; Grandjean, O.; Kronenberger, J.; Valadier, M.-H.; Feraud, M.; Jouglet, T.; Suzuki, A. Glutamine Synthetase-Glutamate Synthase Pathway and Glutamate Dehydrogenase Play Distinct Roles in the Sink-Source Nitrogen Cycle in Tobacco. Plant Physiol. 2006, 140, 444–456. [Google Scholar]
  22. Wang, J.; Han, J.; Yang, M.; Yao, D.; Zhou, Y.; Wang, W.; Wu, Z.; Yang, Q. Nitrogen uptake, transport and metabolism of different nitrogen-efficient maize varieties. J. Nucl. Agric. Sci. 2020, 34, 2800–2812. [Google Scholar]
  23. Yamaya, T. Genetic manipulation and quantitative-trait loci mapping for nitrogen recycling in rice. J. Exp. Bot. 2002, 53, 917–925. [Google Scholar] [PubMed] [Green Version]
  24. Chen, M.; Liu, C.; Liu, D.; Tang, Q.; Lin, J.; Liu, X. Heterologous expression of Alternaria brassica glutamate dehydrogenase gene AbGDH to improve nitrogen use efficiency in rice. Life Sci. Res. 2019, 23, 1–12. [Google Scholar]
  25. Zhang, X.; Cai, W.; Kan, H.; Xue, B.; Jia, Z.; Wang, S.; Wu, Y. Differential analysis of carbon and nitrogen metabolism and related gene expression in different varieties of flue-cured tobacco during aging. Chin. J. Tob. 2020, 26, 66–73. [Google Scholar]
  26. Jia, B.; Sun, Z.; Zhang, J.; Zhu, X. Nitrogen metabolism, key enzyme activity and related gene expression analysis of flue-cured tobacco during maturity. Henan Agric. Univ. 2020, 54, 559–565. [Google Scholar]
  27. Zhang, Y.; Zhao, Y.; Wang, Y.; Mou, B.; Zhang, J.; Ma, H.; Han, Y. Physiological and biochemical responses of potato Yanshu 4 to nitrogen and transcriptome analysis. Guangdong Agric. Sci. 2021, 48, 56–66. [Google Scholar]
  28. Gelli, M.; Duo, Y.; Konda, A.R. Identification of differentially expressed genes between sorghum genotypes with contrasting nitrogen stress tolerance by genome-wide transcriptional profiling. BMC Genom. 2014, 15, 179. [Google Scholar]
  29. Zhang, Y. The Regulation Mechanism of Nitrogen Application on Nitrogen Assimilation and Carbon Metabolism in Sugar Beet. Ph.D. Thesis, Northeast Agricultural University, Harbin, China, 2013. [Google Scholar]
  30. Huang, H.; Shen, Y.; Wang, W.; Lian, W.; Chen, X.; Zhai, X.; Yu, Q.; Yang, Z.; Jia, H. Cloning and expression analysis of tobacco nitrate transporter gene NtNRT2.4. Chin. J. Tob. 2016, 22, 84–91. [Google Scholar]
  31. Lezhneva, L.; Kiba, T.; Feria-Bourrellier, A.B. The Arabidopsis nitrate transporter NRT2.5 plays a role in nitrate acquisition and remobilization in nitrogen-starved plants. Plant J. 2014, 80, 230–241. [Google Scholar]
  32. Orsel, M.; Krapp, A.; Daniel-Vedele, F. Analysis of the NRT2 nitrate transporter family in Arabidopsis. Structure and gene expression. Plant Physiol. 2002, 129, 886–896. [Google Scholar]
  33. Yu, J.; Zhu, Z.; Zhang, Z.; Shu, J.; Yang, C.; Song, H.; Guan, C. Effects of glutamine synthase and glutamate synthase on nitrogen reuse in rapeseed under different nitrogen supply conditions. Crops J. 2014, 6, 81–85. [Google Scholar]
  34. Wang, X. Cloning and Functional Analysis of Key Genes in Response to Nitrate Nitrogen Signal in Fruit Tree Roots. Ph.D. Thesis, Shandong Agricultural University, Tai’an, China, 2012. [Google Scholar]
  35. Sun, M. Nitrogen Utilization Evaluation of Introgressed Tomato Strains of Pannari and Preliminary Research on the Mechanism of Action of High-Efficiency Strains. Master’s Thesis, Shenyang Agricultural University, Shenyang, China, 2018. [Google Scholar]
  36. Wu, Y.; Li, Q.; Dou, P.; Ma, X.; Yu, D.; Luo, Y.; Kong, F.; Yuan, J. Effects of nitrogen fertilizer on chlorophyll content and nitrogen-metabolizing enzyme activity of different low-nitrogen-tolerant maize varieties in late growth stage. J. Herbol. 2017, 26, 188–197. [Google Scholar]
  37. Ma, D.; Wang, Y.; Zhao, C.; Lin, Q. Effects of nitrogen application rate and post-flowering soil water content on nitrogen metabolism characteristics and grain protein content of wheat. J. Plant Nutr. Fertil. 2008, 6, 1035–1041. [Google Scholar]
  38. Shah, J.M.; Bukhari, S.A.H.; Zeng, J.B. Nitrogen (N) metabolism related enzyme activities, cell ultrastructure and nutrient contents as affected by N level and barley genotype. J. Integr. Agric. 2017, 16, 190–198. [Google Scholar]
  39. Zhang, T. Physiological Response and Differential Gene Expression of Efficient Nitrogen Utilization in Potato. Ph.D. Thesis, Inner Mongolia Agricultural University, Hohhot, China, 2020. [Google Scholar]
  40. Duan, Y.; Zhang, Y.; Wang, S.; Shen, Q. Response of rice with different nitrogen efficiencies to nitrification and its physiological mechanism during the whole growth period. Chin. J. Ecol. 2007, 3, 1086–1092. [Google Scholar]
Figure 1. Relative expression of nitrate reductase gene StNR in two genotypes of potato under different N supply levels. (A) Leaf (L); (B) Root (R). S, B, T, and M represent seedling stage, budding stage, tuber expansion stage, and mature stage, respectively. N, N, N+ are different N supply levels, representing low N, normal N, and excess N, respectively. Different letters indicate the difference of relative gene expression in different periods under different N application levels (p < 0.05).
Horticulturae 08 00769 g001
Figure 2. Relative expression of nitrite reductase gene StNiR in two genotypes of potato under different N supply levels. (A) Leaf (L); (B) Root (R). S, B, T, and M represent seedling stage, budding stage, tuber expansion stage, and mature stage, respectively. N, N, N+ are different N supply levels, representing low N, normal N, and excess N, respectively. Different letters indicate the difference of relative gene expression in different periods under different N application levels (p < 0.05).
Horticulturae 08 00769 g002
Figure 3. Relative expression of glutamine synthase gene StGS1 in two genotypes of potato under different N supply levels. (A) Leaf (L); (B) Root (R). S, B, T, and M represent seedling stage, budding stage, tuber expansion stage, and mature stage, respectively. N, N, N+ are different N supply levels, representing low N, normal N, and excess N, respectively. Different letters indicate the difference of relative gene expression in different periods under different N application levels (p < 0.05).
Horticulturae 08 00769 g003
Figure 4. Relative expression of glutamine synthase gene StGS1-3 in two genotypes of potato under different N supply levels. (A) Leaf (L); (B) Root (R). S, B, T, and M represent seedling stage, budding stage, tuber expansion stage, and mature stage, respectively. N, N, N+ are different N supply levels, representing low N, normal N, and excess N, respectively. Different letters indicate the difference of relative gene expression in different periods under different N application levels (p < 0.05).
Horticulturae 08 00769 g004
Figure 5. Relative expression of glutamine synthase gene StGS1-2 in two genotypes of potato under different N supply levels. (A) Leaf (L); (B) Root (R). S, B, T, and M represent seedling stage, budding stage, tuber expansion stage, and mature stage, respectively. N, N, N+ are different N supply levels, representing low N, normal N, and excess N, respectively. Different letters indicate the difference of relative gene expression in different periods under different N application levels (p < 0.05).
Horticulturae 08 00769 g005
Figure 6. Relative expression of glutamine synthase gene StGS1-4 in two genotypes of potato under different N supply levels. (A) Leaf (L); (B) Root (R). S, B, T, and M represent seedling stage, budding stage, tuber expansion stage, and mature stage, respectively. N, N, N+ are different N supply levels, representing low N, normal N, and excess N, respectively. Different letters indicate the difference of relative gene expression in different periods under different N application levels (p < 0.05).
Horticulturae 08 00769 g006
Figure 7. Relative expression of glutamine synthase gene StGS2 in two genotypes of potato under different N supply levels. (A) Leaf (L); (B) Root (R). S, B, T, and M represent seedling stage, budding stage, tuber expansion stage, and mature stage, respectively. N, N, N+ are different N supply levels, representing low N, normal N, and excess N, respectively. Different letters indicate the difference of relative gene expression in different periods under different N application levels (p < 0.05).
Horticulturae 08 00769 g007
Figure 8. Relative expression of glutamate synthase gene StFd-GOGAT in two genotypes of potato under different N supply levels. (A) Leaf (L); (B) Root (R). S, B, T, and M represent seedling stage, budding stage, tuber expansion stage, and mature stage, respectively. N, N, N+ are different N supply levels, representing low N, normal N, and excess N, respectively. Different letters indicate the difference of relative gene expression in different periods under different N application levels (p < 0.05).
Horticulturae 08 00769 g008
Figure 9. Relative expression of glutamate synthase gene StNADH-GOGAT in two genotypes of potato under different N supply levels. (A) Leaf (L); (B) Root (R). S, B, T, and M represent seedling stage, budding stage, tuber expansion stage, and mature stage, respectively. N, N, N+ are different N supply levels, representing low N, normal N, and excess N, respectively. Different letters indicate the difference of relative gene expression in different periods under different N application levels (p < 0.05).
Horticulturae 08 00769 g009
Figure 10. Relative expression of glutamate dehydrogenase gene StGDH in two genotypes of potato under different N supply levels. (A) Leaf (L); (B) Root (R). S, B, T, and M represent seedling stage, budding stage, tuber expansion stage, and mature stage, respectively. N, N, N+ are different N supply levels, representing low N, normal N, and excess N, respectively. Different letters indicate the difference of relative gene expression in different periods under different N application levels (p < 0.05).
Horticulturae 08 00769 g010
Figure 11. Relative expression of nitrate transporter StNRT1.5 in two genotypes of potato under different N supply levels. (A) Leaf (L); (B) Root (R). S, B, T, and M represent seedling stage, budding stage, tuber expansion stage, and mature stage, respectively. N, N, N+ are different N supply levels, representing low N, normal N, and excess N, respectively. Different letters indicate the difference of relative gene expression in different periods under different N application levels (p < 0.05).
Horticulturae 08 00769 g011
Figure 12. Relative expression of nitrate transporter StNRT2.4 in two genotypes of potato under different N supply levels. (A) Leaf (L); (B) Root (R). S, B, T, and M represent seedling stage, budding stage, tuber expansion stage, and mature stage, respectively. N, N, N+ are different N supply levels, representing low N, normal N, and excess N, respectively. Different letters indicate the difference of relative gene expression in different periods under different N application levels (p < 0.05).
Horticulturae 08 00769 g012
Figure 13. Relative expression of nitrate transporter StNRT2.5 in two genotypes of potato under different N supply levels. (A) Leaf (L); (B) Root (R). S, B, T, and M represent seedling stage, budding stage, tuber expansion stage, and mature stage, respectively. N, N, N+ are different N supply levels, representing low N, normal N, and excess N, respectively. Different letters indicate the difference of relative gene expression in different periods under different N application levels (p < 0.05).
Horticulturae 08 00769 g013
Figure 14. Relative expression of nitrate transporter StNRT2.7 in two genotypes of potato under different N supply levels. (A) Leaf (L); (B) Root (R). S, B, T, and M represent seedling stage, budding stage, tuber expansion stage, and mature stage, respectively. N, N, N+ are different N supply levels, representing low N, normal N, and excess N, respectively. Different letters indicate the difference of relative gene expression in different periods under different N application levels (p < 0.05).
Horticulturae 08 00769 g014
Figure 15. Nitrate reductase (NR) activity in two genotypes of potato leaves under different N supply levels. The amount of catalytic reduction of 1 nmol of NADH per 1 g of fresh weight sample per 1 min is one unit of enzyme activity. S Stage, B Stage, T Stage, and M Stage represent seedling stage, budding stage, tuber expansion stage, and mature stage, respectively. N, N, N+ are different N supply levels, representing low N, normal N, and excess N, respectively. Different letters indicate the difference of enzyme activity under different N application levels in the same period (p < 0.05).
Horticulturae 08 00769 g015
Figure 16. Nitrite reductase (NiR) activity in two genotypes of potato leaves under different N supply levels. The amount of 1 nmol NO2 reduced per 1 g of fresh weight sample per 1 min is one unit of enzyme activity. S Stage, B Stage, T Stage, and M Stage represent seedling stage, budding stage, tuber expansion stage, and mature stage, respectively. N, N, N+ are different N supply levels, representing low N, normal N, and excess N, respectively. Different letters indicate the difference of enzyme activity under different N application levels in the same period (p < 0.05).
Horticulturae 08 00769 g016
Figure 17. Glutamine synthase (GS) activity in two genotypes of potato leaves under different N supply levels. The amount of 1 nmol of γ-glutamyl hydroxamic acid is produced per 1 mL of reaction system per 1 min per 1 g of fresh weight sample is one unit of enzyme activity. S Stage, B Stage, T Stage, and M Stage represent seedling stage, budding stage, tuber expansion stage, and mature stage, respectively. N, N, N+ are different N supply levels, representing low N, normal N, and excess N, respectively. Different letters indicate the difference of enzyme activity under different N application levels in the same period (p < 0.05).
Horticulturae 08 00769 g017
Figure 18. Glutamate synthase (GOGAT) activity in two genotypes of potato leaves under different N supply levels. The amount of 1 nmol NADH is consumed per 1 g fresh weight sample per 1 min is one unit of enzyme activity. S Stage, B Stage, T Stage, and M Stage represent seedling stage, budding stage, tuber expansion stage, and mature stage, respectively. N, N, N+ are different N supply levels, representing low N, normal N, and excess N, respectively. Different letters indicate the difference of enzyme activity under different N application levels in the same period (p < 0.05).
Horticulturae 08 00769 g018
Figure 19. Glutamate dehydrogenase (GDH) activity in two genotypes of potato leaves under different N supply levels. The amount of 1 nmol NADH is consumed per 1 g fresh weight sample per 1 min is one unit of enzyme activity. S Stage, B Stage, T Stage, and M Stage represent seedling stage, budding stage, tuber expansion stage, and mature stage, respectively. N, N, N+ are different N supply levels, representing low N, normal N, and excess N, respectively. Different letters indicate the difference of enzyme activity under different N application levels in the same period (p < 0.05).
Horticulturae 08 00769 g019
Table 1. Primer sequence.
Primer NamePrimer Sequence
Reference-StEF1α FGATGGTCAGACCCGTGAACA
Reference-StEF1α RCCTTGGAGTACTTCGGGGTG
StNADH-GOGAT FGTGGTGGTGTTGCCTATGTTCTTGA
StNADH-GOGAT RTTGTGTTACGCTGGTGTTGCTGTAT
StFd-GOGAT FCAAGCGGATTCGTAGAAGGATTGGT
StFd-GOGAT RCGTTGAAGGTCAAGAACAGCATTGC
StGS1 FAATGAGCGTCGTCTCACTGG
StGS1 RGGCTGGCCTGTCCTCAAAG
StGS1-2 FGGAAGTGATGCCTGGACAGTGG
StGS1-2 RCAGCAACCTCAGCAATCCTCTCG
StGS1-3 FTGGACAAGCACCTGGAGAAGACA
StGS1-3 RCCAAGATGTTGTTACCACCACGGAA
StGS1-4 FCTGGAAAGGCTTTTGGACGC
StGS1-4 RCCAGGCATCACTTCTCCGTT
StGS2 FTGCTGCTTATGGGGTTGGC
StGS2 RCTGTGTGTCCCTTCCGATCCT
StNR FACGCTGAACTTGCTAACGCTGAA
StNR R ATGGCACGGAGTTGTAATGACAGAG
StNiR F TGTGCTACCTGATGTGCCTGAGA
StNiR R TCCTGACATTATCCATGCCACTCTG
StGDH F TCGGCGGTGGTGATGTAATGAGTA
StGDH RCTCCTCCCAGAGCACAGGGTATAAG
StNRT1.5 FCGACGATGACACAACTGGTGGTAG
StNRT1.5 RCCTGCTTCTGGCTCTCAAGTTCC
StNRT2.4 FGCAGACGGTGGCTGGATTGATG
StNRT2.4 R AAGCACGCCATAACCAGAACAGAC
StNRT2.5 F ACCTGCTCTGTTTCAGGCTT
StNRT2.5 RGTTTCGCGTAATCTCCATCGG
StNRT2.7 FGCAGACGGTGGCTGGATTGATG
StNRT2.7 RAAGCACGCCATAACCAGAACAGAC
Publisher’s Note: MDPI stays neutral with regard to jurisdictional claims in published maps and institutional affiliations.

