Article

Cell Division Controls Final Fruit Size in Three Apple (Malus x domestica) Cultivars

by
Siti Khadijah A. Karim
1,*,
Andrew C. Allan
2,3,
Robert J. Schaffer
2,3 and
Karine M. David
2
1
Faculty of Plantation and Agrotechnology, Universiti Teknologi MARA (UiTM) Melaka, Jasin Campus, Merlimau 77300, Malaysia
2
School of Biological Sciences, University of Auckland, Private Bag 92019, Auckland 1142, New Zealand
3
Plant and Food Research Institute Ltd., Private Bag 92169, Auckland 1142, New Zealand
*
Author to whom correspondence should be addressed.
Horticulturae 2022, 8(7), 657; https://doi.org/10.3390/horticulturae8070657
Submission received: 24 June 2022 / Revised: 15 July 2022 / Accepted: 15 July 2022 / Published: 19 July 2022

Abstract

:
Apple (Malus x domestica) fruit size is dependent on cell division and cell expansion, processes that are subsequently regulated by plant hormones such as auxins, gibberellins, and cytokinins. In this study, we investigated the role of cell division and cell expansion in apple growth and identified which of the two was more deterministic of final fruit size. Three cultivars of different sizes were selected, namely, “Twenty Ounce” (large-sized), “Royal Gala” (medium-sized), and “Crabapple” (small-sized). Gene expression and cell size analyses were conducted over the course of two consecutive seasons. The expression patterns of three classes of genes were markedly similar across all cultivars. Two cell division markers, namely MdCDKB2;2 and MdANT2, were discovered to be correlatively expressed, as both displayed initially high expression levels, which gradually declined from the early to late stages of the growth time course. For cell expansion markers, MdEXP3 was upregulated as the cells expanded, while MdARF106 was expressed in both the cell division and expansion stages. Meanwhile, the ripening-related gene MdACO1 was expectedly expressed only during the ending stages associated with ripening. Interestingly, the cell measurements taken regularly from each cultivar throughout the same experimental timespan showed that cell sizes were unaltered and remained constant from initial pollination at the zeroth Day After Pollination (DAP) to ripening at 120 Days After Full Bloom (DAFB).

1. Introduction

Apple fruit size is dependent on its cell number and size, characteristics regulated by cell division and expansion rates [1,2]. Although the average-sized fruit has approximately 50 million cells, some grow larger by either increasing their cell numbers or enlarging their cells [3]. For commercially grown apples, fruit size is an important factor in determining the keeping quality of apples in storage [4]. All fruits stored together must be of a similar size as smaller apples have a shorter storage life than their bigger counterparts. Furthermore, as they are sold by weight, producing larger fruits will help growers gain maximum profit [3]. Therefore, research on the factors controlling final fruit size hold both economic and scientific interest.
Great variations in fruit size exist among apples. For instance, Crabapples are typically 5 cm in diameter, whereas other cultivars may produce fruit in excess of 10 cm [1,5]. Apart from cellular growth, harvest time is also a critical determinant of fruit size. Red Delicious are larger than Royal Gala at harvest as their delayed maturity means a longer time on the tree [3]. Enlargement strategies have also been introduced to improve fruit size. In fruit thinning, lateral flowers are removed either manually [1,6] or by utilising plant growth hormones, such as gibberellin, auxin, and cytokinin [7,8]. This increases the leaf:fruit ratio, thus assisting the remaining flowers to grow larger fruits [1,9]. Unfortunately, genetics bears a strong influence and may render the thinning process unsuccessful in some cultivars: for instance, Crabapples will remain small despite cultivation under the same conditions as bigger cultivars [3]. Deeper knowledge of fruit development at a cellular and molecular level would therefore be valuable to improve techniques of fruit size manipulation in apple breeding.
Fruits are reproductive organs unique to the Angiosperm phylum that have evolved to promote seed dispersal. Fleshy fruits assist seed dispersal by attracting animals due to their colour, flavour, nutritional content, and texture. Despite being a major contributor to the human diet, little is known about how the flesh tissue develops, differentiates, and ripens. Fruit development starts with successful fertilisation. This event releases the hormones necessary to consecutively induce the stages of fruit set, cell division, cell expansion, and ripening [10,11]. The entire process takes 20 to 21 weeks, which culminates with the production of a crisp fruit with a waxy cuticle.
The cell division stage begins during fruit set, a stage characterised by the rapid amplification of cell numbers [11,12]. Division ceases three to four weeks after pollination to allow expansion to take place [10,11]. Although cell expansion continues until full ripening, the process reaches its peak 40 to 60 days after anthesis [8,11]. The onset of ripening occurs at 90 DAFB, after which the fruit would continue to mature until fully ripened by 146 DAFB [8,11]. The ripening stage is particularly crucial as it entails the changes necessary to increase the fruit’s attractiveness to agents of seed dispersal such as birds and animals [11,13,14].
Final fruit size is determined by cell division and expansion. Thus, an understanding of cell cycle regulation would provide a good picture of fruit development in plants [5,15]. Cell cycle progression is a controlled process involving specific checkpoints monitored by a large family of serine/threonine protein kinases, such as the Cyclin-Dependent Kinases (CDKs), an activating subunit, the cyclins, and CDK inhibitors [12,15]. Although CDKB2;1 is relatively well studied [16,17], CDKB2;2 is not, likely due to its absence in some plant species [11]. In apples, the MdCDKB2 gene has been identified by Janssen et al. [8] from a microarray data pool, findings which were then refined and elaborated upon by Malladi and Johnson [12]. Our interest in utilising CDKB2;2 as a marker of cell division lies in its distinct downregulation towards the end of the early developmental stages, an observation that may have alluded to the participation of CDKB2;2 in the cell cycle regulation of the apple fruit.
AINTEGUMENTA (ANT) is a plant-specific gene of the APETALA 2 (AP2) family of floral transcription factors and is active in developing flower and vegetative tissues [2,18]. In Arabidopsis, ANT was demonstrated to control cell proliferation in integuments during ovule growth [2,19]. The loss of ANT function decreased cell division activity, resulting in reduced floral organ size. However, apple-specific homologues of ANT are yet to be shown to function similarly to their Arabidopsis counterparts [1,2]. Consequently, we opted to analyse the apple ANT gene, MdANT2, as another potential marker of the cell division phase in apple fruit development.
Several other genes have been identified for their potential involvement in apple fruit growth. Previous research observed the upregulation of MdANT1 and MdANT2 during the early stages of fruit growth. Their high expression levels were maintained to the end of the cell division stage to propel the division of competent undifferentiated cells. However, meristematic cells eventually lose their competence with both ANT variants becoming downregulated as the fruit enters the ripening stage [1,2,19]. These observations were nonetheless critical in demonstrating that the cyclical expression of MdANT1 and MdANT2 coincided with the developmental stage of cell division during fruit growth. Both genes are known to be more lengthily and highly expressed in larger fruits within the cultivar Golden Delicious Smoothie (GS) [1,2]. Moreover, MdANT1 and MdANT2 have exhibited a positive correlation to A- and B-type CDKs during the regulation of cell production and cell cycle in apples [1,2].
Meanwhile, the Apple Auxin Response Factor 106 (MdARF106) is a transcription factor discovered due to its QTL-mapped co-localisation with a population of fruit growth genes. Analysis of its expression patterns during the cell division and expansion stages of development then supported the hypothesis that MdARF106 too might regulate fruit growth [20,21].
Expansins are a family of proteins that catalyse cell wall expansion [22,23]. In Arabidopsis, the expansin family consists of nearly 30 genes divided into two subfamilies, designated as either α or β, based on sequence divergence and biochemical activity [23,24,25]. Cell expansion entails the synthesis of new plant cell walls around nascent cells, a process that inevitably enlarges cellular size, thus leading to plant bulking and growth [23,26]. In apple fruit size studies, higher expression levels of MdEXP3 were observed in the big-sized cultivar M. domestica “Sekaiichi” in comparison to that of the small-sized M. floribunda during their expansion phases (35 and 49 DAFB), thus supporting the role of expansins during this stage of fruit growth [27]. Their effects are also cell-expansion-specific, as MdEXP3 was only negligibly detectable during the preceding cell division stage (21 DAFB) [27]. Another study then suggested that MdEXP3 may be linked with ripening or and ethylene regulation [28]. Nonetheless, expansins undoubtedly play a vital role in cell expansion as the low activity of another gene family member, MdEXPA10;1, caused a decline in fruit growth due to low cell wall expansion activity [29].

2. Materials and Methods

Entire experiments were repeated over two consecutive seasons. Gene expressions were analysed with samples from two biological replicates (Rep1 and Rep2). Cell area and therefore size were determined by measuring three individuals at each time point.

2.1. Pollination

Pollen obtained from Granny Smith was used to hand-pollinate the flowers of Twenty Ounce, Royal Gala, and Crabapples. The Granny Smith variety is one of the most common and compatible pollinisers for many apple varieties including these three cultivars studied. All pollination was performed early in the morning (before 11 a.m.), which is when the most flowers are first open, in order to minimize competition with other pollinators such as bees. An unpollinated blooming flower was distinguished by its white stigma, as opposed to the brown stigma of pollinated blooms. To pollinate a flower, a small paint brush was first dipped into the pollen, then gently brushed against the stigma of a blooming flower. Each flower was tagged for recognition during sample collection. A total of 108 flowers were pollinated during Season 1 and 300 during Season 2. We opted to pollinate more flowers during Season 2 in order to obtain a higher concentration of RNA.

2.2. Harvest

The hypanthium of unpollinated flowers was collected from each cultivar as controls (un-bloomed flowers). Pollinated flowers or fruits were collected and dissected according to the pre-determined time points. Samples were collected for three types of experiments, i.e., physiology, histology, and gene expression. For physiology studies, the equatorial diameter of a fruit was determined using callipers. Measurements were taken from three individual fruits, after which they were quickly imaged. For histology experiments, flowers were fixed in a fixative solution before storage in 4 °C. For gene expression analyses, fresh samples were processed on-site at the orchard to retain RNA integrity during the process of their transport back to the laboratory. Briefly, the hypanthiums of flowers were dissected with a scalpel to discard their ovaries, then flash frozen in liquid nitrogen. Samples were immediately stored in a −80 °C freezer upon arrival.

2.3. RNA Isolation and qPCR Analyses

The RNA was extracted from frozen samples. Due to the low concentration of RNA in the mesocarp region of fruits, we opted to follow a protocol that was previously described for pine needles [30,31]. This protocol works in isolating a higher concentration of RNA from even small-sized tissues. Clean-up was achieved using the RNeasy Mini Kit (Qiagen) and Ambion Turbo DNase treatment Kit, both performed as per the manufacturer’s instructions. First-strand cDNA was synthesised using the First Strand Superscript III cDNA Supermix Kit (Invitrogen). Two biological replicates were prepared for each time point and cultivar. The qPCR runs were executed on the Applied Biosystems Real-Time PCR platform alongside the housekeeping gene MdGAPDH for normalisation purposes. Three replicates of each reaction were prepared for each of the 8 markers used. qPCR was performed on both biological replicates (Rep1 and Rep2) for each season’s samples. The data were analysed using the Livak method (ΔΔCT) [32] or using the ΔCt method and normalised against MdGAPDH.
To ensure RNA-specific targeting during qPCR, primers for a marker of cell division, MdCDKB2;2, and one of cell expansion, MdEXP3, were designed to span the exons of their genomic sequences. The specific qPCR marker of the MdCDKB2:2 gene was designed by using the GeneBank accession number (CN943384) that was published in a report [33]; the cDNA sequence was searched on the NCBI website. The sequence was then copied and blasted on the Genome Database of Rosaceae (GDR) website. The results indicated that there were three chromosomes where CDKB2:2 could be located—Chromosome 6, Chromosome 6 (Haploid 1), and Chromosome 9. The accession number/code of the three sequences were analysed against the GDR database. The gene model sequence code for Ch6 was MDP0000418062. The gDNA, which was in reverse sequence, was saved in Notepad (Microsoft Corporation, Redmond, WA, USA). The cDNA sequence was also saved in a separate Notepad file. At this point, there were three gDNAs and cDNAs obtained. Using Geneious Pro software (http://www.geneious.com, accessed on 15 January 2015 [34]), each of the gDNA files was imported and reverse complemented. All cDNA files were also imported into the software.
Within Geneious, all three cDNAs were aligned, and the consensus sequence was saved in a Notepad file. All three gDNAs (reversed) were also aligned and saved in another Notepad file. The aligned consensus sequence of both the cDNA and gDNA were then further aligned, and exons and introns could be predicted. The forward primer was designed by taking the 10 mer from the edge of exon1 and the 10 mer from the edge of exon2 in the start region (using Primer 3 online freeware; www.bioinformatics.nl/cgi-bin/primer3plus/primer3plus.cgi/, accessed on 15 January 2015). The reverse primer was designed by taking the 20 mer from another exon so that the product would be in the range of 80–100 bp. The primer sequence was then analysed using online software, IDT Oligo Analyser (http://sg.idtdna.com/calc/analyzer, accessed on 15 January 2015). Several parameters were considered, such as the G/C percentage (at least 50%), the possibility of a primer dimer, hairpin, the melting temperature between the pair (65 °C and above; the Tm difference between forward and reverse must not be as high), and the product size (between 80–100 bp only). The designed primers were next opened using IDT to be synthesised. Primer efficiency was evaluated using qPCR.
The MdEXP3 accession number is MDP0000670959. Primers were designed following the same protocol of the MdCDKB2:2 primer design work. Primer efficiency was evaluated using qPCR. The primer sequence for MdANT2 was re-synthesised from a published report [1]. An MdARF106 primer was designed using the same method described for MdCDKB2:2. The MdARF106 accession number is MDP0000232116 [20]. A pair of primers was created. The MdACO1 primer was re-synthesised from a published work [35,36]. The MdPG1 primer was obtained from an unpublished work of the Plant Molecular Biology Lab at the University of Auckland, New Zealand. The primer of MdActin was re-synthesised from a published work [35]. MdGAPDH was re-synthesised from a published work [29]. Table 1 shows the primer sequences generated. Each of the primers’ efficiency was evaluated using qPCR.

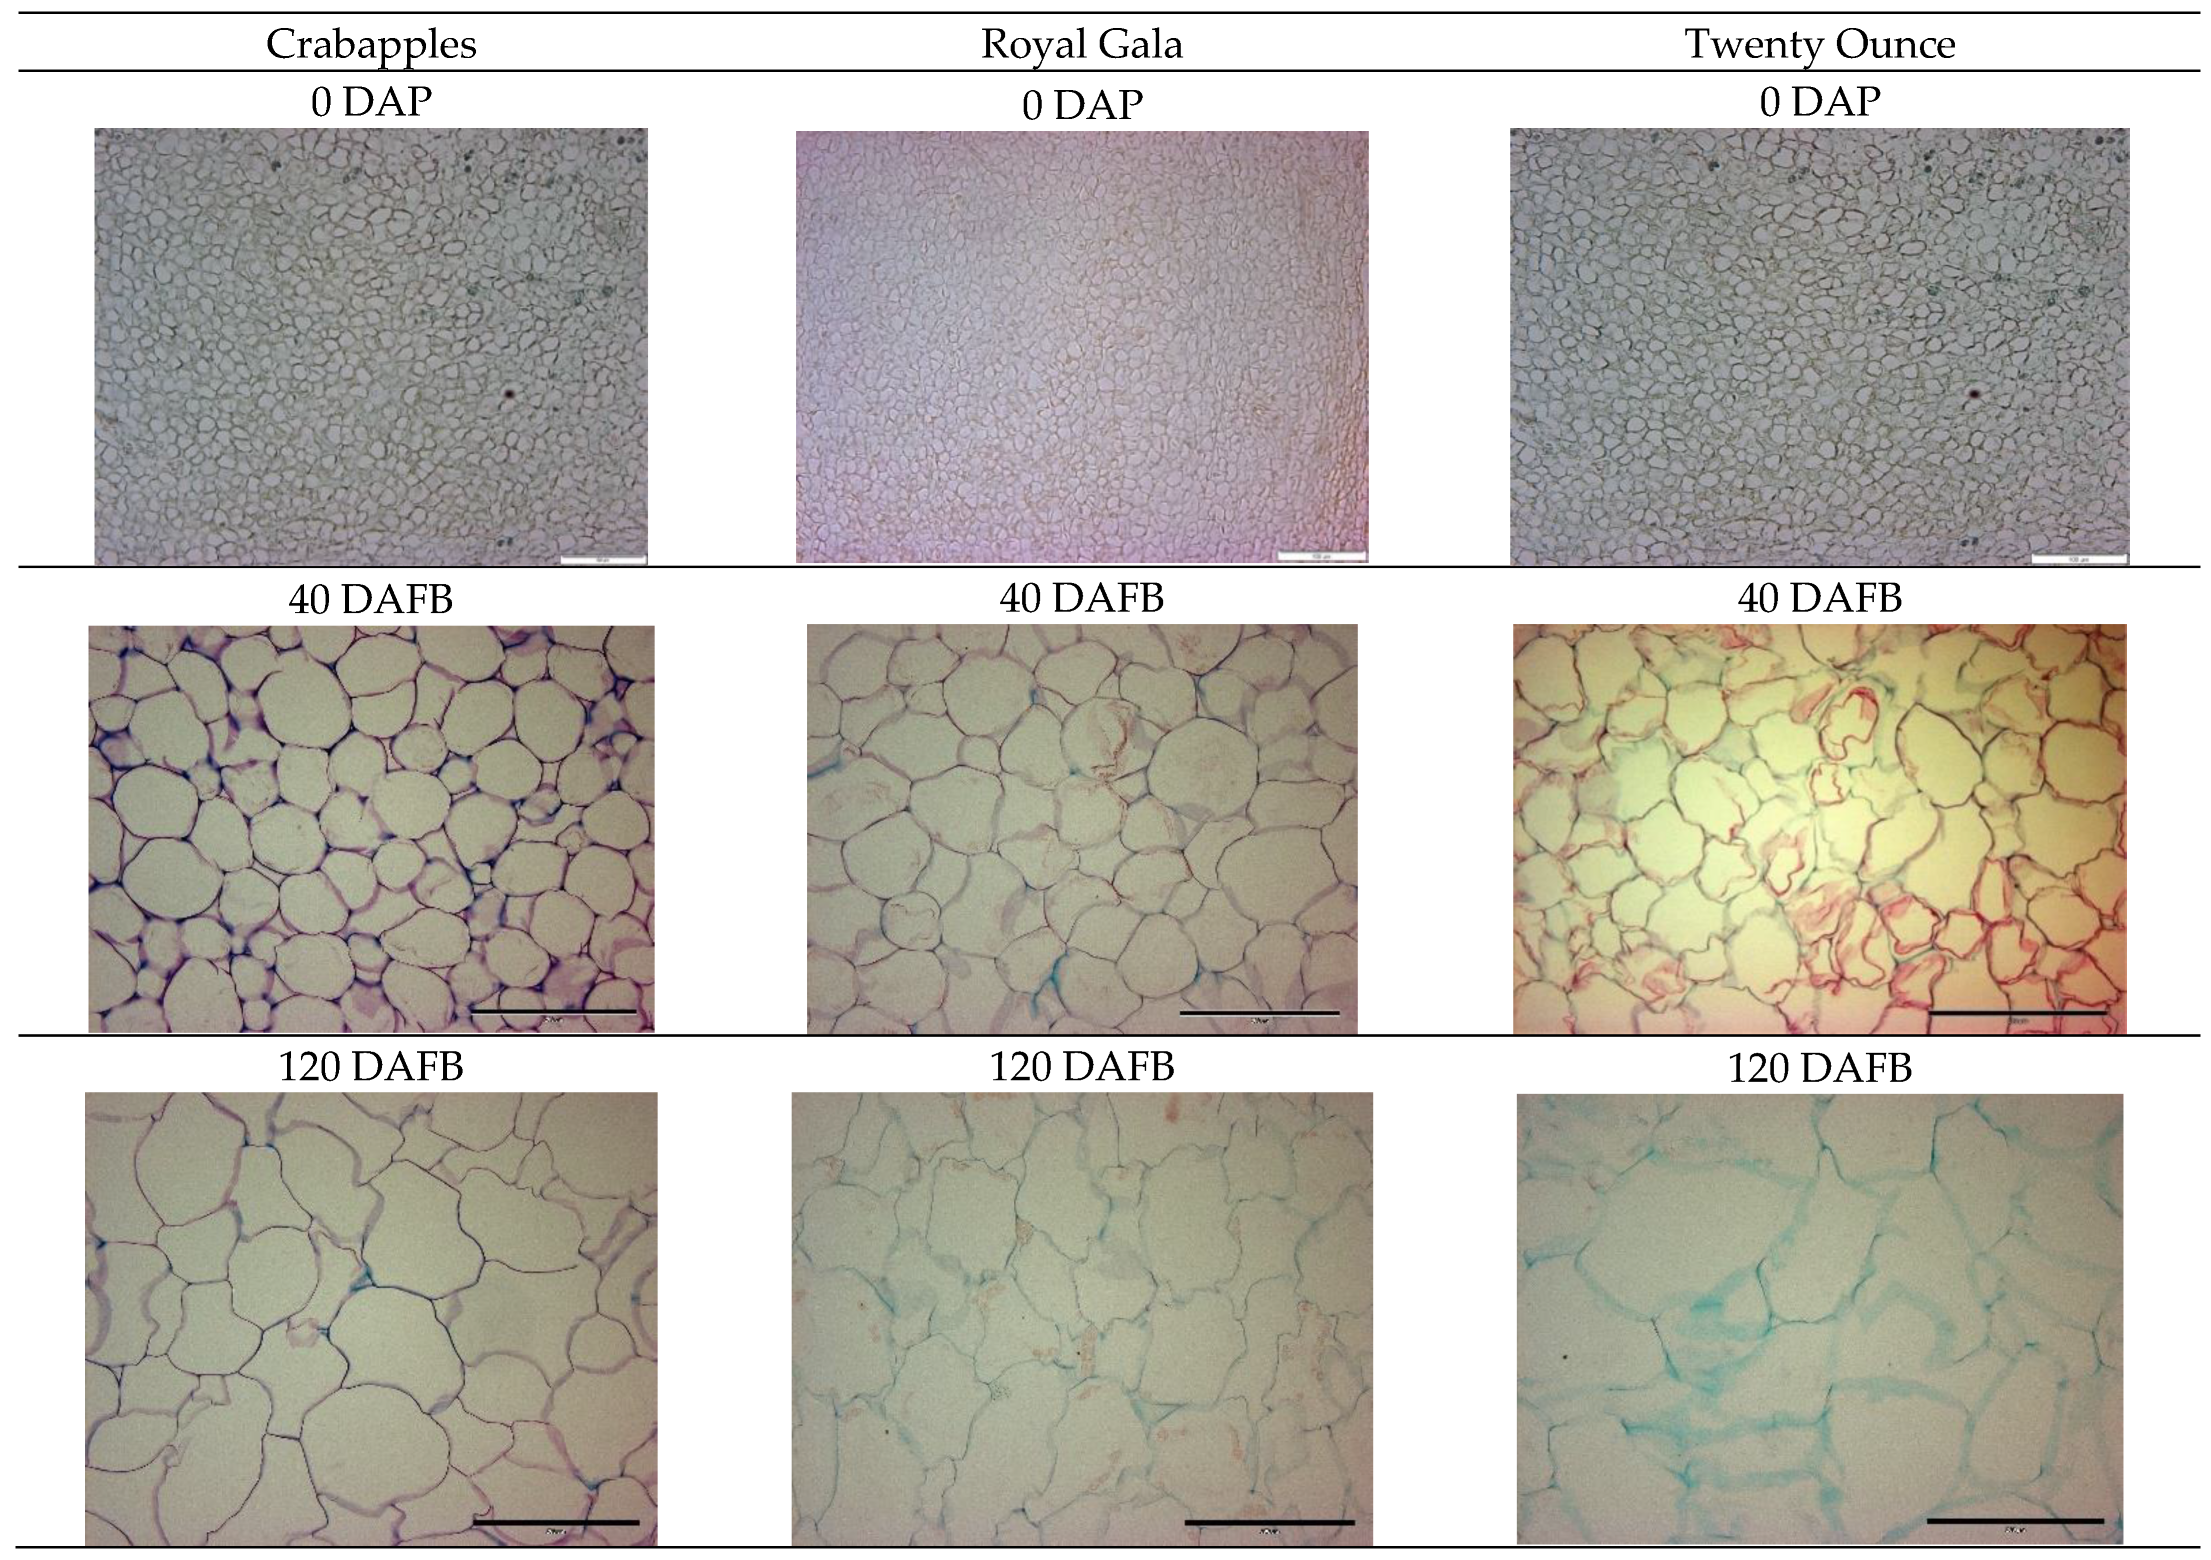
2.4. Histology Slide Preparation and Cell Area Measurement

Hypanthium segments and fruits were fixed and embedded in paraffin wax. Specimen slides were prepared on a microtome (Leica Biosystems, Deer Park, IL, USA) with a thickness setting of 10 µm per slice. Specimens were stained with 1% Safranin- 0.5% Fast Green [37]. Brightfield microscopy images were obtained using the Leica 500 Microscope, then exported to the ImageJ software for cell area measurements. These steps were repeated with two more individual hypanthium/fruits for each time point and cultivar, for a total of three replicates.

2.5. Phylogenetic Analysis

A phylogenetic tree was generated in order to investigate the relatedness of the apple CDK family with two well-known model plants, which are Arabidopsis for dry fruit and tomato for fleshy fruit. A number of CDK genes from Arabidopsis, apple, and tomato were taken from reports [12,38,39,40,41]. Sequences were analysed using the Basic Local Alignment Search Tool (BLAST). All sequences then underwent BLASTn and tBLASTn to identify the homology. Nucleotide sequences were translated into protein sequences before protein homology between samples was validated using BLASTp. Sequences were aligned using Multiple Sequence Comparison by Log-Expectation (MUSCLE) before a neighbour-joining phylogenetic tree was generated using the Geneious Pro software (Auckland 1010, New Zealand, www.geneious.com, accessed on 15 January 2015) with 500 bootstraps [35].

2.6. Statistical Analysis

All data in this research were analysed by ANOVA using SPSS version 22 (IBM Corporation, Armonk, NY, USA) or the t-test method using Windows Microsoft Excel 2007 (Microsoft Corporation, Redmond, WA, USA). Data were judged with a p-value < 0.05 to accept the significant difference. Post-ANOVA, when a significant difference was obtained, Tukey’s HSD test was carried out for the separation of means at significance <0.05.

3. Results

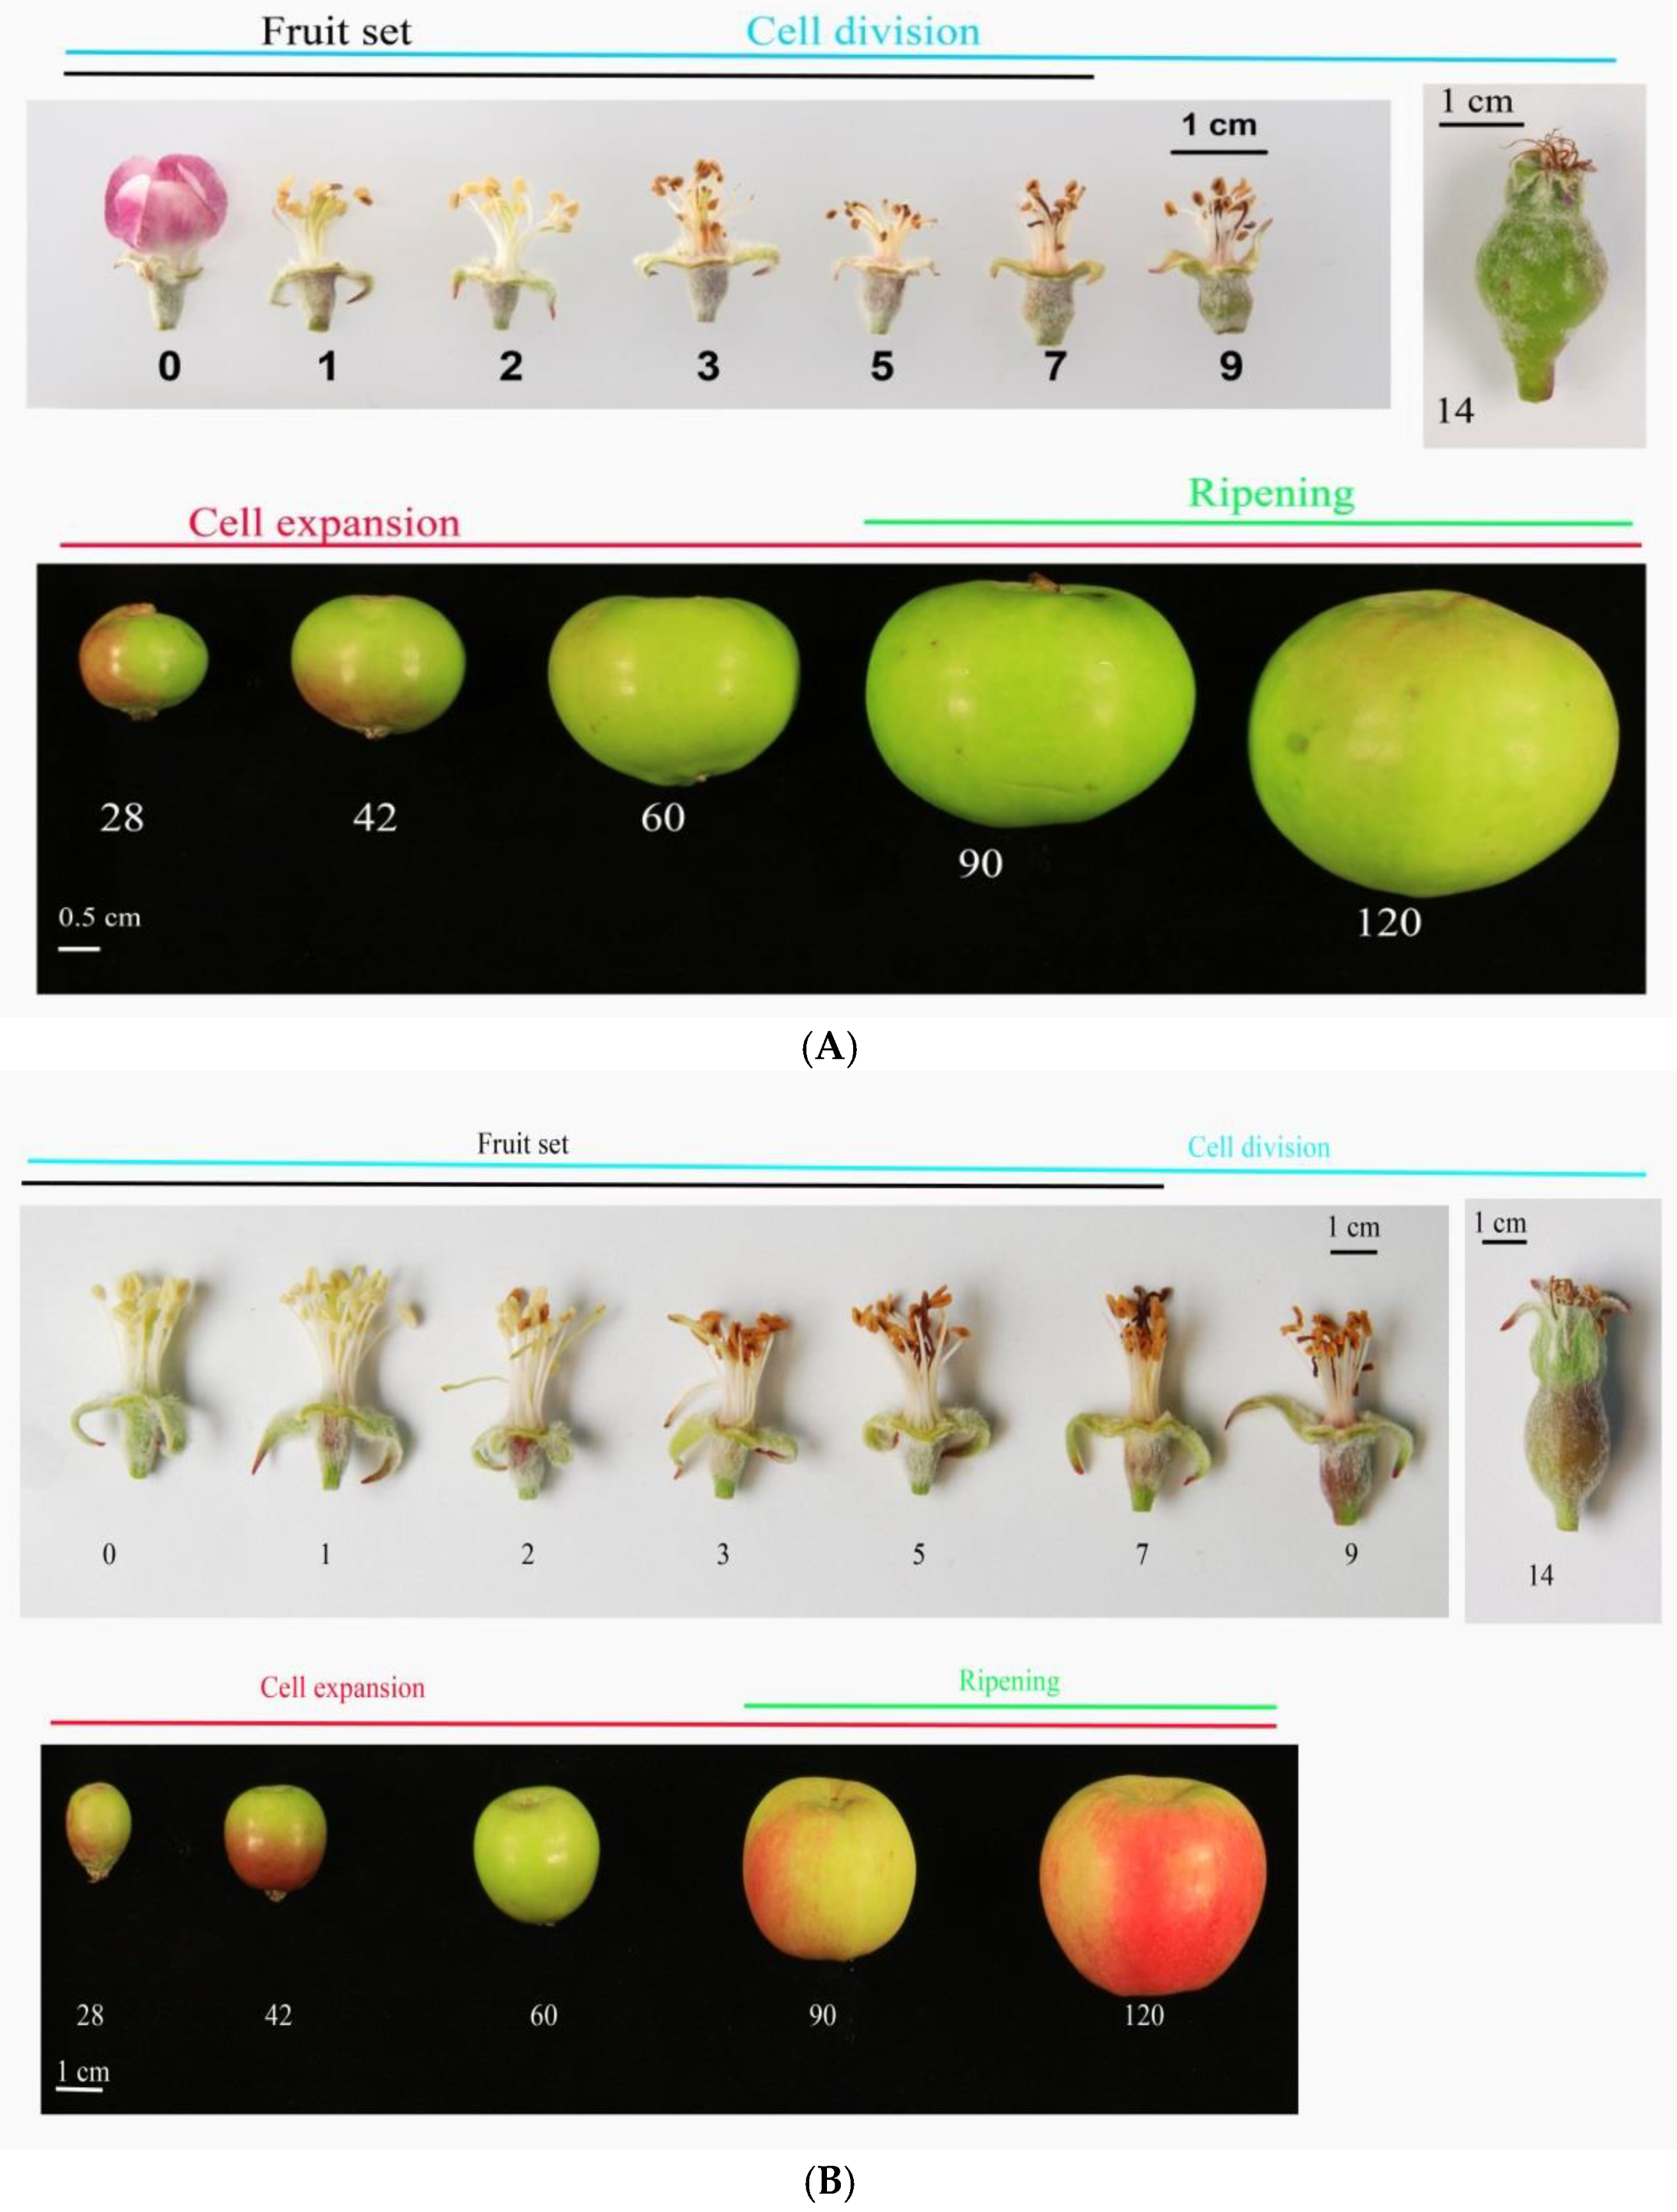
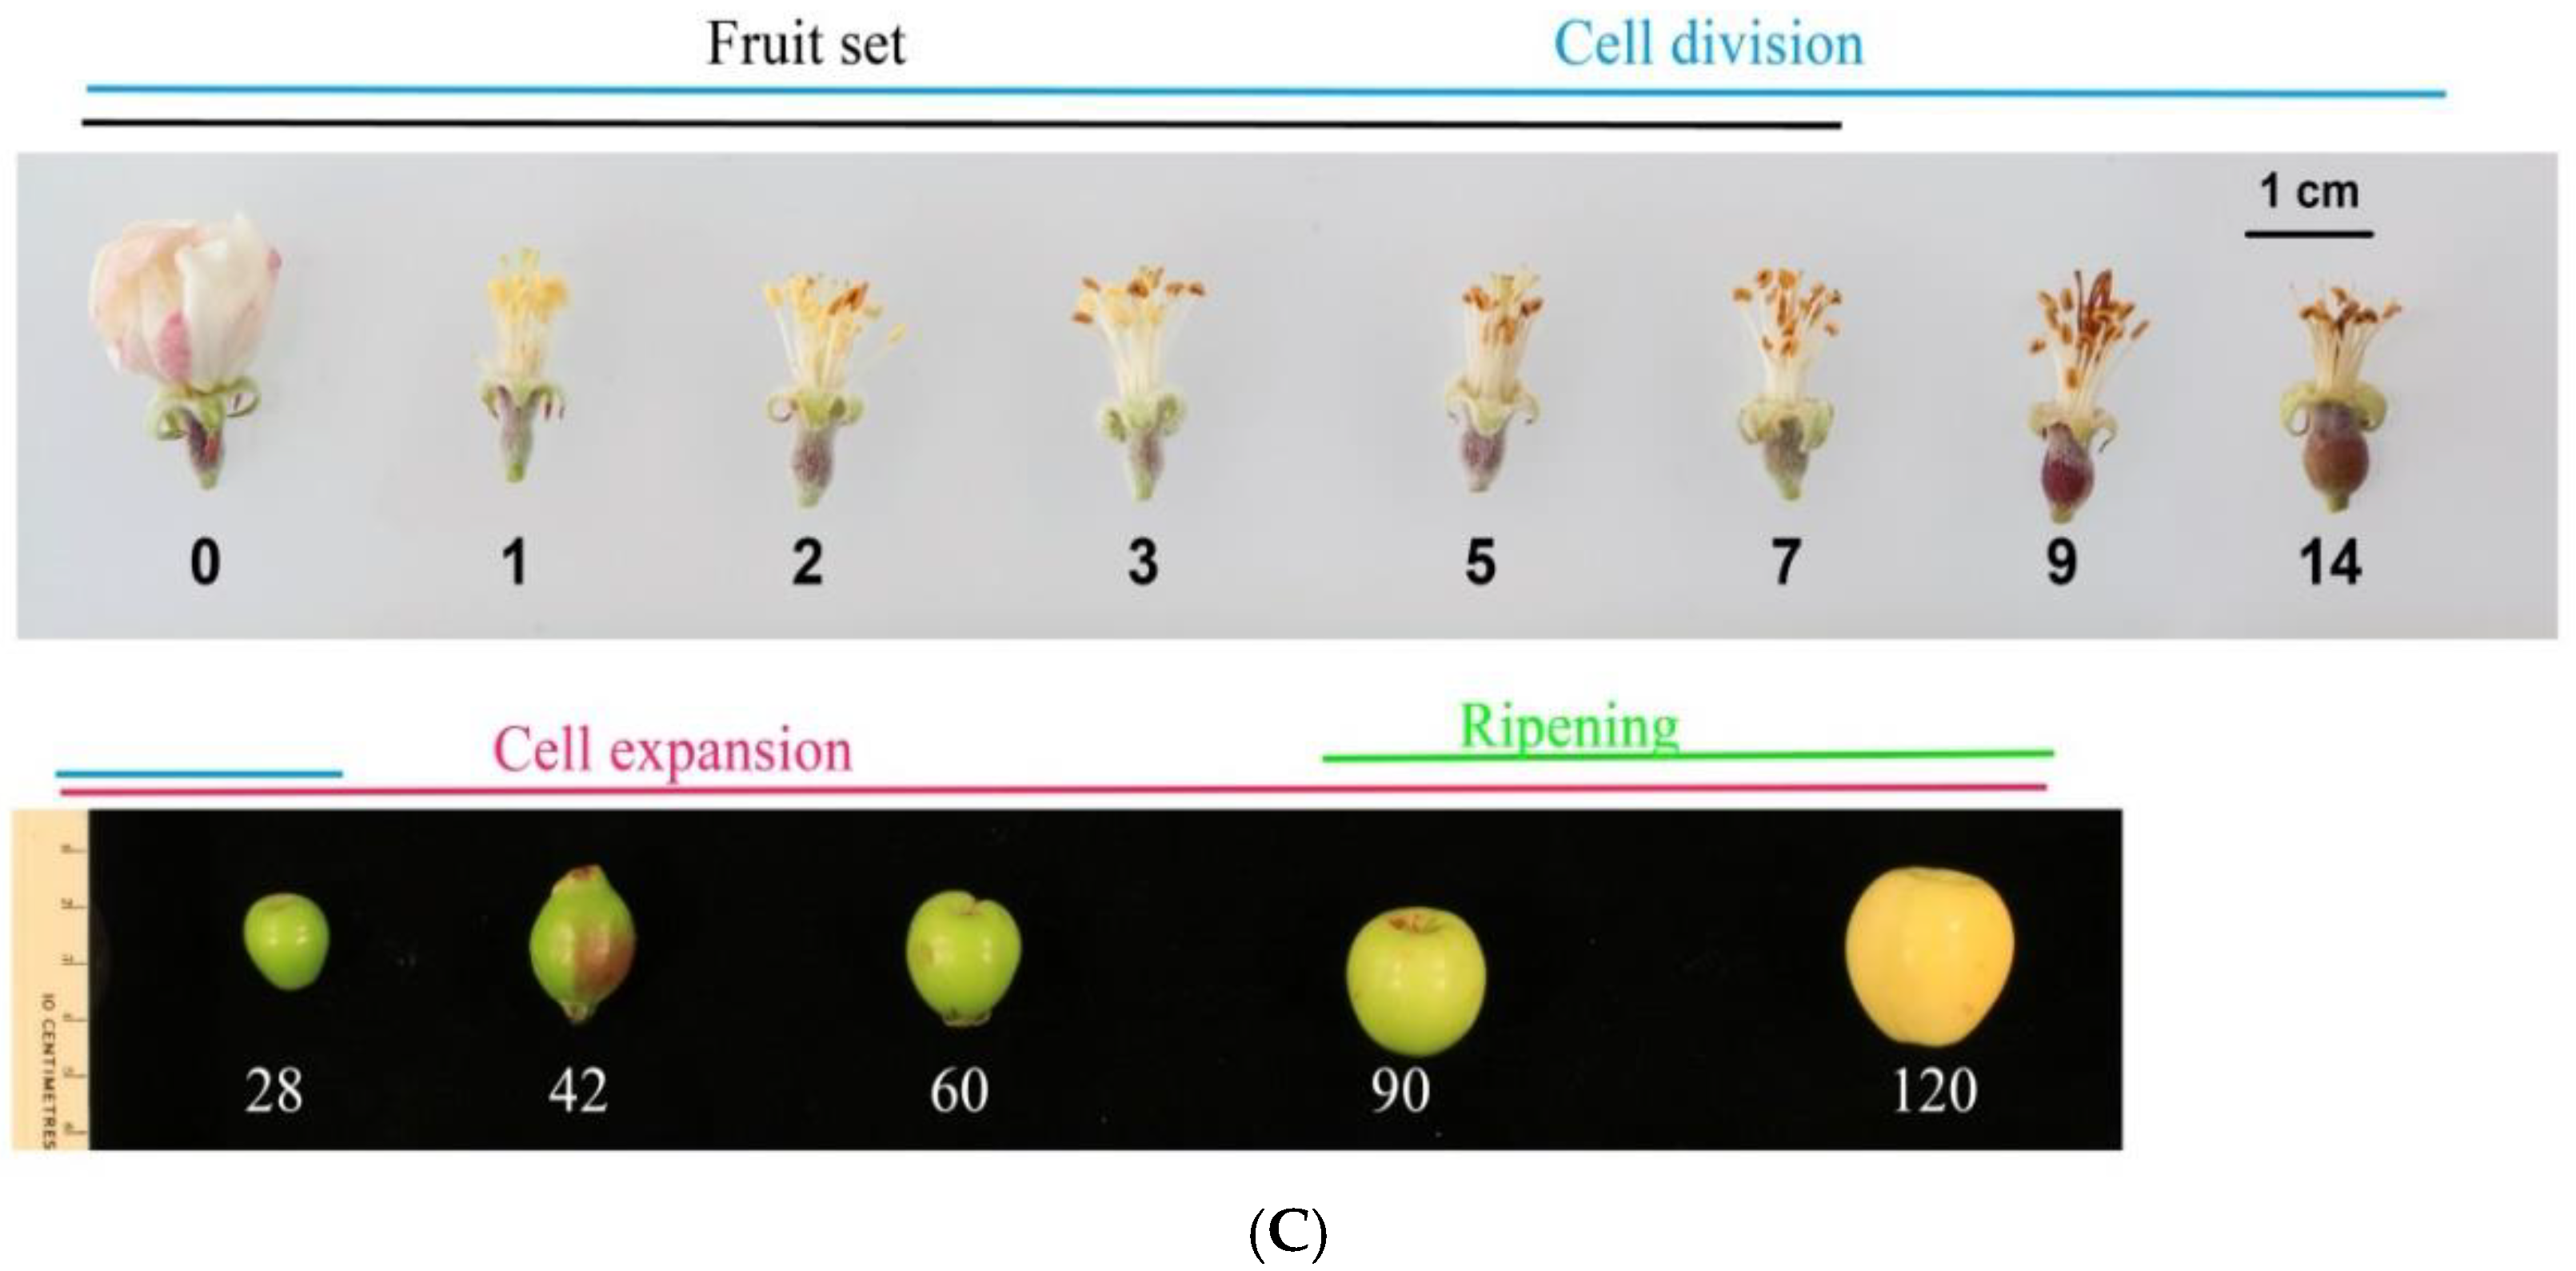
3.1. Cell Coverage Area at before Full Bloom and at Maturity

In this study, fruit development was characterised by its width and cell coverage area measurements (Figure 1A–C). Physiological testing revealed similar hypanthium widths among the three cultivars before full bloom, or at 0 DAFB (Figure 2). As such, the eventual differences in fruit width at maturity (120 DAFB) were instead attributable to differences in total cell number. The Twenty Ounce cultivar experienced a faster growth pace from early to late development, consequently producing the largest fruit compared to the other cultivars (Figure 2). The most rapid period of fruit width gain for Twenty Ounce was the cell expansion stage (42 DAFB to 120 DAFB). This observation indicated that along with cell division, cell expansion was also accountable for the big size of Twenty Ounce. Histology and gene expression studies were subsequently conducted to further support these hypotheses.
During the first experimental season, flowers and fruits were collected at 10 time points from 0 to 120 DAFB. Due to the need for more data from the early developmental stages, the number of collection time points was increased to 12 throughout the second experimental season. The cell coverage area of either the floral hypanthium or fruits was measured. Cell area measurements corroborated these findings as they were similar for all three cultivars along the same time points. Such outcomes were consistently obtained across the two seasons and further showed that cells in all cultivars expand at the same pace throughout fruit development (Figure 3). Microscopy images of the hypanthium showed no significant differences in the cell sizes of the cultivars at either 0 or 120 DAFB (Figure 4).
Crabapple fruits nonetheless grew in size at a slower pace than those of either Royal Gala or Twenty Ounce (Figure 1A–C and Figure 2), the latter of which was the fastest-growing cultivar. This was demonstrated by the exponential size gain of Twenty Ounce after 42 DAFB, consequently producing the largest fruits amongst the three apple variants.

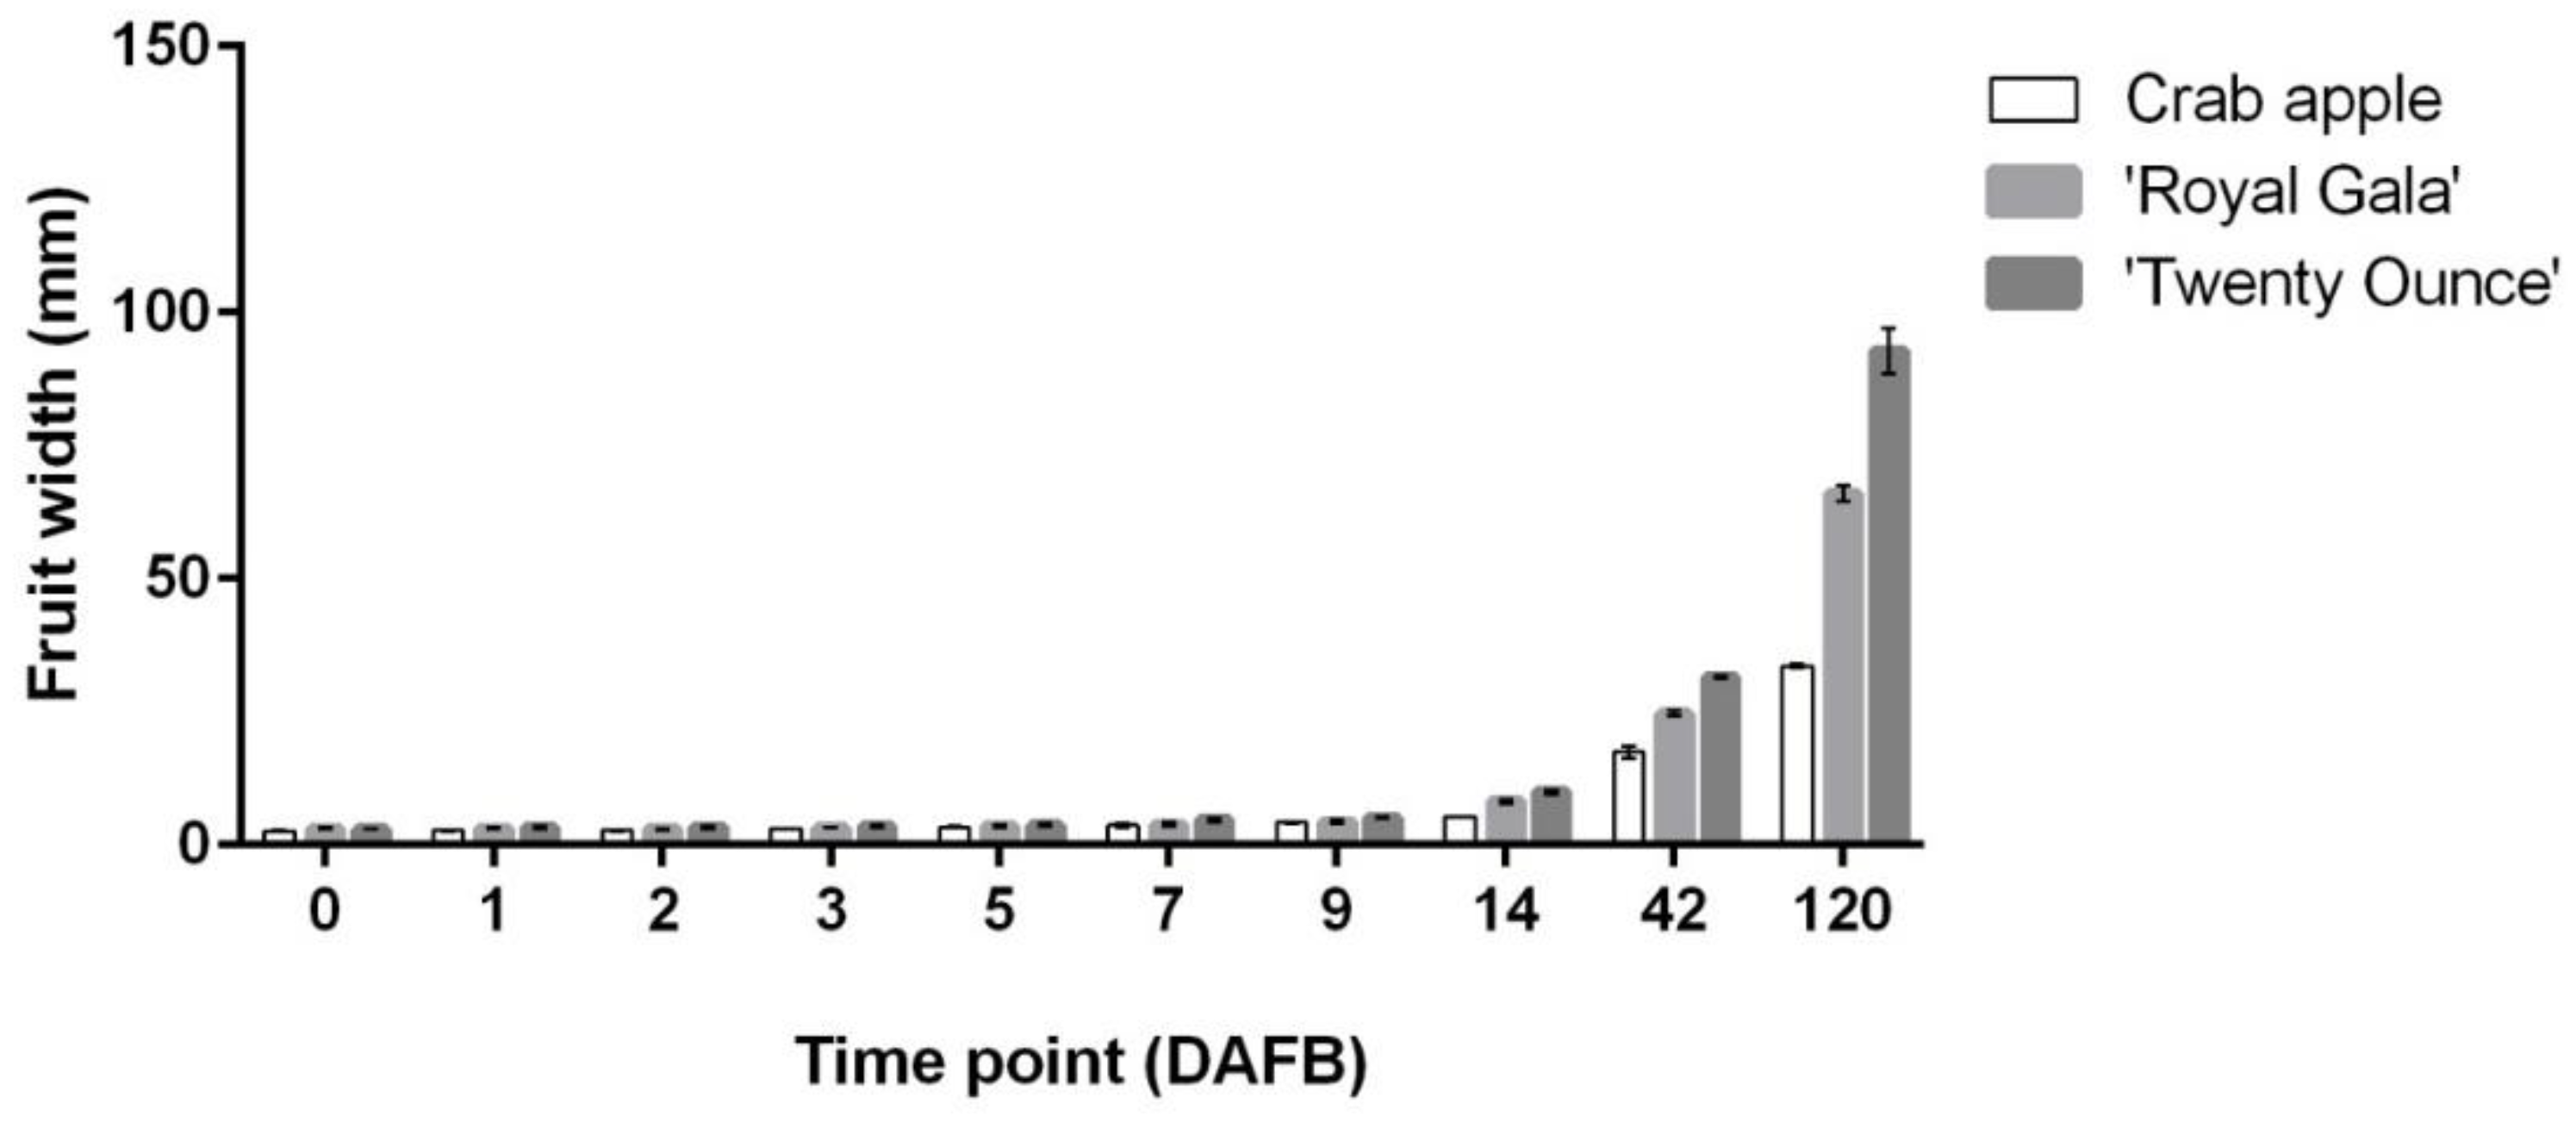
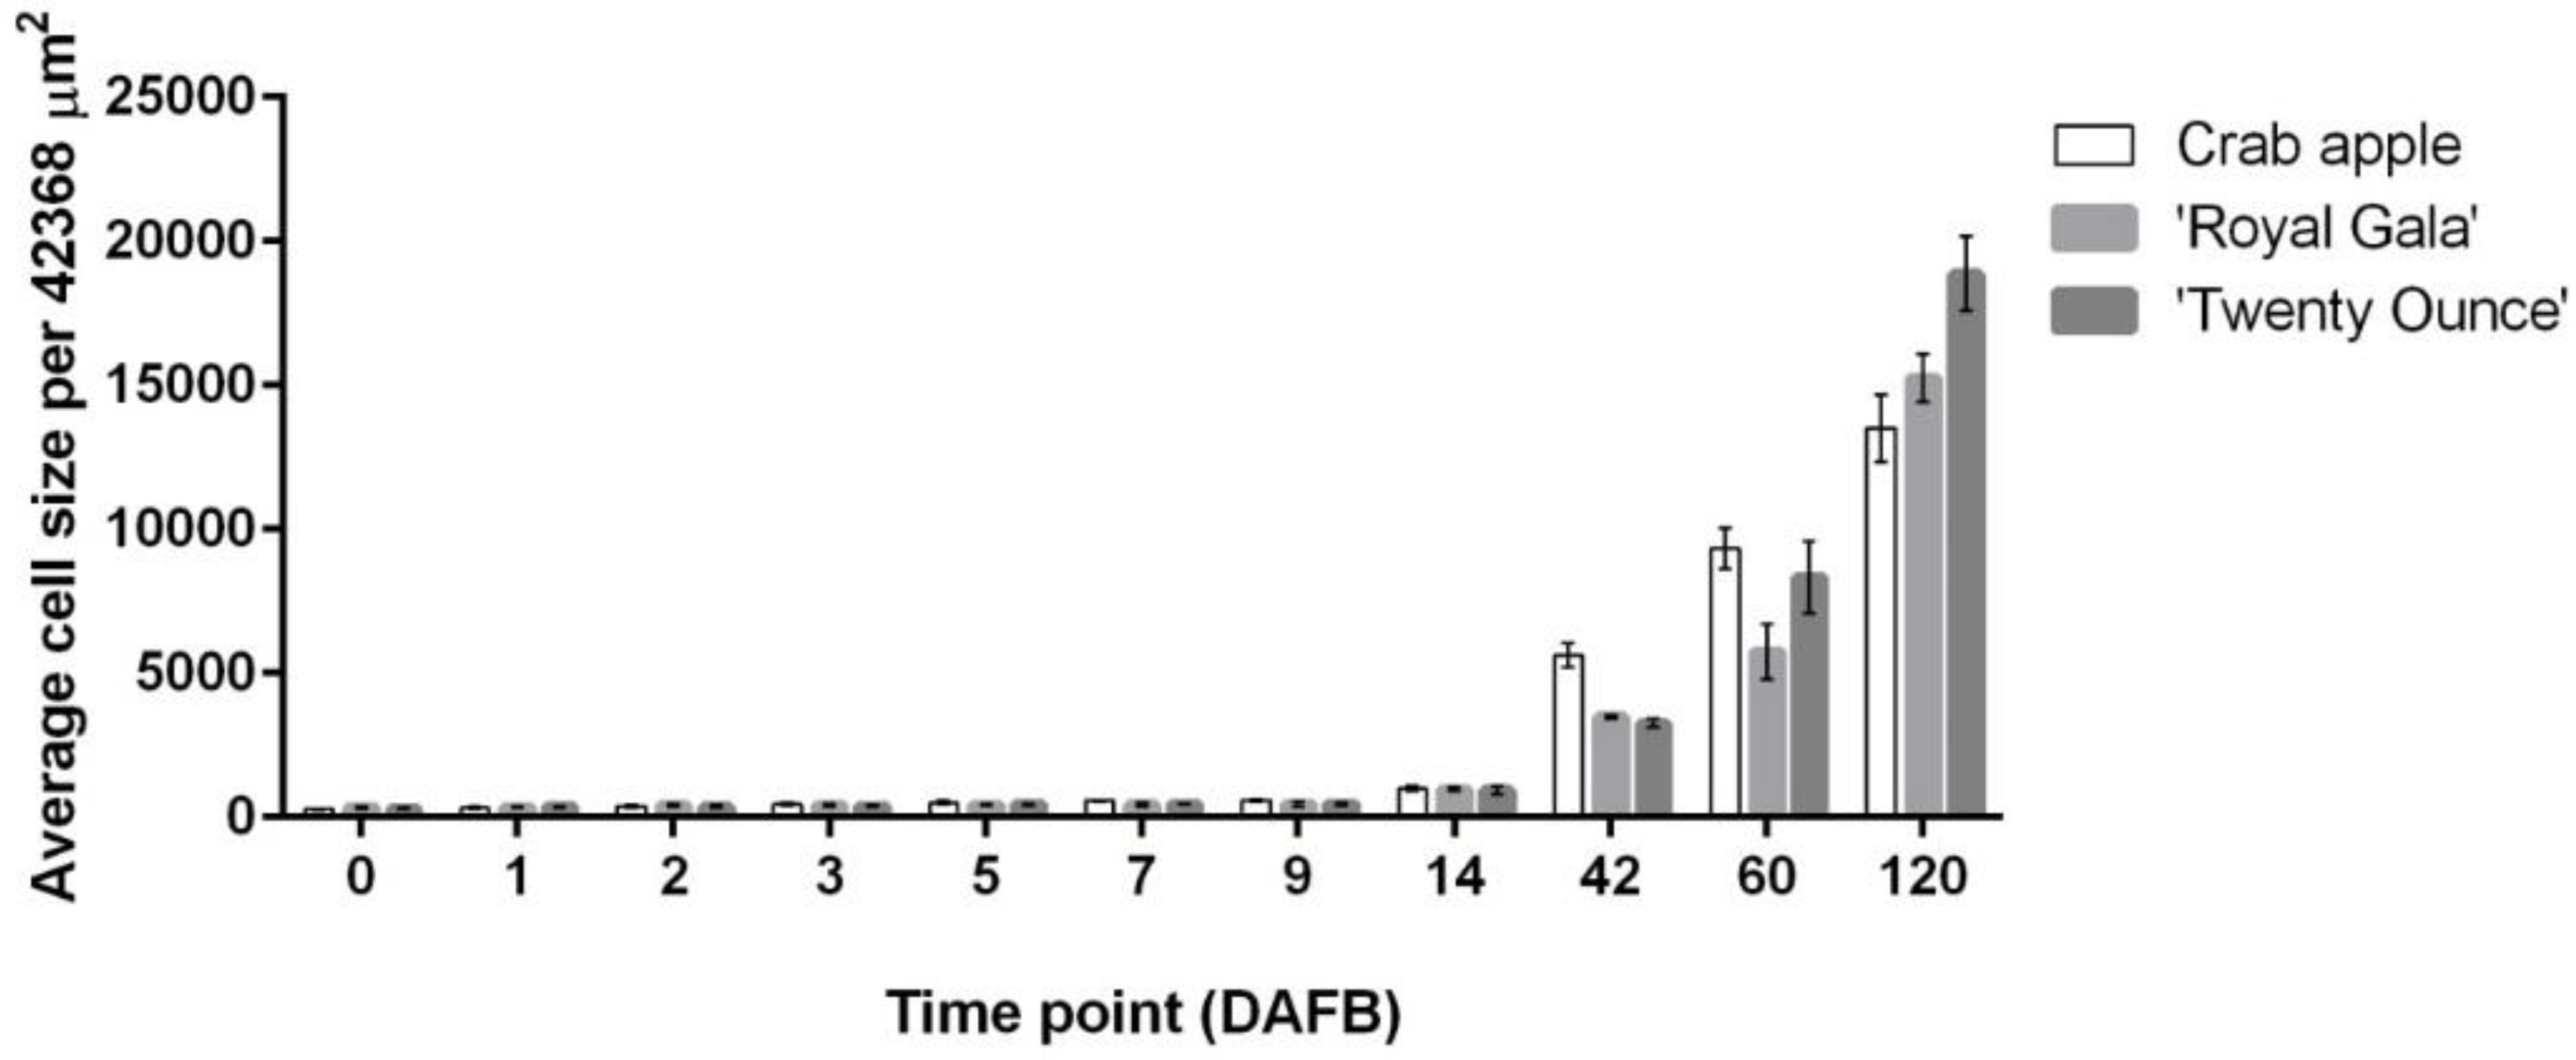
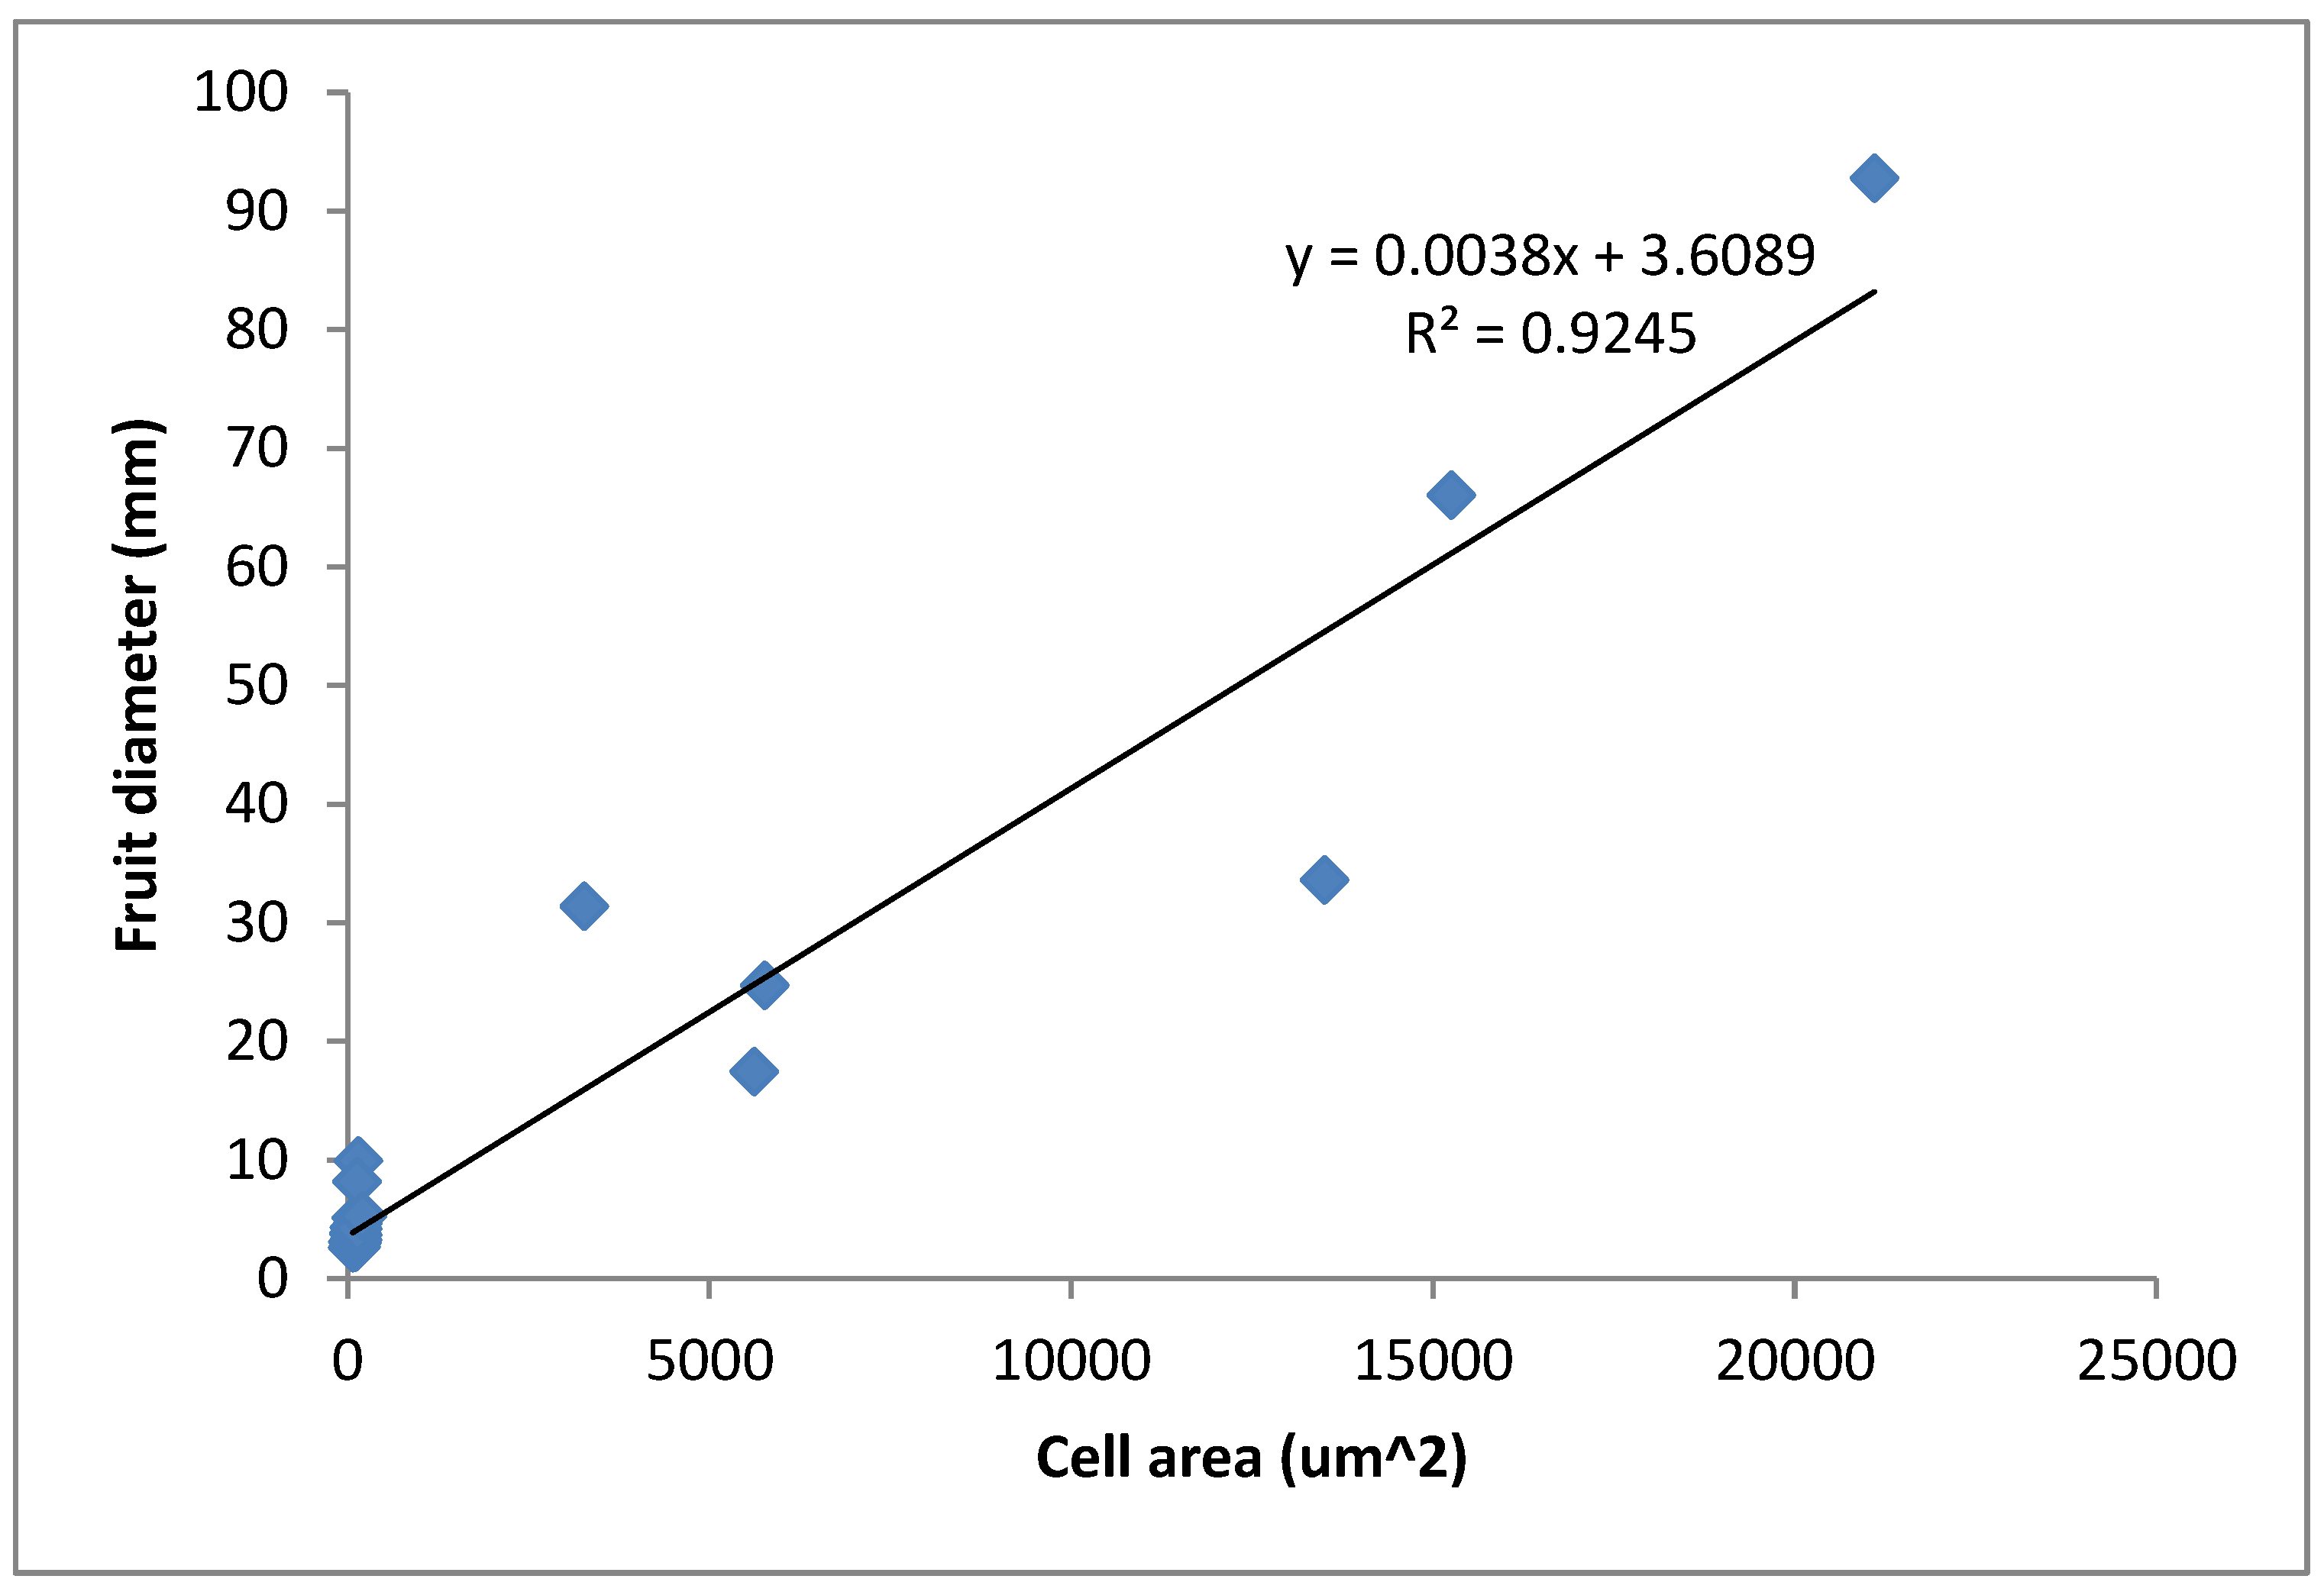
3.2. Relationship between Fruit Diameter, Cell Area, and Cell Number in Three Apple Cultivars

Data collected from Season 2 showed the positive correlation between fruit diameter and cell area among the three cultivars (R2 = 0.9245, p < 0.05 (Figure 5)), an indication of the deterministic influence of cell area on final fruit size. Naturally, cell coverage areas would depend on cell division during early development, as well as cell expansion in the final developmental stages. Both cellular processes have indeed been reported to determine final fruit size [27]. Figure 3 depicts the number of cells counted within a set image area of 42 × 103 μm2. The graph shows an inverse relationship between cell coverage area and cell numbers towards late development, whereby cell numbers were decreased despite an expansion of the cell area (Figure 5). Collectively, these results indicated that whilst cell division occurs rapidly in the early stages, it is gradually overtaken by cell expansion as fruit development progresses into the late stages.

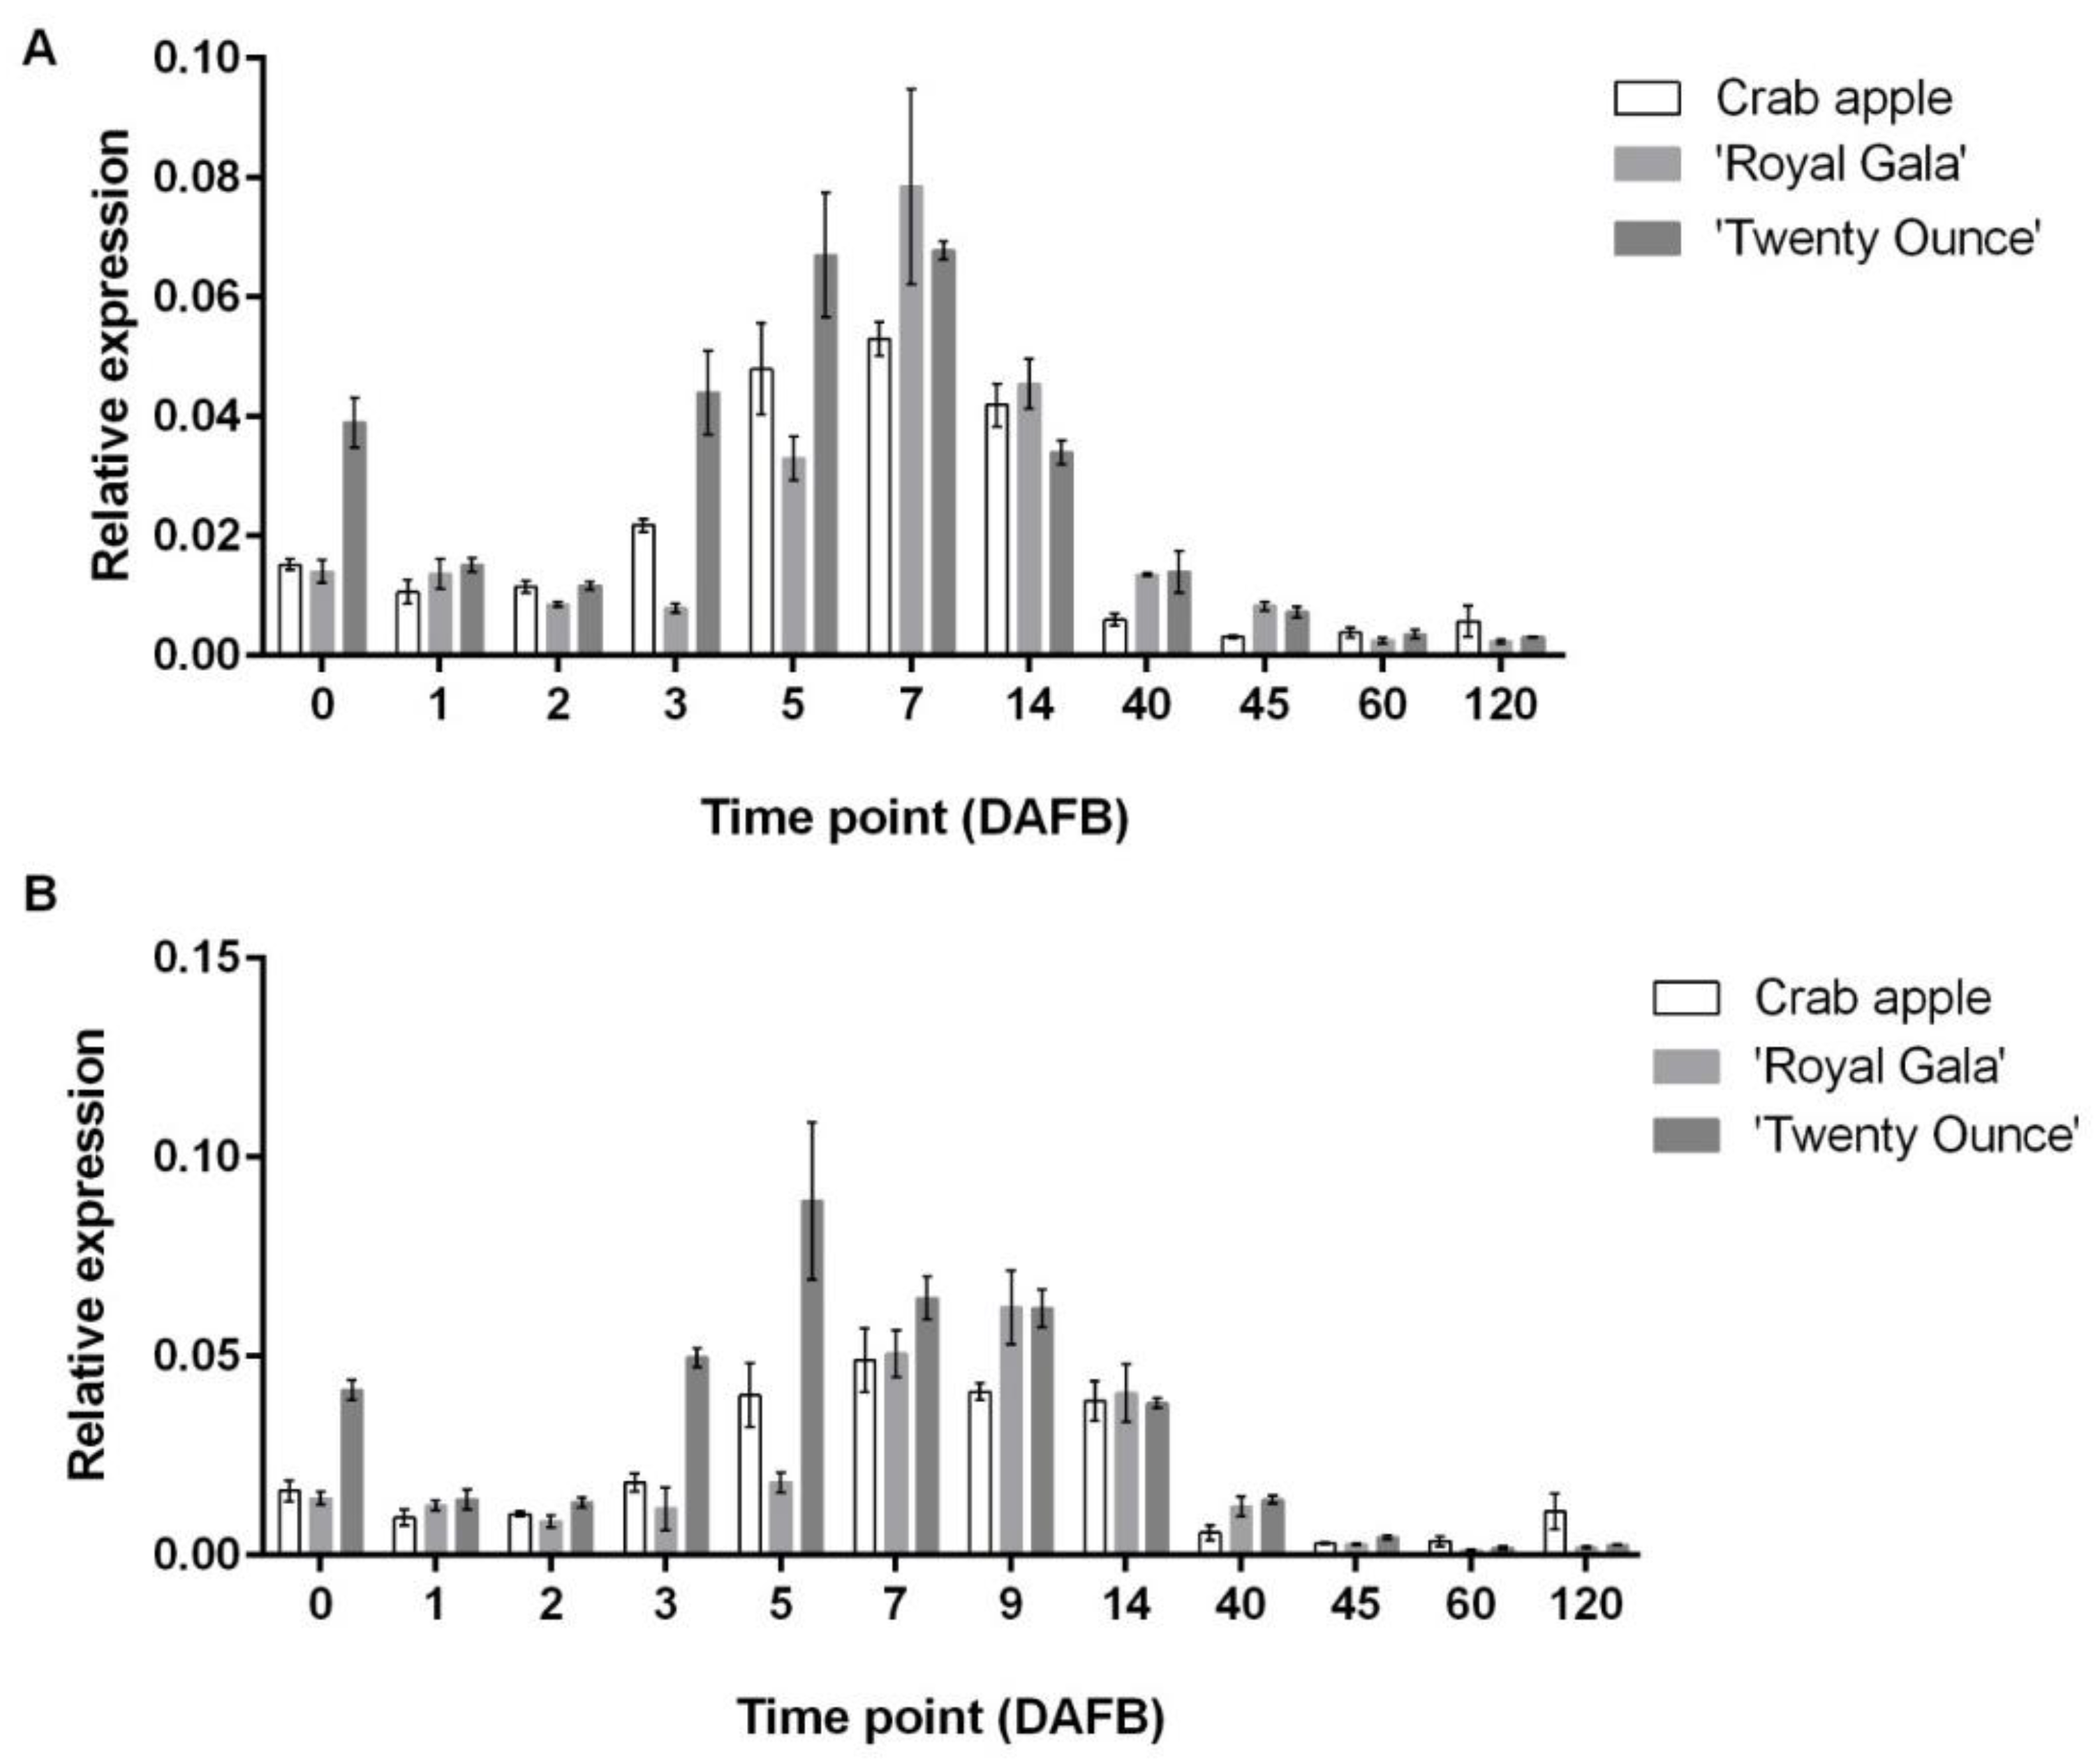
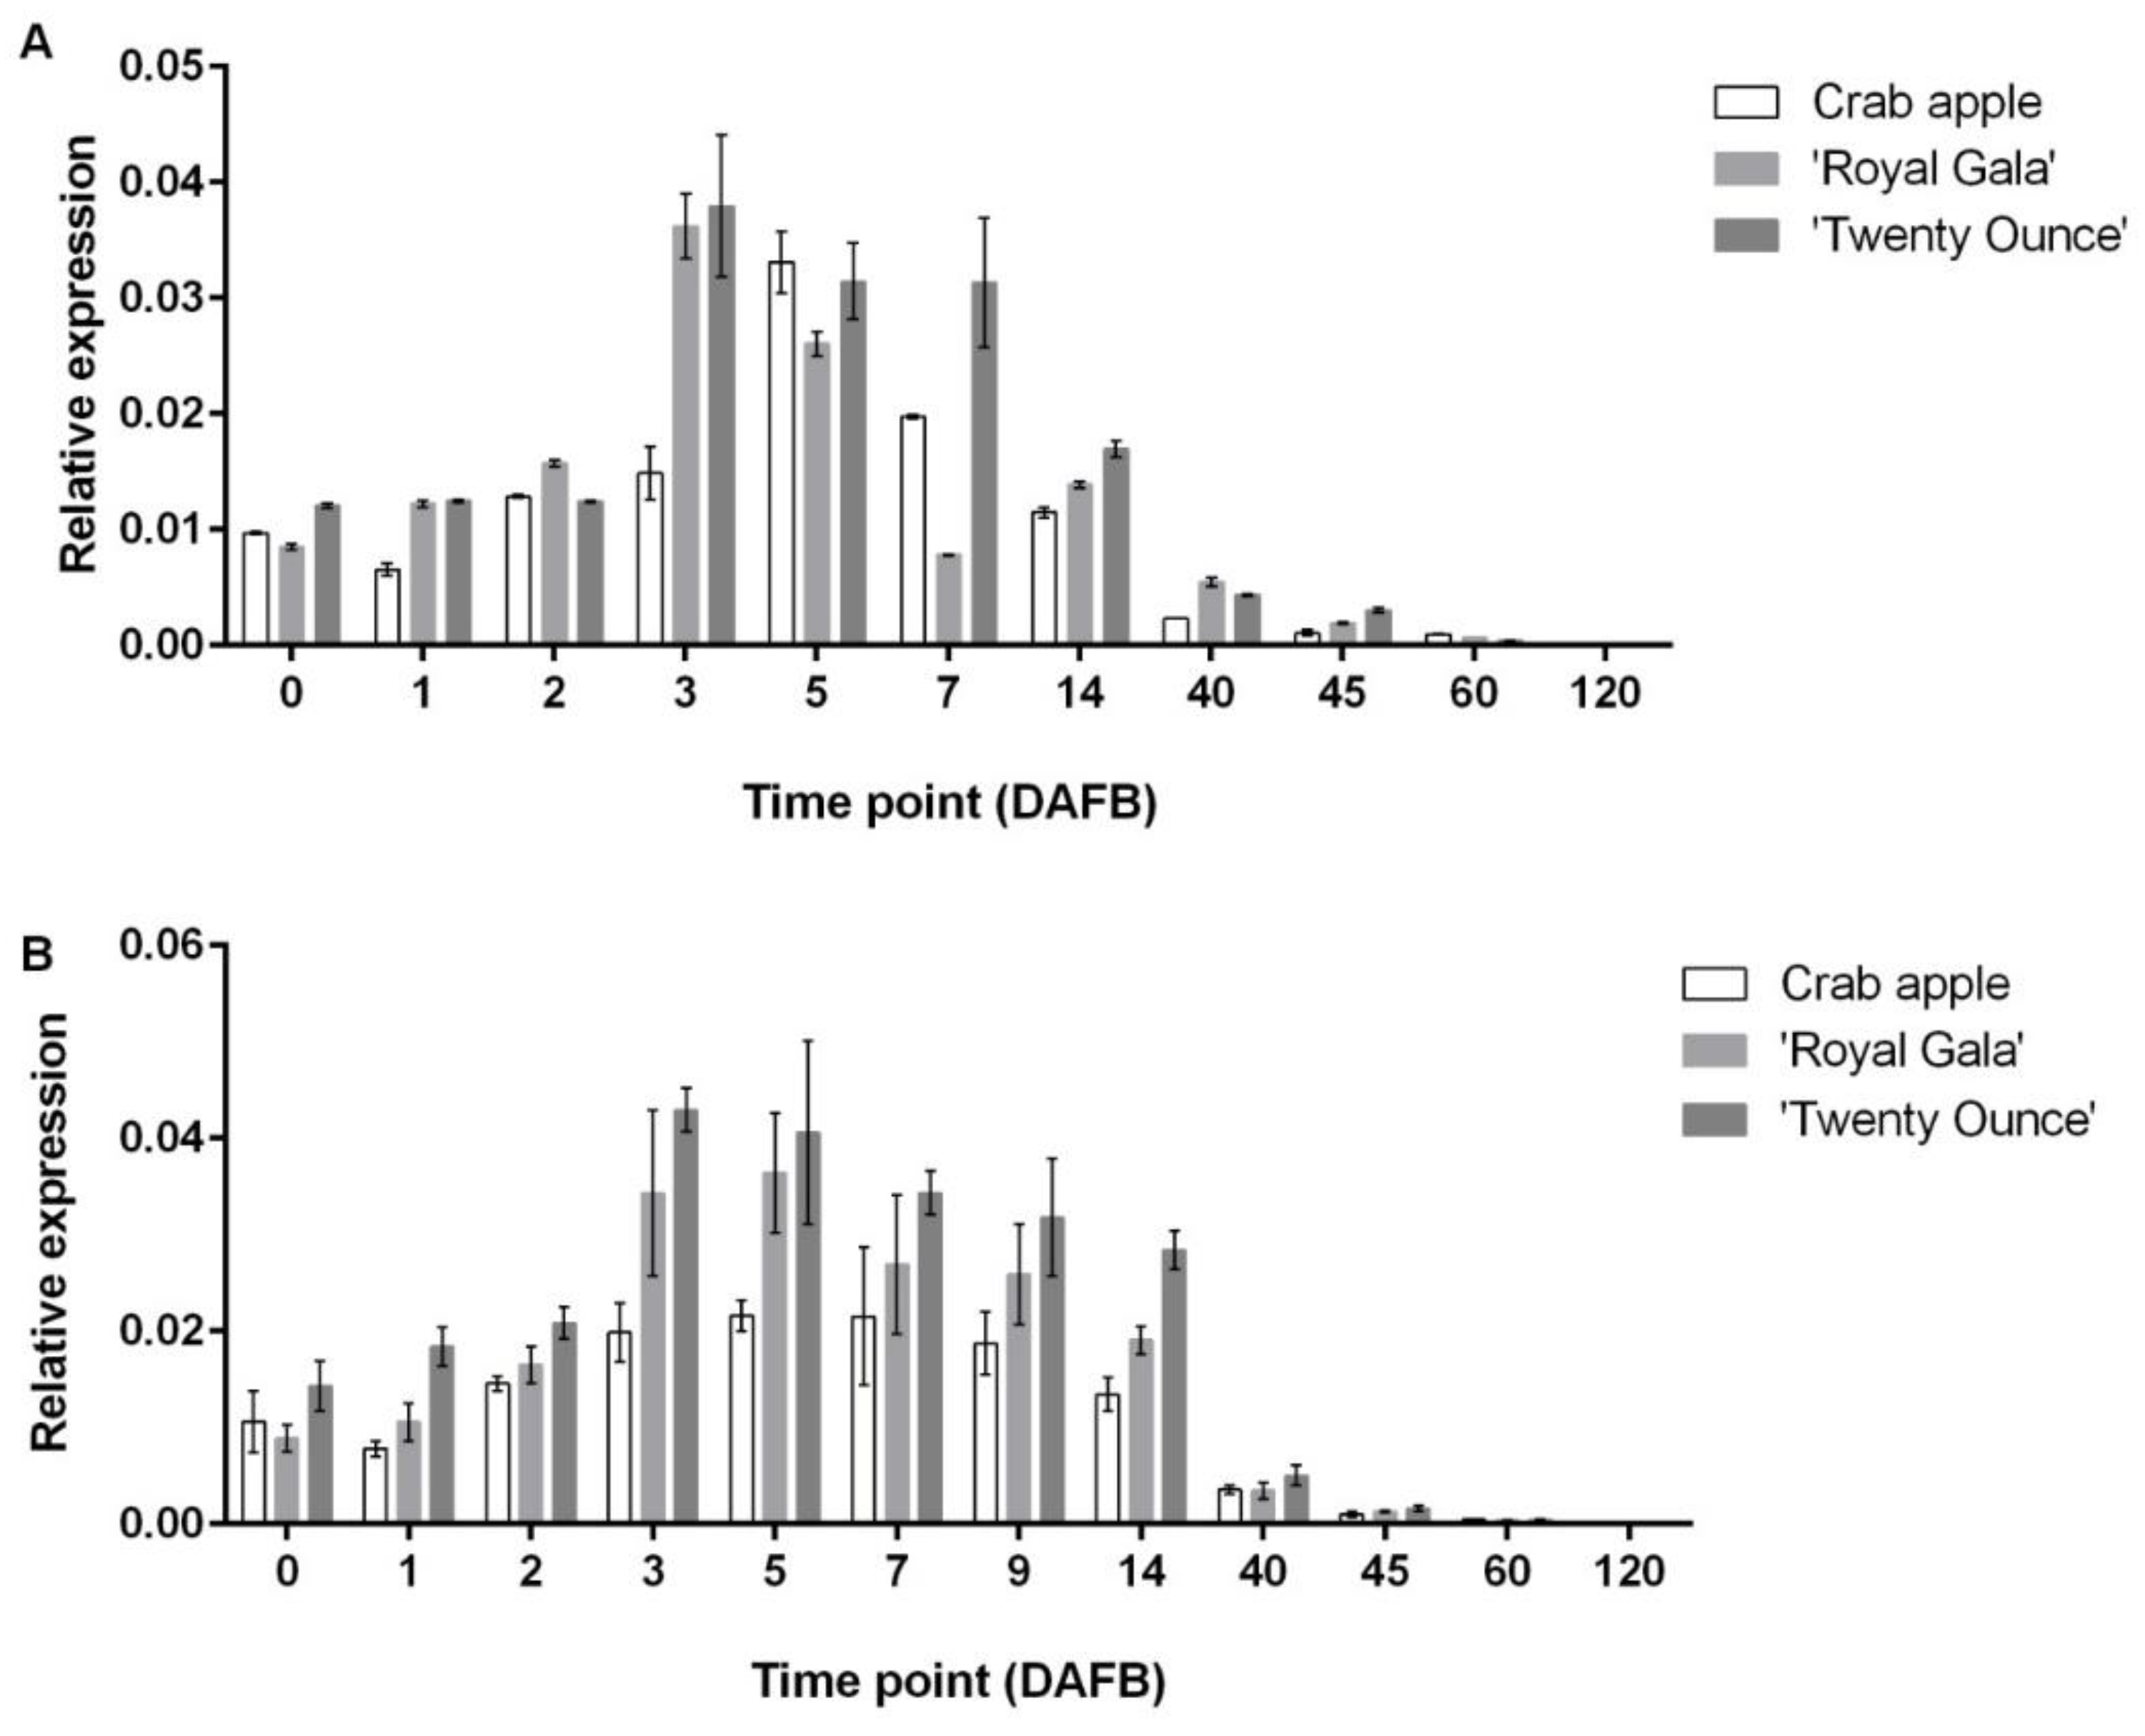
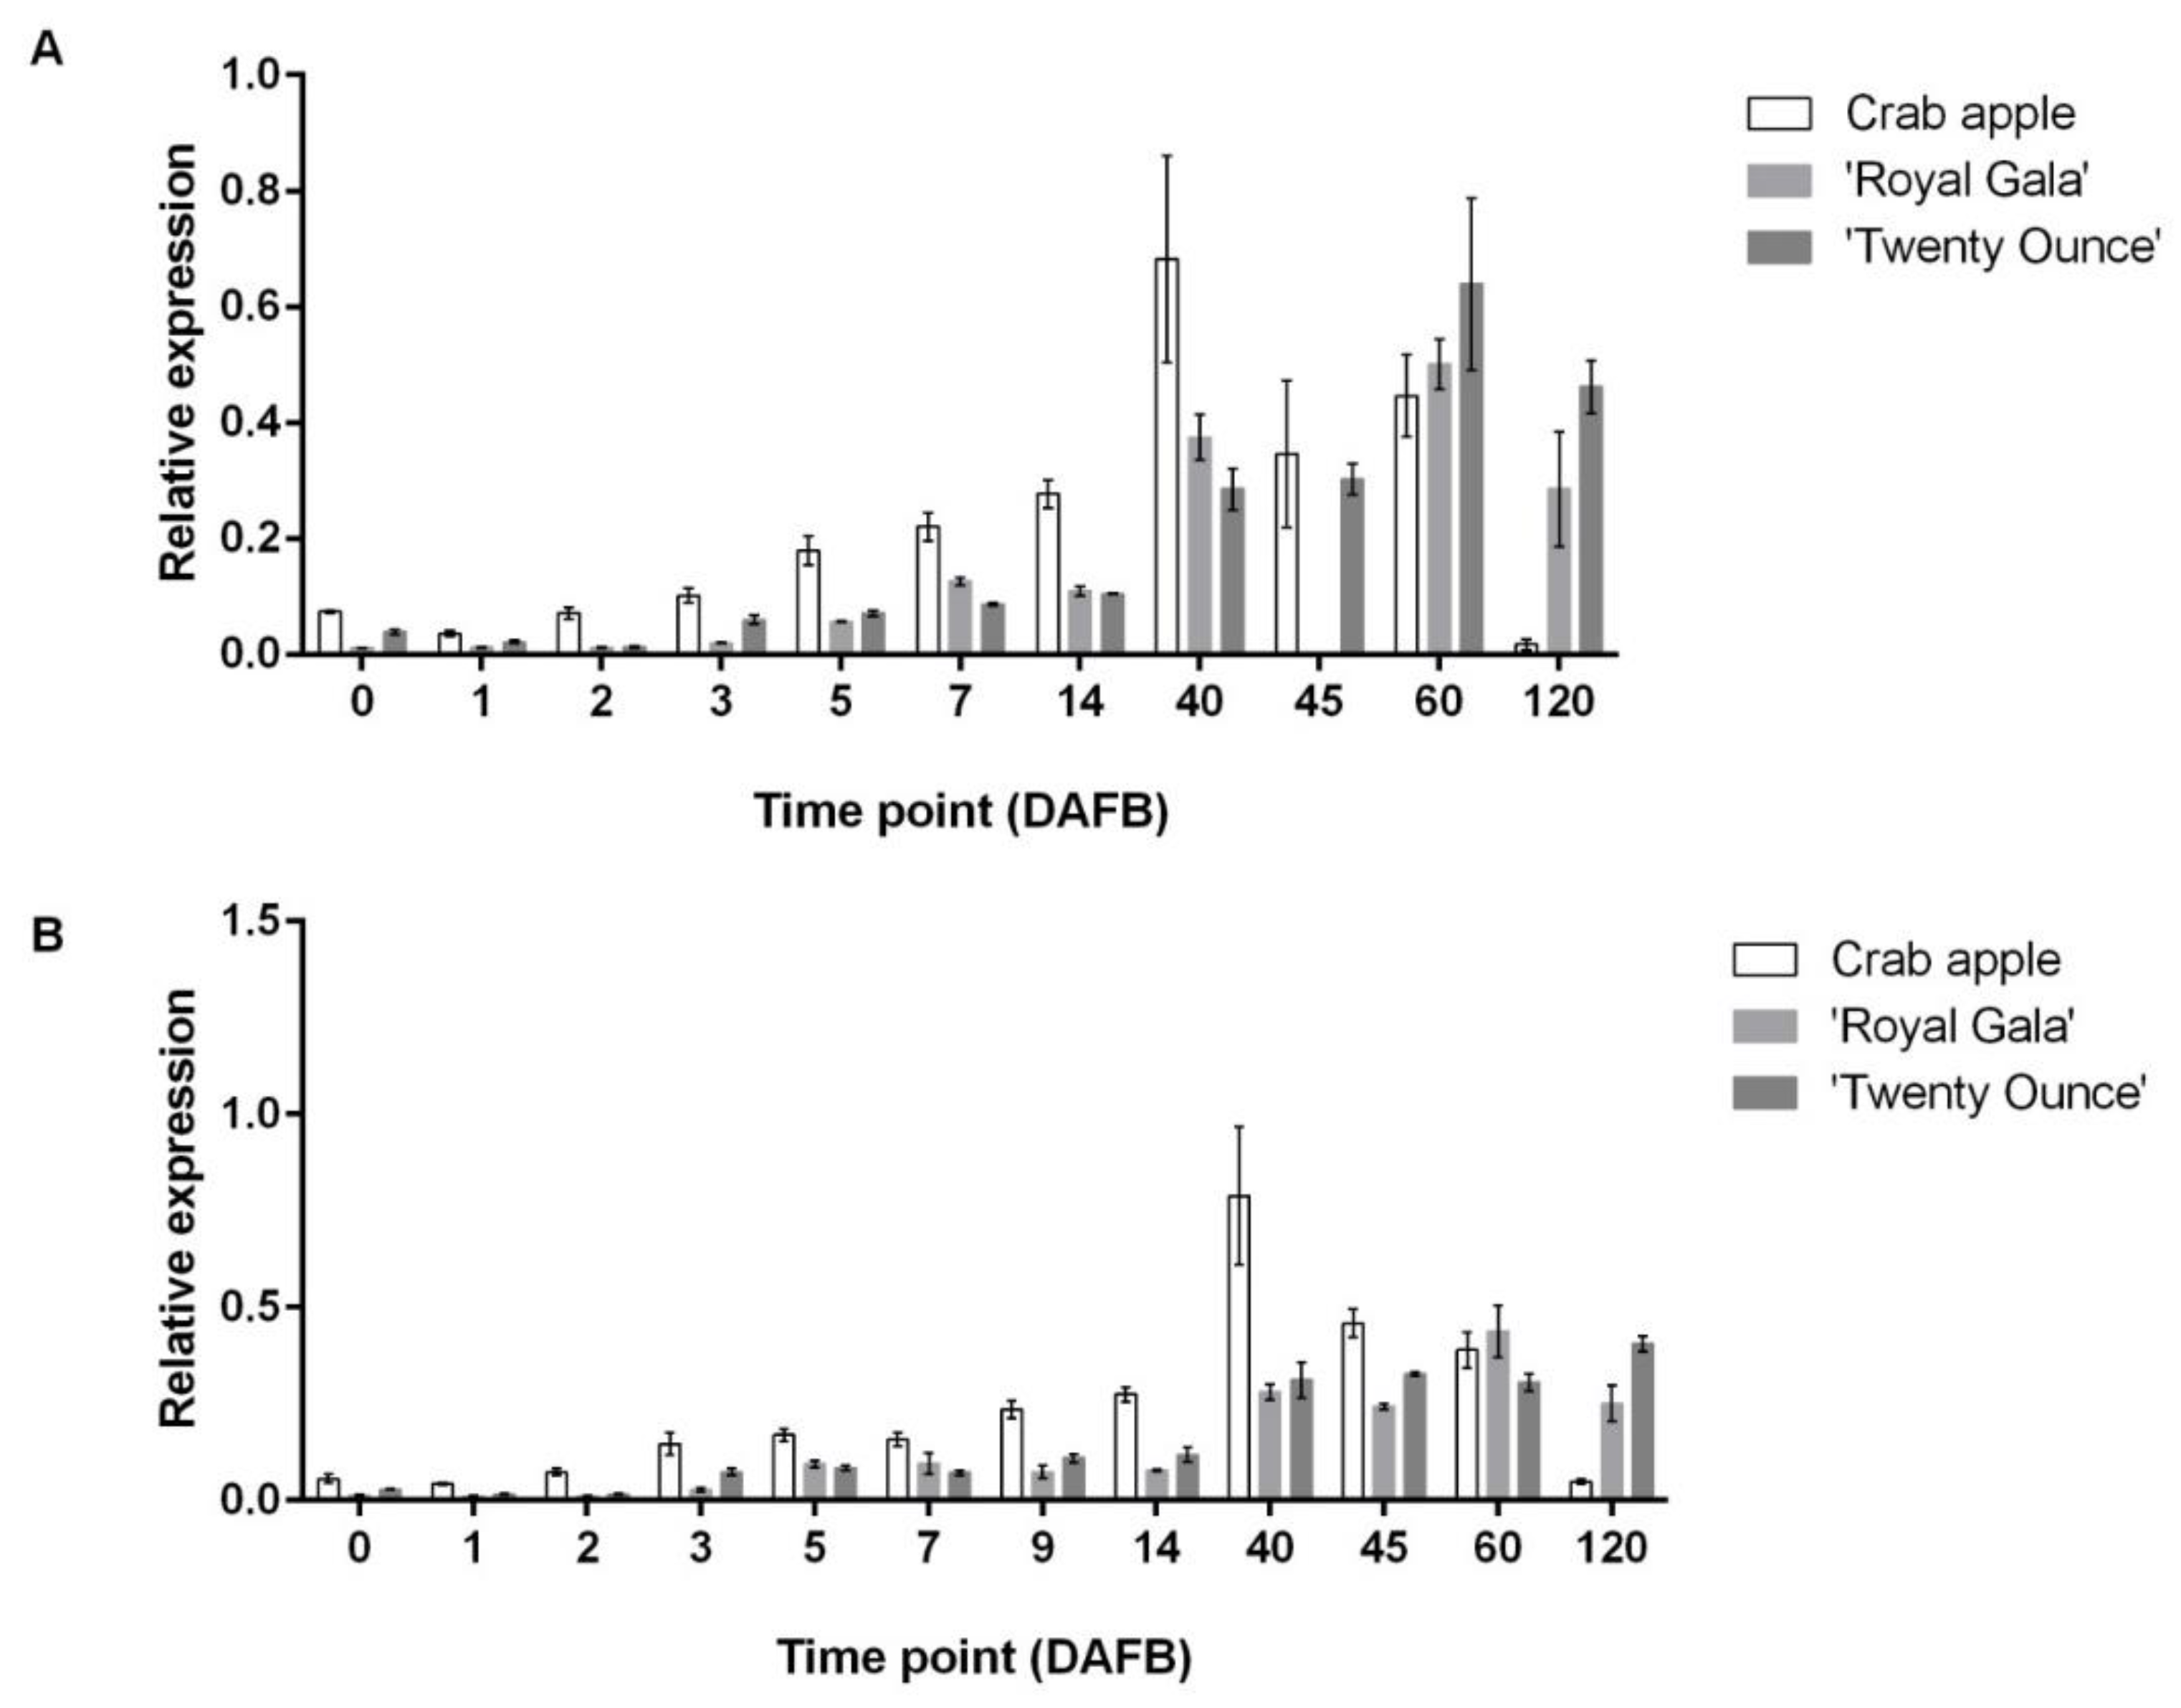
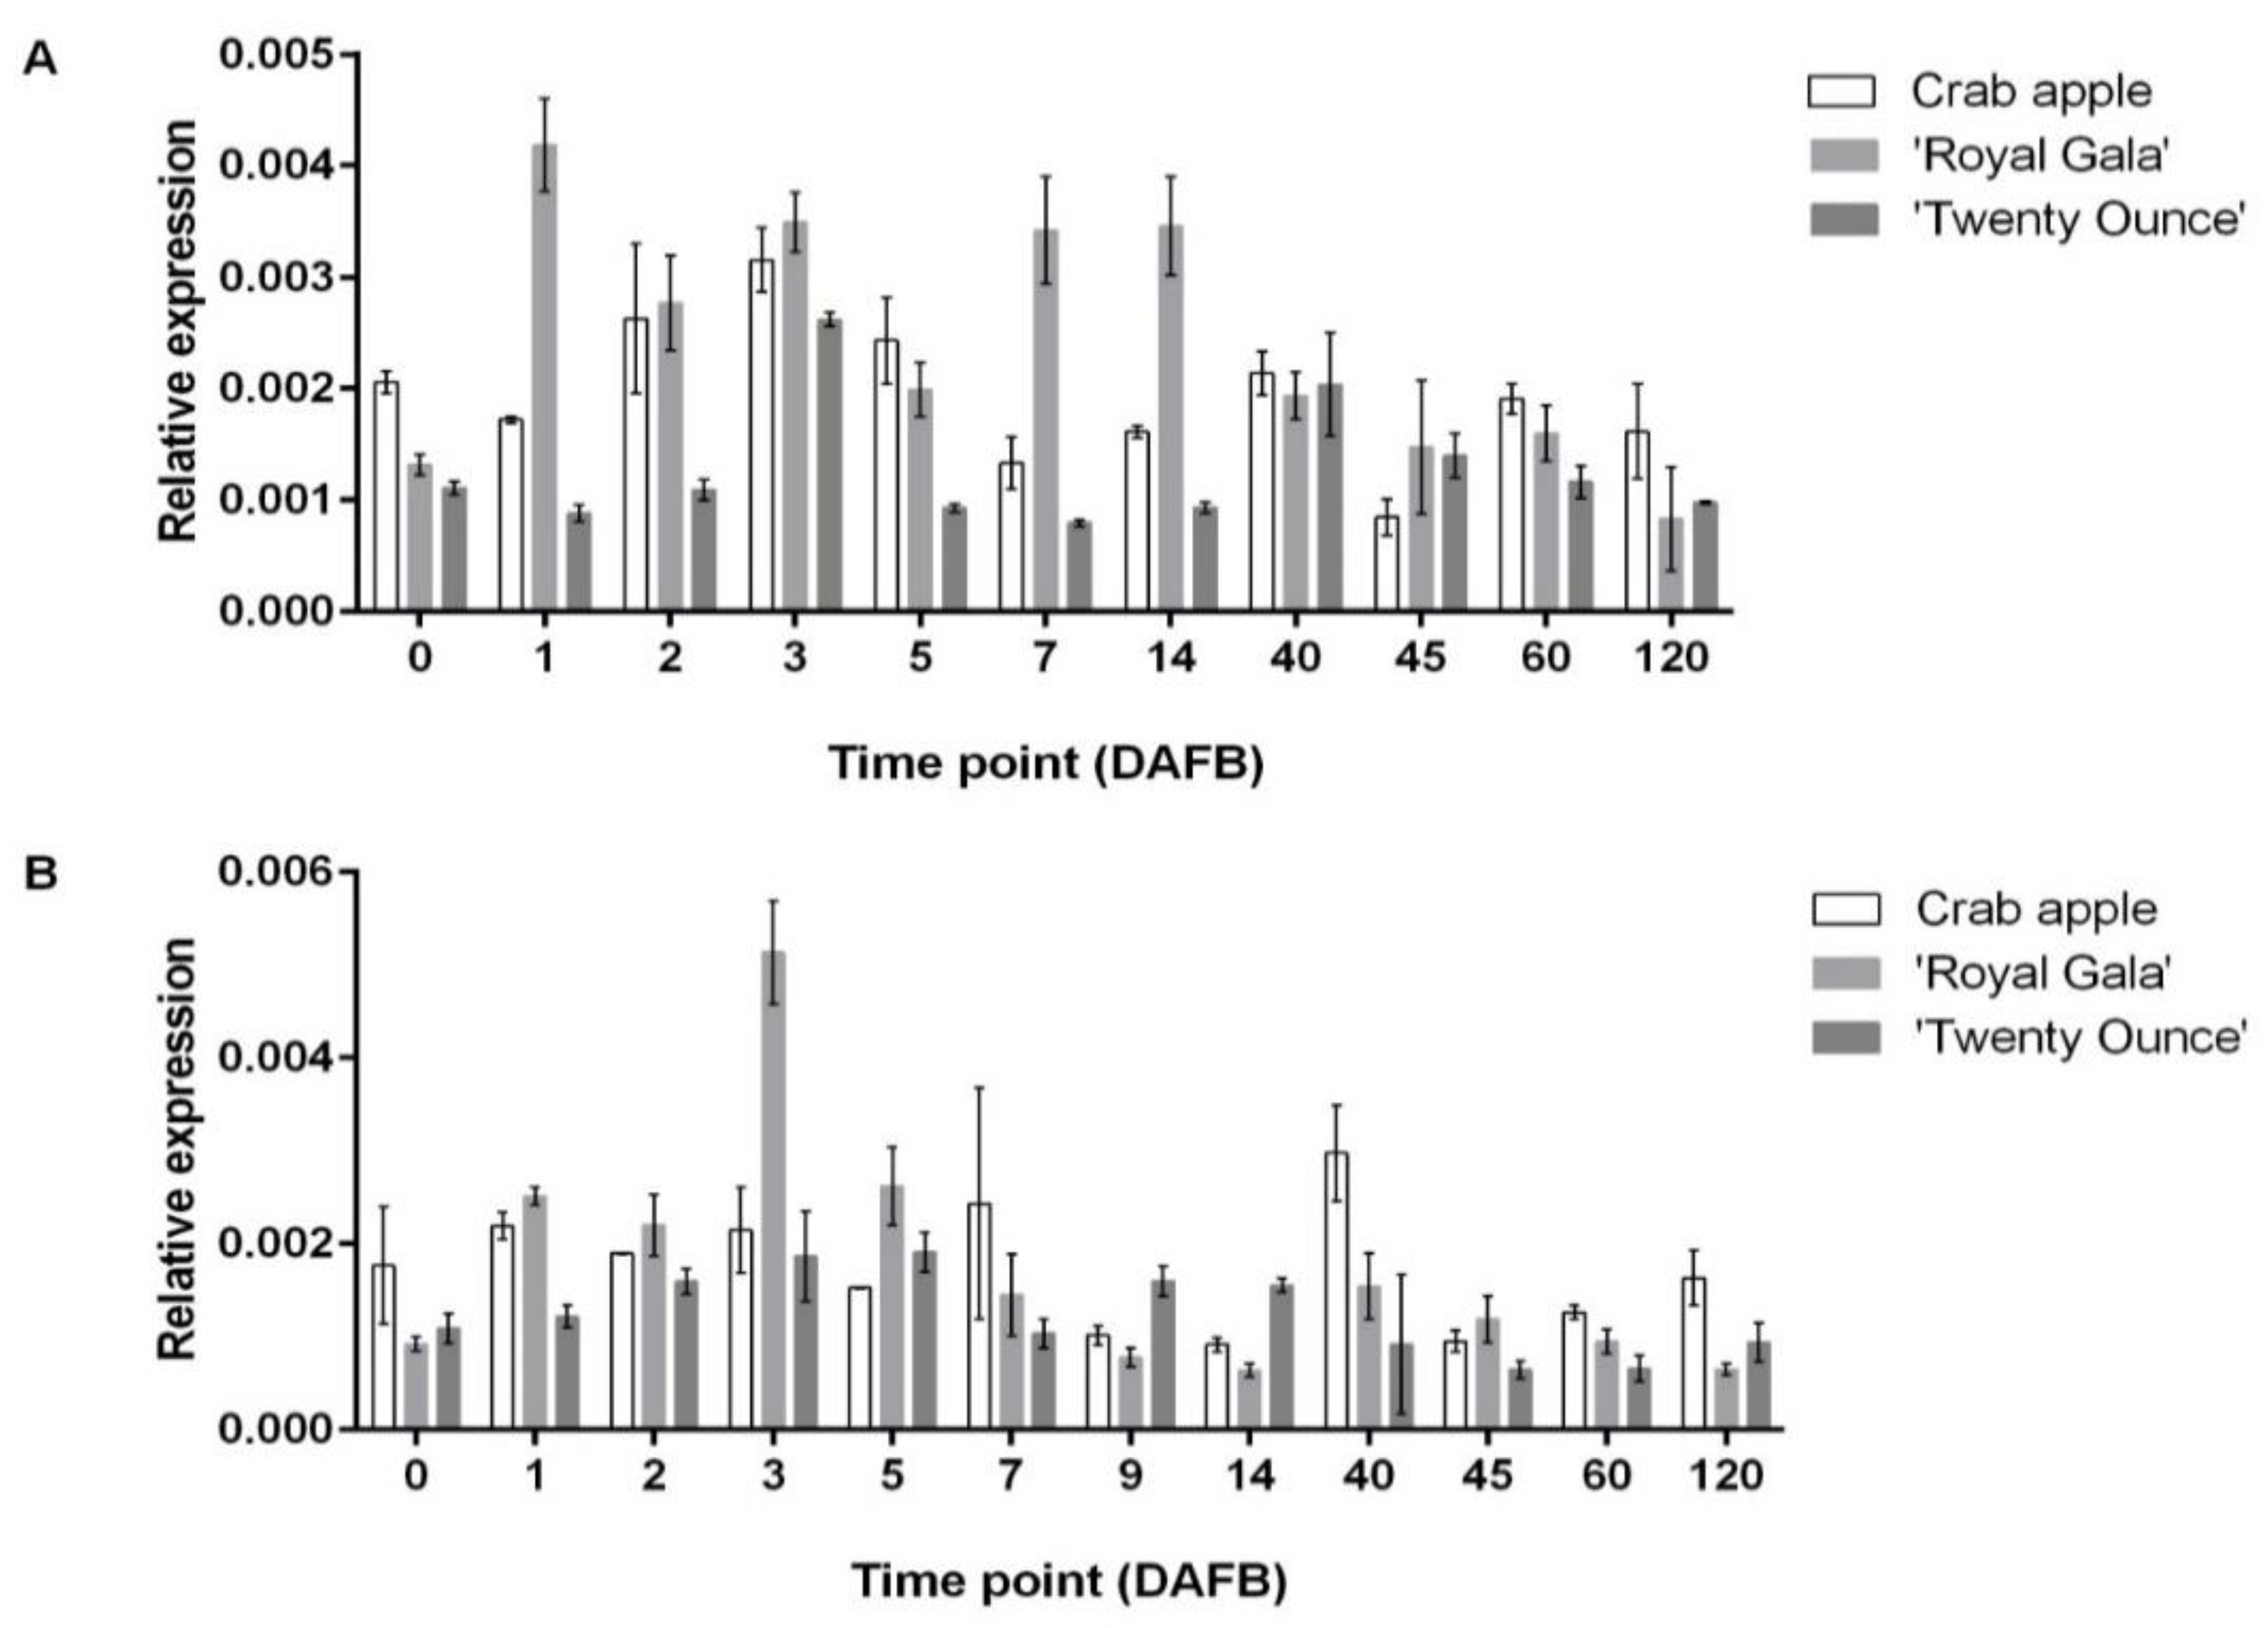
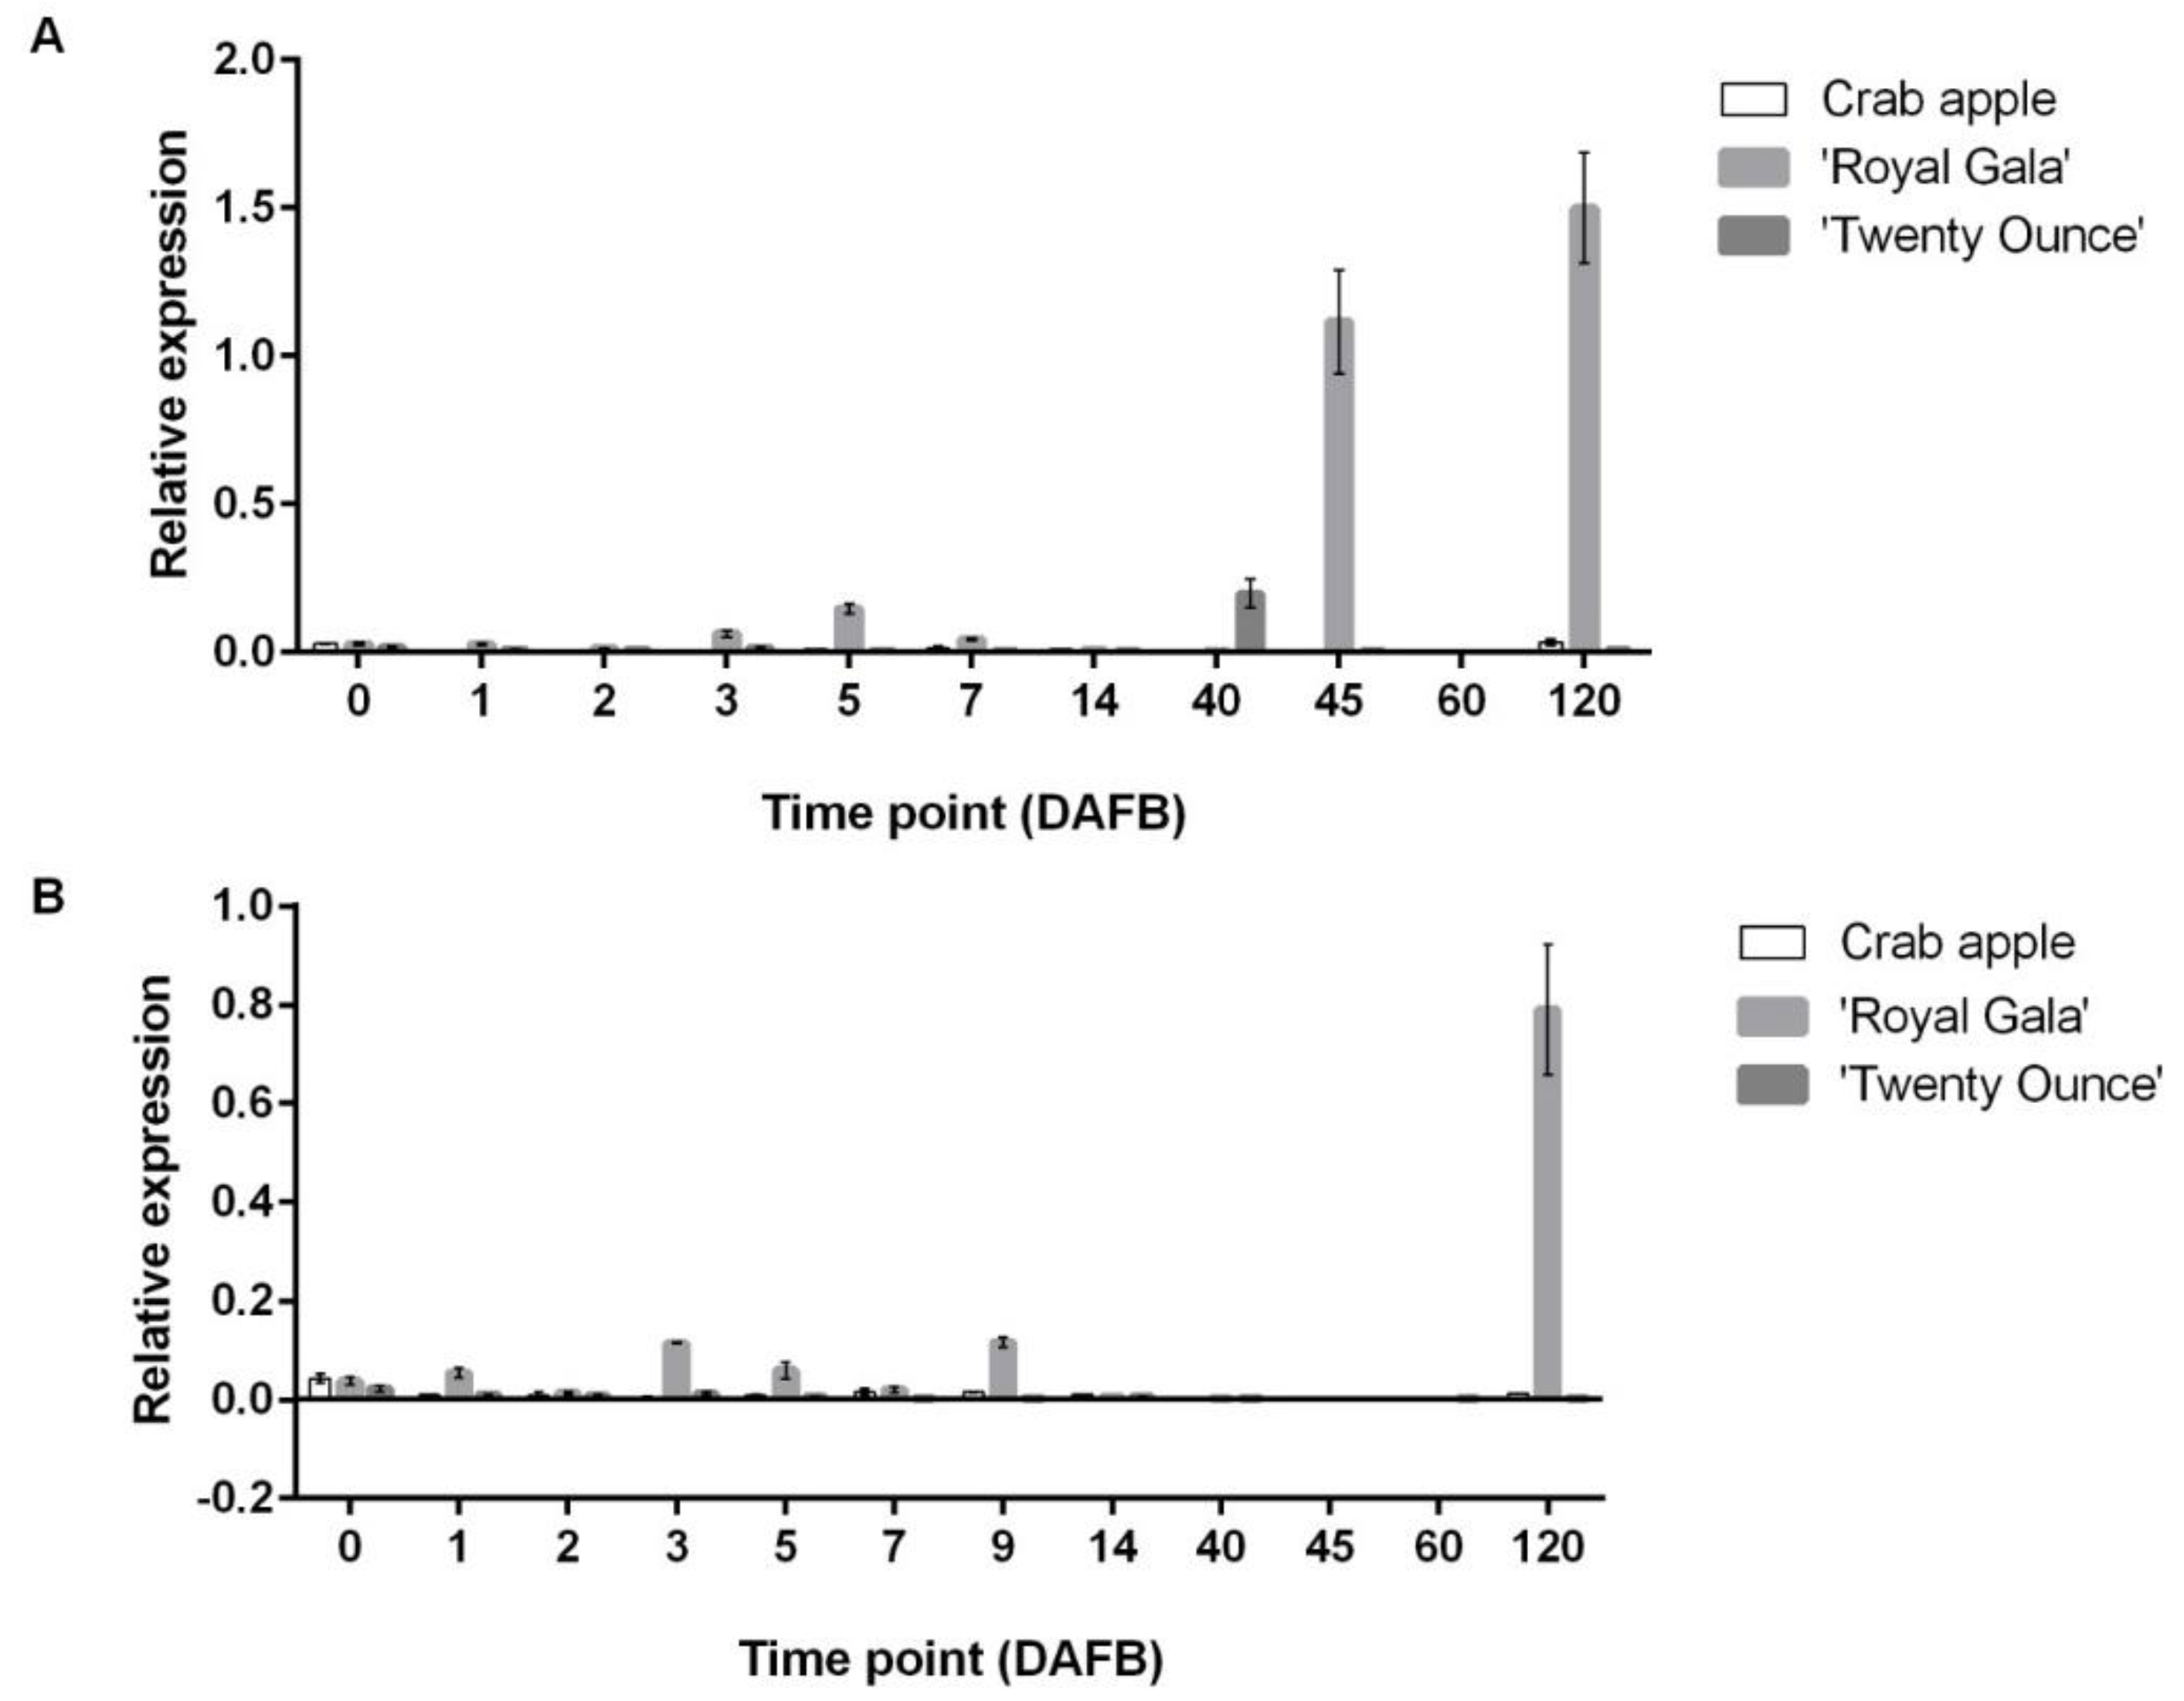
3.3. Comparison of Expression Patterns among Three Cultivars

Preliminary testing on samples harvested during Season 1 (data not shown) found that MdCDKB2;2 was upregulated during early development, but was downregulated afterwards. In preparation for Season 2, flowers from the Twenty Ounce, Royal Gala, and Crabapple cultivars were again hand-pollinated and harvested. The time course was changed slightly to include narrower intervals within the earlier stages of fruit development. Gene expression analyses were conducted with RNA samples derived from two biological replicates for all three cultivars, referred to as Rep1 and Rep2. As anticipated, a similar expression pattern was observed in Season 2 replicates where MdCDKB2;2 was highest in Twenty Ounce during early development (Figure 6). The cultivar displayed the most significant surges in MdCDKB2;2 expression at 0, 3, and 5 DAFB.
The expression pattern of MdANT2, a second cell division gene, was then found to be similar to that of MdCDKB2;2. Though expressed highly in the earlier time points, Figure 7 demonstrates the distinct downturn of MdANT2 in the later stages. Similar to MdCDKB2;2, MdANT2 expression was also the greatest in the big-sized Twenty Ounce, followed by the middle-sized Royal Gala and the small Crabapple.
Season 1 testing of MdEXP3 expression in Royal Gala flowers and fruits revealed its high levels during the cell expansion stages. In Season 2 (Figure 8), MdEXP3 was most prominently found in Crabapple throughout the earlier stages. By contrast, Twenty Ounce expressed the highest levels of the cell expansion gene only as the fruit approached maturity (120 DAFB). These observations importantly signified that although each cultivar may do so in a temporally dissimilar manner, the cells of its fruit would nevertheless undergo the expansion process; this explains why all cultivars produced similar cell sizes before full bloom (0 DAFB) and at full ripening (120 DAFB).
More anomalous outcomes were derived from gene expression analyses of two genes, namely MdARF106 and MdACO1. The transcription factor MdARF106 was highly expressed throughout the time course and without significant differential expression among cultivars, an implication of its role as a facilitator rather than a driver of both the cell division and expansion stages (Figure 9). The ripening marker MdACO1 was then shown to be strongly produced in Royal Gala over the ripening period. Unexpectedly, MdACO1 was almost absent from the other two cultivars (Figure 10).

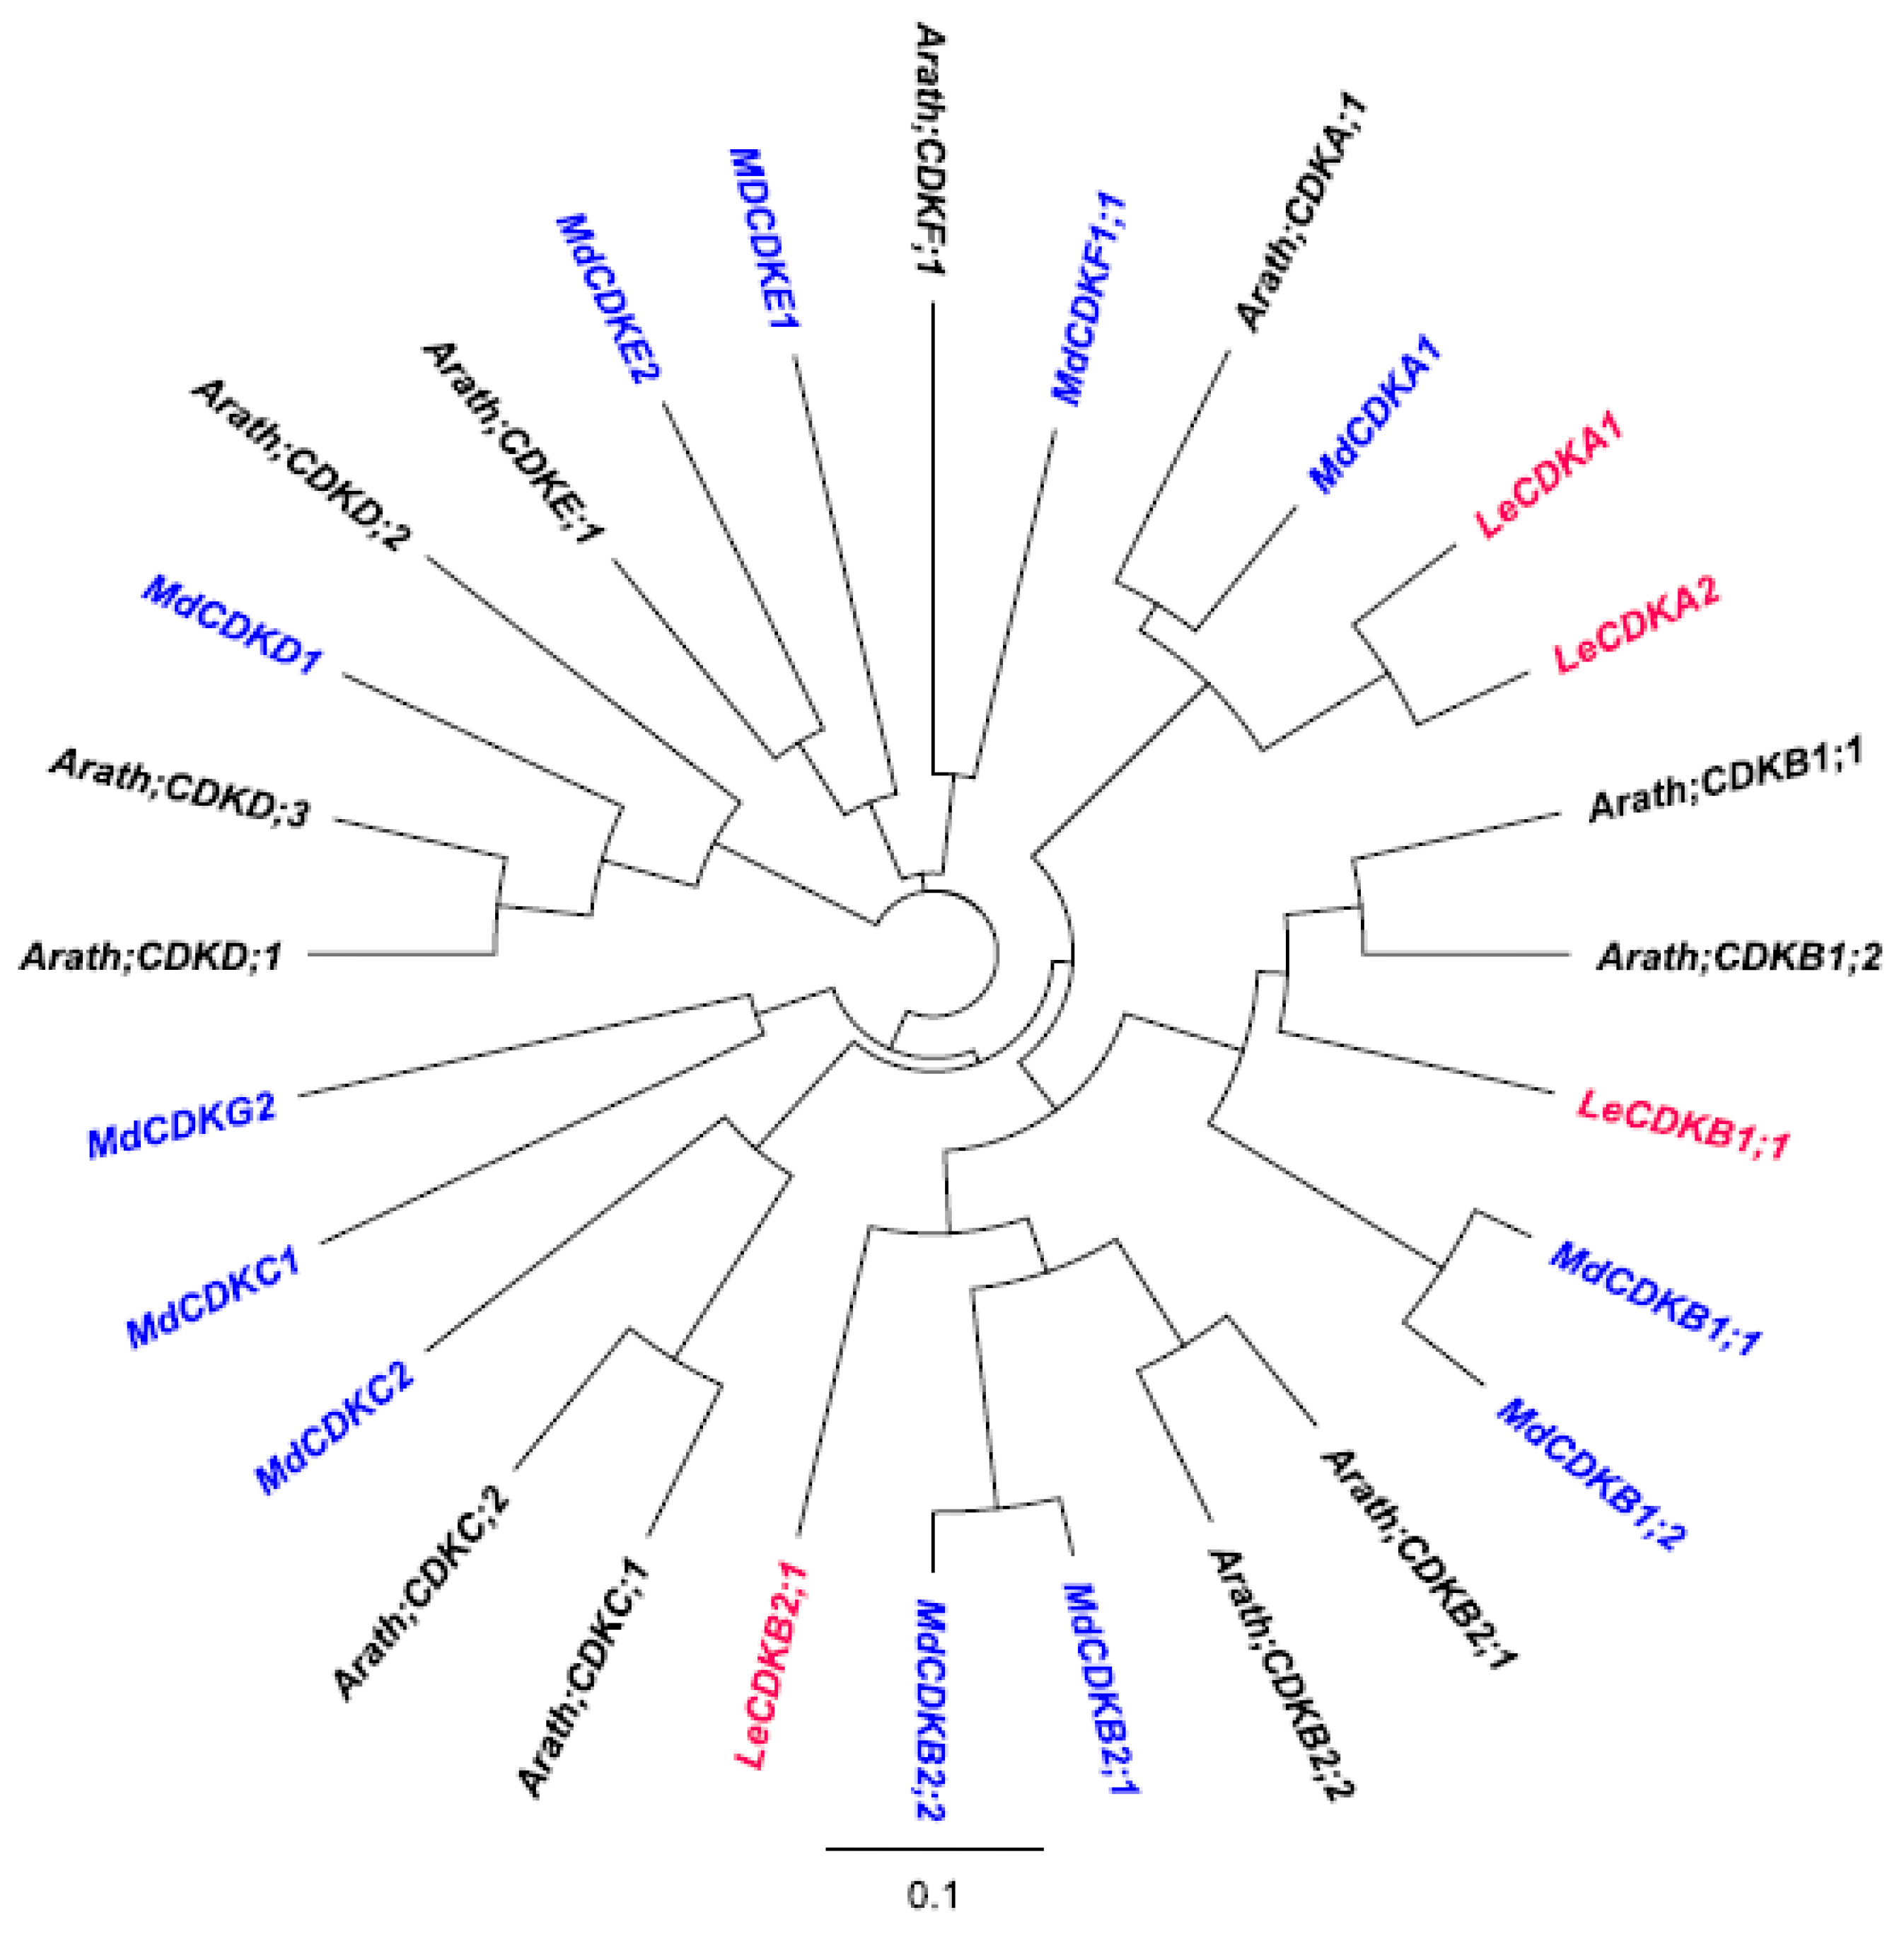
3.4. Phylogenetic Analysis of CDK Genes

A phylogenetic tree of apple, Arabidopsis, and tomato CDK genes was generated to study the relationship between members of this gene family across different species (Figure 11). CDK genes were divided into seven classes (A to F), based on their roles in the different stages of cell cycle [16,22]. Here, CDKB2;2 was selected as a marker for cell division in apple fruit and cell culture. CDKA and CDKB are core cell cycle genes [15,42,43,44]. Two types of CDKBs, i.e., CDKB1 and CDKB2, are plant-specific. CDKB1 is expressed from the late S to M phases of the cell cycle, whereas CDKB2 is expressed specifically from the G2 to M phases [15,44]. Like Arabidopsis, the apple plant possesses two types of CDKB1 (CDKB1;1 and CDKB1;2) and two types of CDKB2 (CDKB2;1 and CDKB2;2), all of which are homologous to each other [12,15,44]. Microarray expression data from previous studies determined that CDKB2;2 forms a more distinct peak during early apple fruit development compared to CDKB2;1 [8,22]. Despite the scarcity of data available about apple fruit genomic sequences, alignment of the cell cycle genes from apple and the well-established Arabidopsis successfully established the high similarity of the apple CDKB2;2 gene (accession number: CN943384) to the Arabidopsis CDKB2 (accession number: At1G20930.1). With an expected value of 1 × e−102, the degree of likeliness between the two was deemed great enough to indicate a shared function in cell cycle regulation [8]. The accession number of each gene is shown in Table 2.

4. Discussion

Given that there are over 7000 varieties of apples known to mankind, it is only natural that distinct fruit size differences would be found among apple cultivars [10,11]. Once fertilised and having entered the fruit set stage, cells in the hypanthium will rapidly divide and expand, thus resulting in the organ’s lateral growth; specifically, the hypanthium would have developed into fruit flesh (mesocarp) by the end of the development process. Interestingly, we found that the cell size of all three cultivars was very similar before full bloom (0 DAFB), as well as at ripening (120 DAFB), despite their vast final fruit size differences. The same findings were reported before in other apple cultivars [15,45]. As such, these observations affirm that, ultimately, fruit size is dependent not on cell size, but instead cell numbers, the growth of which is determined by cell division and expansion genes. By contrast, the smaller fruits of a blueberry cultivar were shown to produce smaller cells at full bloom compared to the bigger fruits of the same plant. However, it was later concluded that the cell size differences at full bloom did not actually influence final fruit size in the cultivar [15,46].
Physiologically, Twenty Ounce grows at a faster rate than the other cultivars. At ripening, its fruit width was three-times larger than that of Crabapple. However, our histology studies demonstrated that the cells of the three cultivars expanded at a similar pace throughout development, an implication of the weak impact of cell expansion in determining fruit size. Even though expansion itself is a major cause of cell growth, its contribution to the final fruit size among apple variants was unclear [15,46]. In this study, the low expression of MdEXP3 in big-sized Twenty Ounce proved that cell expansion is not deterministic for fruit size differences among the three cultivars. Rather, the high expression of MdCDKB2;2 observed in Twenty Ounce asserts that cell division more prominently influenced the final fruit size of the cultivar. Nonetheless, such a straightforward relationship appears unlikely. As high levels of MdCDKB2;2 are speculated to encourage fruit growth, its upregulation at an earlier period would benefit fruit size gain more effectively than later surges. However, should this be the only contributing factor to fruit size, then Crabapple fruits would grow larger than Royal Gala fruits, as the MdCDKB2;2 spike in the former precedes that of the latter by two days. There must thus be intrinsic genetic factors that override cell division genes in the determination of final fruit size.
Early research has revealed that cell division influences fruit size in apples [4,47,48]. Cell number comparisons between big-sized and small-sized apples indicated that the cells of either cultivar would be similarly sized at maturity, insinuating that cell population numbers as a whole are more impactful on fruit size in apples [35,49]. A high cell number has indeed been shown to lead to larger fruit sizes in other species such as the rabbit-eye blueberry (Vaccinium ashei [46]), sweet cherry (Prunus avium [32]), and tomato (Solanum lycopersicum [33,50]). In apple fruits, reports preceding the present study concluded that both cell division and expansion are involved in large-fruit production, although to what extent expansion could influence final fruit size was not determined [27,51].
Most of the pre-existing apple fruit size control research involved cellular and/or physiological assessments [4,50], and few have incorporated gene expression analysis. In this study, we performed real-time quantitative PCR (RT-qPCR) to investigate the differential expression of specific markers throughout fruit development. This approach is more reliable and adds more depth to the overall analysis. Another cell division marker, MdANT2, was chosen due to its positive correlation with MdCDKB2;2 and might thus be used to reaffirm their expression patterns. Though it is a known regulator of cell division control in other species [1,22], the role of MdANT in apple fruits is not yet studied. MdANT was hypothesised to function similarly to its homologue in Arabidopsis [1,2], a gene involved in floral organ initiation and growth [2,44]. To investigate the truth to this assumption, we first quantified MdANT expression levels in the Royal Gala cultivar harvested over Season 1. MdANT was shown to be upregulated during early development before declining towards the ripening stage. With the Season 2 harvest, we observed the positive correlation of MdANT and MdCDKB2;2, in line with findings from a previous report [1]. We also determined that cell division more actively occurs in the young fruits of Twenty Ounce than those of either the Royal Gala or Crabapple variants. The high expression of MdANT2 in Twenty Ounce before full bloom and the cultivar’s rapid cell production rate together implicate the gene in cell division and population growth.
The transcription factor MdARF106 has been previously identified as a highly present gene throughout early development [1,20]. Our analysis of MdARF106 duly showed that the gene was expressed during both cell division and cell expansion, with no significant level differences among cultivars. As the utilisation of stage-specific markers was crucial to our experimental design, MdARF106 was disregarded in favour of the expansin MdEXP3 [28,52]. Indeed, MdEXP3 displayed an expression pattern that was temporally in tune with cell expansion; curiously, however, the gene was more modestly expressed in Twenty Ounce than in both Royal Gala and Crabapple. Contrarily, preceding studies have shown MdEXP3 to exhibit high-expression profiles in big-sized apple variants, leading to the conclusion that cell expansion genes could influence fruit production in those cultivars [28,33]. Taken together, these observations therefore suggest that the effects of cell expansion on final fruit size may be more prominent in some apple cultivars over others.

5. Conclusions

Molecular approaches have been utilised to great effect in apple research to dissect the complex interaction and interplay between hormones during fruit growth. Data from three apple cultivars were collected over a two-year period (two seasons of harvest), where it was found that cell numbers determined the final fruit size. Additionally, the expression of certain genes during early fruit development directly influenced fruit size. The biggest cultivar within this study, Twenty Ounce, evidently demonstrated such a connection; in direct contrast, the middle-sized Royal Gala and small-sized Crabapple exhibited the highest levels of cell division genes during early fruit development.
Regarding fruit size control, cell division appears key to fruit size differences among the apple cultivars studied. Although the MdCDKB2:2 gene has been characterised, it would be of interest to further research the function of this gene during apple fruit development. One way to assess its function would be through the introduction of the gene on an auxin-specific promoter into developing fruits. Since MdCDKB2:2 was correlated with auxin action in promoting cell cycle promotion, the promoter should increase the cells’ sensitivity to auxin. The application of antisense or knock-out could provide a tool to study MdCDKB2:2 function in apple fruit. From this study, it was found that “Twenty Ounce” had a higher expression of MdCDKB2:2 compared to the other cultivars, suggesting it plays a major role in determining the large size of the fruit. Through introduction of this gene by antisense, its function in influencing “Twenty Ounce” final fruit size could be further examined, particularly in how it may affect cell number production.

Author Contributions

Conceptualization, S.K.A.K., A.C.A., R.J.S. and K.M.D.; methodology, S.K.A.K.; software, S.K.A.K.; validation, S.K.A.K., A.C.A., R.J.S. and K.M.D.; formal analysis, S.K.A.K.; writing—original draft preparation, S.K.A.K.; writing—review and editing, S.K.A.K., A.C.A., R.J.S. and K.M.D. All authors have read and agreed to the published version of the manuscript.

Funding

This research was funded by the University of Auckland and Plant and Food Research Ltd. S.K. was a recipient of a Ph.D. fellowship from the Malaysian Ministry of Education (MoE).

Institutional Review Board Statement

Not applicable.

Informed Consent Statement

Not applicable.

Data Availability Statement

Not applicable.

Acknowledgments

Thank you to the Ministry of Education Malaysia (MoE) for the scholarship, the supervisory team, the University of Auckland, and Plant and Food Research (NZ) for the samples and research funding.

Conflicts of Interest

The authors declare no conflict of interest.

References

  1. Dash, M.; Malladi, A. The Aintegumenta genes, MdANT1 and MdANT2, are associated with the regulation of cell production during fruit growth in apple (Malus × domestica Borkh.). BMC Plant Biol. 2012, 12, 98. [Google Scholar] [CrossRef] [PubMed] [Green Version]
  2. Han, X.; Liu, K.; Yuan, G.; He, S.; Cong, P.; Zhang, C. Genome-wide identification and characterization of AINTEGUMENTA-LIKE (AIL) family genes in apple (Malus domestica Borkh.). Genomics 2022, 114, 110313. [Google Scholar] [CrossRef] [PubMed]
  3. Hirst, P.M. Advances in understanding flowering and pollination in apple trees. In Achieving Sustainable Cultivation of Apples; Burleigh Dodds Science Publishing: Cambridge, UK, 2017; Volume 31, pp. 109–126. [Google Scholar]
  4. Bain, J.M.; Robertson, R.N. The physiology of growth in apple fruits I. Cell size, cell number, and fruit development. Aust. J. Biol. Sci. 1951, 4, 75–91. [Google Scholar] [CrossRef] [PubMed] [Green Version]
  5. Zeng, X.; Li, H.; Jiang, W.; Li, Q.; Xi, Y.; Wang, X.; Li, J. Phytochemical compositions, health-promoting properties and food applications of crabapples: A review. Food Chem. 2022, 23, 132789. [Google Scholar] [CrossRef]
  6. Gonzalez, L.; Torres, E.; Àvila, G.; Bonany, J.; Alegre, S.; Carbó, J.; Martín, B.; Recasens, I.; Asin, L. Evaluation of chemical fruit thinning efficiency using Brevis®(Metamitron) on apple trees (‘Gala’) under Spanish conditions. Sci. Hortic. 2020, 261, 109003. [Google Scholar] [CrossRef]
  7. Jonkers, H. Biennial bearing in apple and pear: A literature survey. Sci. Hortic. 1979, 11, 303–317. [Google Scholar] [CrossRef]
  8. Janssen, B.J.; Thodey, K.; Schaffer, R.J.; Alba, R.; Balakrishnan, L.; Bishop, R.; Bowen, J.H.; Crowhurst, R.N.; Gleave, A.P.; Ledger, S.; et al. Global gene expression analysis of apple fruit development from the floral bud to ripe fruit. BMC Plant Biol. 2008, 8, 16. [Google Scholar] [CrossRef] [Green Version]
  9. Forshey, C.G. Fruit numbers, fruit saize, and yield relationships in’McIntosh’apples. J. Am. Soc. Hort. Sci. 1977, 102, 399–402. [Google Scholar]
  10. McAtee, P.; Karim, S.; Schaffer, R.; David, K. A dynamic interplay between phytohormones is required for fruit development, maturation, and ripening. Front. Plant Scie. 2013, 4, 79. [Google Scholar] [CrossRef] [Green Version]
  11. Karim, S.K.; Read, N.; David, K.M.; Allan, A.C.; Schaffer, R.J. Characterisation of induced Malus x domestica ‘Royal Gala’cell differentiation by using different hormones in cell cultures. J. Hortic. Sci. Biotechnol. 2022, 2022, 1–5. [Google Scholar] [CrossRef]
  12. Malladi, A.; Johnson, L.K. Expression profiling of cell cycle genes reveals key facilitators of cell production during carpel development, fruit set, and fruit growth in apple (Malus × domestica Borkh.). J. Exp. Bot. 2011, 62, 205–219. [Google Scholar] [CrossRef] [PubMed] [Green Version]
  13. Giovannoni, J.J. Fruit ripening mutants yield insights into ripening control. Curr. Opin. Plant Biol. 2007, 10, 283–289. [Google Scholar] [CrossRef]
  14. Rugkong, A.; McQuinn, R.; Giovannoni, J.J.; Rose, J.K.; Watkins, C.B. Expression of ripening-related genes in cold-stored tomato fruit. Postharvest Biol. Technol. 2011, 61, 1–4. [Google Scholar] [CrossRef]
  15. Malladi, A. Molecular physiology of fruit growth in apple. Hortic. Rev. 2020, 47, 1–42. [Google Scholar]
  16. Kitsios, G.; Doonan, J.H. Cyclin dependent protein kinases and stress responses in plants. Plant Signal. Behav. 2011, 6, 204–209. [Google Scholar] [CrossRef] [Green Version]
  17. Endo, M.; Nakayama, S.; Umeda-Hara, C.; Ohtsuki, N.; Saika, H.; Umeda, M.; Toki, S. CDKB2 is involved in mitosis and DNA damage response in rice. Plant J. 2012, 69, 967–977. [Google Scholar] [CrossRef] [PubMed] [Green Version]
  18. Klucher, K.M.; Chow, H.; Reiser, L.; Fischer, R.L. The AINTEGUMENTA gene of Arabidopsis required for ovule and female gametophyte development is related to the floral homeotic gene APETALA2. Plant Cell. 1996, 8, 137–153. [Google Scholar]
  19. Mizukami, Y.; Fischer, R.L. Plant organ size control: AINTEGUMENTA regulates growth and cell numbers during organogenesis. Proc. Natl. Acad. Sci. USA 2000, 97, 942–947. [Google Scholar] [CrossRef] [Green Version]
  20. Devoghalaere, F.; Doucen, T.; Guitton, B.; Keeling, J.; Payne, W.; Ling, T.J.; Ross, J.J.; Hallett, I.C.; Gunaseelan, K.; Dayatilake, G.A.; et al. A genomics approach to understanding the role of auxin in apple (Malus x domestica) fruit size control. BMC Plant Biol. 2012, 12, 7. [Google Scholar] [CrossRef] [Green Version]
  21. Jiao, Q.Q.; Cui, M.; Chen, X.S.; Zhang, Z.Y.; Wang, N.; Jiang, Y.M.; Mao, Z.Q.; Shu, J.; Shen, X.; Jiang, S.H.; et al. MdCKS1 Expression Involved in Fruit Size in Apple Cultivar ‘Fuji’and ‘Ralls’. Russ. J. Plant Physiol. 2021, 68, 1059–1068. [Google Scholar] [CrossRef]
  22. Cho, H.T.; Kende, H. Expansins and internodal growth of deepwater rice. Plant Physiol. 1997, 113, 1145–1151. [Google Scholar] [CrossRef] [PubMed] [Green Version]
  23. Wu, B.; Shen, F.; Wang, X.; Zheng, W.Y.; Xiao, C.; Deng, Y.; Wang, T.; Yu Huang, Z.; Zhou, Q.; Wang, Y.; et al. Role of MdERF3 and MdERF118 natural variations in apple flesh firmness/crispness retainability and development of QTL-based genomics-assisted prediction. Plant Biotechnol. J. 2021, 19, 1022–1037. [Google Scholar] [CrossRef] [PubMed]
  24. Cosgrove, D.J. Loosening of plant cell walls by expansins. Nature 2000, 407, 321–326. [Google Scholar] [CrossRef] [PubMed]
  25. Cho, H.T.; Cosgrove, D.J. Altered expression of expansin modulates leaf growth and pedicel abscission in Arabidopsis thaliana. Proc. Natl. Acad. Sci. USA 2000, 97, 9783–9788. [Google Scholar] [CrossRef] [PubMed] [Green Version]
  26. Percy, A.E.; Melton, L.D.; Jameson, P.E. Expansion during early apple fruit development induced by auxin and N-(2-chloro-4-pyridyl)-N′-phenylurea: Effect on cell wall hemicellulose. Plant Growth Regul. 1998, 26, 1–6. [Google Scholar] [CrossRef]
  27. Harada, T.; Kurahashi, W.; Yanai, M.; Wakasa, Y.; Satoh, T. Involvement of cell proliferation and cell enlargement in increasing the fruit size of Malus species. Sci. Hortic. 2005, 105, 447–456. [Google Scholar] [CrossRef]
  28. Wakasa, Y.; Hatsuyama, Y.; Takahashi, A.; Sato, T.; Niizeki, M.; Harada, T. Divergent expression of six expansin genes during apple fruit ontogeny. Eur. J. Hortic. Sci. 2003, 68, 253–259. [Google Scholar]
  29. Dash, M.; Johnson, L.K.; Malladi, A. Reduction of fruit load affects early fruit growth in apple by enhancing carbohydrate availability, altering the expression of cell production-related genes, and increasing cell production. J. Am. Soc. Hortic. Sci. 2013, 138, 253–262. [Google Scholar] [CrossRef] [Green Version]
  30. Chang, S.; Puryear, J.; Cairney, A. A simple and efficient method for isolating RNA from pine trees. Plant Mol. Biol. Rep. 1993, 11, 113–116. [Google Scholar] [CrossRef]
  31. Schaffer, R.J.; Friel, E.N.; Souleyre, E.J.; Bolitho, K.; Thodey, K.; Ledger, S.; Bowen, J.H.; Ma, J.H.; Nain, B.; Cohen, D.; et al. A genomics approach reveals that aroma production in apple is controlled by ethylene predominantly at the final step in each biosynthetic pathway. Plant Physiol. 2007, 144, 1899–1912. [Google Scholar] [CrossRef] [Green Version]
  32. Olmstead, J.W.; Iezzoni, A.F.; Whiting, M.D. Genotypic differences in sweet cherry fruit size are primarily a function of cell number. J. Am. Soc. Hortic. Sci. 2007, 132, 697–703. [Google Scholar] [CrossRef]
  33. Bohner, J.; Bangerth, F. Effects of fruit set sequence and defoliation on cell number, cell size and hormone levels of tomato fruits (Lycopersicon esculentum Mill.) within a truss. Plant Growth Regul. 1988, 7, 141–155. [Google Scholar]
  34. Livak, K.J.; Schmittgen, T.D. Analysis of relative gene expression data using real-time quantitative PCR and the 2(-Delta Delta C(T)) method. Methods 2001, 25, 402–408. [Google Scholar] [CrossRef]
  35. Kearse, M.; Moir, R.; Wilson, A.; Stones-Havas, S.; Cheung, M.; Sturrock, S.; Buxton, S.; Cooper, A.; Markowitz, S.; Duran, C.; et al. Geneious Basic: An integrated and extendable desktop software platform for the organization and analysis of sequence data. Bioinformatics 2012, 28, 1647–1649. [Google Scholar] [CrossRef] [PubMed]
  36. Kolarič, J.; Pleško, I.M.; Tojnko, S.; Stopar, M. Apple fruitlet ethylene evolution and MdACO1, MdACS5A, and MdACS5B expression after application of naphthaleneacetic acid, 6-benzyladenine, ethephon, or shading. HortScience 2011, 46, 1381–1386. [Google Scholar] [CrossRef] [Green Version]
  37. Sass, J.E. Botanical Microtechnique, 3rd ed.; The Iowa State University Press: Ames, IA, USA, 1958. [Google Scholar]
  38. Vandepoele, K.; Raes, J.; Veylder, L.; de Rouzé, P.; Rombauts, S.; Inzé, D. Genome-wide analysis of core cell cycle genes in Arabidopsis. Plant Cell 2002, 14, 903–916. [Google Scholar] [CrossRef] [Green Version]
  39. Huang, Y.-W.; Tsay, W.-S.; Chen, C.-C.; Lin, C.-W.; Huang, H.-J. Increased expression of the rice C-type cyclin-dependent protein kinase gene, Orysa;CDKC;1, in response to salt stress. Plant Physiol. Biochem. 2008, 46, 71–81. [Google Scholar] [CrossRef]
  40. Xu, S.; Zhang, B.; Cao, Z.-Y.; Ling, T.-F.; Shen, W.-B. Heme oxygenase is involved in cobalt chloride-induced lateral root development in tomato. Biometals 2011, 24, 181–191. [Google Scholar] [CrossRef]
  41. Czerednik, A.; Busscher, M.; Bielen, B.M.; Wolters-Arts, M.; de Maagd, R.A.; Angenent, G.C. Regulation of tomato fruit pericarp development by an interplay between CDKB and CDKA1 cell cycle genes. J. Exp. Bot. 2012, 63, 2605–2617. [Google Scholar] [CrossRef] [Green Version]
  42. Gentric, N.; Genschik, P.; Noir, S. Connections between the cell cycle and the DNA damage response in plants. Int. J. Mol. Sci. 2021, 22, 9558. [Google Scholar] [CrossRef]
  43. McAtee, P.A.; Hallett, I.C.; Johnston, J.W.; Schaffer, R.J. A rapid method of fruit cell isolation for cell size and shape measurements. Plant Methods 2009, 5, 1–7. [Google Scholar] [CrossRef] [PubMed] [Green Version]
  44. Krizek, B.A. Ectopic expression of Aintegumenta in Arabidopsis plants results in increased growth of floral organs. Dev. Genet. 1999, 25, 224–236. [Google Scholar] [CrossRef]
  45. Ng, J.K.; Schröder, R.; Sutherland, P.W.; Hallett, I.C.; Hall, M.I.; Prakash, R.; Smith, B.G.; Melton, L.D.; Johnston, J.W. Cell wall structures leading to cultivar differences in softening rates develop early during apple (Malus x domestica) fruit growth. BMC Plant Biol. 2013, 13, 128. [Google Scholar] [CrossRef] [PubMed] [Green Version]
  46. Johnson, L.K.; Malladi, A.; NeSmith, D.S. Differences in cell number facilitate fruit size variation in rabbiteye blueberry genotypes. J. Am. Soc. Hortic. Sci. 2011, 136, 10–15. [Google Scholar] [CrossRef] [Green Version]
  47. Patricia Denne, M. Fruit development and some tree factors affecting it. N. Z. J. Bot. 1963, 1, 265–294. [Google Scholar] [CrossRef]
  48. Hugh Smith, W. The histological structure of the flesh of the apple in relation to growth and senescence. J. Pomol. Hortic. Sci. 1941, 18, 249–260. [Google Scholar] [CrossRef]
  49. Chen, P.; Li, Z.; Zhang, D.; Shen, W.; Xie, Y.; Zhang, J.; Jiang, L.; Li, X.; Shen, X.; Geng, D.; et al. Insights into the effect of human civilization on Malus evolution and domestication. Plant Biotechnol. J. 2021, 19, 2206–2220. [Google Scholar] [CrossRef]
  50. Bertin, N.; Génard, M.; Fishman, S. A model for an early stage of tomato fruit development: Cell multiplication and cessation of the cell proliferative activity. Ann. Bot. 2003, 92, 65–72. [Google Scholar] [CrossRef] [Green Version]
  51. Malladi, A.; Hirst, P.M. Increase in fruit size of a spontaneous mutant of ‘Gala’apple (Malus × domestica Borkh.) is facilitated by altered cell production and enhanced cell size. J. Exp. Bot. 2010, 61, 3003–3013. [Google Scholar] [CrossRef] [Green Version]
  52. Khan, A.; Gutierrez, B.; Chao, C.T.; Singh, J. Origin of the Domesticated Apples. In The Apple Genome; Springer: Cham, Switzerland, 2021; pp. 383–394. [Google Scholar]
Figure 1. (A) The morphology of the “Twenty Ounce” cultivar at various timepoints (DAFB) throughout the developmental stages of fruit set, cell division, cell expansion, and ripening. (B) The morphology of the “Royal Gala” cultivar at various timepoints (DAFB) of the fruit development process such as fruit set, cell division, cell expansion, and ripening. (C) Crabapple fruit morphology at various timepoints (DAFB) throughout the development stages of fruit set, cell division, cell expansion, and ripening.
Horticulturae 08 00657 g001aHorticulturae 08 00657 g001b
Figure 2. Average fruit diameter of the three cultivars from three individual replicates (Season 2). The differences in measurements between cultivars at 14, 42, and 120 DAFB were statistically different (Tukey’s HSD). ANOVA (two-factor), p-value ≤ 0.05.
Horticulturae 08 00657 g002
Figure 3. Average cell size of three cultivars from three individual replicates (Season 2). Error bars represent standard deviations. The difference in measurements between cultivars at 42 until 120 DAFB was statistically different (Tukey’s HSD), ANOVA (two-factor), p ≤ 0.05.
Horticulturae 08 00657 g003
Figure 4. Microscopy images of three cultivars showing a distinct cell size increment amongst the cultivars. Scale bars represent 500 µm.
Horticulturae 08 00657 g004
Figure 5. A graph depicting the relationship between fruit diameter and cell area for the three cultivars across 10 time points during harvest (Season 2). The best fit line indicates the linear correlation of the two variables (p < 0.05, y = 0.0038x + 3.6089).
Horticulturae 08 00657 g005
Figure 6. Differential expression of MdCDKB2:2 in three cultivars during Season 2, relative to the control gene, MdGAPDH. (A) Relative expression in biological Replicate 1 (Rep1). (B) Relative expression in biological Replicate 2 (Rep2). Error bars = standard deviation; n = 3 (technical replicates). Expression levels between time points and cultivars were statistically different, ANOVA (two-factor), p-value ≤ 0.05.
Horticulturae 08 00657 g006
Figure 7. Differential expression of MdANT2 in three cultivars during Season 2 relative to MdGAPDH. (A) Relative expression in biological Replicate 1 (Rep1). (B) Relative expression in biological Replicate 2 (Rep2). Error bars = standard deviation; n = 3 (technical replicates). The expressions between markers were statistically different, ANOVA (two-factor), p-value ≤ 0.05.
Horticulturae 08 00657 g007
Figure 8. Differential expression of MdEXP3 in three cultivars during Season 2, relative to the control gene, MdGAPDH. (A) Relative expression in biological Replicate 1 (Rep1). (B) Relative expression in biological Replicate 2 (Rep2). Error bars = standard deviation; n = 3 (technical replicates). Expression between time points and cultivars were statistically different, ANOVA (two-factor), p-value ≤ 0.05.
Horticulturae 08 00657 g008
Figure 9. Differential expression of MdARF106 in three cultivars during Season 2, relative to the control gene, MdGAPDH. (A) Relative expression in biological Replicate 1 (Rep1). (B) Relative expression in biological Replicate 2 (Rep2). Error bars = standard deviation; n = 3 (technical replicates). The expression between time points and cultivars were statistically different, ANOVA (two-factor), p-value ≤ 0.05.
Horticulturae 08 00657 g009
Figure 10. Differential expression of MdACO1 in three cultivars during Season 2, relative to the control gene, MdGAPDH. (A) Relative expression in biological Replicate 1 (Rep1). (B) Relative expression in biological Replicate 2 (Rep2). Error bars represent standard deviation (n = 3).
Horticulturae 08 00657 g010
Figure 11. Phylogenetic tree of the Cyclin Dependent Kinases (CDKs). The CDKs from apple (blue), Arabidopsis (black,) and tomato (red) were aligned on the MUSCLE software. Parameters for phylogenetic tree building were set to neighbour joining and 500 bootstraps. Md: Malus x domestica, Arath: Arabidopsis, Sl: Solanum lycopersicum.
Horticulturae 08 00657 g011
Table 1. Primer sequences for qPCR analysis.
PrimerSequence 5′-3′
MdCDKB2:2TGCACAGGGATCTTAAGC
MdCDKB2:2ATACTTCTTGAGTGGCAC
MdANT2CCAAGGTGATCGAACCTAACATTGCAG
MdANT2TCCTCCAATGCCATTGAGAATGAGAGA
MdARF106GAGGGGAAGCCGTTTGAGGT
MdARF106GCCGTCCAAAACACCTTCAAT
MdEXP3GATGCAGGAGAAGAGGAGGC
MdEXP3ATTGCACATCTCCAGCACCA
MdACO1CAGTCGGATGGGACCAGAA
MdACO1GCTTGGAATTTCAGGCCAGA
MdPG1TGAACACTTTGCAGCACGAT
MdPG1GGCGGTTCAAGTGAAAAATG
MdActinACCATCTGCAACTCATCCGAACCT
MdActinACAATGCTAGGGAACACGGCTCTT
MdGAPDHTGAGGGCAAGCTGAAGGGTATCTT
MdGAPDHTCAAGTCAACCACACGGGTACTGT
Table 2. Gene name and accession number of CDKs from three different plant species.
Gene NameAccession Number
Arath; CDKA;1AT3G48750.1
Arath;CDKB1;1AT3G54180.1
Arath;CDKB1;2AT2G38620.2
Arath;CDKB2;1AT1G76540.1
Arath;CDKB2;2AT1G20930.1
Arath;CDKC;1AT5G10270.1
Arath;CDKC;2AT5G64960.1
Arath;CDKD;1AT1G73690.1
Arath;CDKD;2AT1G66750.1
Arath;CDKD;3AT1G18040.1
Arath;CDKE;1AT5G63610.1
Arath;CDKF;1AT4G28980.2
MdCDKA1MDP0000185491
MdCDKB1;1MDP0000223519
MdCDKB1;2MDP0000240040
MdCDKB2;1MDP0000418062
MdCDKB2;2MDP0000722904
MdCDKC1MDP0000243737
MdCDKC2MDP0000253325
MdCDKD1MDP0000128357
MdCDKE1MDP0000206441
MdCDKE2MDP0000235270
MdCDKF1;1MDP0000303768
MdCDKG2MDP0000263387
SlCDKA1Solyc08g066330.1.1
SlCDKA2Solyc12g095860.1.1
SlCDKB1;1Solyc10g074720.1.1
SlCDKB2;1Solyc04g082840.2.1
Publisher’s Note: MDPI stays neutral with regard to jurisdictional claims in published maps and institutional affiliations.

