Communication

A Preliminary Study for Identifying Genes Associated with Pellicle Development in Xinjiang Walnut (Juglans regia L.)

1
College of Horticulture and Forestry, Tarim University, Alar 843300, China
2
Key Laboratory of Horticultural Plant Biology, Huazhong Agricultural University, Wuhan 430070, China
3
Xinjiang Production & Construction Corps Key Laboratory of Protection and Utilization of Biological Resources in Tarim Basin, Alar 843300, China
4
College of Agriculture, Tarim University, Alar 843300, China
5
Institute of Economic Crops, Hubei Academy of Agricultural Sciences, Wuhan 430064, China
*
Authors to whom correspondence should be addressed.
These authors contributed equally to this work.
Horticulturae 2022, 8(9), 784; https://doi.org/10.3390/horticulturae8090784
Submission received: 28 July 2022 / Revised: 22 August 2022 / Accepted: 24 August 2022 / Published: 29 August 2022

Abstract

:
Walnut (Juglans regia L.) is an important nut fruit crop mainly grown for its high nutritional and medicinal value. In walnut fruit, the pellicle is the main source of polyphenols (such as proanthocyanidins), which are natural bioactive compounds but also cause astringency and bitterness for walnut fruit consumption. However, the gene regulatory networks of phenolic biosynthetic pathways remain largely unknown in walnut pellicles. Here, we performed RNA sequencing (RNA-seq) to identify differentially expressed genes (DEGs) associated with pellicle development in walnut. In this study, seven developmental stages (8-, 9-, 11-, 13-, 15-, 17-, and 19-week after pollination) of ‘Xinwen179’ pellicle tissues were harvested to conduct further transcriptome-wide profiles. Via RNA-seq, we explored several key DEGs involved in the phenolic biosynthetic pathway, such as dihydroflavonol-4-reductase (DFR), leucoanthocyanidin reductase (LAR), anthocyanidin synthase (ANS) and anthocyanidin reductase (ANR), which are dynamically expressed at developmental stages of the walnut pellicle. Among them, ANR may directly contribute to proanthocyanidins accumulation during walnut development. Taken together, our preliminary investigation on DEGs associated with pellicle development will not only elucidate the gene regulatory networks of the phenolic biosynthetic pathway for pellicle development, but also contribute to the broad spectrum of RNA-seq data resources for further genetic improvement of walnut.

1. Introduction

Walnut (Juglans regia L.; 2n = 2x = 32), a member of the Juglandaceae family, originates from the mountain valleys of Central Asia and is currently widely cultivated in the USA, Iran, and China [1]. It is not only used as a fruit crop rich in unsaturated fatty acids, melatonin, vitamins, polyphenols, and a variety of microelements [2,3] but also has been applied in medicine, healthcare, cosmetics, and other industrial fields [4,5,6]. In recent years, walnut has become a global fruit crop, present in many regions and markets.
Walnut fruit includes four main parts from the outside to the inside: green husk, shell, pellicle (seed coat or skin), and kernel (seed) [2]. The fleshy green husk surrounds a nucleus of the nut itself, which is composed of a shell containing the pellicle and the kernel. For fruit consumption, the kernel is processed into various food products (as an edible part); however, the husk, shell, and pellicle usually become waste or fuel during walnut fruit harvesting and processing [7,8]. Generally, the kernel percent is about 40–60% of the whole walnut fruit, and the pellicle accounts for only about 5–8% of the phenolic compounds of the whole kernel [9] but it is the main source of walnut polyphenols (especial for proanthocyanidins or condensed tannins), which can cause the slight astringency and bitterness [3,10,11].
Recently, with high-throughput sequencing techniques, transcriptome-wide profiling of gene expression (i.e., RNA-Seq) has been widely applied in walnut, which has allowed researchers to understand the dynamics of differentially expressed genes (DEGs) at a global level. For example, previous studies have revealed several DEGs were associated with the walnut juvenile–adult phase change [12,13], and are related to plant resistance to nitrogen stress [14]. Recently, the high-quality chromosome-scale reference genomes have been reported [15,16,17]. With a walnut reference genome, the clean reads of RNA-seq data can be aligned, which will enhance our understanding of transcriptome-wide profiles for walnut development [18,19]. To date, few studies have been performed using RNA-seq data to analyze DEGs associated with lipid biosynthesis in walnut kernel tissue [19,20,21]. However, the gene regulatory network in walnut pellicle tissue remains unclear.
In this study, we investigated DEGs associated with pellicle development in walnut at the transcription level. Total RNA was isolated from walnut pellicle tissue during seven developmental stages, and RNA-seq analyses were performed to identify DEGs associated with walnut pellicle development using walnut reference genome annotations. We identified several DEGs related to the phenolic biosynthetic pathway during walnut pellicle development. Our preliminary investigation into DEGs not only allows us to infer the gene regulatory network for pellicle development but also contributes to subtle walnut RNA-seq data resources for further research.

2. Materials and Methods

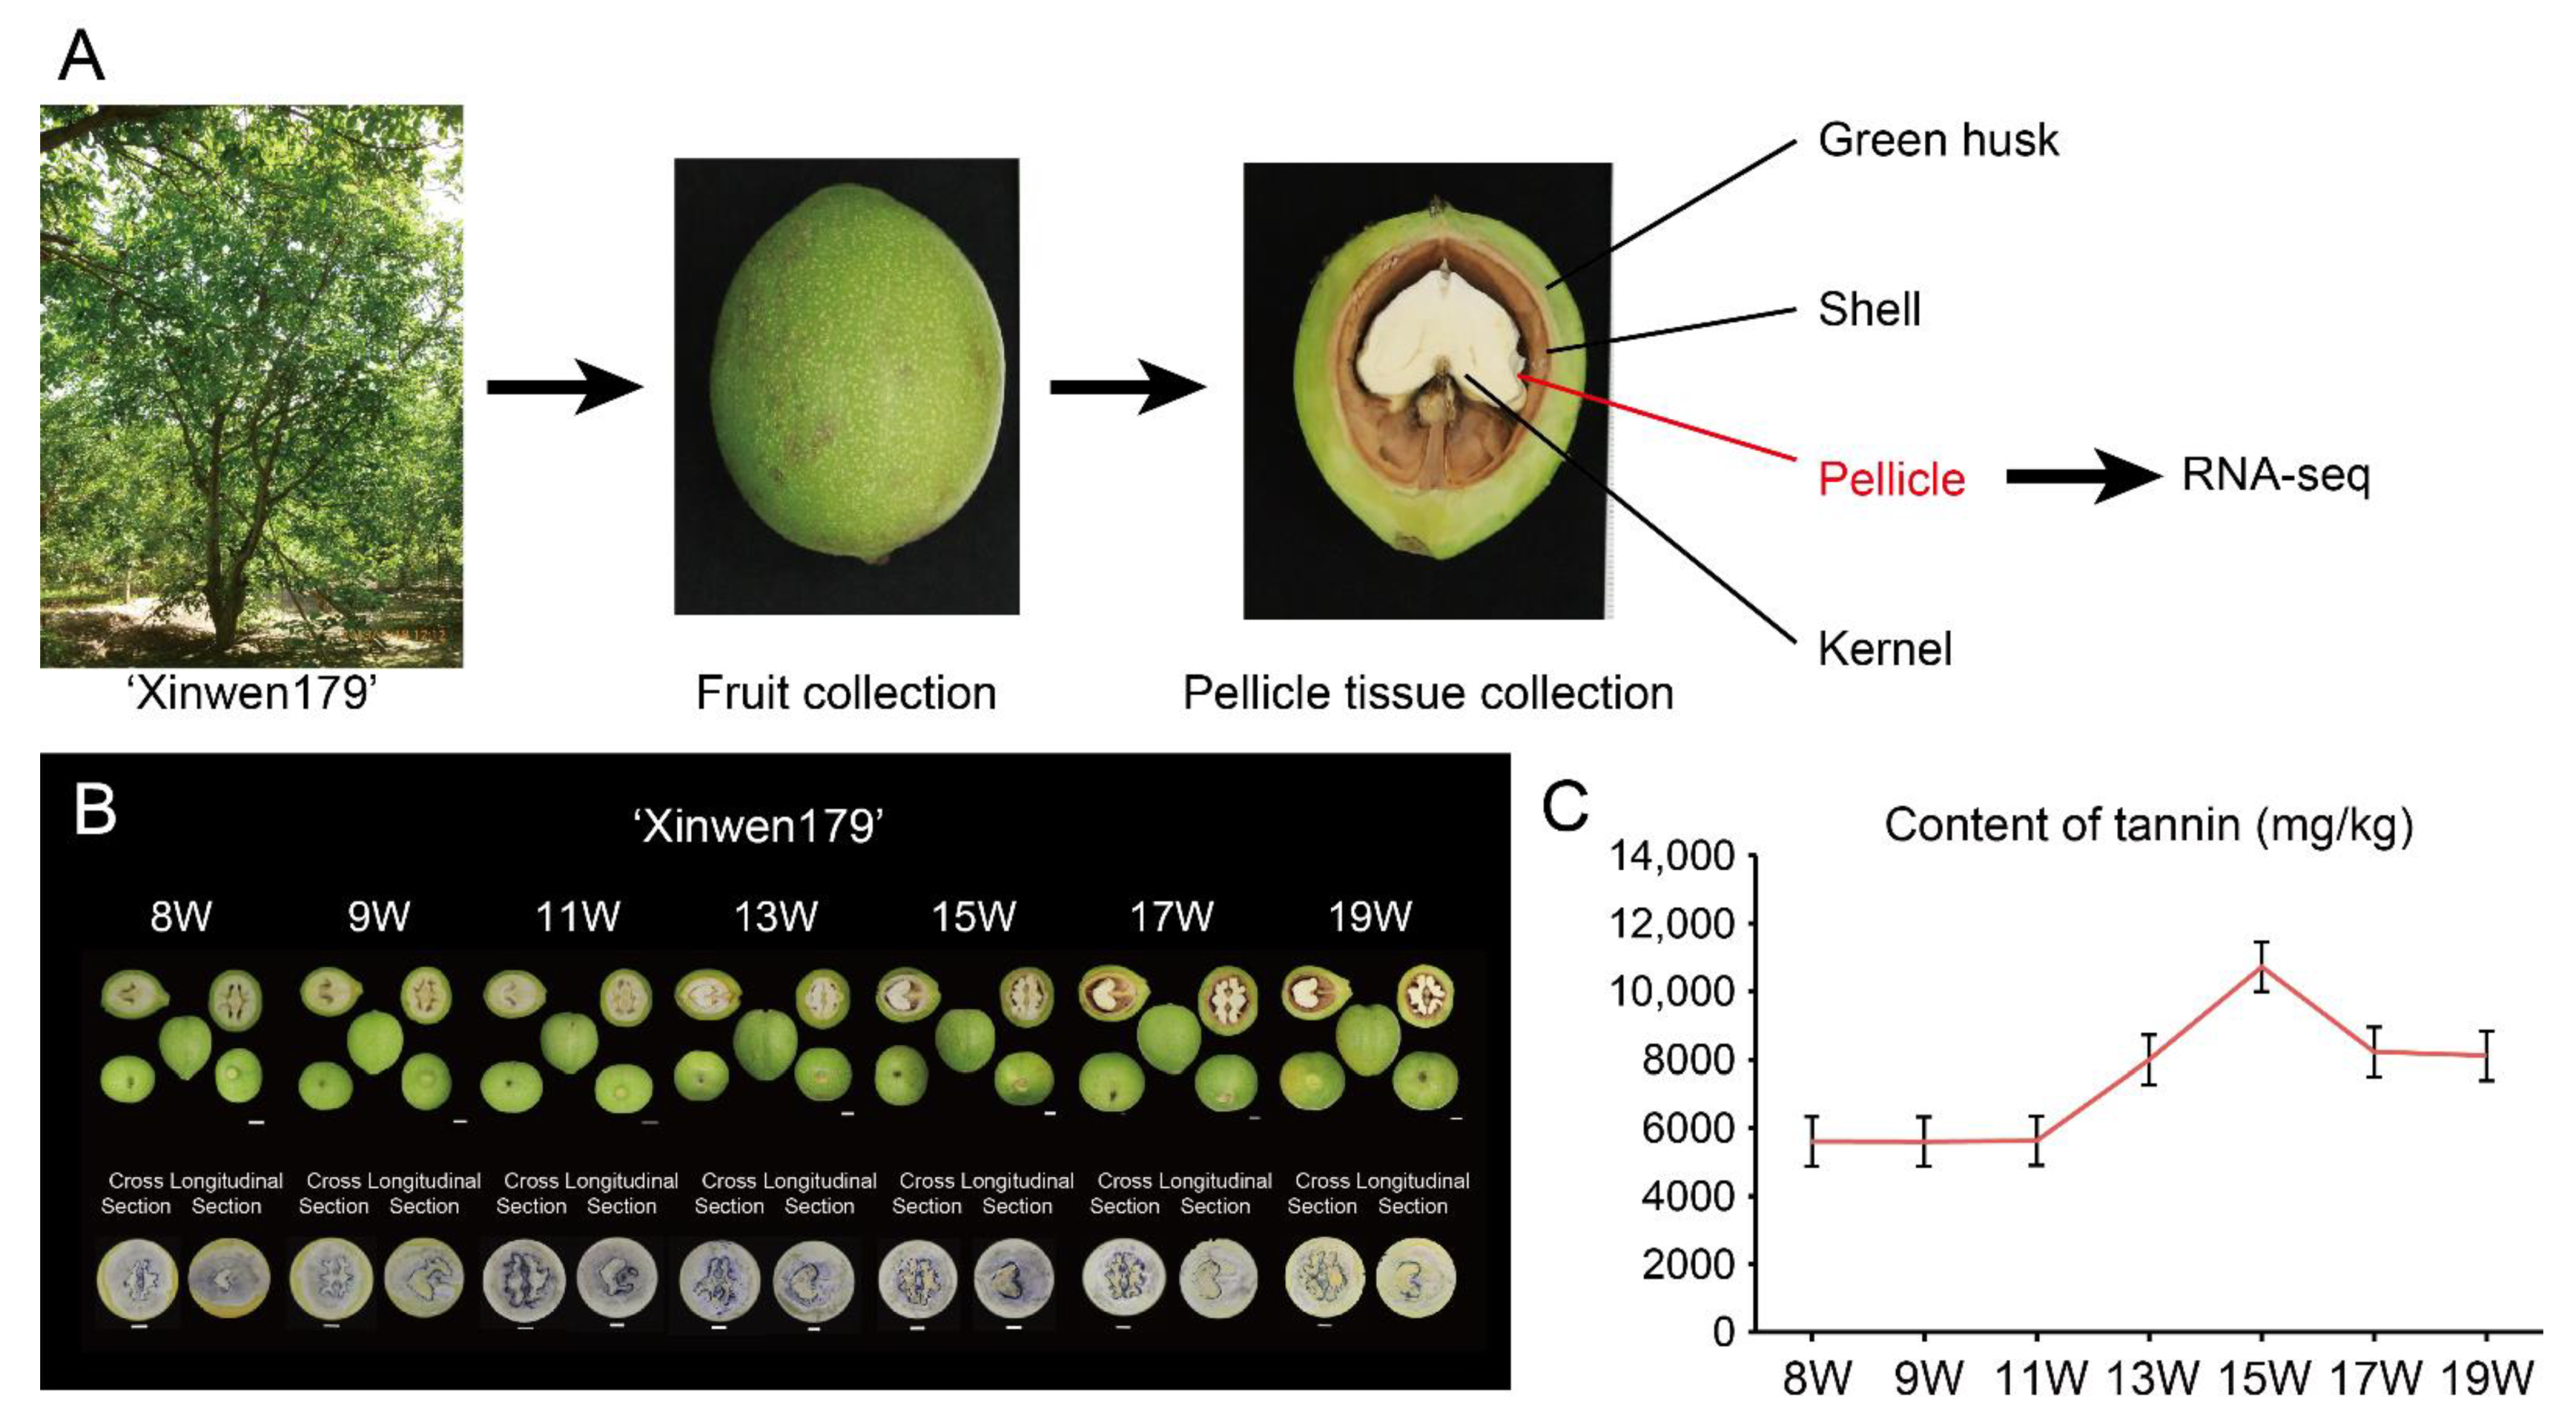
2.1. Plant Materials and Sample Collection

The walnut variety “Xinwen179” used in this study was planted in a field in the Xinjiang Uygur Autonomous Region, China (40°32′27.74239″ N, 81°18′3.40166″ E, altitude 957.37 m). The fruit samples with at least three biological replicates were collected every two weeks from 8 to 19 weeks after flowering in 2021. Upon harvesting, the kernel pellicle was stripped, and then the samples were quick-frozen in liquid nitrogen and stored at −80 °C for further RNA extraction. Tannin content was measured with ultraviolet spectrophotometer for each replicate of the samples according to our previous report [11]. According to the tannin content results, we then selected samples of 8-, 9-, 11-, 13-, 15-, 17-, and 19-weeks after pollination (hereafter referred to as 8 W, 9 W, 11 W, 13 W, 15 W, 17 W, and 19 W) for later RNA sequencing.

2.2. RNA Extraction, Library Preparation, RNA Sequencing

Total RNA of walnuts was extracted using the RNA Easy Fast Plant Tissue Kit (TIANGEN, Beijing, China) according to the manufacturer’s instructions. Concentration and purity were detected by nanodrop, RNA integrity was detected by RNA-specific agarose electrophoresis and Agilent 2100 Bioanalyzer, and only high-integrity RNA was used for the next-step experiment. The cDNA libraries were generated using the TruSeq RNA Sample Preparation Kit (Illumina, San Diego, CA, USA). The quantified RNA library was prepared using an Illumina TruSeq RNA kit, according to the manufacturer’s instructions. The high throughput sequencing of RNA libraries was implemented using the Illumina HiSeq2500 platform.

2.3. RNA-Seq Data Analysis

The RNA-seq data analysis procedure is described in our previous publication [18]. In brief, the FastQC software was used to evaluate the quality of RNA-seq libraries. Adapter sequences and low-quality reads with more than 20% low-quality bases (quality < 20) were filtered out using Trim-galore v0.6.2 (https://github.com/FelixKrueger/TrimGalore, accessed on 15 August 2021). The clean reads were aligned to the walnut genome [15] (http://dendrome.ucdavis.edu/ftp/Genome_Data/genome/Reju/, accessed on 15 August 2021) using HISAT2 v2.2.1 (http://daehwankimlab.github.io/hisat2/, accessed on 15 August 2021) with default parameters and only the reads that aligned exactly once were used for next-step analysis. The gene expression levels were quantified using FeatureCounts v1.22.2 (http://subread.sourceforge.net/featureCounts.html, accessed on 15 August 2021) with default parameters. FPKM (Fragments Per Kilobase of exon model per Million mapped fragments) was used for the normalization of gene expression levels. DEGs were calculated using the DEseq2 package [22] in R with a cutoff FC (Fold Change) > 2 with an adjusted p-value < 0.05.

2.4. Functional Enrichment Analysis

A gene ontology (GO) analysis of differentially expressed genes (DEGs) was performed using the agriGO v2.0 [23] web tools. The gene list and gene number of each term were calculated using the differential genes annotated by the GO term, and the p-value was calculated by the hypergeometric distribution method (p-value < 0.05 was the standard for significant enrichment) for comparison with the whole genome background. Biochemical pathway annotation and enrichment analyses were performed using the Kyoto Encyclopedia of Genes and Genomes (KEGG) [24], with significantly enriched terms also defined as those with FDR < 0.05. The results of gene differential expression analysis were used to screen PPI pairs with differential genes with a score > 0.95 to obtain the correlation between target genes, and the interaction diagram was implemented using Cytoscape [25].

2.5. Quantitative Real-Time PCR Validation

Total RNA was extracted as described above. The first-strand cDNA from 1 μg of total RNA was synthesized from the high-integrity RNA using FastKing RT Kit (TIANGEN, Beijing). The cDNA was used as a template in a final volume of 20 μg for qRT-PCR (quantitative real-time PCR), which was implemented by an SYBR Premix ExTaq II Kit a ABI 7500 qPCR instrument. Three technical replicates were done for each sample. The 2−ΔΔCt method was used to determine the target genes’ relative expression levels in each sample [18,26]. For qRT-PCR analysis, GAPDH gene was applied as the reference gene [18]. All gene-specific primers used in this study were listed in Table S1.

3. Results

3.1. Fruit Phenotype and Dynamic Tannin Content in ‘Xinwen179’

Walnut, a member of the Juglandaceae family, is a widely cultivated economic fruit crop rich in unsaturated fatty acids, melatonin, vitamins, polyphenols, and a variety of microelements. Although walnut has been widely used as an edible fruit or for medicine and healthcare, among other purposes, the abundant polyphenol resources (especial for tannins) in the walnut shell and pellicle were a critical factor that tremendously limited further applications of the plant. The early-flowering walnut variety ‘Xinwen179’ has strong adaptability, as well as high and stable yield ability with a flexible cultivation mode, and could be used for breeding as intermediate genetic material. The ‘Xinwen179’ pellicle tannin content was lower than other varieties with a similar inflection point in the developmental process, so its pellicle was selected for further transcriptome sequencing (RNA-seq) to identify and validate genes that are highly associated with low tannin metabolism regulation in early-fruiting walnut, which would lay the foundation for later genetic improvement. The workflow of RNA-seq for ‘Xinwen179’ pellicle tissues in this study was indicated in Figure 1A.
We collected fruit with three biological replicates in seven stages (8-, 9-, 11-, 13-, 15-, 17-, 19-week, later referred to as 8 W, 9 W, 11 W, 13 W, 15 W, 17 W, 19 W) after the flowering of walnut ‘Xinwen179’ and performed a tannin-based imprinting experiment involving cross- and longitudinal-sectioning to obtain the whole tannin content (Figure 1B). The pellicle of the fruit was separated and stripped for further determination of tannin content. The tannin content was almost unchanged from the 8 W to 11 W pellicle, but there was a sharp increase from 11 W to 15 W, with the highest tannin content present in the 15W pellicle. This increase was followed by a fast decrease from 15 W to 17 W and a slow decrease from 17 W to 19 W (Figure 1C).

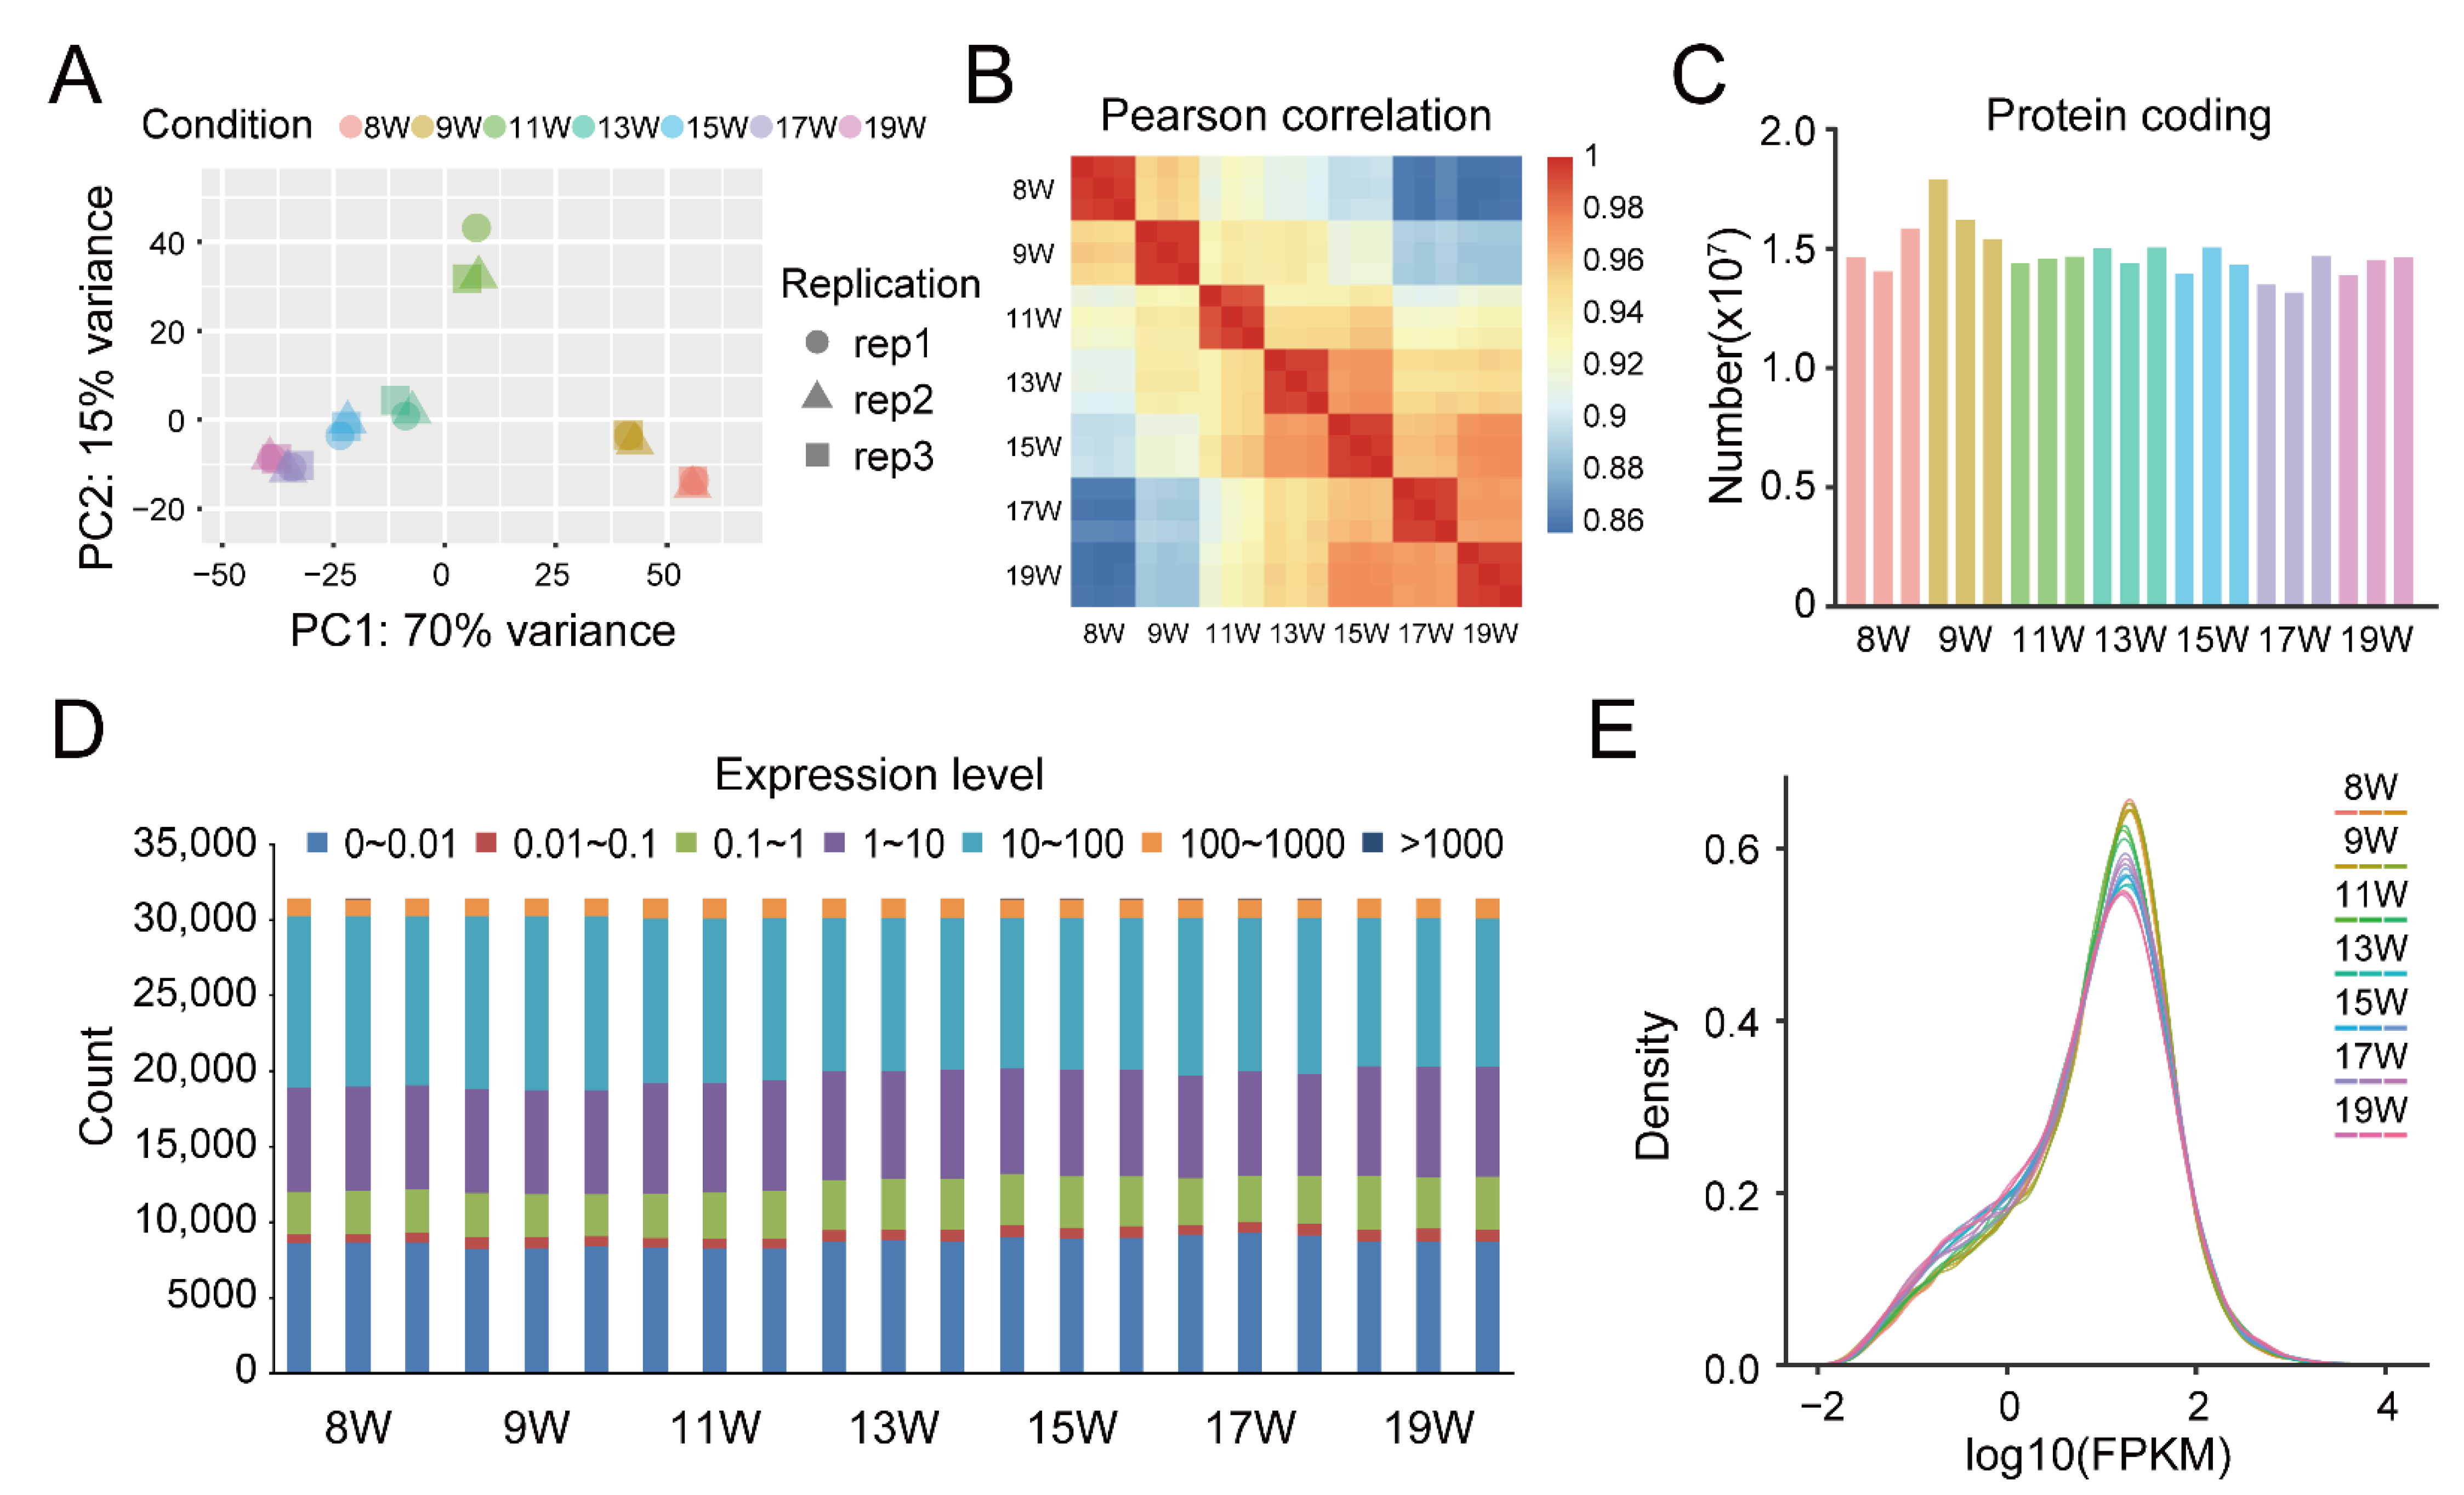
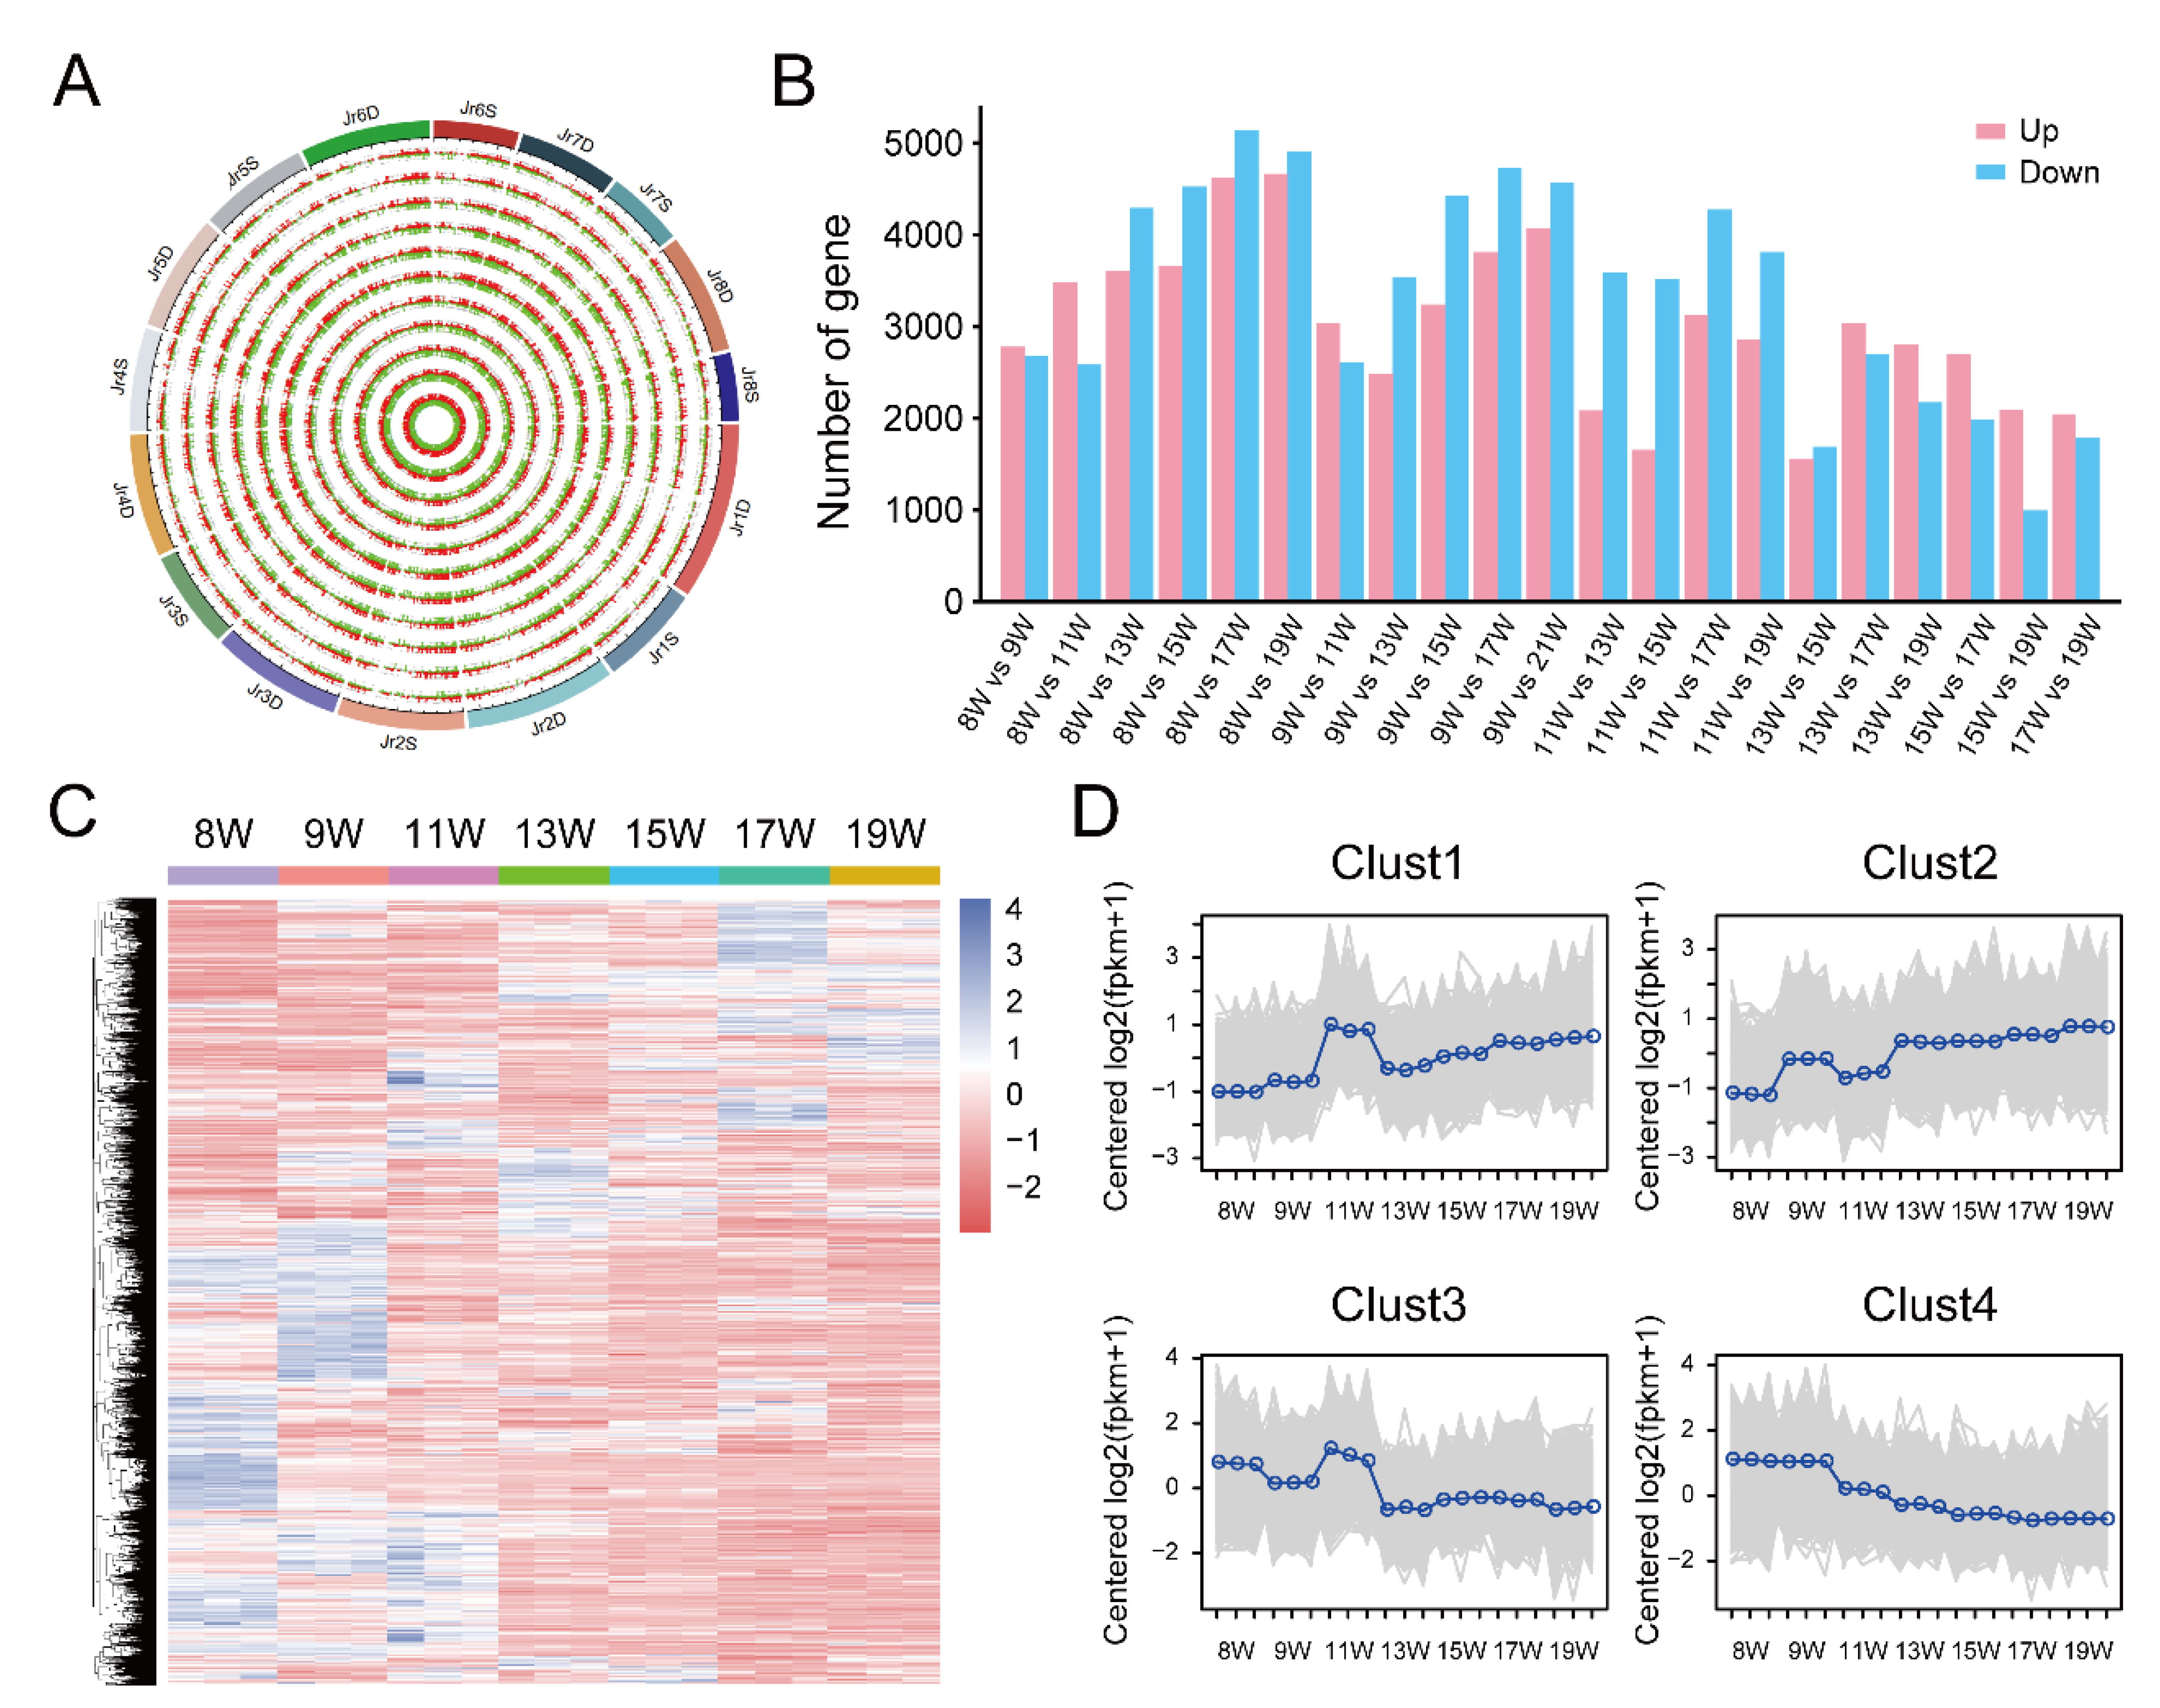
3.2. RNA-seq Results of Dynamic Development Stages of Walnut Pellicles

Transcriptome sequencing of walnut pellicles involved in these seven stages was implemented to identify potential genes and molecular mechanisms in tannin metabolism regulation. A total of 21 pellicle samples at the differential stage were extracted, and the RNA libraries were prepared and sequenced with the Illumina HiSeq2500 platform. Statistics of the RNA-Seq profiles in ‘Xinwen179’ at 8 W, 9 W, 11 W, 13 W, 15 W, 17 W, and 19 W are listed in Table 1. Low-quality reads and adapter sequences were filtered, and the high-quality clean reads were produced at average rates of 97.70%, and 93.75%, Q20, and Q30 values, respectively, indicating the transcriptome sequencing data were of high-quality and suitable for further analysis (Table 1). These data have been submitted to the Gene Expression Omnibus (GEO) database of the National Center for Biotechnology Information (NCBI) and shared with the accession number GSE209790.
These clean data were aligned to the walnut reference genome using Hisat2 software1; the mapped rate ranged from 95.60% to 95.99%, with an average of 95.59% (Table 1), indicating that there was no pollution in the experiments. Only the uniquely mapped reads were retained for subsequent transcript assembly and gene expression calculation. The gene expression level was calculated and normalized with fragments per kilobase of transcript per million mapped reads (FPKM) (Table S2).
To gain insight into the transcriptome of pellicle tannin metabolism regulation, we implemented principal component analysis (PCA) (Figure 2A), Pearson correlation analysis (Figure 2B), reads annotation in protein-coding genes (Figure 2C), analysis of different expression level divided into seven categories (Figure 2D), and density analysis of gene expression level (Figure 2E). PCA analysis identified two principal components (PCs) that explained 85.0% of the variance of the 21 samples in the transcriptome sequencing data (Figure 2A), and the Pearson correlation coefficients were all above 0.94 between the three biological replicates of samples from different stages (Figure 2B), indicating the three biological replicates have very high repeatability. The average number of reads annotated in protein-coding genes in the 9 W pellicle sample was higher than in the other samples (Figure 2C). To decrease the effect of transcription noise, we divided genes into seven categories (0~0.01, 0.01~0.1, 0.1~1, 1~10, 10~100, 100~100, and >1000) and defined expressed genes and non-expressed genes with an FPKM cutoff ≥1, and the results indicated that most genes were expressed (Figure 2D). The density of genes slowly decreased from 8 W to 19 W (Figure 2E).
In order to identify the dynamic changes in gene expression associated with tannin metabolism regulation during pellicle development after flowering, analysis of the differentially expressed genes (DEGs) was implemented using FPKM from 21 samples with standard parameters and fold change (FC) > 2 and p < 0.05 in R package DEseq2. Twenty-one groups of DEGs were identified and visualized in all chromosomes using a Circos plot and histogram (Figure 3A,B) and an upset diagram that intuitively shows the number of common and unique differentially expressed genes between different comparison groups (Figure S1). A clustering analysis was performed to better understand the expression pattern of the DEGs among the comparison groups (Figure 3C). All DEGs were clustered into four groups. Gene expression levels in cluster 1 slowly increased, and a peak appeared in the 11 W sample, while gene expression levels in cluster 4 slowly decreased over time (Figure 3D).

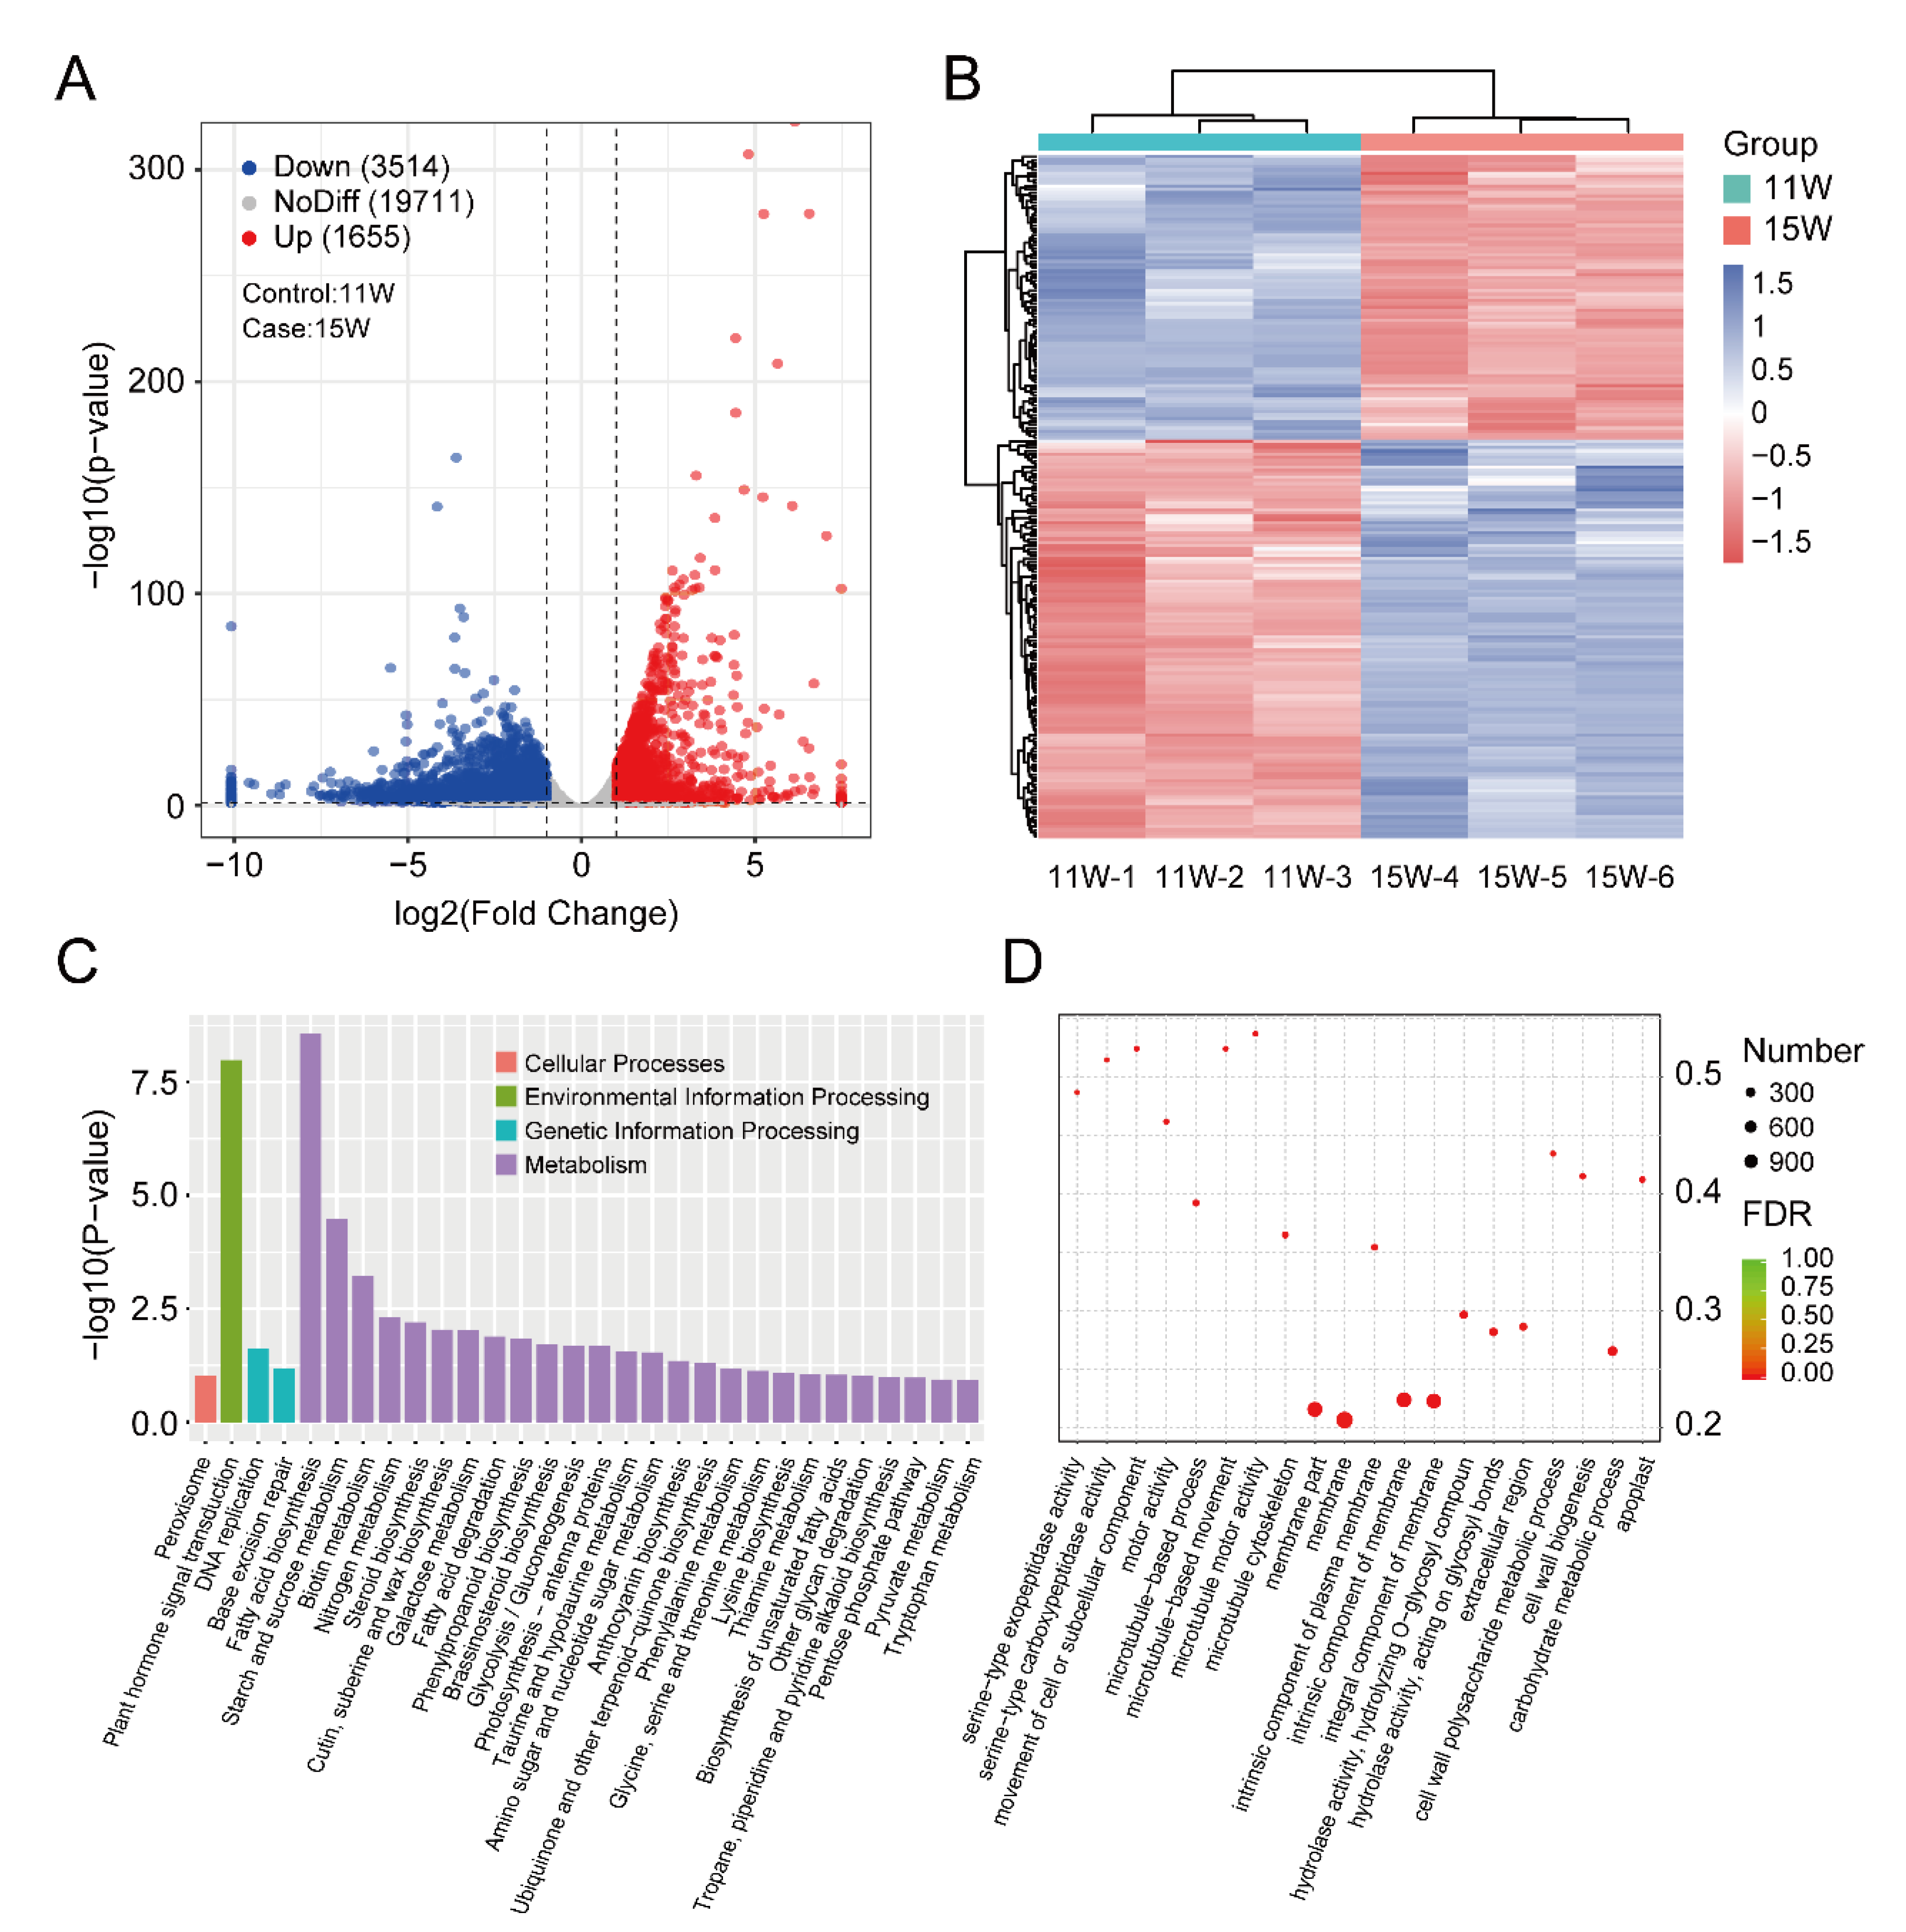
3.3. Identification and Enrichment Analysis of DEGs between 11 W and 15 W Sample

To identify genes closely related to tannin metabolism regulation, we selected 11 W and 15 W pellicle samples, where tannin content was sharply increased (Figure 1B) for DEGs analysis. There were a total of 5169 genes identified as significant DEGs, of which 1655 genes (32%) were upregulated and 3514 genes (68%) were downregulated (Figure 4A). We also implemented a clustering analysis to better understand the pattern between 15 W and 19 W samples (Figure 4B). The regulated network of DEG was also conducted to identify hub genes (Figure S2).
To determine the functions of the DEGs, a KEGG (Kyoto Encyclopedia of Genes and Genomes) analysis [24] was implemented to investigate the biochemical pathways. First, all DEGs were mapped to the KEGG term database w significance of enrichment, defined with a cutoff p < 0.5. The DEGs involved in ‘Plant hormone signal transduction, ‘Fatty acid biosynthesis’, ‘Starch and sucrose metabolism’, ‘Biotin metabolism’, and ‘Nitrogen metabolism’ were the five most common significantly enriched terms (Figure 4C,D).

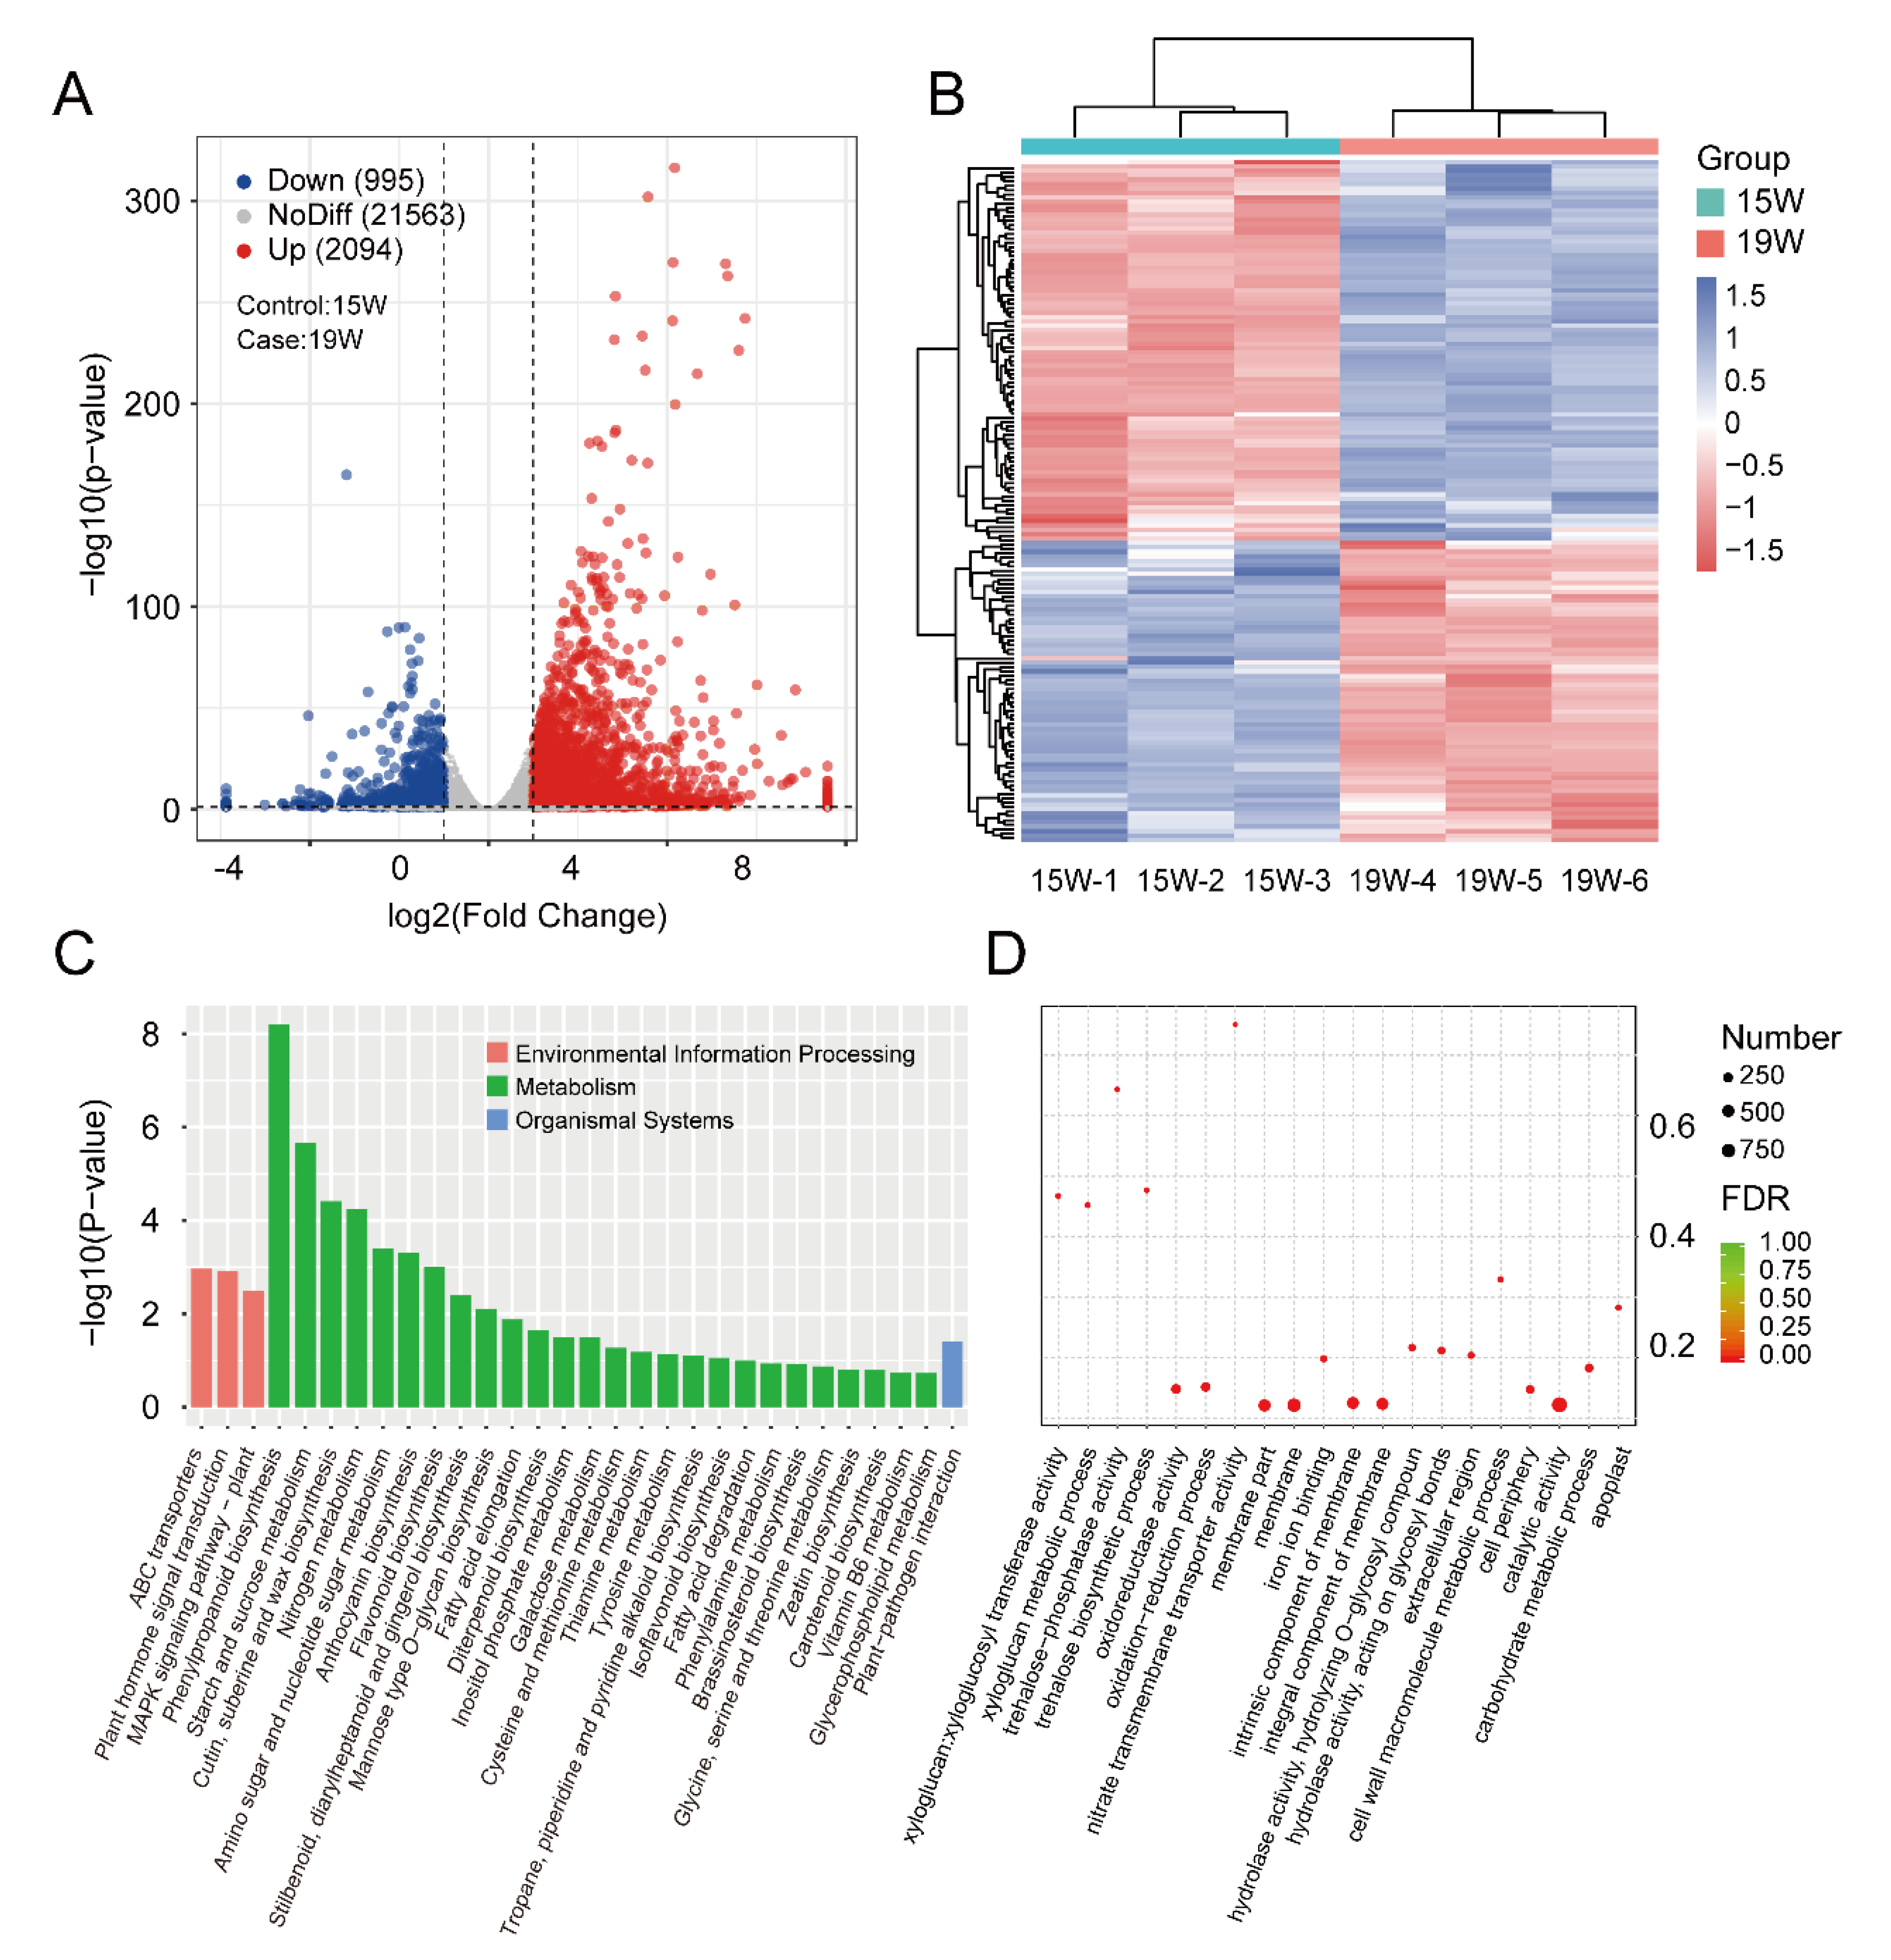
3.4. Identification and Enrichment Analysis of DEGs between the 15 W and 19 W Samples

We selected 15 W and 19 W pellicle samples, a period in which tannin content decreased first quickly (15 W to 17 W) and then very slowly (17 W to 19 W) (Figure 1B), in terms of DEGs. There was a total of 3049 genes identified as significant DEGs, of which 2094 (69%) were upregulated and 955 (31%) were downregulated (Figure 5A). We implemented clustering analysis to better understand the pattern between 15 W and 19 W samples (Figure 5B). The regulated network of DEGs was created to identify hub genes (Figure S3).
To determine the functions of the DEGs, a KEGG analysis was implemented to investigate the biochemical pathways. First, all DEGs were mapped to the KEGG term database, with significantly enriched terms identified with a cutoff p < 0.5. These DEGs are involved in ‘Phenylpropanoid biosynthesis’, ‘Starch and sucrose metabolism’, ‘Cutin suberin and wax biosynthesis’, ‘Nitrogen metabolism’, ‘Amino sugar and nucleotide sugar metabolism’, ‘Anthocyanin biosynthesis’, and ‘Flavonoid biosynthesis’, and were the six most common significantly enriched terms in the metabolism category (Figure 5C,D). These results suggest the DEGs could directly participate in tannin metabolism regulation.

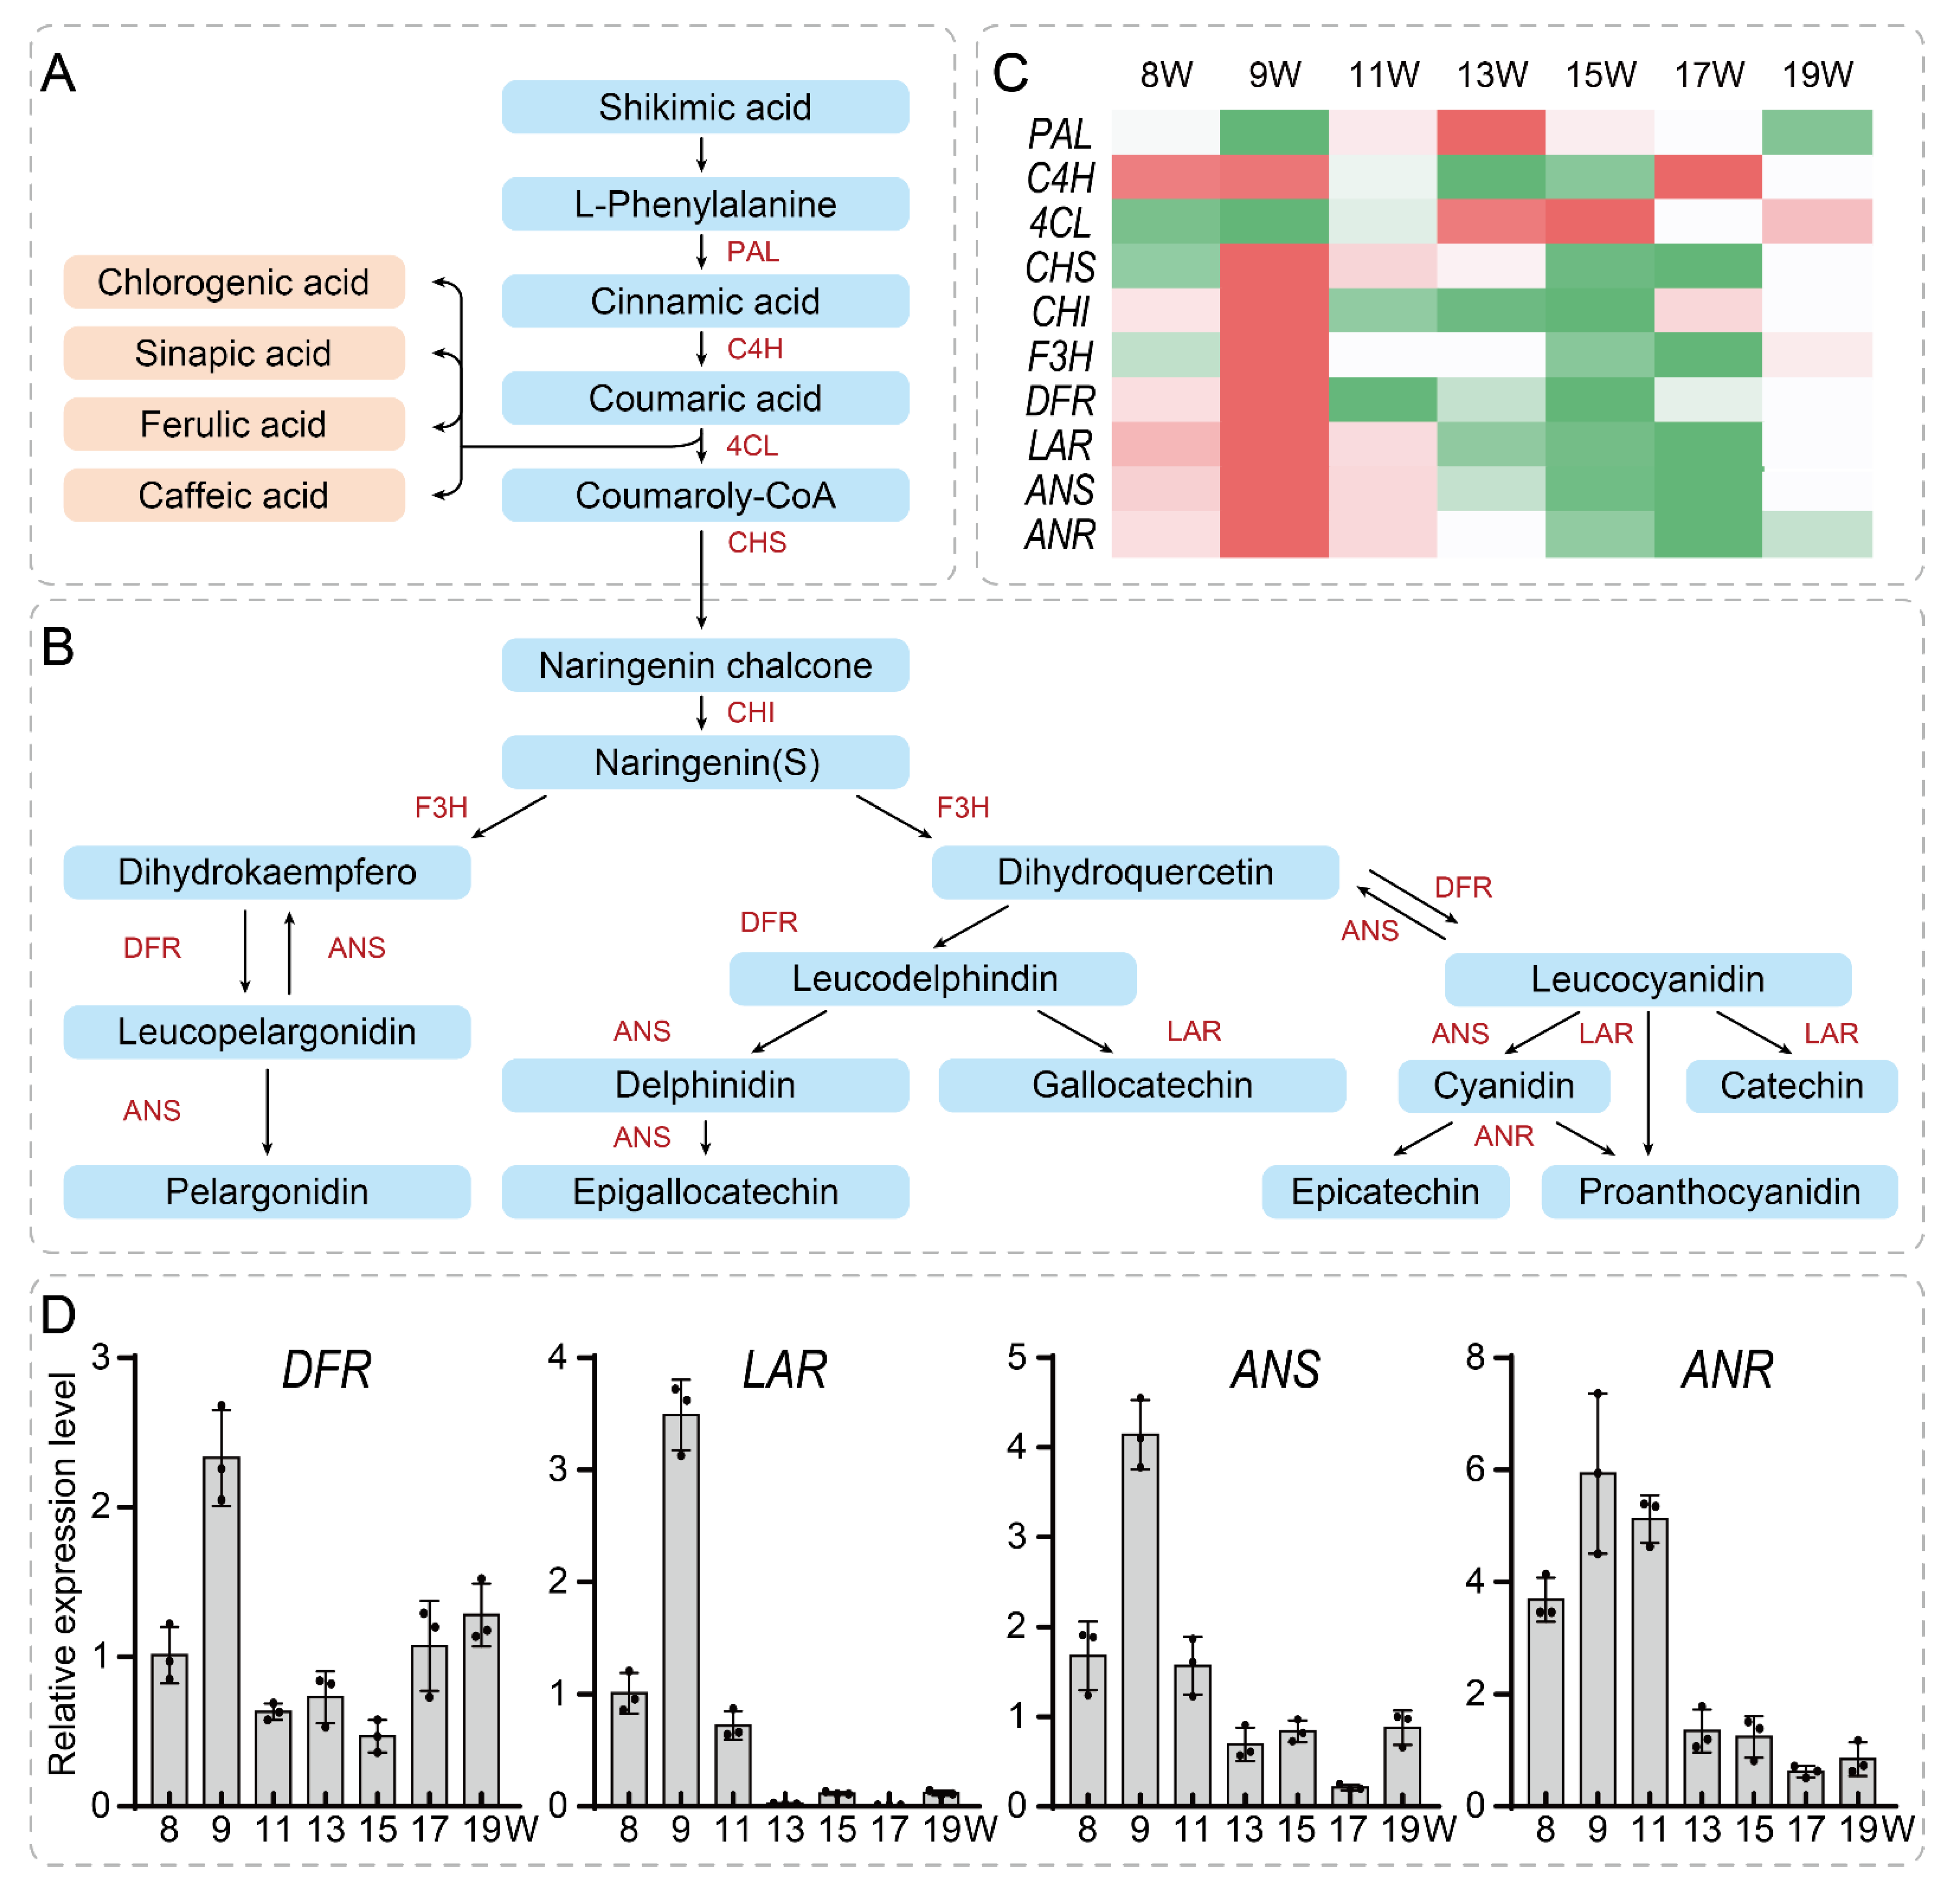
3.5. Network Construction and Validation of Key Genes Related to the Tannin Synthesis Pathway in the Walnut Pellicle

To identify key genes involved in tannin metabolism regulation, we summarized the tannin synthesis pathway based on flavonoid metabolic pathway, phenylalanine metabolic pathway, and shikimic acid metabolic pathway information on the KEGG website (Figure 6).
The first step of phenylpropanoid metabolism begins with shikimic acid and flavanol as a precursor to the synthesis of tannins [27,28,29]. Phenylalanine ammonia-lyase (PAL) deaminates phenylalanine to produce cinnamic acid. Cinnamic acid is then hydroxylated to produce p-coumaric acid by cinnamic acid 4-hydroxylase (C4H), which is followed by 4-coumarate-CoA ligase (4CL) to produce p-coumaroyl CoA (Figure 6A). The p-coumaroyl CoA can commit to the flavonoid pathway via chalcone synthase (CHS). Naringenin is formed by chalcone isomerase (CHI), which is acted on by flavanone 3-hydroxylase (F3H) to produce the dihydrokaempferol and dihydroquercetin. The dihydroflavonol-4-reductase (DFR) acts on dihydroquercetin to make leucodelphinidin and leucocyanidin. Leucodelphinidin can produce gallocatechin via interaction with leucoanthocyanidin reductase (LAR), produce delphinidin via interaction with anthocyanidin synthase (ANS), then produce epigallocatechin via interaction with anthocyanidin reductase (ANR). The leucocyanidin could produce proanthocyanidin (PA) and catechin via interaction with leucoanthocyanidin reductase (LAR). PA is also known as condensed tannins. Leucocyanidin can also produce cyanidin via interaction with anthocyanidin synthase (ANS), then produce epicatechin or proanthocyanidin (PA) via interaction with anthocyanidin reductase (ANR) (Figure 6B). Among these, gallocatechin, epigallocatechin, catechin, and epicatechin are important hydrolytic tannins. By heatmap analysis, we found that four enzyme genes such as DFR (Jr4DG00161700), LAR (Jr8SG00081600), ANS (Jr6DG00150000), and ANR (Jr5DG00075400) shared the same expression pattern that was expressed most highly at early stages of walnut pellicle development and decreased from 15 W to 19 W (Figure 6C). We have also performed qRT-PCR assays to confirm these four genes: DFR, LAR, ANS and ANR. The qRT-PCR data revealed similar expression pattern with those shown by RNA-seq (Figure 6D). Among these genes, ANR encodes a direct upstream enzyme for catalyzing PAs accumulation. Considering in accordance with the tannin content during pellicle development, ANR may be a candidate gene that directly contribute to PAs accumulation. Together, we revealed a large scale of DEGs that may associate with walnut pellicle development.

4. Discussion

In this study, we have presented RNA-seq profiles of the walnut pellicle during walnut development. We have constructed a total of 21 pellicle samples at seven stages (8 W, 9 W, 11 W, 13 W, 15 W, 17 W, and 19 W). By RNA-seq, Q20 and Q30 values were at an average rate of 97.70% and 93.75%, indicating our RNA-seq profiles were of high-quality and suitable for further analysis for pellicle development in walnut. Note that, to make our data open-access, all the RNA-seq data have been submitted to GEO database of the NCBI (GSE209790).
Agro-forest waste is a major problem during the harvesting and processing of walnuts because inedible parts (green husk, shell, and pellicle) are produced and usually discarded [2]. Determining ways to use these inedible parts during walnut processing will meet the demands for sustainable and green agriculture. Recent studies have demonstrated that these inedible parts, like the green husk, could be a source of natural bioactive compounds due to their high secondary metabolite content (tannins) [2,3]. However, little is known about the phenolic biosynthetic pathway in walnut pellicles. Identifying the genetic regulatory mechanisms underlying modulation of the phenolic biosynthetic pathway contributes to new walnut breeding goals for sustainable and green agriculture and contributes to the study of the genetic cues controlling pellicle development in other woody perennials more broadly.
In plants, the tannin biosynthesis pathways are composed of a shikimic acid pathway, phenylpropane pathway, core flavonoid-anthocyanin pathway, and procyanidin-specific pathway [27,28]. DFR, LAR, ANS, and ANR were the key enzyme genes involved in the tannin-specific production pathway. In this study, we have measured the tannin content during walnut pellicle development, and found that tannin content was gradually increased at early stages but gradually reduced after a 15-week stage during walnut pellicle development. To address this question, we have successfully identified that the expression level of ANR (Jr5DG00075400) was related to the change of tannin content during walnut pellicle development. For this tannin metabolic pathway, several well-established transcription factors (TFs) are involved in this pathway in plants [27,28,29]. Therefore, we supposed this pathway would also be regulated by related TFs in walnut. We have analyzed the differentially expressed TFs, including bHLH, ERF, MYB, NAC, MYB, and WRKY families (Figure S4), and examined the protein–protein interaction network of TFs associated with key enzyme genes in the tannin biosynthesis pathway (Figure S5). In addition, because epigenetic modifications have been considered as a major driver for understanding the potential mechanisms of fruit development [30,31], our long-term goals will commit to identify functional impacts of epigenetic modifications during walnut fruit development.
In conclusion, this study profiled the transcriptional changes of DEGs in walnut pellicle development. We have constructed a total of 21 pellicle samples at the seven stages with high-quality RNA-seq data. We have mainly investigated the PAs pathway and related genes in walnut pellicles, and successfully identified the dynamic expression pattern of the important gene ANR. Our study not only provides new insights into understanding the mechanisms of the PAs biosynthesis for pellicle development, but also makes a contribution toward breeding and utilization of walnut in the future.

Supplementary Materials

The following supporting information can be downloaded at: https://www.mdpi.com/article/10.3390/horticulturae8090784/s1, Figure S1: The upset diagram of several DEGs in a different group; Figure S2: Network of key DEGs between 11 W and 15 W samples; Figure S3: Network of key DEGs between 15 W and 19 W samples; Figure S4: The differential expressed transcription factors; Figure S5: The protein-protein interaction network of a differentially expressed transcription factor; Table S1: Summary of qRT-PCR primers used in this study; Table S2: Summary of gene expression levels and annotations in walnut pellicle at seven developmental stage.

Author Contributions

Conceptualization, Q.J., C.W., R.Z. and Z.L.; methodology, S.G.; software, S.G.; validation, Q.J., R.M. and R.Z.; formal analysis, R.M.; investigation, Q.J. and F.S.; resources, Q.J.; data curation, R.M.; writing—original draft preparation, Q.J.; writing—review and editing, R.M., Q.Z. and Z.L.; visualization, S.G.; supervision, C.W., R.Z. and Z.L.; project administration, C.W., R.Z. and Z.L.; funding acquisition, Q.J. and Z.L. All authors have read and agreed to the published version of the manuscript.

Funding

This research was funded by the Major Scientific and Technological Projects of XPCC (2017DB006), and the President’s Fund Innovative Research Team Project of the Tarim University (TDZKCX202101), and the Joint Fund of Tarim University and Huazhong Agricultural University (HNLH202004), and the National-Local Joint Engineering Laboratory of High Efficiency and Superior-Quality Cultivation and Fruit Deep Processing Technology on Characteristic Fruit Trees in Southern Xinjiang Open Project (FE201901).

Data Availability Statement

The raw data sequences have been submitted to the Gene Expression Omnibus (GEO) database of the National Center for Biotechnology Information (NCBI) under the accession number GSE209790.

Acknowledgments

The authors thank Pingxian Zhang (from Huazhong Agricultural University, China) for his technical support and Aamir Ali Shaikh (from Huazhong Agricultural University, China) for language improvement of this manuscript.

Conflicts of Interest

The authors declare no conflict of interest.

References

  1. Bernard, A.; Lheureux, F.; Dirlewanger, E. Walnut: Past and future of genetic improvement. Tree Genet. Genomes 2018, 14, 1–28. [Google Scholar] [CrossRef]
  2. Jahanban-Esfahlan, A.; Ostadrahimi, A.; Tabibiazar, M.; Amarowicz, R. A comprehensive review on the chemical constituents and functional uses of walnut (Juglans spp.) husk. Int. J. Mol. Sci. 2019, 20, 3920. [Google Scholar] [CrossRef] [PubMed]
  3. Sheng, F.; Hu, B.; Jin, Q.; Wang, J.; Wu, C.; Luo, Z. The analysis of phenolic compounds in walnut husk and pellicle by UPLC-Q-Orbitrap HRMS and HPLC. Molecules 2021, 26, 3013. [Google Scholar] [CrossRef]
  4. Hardman, W.E. Walnuts have potential for cancer prevention and treatment in mice. J. Nutr. 2014, 144, 555S–560S. [Google Scholar] [CrossRef]
  5. Pandey, K.B.; Rizvi, S.I. Plant polyphenols as dietary antioxidants in human health and disease. Oxid. Med. Cell. Longev. 2009, 2, 270–278. [Google Scholar] [CrossRef] [PubMed]
  6. Trandafir, I.; Cosmulescu, S.; Nour, V. Phenolic profile and antioxidant capacity of walnut extract as influenced by the extraction method and solvent. Int. J. Food Eng. 2017, 13, 1–8. [Google Scholar] [CrossRef]
  7. Martínez, M.L.; Labuckas, D.O.; Lamarque, A.L.; Maestri, D.M. Walnut (Juglans regia L.): Genetic resources, chemistry, by-products. J. Sci. Food Agric. 2010, 90, 1959–1967. [Google Scholar] [CrossRef]
  8. Jahanban-Esfahlan, A.; Amarowicz, R. Walnut (Juglans regia L.) shell pyroligneous acid: Chemical constituents and functional applications. RSC Adv. 2018, 8, 22376–22391. [Google Scholar] [CrossRef]
  9. Persic, M.; Mikulic-Petkovsek, M.; Slatnar, A.; Solar, A.; Veberic, R. Changes in phenolic profiles of red-colored pellicle walnut and hazelnut kernel during ripening. Food Chem. 2018, 252, 349–355. [Google Scholar] [CrossRef]
  10. Colaric, M.; Veberic, R.; Solar, A.; Hudina, M.; Stampar, F. Phenolic acids, syringaldehyde, and juglone in fruits of different cultivars of Juglans regia L. J. Agric. Food Chem. 2005, 53, 6390–6396. [Google Scholar] [CrossRef]
  11. Hu, B.; Sheng, F.; Jin, Q.; Wang, J.; Wu, C.; Chen, W.; Luo, Z. Characterization of the 5-enolpyruvylshikimate-3-phosphate synthase gene from walnut (Juglans regia L.). Hortic. J. 2022, 91, 176–185. [Google Scholar] [CrossRef]
  12. Quan, S.; Niu, J.; Zhou, L.; Xu, H.; Ma, L.; Qin, Y. Stages identifying and transcriptome profiling of the floral transition in Juglans regia. Sci. Rep. 2019, 9, 7092. [Google Scholar] [CrossRef] [PubMed]
  13. Hassankhah, A.; Rahemi, M.; Ramshini, H.; Sarikhani, S.; Vahdati, K. Flowering in Persian walnut: Patterns of gene expression during flower development. BMC Plant Biol. 2020, 20, 136. [Google Scholar] [CrossRef] [PubMed]
  14. Song, Y.; Zhang, R.; Gao, S.; Pan, Z.; Guo, Z. Transcriptome analysis and phenotyping of walnut seedling roots under nitrogen stresses. Sci. Rep. 2022, 12, 12066. [Google Scholar] [CrossRef]
  15. Marrano, A.; Britton, M.; Zaini, P.A.; Zimin, A.V.; Workman, R.E.; Puiu, D.; Bianco, L.; Di Pierro, E.A.; Allen, B.J.; Chakraborty, S.; et al. High-quality chromosome-scale assembly of the walnut (Juglans regia L.) reference genome. Gigascience 2020, 9, giaa050. [Google Scholar] [CrossRef]
  16. Zhang, J.; Zhang, W.; Ji, F.; Qiu, J.; Song, X.; Bu, D.; Pan, G.; Ma, Q.; Chen, J.; Huang, R.; et al. A high-quality walnut genome assembly reveals extensive gene expression divergences after whole-genome duplication. Plant Biotechnol. J. 2020, 18, 1848–1850. [Google Scholar] [CrossRef]
  17. Zhu, T.; Wang, L.; You, F.M.; Rodriguez, J.C.; Deal, K.R.; Chen, L.; Li, J.; Chakraborty, S.; Balan, B.; Jiang, C.Z.; et al. Sequencing a Juglans regia × J. microcarpa hybrid yields high-quality genome assemblies of parental species. Hortic. Res. 2019, 6, 55. [Google Scholar] [CrossRef] [PubMed]
  18. Jin, Q.; Mo, R.; Chen, W.; Zhang, Q.; Sheng, F.; Wu, C.; Zhang, R.; Luo, Z. Identification and comparative analysis of genes and microRNAs involved in the floral transition of the Xinjiang early-flowering walnut (Juglans regia L.). Horticulturae 2022, 8, 136. [Google Scholar] [CrossRef]
  19. Wang, W.; Wen, H.; Jin, Q.; Yu, W.; Li, G.; Wu, M.; Bai, H.; Shen, L.; Wu, C. Comparative transcriptome analysis on candidate genes involved in lipid biosynthesis of developing kernels for three walnut cultivars in Xinjiang. Food Sci. Hum. Wellness 2022, 11, 1201–1214. [Google Scholar] [CrossRef]
  20. Zhao, S.; Zhang, X.; Su, Y.; Chen, Y.; Liu, Y.; Sun, M.; Qi, G. Transcriptome analysis reveals dynamic fat accumulation in the walnut kernel. Int. J. Genom. 2018, 2018, 8931651. [Google Scholar] [CrossRef]
  21. Gou, Y.; Cheng, S.; Ye, J.; Zhou, X.; Xu, F.; Chen, Z.; Zhang, W.; Liao, Y. Comparative transcriptome analysis reveals the potential molecular mechanism involved in fatty acids biosynthesis of Juglans regia. Sci. Hortic. 2020, 269, 109388. [Google Scholar] [CrossRef]
  22. Love, M.I.; Huber, W.; Anders, S. Moderated estimation of fold change and dispersion for RNA-seq data with DESeq2. Genome Biol. 2014, 15, 550. [Google Scholar] [CrossRef] [PubMed]
  23. Tian, T.; Liu, Y.; Yan, H.; You, Q.; Yi, X.; Du, Z.; Xu, W.; Su, Z. AgriGO v2.0: A GO analysis toolkit for the agricultural community, 2017 update. Nucleic Acids Res. 2017, 45, W122–W129. [Google Scholar] [CrossRef] [PubMed]
  24. Kanehisa, M.; Furumichi, M.; Tanabe, M.; Sato, Y.; Morishima, K. KEGG: New perspectives on genomes, pathways, diseases and drugs. Nucleic Acids Res. 2017, 45, D353–D361. [Google Scholar] [CrossRef]
  25. Shannon, P.; Markiel, A.; Ozier, O.; Baliga, N.S.; Wang, J.T.; Ramage, D.; Amin, N.; Schwikowski, B.; Ideker, T. Cytoscape: A software Environment for integrated models of biomolecular interaction networks. Genome Res. 2003, 13, 2498–2504. [Google Scholar] [CrossRef]
  26. Zhang, P.; Li, X.; Wang, Y.; Guo, W.; Chachar, S.; Riaz, A.; Geng, Y.; Gu, X.; Yang, L. PRMT6 physically associates with nuclear factor Y to regulate photoperiodic flowering in Arabidopsis. aBIOTECH 2021, 2, 403–414. [Google Scholar] [CrossRef]
  27. Zhu, Z.; Wang, H.; Wang, Y.; Guan, S.; Wang, F.; Tang, J.; Zhang, R.; Xie, L.; Lu, Y. Characterization of the cis elements in the proximal promoter regions of the anthocyanin pathway genes reveals a common regulatory logic that governs pathway regulation. J. Exp. Bot. 2015, 66, 3775–3789. [Google Scholar] [CrossRef]
  28. Jaakola, L. New insights into the regulation of anthocyanin biosynthesis in fruits. Trends Plant Sci. 2013, 18, 477–483. [Google Scholar] [CrossRef]
  29. Chen, W.; Zheng, Q.; Li, J.; Liu, Y.; Xu, L.; Zhang, Q.; Luo, Z. DkMYB14 is a bifunctional transcription factor that regulates the accumulation of proanthocyanidin in persimmon fruit. Plant J. 2021, 106, 1708–1727. [Google Scholar] [CrossRef]
  30. Shaikh, A.A.; Chachar, S.; Chachar, M.; Ahmed, N.; Guan, C.; Zhang, P. Recent advances in DNA methylation and their potential breeding applications in plants. Horticulturae 2022, 8, 562. [Google Scholar] [CrossRef]
  31. Chachar, S.; Chachar, M.; Riaz, A.; Shaikh, A.A.; Li, X.; Li, X.; Guan, C.; Zhang, P. Epigenetic modification for horticultural plant improvement comes of age. Sci. Hortic. 2022, 292, 110633. [Google Scholar] [CrossRef]
Figure 1. Phenotype and dynamic content of tannin in walnut variety ‘Xinwen179’. (A) Overview of the experimental design. The fruits of early-flowering walnut cultivar ‘Xingwen179’ were harvested at seven stages (8 W, 9 W, 11 W, 13 W, 15 W, 17 W, and 19 W). RNA-seq was performed with three biological repeats; (B) he phenotype of walnut variety ‘Xinwen179’ from 8 W to 19 W, showing the appearance of fruit (upper panel) in cross- and longitudinal sections (bar = 1 cm); (C) Tannin content with three biological replicates (rep).
Horticulturae 08 00784 g001
Figure 2. The profile of RNA library and sequencing. (A) The principal components analysis (PCA) of the sample with three biological replicates (rep), which explains 85% of the variance; (B) heatmap of Pearson correlation coefficients between samples, indicating a high correlation between the three biological replicates; (C) the number of protein-coding genes of each replicate in the samples, annotated by RNA-seq data; (D) the number of genes with different expression levels; (E) the density plot of sample overall gene expression level.
Horticulturae 08 00784 g002
Figure 3. Identification of differentially expressed genes (DEGs). (A) The circos plot shows the distribution of DEGs at a genome-wide scale. These rings from outside to inside show genomic positions (1st), up- and downregulated gene density of each group; (B) the number of up- and downregulated genes; (C) The heatmap of DEGs in which each column represents one sample, and each row represents one DEG. Gene expression level was transformed by Z-score; (D) the line charts show the trend of gene expression level. The genes were divided into four groups (Cluster 1–4).
Horticulturae 08 00784 g003
Figure 4. Identification of DEGs between 11W and 15W samples and functional enrichment analysis. (A) The volcano plot represents up-(red dots) and downregulated genes (blue dots), and no-difference expression genes (grey dots). Dotted lines show the DEG cutoff value of FC > 2 with p < 0.05; (B) the heatmap of Z-score-transformed gene expression level of DEGs; (C) histogram (right panel) representing significantly enriched gene ontology terms, which are divided into biological processes, molecular functions, and cellular component categories; (D) the bubble diagram shows the significantly enriched GO terms.
Horticulturae 08 00784 g004
Figure 5. Identification of DEGs between 15 W and 19 W samples and functional enrichment analysis. (A) The volcano plot represents up- (red dots) and downregulated genes (blue dots), and no-different expression genes (grey dots). Dotted lines show the DEG cutoff value of FC > 2 with p < 0.05; (B) the heatmap of the gene expression level of DEGs, which were transformed by Z-score; (C) the histogram and (right panel) represent the significantly enriched gene ontology (GO) terms, which are divided into the biological process (BP), molecular function (MF), and cellular component (CC); (D) the bubble diagram shows the significantly enriched GO terms.
Horticulturae 08 00784 g005
Figure 6. An overview of the phenylalanine ammonia-lyase pathway leading to the synthesis of tannin (A,B). The tannin signaling pathway was divided into two parts (A,B); (C) Heatmap analysis of the pression levels of key genes by RNA-seq. Red represents high expression level, and green represents low expression level; (D) qRT-PCR validation of expression for key candidate genes that positively regulate tannin biosynthesis. Data points were presented in the column diagram. Bars indicated for s.d. PAL: Phenylalanine ammonia-lyase; C4H: cinnamic acid 4-hydroxylase; 4CL: 4-coumarate-CoA ligase; CHI: chalcone isomerase; F3H: flavanone 3-hydroxylase; DFR: Dihydroflavonol-4-reductase; LAR: leucoanthocyanidin reductase; ANS: anthocyanidin synthase; ANR: Anthocyanidin reductase.
Horticulturae 08 00784 g006
Table 1. Statistics of the RNA-seq profiles in ‘Xinwen179’ at seven different developmental stages.
SampleTotal_Reads nClean_Reads nTotal_Mapped_Reads nMapped_to_Gene nClean_Reads %Total_Mapped Reads %Mapped_to_Gene %Q20 (%)Q30 (%)
8 W-rep142,511,74039,159,42637,524,50831,708,62392.1195.8286.3197.7993.94
8 W-rep240,938,14437,770,66836,109,59030,471,19892.2695.6086.2397.6293.58
8 W-rep346,185,76842,363,09240,505,00234,203,89391.7295.6186.2997.8594.14
9 W-rep151,196,10247,305,83245,316,19438,411,56692.4095.7986.6197.7493.84
9 W-rep246,607,49843,072,26241,186,92934,938,13992.4195.6286.6797.4793.21
9 W-rep344,124,42840,700,10839,029,82733,085,50492.2395.9086.6397.8294.02
11 W-rep141,750,83038,408,43836,772,37930,863,35591.9995.7485.9897.5793.47
11 W-rep242,265,15038,826,20637,207,85731,305,85391.8695.8386.2097.7593.87
11 W-rep342,840,58239,402,13837,728,90131,571,36691.9795.7585.8097.7793.90
13 W-rep143,713,16640,264,61238,592,25632,383,08092.1195.8586.0397.8193.96
13 W-rep241,997,99038,622,04437,020,22931,078,11591.9695.8586.0997.7293.77
13 W-rep343,851,81440,468,31838,805,46332,511,69592.2895.8985.8297.7793.88
15 W-rep140,476,88037,368,50035,870,26129,940,08492.3295.9985.7497.8293.98
15 W-rep243,758,02040,116,42038,471,38432,069,30591.6795.9085.6097.7793.96
15 W-rep341,861,89238,498,62836,864,47030,703,18191.9695.7685.6097.5393.40
17 W-rep140,003,87636,753,14835,241,47628,758,69491.8795.8983.7797.6893.71
17 W-rep238,970,49035,921,27034,387,51228,016,51892.1795.7383.6297.5493.45
17 W-rep343,878,41640,368,63238,648,77131,730,67292.0095.7484.2197.6393.61
19 W-rep140,618,98637,310,47435,784,31529,355,85391.8595.9184.3897.7493.87
19 W-rep242,697,63039,273,19037,627,97330,838,83591.9795.8184.2997.6593.67
19 W-rep343,254,24439,778,67438,088,21231,127,18391.9695.7584.1197.6293.59
Publisher’s Note: MDPI stays neutral with regard to jurisdictional claims in published maps and institutional affiliations.

