
Effect of UV-B Irradiation on Bioactive Compounds of Red Perilla (Perilla frutescens (L.) Britton) Cultivated in a Plant Factory with Artificial Light


Abstract
:1. Introduction
2. Materials and Methods
2.1. Plant Material and Cultivation Conditions
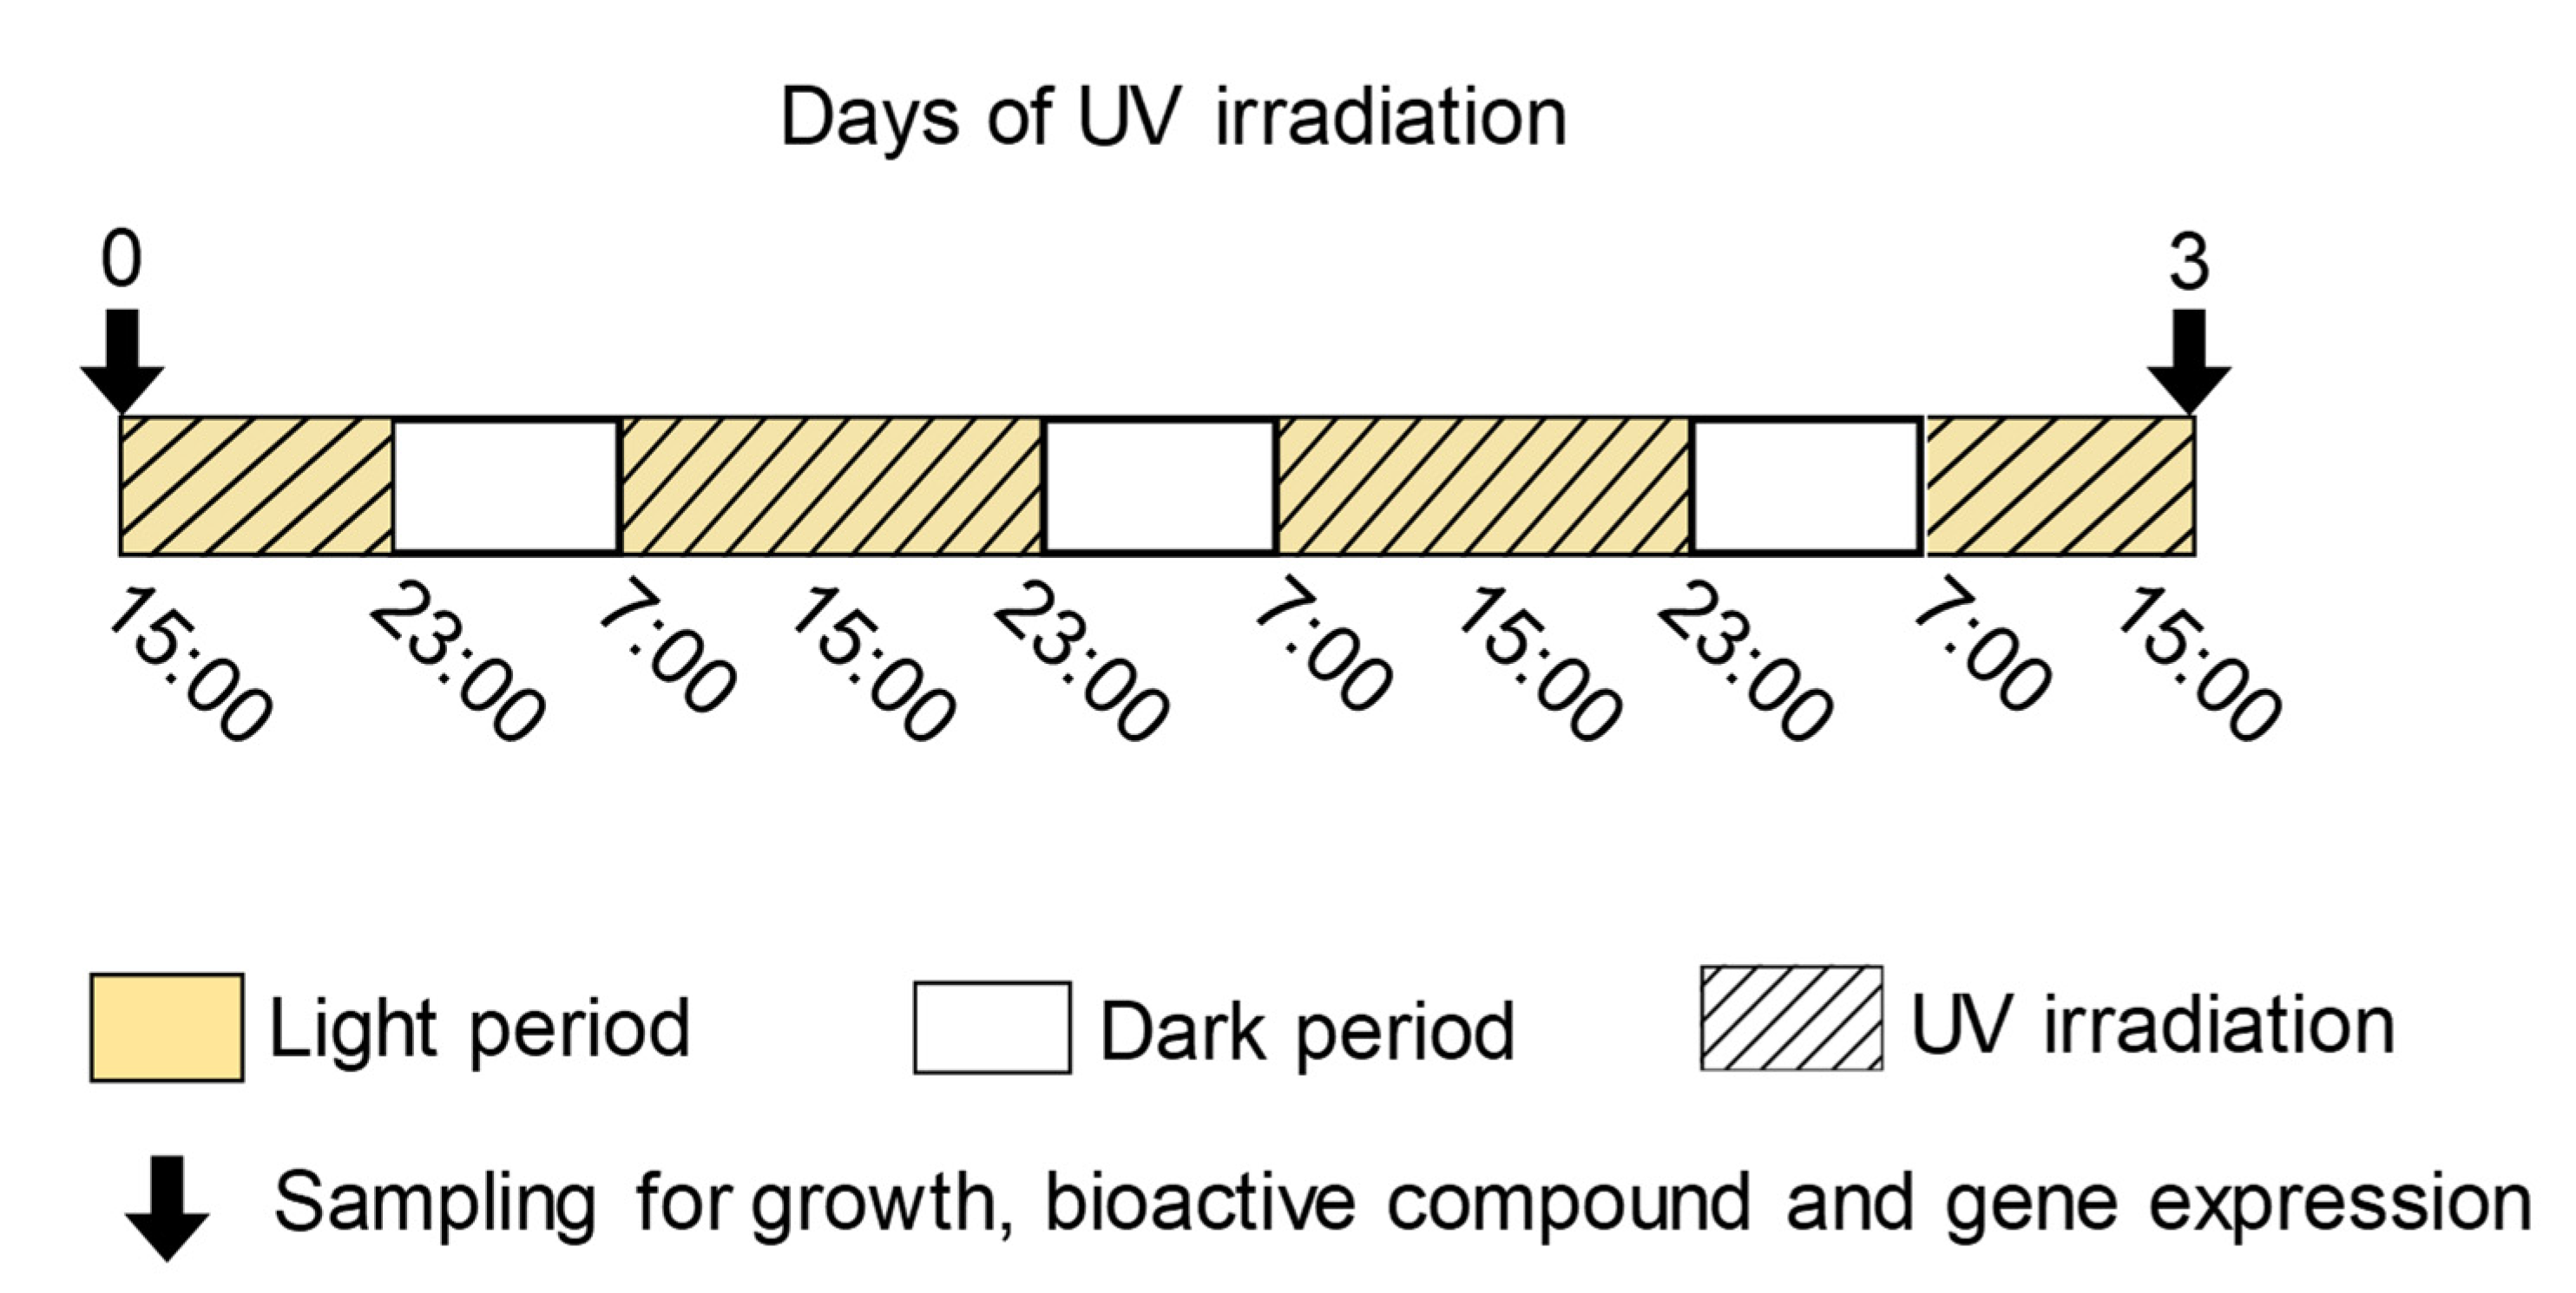
2.2. UV-B Treatment
2.3. Measurement of RA, PA, and ANT Concentrations
2.4. Measurement of Total Oxygen Radical Absorbance Capacity (ORAC)
2.5. Gene Expression Analysis
2.6. Statistical Analysis
3. Results
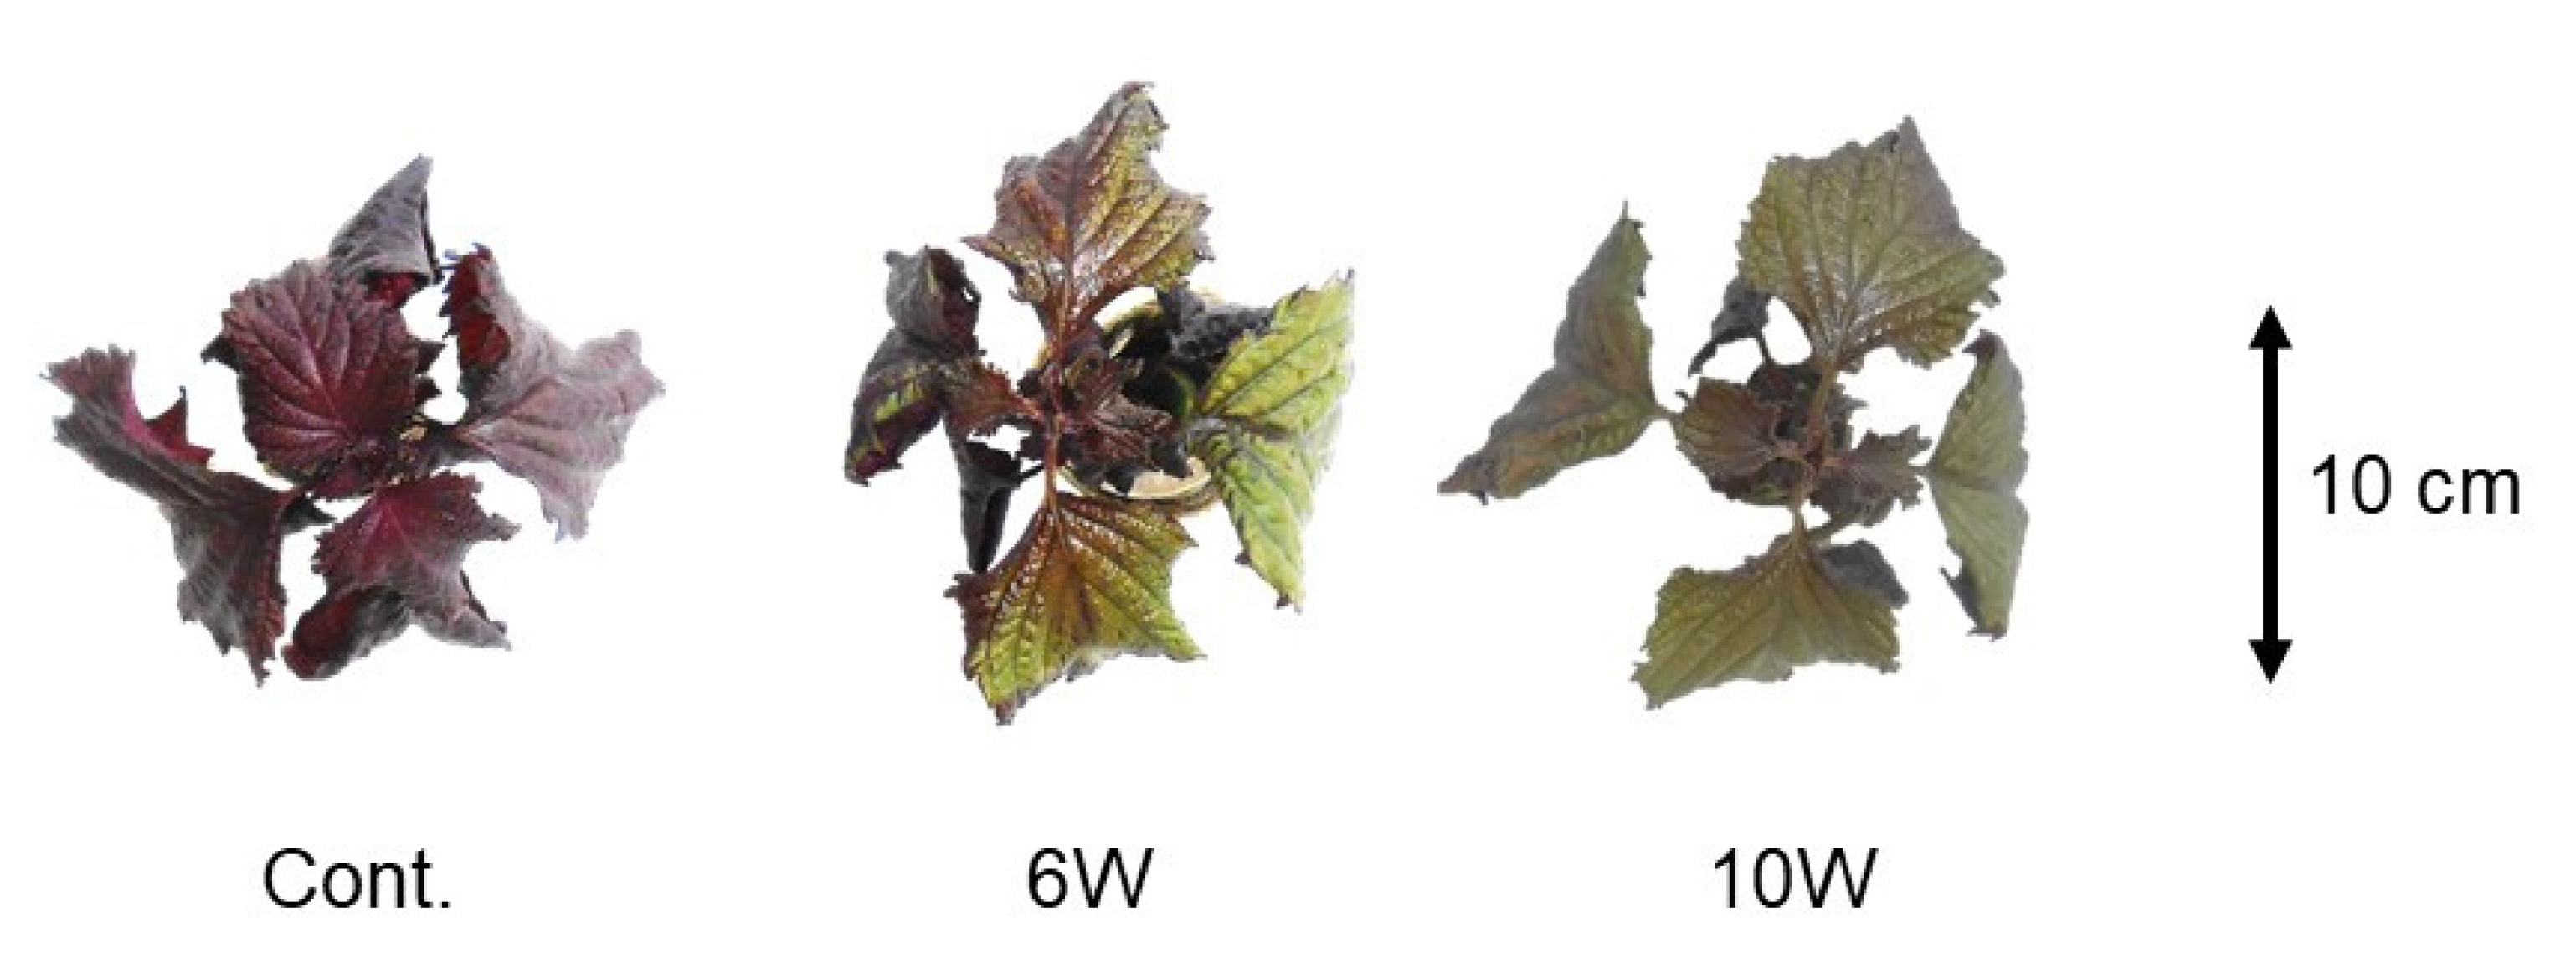
3.1. Experiment 1
3.2. Experiment 2
4. Discussion
4.1. Variations in RA, ANT, and PA Concentrations and ORAC Values under UV-B Irradiation
4.1.1. Variations in PA Concentrations
4.1.2. Variations in RA Concentrations and ORAC Values
4.1.3. Variations in ANT Concentrations and Leaf Growth
4.1.4. RA and ANT for Improvement of Red Perilla Quality
4.2. Comparison of RA and ANT Accumulations under UV Treatments in Light and Dark Periods
4.2.1. Intensity and Dosage of UV-B Irradiation
4.2.2. Time Courses of Expression of Genes Related to RA under UV-B Irradiation with or without a Dark Period
4.2.3. Changes in ANT and Leaf Growth
5. Conclusions
Supplementary Materials
Author Contributions
Funding
Data Availability Statement
Conflicts of Interest
References
- Yu, H.; Qiu, J.F.; Ma, L.J.; Hu, Y.J.; Li, P.; Wan, J.B. Phytochemical and phytopharmacological review of perilla frutescens L. (Labiatae), a traditional edible-medicinal herb in China. Food Chem. Toxicol. 2017, 108, 375–391. [Google Scholar] [CrossRef] [PubMed]
- Ahmed, H.M. Ethnomedicinal, phytochemical and pharmacological investigations of Perilla frutescens (L.) Britt. Molecules 2019, 24, 102. [Google Scholar] [CrossRef] [PubMed] [Green Version]
- Zhou, X.J.; Yan, L.L.; Yin, P.P.; Shi, L.L.; Zhang, J.H.; Liu, Y.J.; Ma, C. Structural characterisation and antioxidant activity evaluation of phenolic compounds from cold-pressed perilla frutescens var. arguta seed flour. Food Chem. 2014, 164, 150–157. [Google Scholar] [CrossRef]
- Schreiner, M.; Mewis, I.; Huyskens-Keil, S.; Jansen, M.A.K.; Zrenner, R.; Winkler, J.B.; O’Brien, N.; Krumbein, A. UV-B-induced secondary plant metabolites - Potential benefits for plant and human health. Crit. Rev. Plant Sci. 2012, 31, 229–240. [Google Scholar] [CrossRef]
- Neugart, S.; Schreiner, M. UVB and UVA as eustressors in horticultural and agricultural crops. Sci. Hortic. 2018, 234, 370–381. [Google Scholar] [CrossRef]
- Avena-Bustillos, R.J.; Du, W.X.; Woods, R.; Olson, D.; Breksa III, A.P.; McHugh, T.H. Ultraviolet-B light treatment increases antioxidant capacity of carrot products. J. Sci. Food Agric. 2012, 92, 2341–2348. [Google Scholar] [CrossRef] [PubMed]
- Kozai, T. Resource use efficiency of closed plant production system with artificial light: Concept, estimation and application to plant factory. Proc. Japan Acad. Ser. B 2013, 89, 447–461. [Google Scholar] [CrossRef] [PubMed] [Green Version]
- Goto, E. Plant production in a closed plant factory with artificial lighting. Acta Hortic. 2012, 956, 37–49. [Google Scholar] [CrossRef]
- Kozai, T.; Ohyama, K.; Chun, C. Commercialized closed systems with artificial lighting for plant production. Acta Hortic. 2006, 711, 61–70. [Google Scholar] [CrossRef]
- Ebisawa, M.; Shoji, K.; Kato, M.; Shimomura, K.; Goto, F.; Yoshihara, T. Supplementary Ultraviolet Radiation B Together with Blue Light at Night Increased Quercetin Content and Flavonol Synthase Gene Expression in Leaf Lettuce (Lactuca sativa L.). Environ. Control Biol. 2008, 46, 1–11. [Google Scholar] [CrossRef] [Green Version]
- Nishimura, T.; Ohyama, K.; Goto, E.; Inagaki, N.; Morota, T. Ultraviolet-B radiation suppressed the growth and anthocyanin production of Perilla plants grown under controlled environments with artificial light. Acta Hortic. 2008, 797, 425–429. [Google Scholar] [CrossRef]
- Lee, M.J.; Son, J.E.; Oh, M.M. Growth and phenolic compounds of Lactuca sativa L. grown in a closed-type plant production system with UV-A, -B, or -C lamp. J. Sci. Food Agric. 2014, 94, 197–204. [Google Scholar] [CrossRef] [PubMed]
- Goto, E.; Hayashi, K.; Furuyama, S.; Hikosaka, S.; Ishigami, Y. Effect of UV light on phytochemical accumulation and expression of anthocyanin biosynthesis genes in red leaf lettuce. Acta Hortic. 2016, 1134, 179–185. [Google Scholar] [CrossRef]
- Moreira-Rodríguez, M.; Nair, V.; Benavides, J.; Cisneros-Zevallos, L.; Jacobo Vela’zquez, D.A. UVA, UVB light doses and harvesting time differentially tailor glucosinolates and phenolic profiles in broccoli sprouts. Molecules 2017, 22, 1065. [Google Scholar] [CrossRef] [PubMed] [Green Version]
- Lee, J.H.; Oh, M.M.; Son, K.H. Short-term ultraviolet (UV)-A light-emitting diode (LED) radiation improves biomass and bioactive compounds of kale. Front. Plant Sci. 2019, 10, 1042. [Google Scholar] [CrossRef] [PubMed] [Green Version]
- Chen, Y.; Li, T.; Yang, Q.; Zhang, Y.; Zou, J.; Bian, Z.; Wen, X. UVA radiation is beneficial for yield and quality of indoor cultivated lettuce. Front. Plant Sci. 2019, 10, 1563. [Google Scholar] [CrossRef] [PubMed] [Green Version]
- Son, K.H.; Furuyama, S.; Hayashi, K.; Ishigami, Y.; Hikosaka, S.; Goto, E. Enhancement of accumulation of bioactive compounds in red leaf lettuce by manipulation of UV light before harvest. Acta Hortic. 2020, 1271, 79–84. [Google Scholar] [CrossRef]
- Johnson, C.B.; Kirby, J.; Naxakis, G.; Peason, S. Substantial UV-B-mediated induction of essential oils in sweet basil (Ocimum basilicum L.). Phytochemistry 1999, 51, 507–510. [Google Scholar] [CrossRef]
- Dolzhenko, Y.; Bertea, C.B.; Occhipinti, A.; Bossi, S.; Maffei, M.E. UV-B modulates the interplay between terpenoids and flavonoids in peppermint (Mentha × piperita L.). J. Photochem. Photobiol. B Biol. 2010, 100, 67–75. [Google Scholar] [CrossRef]
- Hikosaka, S.; Ito, K.; Goto, E. Effects of ultraviolet light on growth, essential oil concentration, and total antioxidant capacity of Japanese mint. Environ. Control Biol. 2010, 48, 185–190. [Google Scholar] [CrossRef] [Green Version]
- Dou, H.; Niu, G.; Gu, M. Pre-Harvest UV-B radiation and photosynthetic photon flux density interactively affect plant photosynthesis, growth, and secondary metabolites accumulation in basil (Ocimum basilicum) plants. Agronomy 2019, 9, 434. [Google Scholar] [CrossRef] [Green Version]
- Nascimento, L.B.D.S.; Brunetti, C.; Agati, G.; Lo Iacono, C.; Detti, C.; Giordani, E.; Ferrini, F.; Gori, A. Short-term pre-harvest UV-B supplement enhances the polyphenol content and antioxidant capacity of Ocimum basilicum leaves during storage. Plants 2020, 9, 797. [Google Scholar] [CrossRef] [PubMed]
- Pandey, N.; Pandey-Rai, S. Short term UV-B radiation-mediated transcriptional responses and altered secondary metabolism of in vitro propagated plantlets of Artemisia annua L. Plant Cell Tissue Organ Cult. 2014, 116, 371–385. [Google Scholar] [CrossRef]
- Inostroza-Blancheteau, C.; Acevedo, P.; Loyola, R.; Arce-Johnson, P.; Alberdi, M.; Reyes-Díaz, M. Short-term UV-B radiation affects photosynthetic performance and antioxidant gene expression in highbush blueberry leaves. Plant Physiol. Biochem. 2016, 107, 301–309. [Google Scholar] [CrossRef] [PubMed]
- Goto, E.; Someya, K.; Ogawa, E.; Hikosaka, S. Effect of UV light on the accumulation of bioactive compounds and expression of related biosynthesis genes in red perilla. Acta Hortic. 2020, 1271, 155–162. [Google Scholar] [CrossRef]
- Caldwell, M.M. Solar UV radiation and the growth and development in higher plants. In Photophysiology; Giese, A.C., Ed.; Academic Press: New York, NY, USA, 1971; Volume 6, pp. 131–143. [Google Scholar]
- Nouchi, I. Effects of ultraviolet-B (UV-B) irradiation on growth of cucumber, radish and kidney bean plants. J. Agric. Meteorol. 1991, 46, 205–214. [Google Scholar] [CrossRef]
- Goto, E.; Matsumoto, H.; Ishigami, Y.; Hikosaka, S.; Fujiwara, K.; Yano, A. Measurements of the photosynthetic rates in vegetables under various qualities of light from light-emitting diodes. Acta Hortic. 2020, 1037, 261–268. [Google Scholar] [CrossRef]
- Ogawa, E.; Hikosaka, S.; Goto, E. Effects of nutrient solution temperature on the concentration of major bioactive compounds in red perilla. J. Agric. Meteorol. 2018, 74, 71–78. [Google Scholar] [CrossRef] [Green Version]
- Gong, Z.; Yamazaki, M.; Sugiyama, M.; Tanaka, Y.; Saito, K. Cloning and molecular analysis of structural genes involved in anthocyanin biosynthesis and expressed in a forma-specific manner in Perilla frutescens. Plant Mol. Biol. 1997, 35, 915–927. [Google Scholar] [CrossRef] [PubMed]
- Zhao, X.; Iwamoto, T.; Carey, E.E. Antioxidant capacity of leafy vegetables as affected by high tunnel environment, fertilisation and growth stage. J. Sci. Food Agric. 2007, 87, 2692–2699. [Google Scholar] [CrossRef]
- Lu, N.; Bernardo, E.L.; Tippayadarapanich, C.; Takagaki, M.; Kagawa, N.; Yamori, W. Growth and accumulation of secondary metabolites in perilla as affected by photosynthetic photon flux density and electrical conductivity of the nutrient solution. Front. Plant Sci. 2017, 8, 708. [Google Scholar] [CrossRef] [PubMed] [Green Version]
- Iwai, M.; Ohta, M.; Tsuchiya, H.; Suzuki, T. Enhanced accumulation of caffeic acid, rosmarinic acid and luteolin-glucoside in red perilla cultivated under red diode laser and blue LED illumination followed by UV-A irradiation. J. Funct. Foods 2010, 2, 66–70. [Google Scholar] [CrossRef]
- Nguyen, L.T.K.; Oh, M.M. Growth and biochemical responses of green and red perilla supplementally subjected to UV-A and deep-blue LED lights. Photochem. Photobiol. 2022. [Google Scholar] [CrossRef]
- Zhao, B.; Wang, L.; Pang, S.; Jia, Z.; Wang, L.; Li, W.; Jin, B. UV-B promotes flavonoid synthesis in Ginkgo biloba leaves. Ind. Crops Prod. 2020, 151, 112483. [Google Scholar] [CrossRef]
- Escobar-Bravo, R.; Klinkhamer, P.G.; Leiss, K.A. Interactive effects of UV-B light with abiotic factors on plant growth and chemistry, and their consequences for defense against arthropod herbivores. Front. Plant Sci. 2017, 8, 278. [Google Scholar] [CrossRef] [PubMed] [Green Version]
- Lee, J.H.; Shibata, S.; Goto, E. Time-course of changes in photosynthesis and secondary metabolites in canola (Brassica napus) under different UV-B irradiation levels in a plant factory with artificial light. Front. Plant Sci. 2021, 12, 786555. [Google Scholar] [CrossRef]
- Neugart, S.; Bumke-Vogt, C. Flavonoid glycosides in Brassica species respond to UV-B depending on exposure time and adaptation time. Molecules 2021, 26, 494. [Google Scholar] [CrossRef]


| Days of Treatment | Treatment | Fresh Weight | Dry Weight | Percent Dry Weight | ||
|---|---|---|---|---|---|---|
| Above-Ground Part (g) | 4th Leaf (g) | Above-Ground Part (g) | 4th Leaf (g) | 4th Leaf (%) | ||
| 0 | 2.46 | 0.66 | 0.39 | 0.14 | 20.6 | |
| 3 | Control | 4.06 a | 1.24 a | 0.78 a | 0.27 a | 22.3 b |
| 3 | 6 W | 3.41 b | 0.88 b | 0.72 ab | 0.23 ab | 25.7 a |
| 3 | 10 W | 3.02 b | 0.76 b | 0.63 b | 0.19 b | 25.4 a |
| Days of Treatment | Treatment | Fresh Weight | Dry Weight | Percent Dry Weight | ||
|---|---|---|---|---|---|---|
| Above Ground Part (g) | 4th Leaf (g) | Above Ground Part (g) | 4th Leaf (g) | 4th Leaf (%) | ||
| 0 | 1.24 ± 0.15 | 0.50 ± 0.03 | 0.22 ± 0.03 | 0.10 ± 0.01 | 20.3 ± 1.43 | |
| 3 | Control | 2.14 ± 0.19 | 0.90 ± 0.10 | 0.36 ± 0.02 | 0.18 ± 0.01 | 18.8 ± 0.71 b |
| 3 | 4 W 24 h | 1.95 ± 0.18 | 0.73 ± 0.07 | 0.32 ± 0.03 | 0.19 ± 0.01 | 26.1 ± 0.88 a |
| 3 | 6 W 16 h | 2.25 ± 0.31 | 0.73 ± 0.12 | 0.37 ± 0.04 | 0.20 ± 0.03 | 27.5 ± 1.85 a |
| Days of Treatment | Treatment | RA Conc. (mg g−1 DW) | ANT Conc. (mg C3G g−1 DW) |
|---|---|---|---|
| 0 | 35.4 ± 5.4 | 27.4 ± 2.8 | |
| 3 | Control | 33.4 ± 3.3 c | 37.2 ± 5.2 a |
| 3 | 4 W 24 h | 64.4 ± 2.9 b | 25.5 ± 0.6 b |
| 3 | 6 W 16 h | 80.4 ± 4.1 a | 26.3 ± 2.9 b |
| Days of Treatment | Treatment | RA Content (mg/leaf) | ANT Content (mg/leaf) |
|---|---|---|---|
| 0 | 3.5 | 2.7 | |
| 3 | Control | 6.0 c | 6.7 a |
| 3 | 4 W 24 h | 12.2 b | 4.8 b |
| 3 | 6 W 16 h | 16.1 a | 5.3 b |
Publisher’s Note: MDPI stays neutral with regard to jurisdictional claims in published maps and institutional affiliations. |
© 2022 by the authors. Licensee MDPI, Basel, Switzerland. This article is an open access article distributed under the terms and conditions of the Creative Commons Attribution (CC BY) license (https://creativecommons.org/licenses/by/4.0/).
Share and Cite
Yoshida, H.; Shimada, K.; Hikosaka, S.; Goto, E. Effect of UV-B Irradiation on Bioactive Compounds of Red Perilla (Perilla frutescens (L.) Britton) Cultivated in a Plant Factory with Artificial Light. Horticulturae 2022, 8, 725. https://doi.org/10.3390/horticulturae8080725
Yoshida H, Shimada K, Hikosaka S, Goto E. Effect of UV-B Irradiation on Bioactive Compounds of Red Perilla (Perilla frutescens (L.) Britton) Cultivated in a Plant Factory with Artificial Light. Horticulturae. 2022; 8(8):725. https://doi.org/10.3390/horticulturae8080725
Chicago/Turabian StyleYoshida, Hideo, Kanae Shimada, Shoko Hikosaka, and Eiji Goto. 2022. "Effect of UV-B Irradiation on Bioactive Compounds of Red Perilla (Perilla frutescens (L.) Britton) Cultivated in a Plant Factory with Artificial Light" Horticulturae 8, no. 8: 725. https://doi.org/10.3390/horticulturae8080725