Article

Evolution of Oleuropein and Other Bioactive Compounds in Arbequina Olive Leaves under Different Agronomic Conditions

by
María Esther Martínez-Navarro
,
Cristina Cebrián-Tarancón
,
María Rosario Salinas
and
Gonzalo L. Alonso
*
Cátedra de Química Agrícola, E.T.S.I. Agrónomos y Montes, Departamento de Ciencia y Tecnología Agroforestal y Genética, Universidad de Castilla-La Mancha, Avda. de España s/n, 02071 Albacete, Spain
*
Author to whom correspondence should be addressed.
Horticulturae 2022, 8(6), 530; https://doi.org/10.3390/horticulturae8060530
Submission received: 13 May 2022 / Revised: 10 June 2022 / Accepted: 13 June 2022 / Published: 15 June 2022
(This article belongs to the Special Issue Sustainable Oliviculture Facing Emerging Challenges)

Abstract

:
Oleuropein and other phenolic compounds contained in olive leaves give it the potential to be transformed from residue to co-product in an oil mill. However, the moment of the agronomic cycle in which their potential transformation is higher is not known in detail. Therefore, for the first time, a monthly study of the evolution of such compounds throughout an agronomic cycle is made (November 2019 to October 2020). Arbequina olive leaves were collected from three plots and the interactive effects of agronomic conditions were investigated, such as crop management (conventional and ecological), plantation framework (intensive and super-intensive) and location under different climatic conditions. The results showed that the main compound throughout the cycle was oleuropein and the highest levels occurred around the pruning season (February/March). Crop management and location affected the content of verbascoside and hydroxytyrosol, while plantation framework only influenced the flavonoid content. All compounds were affected by relative humidity and differential temperature, although hydroxytyrosol showed the highest correlation with the maximum temperature. The absorbance measurements by ultraviolet-visible spectrophotometry showed trends parallel to the oleuropein concentration measured by high-performance liquid chromatography, which suggests that this method could be useful to easily study the evolution of oleuropein in the oil mill.

1. Introduction

The cultivation of the olive tree (Olea europaea L.) represents 10,513,320 ha worldwide, much of which is located mainly in the Mediterranean Basin. The country with the most cultivated area is Spain (24.53%), which is also the main producer of olives with 46.61% of the world’s total production, followed by Italy (8.91%) and Turkey (7.12%) [1]. Currently, two trends point to an increase in ecological agricultural and high-density plantations (intensive and super-intensive systems) in the olive world. In 2020, over 71.5 million ha of farmland were ecological, of which the most important crop was olives with nearly 18% of the total area [2]. Spain ranked third (23%) in terms of the world’s ecological area after Tunisia (29%) and Italy (27%). Regarding reconversion from extensive to intensive or super-intensive systems, it is estimated that by 2030, intensive systems will occupy an area of 22% of the world’s total ecological area, while super-intensive systems will reach 23% [3,4]. Spain has 22% of its olive trees in high-density plantations, while the rest belong to extensive systems. The varieties of olive cultivars most used for intensive and super-intensive systems worldwide are Koroneiki, Arbosana and Arbequina. The latter is by far the dominant cultivar used in high-density plantations due to its low vigour and its high and stable yield [5]. Production is mainly destined for the generation of olive oil where a large amount of biomass is generated [6]. Olive leaves are the waste most susceptible to being transformed into a co-product, especially during harvesting and pruning seasons, but there are not enough studies on the potential of leaves throughout the agronomic cycle. During harvest, production of between 4% and 7% of the weight of the olive leaves is estimated (approximately 0.075–0.15 annual tons per ha), while pruning biomass oscillates between 1.5 and 3 annual tons per ha [7,8].
It is well known that olive leaves contain a large variety of phenolic derivatives, which are an excellent source of bioactive compounds used in the cosmetic, pharmaceutical and food industries due to their beneficial properties [9,10,11]. Currently, oil mills only benefit economically from olive oil when they can obtain additional benefits by marketing olive leaves, taking advantage of their high phenolic content, but oil mills do not usually have sophisticated equipment to analyse these compounds. However, it has been shown that phenolic content can be easily measured with an ultraviolet-visible (UV-Vis) spectrophotometer at 280 nm, equipment which is usually common in oil mills [12]. The polyphenol compound content in olive leaves is highly variable because it is affected by different biotic and abiotic factors of the environment [13,14]. Abiotic factors include temperature, humidity, light, rainfall and altitude. For this reason, knowing the behaviour during the olive tree agronomic cycle of a variety in a particular area is crucial for the transformation of waste to a co-product in the oil mill industry.
The most abundant phenolic compound of olive leaves is oleuropein and, to a lesser extent, others such as verbascoside, hydroxytyrosol and different flavonoids can be found [9,12,15]. Oleuropein has been identified as the most suitable precursor of hydroxytyrosol, which has a wide range of biotical and pharmacological uses, such as a potential therapeutic, antithrombotic, cardioprotective, antitumor, microbicide and anti-inflammatory agent [16,17,18]. In addition, the vast majority of these compounds are soluble in water, so they have great potential for their aqueous extracts can be prepared in the oil mills [12]. For this to be possible, it is necessary to know the moment in the agronomic cycle when these compounds are at their highest concentration in the olive leaf.
Therefore, the aim of this work was to know when the content of oleuropein and other phenolic compounds of olive leaves are at their maximum. For this purpose, the Arbequina olive leaf from cultivars under different agronomic conditions such as crop management (conventional and ecological), plantation framework (intensive and super-intensive) and location were studied monthly along an agronomic cycle.

2. Materials and Methods

2.1. Materials

Standards of oleuropein, hydroxytyrosol, verbascoside and apigenin-7-glucoside, were purchased from Sigma-Aldrich (Madrid, Spain). Diosmetin-7-glucoside were obtained from Extrasynthèse (Genay, France). Acetonitrile (ultra-high performance liquid chromatography gradient grade) was obtained from PanReac AppliChem (Barcelona, Spain).

2.2. Raw Materials and Agronomic Conditions

Olive leaves (Olea europaea L.) cv. Arbequina were collected from November 2019 to October 2020 along the agronomic cycle from three different plots in the Castilla–La Mancha region (southwest Spain, altitude of 865 m, N 39°38′16″ latitude and W 2°53′21″ longitude). Plot 1 (P1) was located in the south (N 39°24′28.5840″, W 2°9′38.0160″), and plots 2 (P2) and 3 (P3) were located in the east (N 38°36′54.3240″, W 1°35′39.1920″ and N 38°36′36.3240″, W 1°35′33.9720″, respectively) of this region. The plots’ characteristics are summarized in Table 1.
The agronomic conditions studied were conventional and ecological for crop management, and intensive and super-intensive for plantation framework (Table 1). In this context, conventional production (P1) had traditional crop management in terms of soil tillage practices and chemical intervention to fight pests and provide plant nutrition. Ecological production (P2 and P3) carried out tillage practices to prevent soil degradation and performed crop management without chemical pest control and with naturally derived mineral fertilizers. In the case of intensive production (P3), trees had a globe training system placed in an 8 × 7 m plantation framework. Meanwhile, in super-intensive production (P1 and P2), trees were planted in a frame of trellis posts connected by three horizontal wires and with a 4 m × 1.3 m plantation framework.
To carry out a homogeneous leaf collection, a sampling protocol was developed. From each plot (P1, P2 and P3), five representative healthy trees were selected, and 10 leaves of different ages (0 years, 1 years, 2 years) were collected at 1.20 m of height from the four cardinal points, resulting in a total of 120 leaves per tree [19].

2.3. Sample Preparation

Olive leaves were dried in the dark for seven days [20] and stored at freezing temperatures (−20 °C) until use. The frozen dried leaves were ground in a knife mill (ARES FML-2000), sieved (500 mesh) and subjected to microwave extraction using water as an extractant according to the methodology described by Martínez-Navarro et al. (2021) [12]. All extractions were performed in triplicate.

2.4. Determination of Oleuropein and Other Phenolic Compounds

Analyses were carried out according to Martínez-Navarro et al. (2021) [12]. Aqueous extracts were injected into an Agilent 1200 high-performance liquid chromatograph (Palo Alto, CA, USA) equipped with a diode-array detector (Agilent G1315D) coupled to a ChemStation, version B.03.01 (Agilent, Santa Clara, CA, USA) data-processing station. Separation was performed on a reverse-phase C18 column, Brisa LC2 (250 mm × 4.6 mm, 5 μm particle size), purchased from Teknokroma (Barcelona, Spain), at 30 °C. The phenolic compounds studied were oleuropein, verbascoside, hydroxytyrosol and flavonoids (mainly apigenin-7-glucoside and diosmetin-7-glucoside). All analyses were performed in triplicate and expressed as milligrams compound per gram of olive leaf. Olive leaves aqueous extracts were also measured for absorbance at 280 nm by UV-Vis spectrophotometry (Lambda 20; PerkinElmer, Waltham, MA, USA) to compare them with oleuropein content obtained by high-performance liquid chromatography with a diode-array detector.

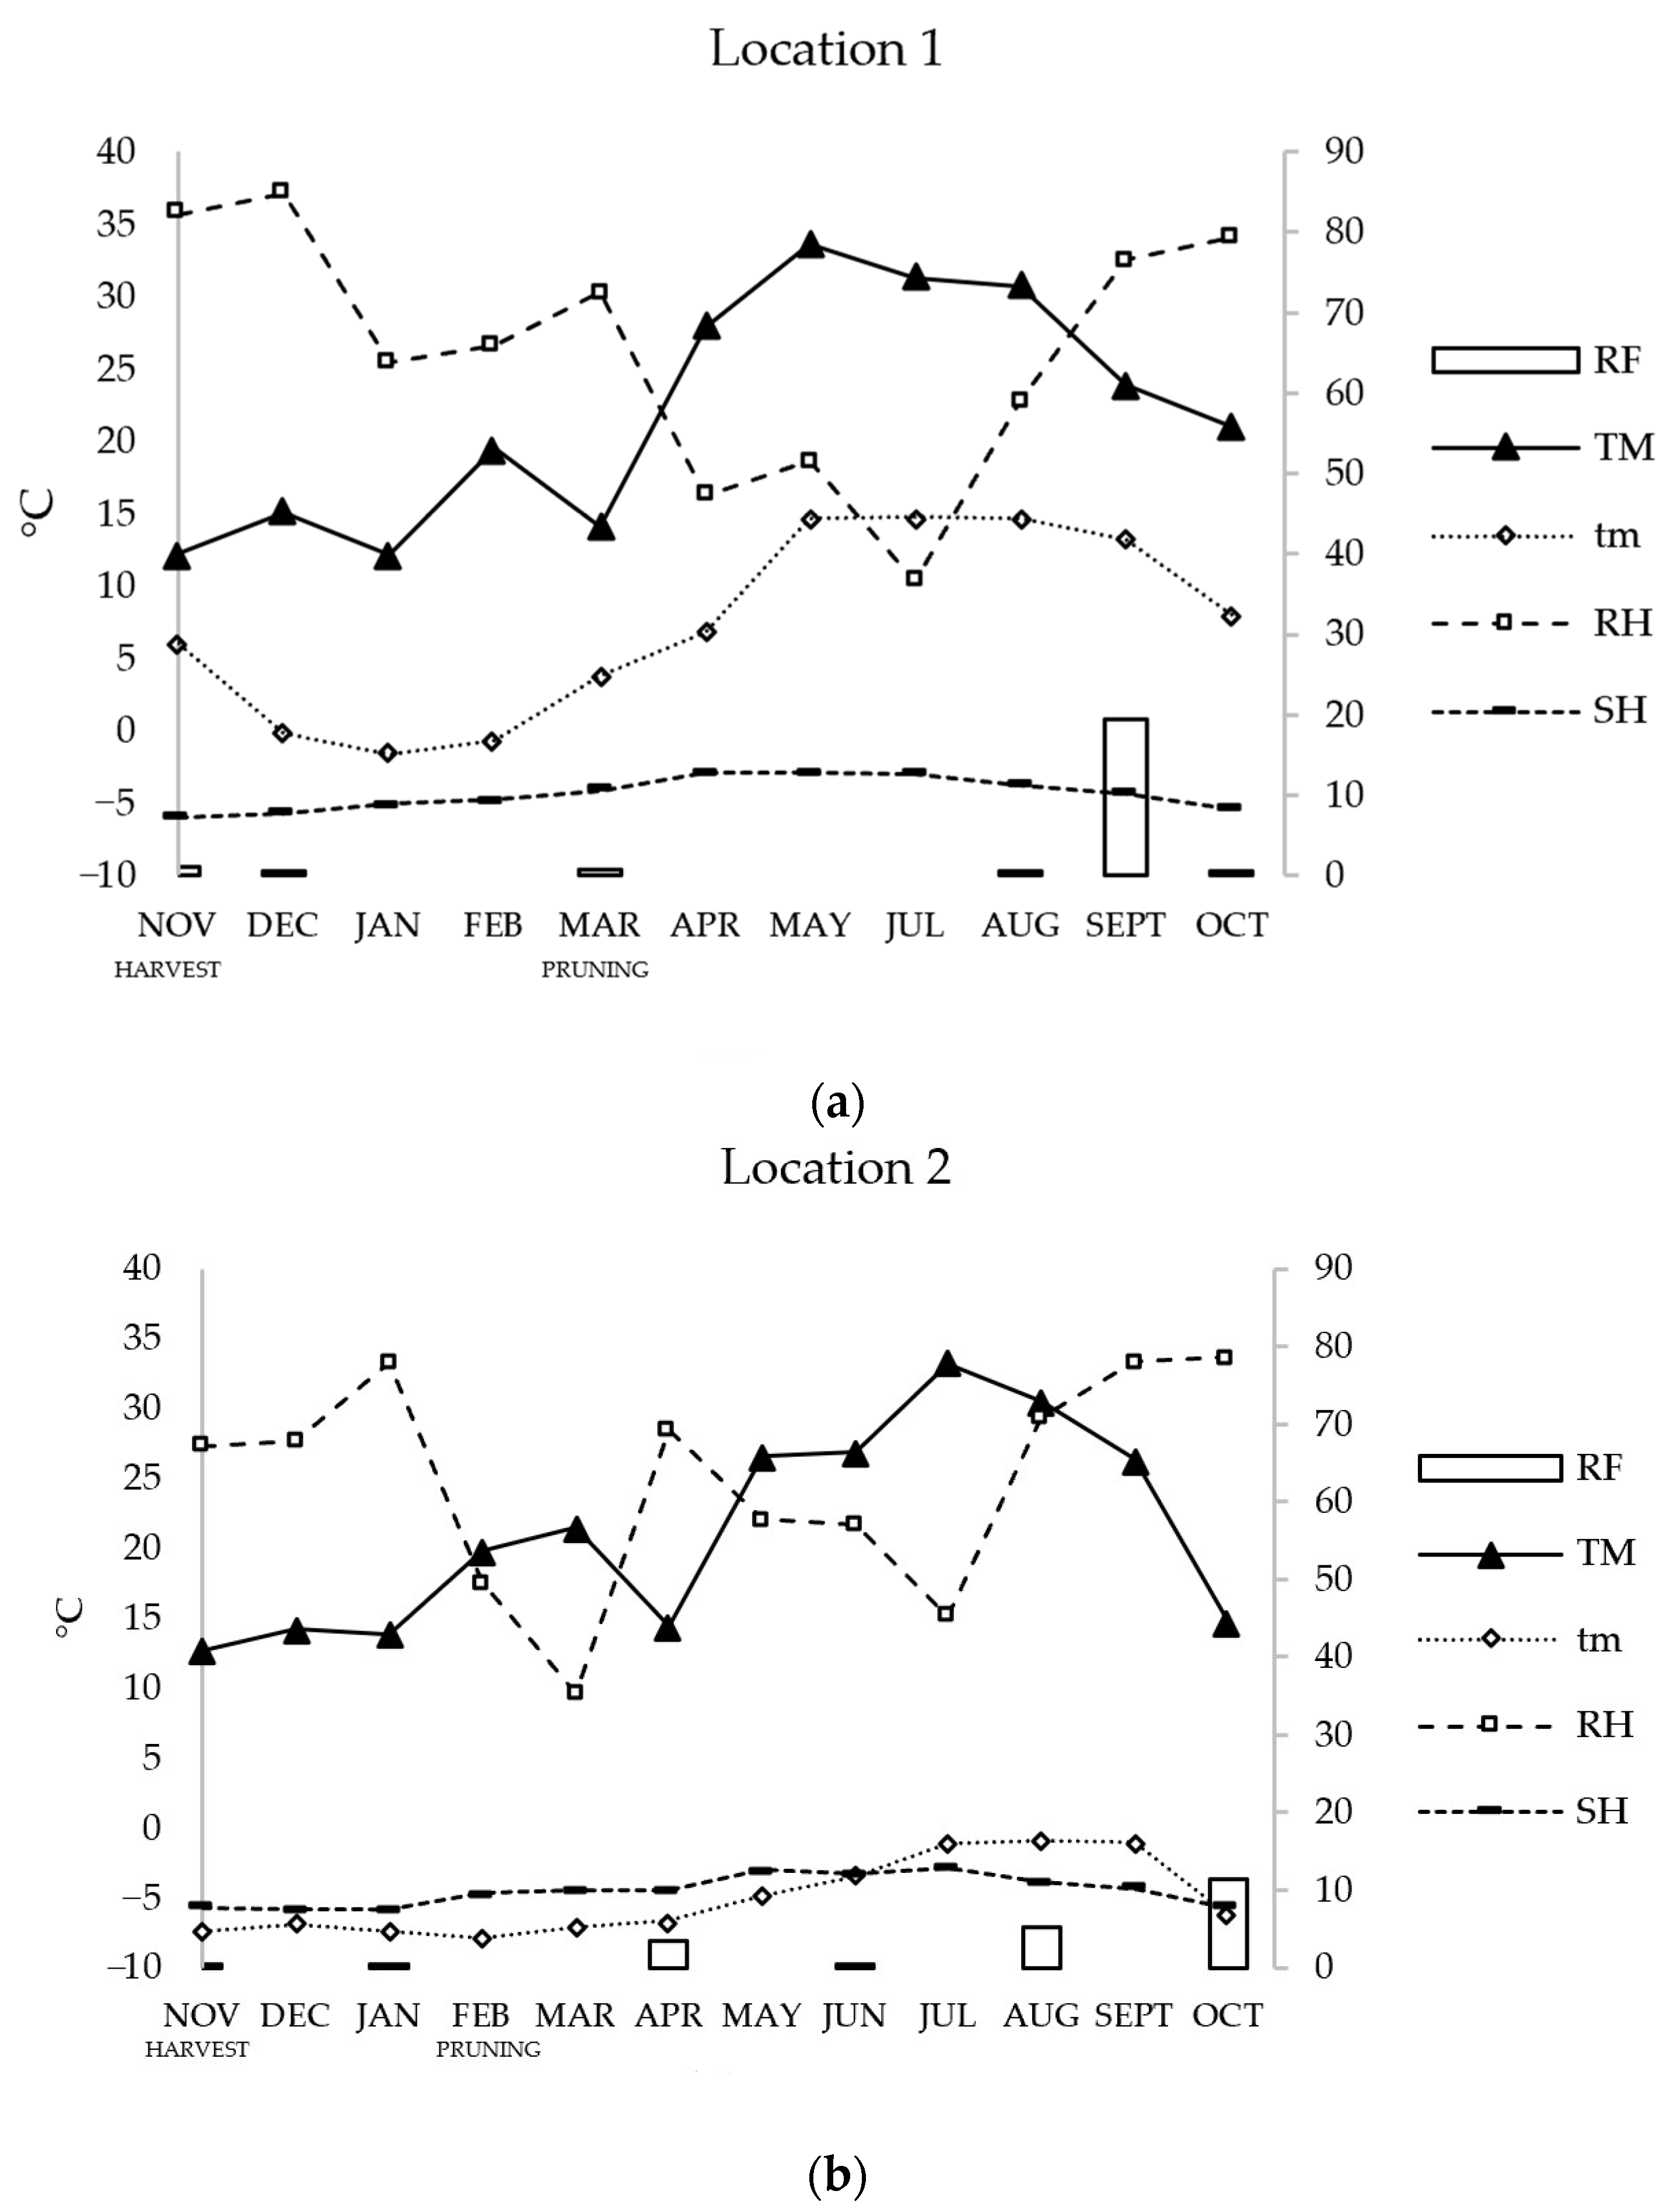
2.5. Climatic Conditions

The climate data were obtained from meteorological stations near the plots: station 1 (N 39°27′17.2152″, W 2°5′29.6578″) for plot 1 and station 2 (N 38°37′22.3140″, W 1°29′44.7677″) for plots 2 and 3 [21]. The climatic parameters used for the study were the absolute maximum temperature (TM), defined as the highest air temperature reached in a day; absolute minimum temperature (tm), defined as the lowest air temperature reached in a day; mean relative humidity (RH), defined as the ratio of the partial pressure of water vapour to the equilibrium vapour pressure of water at a given temperature; sunshine hours (SH) as the maximum duration of sunshine; rainfall (RF) daily maximum such as total daily precipitation; and differential temperature (ΔT) as the difference between the absolute minimum and maximum temperature in a day. For each parameter, the average of the five days before sampling was used, except for RF, for which the sum.

2.6. Statistical Analysis

Analyses data processing was performed using Microsoft Excel (Microsoft Corp., Redmond, WA, USA). Statistical correlations from plots were performed using Statgraphics Centurion version XVII (StatPoint Technologies Inc., Warrenton, VA, USA). For this, a multifactorial analysis of variance was performed with the factors of plantation framework, location and crop management compared with the phenolic compounds’ content. Additionally, correlation analysis was used to examine the relationship between different compounds and the effect of climatic conditions on phenolic content.

3. Results

The locations studied had a Mediterranean climate, but they showed some different weather characteristics during the study period, as can be seen in Figure 1.
Location 1 (L1) had a higher TM during spring (33.6 °C), while location 2 (L2) was warmer during the summer period (33.1 °C). In both places, tm was reached in winter with −1.6 °C and 3.8 °C in L1 and L2, respectively. Temperatures below 0 °C were only reached at L1. RH was higher in L1 than in L2, except for the period of April to July, which had an average during the agronomic cycle of 65.45% for L1 and 62.86% for L2. SH ranged from 7.2 h on short days (autumn and winter seasons) to 12.8 h on long days (spring and summer seasons) in both locations. RF was characterized by low precipitation in both cases, with 21.34 total mm in L1 and 20.45 total mm in L2. To study the influence of the four previously defined types of agronomic conditions (conventional, ecological, intensive and super-intensive) on the evolution of olive leaf phenolic compounds, these types were grouped and compared. The first group included conventional (P1) and ecological (P2) crop management, and the second group included super-intensive (P2) and intensive (P3) plantation frameworks.

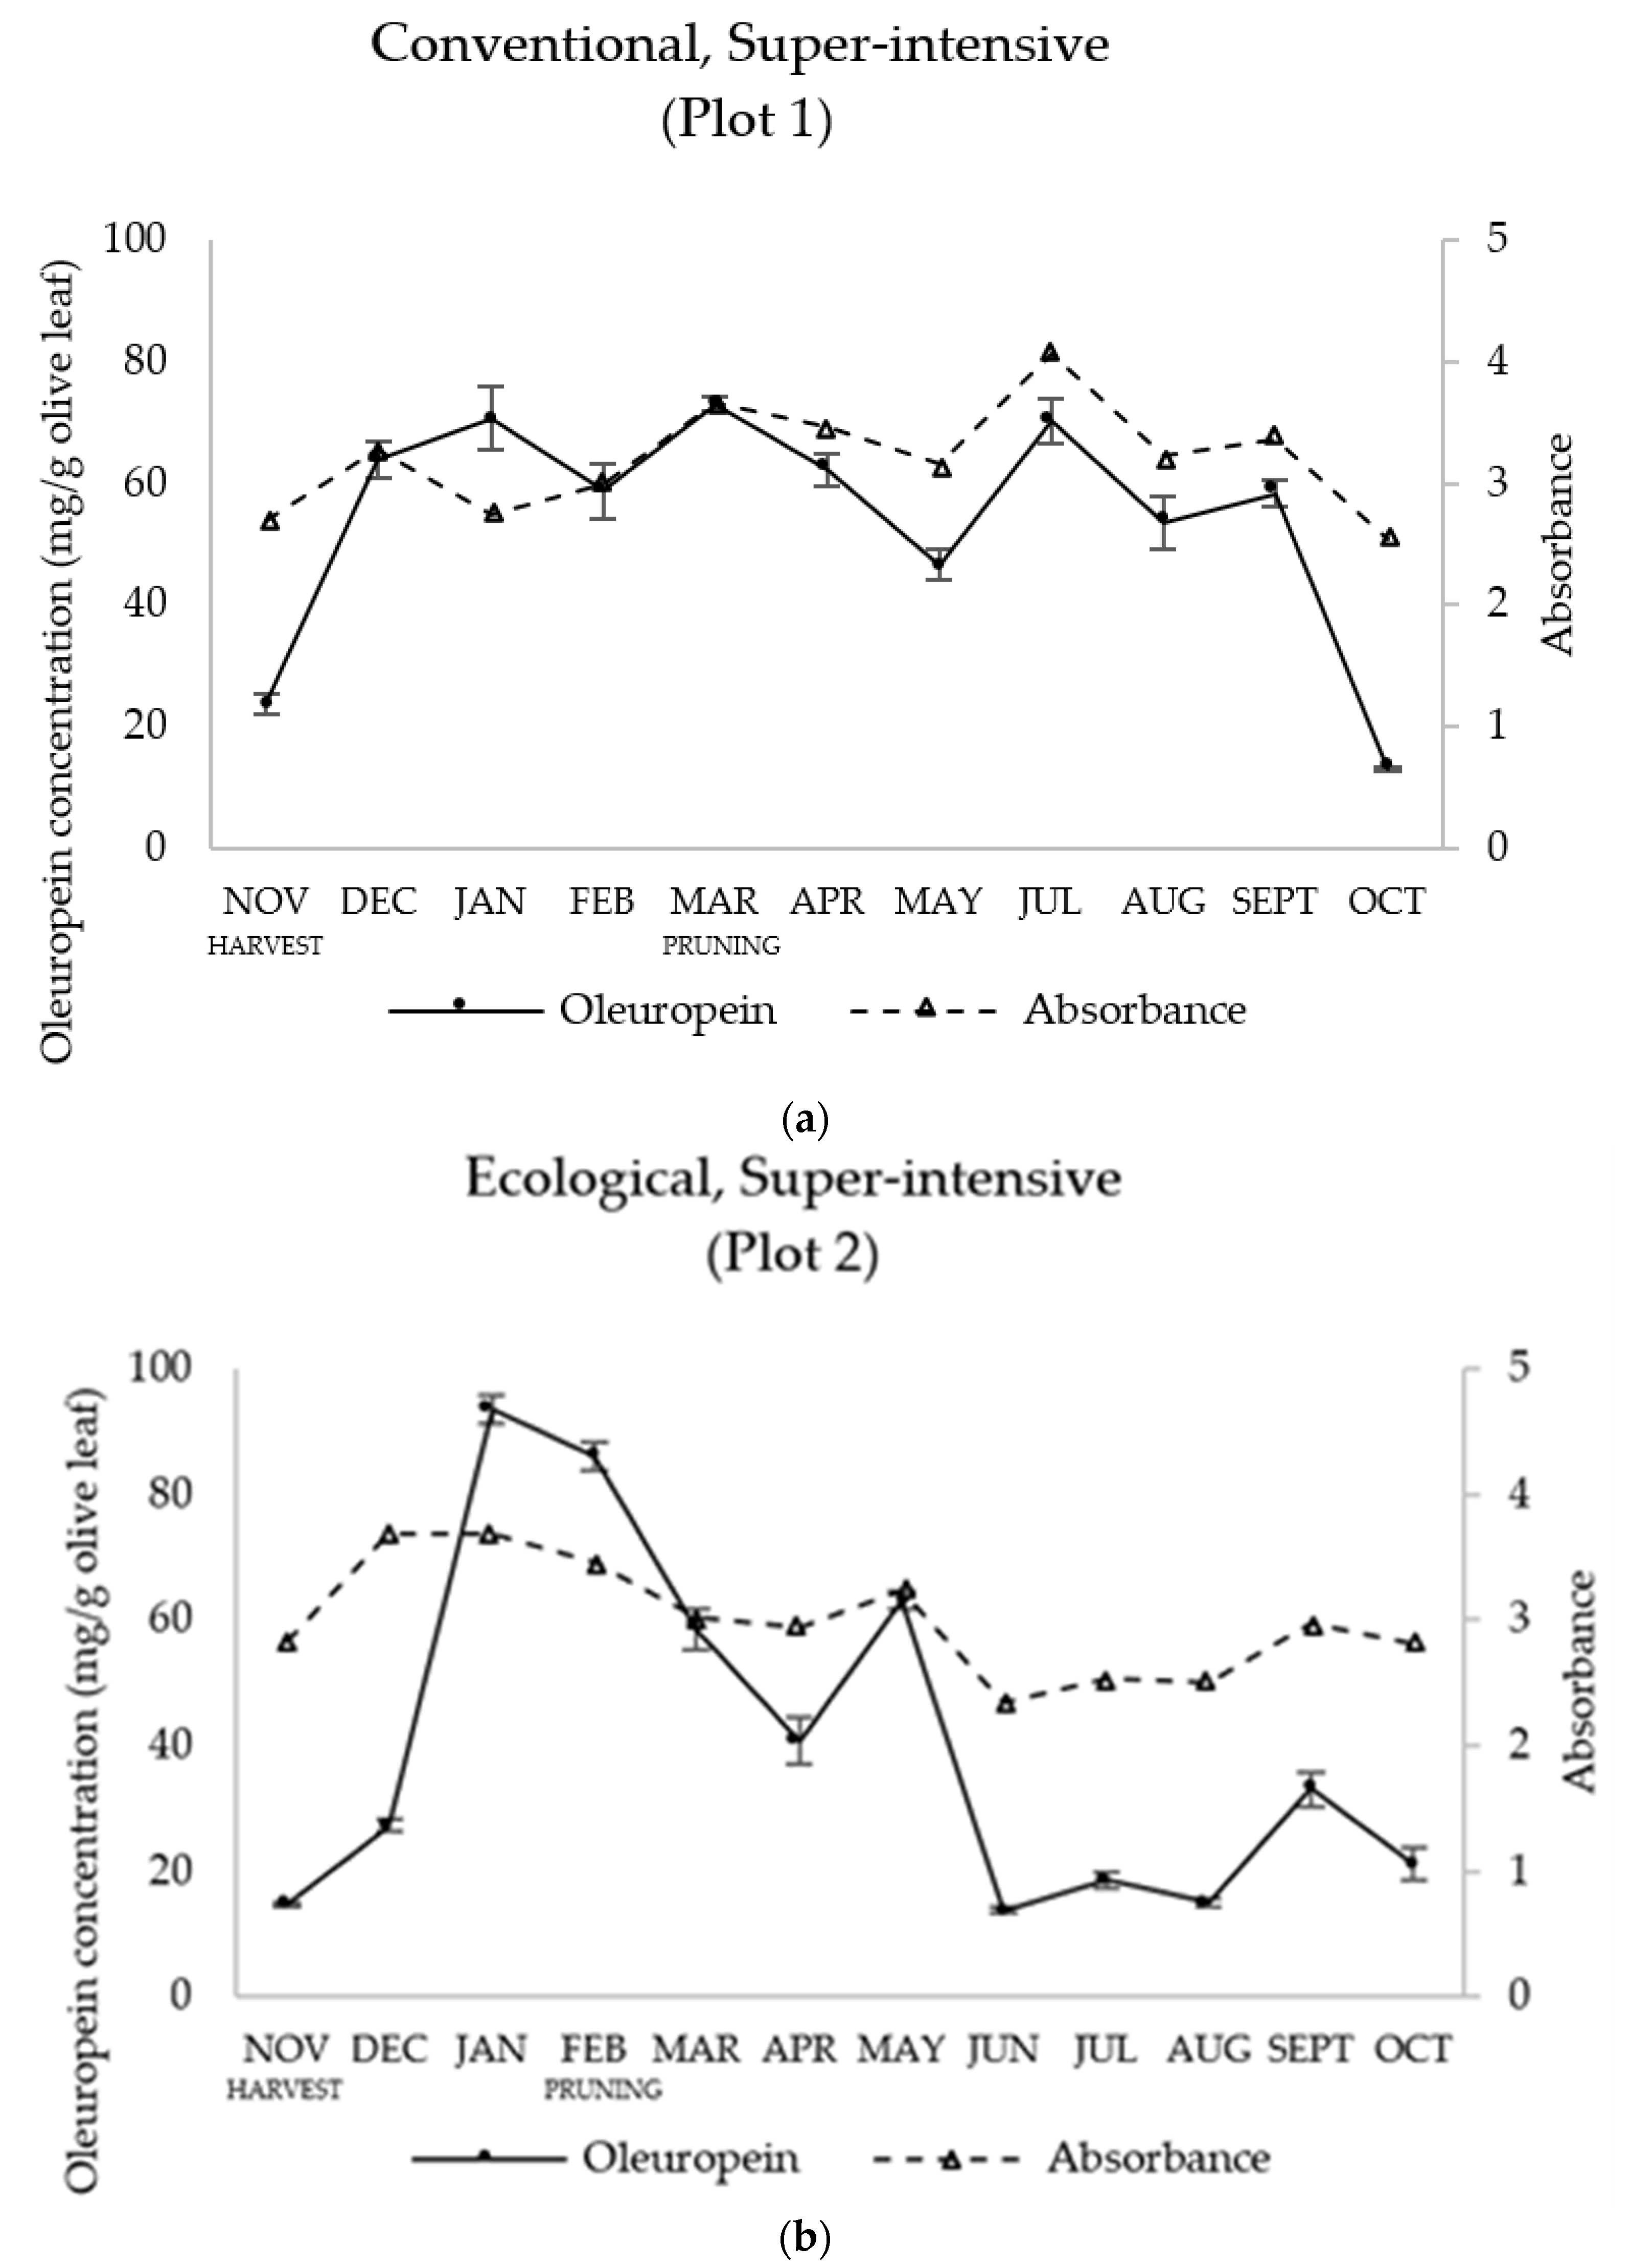
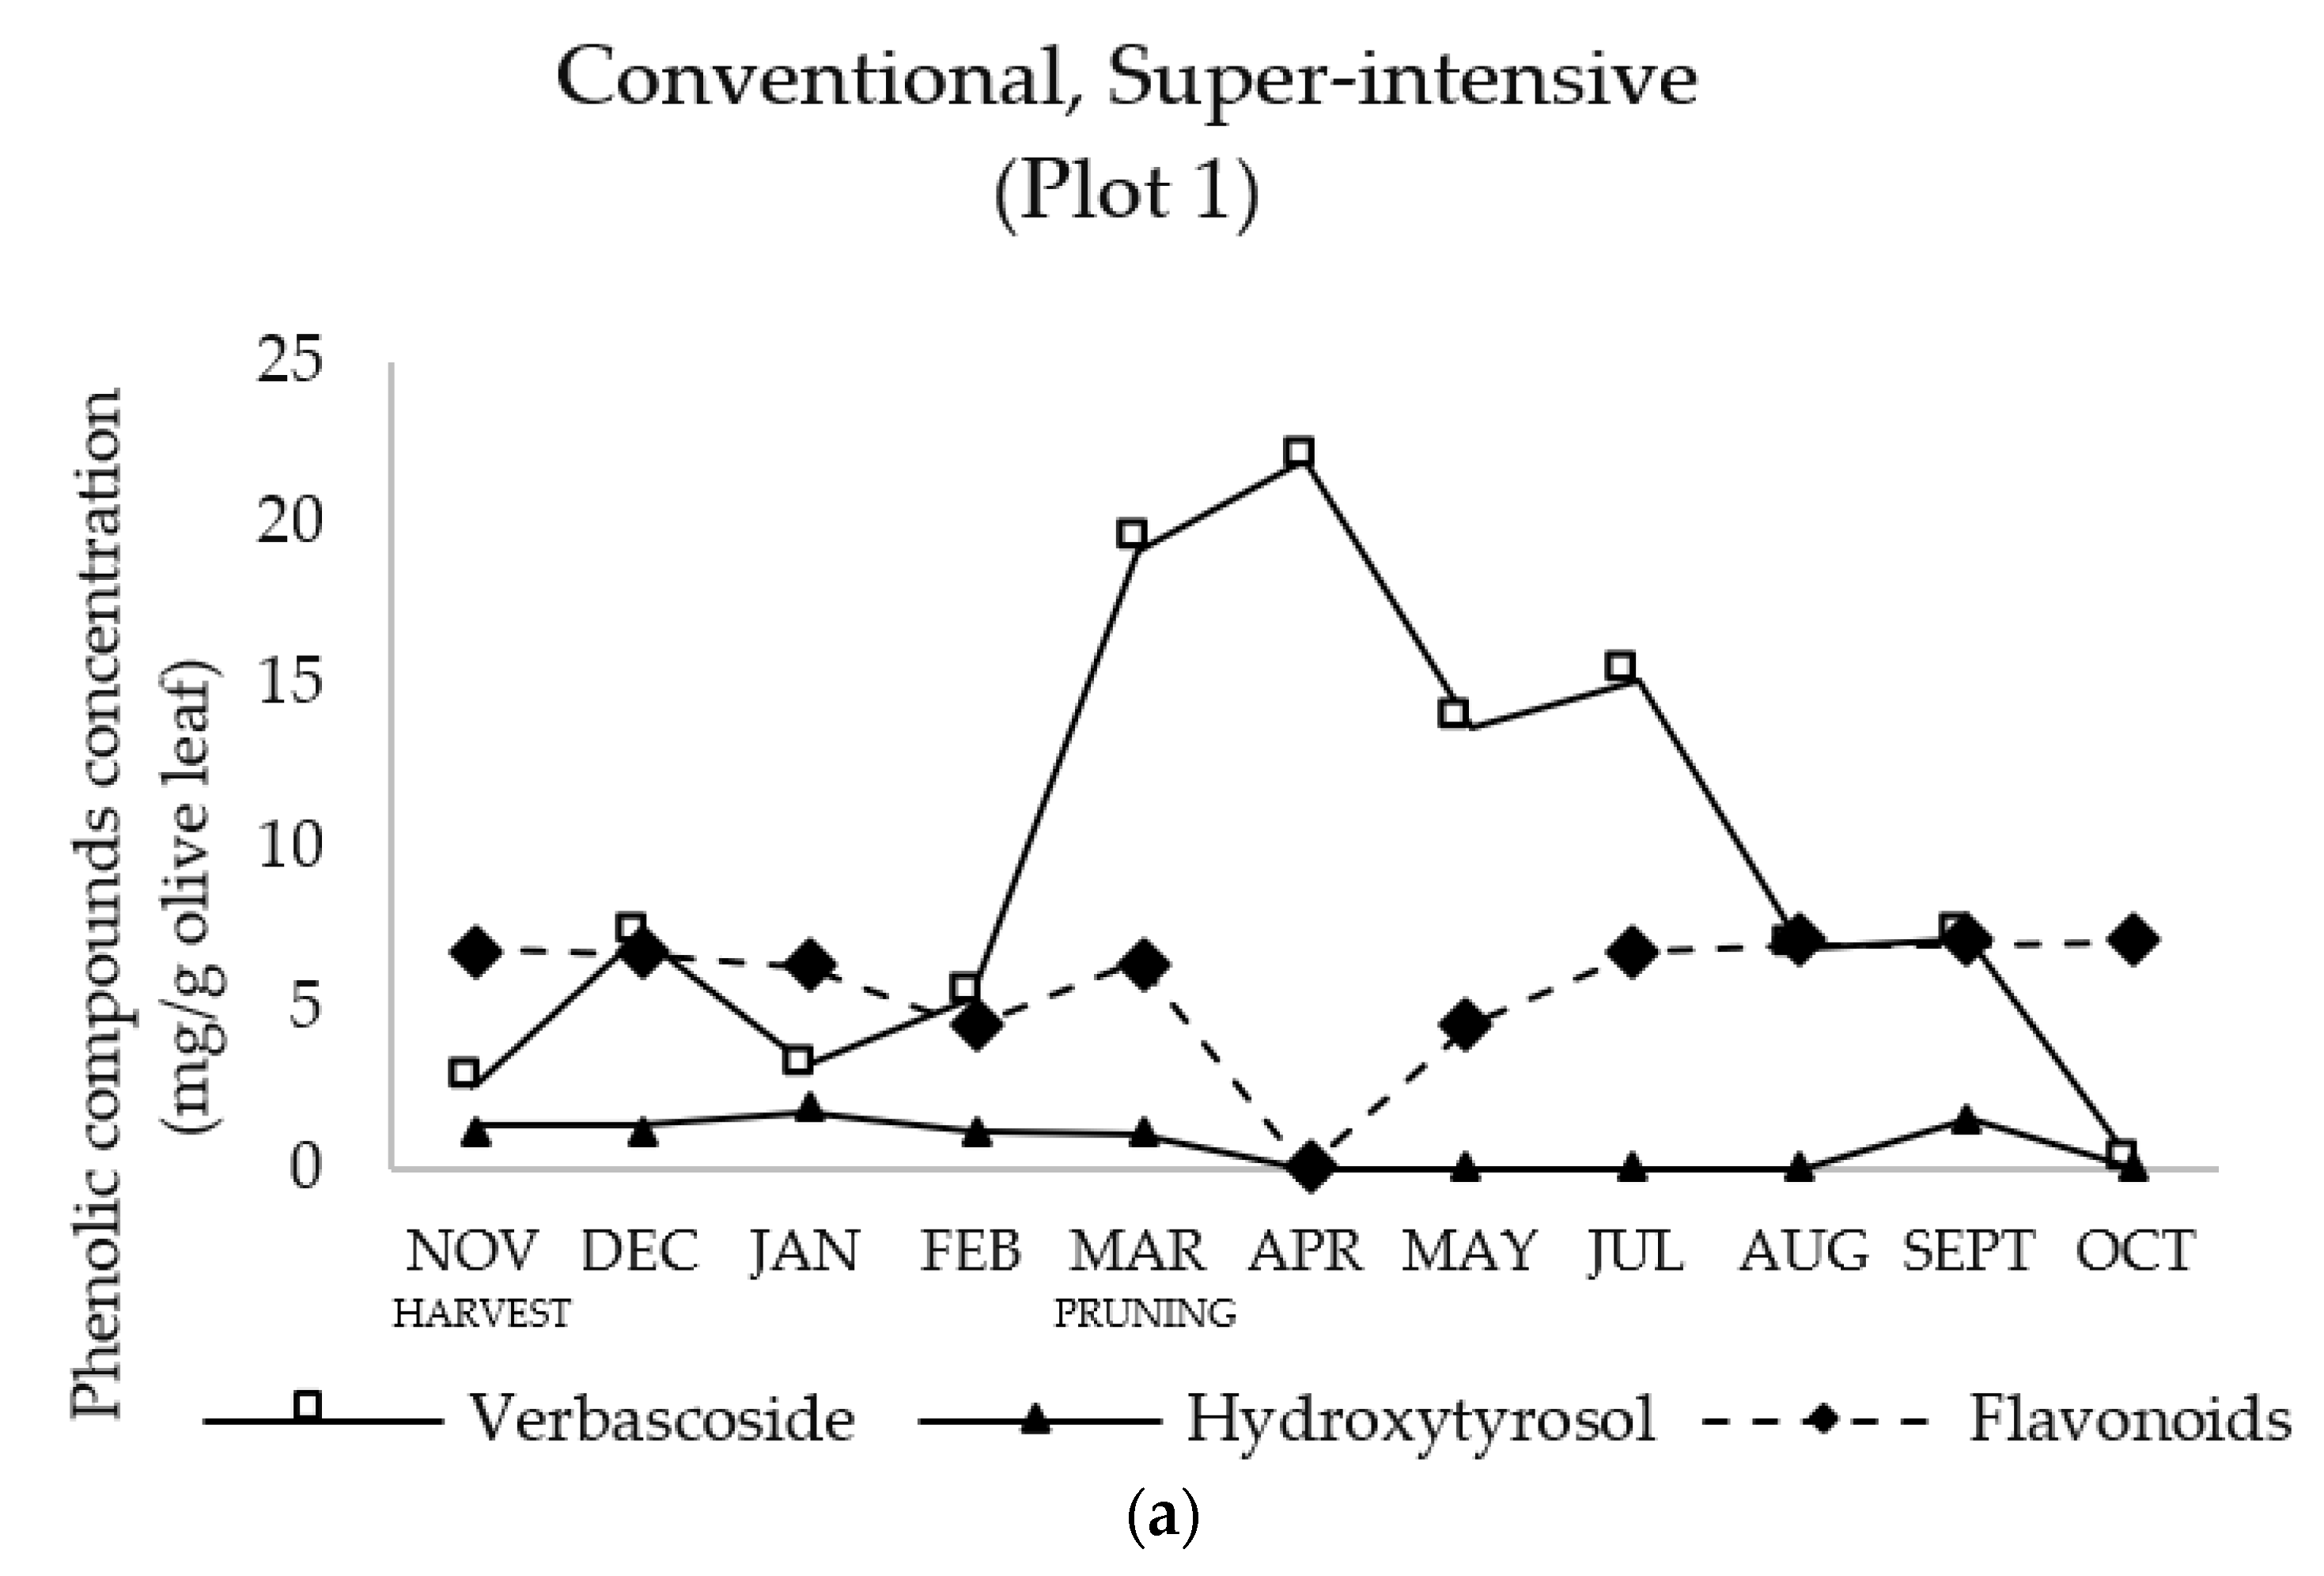
3.1. Comparison between Conventional and Ecological Agronomic Conditions

The influence of conventional and ecological systems, both in super-intensive plantation frameworks, on the phenolic compounds studied are shown in Table 2.
These agronomic conditions affected the total content of verbascoside (p < 0.001) and hydroxytyrosol (p < 0.01) in olive leaves, while oleuropein and flavonoids were not affected. Nevertheless, the behaviour of such phenolic compounds was different in P1 and P2 throughout the agronomic cycle. Oleuropein (Figure 2a,b) had dissimilar behaviour between both plots throughout the agronomic cycle, showing a more stable evolution in P1 than in P2.
The highest oleuropein concentration was observed in March in P1, 73.03 mg/g, coinciding with the pruning season, and in January in the ecological system, 93.57 mg/g, coinciding with the pre-pruning season. From May to October, coinciding with the summer and autumn seasons, content tended to decrease in P2, declining to 13.85 mg/g in June. On the contrary, in P1, oleuropein content remained more stable until September, decreasing considerably in October to 13.09 mg/g. In both plots was observed a similar trend for the oleuropein content, which was lower in leaves collected in autumn (October) than those collected in spring (March). Regarding the other phenolic compounds (Figure 3a,b), the maximum verbascoside content in P1 was 21.97 mg/g (post-pruning), while in P2, it was 6.50 mg/g (pruning).
In P1, this compound increased from January to April, when it reached its maximum level. On the contrary, in leaves from P2, it increased from December to February. The highest hydroxytyrosol content was obtained in P2, 2.13 mg/g, corresponding with post-harvest time (December). P1 showed the maximum hydroxytyrosol content in January, 1.79 mg/g, but the compound was not detected from April to August. On the other hand, in P2, a loss of hydroxytyrosol was observed from December to March, but the evolution was more stable than in P1. The flavonoids group, mainly represented by diosmetin-7-glucoside and apigenin-7-glucoside, showed levels ranging between 2.11 and 7.72 mg/g but, in general, the flavonoid content was quite regular since it was usually around 6.5 to 7.5 mg/g in both systems. P2 had the highest content with 7.72 mg/g, which was similar to the content obtained in P1 of 7.09 mg/g; both occurred in October (pre-harvest).
To determine the possible interactions between the different analysed compounds, a correlation statistical analysis was carried out (Table 3).
Oleuropein content showed a positive correlation with verbascoside content (p < 0.001), and in turn, the latter revealed a negative correlation with hydroxytyrosol content (p < 0.01).

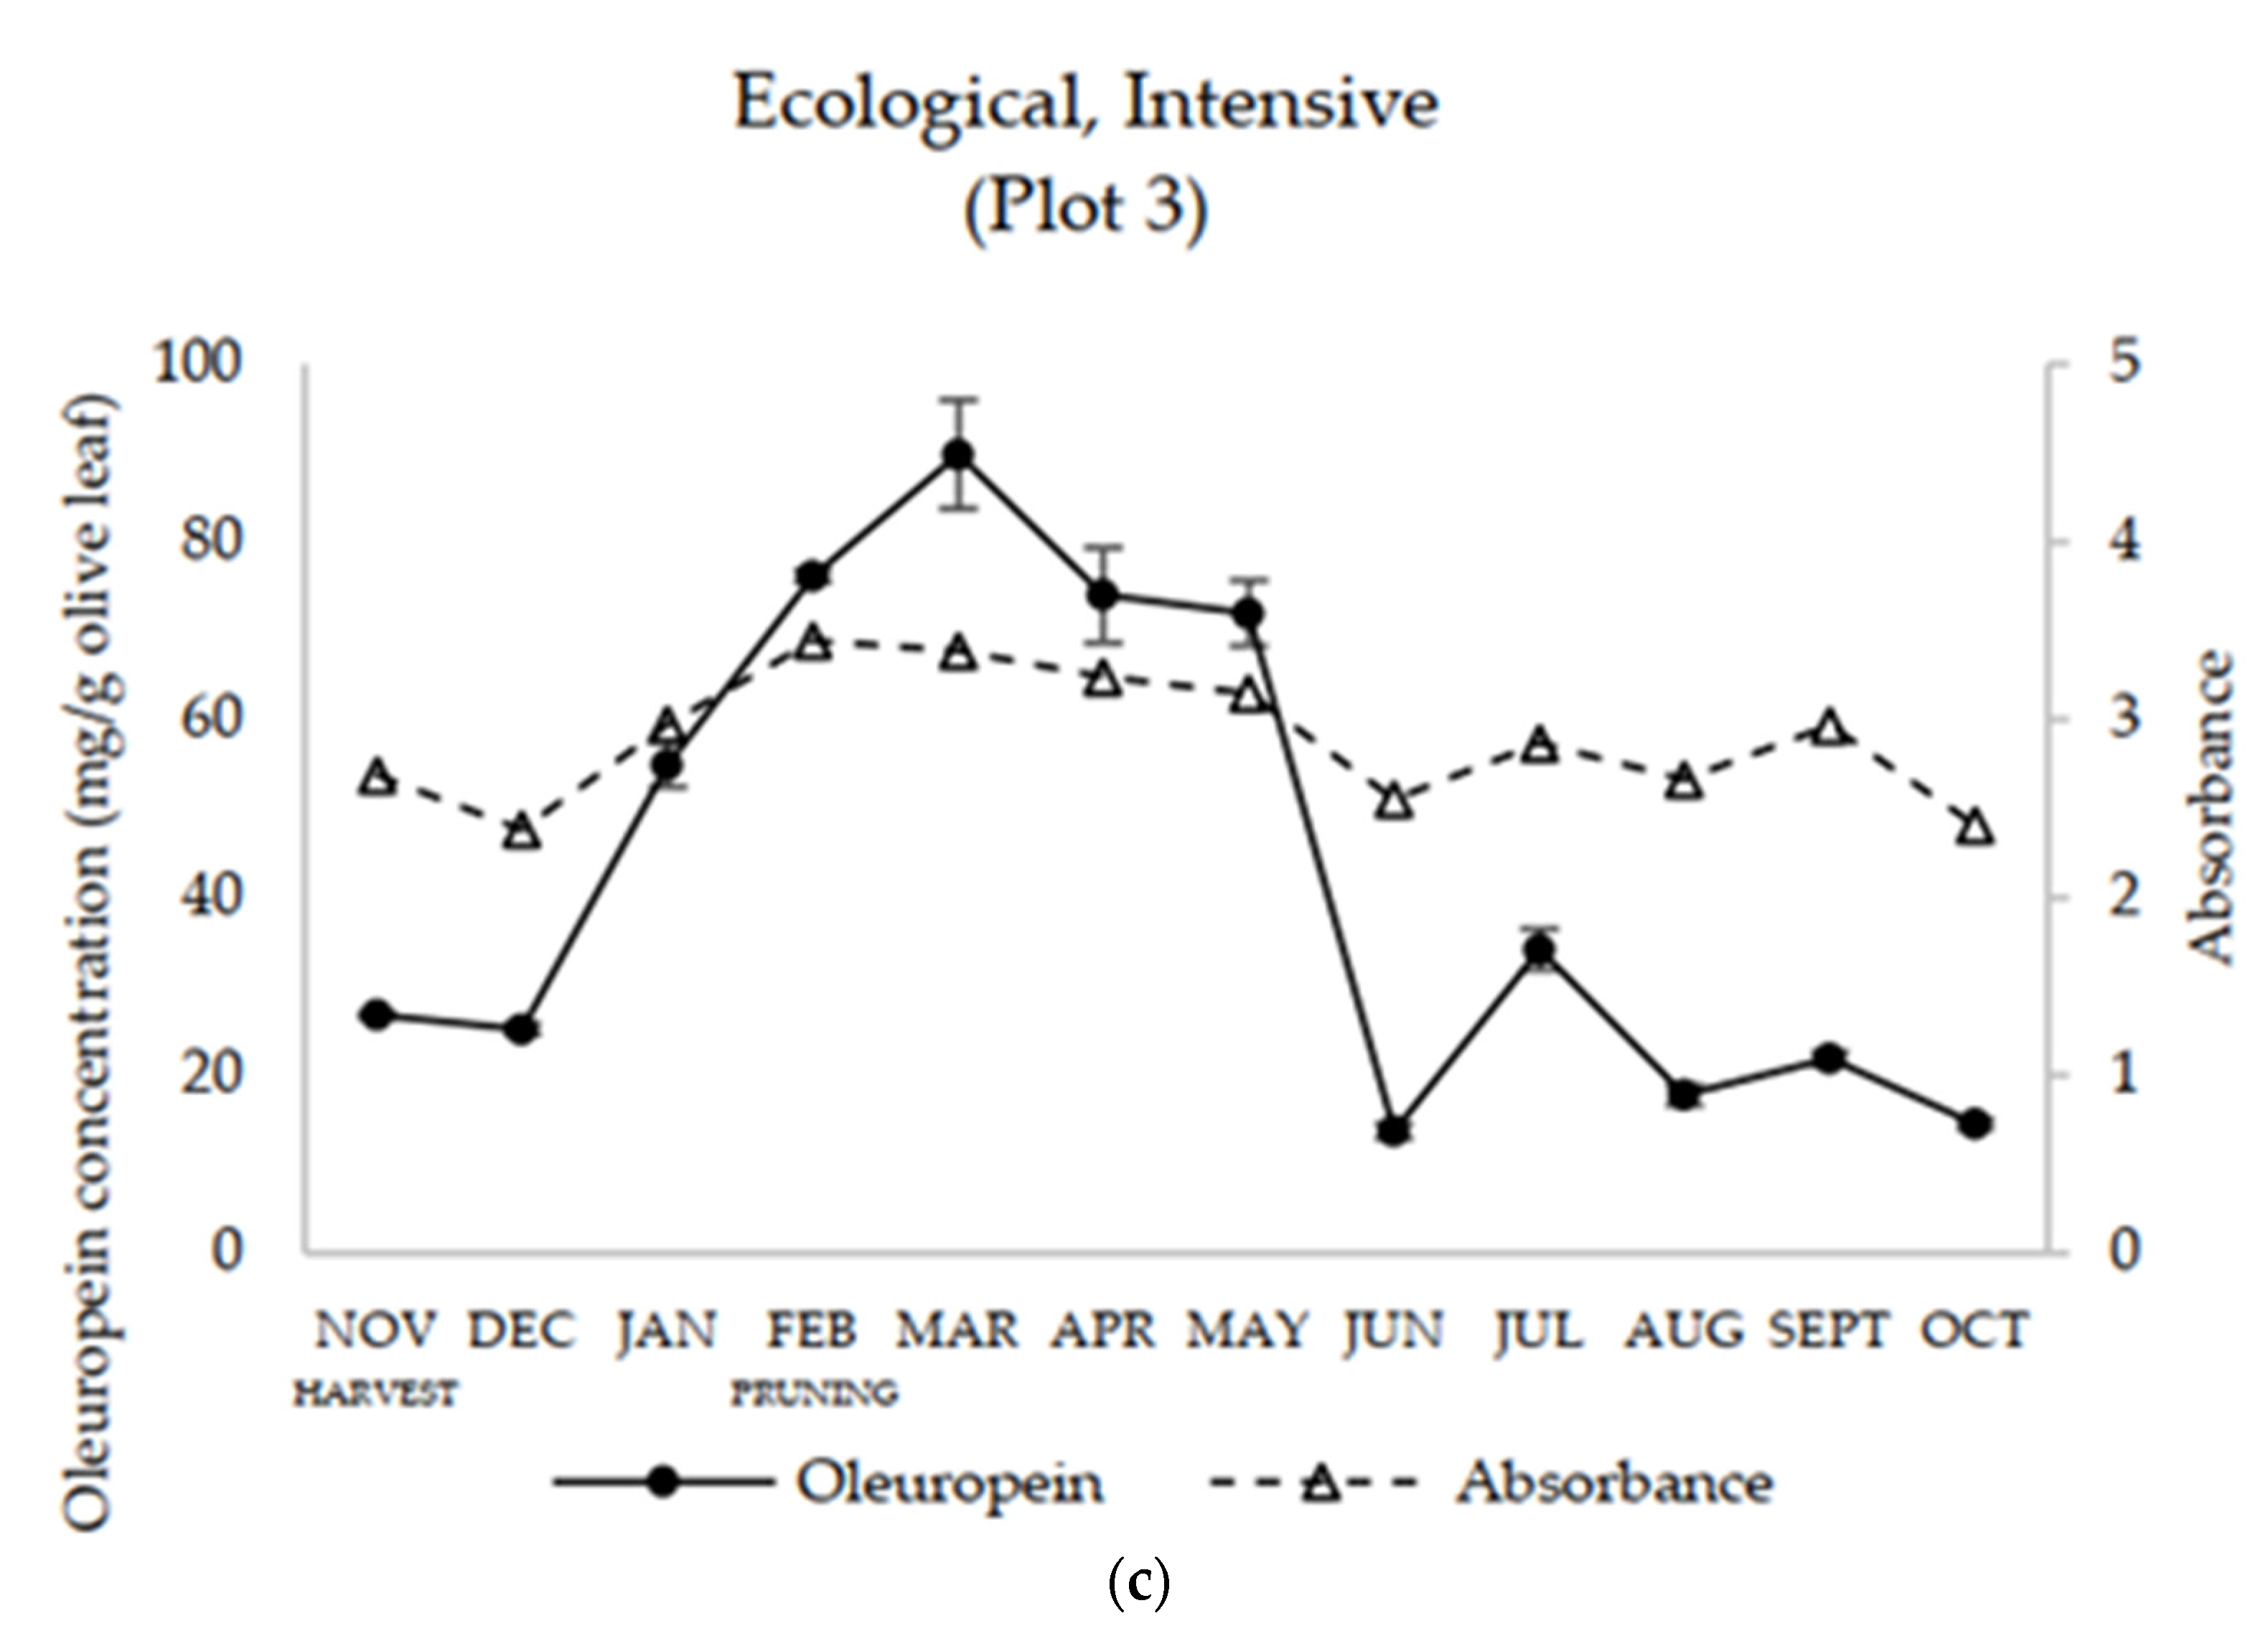
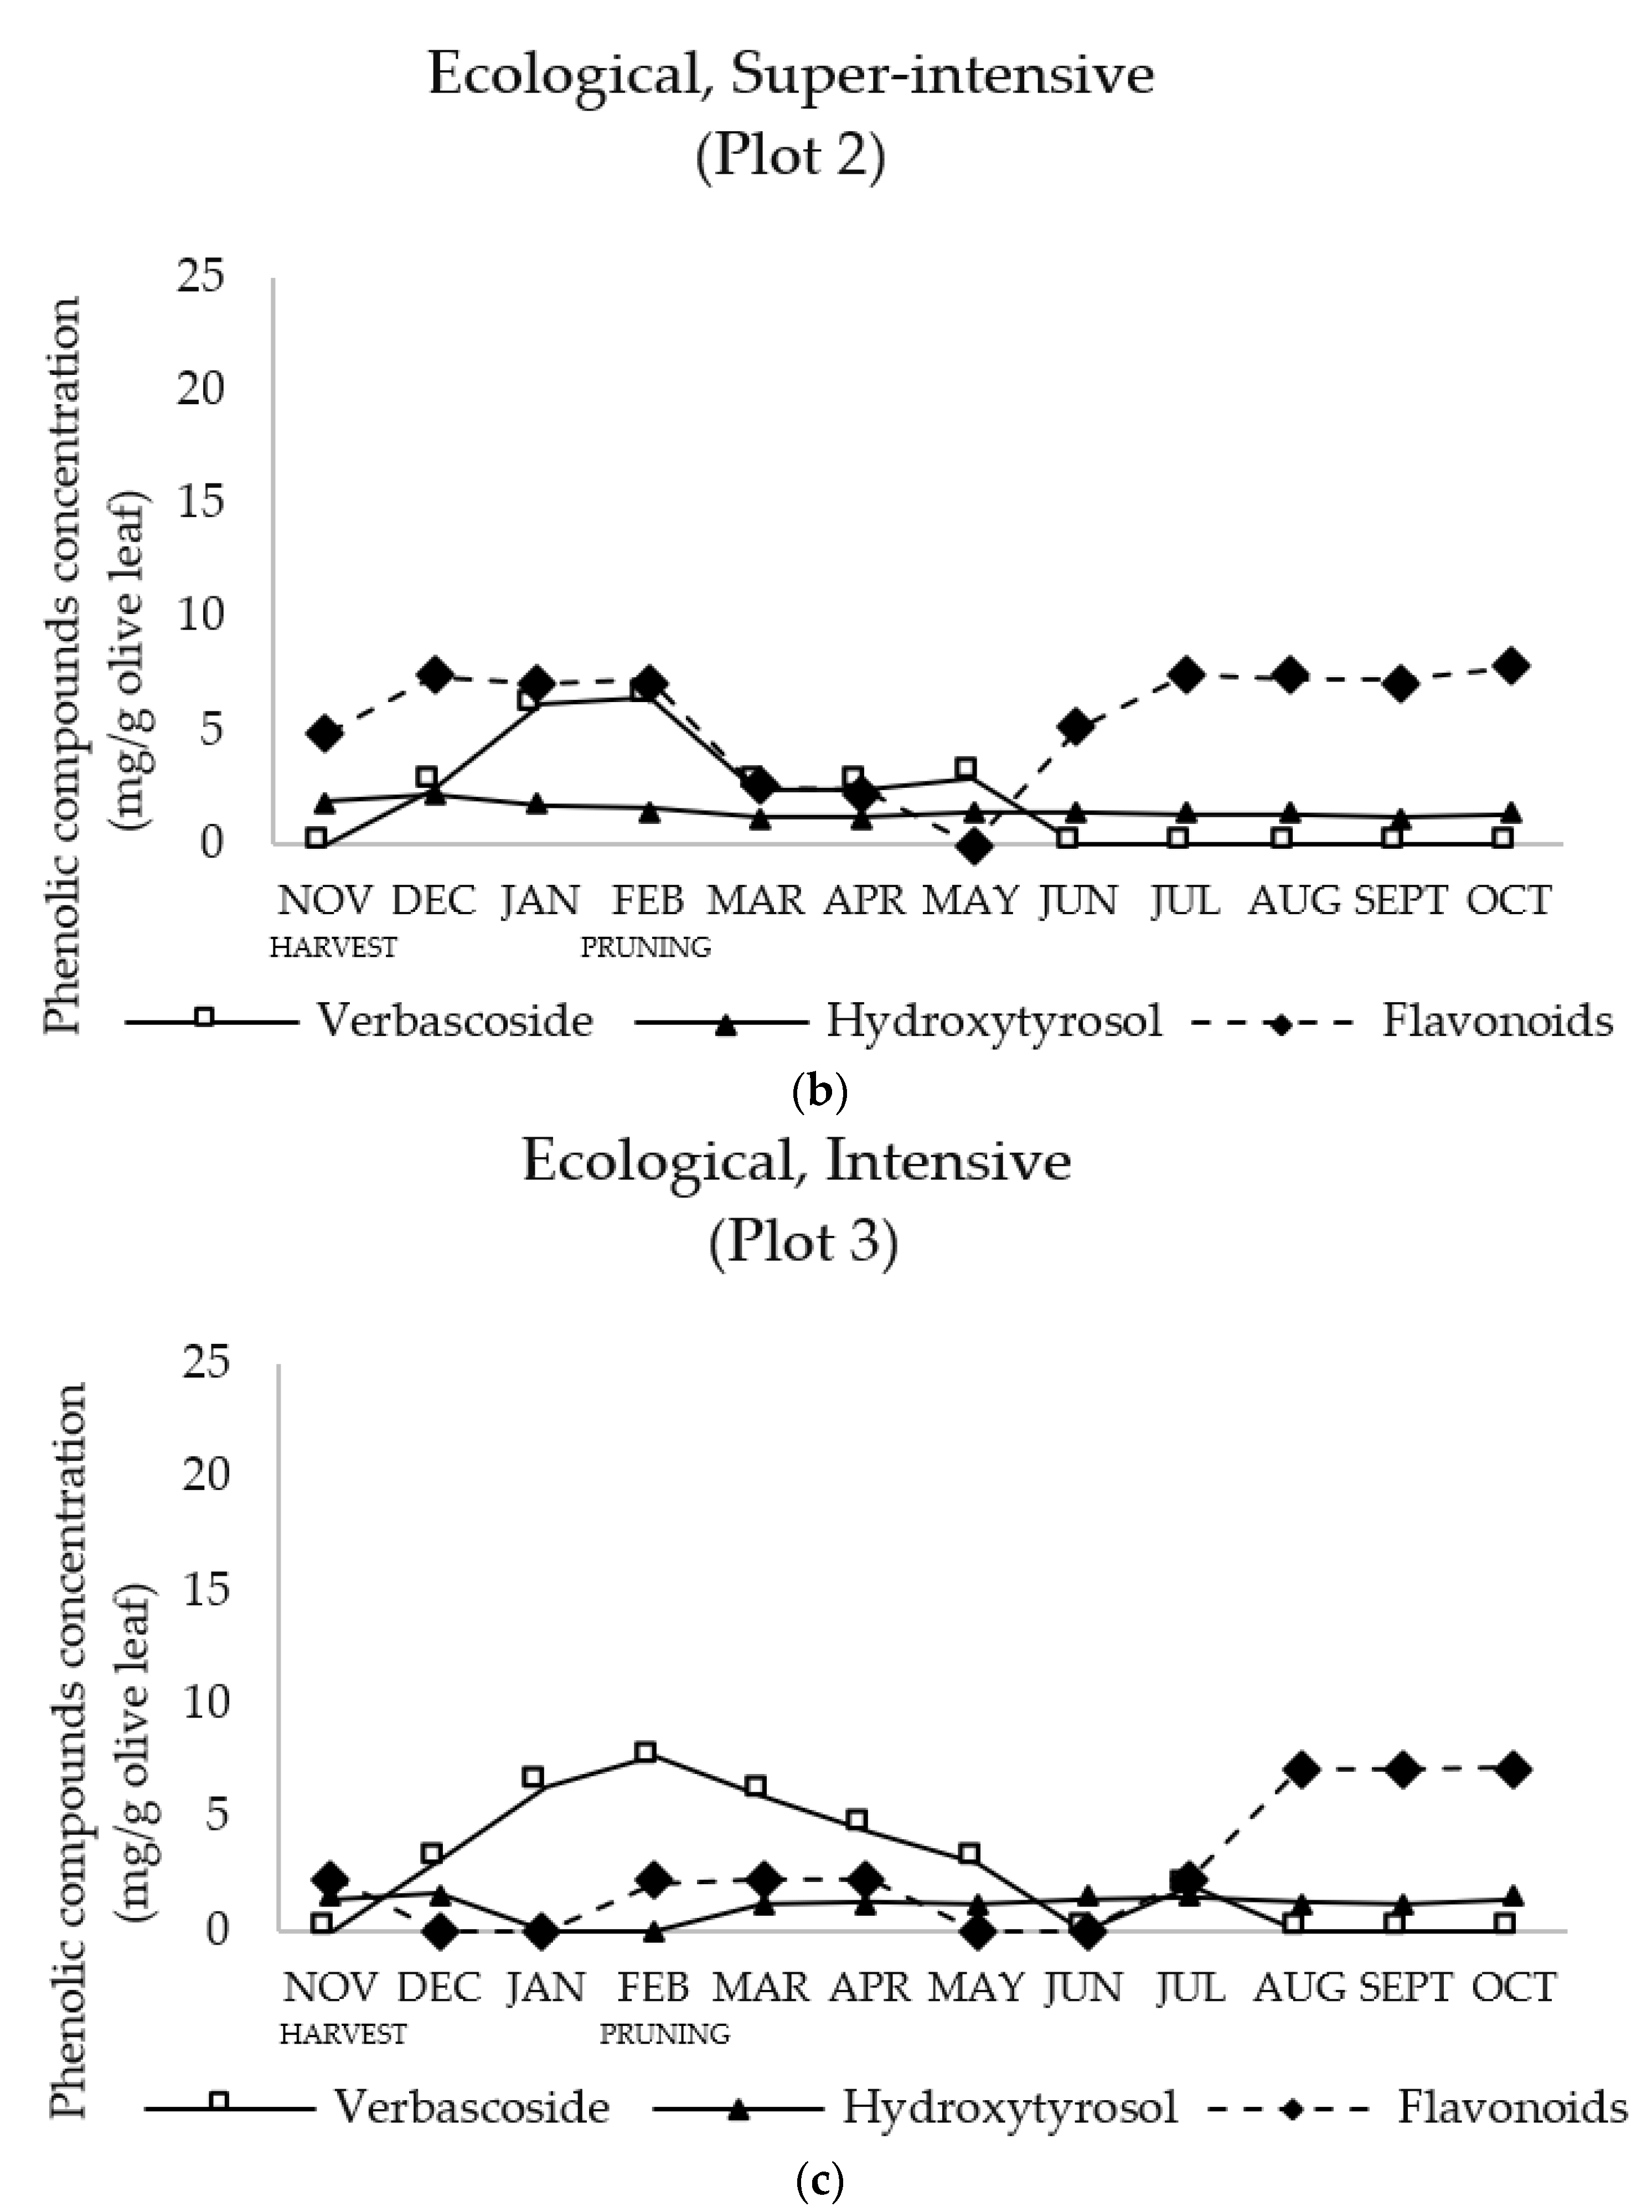
3.2. Comparison between Super-Intensive and Intensive Agronomic Conditions

The effects of super-intensive and intensive systems in the evolution of phenolic compounds in olive leaves are shown in Table 2. These systems only affected the flavonoid content (p < 0.05). However, as in the conventional and ecological systems, in P2 and P3, different behaviour in phenolic compounds was observed throughout the agronomic cycle. Figure 2b,c show the oleuropein content during this cycle in P2 and P3, respectively. The highest oleuropein concentration in P2 was 93.57 mg/g (pre-pruning) and, for P3, it was 89.83 mg/g (post-pruning). However, P3 showed a higher average content than P2, 43.40 mg/g, compared to P2′s 40.48 mg/g. In P2, the maximum oleuropein concentration was reached in a shorter time from the beginning of the cycle, while it did not do so in the intensive system until March. By contrast, the lowest oleuropein content was observed at the same time in both plots, in June, showing levels of 13.85 and 13.72 mg/g for P2 and P3, respectively.
Concerning the other phenolic compounds studied (Figure 3b,c), verbascoside was not detected during the summer and autumn seasons in any of the plots. The highest concentration was observed around the pruning season (February) with levels of 6.50 mg/g in March (post-pruning) for P2 and 7.71 mg/g in February (pruning) for P3. Hydroxytyrosol showed similar behaviour in both plots, remaining constant throughout the agronomic cycle. Concentrations in the super-intensive system ranged from 2.13 mg/g in December (post-harvest) to 1.23 mg/g in March (post-pruning) and in the intensive system presented values from 1.63 mg/g in December (post-harvest) to 1.14 mg/g in March (post-pruning). Regarding flavonoids, in P2, they remained constant except for a decrease in spring, while P3 showed more variations with the highest content occurring from August to October. The maximum concentrations were 7.72 mg/g in P2 and 7.24 mg/g in P3, both in October (pre-harvest).

3.3. Influence of Climatic Conditions

The correlations between climatic conditions (Table A1) and the studied compounds throughout the agronomic cycle are shown in Table 4.
The correlation coefficients (r) ranged between −1 and 1, where a correlation of −1 shows a perfect negative correlation, while a correlation of 1 shows a perfect positive correlation. The absolute maximum temperatures (TM) showed a negative correlation with hydroxytyrosol content in all plots, with the most pronounced in P1 (p < 0.01, r = −0.8035. Next, the absolute minimum temperature (tm) was negatively correlated with oleuropein, verbascoside and hydroxytyrosol content. Oleuropein content shows a negative correlation in all plots (p < 0.05, r = −0.4183), even though in P1, it was not statistically significant (p > 0.1). Regarding verbascoside, the most pronounced negative correlations occurred when the ecological system was used (p < 0.05, r = −0.6116), while hydroxytyrosol showed the most negative correlation in the super-intensive system (P1 (p < 0.05, r = −0.6504) and P2 (p < 0.1, r = −0.5250)). Regarding relative humidity (RH), it was observed that oleuropein and verbascoside content in all plots were negatively correlated (P3 (p < 0.1, r = −0.5338) and P1 (r = −0.6050), respectively), while hydroxytyrosol and flavonoid content showed positive correlations (p < 0.05, r = 0.6165 and r = 0.3687, respectively). There was a positive correlation between sunshine hour (SH) and verbascoside in P1 (p < 0.01, r = 0.7784) but a negative correlation with hydroxytyrosol in all plots (p < 0.1, r = −0.3024), especially when super-intensive systems were used (p < 0.05, r = −0.6414 in P1 and r = −0.6002 in P2). As for rainfall (RF), only flavonoids, from all plots, showed positive correlation (p < 0.1, r = 0.6548. A positive correlation was observed between the differential temperature (ΔT) and oleuropein (p < 0.1, r = 0.3125) and verbascoside (p < 0.05, r = 0.3677) in all plots, while for hydroxytyrosol (p < 0.05, r = −0.3961), this was negative. Regarding the influence of altitude, Table 2 shows that the two locations (L1, 752 m above sea level, and L2, 655 m above sea level) affected the verbascoside (p < 0.001) and hydroxytyrosol (p < 0.01) content.

3.4. Correlation between Oleuropein and Absorbance at 280 Nm

The correlation between the oleuropein content measured in all aqueous extracts and the absorbance at 280 nm of such extracts is shown in Figure 2a–c (Table A2), where a parallel behaviour can be observed. Specifically, when the oleuropein concentration decreases, absorbance also decreases, although in a less pronounced way. The highest absorbance at the beginning of the agronomic cycle corresponds to P2, coinciding with the maximum oleuropein content. From February, this absorbance decreased, and the absorbance that increased was that of P1, as observed in oleuropein evolution. In addition, trends coincided with the higher and more stable concentrations of this plot.

4. Discussion

During the comparison of the conventional and ecological plots, it was observed that the oleuropein contained in the leaves collected in autumn (October) was lower than in spring (March) in both plots (Figure 2). This behaviour could be associated with lower production of young green leaves (leaf renovation) during autumn compared to spring. Moreover, a higher degradation rate of this glycoside in autumn could be related to a decrease in the enzymatic activity of L-phenylalanine ammonia-lyase, which is involved in the metabolism of phenolic compounds in olive trees [22,23]. In contrast, Lama-Muñoz et al. (2020) [7] studied the oleuropein evolution in Arbequina ecological olive leaves during the pruning season (mid-November and mid-December); they observed that the highest concentration was 73.9 mg/g, which is more than in the results obtained in P1 and P2 in December but close to the maximum oleuropein concentration obtained in P1 (70.59 mg/g) in January. Romero et al. (2017) [24] studied Arbequina olive leaves from conventional production, where the highest oleuropein concentration was obtained in January (32.54 mg/g) and April (30.45 mg/g); these results are lower than those found in this study in similar months (in P1, 70.69 and 62.20 mg/g, respectively, and in P2, 93.57 and 40.83 mg/g).
The correlation statistical analysis from different compounds (Table 3) showed a positive correlation with verbascoside content and a negative correlation with hydroxytosol. Contrastingly, Amiot et al. (1986) [25] were the first to hypothesize about a metabolic inverse relationship between oleuropein content and verbascoside in olive fruit since both compounds share the same hydroxytyrosol moiety. Moreover, Funes et al. (2009) [26] suggested that the bioconversion of oleuropein in verbascoside could also occur during the maturation of olive fruits. However, in olive leaves, although it is true that the correlation of the key compound for the formation of oleuropein with verbascoside was negative, the correlation between oleuropein and verbascoside was positive. In summary, independently of the crop management used, higher oleuropein content was observed around the pruning season, which suggests encouraging results for the transformation of olive leaves to co-products and could be an additional benefit for the oil mill.
In the super-intensive and intensive agronomic conditions, the biodegradation oleuropein content overlapped with the first stages of fruit ripening, from August to November, and it reached a minimum in summer months, when the olive fruit is fully [27]. Between mid-November and mid-December, around 26.50 mg/g of oleuropein was obtained in leaves from the intensive system, which is lower than that obtained by Lama-Muñoz et al. (2020) [7], who obtained levels of 73.9 mg/g in a study about Arbequina leaves from intensive and ecological systems. Perhaps this small difference in content is due to the Soxhlet extraction method the authors used. In summary, similar to conventional and ecological systems, in super-intensive and intensive systems, it was observed that around pruning season was the most favourable period for obtaining phenolic compounds from the olive leaves.
Regarding the influence of climatic conditions (Table 4). TM influenced the hydroxytyrosol content in all plots, Dias et al. (2019) [28] demonstrated that heat stress in olive leaves decreased the levels of some phenolic compounds. However, they also observed that plants recovered from heat stress showed an increase in oleuropein, suggesting that this compound’s protective role may be more relevant during plant re-establishment. The tm showed a negative correlation with oleuropein, verbascoside and hydroxytyrosol. However, in P1, the oleuropein content showed no correlation, which could be due to the fact that in P1, which belongs to L1, tm was slightly colder than in P2 and P3 from L2. According to Cavaca et al. (2020) [16], in lightly cold-stressed leaves, oleuropein level is lower than in unstressed samples. In general, the increase observed of oleuropein, verbascoside and hydroxytyrosol content may be related to their antioxidant capacity and, therefore, they may offer protection against oxidative damage induced by freezing [13]. Relative humidity conditions correlated negatively with oleuropein and verbascoside content in all plots; Bilgin and Şahin (2013) [29] concluded that phenolic compounds tend to decrease in the leaves of trees cultivated in humid air (near sea level), which alters trees and fruits. This could explain the negative correlation of oleuropein and verbascoside but not the positive correlation of hydroxytyrosol and flavonoids with RH. Another climatic factor affecting the content was SH. Talhaoui et al. (2015) [13] observed that light was one of the abiotic factors affecting the phenolic compounds of olive leaves, especially flavonoids. However, in this study, these compounds were not affected, but verbascoside and hydroxytyrosol did respond to light exposition. The typical climate of the studied areas is quite dry, but it is well known that olive trees are drought tolerant. Mechri et al. (2020) [30] observed that phenolic compounds increased as a response to water stress, whereas in this study, only the flavonoid content presented statistical differences. As for the influence of altitude (Table 2), affected the verbascoside and hydroxytyrosol content. In this study, the total polyphenol concentration in P1 (L1) was higher than in P2 (L2), which aligns with Bilgin and Şahin (2013) [29], who showed from six different geographical origins in Turkey that at low geographic altitude, there is a greater decrease in phenolic compounds. In summary, the climatic conditions studied affected the content of oleuropein and the other studied phenolic compounds from olive leaves, RH and ΔT being the factors that influenced the content of all of them and the strongest correlation being observed between TM and hydroxytyrosol.
In respect of oleuropein and spectrophotometric method at 280 nm could be used to easily determine the oleuropein content in olive leaves over a given time period as well as to determine the content’s evolution. This correspondence between oleuropein and absorbance has already been suggested in a previous study [12].

5. Conclusions

The results obtained showed that oleuropein was the most abundant compound in olive leaves throughout an agronomic cycle. The highest levels of oleuropein were found around the pruning season, regardless of crop management and plantation framework, which suggests a great economic value of this waste being transformed into a co-product if collected at that time. Hydroxytyrosol and verbascoside varied depending on crop management and location, while flavonoids differed according to plantation framework. Climatic conditions influenced the content of oleuropein and the other studied phenolic compounds, RH and ΔT being the factors that influenced all studied compounds. Oleuropein was positively correlated with verbascoside, and this compound was negatively correlated with hydroxytyrosol. Finally, it was observed that the monitoring of the evolution of oleuropein content can be easily followed by measuring absorbance at 280 nm in aqueous extracts of leaves, which will allow the oil mill itself to determine the best time to take advantage of the olive leaves.

Author Contributions

Conceptualization, M.E.M.-N., C.C.-T., M.R.S. and G.L.A.; Methodology, M.E.M.-N., C.C.-T., M.R.S. and G.L.A.; software, M.E.M.-N. and C.C.-T.; Validation, M.E.M.-N. and C.C.-T.; Formal analysis, M.E.M.-N. and C.C.-T.; Investigation, M.E.M.-N.; Resources, M.E.M.-N., C.C.-T., M.R.S. and G.L.A.; Data curation, M.E.M.-N. and C.C.-T.; Writing—Original draft preparation, M.E.M.-N., C.C.-T., M.R.S. and G.L.A.; Writing—Review and Editing, M.E.M.-N., C.C.-T., M.R.S. and G.L.A.; Visualization, M.E.M.-N., C.C.-T., M.R.S. and G.L.A.; Supervision, G.L.A. and M.R.S.; Project administration, G.L.A. and M.R.S.; Funding acquisition, G.L.A. and M.R.S. All authors have read and agreed to the published version of the manuscript.

Funding

This research received no external funding.

Institutional Review Board Statement

Not applicable.

Informed Consent Statement

Not applicable.

Data Availability Statement

All the data are available in the manuscript file.

Acknowledgments

M.E. Martínez-Navarro wishes to thank the Universidad de Castilla–La Mancha for the predoctoral contract 2019-PREDUCLM. We thank the Government of Castilla–La Mancha (Spain) in collaboration with FEDER for financing the project SBPLY/17/180501/000191 and the owners of the plots for their collaboration.

Conflicts of Interest

The authors declare that they have no known competing financial interests or personal relationships that could have appeared to influence the work reported in this paper.

Appendix A

Table A1. Climatic conditions for each sampling carried out in the different locations.
LocationFeaturesAgronomic CycleTMtmRHSHRFΔT
Location 1Plot 1
Super-intensive, Conventional, Rainfed
752 m above sea level
Nov12.266.0082.267.231.026.26
Dec15.06−0.2084.867.680.1615.26
Jan12.12−1.6263.888.920.0013.74
Feb19.50−0.6265.869.440.0020.12
Mar14.143.8072.5810.580.6810.34
Apr27.906.8447.2812.720.0021.06
May33.6214.6651.5512.900.0018.96
Jul31.2814.7636.6412.680.0016.52
Aug30.7214.6659.0811.160.0216.06
Sept23.913.1876.5810.1419.4410.72
Oct21.007.9679.428.220.0213.04
Location 2Plot 2
Super-intensive, Ecological, Irrigation
Plot 3
Intensive, Ecological, Irrigation
655 m above sea level
Nov12.664.6867.107.780.187.98
Dec14.185.6067.867.540.008.58
Jan13.804.7477.827.580.049.06
Feb19.803.8849.569.580.0015.92
Mar21.445.1435.309.980.0016.3
Apr14.466.0469.2210.003.438.42
May26.629.3057.7212.620.0017.32
Jun26.8611.7256.9512.200.1415.14
Jul33.1816.0045.2412.840.0017.18
Aug30.5016.3270.8011.065.2614.18
Sept26.4016.2078.1610.220.0010.2
Oct14.806.8278.647.7811.47.98
Location 1: South of Castilla–La Mancha; Location 2: East of Castilla–La Mancha. TM: absolute maximum temperature (°C); Tm: absolute minimum temperature (°C); RH: relative humidity (%); SH: sunshine hours (h); RF: rainfall (mm).ΔT: temperature differential (°C). Climatic measurements correspond to an average of 5 previous days.
Table A2. Evolution of oleuropein (mg/g) and absorbance at 280 nm of olive leaves cv. Arbequina.
PlotAgricultural SystemAgronomic CycleOleuropeinUV-Vis
Plot 1Super-intensive, ConventionalNov23.802.692
Dec63.893.272
Jan70.692.751
Feb58.712.989
Mar73.033.664
Apr62.203.458
May46.623.153
Jul70.154.058
Aug53.493.229
Sept58.373.363
Oct13.092.537
Plot 2Super-intensive, Ecological Nov14.662.823
Dec27.223.678
Jan93.573.678
Feb86.003.455
Mar58.503.026
Apr40.832.935
May63.143.237
Jun13.852.342
Jul18.602.537
Aug14.942.508
Sept33.092.970
Oct21.322.808
Plot 3Intensive,
Ecological
Nov26.762.687
Dec25.182.382
Jan54.942.974
Feb76.153.443
Mar89.833.387
Apr73.983.243
May71.983.147
Jun13.722.552
Jul34.162.870
Aug17.752.662
Sept21.852.968
Oct14.532.406

References

  1. FAOSTAT. Food and Agriculture Organization Statitical Databases. Available online: http://www.fao.org/faostat/en/#data (accessed on 12 December 2020).
  2. Willer, H.; Lernoud, J. The World of Organic Agriculture, 1st ed.; FiBL, IFOAM: Rheinbreitbach, Germany, 2020; p. 333. [Google Scholar]
  3. UPA (Unión de Pequeños Agriculturoes). Comprometidos Con El Futuro del Olivar en España La tierra del Agricultor y Ganadero; UPA: Madrid, Spain, 2018; p. 34. [Google Scholar]
  4. MAPAMA (Ministerio de Agricultura y Pesca, Alimentación y Medio Ambiente), 2019. Superficies y Producciones Anuales de Cultivos. Available online: https://www.mapa.gob.es/es/estadistica/temas/estadisticas-agrarias/agricultura/superficies-producciones-anuales-cultivos/ (accessed on 23 May 2020).
  5. Díez, C.M.; Moral, J.; Cabello, D.; Morello, P.; Rallo, L.; Barranco, D. Cultivar and Tree Density As Key Factors in the Long-Term Performance of Super High-Density Olive Orchards. Front. Plant Sci. 2016, 7, 1226. [Google Scholar] [CrossRef] [PubMed] [Green Version]
  6. Contreras, M.d.M.; Romero, I.; Moya, M.; Castro, E. Olive-derived biomass as a renewable source of value-added products. Process Biochem. 2020, 97, 43–56. [Google Scholar] [CrossRef]
  7. Lama-Muñoz, A.; Contreras, M.d.M.; Espínola, F.; Moya, M.; Romero, I.; Castro, E. Content of phenolic compounds and mannitol in olive leaves extracts from six Spanish cultivars: Extraction with the Soxhlet method and pressurized liquids. Food Chem. 2020, 320, 126626. [Google Scholar] [CrossRef] [PubMed]
  8. Ruiz, E.; Romero-García, J.M.; Romero, I.; Manzanares, P.; Negro, M.J.; Castro, E. Olive-derived biomass as a source of energy and chemicals. Biofuels Bioprod. Biorefining 2017, 11, 1077–1094. [Google Scholar] [CrossRef]
  9. Medina, E.; Romero, C.; Garcia, P.; Brenes, M. Characterization of bioactive compounds in commercial olive leaf extracts, and olive leaves and their infusions. Food Funct. 2019, 10, 4716–4724. [Google Scholar] [CrossRef] [Green Version]
  10. Şahin, S.; Elhussein, E.; Bilgin, M.; Lorenzo, J.M.; Barba, F.J.; Roohinejad, S. Effect of drying method on oleuropein, total phenolic content, flavonoid content, and antioxidant activity of olive (Olea europaea) leaf. J. Food Process. Preserv. 2018, 42, e13604. [Google Scholar] [CrossRef]
  11. Liu, B.; Liu, J.; Huang, D.; Pei, D.; Wei, J.; Di, D. Isolation and purification of oleuropein from olive leaves using boric acid affinity resin and a novel solvent system. Colloids Surf. A Physicochem. Eng. Asp. 2021, 614, 126145. [Google Scholar] [CrossRef]
  12. Martínez-Navarro, E.M.; Cebrián-Tarancón, C.; Moratalla-López, N.; Lorenzo, C.; Alonso, G.L.; Salinas, R.M. Development and validation of an HPLC-DAD method for determination of oleuropein and other bioactive compounds in olive leaf by-products. J. Sci. Food Agric. 2021, 101, 1447–1453. [Google Scholar] [CrossRef]
  13. Talhaoui, N.; Taamalli, A.; Gómez-Caravaca, A.M.; Fernández-Gutiérrez, A.; Segura-Carretero, A. Phenolic compounds in olive leaves: Analytical determination, biotic and abiotic influence, and health benefits. Int. Food Res. J. 2015, 77, 92–108. [Google Scholar] [CrossRef]
  14. Žugčić, T.; Abdelkebir, R.; Alcantara, C.; Collado, M.C.; García-Pérez, J.V.; Meléndez-Martínez, A.J.; Režek Jambrak, A.; Lorenzo, J.M.; Barba, F.J. From extraction of valuable compounds to health promoting benefits of olive leaves through bioaccessibility, bioavailability and impact on gut microbiota. Trends Food Sci. Technol. 2019, 83, 63–77. [Google Scholar] [CrossRef]
  15. Guinda, Á.; Castellano, J.M.; Santos-Lozano, J.M.; Delgado-Hervás, T.; Gutiérrez-Adánez, P.; Rada, M. Determination of major bioactive compounds from olive leaf. LWT-Food Sci. Technol. 2015, 64, 431–438. [Google Scholar] [CrossRef] [Green Version]
  16. Cavaca, L.A.S.; López-Coca, I.M.; Silvero, G.; Afonso, C.A.M. Chapter 5—The olive-tree leaves as a source of high-added value molecules: Oleuropein. In Studies in Natural Products Chemistry; Atta Ur, R., Ed.; Elsevier: Amsterdam, The Netherlands, 2020; Volume 64, pp. 131–180. [Google Scholar]
  17. López de las Hazas, M.-C.; Piñol, C.; Macià, A.; Romero, M.-P.; Pedret, A.; Solà, R.; Rubió, L.; Motilva, M.-J. Differential absorption and metabolism of hydroxytyrosol and its precursors oleuropein and secoiridoids. J. Funct. Foods 2016, 22, 52–63. [Google Scholar] [CrossRef] [Green Version]
  18. Robles-Almazan, M.; Pulido-Moran, M.; Moreno-Fernandez, J.; Ramirez-Tortosa, C.; Rodriguez-Garcia, C.; Quiles, J.L.; Ramirez-Tortosa, M. Hydroxytyrosol: Bioavailability, toxicity, and clinical applications. Food Res. Int. 2018, 105, 654–667. [Google Scholar] [CrossRef] [PubMed]
  19. Román, R.; Amoros, J.; Pérez-de-los-Reyes, C.; Navarro, F.J.; Bravo, S. Estudio del contenido de elementos mayoritarios y traza en hojas de olivo. Olivae 2014, 119, 1–7. [Google Scholar] [CrossRef]
  20. Martínez-Navarro, M.E.; Cebrián-Tarancón, C.; Oliva, J.; Salinas, M.R.; Alonso, G.L. Oleuropein Degradation Kinetics in Olive Leaf and Its Aqueous Extracts. Antioxidants 2021, 10, 1963. [Google Scholar] [CrossRef] [PubMed]
  21. SIAR. Servicio Inegral de Asesoramiento al Regante de Castilla-La Mancha. Available online: http://crea.uclm.es/siar/ (accessed on 19 September 2020).
  22. Ranalli, A.; Contento, S.; Lucera, L.; Di Febo, M.; Marchegiani, D.; Di Fonzo, V. Factors Affecting the Contents of Iridoid Oleuropein in Olive Leaves (Olea europaea L.). J. Agric. Food Chem. 2006, 54, 434–440. [Google Scholar] [CrossRef]
  23. Ortega-García, F.; Peragón, J. Phenol Metabolism in the Leaves of the Olive Tree (Olea europaea L.) cv. Picual, Verdial, Arbequina, and Frantoio during Ripening. J. Agric. Food Chem. 2010, 58, 12440–12448. [Google Scholar] [CrossRef]
  24. Romero, C.; Medina, E.; Mateo, M.A.; Brenes, M. Quantification of bioactive compounds in Picual and Arbequina olive leaves and fruit. J. Sci. Food Agric. 2017, 97, 1725–1732. [Google Scholar] [CrossRef] [Green Version]
  25. Amiot, M.J.; Fleuriet, A.; Macheix, J.J. Importance and evolution of phenolic compounds in olive during growth and maturation. J. Agric. Food Chem. 1986, 34, 823–826. [Google Scholar] [CrossRef]
  26. Funes, L.; Fernández-Arroyo, S.; Laporta, O.; Pons, A.; Roche, E.; Segura-Carretero, A.; Fernández-Gutiérrez, A.; Micol, V. Correlation between plasma antioxidant capacity and verbascoside levels in rats after oral administration of lemon verbena extract. Food Chem. 2009, 117, 589–598. [Google Scholar] [CrossRef]
  27. Ortega-García, F.; Peragón, J. HPLC analysis of oleuropein, hydroxytyrosol, and tyrosol in stems and roots of Olea europaea L. cv. Picual during ripening. J. Sci. Food Agric. 2010, 90, 2295–2300. [Google Scholar] [CrossRef]
  28. Dias, M.C.; Figueiredo, C.; Pinto, D.C.G.A.; Freitas, H.; Santos, C.; Silva, A.M.S. Heat shock and UV-B episodes modulate olive leaves lipophilic and phenolic metabolite profiles. Ind. Crops Prod. 2019, 133, 269–275. [Google Scholar] [CrossRef]
  29. Bilgin, M.; Şahin, S. Effects of geographical origin and extraction methods on total phenolic yield of olive tree (Olea europaea) leaves. J. Taiwan Inst. Chem. Eng. 2013, 44, 8–12. [Google Scholar] [CrossRef]
  30. Mechri, B.; Tekaya, M.; Hammami, M.; Chehab, H. Effects of drought stress on phenolic accumulation in greenhouse-grown olive trees (Olea europaea). Biochem. Syst. Ecol. 2020, 92, 104112. [Google Scholar] [CrossRef]
Figure 1. Climatic conditions from November (2019) to October (2020). (a): Location 1; (b): Location 2. Main axis: absolute maximum temperature (TM; °C) and absolute minimum temperature (tm; °C). Secondary axis: rainfall (RF; mm), relative humidity (RH; %) and sunshine hours (SH; h).
Horticulturae 08 00530 g001
Figure 2. Evolution of oleuropein (mg/g) and absorbance at 280 nm of olive leaves cv. Arbequina during an agronomic cycle (November 2019 to October 2020). (a) Plot 1: Conventional and super-intensive; (b) Plot 2: Ecological and super-intensive; (c) Plot 3: Ecological and intensive.
Horticulturae 08 00530 g002aHorticulturae 08 00530 g002b
Figure 3. Evolution of several phenolic compounds (mg/g) of olive leaves cv. Arbequina during an agronomic cycle (November 2019 to October 2020). (a) Plot 1: Conventional and super-intensive; (b) Plot 2: Ecological and super-intensive; (c) Plot 3: Ecological and intensive.
Horticulturae 08 00530 g003aHorticulturae 08 00530 g003b
Table 1. Summary of the different Arbequina plots and agronomic conditions subject of study.
PlotLocationCrop ManagementPlantation Framework
P1L1 1ConventionalSuper-intensive
P2L2 2EcologicalSuper-intensive
P3EcologicalIntensive
1 South of Castilla–La Mancha; 2 East of Castilla–La Mancha.
Table 2. Multifactorial analysis of different agronomic conditions on the phenolic compounds of olive leaves.
OleuropeinVerbascosideHydroxytyrosolFlavonoids
Conventional or ecological systems
Location
1.5815.21 ****8.88 ***0.04
Super-intensive or intensive systems0.080.182.377.07 **
Fisher’s LSD test (α < 0.05) least significant difference. Significant correlation values are typed in bold according to: ** p value < 0.05; *** p value < 0.01; **** p value < 0.001.
Table 3. Correlation between studied phenolic compounds of olive leaves.
PlotOleuropeinVerbascosideHydroxytyrosol
Verbascoside10.5687
20.9407 ****
30.8513 ****
1, 2, 30.5985 ****
Hydroxytyrosol10.2491−0.3744
20.05570.2785
3−0.4759−0.7235 ***
1, 2, 3−0.169−0.5153 ***
Flavonoids1−0.19460.60010.3195
2−0.1924−0.07860.1975
3−0.4112−0.49210.1877
1, 2, 3−0.2022−0.12830.1627
Plot 1: Conventional and Super-intensive; Plot 2: Ecological and Super-intensive; Plot 3: Ecological and Intensive. Significant correlation values are typed in bold according to: *** p value < 0.01; **** p value < 0.001.
Table 4. Correlation between the different climatic conditions and compounds of olive leaves.
PlotOleuropeinVerbascosideHydroxytyrosolFlavonoids
TM10.03630.4117−0.8035 ***−0.3141
2−0.2573−0.3777−0.5751 *0.0064
3−0.1539−0.29880.20560.2047
1, 2, 3−0.12660.0983−0.3760 **0.0053
tm1−0.18550.2379−0.6504 **0.0865
2−0.5169 *−0.6242 **−0.5250 *0.2378
3−0.5087 *−0.6116 **0.37990.4675
1, 2, 3−0.4183 **−0.1522−0.20730.1894
RH1−0.4098−0.6050 **0.6165 **0.4807
2−0.1540−0.13220.15850.3559
3−0.5338 *−0.40960.00630.3887
1, 2, 3−0.3227 *−0.2879 *0.24030.3687 **
SH10.42300.7784 ***−0.6414 **−0.5081
2−0.1716−0.2796−0.6002 **−0.3587
30.0898−0.17220.2280−0.0669
1, 2, 30.08110.2766−0.3024 *−0.2333
RF10.0602−0.10360.38620.2073
2−0.3281−0.3298−0.34700.2370
3−0.3392−0.36400.22580.6548 **
1, 2, 3−0.1721−0.12670.18890.3040 *
ΔT10.32870.3949−0.5062−0.6827 **
20.16770.0786−0.4097−0.2842
30.34870.2090−0.0927−0.2035
1, 2, 30.3125 *0.3677 **−0.3961**−0.2330
TM: absolute maximum temperature; tm: absolute minimum temperature; RH: relative humidity; SH: sunshine hour; RF: rainfall; ΔT: differential temperature; Plot 1: Conventional and Super-intensive; Plot 2: Ecological and Super-intensive; Plot 3: Ecological and Intensive. Significant correlation values are typed in bold according to: * p value < 0.1; ** p value < 0.05; *** p value < 0.01.
Publisher’s Note: MDPI stays neutral with regard to jurisdictional claims in published maps and institutional affiliations.

