Article

Dynamic Changes of Fruit Physiological Quality and Sugar Components during Fruit Growth and Development of Actinidia eriantha

1
College of Agronomy, Jiangxi Agricultural University, Nanchang 330045, China
2
Institute of Kiwifruit, Jiangxi Agricultural University, Nanchang 330045, China
*
Author to whom correspondence should be addressed.
Horticulturae 2022, 8(6), 529; https://doi.org/10.3390/horticulturae8060529
Submission received: 28 April 2022 / Revised: 6 June 2022 / Accepted: 13 June 2022 / Published: 15 June 2022
(This article belongs to the Special Issue Genetics and Breeding of Fruit Trees)

Abstract

:
‘Ganlv 1’ is a new cultivar of Actinidia eriantha selected from the wild natural population, which has the advantages of moderate taste, high yield, easy peeling and high ascorbic acid (AsA) content. In this study, ‘Ganlv 1’ was used to explore the changes in fruit quality, soluble sugar components, sucrose metabolism-related enzymes activities and sucrose metabolism-related enzyme genes’ expression during the fruit’s development. The results showed that, except for AsA, the changes in the fruit quality index and fruit growth and development during the development of ‘Ganlv 1’ basically exhibited the same trend. The fruit shape index was different in the different development stages of the fruit, and tended to be stable with fruit growth and development. The dynamic changes of the dry matter content indicated that the best time for fruit harvest was about 160 days after full bloom. The main sugar components in the fruit were fructose, glucose and sucrose, and sucrose and glucose were the main sugars in the soft-ripening stage. The trend of sucrose accumulation, the activities of the sucrose metabolism-related enzymes and the expression of the sucrose metabolism-related genes indicated that 130–145 days after full bloom (DAFB) might be the critical period of sucrose metabolism. The results are of great significance for clarifying the developmental characteristics and dynamic changes in the sugar components in A. eriantha fruits, and lay a foundation for further studying of the mechanism of sugar metabolism in A. eriantha.

1. Introduction

Actinidia eriantha Benth. is a perennial deciduous vine of the genus, Actinidia. The surface of A. eriantha is covered with a layer of white fluff, and its emerald green flesh is rich in flavor and nutrients. Compared with A. chinensis and A. deliciosa, A. eriantha has stronger adaptability and stress resistance. Its high content of AsA is the most striking characteristic of A. eriantha, and 100 g of its fresh fruit contains as much as 596–1397 mg of AsA, which is three to four times that of A. chinensis [1]. Therefore, A. eriantha is a special germplasm resource for cultivating new varieties of kiwifruit with a high AsA content. In addition, A. eriantha has the characteristics of easy peeling after soft ripening, a long shelf life, and other characteristics which have high scientific research and economic value. China has abundant germplasm resources of A. eriantha, and many new cultivars of a good quality have been bred, such as ‘White’ and ‘Ganmi 6’ [2,3]. ‘Ganlv 1’ is a new cultivar selected from the natural population of wild A. eriantha by our group. It has the advantages of moderate taste, good yield and high AsA content, and has a high potential for development and utilization. However, the dynamic changes in the fruit quality and sugar components during the development of ‘Ganlv 1’ fruits are still unclear.
The fruit quality is mainly determined by the exterior and internal quality of the fruit. The exterior quality mainly includes the fruit color, fruit weight, freshness, fruit shape index and other indicators, while the internal quality is mainly determined by a variety of fruit inclusions, such as the soluble solids content, total acid, sugar components, nutrients, flavor and so on. At present, many studies have been carried out to determine and evaluate the fruit quality of A. eriantha. For example, by comparing the effects of different harvest maturity on the postharvest fruit quality and storage of A. eriantha ‘White’, the results showed that the fruit should be harvested, as far as possible, before 165 days after full bloom [4]. The three main components of the comprehensive evaluation of fruit quality were identified by analyzing the quality of wild A. eriantha, and the diversity of the fruit quality of different wild A. eriantha was revealed [5]. The comprehensive analysis of the fruit quality of wild A. eriantha showed that there were great differences in the fruit quality indexes, among which the coefficient of variation of single fruit weight was the largest (>33%), while the coefficient of fruit transverse and soluble solids was relatively small (11% and 11.91%, respectively), indicating that the fruit traits of wild A. eriantha had a rich genetic diversity [6,7]. Based on the BBCH (Biologische Bundesantalt, Bundessortenamt and Chemische Industrie) measurement method, a standard model for systematically describing the growth and development of the ‘White’ fruit was constructed, and the characteristics of fruit morphology, growth and development, as well as the accumulation and dynamic changes of the carbohydrate and organic acid in fruit, from anthesis to senescence, were studied [8]. In addition, the dynamic changes in the soluble sugars, titratable acid and ascorbic acid contents during the fruit development of ‘Ganmi 6’ and other A. eriantha fruits were also examined [9,10,11]. These studies are helpful to understand the growth and development characteristics and fruit quality of A. eriantha.
Sugar is an important basis for the formation of fruit flavor quality. The metabolism and accumulation of sugar in fruit are important factors affecting the fruit quality. The types and quantity of sugars determine the quality of the fruit to a large extent. The soluble sugars accumulated in the fruits of horticultural plants are mainly sucrose, fructose and glucose [12,13]. However, in the process of fruit growth and development, the types and contents of the sugars in the fruits of different horticultural plants are different to some extent. For example, the fruit of the wolfberry (Lycium barbarum L.) was rich in total sugars and fructose, and the predominant sugars at the maturity of the fruit were fructose and glucose [14]. In the determination of the sugar components of 86 apple varieties, it was found that the soluble sugar in the apple fruits was mainly fructose, and the content of sucrose (92.7%) in most of the varieties was higher than that of glucose [15]. The main components of sugar in grapes were glucose and fructose, and the content of sucrose was lower [16]. During the development of the ‘White’ fruit, the content of fructose was the highest, followed by glucose, and the content of sucrose was the lowest [8]. The sucrose content of ‘Ganmi 6’ was higher than that of glucose and fructose in the early stages of fruit development, while the content of fructose was the highest, followed by glucose and sucrose in the late stages of fruit development [17].
In this study, the fruit quality, sugar components and sugar metabolism-related enzyme activities of the new A. eriantha cultivar ‘Ganlv 1’ during fruit development were detected and analyzed to reveal the dynamic changes in fruit quality and sugar metabolism-related mechanism characteristics of ‘Ganlv 1’. The results will lay a foundation for further understanding the fruit development characteristics, fruit quality formation mechanisms and the development and utilization of the new varieties of A. eriantha.

2. Materials and Methods

2.1. Experimental Materials

The experimental material of A. eriantha ‘Ganlv 1’ was collected from the germplasm resource nursery of the Kiwifruit Research Institute of Fengxin County, Jiangxi Province. The fruit samples were picked on 3 June 2019, which was 25 days after full bloom (DAFB), and the fruits were collected every 15 days for a total of 13 times. Thirty fruits of the same size and with no damage were collected randomly at each time point. The samples at the soft-ripening stage (fruit firmness reached 1.0 kg·cm−2) were collected separately to the fruit ripening stage. The fruits collected each time were randomly divided into three groups, and each group contained 10 fruits, which represented the three repetitions of the experiment. After measuring the appearance quality, the collected fruit samples were placed at room temperature until naturally soft and ripe (fruit firmness reached 1.0 kg·cm−2). Then, the epidermis of the soft, ripe fruit samples was removed, and the outer and inner pericarps were chopped and immediately frozen with liquid nitrogen. Finally, the samples were stored in a refrigerator at −80 °C for later use.

2.2. Measurement of Fruit Physiological Quality

The fruit shape index and single fruit weight were measured immediately after the kiwifruit samples were collected, and other fruit quality indexes were determined after the natural soft ripening at room temperature. The appearance qualities during the fruit development, including longitudinal diameter, transverse diameter and lateral diameter, were measured using vernier calipers. The fruit shape index was obtained by calculating the ratio of the longitudinal and transverse diameters. The single fruit weight was measured using an analytical balance. The soluble solids content (SSC) was determined using a digital hand-held pocket refractometer (model PAL-1, ATAGO, Tokyo, Japan). The dry matter (DM) content was determined by drying a 5 mm slice from the equatorial central transverse section of the fruit at 55 °C for about 24 h until constant weight. The content of titratable acid (TA) was determined by acid-base titration [18]. The content of vitamin C was determined by the 2,6-dichloroindophenol titration method [18]. The soluble sugar content was determined by the anthrone colorimetry method [18].

2.3. Determination of Sugar Components

The sugar components were determined by improved high-performance liquid chromatography (HPLC). About 4 g of the frozen pulp was accurately weighed from each sample, ground into homogenate under liquid nitrogen, and then transferred into a 15 mL centrifuge tube. After adding 5 mL of 80% ethanol, the centrifuge tube was placed in a water bath at 35 °C for about 25 min, then centrifuged at 1000 rpm at room temperature for 15 min, and the supernatant was transferred to a volumetric flask. The residue was extracted repeatedly three times, and finally, the supernatant was combined and the volume was fixed to 25 mL. One mL of the supernatant was dried by rotary evaporation and then 1 mL of ddH2O was added to dissolve. Afterward, the fully dissolved solution was filtered by a filter with a diameter of 13 mm and an aperture of 0.44 μm. The obtained filtrate was used for the determination of the sugar content by HPLC. Each sample was repeated three times.
Analytical chromatographic separations were carried out on a Waters Spherisorb NH2 column (4.6 mm × 250 mm, 5.0 μm). The mobile phases were composed of acetonitrile and ddH2O (7.8:2.2, v/v). The injection volume was 20 μL and the flow rate was set at 1.0 mL/min. The temperature of the column was kept at 35 °C. The RID (differential refraction detector) was used for detection.

2.4. Determination of Enzymes Activities Related to Sugar Metabolism

The key enzymes of the plant fruit sugar metabolism pathways were selected to determine the activities of these enzymes, including vacuolar acid invertase (VIN), neutral invertase (NI), sucrose synthase (SS), sucrose phosphate synthase (SPS) and cell wall-bound invertase (CWIN). These enzyme activities were measured using plant Enzyme-Linked Immunosorbent Assay (ELISA) kits (MEIMIAN, Yancheng, China), in accordance with the manufacturer’s instructions.

2.5. Expression Analysis of Genes Related to Sugar Metabolism

The sugar metabolism-related genes NI, VIN, SS, SPS and CWIN of A. eriantha were searched from the Kiwifruit Genome Database (KGD) (http://kiwifruitgenome.org/, accessed on 8 October 2019) [19], and the corresponding gene sequences were found. The specific amplified primers were designed using Primer 3 (version 0.4.0), and synthesized by Tsingke Biological Technology (Beijing, China). The detailed information of the primers are shown in Table 1, and the kiwifruit Actin gene was used as a reference gene.
The total RNA of the ‘Ganlv 1’ fruit at each stage was extracted by the Quick RNA isolation kit of Waryong, according to the manufacturer’s instructions. The quality of RNA was detected by agarose gel electrophoresis, and the qualified RNA was used for subsequent reverse transcription. The total RNA was used as a template and the cDNA was synthesized using Takara reverse transcription kit (PrimeScriptTM RT reagent Kit with gDNA Eraser) (Takara, Dalian, China), according to the manufacturer’s instructions. The gene expression analysis was performed by real-time fluorescence quantitative PCR (qRT-PCR) on the Applied Biosystems StepOne RT-PCR system. The RT-PCR reaction system was 20 μL, including TB Green Premix Ex Taq (Tli RNaseH Plus) (Takara, Dalian, China) 10 μL, forward primer (10 μmol/L) 0.5 μL, reverse primer (10 μmol/L) 0.5 μL, RNase free water 8 μL and cDNA 1 μL. The procedure was performed as follows: pre-denaturation at 95 °C for 30 s; denaturation at 95 °C for 5 s; annealing at 60 °C for 30 s; return to step 2; 40 cycles completed. Finally, the melt curve was drawn at 95 °C for 5 s and 64 °C for 30 s. Each sample was repeated in three biological replicates. The relative expression of genes was calculated by the method of 2−ΔΔCT.

2.6. Data Analysis

Microsoft Excel 2010 software was used for the preliminary analysis of the experimental data and the corresponding trend chart was made. SPSS v23.0 software was used to analyze the difference significance of the data (one-way ANOVA, Duncan’s test).

3. Results

3.1. Dynamic Changes of Appearance Quality-Related Indexes of ‘Ganlv 1’ during Fruit Development

The measurement results of the appearance quality indexes of A. eriantha ‘Ganlv 1’ at the different development stages are shown in Table 2. The vertical diameter of the fruit began to increase rapidly 25 DAFB, and the growth trend slowed down after 40 DAFB, entering the slow growth stage (Table 2). The growth patterns of the fruits’ transverse diameter and lateral diameter were basically the same, and the rapid growth period of the fruits’ transverse diameter and lateral diameter was from 25 DAFB to 85 DAFB, and then entered the slow growth period (Table 2). The fruit shape index increased rapidly during the period of 25 DAFB to 40 DAFB, then decreased rapidly during the period of 40 DAFB to 85 DAFB, and the fruit shape index increased slowly after 85 DAFB and tended to be stable (Table 2). During the early stages of fruit growth (25–40 DAFB), the rate of vertical growth was much higher than that of transverse growth, indicating that the vertical growth of the fruit was faster at this time and the fruit became longer. With the growth of the fruit, the trend of vertical growth slowed down and the trend of transverse and lateral growth increased, indicating that the fruit was thickening rapidly during this period. During the whole process of the fruit growth, the length of the transverse and lateral diameters was much smaller than that of the vertical diameter, which was consistent with the long cylindrical shape of the A. eriantha.
As the volume of the fruit increased, the weight of the fruit also rapidly increased. The fruit weight of ‘Ganlv 1’ began to increase rapidly after 25 DAFB. During the period of 145–175 DAFB, the fruit entered a slow growth period (Table 2). At the late period of fruit growth (175–190 DAFB), the fruit entered the pre-harvest expansion stage, and the vertical diameter, transverse diameter and lateral diameter of the fruit increased in varying degrees, the fruit shape index decreased, and the fruit weight also increased significantly. In the soft-ripening stage, the vertical, transverse and lateral diameter of the fruit decreased significantly, the fruit shape index increased and fruit mass decreased significantly. This may be due to more evaporation of water during the soft-ripening stage, resulting in fruit shrinkage. In addition, it could also be due to either dry weather or nutrient decomposition.

3.2. Dynamic Changes in Dry Matter and Soluble Solid Content in A. eriantha ‘Ganlv 1’ during Fruit Development

The content of dry matter (DM) increased during the fruit development. The DM content increased slowly in the early stages of fruit growth (85–115 DAFB), but increased sharply from 115 DAFB to 145 DAFB (Figure 1a). The DM content increased slowly during the period from 145 DAFB to 160 DAFB but decreased briefly from 160 DAFB to 175 DAFB, and then increased again, and finally reached the maximum value of 19.55% at the soft-ripening stage (Figure 1a).
The soluble solid content (SSC) also maintained an increasing trend during the whole fruit development period. Although the SSC decreased briefly in the early stage (85–100 DAFB), the SSC increased after that (Figure 1b). The SSC increased slowly from 100 DAFB to 160 DAFB, then increased rapidly after 160 DAFB, and reached the maximum value of 15.91% in the soft-ripening stage (Figure 1b).

3.3. Determination of Titratable Acid and AsA Contents in ‘Ganlv 1’ during Fruit Development

The titratable acid content of ‘Ganlv 1’ during fruit development is shown in Figure 2a. The titratable acid content of the fruit increased gradually from 25 DAFB to 70 DAFB, and then decreased slightly from 70 DAFB to 100 DAFB. During the period of 100 DAFB to 115 DAFB, the titratable acid content began to rise again and fluctuated in a small range from 115 DAFB to 160 DAFB. After 160 DAFB, the titratable acid content showed a rapid upward trend and reached the maximum value in the soft-ripening stage (Figure 2a). In general, although the content of titratable acid fluctuated in a small range during the fruit development, the content of titratable acid was in an overall upward trend.
The changes in the AsA content in ‘Ganlv 1’ are shown in Figure 3b. The AsA content decreased continuously from 25 DAFB to 55 DAFB, and increased briefly from 55 DAFB to 70 DAFB, followed by a sharp decrease from 70 DAFB to 100 DAFB. During the period of 100 DAFB to 115 DAFB, the AsA content increased slightly, and then began to decrease until it gradually stabilized after 145 DAFB, and there was a slight increase in the AsA content in the soft-ripening stage (Figure 2b). During the fruit development of ‘Ganlv 1’, the content of AsA generally showed a downward trend, but overall it can still be seen that the AsA content of A. eriantha is very high.

3.4. Change of Soluble Sugar Components in ‘Ganlv 1’ during Fruit Development

During the fruit development, the soluble sugar content fluctuated slightly before 160 DAFB, but the overall trend was increasing. It began to grow rapidly after 160 DAFB, and reached the maximum in the soft-ripening stage (Figure 3a).
The changes in the soluble sugar components (glucose, sucrose and fructose) during fruit development were determined by HPLC. The content of glucose and fructose increased greatly from 25 DAFB to 40 DAFB, and then the fructose content increased slowly, while the glucose content decreased (Figure 3b). The fructose content began to increase rapidly after 160 DAFB and reached the maximum value in the soft-ripening stage. The glucose content increased slightly at about 100 DAFB, but then immediately decreased and tended to be stable. It began to increase rapidly after 160 DAFB, and the increase rate was much higher than the fructose, and the final glucose content was higher than fructose (Figure 3b). In the early stages of fruit development (25–40 DAFB), the sucrose content decreased slightly, then tended to be stable, and began to increase rapidly at about 130 DAFB. Finally, the sucrose content was close to the glucose content and higher than the fructose content (Figure 3b). On the whole, the content of glucose, fructose and sucrose were relatively low and changed little in the early stages of the fruit growth. The sucrose began to increase at about 130 DAFB, glucose and fructose began to increase at about 160 DAFB, at which time the fruit began to accumulate sugar rapidly.

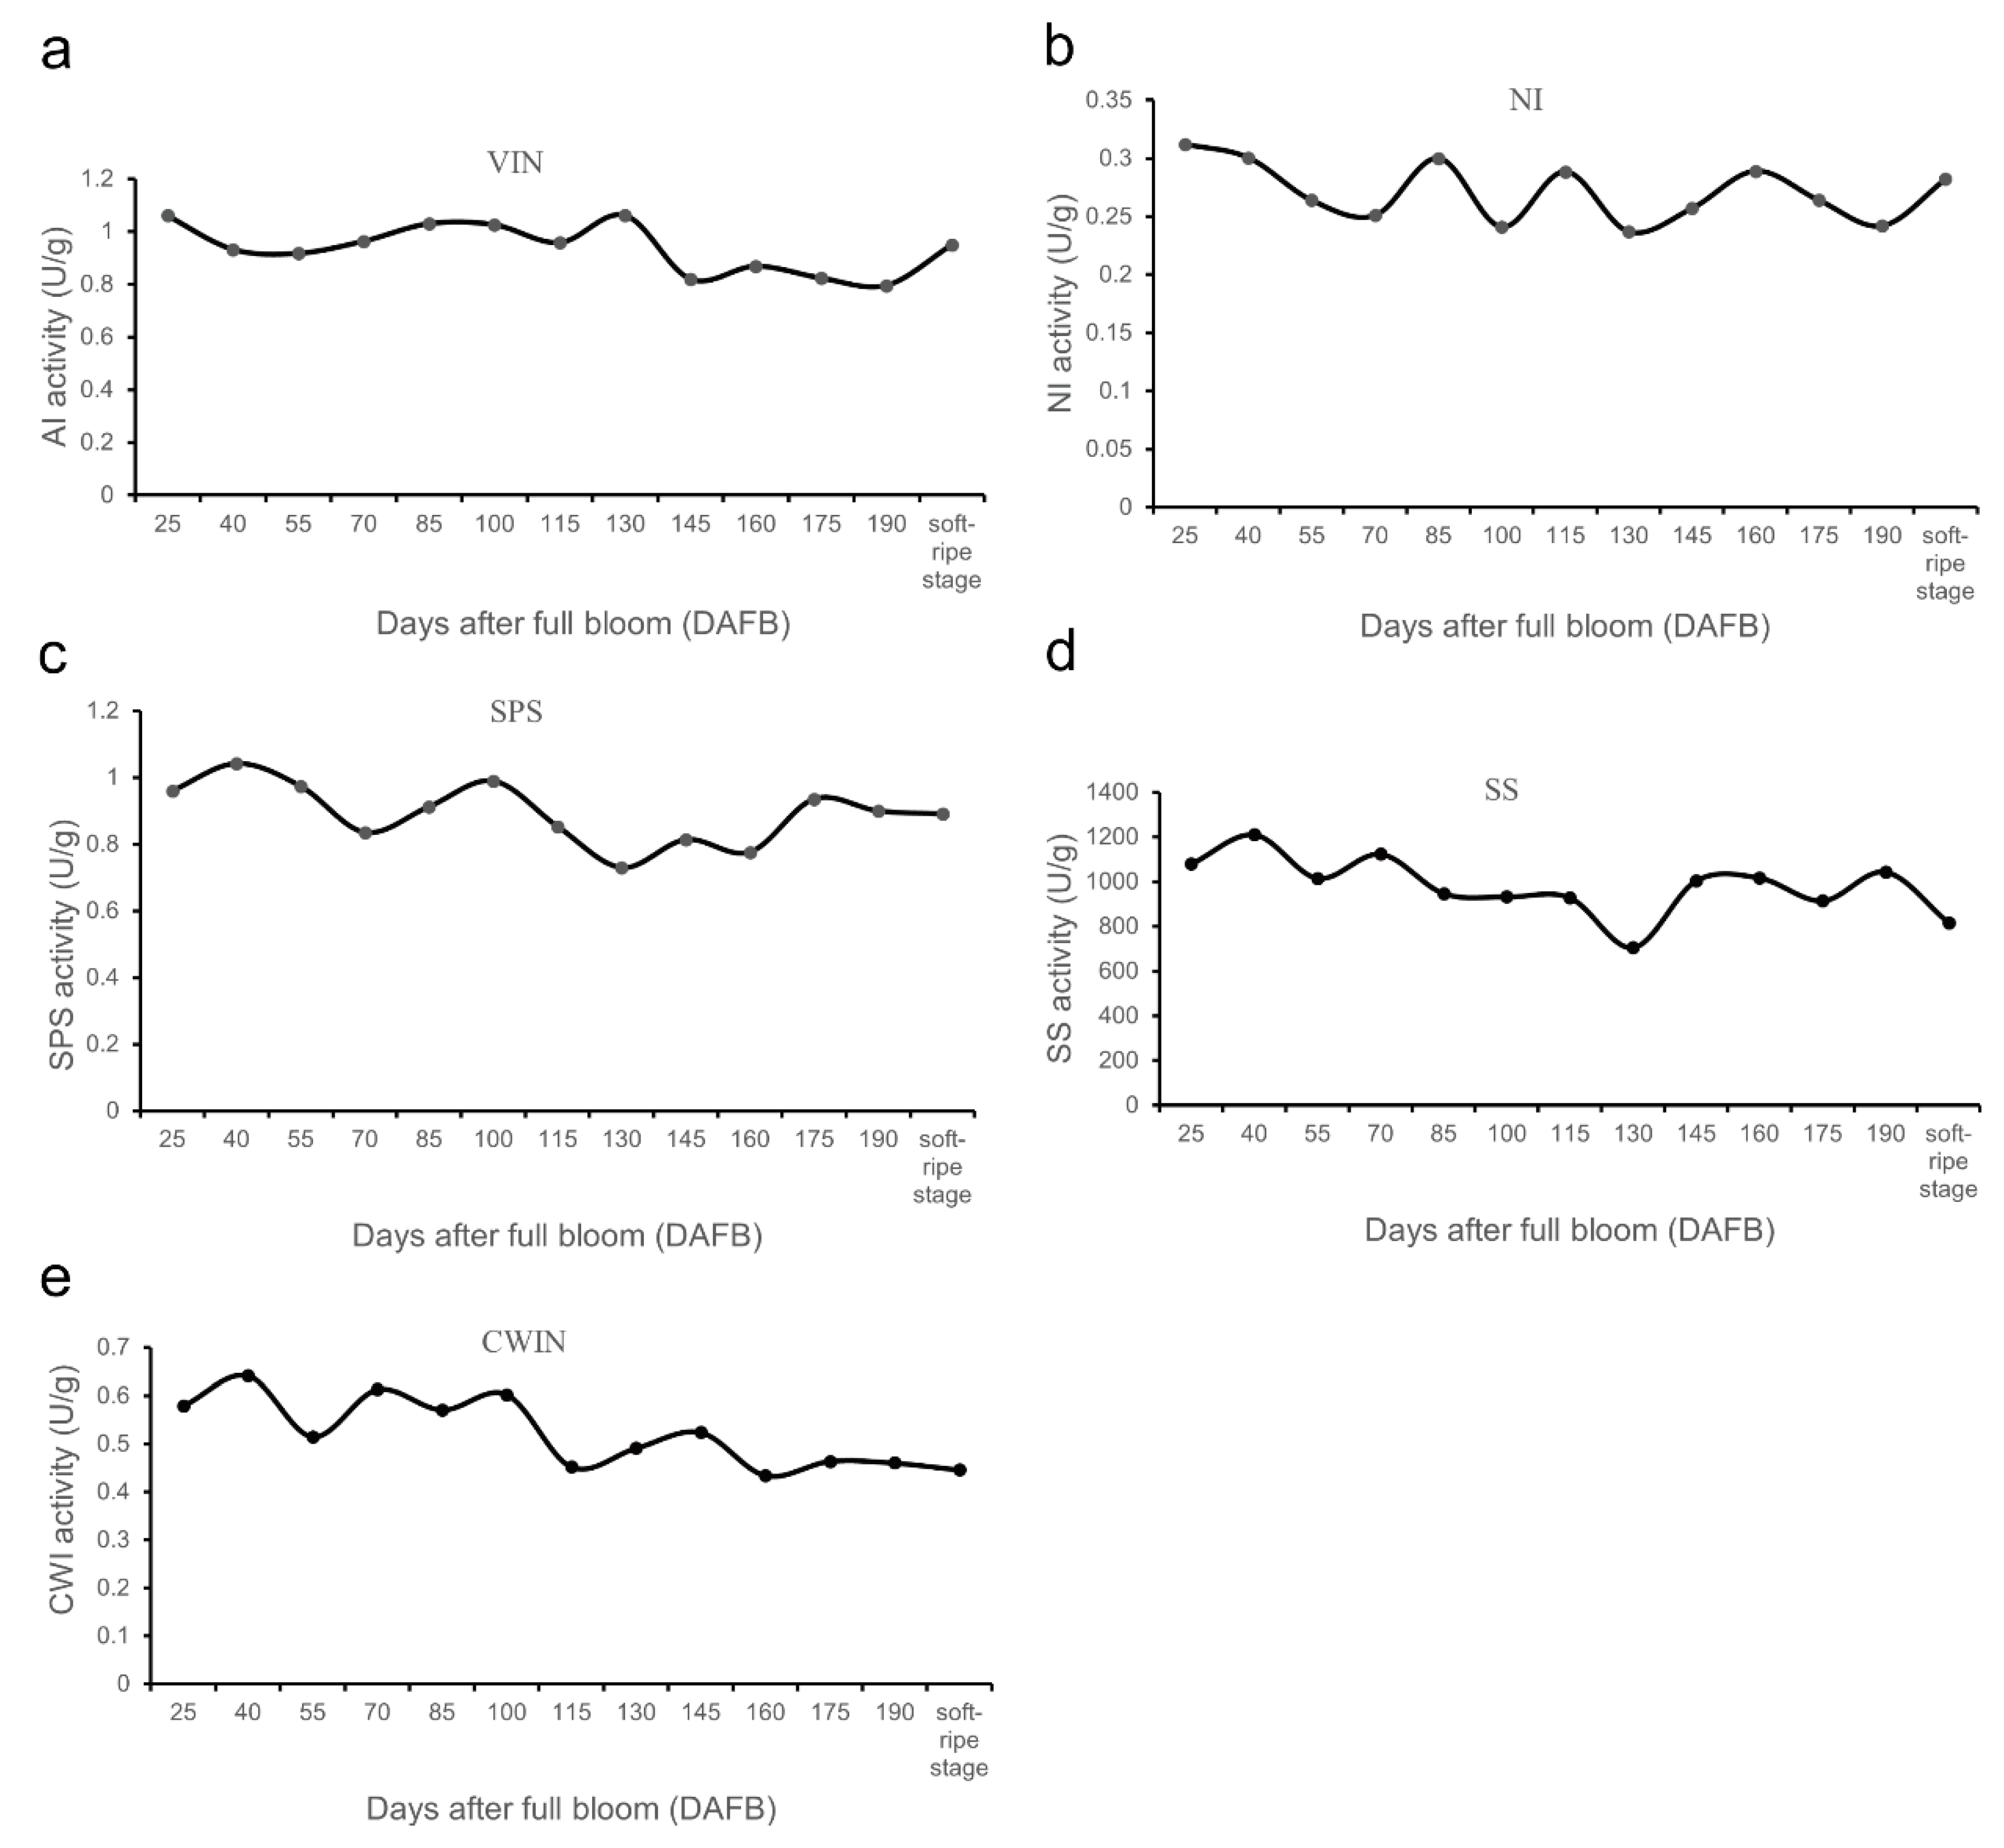
3.5. Changes of Soluble Sugar-Related Metabolic Enzyme Activities during Fruit Development

The changes in the soluble sugar-related metabolic enzyme activities during the fruit development of ‘Ganlv 1’ are shown in Figure 4. The VIN activity underwent a process almost opposite to that of sucrose synthase (SS) and sucrose phosphate synthase (SPS). In the early stages of the fruit development, the activity of VIN decreased first and then increased, and reached the highest value at 130 DAFB. Then, it began to decline in a fluctuation pattern and reached the lowest value at about 190 DAFB, but there was a rapid upward trend in the soft-ripening period (Figure 4a). The activity of the soluble neutral invertase (NI) showed a gradual decline from 25 DAFB to 70 DAFB, and it then showed continuous fluctuations from 70 DAFB to 130 DAFB, and reached the lowest value at around 130 DAFB. Then, it began to fluctuate during the period of 130 DAFB to 190 DAFB, and increased significantly in the soft-ripening stage (Figure 4b). The SPS enzyme activity first increased and then decreased in the early stages of fruit development, forming a trough at 70 DAFB, and then began to rise again. It began to decrease at 100 DAFB and reached the lowest point at 130 DAFB. Then, it began to show an upward trend, and showed a slow downward trend again from 175 DAFB to the soft-ripening stage (Figure 4c). The SS enzyme activity maintained a relatively high level during the fruit growth period. From 25–130 DAFB, the SS enzyme activity showed a fluctuating downward trend and decreased to the lowest value at about 130 DAFB, and then increased rapidly from 130 DAFB to 145 DAFB. It showed a fluctuating upward trend during the period from 145 DAFB to 190 DAFB, and showed a downward trend in the soft-ripening stage (Figure 4d). The activity of CWIN decreased during the fruit development. The CWIN activity changed drastically during the 25–160 DAFB period and reached the lowest value at about 160 DAFB. During the period of 160 DAFB to the soft-ripening period, the CWIN activity increased slowly and then decreased gradually (Figure 4e).

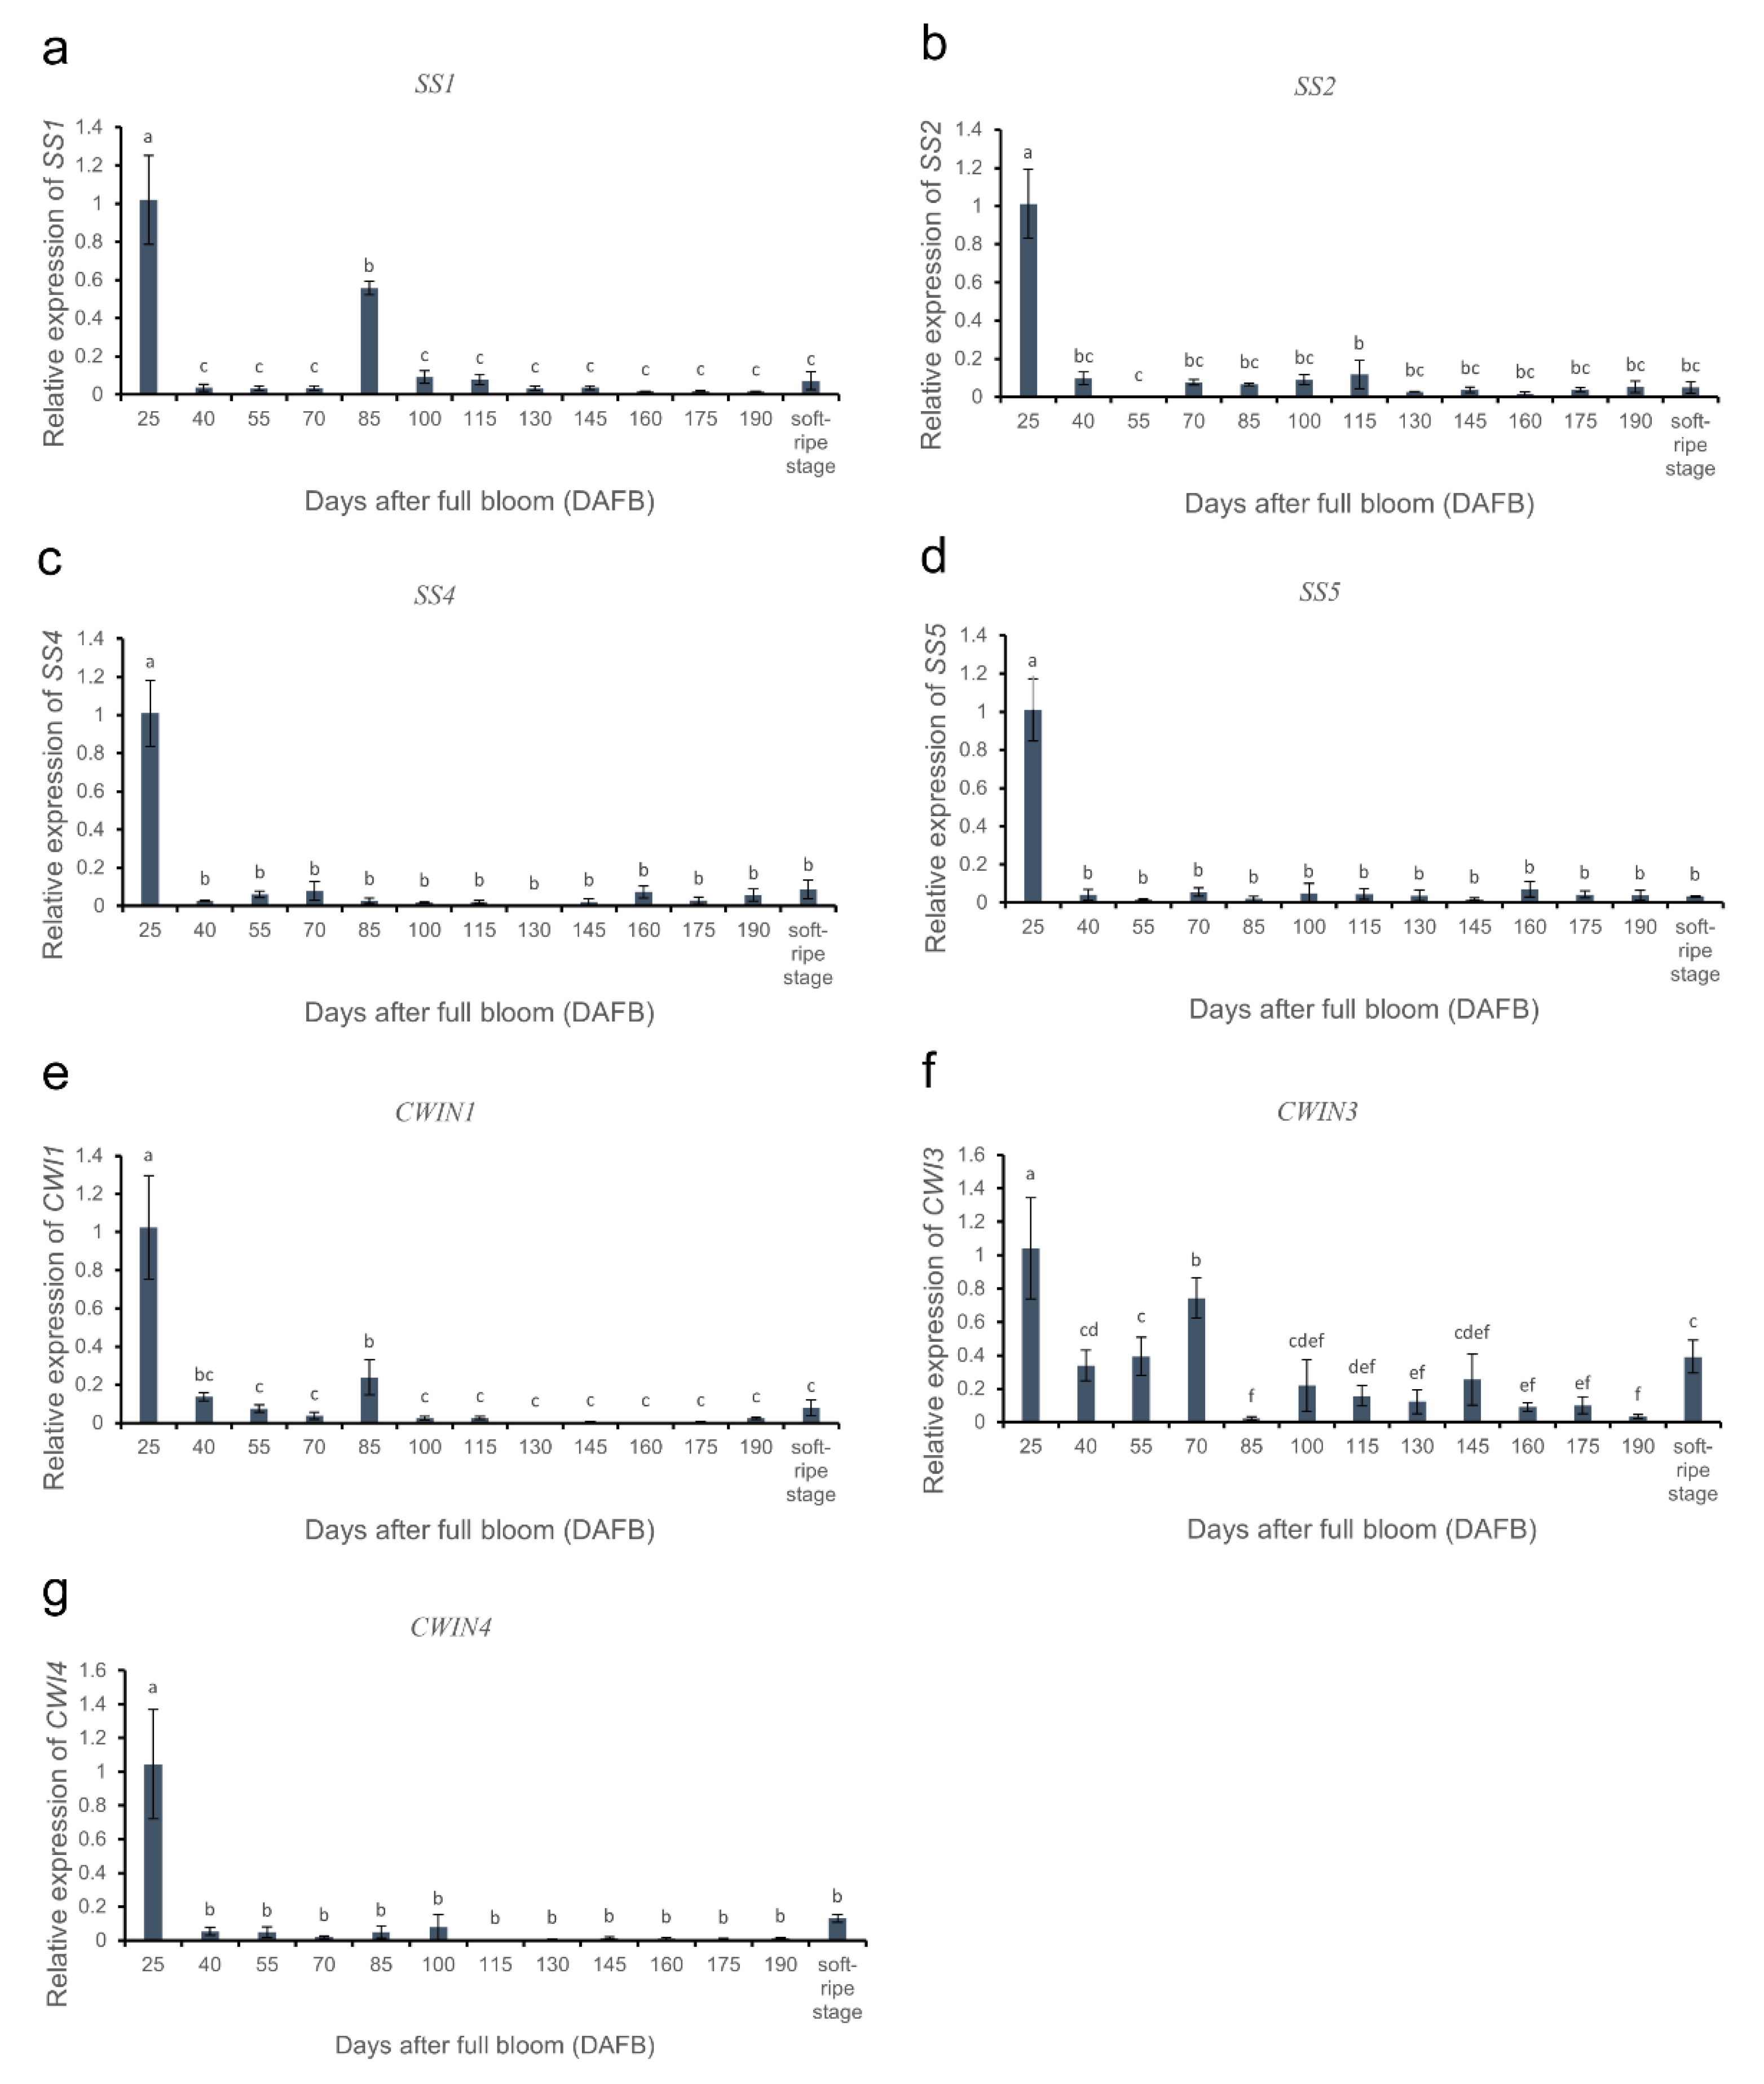
3.6. Gene Expression Analysis of Soluble Sugar Metabolism-Related Enzymes during Fruit Development

The VIN3 and VIN5 are genes related to vacuolar acid invertase, which is also called soluble acid invertase (AI) [20]. The expression level of the VIN3 gene was extremely low in the early stages of fruit development (25–100 DAFB), but relatively high in the middle and late stages (115 DAFB to the soft-ripening stage), and reached the maximum at 175 DAFB (Figure 5a). The expression level of the Vin5 gene was the highest at 25 DAFB, then began to decline rapidly, followed by a rapid downward trend, and dropped to the lowest point at 55 DAFB. The expression of this gene increased slowly from 55 DAFB to 100 DAFB, then began to decrease and maintained a lower expression level in the following stages (Figure 5b).
The NIN1, NIN2 and NIN3 are the NI-related genes. The expression level of NIN1 was the highest at 25 DAFB, and then decreased rapidly afterward (Figure 5c). The NIN2 has a high level of expression in all of the stages of fruit development, with the highest expression level at 25 DAFB, and a relatively high expression level at 85 and 145 DAFB (Figure 5d). The expression of NIN3 was also the highest at 25 DAFB, and was relatively higher at 70 and 100 DAFB (Figure 5e).
The SPS1 had a higher expression level in the middle and late stages of fruit development, among which the expression level was the most prominent at 100 DAFB, 145 DAFB and the soft-ripening stage (Figure 5f). The expression level of SPS2 was the highest at 25 DAFB, then decreased rapidly, and increased in the later stages of fruit development (145 DAFB to the soft-ripening stage) (Figure 5g). The expression level of SPS5 was also the highest at 25 DAFB, and then decreased rapidly. The expression level of SPS5 remained relatively high at 70–115 DAFB, and then decreased rapidly (Figure 5h).
The expression level of the SS1 gene was higher at 25 DAFB and 85 DAFB, while the expression levels in the other stages were much lower than these two periods (Figure 6a). The expression patterns of SS2, SS4 and SS5 were basically the same (Figure 6b–d). They all had the highest expression level at 25 DAFB, and then the expression level decreased rapidly and remained at a very low expression level (Figure 6b–d).
The expression levels of the three CWIN genes were the highest at 25 DAFB, but the expression levels were different at subsequent stages. For example, for CWIN1, in addition to 25 DAFB, it also had a relatively high expression level at 85 DAFB, and then the expression level decreased (Figure 6e). The CWIN3 had a relatively high expression level at 40 DAFB, 55 DAFB, 70 DAFB and in the soft-ripening stage (Figure 6f). The expression level of CWIN4 reached its maximum only at 25 DAFB, and then decreased rapidly and leveled off (Figure 6g).

4. Discussion

A. eriantha has strong disease resistance, high-temperature resistance, easy peeling, a long shelf life, is rich in AsA, and thus has great economic character and nutritional value. In this study, the dynamic changes in the fruit quality, sugar composition and content, sucrose synthesis-related enzyme activities and the related gene expressions of the new A. eriantha cultivar ‘Ganlv 1’ during fruit development were detected and analyzed.
The detection results of the fruit appearance quality of ‘Ganlv 1’ showed that the ‘Ganlv 1’ fruit increased rapidly in the early stages of development, and, although there was a slow increase in the middle stages, it was not obvious (Table 2). The study of the development characteristics of ‘White’ showed that the development of ‘White’ showed a ‘double S’ curve [8]. However, in this study, the fruit development of ‘Ganlv 1’ presented an approximate ‘double S’ curve change. The difference may be caused by the different characteristics of the varieties, or by the difference in certain factors, such as the climate and environment during fruit development. The size and weight of the fruit decreased during the soft-ripening process after picking, which might be due to fruit water loss or nutrient decomposition, suggesting the importance of postharvest preservation of A. eriantha. The result of the fruit shape index showed that the fruit shape index of ‘Ganlv 1’ was basically stable between 1.7–2.5 during the fruit development period, and the fruit shape index was relatively high in the early stages. At this time, the fruit was relatively slender, and the fruit shape index tended to be stable with the development and maturity of the fruit.
The dry matter content is an important index to evaluate the flavor quality of fruit after ripening. By measuring the dry matter content of the fruit at different developmental stages, the ripeness of the fruit can be preliminarily judged and the optimal time for harvesting can be determined [21]. In addition, as an important indicator of fruit quality, the dry matter content also affects the fruit flavor and texture of kiwifruit [22]. The dry matter content of ‘Ganlv 1’ increased slowly in the early stages, and then sharply from 115 DAFB to 145 DAFB (Figure 1). In the later period (145–160 DAFB), it was in a relatively stable increasing trend and reached a peak of 18.26% at 160 DAFB (Figure 1). After 160 DAFB, it decreased briefly and then began to rise again, to reach the maximum value of 19.55% in the soft-ripening period. The changes in the dry matter content at different stages of ‘Ganlv 1’ fruit development indicated that the best harvesting time of the ‘Ganlv 1’ fruit was about 160 DAFB, which is consistent with that of ‘White’ and ‘Ganmi 6’. Previous studies have shown that ‘White’ harvested before 165 DAFB has a better nutritional and flavor quality [4,8], and the fruit growth period of ‘Ganmi 6’ fruit is 165 days [3]. The dry matter content of ‘White’ and ‘Ganmi 6’ were 17.9% and 17.3% [3,23], while the dry matter content of ‘Ganlv 1’ at 160 DAFB (18.26%) and the soft-ripening stage (19.55%) was higher than that of ‘White’ and ‘Ganmi 6’, indicating that ‘Ganlv 1’ has a very high dry matter content and its flavor and texture may also be better than these two varieties. Previous studies have shown that kiwifruit genotypes with high dry-matter content usually have higher SSC [22,24]. In this study, the SSC of ‘Ganlv 1’ was 15.91%, which was higher than that of ‘Ganmi 6’ (13.6%) [3], and was close to that of ‘White’ (16.0%) [23], which is consistent with the previous studies.
A. eriantha ‘Ganlv 1’ was rich in AsA. Although the content of the AsA decreased during fruit development, the AsA content increased in the soft-ripening stage. On the whole, the changing trend in the AsA content during the fruit development of ‘Ganlv 1’ was basically consistent with that of ‘Ganmi 6’ [9]. The content of AsA in the soft-ripening stage of ‘Ganlv 1’ was 7.09 mg/g, which was lower than that of ‘Ganmi 6’ (7.23 mg/g) [3], and higher than that of ‘White’ (6.28 mg/g) [23].
‘Ganlv 1’ had high soluble sugar content. The soluble sugar content of ‘Ganlv 1’ showed an overall upward trend during fruit development, but there was a large fluctuation in this process, which was somewhat inconsistent with the dynamic change trend of soluble sugar in ‘White’ and ‘Ganmi 6’ [8,9]. Before 160 DAFB, the content of the soluble sugar components in ‘Ganlv 1’ fruit remained at a low level with no obvious dynamic change, and the content of fructose was higher than that of sucrose and glucose during this period (Figure 3).After 160 DAFB, with the ripening of the fruit, the starch in the fruit began to degrade gradually, and the content of soluble sugar components (including sucrose, fructose and glucose) also began to accumulate gradually (Figure 3). In the soft-ripening stage, the content of glucose was the highest, followed by sucrose, and the content of fructose was the lowest. The changing trend in the soluble sugar content in ‘Ganlv 1’ during the fruit development and soft-ripening stage was basically similar to that of ‘White’ [8,25]. However, the content of total soluble sugar in ‘White’ and ‘Ganmi 6’ were 9.00% and 6.30% [3,23], respectively, which were lower than that of ‘Ganlv 1’ (9.74%). During the development of the ‘White’ fruit, the soluble sugar content was mainly accumulated by fructose and glucose, the sucrose content was always lower than glucose and fructose, and the fructose content was the highest [8]. Moreover, the study on the sugar metabolism of ‘White’ during storage showed that the glucose content was the highest, fructose was the second, and sucrose was the lowest [25]. However, the contents of these three sugars were relatively close, and the sucrose content was the highest in A. chinensis ‘Hort16A’ [26]. During the late growth stages of A. deliciosa ‘Hayward’, the starch began to degrade and the soluble sugar content increased rapidly, accumulating a large amount of sucrose, fructose and glucose in the late stages of the fruit development, mainly in fructose and glucose accumulation, the sucrose content was the lowest and the fructose content was the highest [27]. During the postharvest ripening process of A. delicia, the accumulation of glucose and fructose was always more than that of sucrose, and the accumulation of glucose was the highest [28]. The differences between the soluble sugar content and soluble sugar component content among the different varieties reflected the different sugar metabolism characteristics among the different varieties, which also reflected the diverse flavor of kiwifruit varieties.
The accumulation and changes in the sucrose content and the activities of sucrose-related metabolic enzymes and gene expression during fruit growth and development revealed the main period of sucrose metabolism in ‘Ganlv 1’. During the early stages of the fruit growth and development (25–130 DAFB), the sucrose content remained at a low level, while after 130 DAFB, the sucrose content began to increase rapidly (Figure 4b), indicating that the main period of sucrose accumulation began at 130 DAFB. The sucrose synthesis-related enzymes (SS and SPS) catalyze the synthesis of sucrose, among which SPS enzyme activity is highly positively correlated with sucrose content, while sucrose invertases (VIN, NI and CWIN) degrade sucrose into glucose and fructose [29,30]. In this study, the SS and SPS activities were all lowest at 130 DAFB, and then increased rapidly during 130–145 DAFB. The sucrose invertase VIN activity decreased significantly during 130–145 DAFB (Figure 4). Although the NI and CWIN enzyme activities showed an upward trend during this period, their enzyme activities were much lower than those of other enzymes (Figure 4). The changing trend of the sucrose metabolism-related enzyme activities suggested that the period of 130–145 DAFB was favorable for the accumulation of sucrose. The expression trend of some of the sucrose metabolism-related enzyme genes was correlated with the trend of the sucrose metabolism-related enzyme activity changes. For example, the expression levels of SPS1, SPS2, SPS5, NIN2 and NIN3 were all lower at 130 DAFB, but increased at 145 DAFB to varying degrees (Figure 5 and Figure 6).
Plant sugar metabolism-related genes mostly exist in the form of gene families. For example, 6, 5, 17 and 11 SS genes were identified in peach (Prunus persica) [31], grape (Vitis vinifera) [32], pear (Pyrus bretschneideri) [33] and apple (Malus domestica) [34], respectively. Two VIN genes and five CWIN genes were identified in peach [35] At present, seven SS genes have been identified in A. deliciosa ‘Hayward’ [36], but the number of SS genes in A. eriantha is not clear. This study only analyzed the expression of four SS genes in ‘Ganlv 1’, which could not fully clarify the role of SS genes in sucrose metabolism. In future work, clarifying the members of the SS gene family and other sugar metabolism-related gene families will play an important role in understanding the mechanism of sugar metabolism in A. eriantha.

5. Conclusions

In conclusion, the dynamic changes in the fruit quality, the activities of the sucrose metabolism-related enzymes and the expression of the sucrose metabolism-related genes during the development of A. eriantha ‘Ganlv 1’ were detected and analyzed. The results clarified the dynamic characteristics of the fruit development of ‘Ganlv 1’, indicating that the best harvest time for ‘Ganlv 1’ was at about 160 DAFB. The main sugar components in the ‘Ganlv 1’ fruit were fructose, glucose and sucrose, among which glucose and sucrose were the most important sugars in the soft-ripening stage of the fruit. The analysis of the sucrose accumulation trend, sucrose metabolism-related enzyme activities and sucrose metabolism-related genes expression analysis indicated that 130–145 DAFB was the critical period for fruit sugar accumulation and metabolism. The results laid a foundation for clarifying the growth and development characteristics of A. eriantha fruit and the related mechanism of sugar metabolism.

Author Contributions

Conceptualization, C.H. and X.X.; methodology, C.H. and X.J.; validation, X.J., M.W. and S.C.; formal analysis, M.W. and X.J.; investigation, X.J. and D.J.; resources, M.W., X.J. and S.C.; data curation, M.W., X.J. and J.T.; writing—original draft preparation, J.T. and X.J.; writing—review and editing, J.T.; visualization, J.T. and X.J.; supervision, C.H.; project administration, C.H.; funding acquisition, C.H. All authors have read and agreed to the published version of the manuscript.

Funding

This research was funded by the National Natural Science Foundation of China (Grant Nos: 31760567 and 31960588).

Institutional Review Board Statement

Not applicable.

Informed Consent Statement

Not applicable.

Data Availability Statement

The data presented in this study are available on request from the corresponding author.

Conflicts of Interest

The authors declare no conflict of interest.

References

  1. Huang, H.W. Actinidia Germplasm Resources in China; China Forestry Publishing House: Beijing, China, 2013. [Google Scholar]
  2. Xie, M.; Wu, Y.J.; Jiang, G.H.; Zhang, Q.C.; Zhang, H.Q.; Peng, S.J.; Liu, K.M. A new big fruit Actinidia eriantha Benth. cultivar ‘White’. Acta Hortic. Sin. 2008, 35, 1555. [Google Scholar]
  3. Xu, X.B.; Huang, C.H.; Qu, X.Y.; Chen, M.; Zhong, M.; Lang, B.B.; Chen, C.J.; Xie, M.; Zhang, W.B. A new easy peeling Actinidia eriantha cultivar ‘Ganmi 6’. Acta Hortic. Sin. 2015, 42, 2539–2540. [Google Scholar]
  4. Xu, Y.H.; Song, Q.Q.; Hu, B.; Li, S.G.; Zheng, X.L.; Jiang, T.J. Harvest maturity affects quality and storability of Actinidia eriantha cv. White fruit. J. Nucl. Agric. Sci. 2020, 34, 0521–0531. [Google Scholar]
  5. Qu, X.Y.; Lang, B.B.; Zhong, M.; Zhu, B.; Tao, J.J.; Huang, C.H.; Xu, X.B. Principal component analysis and comprehensive evaluation of fruit quality of Actinidia eriantha. Chin. Agric. Sci. Bull. 2016, 32, 92–96. [Google Scholar]
  6. Lang, B.B.; Zhu, B.; Xie, M.; Zhang, W.B.; Seyrek, U.A.; Huang, C.H.; Xu, X.B. Variation and probability grading of the main quantitative characteristics of wild Actinidia eriantha germplasm resources. J. Fruit Sci. 2016, 33, 8–15. [Google Scholar]
  7. Wang, Y.Z.; Pan, Z.M. Comprehensive evaluation of 22 Actinidia eriantha germplasm resources based on principal components analysis. Acta Agric. Zhejiangensis 2021, 33, 825–830. [Google Scholar]
  8. Zhang, H.Q.; Xie, M.; Xiao, J.P.; Zhou, L.Q.; Song, G.H. Characterization of fruit development of the diploid kiwifruit, Actinidia eriantha ‘White’. J. Fruit Sci. 2015, 32, 238–246. [Google Scholar]
  9. Chen, C.J.; Tao, J.J.; Qu, X.Y.; Huang, C.H.; Xu, X.B. Dynamic variation in sugar, acid, and AsA contents of ‘Gnami 6’ kiwifruit (Actinidia eriantha Benth) fruits. Agric. Sci. Technol. 2015, 16, 2589–2591, 2595. [Google Scholar]
  10. Liu, C.H.; Qiu, G.L.; Liu, Z.B.; Yang, Y.; Zhuang, Q.G.; Zhang, Q. Study on the changes of physicochemical properties of A. eriantha during the fruit development. J. Sichuan Univ. (Nat. Sci. Ed.) 2019, 56, 951–956. [Google Scholar]
  11. Zhang, H.Q.; Xie, M.; Zhang, C.; Yang, L.Q.; Zhang, Z.; Xiao, J.P.; Zhou, L.Q. Difference in starch accumulation and characterization of sugar metabolism during fruit development of kiwifruit. Sci. Agric. Sin. 2014, 47, 3453–3464. [Google Scholar]
  12. Zheng, Q.M.; Tang, Z.; Xu, Q.; Deng, X.X. Isolation, phylogenetic relationship and expression profiling of sugar transporter genes in sweet orange (Citrus sinensis). Plant Cell Tissue Organ Cult. 2014, 119, 609–624. [Google Scholar] [CrossRef]
  13. Lee, P.R.; Tan, R.M.; Yu, B.; Curran, P.; Liu, S.Q. Sugars, organic acids, and phenolic acids of exotic seasonable tropical fruits. Nutr. Food Sci. 2013, 43, 267–276. [Google Scholar] [CrossRef]
  14. Zhao, J.H.; Li, H.X.; Xi, W.P.; An, W.; Niu, L.L.; Cao, Y.L.; Wang, H.F.; Wang, Y.J.; Yin, Y. Changes in sugars and organic acids in wolfberry (Lycium barbarum L.) fruit during development and maturation. Food Chem. 2015, 173, 718–724. [Google Scholar] [CrossRef] [PubMed]
  15. Li, Y.N.; Yan, L.Y.; Zhang, B.; Yang, S.B.; Zhao, Z.Y. A study on sugar and organic acid components in different apple cultivars. J. Fruit Sci. 2021, 38, 1877–1889. [Google Scholar]
  16. Zhang, G.J. Study on Sugars and Acids Inheritance and the Expression Pattern of β-Glucosidase Genes (VvBGs) during Grape Berry Ripening; China Agricultural University: Beijing, China, 2013. [Google Scholar]
  17. Huang, Q. Studies on Characterization of Organic Acids Metabolism and Expression of Relative Genes during Fruit Development of Relative Genes during Fruit Development of ‘Ganmi 6’; Jiangxi Agricultural University: Nanchang, China, 2019. [Google Scholar]
  18. Cao, J.K.; Jiang, W.B.; Zhao, Y.M. Experiment Guidance of Postharvest Physiology and Biochemistry of Fruits and Vegetables; Chinese Light Industry Press: Beijing, China, 2007. [Google Scholar]
  19. Yue, J.Y.; Liu, J.C.; Tang, W.; Wu, Y.Q.; Tang, X.F.; Li, W.; Yang, Y.; Wang, L.H.; Huang, S.X.; Fang, C.; et al. Kiwifruit Genome Database (KGD): A comprehensive resource for kiwifruit genomics. Hortic. Res. 2020, 7, 117. [Google Scholar] [CrossRef]
  20. Wang, X.X.; Chen, Y.; Jiang, S.; Xu, F.; Wang, H.F.; Wei, Y.Y.; Shao, X.F. PpINH1, an invertase inhibitor, interacts with vacuolar invertase PpVIN2 in regulating the chilling tolerance of peach fruit. Hortic. Res. 2020, 7, 168. [Google Scholar] [CrossRef]
  21. Chen, M.Y.; Zhang, P.; Zhao, T.T.; Han, F.; Liu, X.L.; Zhong, C.H. Relationship between harvest indices and fruit quality traits in Actinidia chinensis ‘Jintao’. Plant Sci. J. 2019, 37, 621–627. [Google Scholar]
  22. Nardozza, S.; Gamble, J.; Axten, L.G.; Wohlers, M.W.; Clearwater, M.J.; Feng, J.Q.; Harker, F.R. Dry matter content and fruit size affect flavour and texture of novel Actinidia deliciosa. J. Sci. Food Agric. 2011, 91, 742–748. [Google Scholar] [CrossRef]
  23. Wu, Y.J.; Xie, M.; Zhang, Q.C.; Jiang, G.H.; Zhang, H.Q.; Long, Q.J.; Han, W.J.; Chen, J.W.; Shong, G.H. Characteristics of ‘White’: A new easy-peel cultivar of Actinidia eriantha. N. Z. J. Crop Hortic. Sci. 2009, 37, 369–373. [Google Scholar] [CrossRef]
  24. Nardozza, S.; Boldingh, H.L.; Richardson, A.C.; Costa, G.; Marsh, H.; MacRae, E.A.; Clearwater, M.J. Variation in carbon content and size in developing fruit of Actinidia deliciosa genotypes. Funct. Plant Biol. 2010, 37, 545–554. [Google Scholar] [CrossRef]
  25. Qi, W.Y.; Zhou, C.H.; Song, L.J.; Zhong, Y.; Zheng, X.L. Study on sugar metabolism of Actinidia eriantha Benth ‘White’ during storage. J. Fruit Sci. 2016, 33, 744–751. [Google Scholar]
  26. Richardson, A.C.; Boldingh, H.L.; McAtee, P.A.; Gunaseelan, K.; Luo, Z.W.; Atkinson, R.G.; David, K.M.; Burdon, J.N.; Schaffer, R.J. Fruit development of the diploid kiwifruit, Actinidia chinensis ‘Hort16A’. BMC Plant Biol. 2011, 11, 182. [Google Scholar] [CrossRef] [PubMed] [Green Version]
  27. Moscatello, S.; Famiani, F.; Proietti, S.; Farinelli, D.; Battistelli, A. Sucrose synthase dominates carbohydrate metabolism and relative growth rate in growing kiwifruit (Actinidia deliciosa, cv Hayward). Sci. Hortic. 2011, 128, 197–205. [Google Scholar] [CrossRef]
  28. MacRae, E.; Quick, W.P.; Benker, C.; Stitt, M. Carbohydrate metabolism during postharvest ripening in kiwifruit. Planta 1992, 188, 314–323. [Google Scholar] [CrossRef]
  29. Gomez, M.; Lajolo, F.; Cordenunsi, B. Evolution of soluble sugars during ripening of papaya fruit and its relation to sweet taste. J. Food Sci. 2010, 67, 442–447. [Google Scholar] [CrossRef]
  30. Basson, C.E.; Groenewald, J.H.; Kossmann, J.; Cronjé, C.; Bauer, R. Sugar and acid-related quality attributes and enzyme activities in strawberry fruits: Invertase is the main sucrose hydrolysing enzyme. Food Chem. 2010, 121, 1156–1162. [Google Scholar] [CrossRef]
  31. Zhang, C.H.; Yu, M.L.; Ma, R.J.; Shen, Z.J.; Zhang, B.B.; Korir, N.K. Structure, expression profile, and evolution of the sucrose synthase gene family in peach (Prunus persica). Acta Physiol. Plant. 2015, 37, 81. [Google Scholar] [CrossRef]
  32. Zhu, X.D.; Wang, M.Q.; Li, X.P.; Jiu, S.T.; Wang, C.; Fang, J.G. Genome-wide analysis of the sucrose synthase gene family in grape (Vitis vinifera): Structure, evolution, and expression Profiles. Genes 2017, 8, 111. [Google Scholar] [CrossRef]
  33. Lv, J.H.; Wang, Y.Z.; Cheng, R.; Wang, G.M.; Zhang, S.L.; Wu, J.; Zhang, H.P. Genome-wide identification and expression analysis of sucrose synthase (SUS) and sucrose phosphate synthase (SPS) gene families in pear. Acta Hortic. Sin. 2018, 45, 421–435. [Google Scholar]
  34. Tong, X.L.; Wang, Z.Y.; Ma, B.Q.; Zhang, C.X.; Zhu, L.C.; Ma, F.W.; Li, M.J. Structure and expression analysis of the sucrose synthase gene family in apple. J. Integr. Agric. 2018, 17, 847–856. [Google Scholar] [CrossRef] [Green Version]
  35. He, X.X.; Wei, Y.Y.; Kou, J.Y.; Xu, F.; Chen, Z.H.; Shao, X.F. PpVIN2, an acid invertase gene family member, is sensitive to chilling temperature and affects sucrose metabolism in postharvest peach fruit. Plant Growth Regul. 2018, 86, 169–180. [Google Scholar] [CrossRef]
  36. Chen, C.; Wang, Y.; Yang, Y.; Yan, Y.Q. Identification of Sucrose Synthase Gene Family in Kiwifruit and Their Expression during Fruit Development. Mol. Plant Breed. 2021. Available online: http://kns.cnki.net/kcms/detail/46.1068.S.20210422.1703.010.html (accessed on 17 April 2022).
Figure 1. Dynamic changes of dry matter content and soluble solid content during fruit development of A. eriantha ‘Ganlv 1’. (a) Changes of dry matter content during fruit development of ‘Ganlv 1’; (b) Changes of soluble solid content during fruit development of ‘Ganlv 1’.
Horticulturae 08 00529 g001
Figure 2. Dynamic changes of titratable acid content and ascorbic acid content during fruit development of A. eriantha ‘Ganlv 1’. (a) Changes of titratable acid content during fruit development of ‘Ganlv 1’; (b) Changes of ascorbic acid content during fruit development of ‘Ganlv 1’.
Horticulturae 08 00529 g002
Figure 3. Dynamic changes of soluble sugar content and sugar component content during fruit development of A. eriantha ‘Ganlv 1’. (a) Changes of soluble sugar content during fruit development of ‘Ganlv 1’; (b) Changes of sugar component content during fruit development of ‘Ganlv 1’.
Horticulturae 08 00529 g003
Figure 4. Changes in activities of sugar metabolism relative enzyme during fruit development of A. eriantha ‘Ganlv 1’, including VIN (a); NI (b); SPS (c); SS (d); CWIN (e).
Horticulturae 08 00529 g004
Figure 5. Expression patterns of sucrose metabolism-related genes over A. eriantha ‘Ganlv 1’ fruit development, including VIN3 (a); VIN5 (b); NIN1 (c); NIN2 (d); NIN3 (e); SPS1 (f); SPS2 (g) and SPS5 (h).
Horticulturae 08 00529 g005
Figure 6. Expression patterns of sucrose metabolism-related genes over A. eriantha ‘Ganlv 1’ fruit development, including SS1 (a); SS2 (b); SS4 (c); SS5 (d); CWIN1 (e); CWIN3 (f) and CWIN4 (g).
Horticulturae 08 00529 g006
Table 1. Primers used for quantitative real-time PCR.
GeneForward Primer (5′→3′)Reverse Primer (5′→3′)
CWIN1GCCGAAAGGCTACATCAGTCATCACTGCACATAAGCACCACATAC
CWIN3CAAGTCCAAAACCTAGCCGTGCAAGCAGTGGTGGGGTCTCT
CWIN4GGCTAACCTTGAAGAGTACACACCAGCATCAGAGCACATGAGAACC
VIN3TTCGGCAGAGAAATGGGCTGTCATAGAATGTCTTTGATGCGTAG
VIN5CAAGTCCAAAACCTAGCCGTGCAAGCAGTGGTGGGGTCTCT
NIN1ACTTTATCGGTAATGTCGGTCCTCGGGAGTTGCCAATGACG
NIN2TGCCGAGAGCCGTTTACTGAGCATCTTCGCCACCAAATAG
NIN3GGAATGTCAGCCCTGCGAGTCAGGAGTTGCCAAAGATGCTA
SPS1AAGCGGGGACACTGACTACGGAAAGAGGGTAGGTTCTGTTGGC
SPS2TTGTCTGAAGGAGAGAAGGGAGATTGGAAAAGTTACGCTGGAA
SPS5CAAAGCCGAGATGAAGAAGATGCCTCCACCACTGTCAACCCA
SS1GCATTGCTGATACGAAGGGCGACTATGATTTCCGCTGGT
SS2GGGAAAACGGGTTAGAGCAGAAACACCACGAAGAGCAGGG
SS4TCAGAGATATTCCAGGCACCGTCAGAGATATTCCAGGCACCG
SS5CAAGAATCATCGCAGACGGAGAGTGAGGGCAAGAAGTGTAAGC
ActinGCTCCACCTGAGAGGAAATACCGAAATCCACATCTGTTGAAAG
Table 2. Dynamic changes of fruit appearance quality-related indexes of A. eriantha ‘Ganlv 1’.
Stages
(DAFB)
Vertical Diameter (mm)Transverse Diameter (mm)Lateral Diameter (mm)Single Fruit Weight
(g)
Fruit Shape Index
2528.77 ± 2.34 i15.14 ± 2.9 h14.7 ± 2.42 g2.320 ± 0.841 j1.9 ± 0.18 c
4040.17 ± 3.58 h17.3 ± 1.09 g16.53 ± 0.65 f6.597 ± 1.158 i2.32 ± 0.28 a
5541.56 ± 2.65 gh19.05 ± 1.56 f18.3 ± 1.54 e8.538 ± 1.362 h2.18 ± 0.13 b
7041.27 ± 2.82 gh22.62 ± 3.14 e21.52 ± 2.47 d10.349 ± 1.362 g1.82 ± 0.22 cdef
8542.22 ± 3.48 g24.2 ± 3.54 cd22.76 ± 3.40 cd11.580 ± 2.252 g1.74 ± 0.34 fg
10042.59 ± 3.44 fg24.82 ± 1.20 bcd23.81 ± 1.39 abc13.066 ± 2.695 f1.72 ± 1.60 g
11544.11 ± 2.71 ef25.26 ± 1.69 bc24.62 ± 2.52 ab15.809 ± 2.223 e1.75 ± 0.17 efg
13044.62 ± 4.31 de24.91 ± 2.27 bcd23.43 ± 1.71 bc16.555 ± 2.976 de1.79 ± 0.24 defg
14546.46 ± 4.46 cd24.94 ± 2.56 bcd23.82 ± 1.90 abc17.560 ± 3.901 bcd1.86 ± 0.29 cde
16047.84 ± 2.84 bc26.04 ± 2.52 ab24.07 ± 1.37 abc18.132 ± 1.196 bc1.84 ± 0.26 cdef
17548.5 ± 2.01 b25.46 ± 2.32 bc23.27 ± 2.32 bc18.363 ± 2.832 b1.91 ± 0.17 cd
19051.24 ± 4.91 a27.18 ± 1.94 a25.16 ± 3.29 a21.982 ± 5.741 a1.89 ± 0.13 cd
Soft-ripening stage49.05 ± 3.20 b25.8 ± 2.29 bc23.14 ± 2.11 c19.695 ± 2.702 ab1.93 ± 0.13 c
Letters in the table indicate the level of difference significance.
Publisher’s Note: MDPI stays neutral with regard to jurisdictional claims in published maps and institutional affiliations.

