Article

Vertical Greenery as Natural Tool for Improving Energy Efficiency of Buildings

1
Energy Efficiency Department, Italian National Agency for New Technologies, Energy and Sustainable Economic Development (ENEA), Casaccia Research Center, 00123 Rome, Italy
2
Centro Studi l’Uomo e l’Ambiente, 35124 Padova, Italy
3
Department of Agriculture and Forest Sciences, Tuscia University, 01100 Viterbo, Italy
4
Italian Interuniversity Research Centre for Sustainable Development (C.I.R.P.S.), 00100 Rome, Italy
5
Department of Veterinary Sciences, University of Pisa, 56126 Pisa, Italy
*
Authors to whom correspondence should be addressed.
Horticulturae 2022, 8(6), 526; https://doi.org/10.3390/horticulturae8060526
Submission received: 11 May 2022 / Revised: 12 June 2022 / Accepted: 13 June 2022 / Published: 15 June 2022

Abstract

:
The European Construction Sector Observatory outlined that green building envelopes as green roofs and walls contribute to the reduction of energy demand and CO2 emissions due to the air conditioning in summer periods, and the mitigation of heat islands in urban areas. For this reason, the understanding about the contribution of urban greening infrastructures on buildings to sustainable energy use for air conditioning is urgent. This paper focuses on the analysis of a vertical surface provided with a Parthenocissus quinquefolia (L.) Planch., a winter deciduous species, as green cover of a building, assessing the reduction of the solar radiation energy absorbed by the façade and, consequently, the heat flux (HF) transmitted into the internal ambient. This research shows that, in July, surface temperatures (STs) on the vegetated façade were up to 13 °C lower than on the unvegetated (bare) façade. Under the climate and environmental conditions of the green wall located at ENEA Casaccia Research Center, a saving of 2.22 and 1.94 kWhe/m2, respectively in 2019 and 2020, for the summer cooling electricity load, was achieved. These energy reductions also allowed the saving of 985 and 862 g CO2/m2 emissions, respectively, in 2019 and 2020. Ultimately, a green factor named K v * was also elaborated to evaluate the influence of vegetation on the STs as well as on HFs transmitted into the indoor ambient and adapted to the case of a detached vertical green cover. Measurements of K v * factor lasting three years showed the suitability of this index for defining the shading capacity of the vegetation on the building façade surfaces, which can be used to predict thermal gains and effects in a building endowed of a vertical green system.

1. Introduction

The indoor air conditioning of buildings is currently responsible for about 40% of Europe’s total energy consumption [1]. The European Commission (EC) of the European Union (EU), through the Energy Performance of Buildings Directive (EPBD), set several standards and regulations for decarbonizing the Member States’ building stock to pursue buildings and cities more environmentally and energetically sustainable. Furthermore, the International Energy Agency (IEA) reported that global energy consumption due to air conditioners is responsible for nearly 20% of the total electricity used in buildings around the world [2]. The EU, through the Commission Document 249 of 2013 “Green infrastructure—Enhancing Europe’s Natural Capital” [3] and the Directive 2018/844 on energy efficiency [4], outlined the potential of nature-based solutions (NBSs) such as green roofs and green façades as natural tools to reduce the energy demand of the building sector. NBSs, through chlorophyll photosynthesis operated by plants, sequester carbon in leaves, branches and roots, reducing atmospheric CO2 and contributing to the environmental sustainability of cities [5,6]. In addition, soil and other growing mediums of these infrastructures act as a carbon sink [7]. In the Mediterranean climate, the widespread use of vertical greenery systems (VGSs) on buildings improves the level of shading against solar radiation and, thanks to the cooling capacity of vegetation, reduces the energy demand for summer air conditioning [8]. In their 2018 review study, Besir and Cuce showed how vegetation could provide an effective building insulation, and concluded that, overall, greenery surfaces can reduce the energy demand for the acclimatization of buildings between 10% and 30% [9]. Different studies reported that vegetated façades favor a reduction in the wall surface temperature behind vegetation in the range of 1.9–8.3 °C depending on the orientation and the covering percentage of plant foliage, according to Kontoleon and Eumorfopoulou [10]; an average of 5.5 °C for Pérez and collaborators [11]; between 1.2 and 3.9 °C for Perini et al. in colder climates at the beginning of Autumn using evergreen species [12]; and up to 4 °C for Vox and Schettini [13,14]. Green walls of the plant-trough based-type (https://efb-greenroof.eu/green-wall-basics/, accessed on 2 May 2022) are also functional in energy saving; indeed, they can decrease the temperature of the air cavity (gap) between the vegetation and the wall surface of the building, acting as a thermal buffer and improving their thermal insulation impact on the building [15,16]. Plants provide natural cooling in several ways, by providing shade, utilizing the solar energy in photosynthesis, and especially by evapotranspiration in summer periods [17,18,19]; moreover, they improve the environment inside, outside and around the building [20]. In the summer conditions of Chicago (IL, USA), vegetative layers have been estimated to reduce the façade surface temperature and heat flux through exterior walls by 10% on average [21]. Even under an extreme hot and dry climate, an energy saving of 2% was associated with the installation of vegetated façades [22]. Under Mediterranean climates, the abatement of the temperature of the building’s external façade surface during the daytime determines a reduction of heat transfer, resulting in less transfer of heat to the inside of the building. Using experimental data for a whole year, it was calculated that the effective thermal resistance of plants in green walls as passive systems for energy saving ranged from 0.07 to 3.61 m2K/W [18]. According to Tilley et al. [23], in the USA, green façades reduce building surface temperatures by as much as 14 °C compared with exposed building surfaces, with a mean indoor temperature difference of 4 °C during the summer, with the result of a drop in the demand for air conditioning in warmer months and reduced energy consumption and greenhouse gas emissions. Interestingly, the effect of vertical greenery systems on the ambient temperature has been assessed to be dependent both on the specific vertical greenery systems and the distance (from 0.15 up to 1 m) from the vegetated layer [24]. Unfortunately, the research results related to the quantification and modeling of green wall energy efficiency benefits are not easily comparable, as the methodology used is different and presents a high variability [25].
In this manuscript, we report the results of an experimental activity addressed to study the influence of vegetation installed on the southwest (SW) wall of a building prototype. The thermal exchanges between the building’s interior and exterior were estimated through the external surface temperature of the vegetated façade in comparison with the unvegetated (bare) façade. A mathematical model based on an index called green factor, Kv, defined to evaluate the cooling performances of vegetation in green walls where the vegetation cover is attached to the façade [26,27], was adapted and successfully tested in the case of the green wall under study, with the green cover placed 0.6 m away from the building wall.

2. Materials and Methods
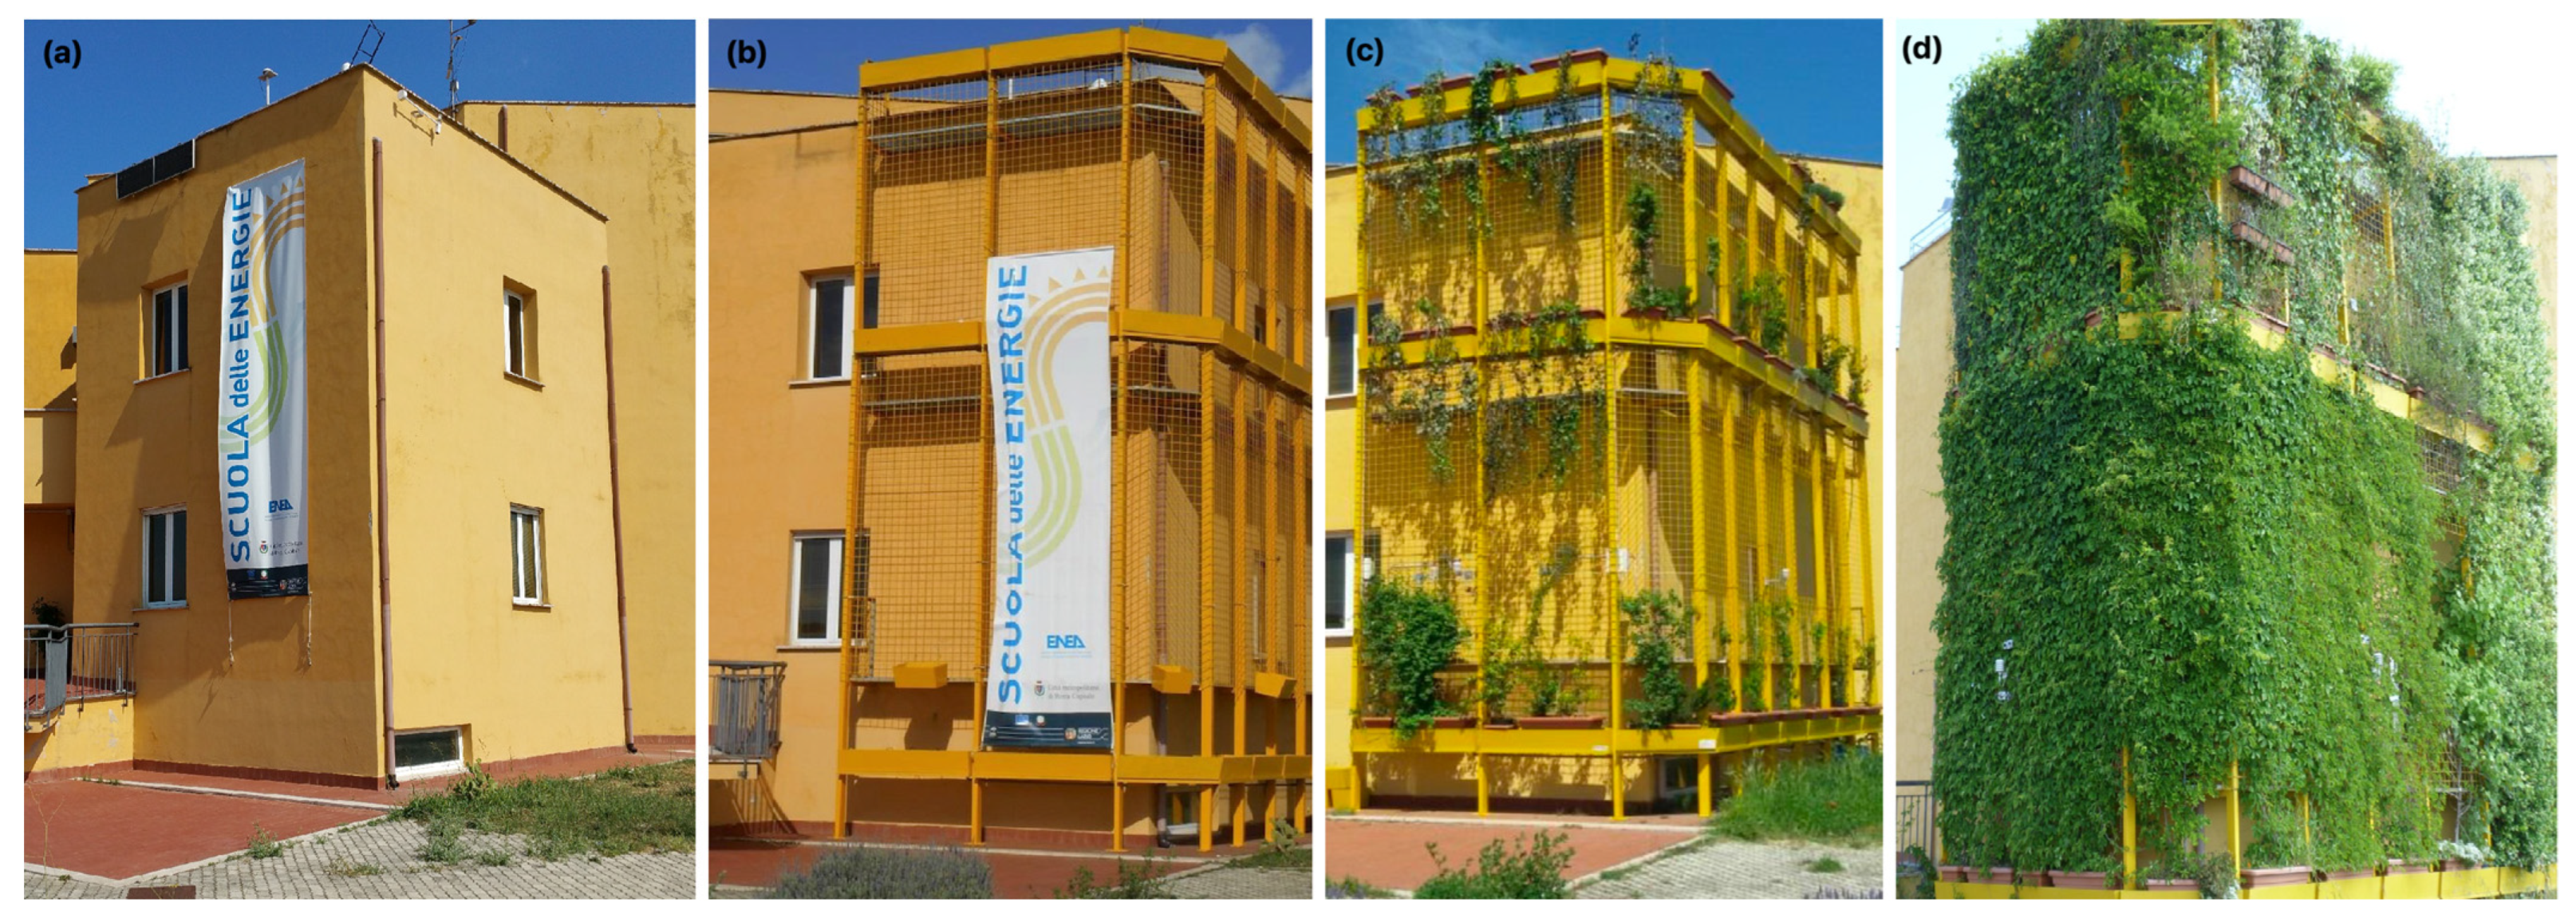
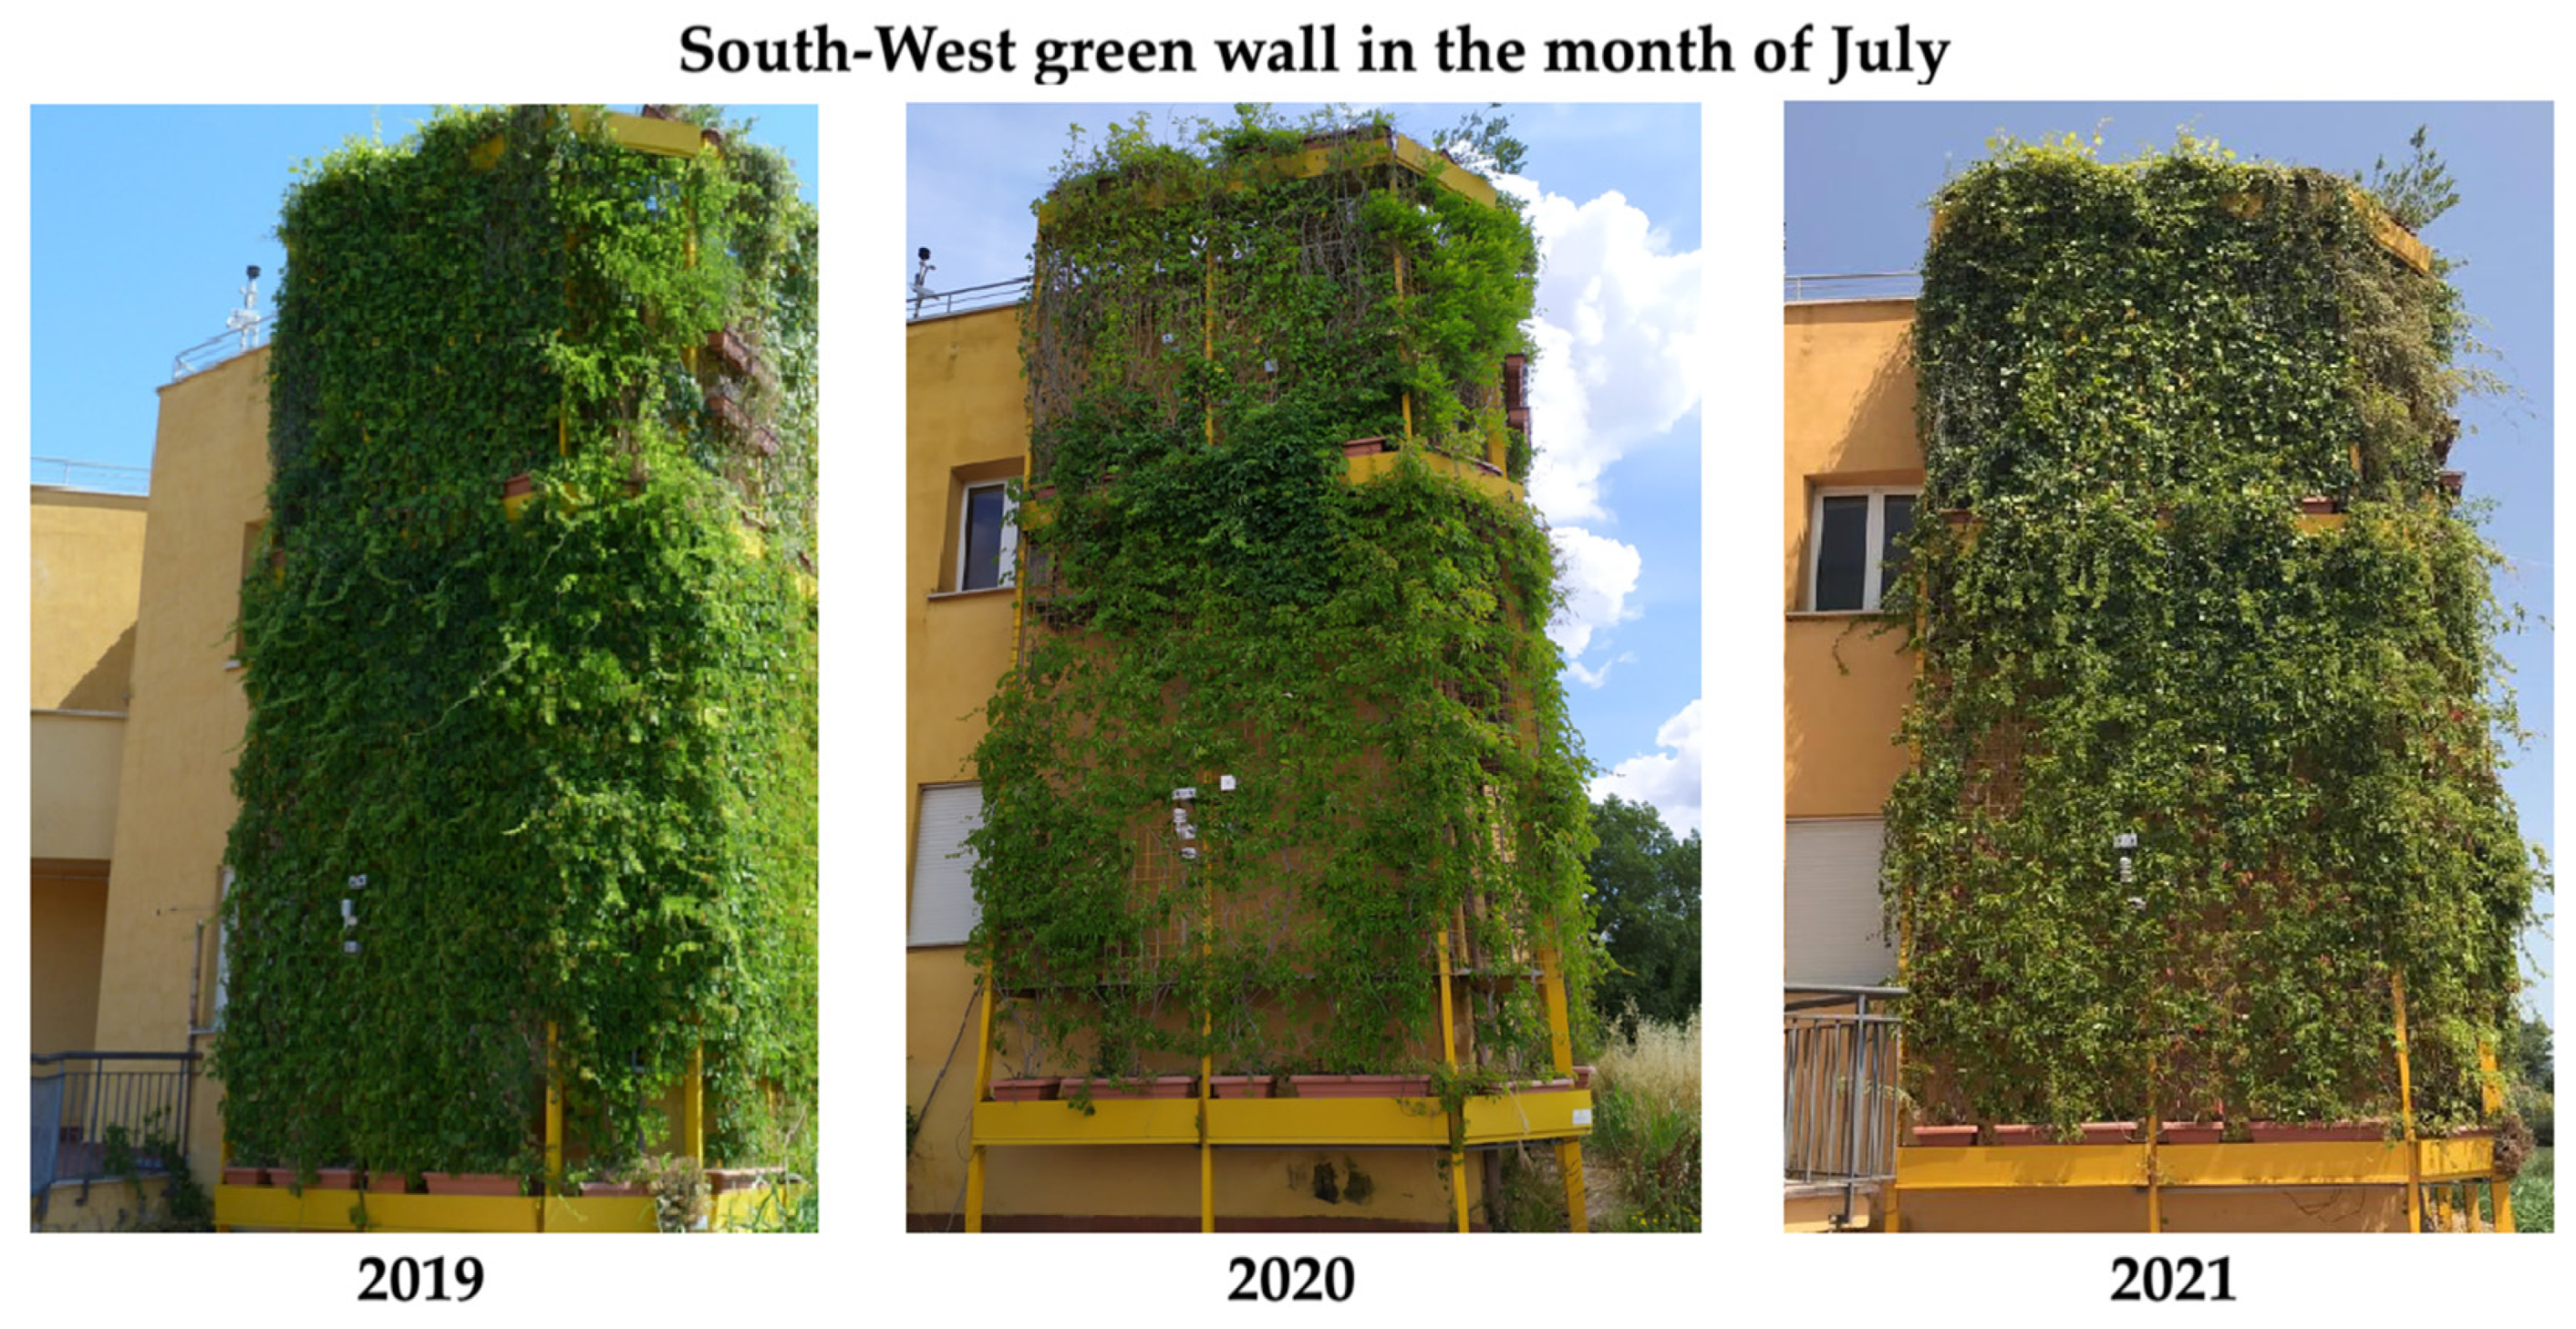
2.1. Study Location

The current research study was carried out at the ENEA Casaccia Research Center (RC), located about 25 km northwest of Rome (Italy), having a latitude of 42°101′ N and longitude of 12°176′ E. According to the Köppen–Geiger climate classification, this area is characterized by hot and dry summers, rainy winters and a solar radiation intensity that varies greatly with the seasons [28]. To study the effects of vertical greening on the energy saving of buildings, a vegetated wall system of about 90 m2 was installed on the southeast (SE) and southwest (SW) façades of a building (Figure 1). The overall green wall was made by a metal grate integrated on a stainless-steel infrastructure anchored to the ground and to the façades of the building, and placed 60 cm from the façades of the building [29]. In this kind of green wall, the vegetation is detached from the building façade. The experimental activity and the data analyzed and reported on in this manuscript refer mainly to the SW green wall.
The cultivated plant species on the SW side was Parthenocissus quinquefolia (L.) Planch., a species of flowering vine belonging to the Vitaceae family, native to eastern and central North America and well adapted to Mediterranean climates, with characteristics of a prolific deciduous climber. Indeed, in a previous experimentation of ours, this species showed very rapid development and growth, as well as good plant-shielding capacity [30]. The commercial pots used to accommodate the plants were made of recyclable thermoplastic resins resistant to shocks, frost and UV rays, and had a size of 100 × 46 × 40 cm. The soil substrate contained a mixture of sphagnum peat and bentonite clay. The Parthenocissus plants were transplanted into the pots on the SW façade at the end of March 2017 and received nutritional treatments with “Nitrophoska Original Gold” (Compo Expert) fertilizer at concentrations NPK 15-9-15. NPK Original Gold is a balanced complex fertilizer containing both slow-release (5%) and ready-to-use nitrogen in the nitric (2.5%) and ammonia forms (7.5%), satisfying plants’ nutritional needs from the beginning of the crop cycle and, at the same time, providing a nitrogen reserve to be gradually released in the subsequent phases. This was applied in the substrate, yearly, in the months of March (3 g/L), May (1 g/L) and June (1 g/L). Regular irrigation based on the season and weather conditions was supplied by an automated system for sustaining healthy plant growth, with occasional controls of the soil moisture, through the ECH2O Volumetric Water Content (VWC) sensor, which was mostly maintained at values above 25–30% (m3/m3).

2.2. Terminology

Given the use of different terminology in the topic area of vertical greenery systems on buildings, denoting the relevance of this issue and in order to avoid possible misunderstandings, the terminology chosen and used throughout this manuscript to report the case study object of this work is briefly outlined here. The surface of the bare façade of the building used as control to study the effects of the vegetation is denoted as an “unvegetated façade”. In the case of the green wall, the building façade shaded and influenced by the vegetation is denoted as a “vegetated façade”, while the detached vertical vegetation layer, positioned 60 cm from the vegetated façade, is referred to as “green cover”.

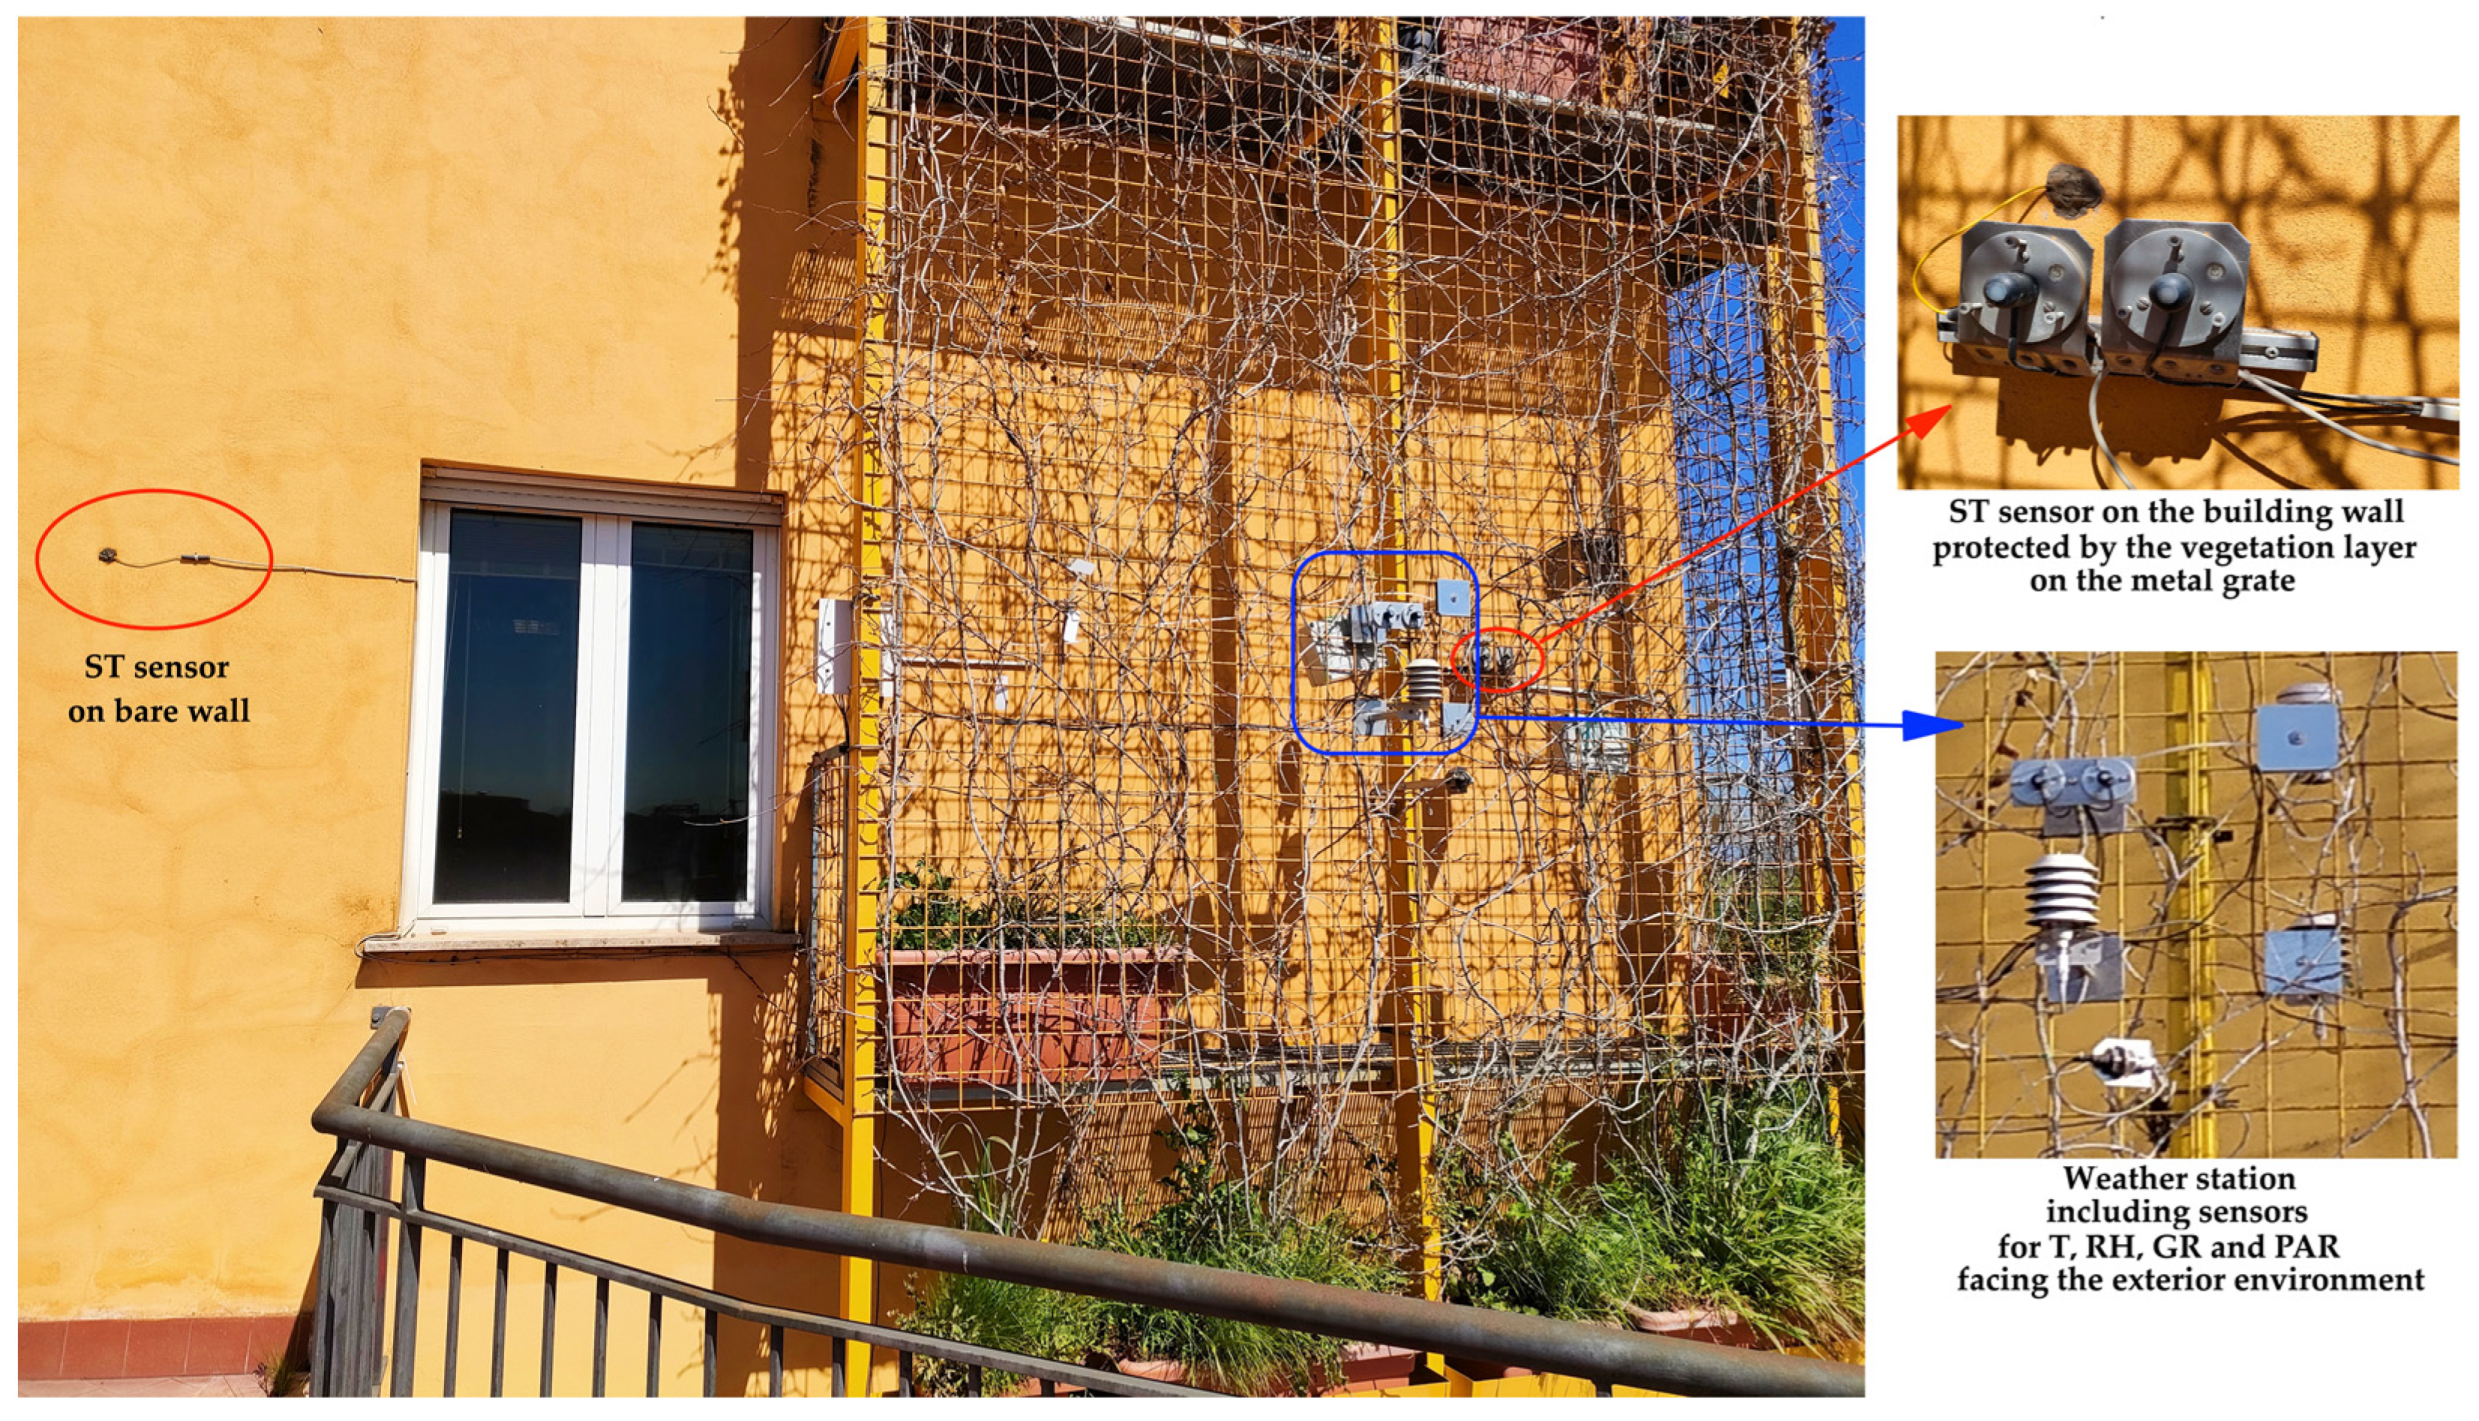
2.3. External Surface Temperature and Microclimatic Monitoring

The thermal performance of the experimental vegetated wall was analyzed by measuring the surface temperature (ST, °C) of both the unvegetated façade without vegetation and the vegetated façade (Figure 2), using thermistors with an accuracy of ±0.15 °C. The outdoor air temperature (Ta, °C) and relative humidity (RHa, %) were measured with a Hygroclip S3 sensor (Rotronic, Zurich, Switzerland), with accuracies of ±0.1 °C and ±0.8%, respectively. Solar radiation was monitored by Apogee Instruments’ devices (www.apogeeinstruments.com, accessed on 2 May 2022). In particular, global solar radiation (GR, Wm−2) in the 350–1100 nm range was recorded perpendicular to the façade ( ) , i.e., in a vertical plane, in the space between the green cover and the vegetated façade (namely inside the gap, GRgap) and on the plant canopy of the green cover facing the external environment (GRext). The installed pyranometers incorporated a calibrated silicon-cell photodiode sensor, with an accuracy of ±5% under clear sky conditions. Photosynthetically active radiation (PAR, µmol of photons m−2s−1) was measured in the spectral range between 410 and 655 nm, with a spectral error lower than 5% at sunlight. For all sensors, the set logger recording interval was 1 h. The data acquisition from the different sensors (multiple channels) was time-synchronized, and the measured data were stored as a sequence of records in the mass memory of the data-logger feeding a database in a remote server. The actual measurement period was 2019–2021.

2.4. Determination of Thermal Properties

The total thermal resistance (R) for the specific stratigraphy of the wall of the building prototype at ENEA Casaccia RC was calculated according to the UNI EN 1745:2020 norm, which indicates the methods for the determination of thermal properties of masonry and masonry products. The total thermal transmittance (U) of the building wall was obtained as the inverse of R, equal to U = 1/R.
The thermal fluxes (heat fluxes, HFs) between the external and internal environment in relation to vegetated and unvegetated façades were also estimated as specified in the UNI EN 1745:2020 norm. The HFs were calculated according to the Technical Specification UNI/TS 11300-1, which defines the methodology to calculate the energy performance of buildings and the energy requirements for indoor climate control. The following equation was used to calculate the thermal energy transmitted through the wall:
Q = U   ·   S   ·   Δ T   ·   t c
where Q (Wh) is the energy transmitted through the wall during time tc; U (Wm−2 °C−1) is the thermal transmittance of the wall; S (m2) is the surface area set as 1 m2; ΔT (°C) is equal to (T−Tc), that is, the difference between the surface temperature (ST) of the façade (vegetated or unvegetated) and the comfort temperature Tc (°C) in the building interior, in °C; and tc (h) is the time interval between two consecutive measures set as 1 h.

2.5. Electricity Saving

Electricity saving was estimated as the ratio between the thermal flux (in kWhm−2) and the energy efficiency ratio (EER), the latter being the ratio between the yielded energy and the consumed electricity, thus representing the efficiency of a room air conditioner (AC).

2.6. Saved CO2 Emissions

To estimate the saved CO2 emissions, the calculated electricity saving was multiplied by the CO2 amount (in kg) emitted to produce 1 kWhe, which was set to 0.444 kg CO2 per kWhe as the emission factor for gross Italian thermoelectric production in 2018, according to ISPRA [31].

2.7. Statistical Analysis

The recorded data, stored in a cloud database, was exported into an Excel spreadsheet. The linear relationship between the datasets was tested by simple linear regression analysis performed by a DSAASTAT Excel plug-in. The significance between the experimental and calculated thermal fluxes was tested using analysis of variance (ANOVA), performed by the SigmaStat 3.1 package (Systat Software Inc., San Jose, CA, USA). The means were separated by the Tukey’s test at a 95% confidence level.

3. Results

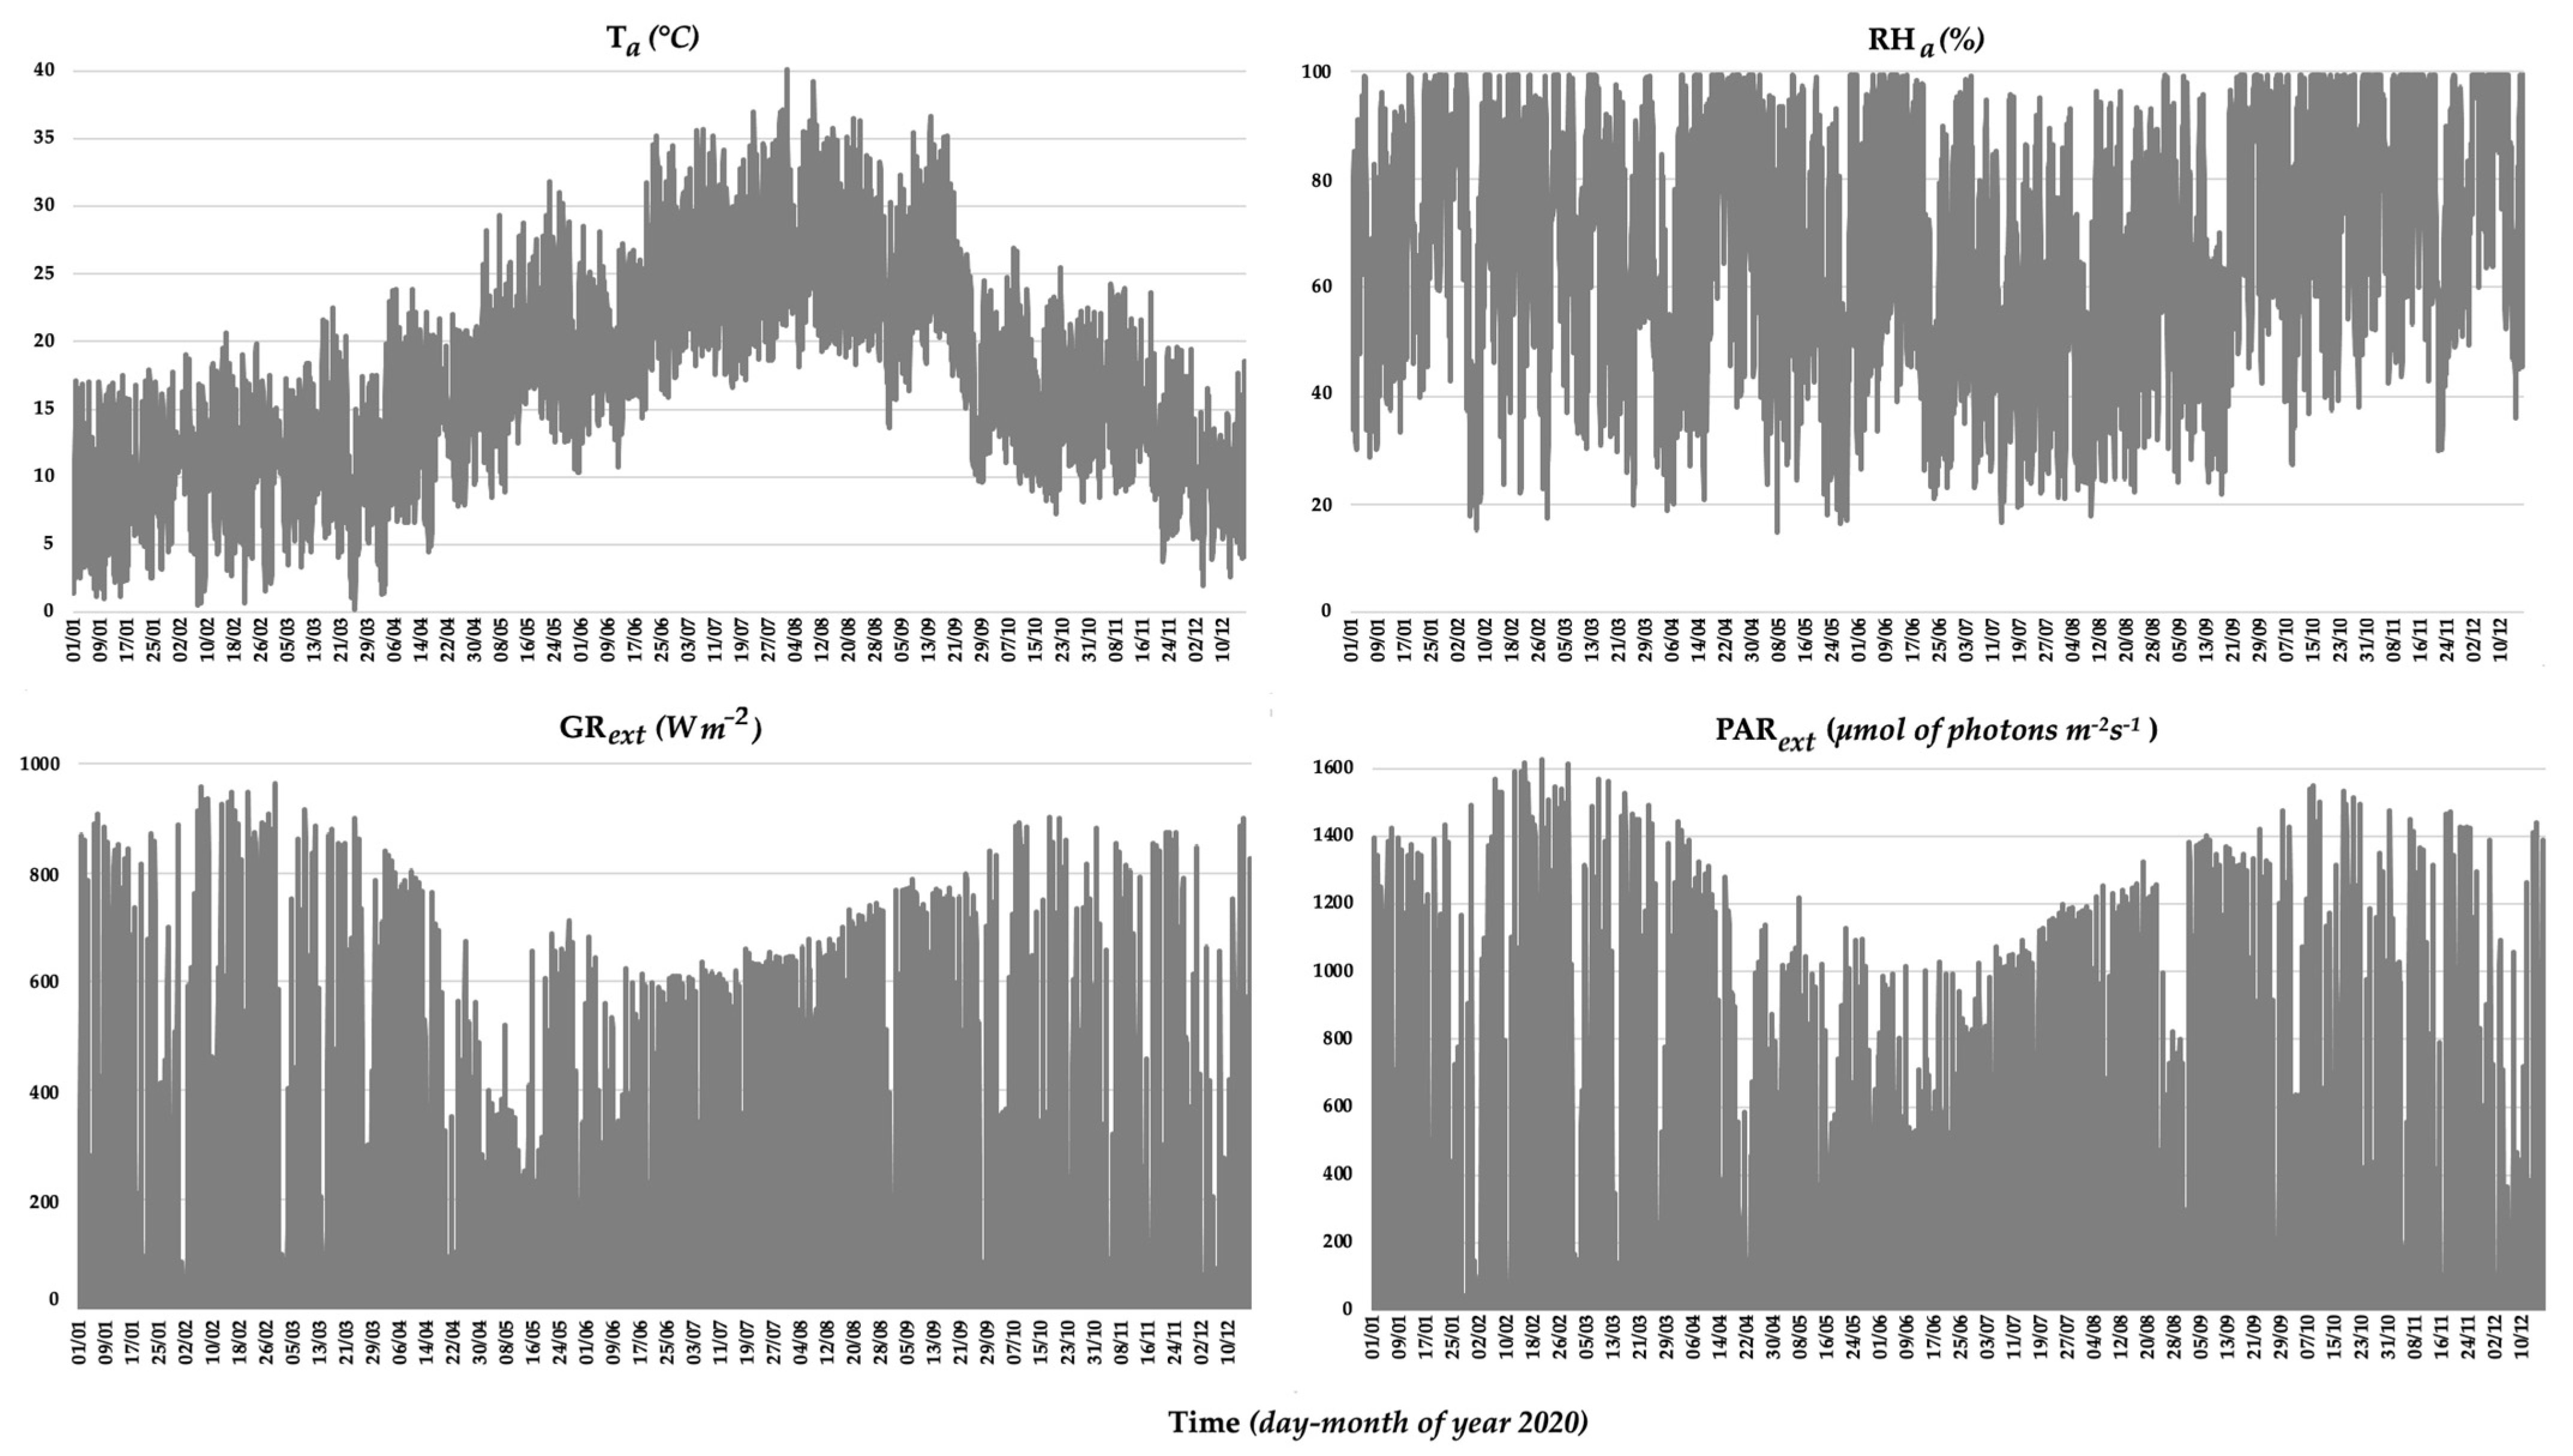
3.1. Microclimate Monitoring

Precise meteorological information of the study area is crucial to attain an accurate analysis of microclimate and thermal data for assessing the energy efficiency gain from the vertical green façade. The microclimate measured by the weather station located on the green façade under observation was hot during summer and relatively cool during winter, fitting the geographical location and the Csa Köppen–Geiger climate classification [28]. The temperature, relative humidity, GR and PAR values registered hourly in 2020 are reported in Figure 3.
In the summer of 2020, the mean Ta was 24.4 °C, with a maximum of 37.3 °C and a minimum of 11.5 °C; in winter, the mean Ta was 9.4 °C, with a maximum of 19.0 °C and a minimum of 1.5 °C. Concerning relative humidity, in summer, the mean RHa was 59.7%, with a maximum of 99.0% and a minimum of 20.2%; in winter, the mean RHair was 74.0%, with a maximum of 99.2% and a minimum of 16.7%. GRext and PARext showed a parallel trend, with the smaller values occurring in the winter months due to the presence of clouds, as expected. In summer, the mean GRair was 273.05 Wm−2 and mean PARair 569.60 µmol photons m−2 s−1; in winter, the mean GRair was 92.22 Wm−2 and mean PARair was 184.48 µmol photons m−2 s−1. In 2020, most of the prevalent wind directions at the site were the southwest (SW), where wind speeds were often in the range 3.6–5.7 m/s, and to a small extent, the northwest (NW). Similar trends for the microclimatic parameters were also observed in 2019 and 2021 (data not shown).

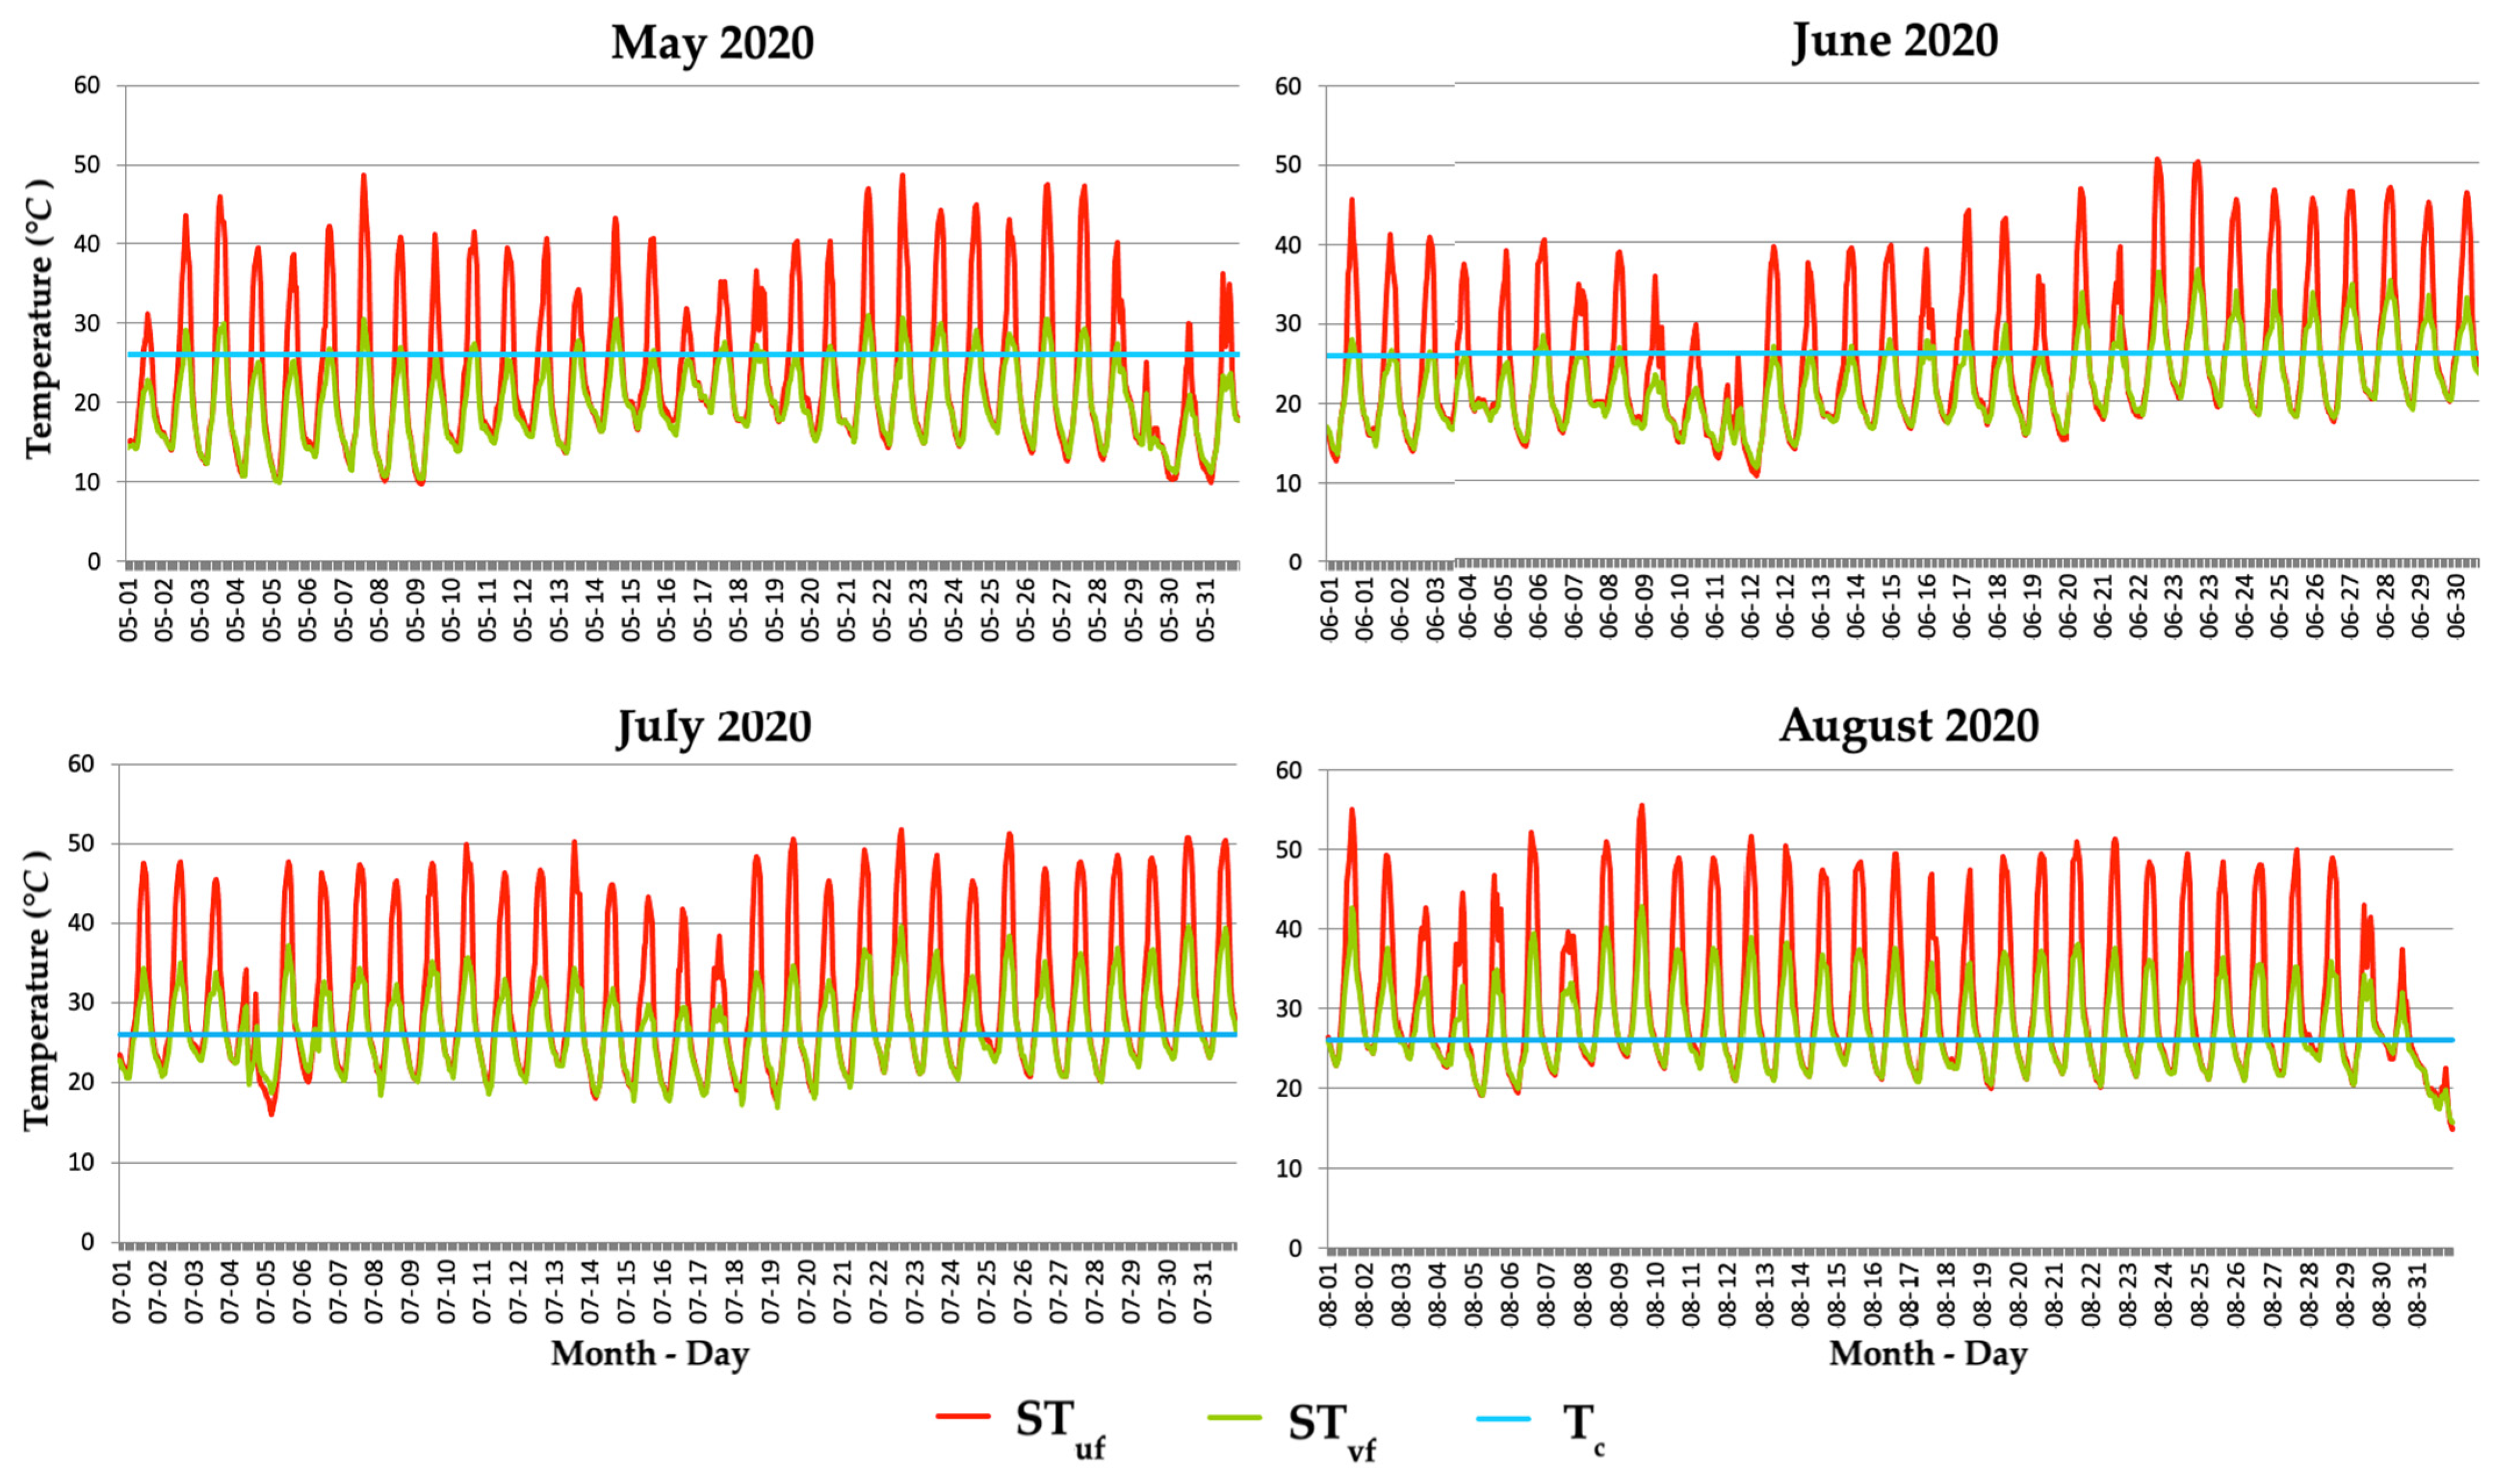
3.2. Surface Temperature on Unvegetated and Vegetated Façades

The influence of the green cover on the surface temperature (ST) and, consequently, on the thermal fluxes was analyzed during the period from May to August in 2019 and 2020. The comfort temperature (Tc) inside the building was established at 26 °C. In Figure 4, as an example, the trends of the surface temperature on the unvegetated (STuf) and vegetated (STvf) façades in the abovementioned months in 2020 are reported, considering that similar trends were also observed in 2019. In May 2020, STvf was almost around or lower than Tc, with a maximum temperature of 32 °C, while STuf was always higher than Tc, with peaks of up to 50 °C. The ΔST between the unvegetated and vegetated facades was higher than 18 °C on particularly hot afternoons. In June 2020, the vegetated façade registered an ST almost below 26 °C during the first 20 days of the month, increasing up to 35 °C in the last 10 days; on the other hand, the unvegetated façade showed an evident trend of ST peaks of between 40 °C and 50 °C. In the two following months, ST showed a trend very similar to the month of June, with very marked differences between the two types of façades. In August, STvf was almost below 38 °C, and approximately 10–15 °C lower than in the absence of plants. The maximum ΔST between unvegetated and vegetated façades reached 15 °C registered at 3:00 p.m. on 27 August 2020.

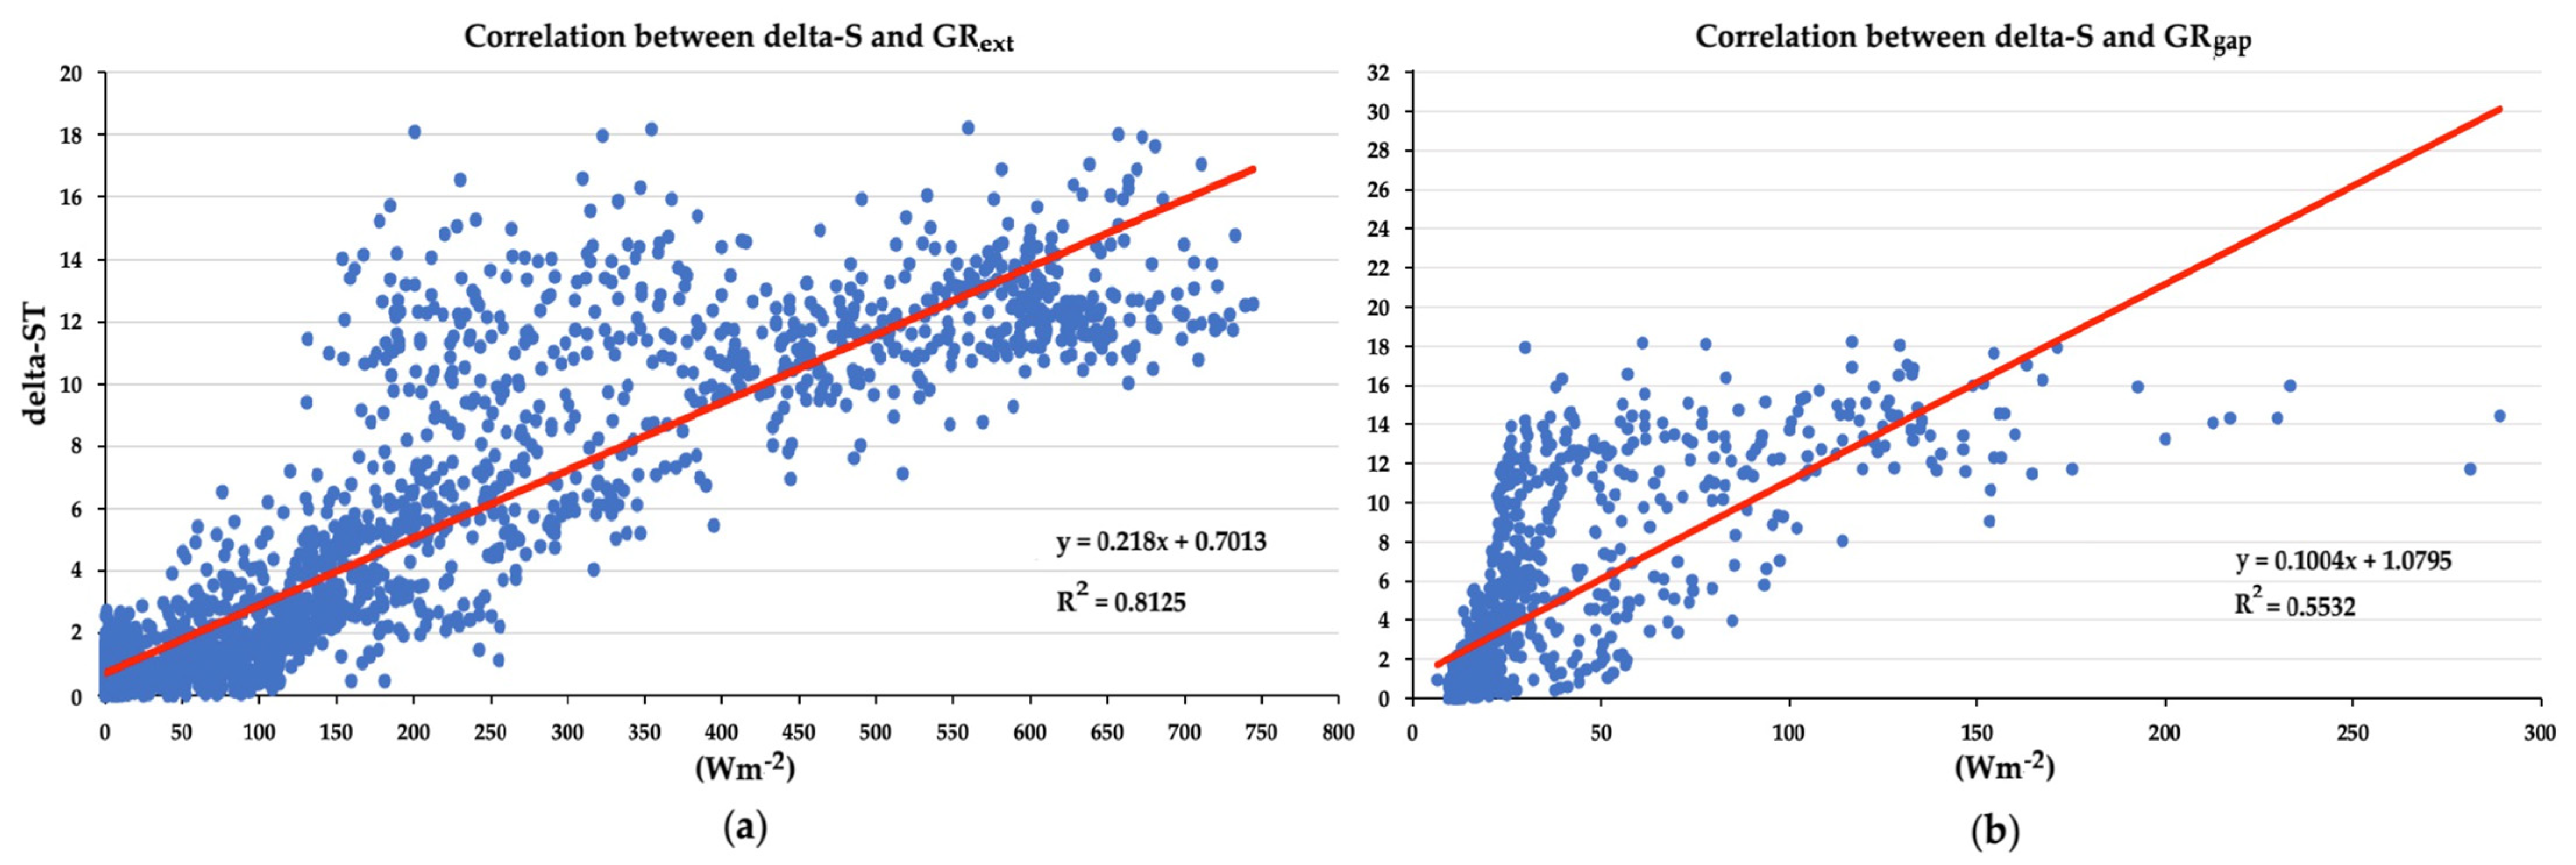
3.3. Dependence of Surface Temperature Difference on Global Radiation

It was hypothesized that the surface temperature difference between the unvegetated and vegetated façades (ΔST = STuf − STvf) could be dependent on the solar incident global radiation (GR). To test this hypothesis, a statistical correlation was performed, and the results of this analysis are reported in Table 1. Using GR data incident on the green cover at the level of the plant canopy, abbreviated as external GR (GRext), a strong positive correlation was assessed with ΔST (R2 = 0.81; Table 1; Figure 5a). Differently, using GR data incident to the vegetated façade detected in the gap space between the vegetated façade and the green cover, abbreviated as GRgap, only a moderate correlation was revealed (R2 = 0.55; Table 1). Notwithstanding, from the graph in Figure 5b, it is evident that ΔST increased with the increase of incident GRgap, up to a certain threshold (150 Wm−2) of solar radiation.

3.4. Thermal Transmittance (U)

The thermal properties of the main components of the stratigraphy of the building wall useful for estimating its thermal transmittance (U) are reported in Table 2. In the calculations, only external façade ST values higher than 26 °C (Tc) were considered. The influence of the shadow caused by the metal structure was neglected because of its low absolute value. As a result, the thermal transmittance of the building wall was equal to 0.80 W/m−2K−1 (Table 2).

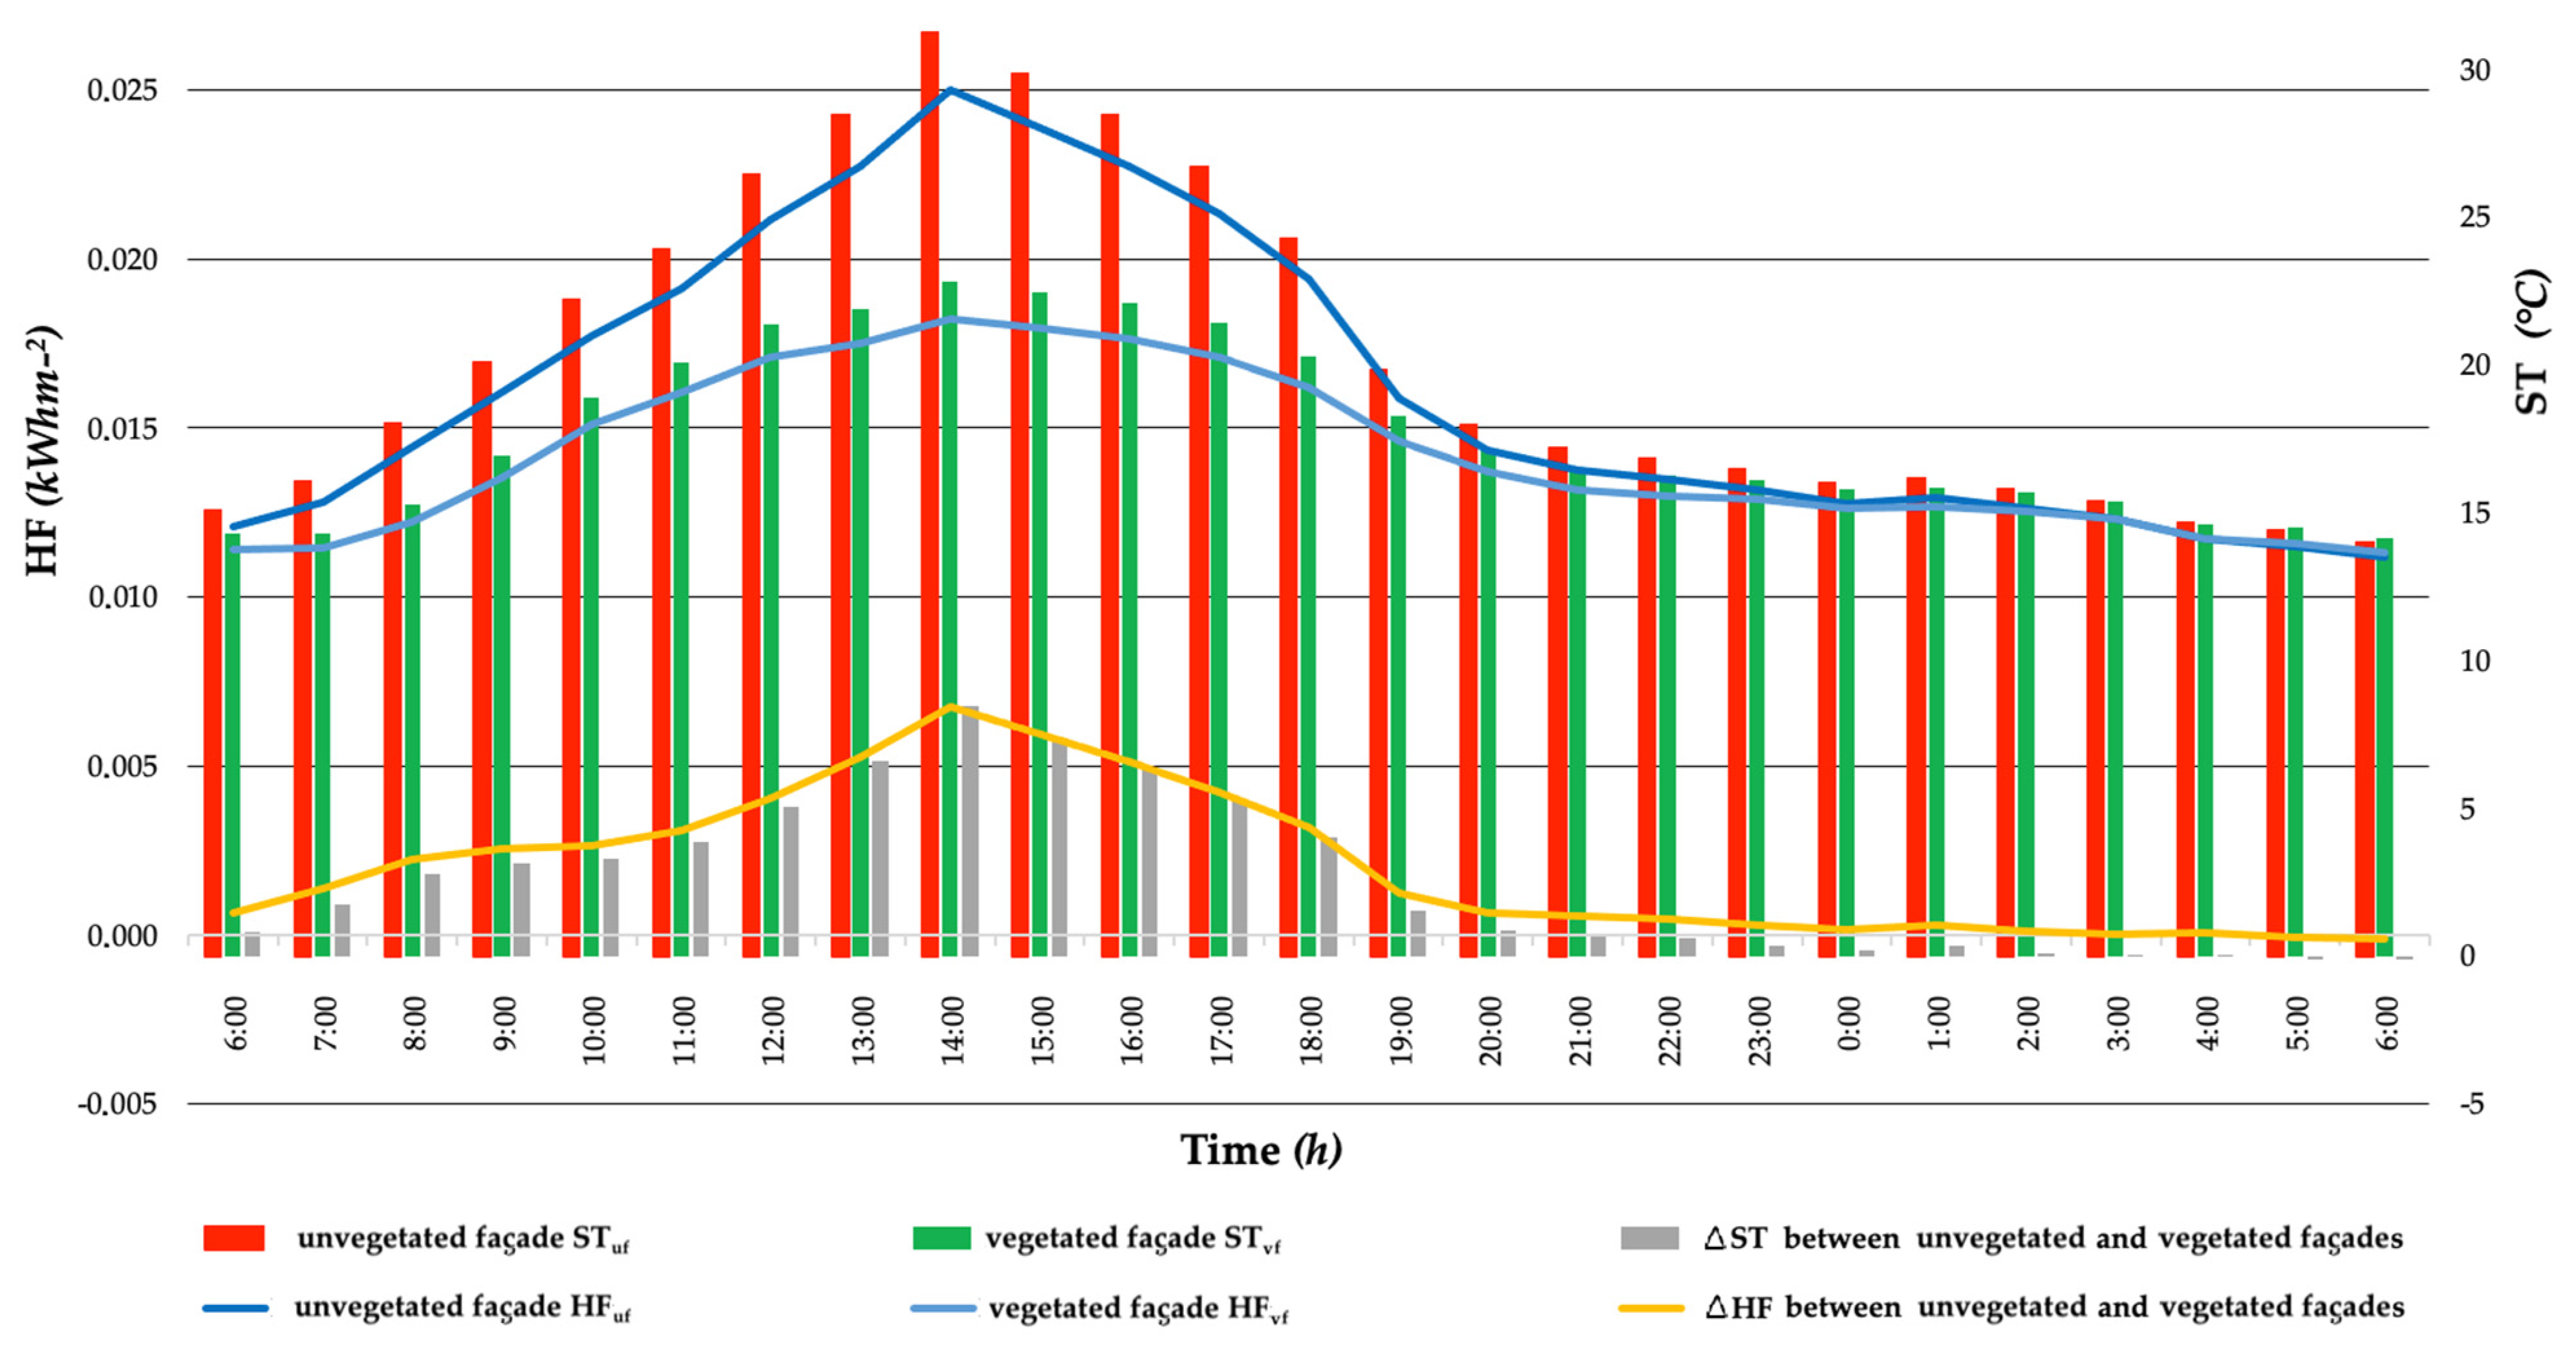
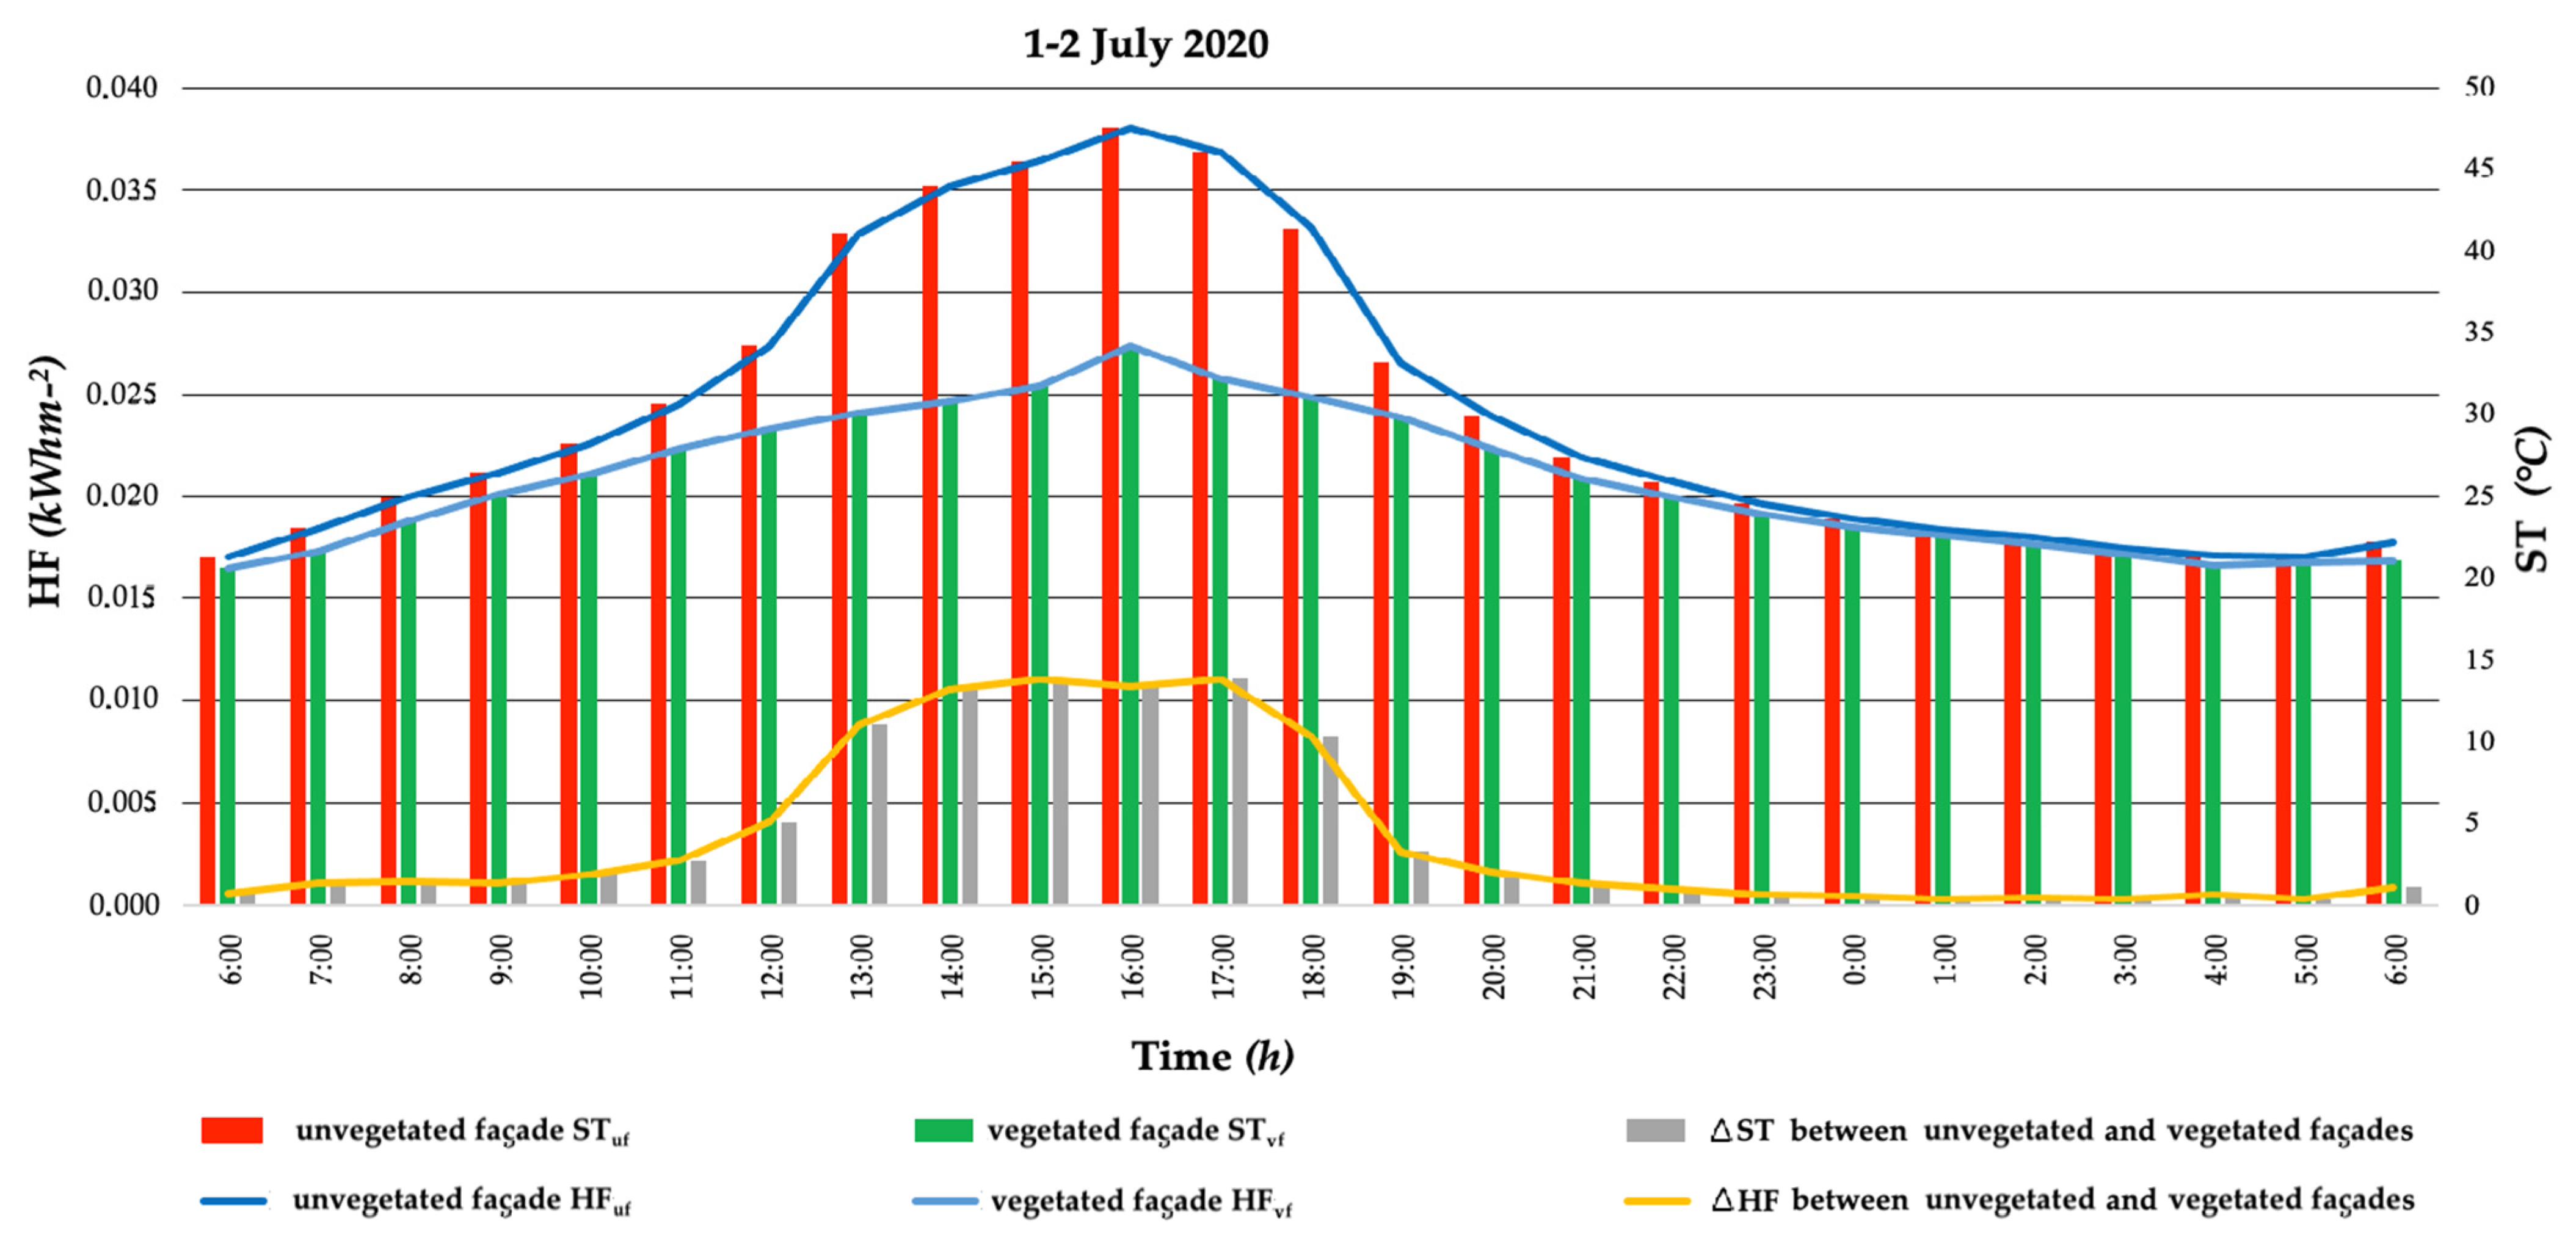
3.5. Hourly Heat Fluxes through Unvegetated and Vegetated Façades

Heat flux (HF) is defined as the amount of heat energy passing through a certain surface per unit of time and per area. The increase of surface temperatures (ST) caused by the incident solar radiation in the hottest months influenced HFs through the two different types of façades. Here, the relationships between ST and HF in the vegetated and unvegetated façades are shown in two specific periods lasting 24 h, namely, the beginning of May 2020 (Figure 6) and the beginning of July 2020 (Figure 7).
Figure 6 focuses on the HFs and STs in both unvegetated (HFuf and STuf) and vegetated (HFuf and STuf) façades, during a 24 h time interval from 06:00 a.m. on the 1st to 06:00 a.m. on the 2nd of May 2020. The maximum HF difference between the two façades (ΔHF) was 0.007 kWhm−2 at 2:00 p.m., corresponding to an ST difference between the two façades (ΔST) of 8.4 °C.
Figure 7 shows that at higher daily temperatures registered during the time interval from 1:00 to 06:00 p.m., the vegetated façade was more effective in decreasing ST and, consequently, HF. The ΔHF between the two façades was higher than 0.01 kWhm−2 from 2:00 to 5:00 p.m., corresponding to a ΔST higher than 13 °C. In July, starting from 11:00 p.m., as resulting from the yellow line related to ΔHF, the HFs vs. the interior and the exterior of the building were almost similar; indeed, the yellow line approximates zero.

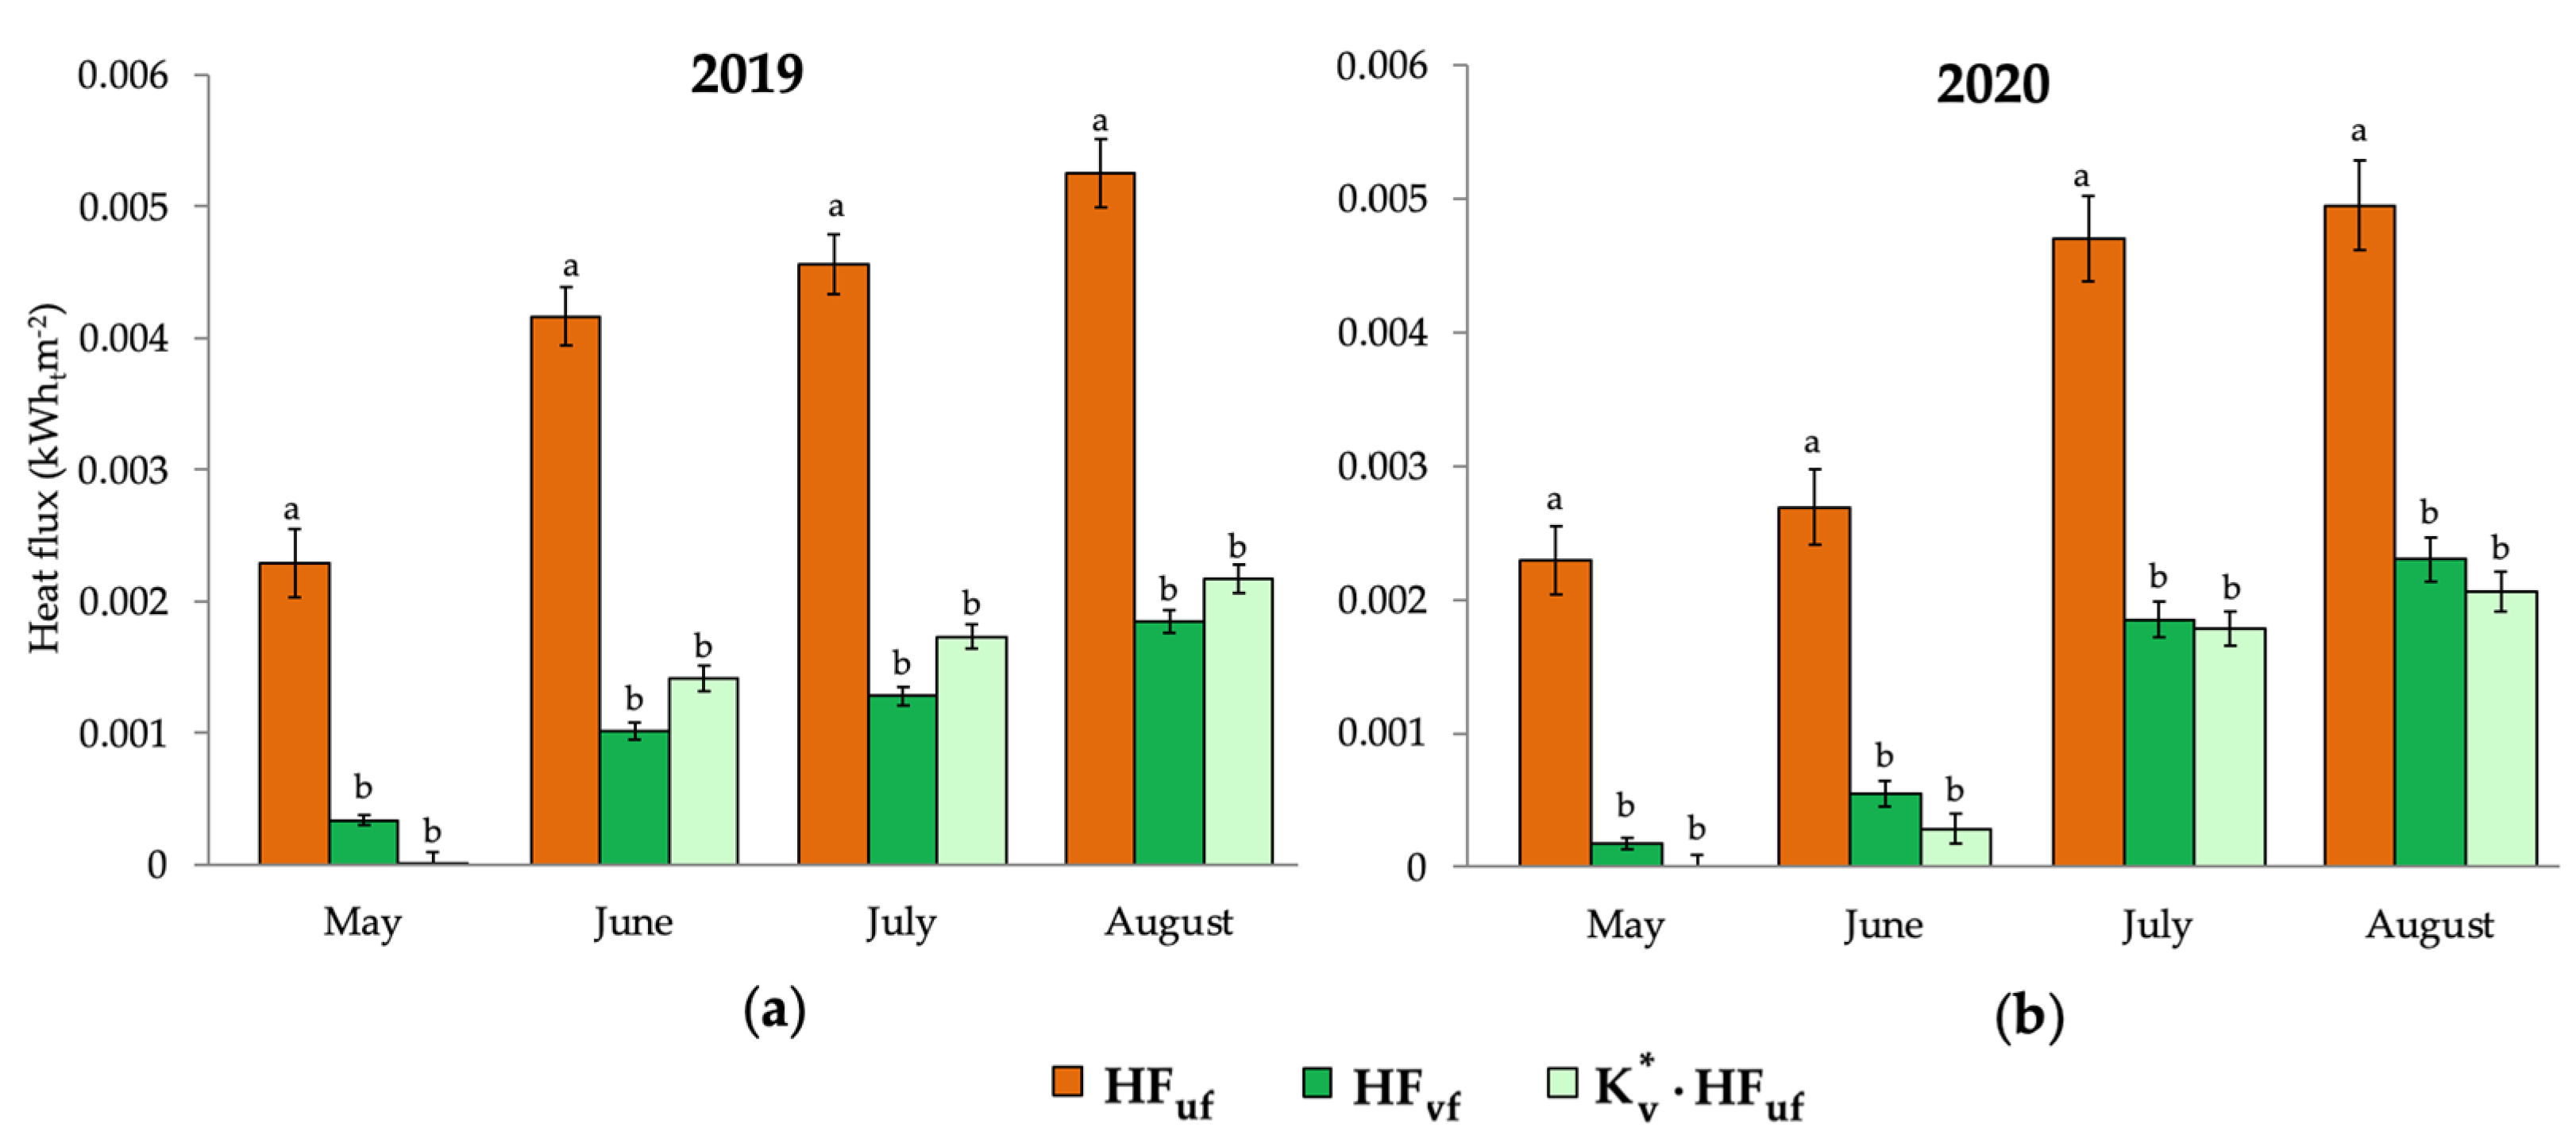
3.6. Monthly Heat Fluxes through Unvegetated and Vegetated Façades

The results of the analysis on the thermal fluxes are reported in Table 3 as the sum of the HFs for the months from May to August, in 2019 and 2020. Even though these data are estimated from the measured STs, this is theoretical data, since this study only considers the effects of a single façade. Evidently, the HF across the vegetated façade represents approximately one third of the HF across the unvegetated façade, confirming the positive effect of the vegetation in cooling the surrounding environment.
The difference between the flux entering through the unvegetated façade (HFuf) and the flux entering through the vegetated façade (HFvf), here named ΔHF, represents the thermal heat that is blocked by the vegetation of the green cover and does not enter the building. Looking at the saving of electric energy for cooling during the hot season as a main result, in relation to the Mediterranean climate, it has been found that—in terms of ΔHF—the presence of a vegetated façade such as the one in the current experiment reduced the total thermal flux entering the building by up to 8.20 and 7.18 kWhthm−2, in 2019 and 2020, respectively, in the spring–summer period from May to August of each year (Table 3). The saving for the acclimatization electricity load from May to August was calculated as:
Δ HF / EER
where the energy efficiency ratio (EER) is a measure of the cooling power of an air-conditioning system per unit of power consumed. It is calculated by dividing the cooling power provided by an AC system per hour by the number of watts of electricity consumed [32]. Assuming an EER for a traditional acclimatization system equal to 3.7 Wth/We, the calculated summer cooling energy saving was 2.22 kWhem−2 in 2019 and 1.94 kWhem−2 in 2020 (“e” subscript in kWhem−2 indicates “electric” kilowatt-hours per square meter). Furthermore, taking into account a CO2 emission of 444.4 g CO2/kWhe [31], the emission saving corresponded to 985 g CO2/m2 in 2019 and to 862 g CO2/m2 in 2020.

3.7. Elaboration of Green Factor K v * for Green Vertical Cover Detached from Building Wall

The above analysis utilized experimental data; indeed, the HFs and ΔHFs were calculated from the measured STs. In order to provide engineers and technicians in the field of green walls an easier way to estimate the energy saving achievable through the use of a vertical green cover, under conditions similar to the current work, a mathematical model based on the green factor was developed. Previously, a green factor, named Kv, was already defined to evaluate the cooling performances of a vegetation cover attached to the façade [26]. The equation that provides the value of the difference between the incoming thermal flux (Δϕ) in an unvegetated façade and in a vegetated façade can be written as follows:
Δ ϕ A = U   K v a I h e
T u f T v f T u f T e a = ( 1 τ v   h e h e * ) = K v
where U (Wm−2K−1) is the thermal transmittance of the building wall; τ v is the vegetation solar transmission coefficient; h e and h e * (Wm−2K−1) are the coefficients of surface heat transfer, respectively, without and with the vertical green cover (coefficients of convective exchange); Tvf (°C) is the external ST on the vegetated façade; Tuf (°C) is the external ST on the unvegetated façade; Tea (°C) is the external air temperature; Tgap (°C) is the external air temperature in the gap between the vegetated façade and the vertical green cover; I (Wm−2) is the global solar radiation; and a is the absorption coefficient of the unvegetated façade, so that aI (Wm−2) is the global solar radiation on the unvegetated façade [26,27,33]. However, in the current study, Kv was elaborated on the basis of the vertical green cover placed 60 cm from the wall of the building by developing the following system of equations:
{ T u f = ( T e a + a I h e ) T v f = T g a p + τ v a I h e
Multiplying the first equation by the quantity τ v , subtracting the second equation from the first, and then arranging the terms:
τ v ( T u f T e a ) = T v f T g a p
Finally, τ v can be calculated as:
τ v = T v f T g a p T u f T e a
The green factor K v * is defined by the following relationship:
K v * = 1 τ υ = 1 ( T v f T g a p T u f T e a )
Since there is a 60 cm gap between the vertical green cover and the vegetated façade, the current formula of K v * uses a slightly modified convective coefficient, namely h e * , instead of the convective coefficient he, which is used in the case of a green cover adjacent to the building wall [30]. As a result, the presence of the vertical green cover reduces the amount of heat that enters the interior building environment. This reduction can be estimated using the K v * factor. Theoretically, assuming K v * is equal to 1, there would be a total blocking of the HF entering the building, and therefore the ST on the vegetated façade would be the same as the air temperature inside the gap. On the other hand, assuming K v * is equal to zero, there would be no reduction in the HF entering the building, and the temperature on the vegetated façade would be the same as on the unvegetated façade, as described by the following relationships:
K v * = 1 ( T v f T g a p ) = 0 T v f = T g a p Maximum   shadow
K v * = 0 ( T v f T g a p ) = ( T u f T e a ) No   shadow .
Clearly, K v * may assume values between 0 and 1. The green factor may be a useful parameter that allows the evaluation of the capacity of specific vegetation placed on a vertical green cover to attenuate the thermal flux versus the interior of a building. As expected, K v * is a parameter that, multiplied by HFuf, is supposed to return a value similar to HFvf, i.e.:
K v *   ·   HF uf HF vf
In order to evaluate the effectiveness of the K v * factor in the estimation of the thermal flux across a vegetated façade (HFvf), its mean monthly value was calculated with Formula (8) during the hours of direct solar radiation from 1:00 to 5:00 p.m., excluding outliers and values >1 or <0 (negative) proceeding from measurement artifacts. The K v * factor values calculated for the Parthenocissus vertical green cover of the ENEA green wall during the spring–summer months from May to September, in the years 2019, 2020 and 2021, are reported in Table 4.
Theoretically, K v * should reflect the status of the vegetation and the result should be almost proportional to the plants’ health, growth and development. As a result, the K v * values reported in Table 4 were highly related to the real status of the vegetation, in accordance with the unstructured observations of the vegetation carried out during the experimental period. In this regard, in the spring–summer of 2020, the vegetation showed a lower coverage than in the previous year and in the following one, because of a malfunction of the irrigation system, which led to a long-lasting dehydration of plants due to the COVID-19 lockdown. Such an unexpected experimental event has been clearly translated into the K v * calculated values, which in 2020 were lower than in 2019 and in 2021. From the unstructured observations, the maximum expansion (coverage) of vegetation in the green cover was achieved in 2019, as also evident in Figure 8.
According to Equation (11), the sum of the monthly K v * multiplied by the monthly HFuf during the selected four-month periods showed a similarity with the thermal flux entering the vegetated façade (HFvf), experimentally estimated from the registered ST values (Table 5). Since our focus was on positive fluxes entering the building, for simplification, the “ K v *   ·   HF uf ” product in May of both 2019 and 2020 was set equal to 0, avoiding negative values (Table 5).
Furthermore, an ANOVA was performed to compare the thermal fluxes entering the building through the unvegetated (HFuf) and vegetated façade (HFvf) and the green factor multiplied by the thermal flux through the unvegetated façade ( K v *   ·   HF uf ) . In this case, the monthly mean HF values proceeding from all HF hourly values per month were used for the statistics. As a result, there were no significant differences between HFvf and “ K v *   ·   HF uf ”, thus confirming their similarity. On the other hand, HFuf was significantly higher (p < 0.01) than HFvf and “ K v *   ·   HF uf ” (Figure 9).

4. Discussion

Vertical greenery systems (VGSs) represent successful nature-based solutions (NBSs) associated with buildings where plants may act as natural temperature regulators, a capability that makes them an efficient strategy for urban heat island mitigation [16,34,35]. In cities where this phenomenon is relevant, a significant energy demand for the cooling of indoor environments should be foreseen, especially under the current dramatic situation of the Russia–Ukraine conflict, where the energy system is the main objective [36]. The aim of this work was to study and quantify the thermal effects of a vertical green cover positioned 60 cm from the building wall in order to predict the potential energy saving for indoor summer cooling of a green wall detached from the building wall, under the Mediterranean conditions of the ENEA Casaccia RC, where this installation is located. The study focused on the thermal gain that the green wall could confer during the summer period by using Parthenocissus quinquefolia (L.) Planch., a deciduous plant species that loses its leaves in fall, thus leaving the building façade “naked” during the cold season of the year. The research activity also included the monitoring of microclimatic parameters, which confirmed that the greened building at ENEA is located in an area with Mediterranean climate and a very hot summer, with occasional air temperature peaks of up to 40 °C and a generally high relative humidity.
A significant reduction of the surface temperature (ST) on the vegetated façade due to the green cover compared to the unvegetated (bare) façade was observed throughout the analyzed warmer months (from May to August) of the Mediterranean climate. Such an ST reduction, which then translates into a reduction of heat transfer to the building, should be determined by a combination of effects besides the solar radiation shielding, taking into consideration the shading and evapotranspiration of plants, but also the air convection in the gap [15]. Among the studies carried out in similar climatic regions on green wall performance, as recently reviewed by Assimakopoulos et al. [37], who looked specifically at the vertical solutions classified as green façades such as in our case study, outdoor ST reduction was reported of up to 9 °C by Vox et al. [38] on warm days, close to 14 °C in summer with east- or west-oriented façades, and close to 11 °C when south-oriented [35]. In our study, we observed a comparable effect: the application of the green cover allowed the external ST of the vegetated façade to be maintained at lower values than the unvegetated façade, and the higher differences in ST were recorded in the daytime from 12:00 a.m. to 6:00–7:00 p.m. In this regard, the main parameters known to contribute to the temperature sensed inside the building include plant foliage, often described by the leaf area index (LAI) and leaf cover percentage traits [37,39,40], façade orientation [40] and climate [41].
From a practical point of view, as reported in other studies [37], the difference between the outside surface temperature in the unvegetated and in the vegetated façades in relation to a specific wall stratigraphy and its total thermal transmittance (U) could also be considered as a main index for evaluating the positive effect that the green infrastructure may play at the urban level in the context of a heat island.
Interestingly, our study evidenced that in a green wall system with plant cover detached from the building wall, the difference between the ST on the unvegetated and vegetated façades (ΔST) was much more dependent on the incident global radiation hitting the external surface of the canopy cover (GRext) than on the solar radiation hitting the interior of the gap (GRgap). This may be due to the spectral properties of the leaves, which in turn may depend on different factors, especially those linked to the geometry and density of the foliage. Notwithstanding, in the narrow range of the irradiation passing through the green cover, a higher GRgap generally corresponded to superior ΔST values.
The plant layer certainly reduced the external ST, and this contributed to the attenuation of the HF transmission into the building through the façades. As expected, the highest HF cut during the day occurred at the same time of the highest ST cut. It is worthy of note that another advantage of green walls (as well as of green roofs) is the thermal lag [13,42] reflecting the delay of the thermal wave transmission from the exterior into the interior of the building through the wall, which depends on the intrinsic characteristics of the wall, even though, according to other studies, VGSs did not provide significant variation of thermal inertia of the construction system [40].
From the sum of the heat fluxes in the examined warm months, an overall cut of the indoor environment entering flux has been calculated, allowing the estimation of the summer electricity saving for indoor cooling, which was higher in 2019 than in 2020 (2.22 kWhem−2 in 2019 compared to 1.94 kWhem−2 in 2020). This difference was due to a different coverage level of the wall over the two years. Indeed, in 2020, due to an irrigation system malfunction, the plant growth was less flourishing than in the previous year (as can be seen in Figure 8). It is now ascertained that increasing the leaf coverage area of green façades can improve the thermal insulation capacity of building wall [43].
Approximately 2 kWhem−2 of electricity, which could be saved yearly for the indoor summer climatization under the reported case study conditions, is accompanied by almost 1 kg of carbon dioxide saved yearly per m2, corresponding to the emissions avoided due to the electricity saving. It is reported that “just 1 m2 of living wall extracts 2.3 kg of CO2 per annum from the air” [44,45]. Our result is in line with these data, considering that the degree of CO2 reduction depends on the weather conditions and green wall orientation, and may be increased by selecting plants more adept at locking away CO2 from the atmosphere [46]. For completeness of information, it should be underlined that additional CO2 amounts are subtracted from the atmosphere due to the plants’ growth and physiological metabolism, since plants live off CO2, and an adult plant is able to absorb 10–50 kg of CO2 per year [47]. It is remarkable to point out that CO2 removal by plants could also ameliorate indoor air quality for a healthy building environment [46,48].
The quantification of the effect of a green infrastructure on energy consumption for the acclimatization of the indoor environment of a building would be highly desired during its planning phase in order to obtain an estimate of the energy efficiency advantages of applying a particular green system on a building. In fact, one of the main barriers that hinders the spread of green infrastructures, and especially VGIs, is certainly the difficulty of quantifying and predicting their gains and effects; on the other hand, it is important to foresee complications in terms of the management and maintenance of a green façade [49]. For this reason, our research has also focused on identifying a parameter that could estimate the improvements to the building energy efficiency, with respect to the air conditioning of internal rooms, brought about by the adoption of a green facade thanks to its cooling function. A similar attempt was made by Ariaudo et al. [26], who defined a Kv index (green factor) associated with the mitigating action of a green wall adjacent to the building. As already mentioned, the green wall under study in ENEA is characterized by an infrastructure detached from the building at a distance of 60 cm; this kind of structure was though to facilitate the management of the vegetation, while at the same time reducing the risk of introducing insects and animals attracted by vegetation into the building. In this work, we reported the equation leading to the modified Kv, named K v * , in which the contribution of the external air temperature in the gap between the building wall and the green vertical cover (Tgap) is included. The K v * index is plant species-specific, and here it was calculated and tested in the case study of the detached Parthenocissus green wall. It was found that the experimentally estimated thermal flux through the vegetated façade could be successfully approximated with the product of the thermal flux through the unvegetated façade with the green factor K v * . The average values of K v * could be experimentally estimated and tabulated for a range of environmental conditions and then provided to technicians of the sector, who, in turn, may easily estimate the summer cooling advantage based on the heat flux through a building wall. A corollary of our findings is that the plant species to be grown on a green wall designed with the main aim of providing energy saving for summer cooling, besides other advantages, can be selected on the basis of their Kv or K v * in attached or detached green walls, respectively. The higher energy efficiency of a green cover may be achieved by selecting plants endowed with a high Kv, high foliage density and high carbon sequestration ability.

5. Conclusions

This study analyzed the beneficial effect, in summer, on the surface temperature of a building wall shaded by a vertical green cover of Parthenocissus quinquefolia (L.) Planch. in a Mediterranean area. With respect to an unvegetated façade, the presence of vertical vegetation allowed the reduction of the heat fluxes entering the building, meaning an electricity load saving of about 2 kWhe/m2 plus the avoidance of about 1 Kg of CO2 emissions into the atmosphere per year. Even though we recognize that this result is based on a simplified “statistical” model, in which only the thermal contribution of the SW vegetated façade was considered for estimating the final energy saving for the summer indoor acclimatization, it is relevant because it means that a significant energy saving may be achieved with the spread of the application of VGSs in a city. The next step will be the development of a more complex “dynamic” model that will consider the effects due to the all-building envelope. Furthermore, for the purpose of providing a useful tool to the planners of vertical greenery systems in cities, a specific green factor, Kv, was developed, which defines the capacity of shading of specific plant species used for protecting a building wall in a detached green wall system.

Author Contributions

Conceptualization: C.A.C., L.G. and A.L.; data curation: L.G., A.C., L.C., P.D.R., C.B. and A.L.; formal analysis: C.A.C., L.G., L.C., P.D.R. and A.L.; resources: C.A.C., P.D.R. and A.L.; supervision: C.A.C. and A.L.; validation: C.A.C., P.D.R., C.B., R.M. and A.L.; writing—original draft preparation: C.A.C., L.G. and A.C.; writing—review and editing: C.A.C., L.G., P.D.R., C.B., R.M. and A.L. All authors have read and agreed to the published version of the manuscript.

Funding

This research was supported by the Italian National Funding “Electric System Research Programme 2019–2021” from the Ministry of Economic Development, in the frame of the project entitled “1.5 Tecnologie, tecniche e materiali per l’efficienza energetica ed il risparmio di energia negli usi finali elettrici degli edifici nuovi ed esistenti”, Line of Activity (LA) entitled “Infrastrutture “verdi” per migliorare l’efficienza energetica degli edifici e la qualitá del microclima”.

Institutional Review Board Statement

Not applicable.

Data Availability Statement

The data presented in this study are available on request from the corresponding author.

Acknowledgments

We thank Giovanni Puglisi (ENEA, IT) for his valuable and helpful suggestions.

Conflicts of Interest

The authors declare no conflict of interest. The funders had no role in the design of the study; in the collection, analyses, or interpretation of data; in the writing of the manuscript, or in the decision to publish the results.

References

  1. Adriadapt. Improving Thermal Comfort in Buildings. Published on 15 January 2022. Available online: https://adriadapt.eu/adaptation-options/improving-thermal-comfort-in-buildings/ (accessed on 12 June 2022).
  2. International Energy Agency (IEA). The Future of Cooling. Opportunities for Energy-Efficient Air Conditioning; Technology Report; IEA Publications: Paris, France, May 2018; Available online: https://iea.blob.core.windows.net/assets/0bb45525-277f-4c9c-8d0c-9c0cb5e7d525/The_Future_of_Cooling.pdf (accessed on 12 June 2022).
  3. European Commission (EU). Green Infrastructure (GI)-Enhancing Europe’s Natural Capital; Commission Document COM(2013) 249 final; European Commission (EU): Brussels, Belgium, 2013.
  4. European Commission. Directive (EU) 2018/844 of the European Parliament and of the Council of 30 May 2018 Amending Directive 2010/31/EU on the Energy Performance of Buildings and Directive 2021/27/EU on Energy Efficiency; L156/75-91; European Commission (EU): Brussels, Belgium, 2018.
  5. De la Sota, C.; Ruffato-Ferreira, V.J.; Ruiz-García, L.; Alvarez, S. Urban green infrastructure as a strategy of climate change mitigation. A case study in northern Spain. Urban For. Urban Green. 2019, 40, 145–151. [Google Scholar] [CrossRef]
  6. Seddon, N.; Smith, A.; Smith, P.; Key, I.; Chausson, A.; Girardin, C.; House, J.; Srivastava, S.; Turner, B. Getting the message right on nature-based solutions to climate change. Glob. Change Biol. 2021, 27, 1518–1546. [Google Scholar] [CrossRef] [PubMed]
  7. Mitchell, R.K.E. How Might the Evolution of Urban Agriculture Advance Sustainable Agriculture in the Future? (A Foresight Study Looking at Food Security through the Lens of Urban Rooftop Agriculture and Sustainable Water Management). Available online: http://openresearch.ocadu.ca/id/eprint/259/1/Mitchell_Robert_2015_MDes_SFIN_MRP.pdf (accessed on 12 June 2022).
  8. Perini, K.; Bazzocchi, F.; Croci, L.; Cattaneo, E. The use of vertical greening systems to reduce the energy demand for air conditioning. Field monitoring in Mediterranean climate. Energy Build. 2017, 143, 35–42. [Google Scholar] [CrossRef]
  9. Besir, A.; Cuce, E. Green roofs and facades: A comprehensive review. Renew. Sustain. Energy Rev. 2018, 82, 915–939. [Google Scholar] [CrossRef]
  10. Kontoleon, K.J.; Eumorfopoulou, E.A. The effect of the orientation and proportion of a plant-covered wall layer on the thermal performance of a building zone. Build. Environ. 2010, 45, 1287–1303. [Google Scholar] [CrossRef]
  11. Pérez, G.; Rincón, L.; Vila, A.; González, J.M.; Cabeza, L.F. Green vertical systems for buildings as passive systems for energy savings. Appl. Energy 2011, 88, 4854–4859. [Google Scholar] [CrossRef]
  12. Perini, K.; Ottelé, M.; Fraaij, A.L.A.; Haas, E.M.; Raiteri, R. Vertical greening systems and the effect on air flow and temperature on the building envelope. Build. Environ. 2011, 46, 2287–2294. [Google Scholar] [CrossRef]
  13. Vox, G.; Blanco, I.; Campiotti, C.A.; Giagnacovo, G.; Schettini, E. Vertical Green Systems for Buildings Climate Control. In Proceedings of the 43rd International Symposium–Actual Tasks on Agricultural Engineering, Opatija, Croatia, 24–27 February 2015; pp. 723–732. Available online: https://www.academia.edu/18003407/VERTICAL_GREEN_SYSTEMS_FOR_BUILDINGS_CLIMATE_CONTROL (accessed on 12 June 2022).
  14. Schettini, E.; Blanco, I.; Scarascia Mugnozza, G.; Campiotti, C.A.; Vox, G. Contribution of green walls to building microclimate control. In Proceedings of the 2nd International Symposium on Agricultural Engineering (ISAE 2015), Belgrade, Serbia, 9–10 October 2015; pp. V-53–V-60. Available online: http://isae.agrif.bg.ac.rs/archive/Proceedings_ISAE_2015.pdf (accessed on 12 June 2022).
  15. Raji, B.; Tenpierik, M.J.; Van Den Dobbelsteen, A. The impact of greening systems on building energy performance: A literature review. Renew. Sustain. Energy Rev. 2015, 45, 610–623. [Google Scholar] [CrossRef] [Green Version]
  16. Pérez, G.; Coma, J.; Martorell, I.; Cabeza, L.F. Vertical Greenery System (VGS) for energy saving in buildings: A review. Renew. Sustain. Energy Rev. 2014, 39, 139–165. [Google Scholar] [CrossRef] [Green Version]
  17. Schettini, E.; Blanco, I.; Campiotti, C.A.; Bibbiani, C.; Fantozzi, F.; Vox, G. Green control of microclimate in buildings. Agric. Agric. Sci. Procedia 2016, 8, 576–582. [Google Scholar] [CrossRef]
  18. Vox, G.; Blanco, I.; Fuina, S.; Campiotti, C.A.; Scarascia Mugnozza, G.; Schettini, E. Evaluation of wall surface temperatures in green facades. In Proceedings of the Institution of Civil Engineers. Proc. Inst. Civ. Eng.-Eng. Sustain. 2017, 170, 334–344. [Google Scholar] [CrossRef]
  19. Schettini, E.; Campiotti, C.A.; Scarascia Mugnozza, G.; Blanco, I.; Vox, G. Green walls for building microclimate control. ISHS Acta Hortic. 2018, 1215, 73–76. [Google Scholar] [CrossRef]
  20. Sheweka, S.M.; Nourhan, M.M. Green facades as a new sustainable approach towards climate change. Energy Procedia 2012, 18, 507–520. [Google Scholar] [CrossRef] [Green Version]
  21. Susorova, I.; Azimi, P.; Brent, S. The effects of climbing vegetation on the local microclimate, thermal performance, and air infiltration of four building facade orientations. Build. Environ. 2014, 76, 113–124. [Google Scholar] [CrossRef]
  22. Andric, I.; Kamal, A.; Al-Ghamd, S.G. Efficiency of green roofs and green walls as climate change mitigation measures in extremely hot and dry climate: Case study of Qatar. Energy Rep. 2020, 6, 2476–2489. [Google Scholar] [CrossRef]
  23. Tilley, D.; Price, J.; Matt, S.; Marrow, B. Vegetated Walls: Thermal and Growth Properties of Structured Green Façades. Final Report to Green Roofs for Healthy Cities. Green Walls Group. 29 March 2012. Available online: https://www.researchgate.net/publication/328267296_Vegetated_Walls_Thermal_and_Growth_Properties_of_Structured_Green_Facades (accessed on 12 June 2022).
  24. Wong, N.H.; Kwang Tan, A.Y.; Chen, Y.; Sekar, K.; Tan, P.Y.; Chan, D.; Chiang, K.; Wong, N.C. Thermal evaluation of vertical greenery systems for building walls. Build. Environ. 2020, 45, 663–672. [Google Scholar] [CrossRef]
  25. Manso, M.; Teotònio, I.; Matos Silva, C.; Oliveira Cruz, C. Green roof and green wall benefits and costs: A review of the quantitative evidence. Renew. Sustain. Energy Rev. 2021, 135, 110111. [Google Scholar] [CrossRef]
  26. Ariaudo, F.; Corgnati, S.; Fracastoro, G.V.; Raimondo, D. Cooling Load Reduction by Green Walls: Results from an Experimental Campaign. In Proceedings of the 4th International Building Physics Conference (IBPC), Istanbul, Turkey, 15–18 June 2009; Available online: https://www.academia.edu/67354764/Cooling_load_reduction_by_green_walls_results_from_an_experimental_campaign (accessed on 12 June 2022).
  27. Campiotti, C.A.; Bibbiani, C.; Alonzo, G.; Giagnacovo, G.; Ragona, R.; Viola, C. Green Roofs and Facades Agriculture (GRF) for Supporting Building Energy Efficiency. J. Sustain. Energy 2011, II, 24–29. Available online: http://www.energy-cie.ro/archives/2011/nr_3/v2-n3-4.pdf (accessed on 12 June 2022).
  28. Kottek, M.; Grieser, J.; Beck, C.; Rudolf, B.; Rubel, F. World Map of the Köppen-Geiger climate classification updated. Meteorol. Z. 2006, 15, 259–263. [Google Scholar] [CrossRef]
  29. Campiotti, C.A.; Consorti, L.; Giagnacovo, G.; Latini, A.; Puglisi, G.; Scoccianti, M.; Viola, C. Caratterizzazione di Tipologie di Sistemi Vegetali per Migliorare L’efficienza Energetica Degli Edifici Nella Città Metropolitana; Project Report RdS/PAR2015/141; Accordo di Programma Ministero dello Sviluppo Economico—ENEA: Rome, Italy, 2016. Available online: https://www.enea.it/it/Ricerca_sviluppo/documenti/ricerca-di-sistema-elettrico/adp-mise-enea-2015-2017/edifici-intelligenti/rds_par2015-141.pdf (accessed on 12 June 2022).
  30. Campiotti, C.A.; Giagnacovo, G.; Latini, A.; Margiotta, F.; Nencini, L.; Puglisi, G. Le Coperture Vegetali per la Sostenibilità Energetica ed Ambientale Degli Edifici; Project Report RdS/PAR2016/075; Accordo di Programma Ministero dello Sviluppo Economico—ENEA: Rome, Italy, 2017. Available online: https://www.enea.it/it/Ricerca_sviluppo/documenti/ricerca-di-sistema-elettrico/adp-mise-enea-2015-2017/edifici-intelligenti/rds_par2016_075.pdf (accessed on 12 June 2022).
  31. ISPRA. Fattori di Emissione Atmosferica di Gas a Effetto Serra Nel Settore Elettrico Nazionale e Nei Principali Paesi Europei; ISPRA Report 317/2020; ISPRA (Istituto Superiore per la Protezione e la Ricerca Ambientale): Rome, Italy, 2020; ISBN 978-88-448-0992-8. Available online: https://www.isprambiente.gov.it/it/pubblicazioni/rapporti/resolveuid/7e78bd7229e946ebbf5b104c7f95f7a8 (accessed on 12 June 2022).
  32. Juaidi, A.; Abdallah, R.; Ayadi, O.; Salameh, T.; Hasan, A.A.; Ibrik, I. Chapter 1-Solar Cooling Research and Technology. In Recent Advances in Renewable Energy Technologies; Jeguirim, M., Ed.; Academic Press: Cambridge, MA, USA, 2021; pp. 1–44. ISBN 9780323910934. [Google Scholar] [CrossRef]
  33. Bibbiani, C.; Gargari, C.; Campiotti, C.A.; Salvadori, G.; Fantozzi, F. Evaluation of greenwalls efficiency for building energy saving. In Innovative Biosystems Engineering for Sustainable Agriculture, Forestry and Food Production; Coppola, A., Di Renzo, G., Altieri, G., D’Antonio, P., Eds.; MID-TERM AIIA 2019 Lecture Notes in Civil Engineering; Springer: Cham, Switzerland, 2020; Volume 67, pp. 169–177. [Google Scholar] [CrossRef]
  34. Afshari, A. A new model of urban cooling demand and heat island–Application to vertical greenery systems (VGS). Energy Build. 2017, 157, 204–210. [Google Scholar] [CrossRef]
  35. Coma, J.; Pérez, G.; de Gracia, A.; Burés, S.; Urrestarazu, M.; Cabeza, L.F. Vertical greenery systems for energy savings in buildings: A comparative study between green walls and green facades. Build. Environ. 2017, 111, 228–237. [Google Scholar] [CrossRef] [Green Version]
  36. Tollefson, J. What the war in Ukraine means for energy, climate and food. Nature 2022, 604, 232–233. [Google Scholar] [CrossRef] [PubMed]
  37. Assimakopoulos, M.N.; De Masi, R.F.; de Rossi, F.; Papadaki, D.; Ruggiero, S. Green wall design approach towards energy performance and indoor comfort improvement: A case study in Athens. Sustainability 2020, 12, 3772. [Google Scholar] [CrossRef]
  38. Vox, G.; Blanco, I.; Schettini, E. Green façadas to control wall surface temperature in buildings. Build. Environ. 2018, 129, 154–166. [Google Scholar] [CrossRef]
  39. Charoenkit, S.; Yiemwattana, S.; Rachapradit, N. Plant characteristics and the potential for living walls to reduce temperatures and sequester carbon. Energy Build. 2020, 225, 110286. [Google Scholar] [CrossRef]
  40. Ascione, F.; De Masi, R.F.; Mastellone, M.; Ruggiero, S.; Vanoli, G.P. Green walls, a critical review: Knowledge gaps, design parameters, thermal performances and multi-criteria design approaches. Energies 2020, 13, 2296. [Google Scholar] [CrossRef]
  41. Alexandri, A.; Jones, P. Temperature decreases in an urban canyon due to green walls and green roofs in diverse climates. Build. Environ. 2008, 43, 480–493. [Google Scholar] [CrossRef]
  42. Kumar, V.; Mahalle, A.M. Investigation of the thermal performance of green roof on a mild wild climate. Int. J. Renew. Energy Res. 2016, 6, 487–493. [Google Scholar] [CrossRef]
  43. Widiastuti, R.; Zaini, J.; Caesarendra, W.; Kokogiannakis, G.; Binti Suhulian, S.N.N. Thermal insulation of green façades based on calculation of heat transfer and long wave infrared radiative exchange. Measurement 2022, 188, 110555. [Google Scholar] [CrossRef]
  44. Available online: https://www.srsgroup.co.nz/blog/co2-removal-by-living-walls-some-key-facts/ (accessed on 12 June 2022).
  45. Available online: https://ethicalunicorn.com/2021/07/20/how-green-walls-help-the-environment-clean-the-air-improve-wellbeing/ (accessed on 12 June 2022).
  46. Wesolowska, M.; Laska, M. The use of green walls and the impact on air quality and life standard. E3S Web Conf. 2019, 116, 00096. [Google Scholar] [CrossRef]
  47. Cameron, R.W.F.; Blanuša, T. Green infrastructure and ecosystem services–Is the devil in the detail? Ann. Bot. 2016, 118, 377–391. [Google Scholar] [CrossRef] [PubMed] [Green Version]
  48. Rivera, E. Quantifying CO2 removal by living walls: A Case Study of the Center for Design Research. J. Undergrad. Res. 2014, 2014, 20–29. Available online: https://kuscholarworks.ku.edu/bitstream/handle/1808/15038/Rivera_jur14.pdf;sequence=1 (accessed on 12 June 2022).
  49. Manso, M.; Sousa, V.; Matos Silva, C.; Oliveira Cruz, C. The role of green roofs in post COVID-19 confinement: An analysis of willingness to pay. J. Build. Eng. 2021, 44, 103388. [Google Scholar] [CrossRef]
Figure 1. Consecutive steps in the installation of the green wall at the ENEA “green” building demonstration platform. (a) The building without the vertical green wall installation; (b) yellow stainless-steel infrastructure with three series of planter holders, respectively at the base and on the 1st and 2nd floor of the building; (c) transplanted plants attaching themselves to the lattice infrastructure (April 2017); (d) plants completely covering the infrastructure (June 2019).
Horticulturae 08 00526 g001
Figure 2. Section of the building at ENEA Casaccia RC showing the steel infrastructure sustaining vegetation in the SW façade at the first-floor level. The picture was taken in March, when the deciduous Parthenocissus quinquefolia (L.) Planch. Was still bare after losing its leaves in winter. On the left, the red circle surrounds the surface temperature sensor located on the unvegetated façade (STuf), while on the right, the one on the vegetated façade (STvf) is circled. The other devices surrounded by the blue square correspond to the weather station, including several sensors for microclimate monitoring.
Horticulturae 08 00526 g002
Figure 3. Hourly data recorded in 2020 of the ambient temperature and relative humidity measured on the external side of the vegetated façade (Ta and RHa, respectively) in the upper part of the figure, and of the solar global radiation and photosynthetically active radiation measured parallel to the vegetated façade on the external side (GRext and PARext, respectively) in the lower part of the figure. On the x-axis, the time is expressed as day–month of 2020.
Horticulturae 08 00526 g003
Figure 4. Surface temperature (°C) registered on the vegetated façade shaded by Parthenocissus (STvf, green line) and on the unvegetated façade (STuf, red line). The light blue horizontal line at 26 °C indicates the value of the indoor comfort temperature inside the building (Tc).
Horticulturae 08 00526 g004
Figure 5. Graph of surface temperature difference between unvegetated and vegetated façades (ΔST) and incident global solar radiation (GR). (a) ΔST correlation with GR detected on the external plant canopy of the green cover (GRext); (b) ΔST correlation with GR detected inside the gap (GRgap), which was the 60 cm space between the building’s vegetated façade and the green cover shading it.
Horticulturae 08 00526 g005
Figure 6. Double axis graph showing the heat flux (HF) on the left y-axis and the surface temperature (ST) on the right y-axis, as a function of the time (24 h period) from 06:00 a.m. on the 1st to 06:00 a.m. on the 2nd of May 2020. HFs are represented as vertical bars, STs as curved lines. Both variables are shown as hourly mean values on the unvegetated (HFuf and STuf) and vegetated (HFvf and STvf) façades. HF and ST differences between the unvegetated and vegetated façades (ΔHF and ΔST, respectively) are also shown.
Horticulturae 08 00526 g006
Figure 7. Double axis graph showing the heat flux (HF) on the left y-axis and the surface temperature (ST) on the right y-axis, as a function of the time (24 h period) from 06:00 a.m. on the 1st to 06:00 a.m. on the 2nd of July 2020. HFs are represented as vertical bars, STs as curved lines. Both variables are shown as hourly mean values on the unvegetated (HFuf and STuf) and vegetated (HFvf and STvf) façades. HF and ST differences between the unvegetated and vegetated façades (ΔHF and ΔST, respectively) are also shown.
Horticulturae 08 00526 g007
Figure 8. Pictures of the southwest (SW)-oriented green wall on the building at ENEA Casaccia RC in the month of July in 2019, 2020 and 2021.
Horticulturae 08 00526 g008
Figure 9. Mean value of hourly heat fluxes entering the interior of the building calculated from May to August 2019 (a) and 2020 (b). Unvegetated façade HF (HFuv, in orange), vegetated façade HF (HFvf, in green) and K v * HFuf (in light green). Error bars show ± SEM (standard error of the mean), different letters indicate statistically significant differences (p < 0.01).
Horticulturae 08 00526 g009
Table 1. Statistical results of the ANOVA and linear correlation analysis between surface temperature difference ( Δ ST ) and the global radiation (GR) incident on the canopy of the vegetated surface (GRext) and detected inside the gap (GRgap), which was the 60 cm space between the building’s surface and the green plant cover.
Analysis of VarianceParameters Estimated
EffectDFSSMSF ValueProb.ParameterEstimateSET ValueProb.
Model146,137.4901746,137.4901710,647.30990Intercept (a)0.7010.05449282612.869664689.967 × 10−37
Error245710,646.803234.333253247 GRext0.0220.000210841103.18580280
Total245856,784.293423.10182807
R-square: 0.81
Model114,497.314,497.31344.503.4 × 10−192Intercept (a)1.080.138.091.56 × 10−15
Error108611,710.010.8 GRgap0.100.0036.673.43 × 10−192
Total108726,207.424.1
R-square: 0.55
DF: degrees of freedom; SS: sum-of-squares; MS: mean squares; SE: standard error.
Table 2. Thermal properties of the stratigraphy elements of the prototype building façade calculated according to the UNI EN 1745:2020 norm, total thermal resistance (R) and thermal transmittance (U) of the building wall.
Wall Stratigraphy
Elements
Thickness (m)Conductivity, λ (Wm−1K−1)Thermal
Resistance,
R (W−1m2K)
Thermal
Transmittance,
U (Wm−2K−1)
Adductance
(internal heat resistance)
0.100
Internal plaster0.0200.6500.031
Hollow bricks0.0800.2300.348
Air gap0.0550.2600.212
Hollow bricks exterior0.1200.2300.522
Exterior plaster0.0200.6500.031
Adductance
(external heat resistance)
Thermal resistance of the building wall (R)1.243 *
Thermal transmittance of the building wall (U) 0.80
* The value of the thermal resistance (R) does not exactly correspond to the sum of the thermal resistance of the listed wall stratigraphy elements due to approximations in calculations.
Table 3. Monthly heat fluxes entering the interior of the building through the unvegetated (HFuf) and vegetated (HFvf) façades, and monthly HF differences between the unvegetated and vegetated façades (ΔHF = HFuf − HFvf), in the period from May to August, 2019 and 2020.
YearMonthHFuf
(kWhthm−2)
HFvf
(kWhthm−2)
ΔHF
(kWhthm−2)
2019May1.020.070.95
June3.000.732.27
July3.390.952.44
August3.911.372.54
Total11.623.418.20
2020May1.700.131.57
June1.940.41.54
July3.471.372.09
August3.681.711.97
Total10.793.617.18
th” subscript in kWhthm−2 indicates “thermal”.
Table 4. Monthly mean values ± std. dev. of K v * calculated for Parthenocissus quinquefolia (L.) Planch. in spring–summer months in 2019, 2020 and 2021.
Month K v *
201920202021
May0.89 ± 0.090.80 ± 0.110.83 ± 0.13
June0.92 ± 0.080.84 ± 0.120.91 ± 0.10
July0.96 ± 0.150.86 ± 0.120.94 ± 0.05
August0.89 ± 0.090.74 ± 0.080.86 ± 0.12
September0.80 ± 0.140.67 ± 0.110.82 ± 0.12
Table 5. Monthly heat fluxes experimentally obtained through the vegetated façade (HFvf) and the respective products between the experimentally obtained K v * for Parthenocissus quinquefolia (L.) Planch. and the heat fluxes through the unvegetated facade (namely, K v *   ·   HF uf ) in the period from May to August 2019 and 2020.
YearMonthHFvf
(kWhthm−2)
K v * · HF uf
(kWhthm−2)
2019May0.070.00
June0.731.01
July0.951.29
August1.371.62
Total3.414.34
2020May0.130.00
June0.40.21
July1.371.34
August1.711.57
Total3.613.12
th” subscript in kWhthm−2 indicates “thermal”.
Publisher’s Note: MDPI stays neutral with regard to jurisdictional claims in published maps and institutional affiliations.

