Article

The Effect of Changing Climatic Conditions on the Morphological Traits and Chemical Composition of Almond Kernels

1
Institute for Science Application in Agriculture, Blvd. Despota Stefana 68b, 11000 Belgrade, Serbia
2
Institute of Hygiene, Military Medical Academy, Crnotravska 17, 11000 Beograd, Serbia
3
Faculty of Agriculture, University of Belgrade, Nemanjina 6, Zemun, 11080 Belgrade, Serbia
4
Institute ‘Tamiš’, Novoseljanski Put 33, 26000 Pančevo, Serbia
*
Author to whom correspondence should be addressed.
Horticulturae 2022, 8(6), 487; https://doi.org/10.3390/horticulturae8060487
Submission received: 29 March 2022 / Revised: 24 May 2022 / Accepted: 28 May 2022 / Published: 31 May 2022

Abstract

:
This study evaluates the effect of two contrasting years, in terms of climatic parameters, on kernel morphology and content and on the composition of oil, tocopherols and the 11 macro- and micro-elements in almonds. Low precipitation and high temperatures increased the content of tocopherols, Cu and Zn but decreased the kernel ratio, the oil content, and the levels of macro-elements and of Cr, Fe, Mn and Mo. The obtained data indicate some statistically significant correlations among the kernel quality parameters and climate. A small variation in oil concentration with the highest value in ‘Texas’ (60.07%) was observed. The main tocopherol homologue was α-tocopherol (39.4 to 404.4 mg/100 g DW), representing more than 90% of the total tocopherols. Potassium was predominant (882.0 to 1104.5 mg/100 g), followed by phosphorus, magnesium, calcium and sodium. The most abundant micro-elements were iron (3.095 to 3.708 mg/100 g) and zinc (2.641 to 4.765 mg/100 g), followed by manganese, copper, molybdenum and chromium. The genotype 15/03 has the highest level of health-promoting compounds (α-tocopherol, potassium and zinc), so that, together with genotype 25/03 which showed the best response to changing climatic conditions, this genotype could be of interest for breeding programs.

1. Introduction

As a food crop with a high nutritional and medicinal value, almonds have been a significant part of the human diet from the pre agricultural era to the present day. Due to their good flavor and taste, they may be consumed either as snacks or as a part of a meal, providing macronutrients, micronutrients, and various bioactive components [1,2]. Almonds naturally contain high levels of oil, monounsaturated and polyunsaturated fatty acids, protein and dietary fiber, as well as a variety of essential nutrients, including vitamin E and several trace elements. It is considered a ‘nutrient-dense’ nut, meaning that it provides a variety of nutrients in high amounts per serving. Demand for almonds has been promoted by the ongoing studies demonstrating a broad range of health benefits from regular almond consumption, including possible protection from cancer, obesity, diabetes and heart diseases [3,4]. Even as almond oil has been broadly and predominately used in the manufacture of food and cosmetic products in recent years, the need for its high quality and the high-quantity production of almond oil for human consumption has also increased [5].
Although fruit quality is mainly related to the chemical composition of a product, including the nutritional and health aspects involved in defining its final value, some physical parameters must also be taken into account when evaluating the quality of any fruit. In the almond, the physical traits do not affect the organoleptic characteristics of the kernel, but they have a special importance in the industry because of the different steps involved in almond processing [6].
The kernel is the commercial part of the almond, and its size and shape are mostly genotype-dependent. The size and the closely correlated kernel weight are variable from year to year although this trait is less variable in the almond than in other fruit species [7]. In addition to the overall kernel size, its linear dimensions of length, width and thickness, as well as the length/width ratio, are also important for certain commercial applications [8,9,10]. A kernel size is commercially important, with larger sizes—higher than 1.2 g—generally conferring greater value [11].
The chemical and mineral compositions of almond kernels are of great significance for the establishment of its nutritive value and for its quality in terms of recent concerns on the part of consumers regarding the maintenance of a healthy lifestyle [12]. Out of the 14 minerals identified as the principal minerals for the human body, up to nine appear in the almond, and four of those nine appear in relevant concentrations [13]. According to the literature reviewed by [14], potassium is the most common, followed by phosphorus. Both macronutrients account for more than 70% of the total mineral fraction, without taking nitrogen into account. The amount of potassium was found to be high and four times as high compared with the amount of sodium, which is very important for the functioning of all living cells and blood pressure regulation [15]. Diets high in potassium and phosphorus are linked with reduced cardiovascular disease mortality and hypercalcemia, osteoporosis, and diabetes, improving functions in the skeletal and non-skeletal tissues [16,17]. Almond kernels are also an important source of calcium, magnesium, and manganese [1,15,18]. During fruit growth and ripening, copper, iron and zinc are accumulated in significant amounts in almond kernels, too [19]. The other elements found, although in minor concentrations, include molybdenum, boron, chromium, aluminum, nickel and selenium. Some references to toxic heavy metals have also been found [20]. Although micronutrients are present in the almond kernel in relatively small amounts, they play an important role in plant metabolism and in the human body, assisting in the prevention of many diseases and the maintenance of good health.
The almond kernel is considered to be one of the foods richest in tocopherol (the vitamin E), especially as the source of the α-tocopherol [21,22] considered to be the most biologically active form of the vitamin E that limits free radical formation, oxidative stress, and lipid peroxidation. α-tocopherol has been found to mainly inhibit new free radical production. Oxidation has been connected with numerous possible conditions/diseases, including atherosclerosis, cancer, ageing, arthritis and cataracts. Thus, vitamin E might help prevent or delay the chronic diseases associated with reactive oxygen species molecules [23].
According to a recent review [24], not only do the tocopherols play a substantial role as a healthy food for human consumption, but they also protect lipids against oxidation and thus lengthen the storage time of almond kernels. The four tocopherol isomers, α-, γ-, δ- and β-tocopherol, in decreasing importance, were reported in the almonds at various levels. The range of the variability of the different tocopherol homologues for different almond cultivars and genotypes from different countries has been summarized by [25] and updated by [26]. The authors indicated that the range of variability for the α-tocopherol was between 21.3 and 656.7 mg/kg oil, for γ-tocopherol between 2.4 and 50.2 mg/kg oil, and for β-tocopherol between 0.1 and 22.0 mg/kg oil. Information on tocopherol concentrations is important in determining the end-use of kernels and for predicting their storage life [27,28].
The precise knowledge of almond kernel composition is of a great interest from the commercial, industrial and nutritional points of view, especially taking into consideration the variability that exists between different genotypes [14]. The majority of studies on the composition and characterization of macro- and micronutrients refer to broadly cultivated cultivars, whereas little information is available for local almond genotypes/cultivars [29]. Information on the nutritional characteristics of local almond varieties would be interesting from a nutritional aspect in order to depict the natural variability and elaborate the most nutrient-dense almond varieties, which strengthens the importance of selecting cultivars with a high nutrient content [30].
The almond is considered a drought-resistant fruit crop with high resilience to environmental changes. Changing climate is an important stress factor, which affects agricultural production and thus almond yields and quality as well [31]. Though the almond has already proven to be a good choice for warm and moderate-to-severe water stress situations [32], creating new cultivars showing an efficient uptake and utilization of available water and mineral resources is an important strategy that needs to be focused on. The right genotype/cultivar/rootstock and the most appropriate growing conditions must be selected in order to obtain kernels with the highest level of the beneficial components which are important for human consumption and health. Thus, the present paper aims to compare the effect of changing climatic conditions on the kernel morphology, content and composition of oil, tocopherols and minerals of the six almond genotypes originating from Serbia and one commercial almond cultivar. Another goal is to increase the knowledge of the diversity of tocopherols and minerals in Serbian almonds, which can be used either in the following breeding programs for creating new cultivars for changing climatic conditions or as a raw material for table consumption and industrial processing.

2. Materials and Methods

2.1. Almond Samples and Location Characteristics

The study was conducted in a full-production almond orchard planted in the autumn of 2006. The almond orchard is located in Surduk, above the Danube River, near Belgrade, Serbia (45°03′ N; 20°20′ E, at the altitude of 110 m). The soil is a calcareous chernozem on the loess belt, easily permeable, with an organic matter content of 25.0 g kg−1 (0–30 cm) and 17 g kg−1 (30–60 cm). Six almond genotypes originating from the large spontaneous population of almond seedlings in North Serbia called Slankamen Hill, from which five genotypes, based on the previous study of [33], proved to be high in total phenolic contents (683–1392 mg GAE/kg FW), were chosen for comparison with the ‘Texas’ cultivar. Each sample was represented by three trees grafted onto Myrobalan plum seedlings and trained as an open vase. The space distance was 4 × 3 m. All the necessary agrotechnical measurements, except for irrigation, were applied. For the purpose of conducting a kernel analysis, the almond fruits (10 per tree, 30 in total) were randomly sampled when the hull was fully desiccated and open along the suture. The fruits were dried at a room temperature and the kernels in endocarps were kept in the paper bags in the dark until carrying out the analysis. Prior to the analysis, the endocarp was broken, and the kernel was pulled out and used without extra drying. The kernel length, width and thickness were measured with a digital caliper, and the kernel weight was measured with a digital scale. The kernel ratio was expressed as a percentage.
Two consecutive and very contrasting years in terms of temperature and precipitation were chosen for the purpose of this study (Table 1 and Table 2). The maximum air temperatures during the summer months of 2014 and 2015 were around 33 °C and 38 °C, respectively, with an average humidity of 70% in both years. The annual precipitations of 841.6 (2014) and 609.6 mm (2015) were mainly distributed from May to September (with June and August being the driest with around 50 mm of precipitations).
For the purpose of this study, daily temperatures (average, max and min), precipitation (mm) and air humidity were recorded and are presented in Figure 1 and Figure 2.

2.2. Oil Extraction

The almond kernels were milled in an electrical grinder and about 5 g of each sample was extracted using a Soxhlet extractor with petroleum ether (40–60 °C) used as the solvent (AOAC 948.22:2000). After 8 h of extraction, the remaining solvent was evaporated by a rotary vacuum evaporator at 50 °C. The fat content (%) was determined as the difference in the weight of the dried sample before and after the extraction. The samples were sealed under a nitrogen blanket (an inert environment) so as to prevent oxidation. The dried samples obtained after the oil extraction were used to determine tocopherols.

2.3. Tocopherol Determination

The tocopherol concentrations were determined in the extracted kernel oil during the two consecutive years (2014–2015). The tocopherol determination was carried out using the HPLC (Waters M600E, Milford, MA, USA) on a reversed-phase Nucleosil 50-5 C18 column (Machery-Nagel, Düren, Germany) with fluorescence detection according to the procedure of [34] modified by [35]. The following procedures were applied: 20 mL of 96% v/v of ethanol, 0.12 g of pyrogallol, and 3 mL 50% KOH solution were added to 0.5 mL of the extracted oil, after which the solution was heated at 60 °C for 30 min with reflux and stirring. Once the saponification process was completed, the content was cooled and transferred to the volumetric flask (50 mL) and topped with ethanol. An aliquot of 5 mL was then transferred to the separation funnel and 5 mL of the cold deionized water and 5 mL of hexane were added. The mixture was vortex-shaken for 3 min and 4 mL of the hexane solution was then dried under a nitrogen blanket. The dry matter was then dissolved in 4 mL of methanol. The sample was then filtered using a membrane syringe filter and injected into the HPLC system. The mobile phase was 95% v/v methanol at a flow rate of 1.2 mL/min. Detection was performed with a fluorescence detector (Shimadzu RF-535, Kyoto, Japan) operated with an excitation wavelength of λ = 290 nm and an emission wavelength of λ = 330 nm. The relative retention time and the maximum values of absorption at the given relative retention time were used to identify tocopherols in the oil samples. The standards for individual tocopherols were obtained from Sigma Aldrich (St. Louis, MO, USA). The total chromatographic analysis time was 20 min. The signal processing was carried out by the ‘Clarify’ software. The content of the tocopherols was calculated based on a comparative analysis of the peaks of the standards and the samples. The tocopherol content determination was duplicated using 30 kernels of each genotype, reporting the average values.

2.4. The Analysis of the Minerals

Kernels were ground in a domestic electrical grinder until a fine flour was obtained. Inductively coupled plasma-atomic emission spectrometry (ICP-AES) provides a rapid and precise means of monitoring the elements simultaneously for minor- and trace-levels. The ICP-AES technique is broadly regarded as the most versatile analytical technique in the chemistry laboratory [36]. One gram of the milled sample and 5 mL HNO3 65% were added. A microwave furnace was used for the digestion and dissolution of the experimental samples. In this method, the samples were dissolved at 180 °C and 400 psi pressure in the apparatus. After a further 20-min processing, the samples were put into the 25 mL polyethylene flasks made up with deionized water. The metals were analyzed by ICP-AES (ICAP Series 600 Thermo Fisher scientific, Waltham, MA, USA). The calibration curves were constructed using a series of dilutions containing different levels of metals (0.005 mg/L to 2 mg/L). The reading was made at the emission wavelengths for zinc, manganese, iron, copper, chrome, and cobalt of 202.548, 257.610, 238.204, 324.754, 267.716 and 238.616 nm, respectively. The results were evaluated according to the iTEVA iCAP Software ICP Spectrometer, whereas a One-Sample t-test was used for the comparison of the metal values.
An ion chromatographic (IC) method was performed to determine Na+, K+, Mg2+ and Ca2+ in the corn silk samples. Wet micro-mineralization was applied for the sample preparation using PTFE pressure digestion vessels. Briefly, 200 mg of the powdered sample was digested with 2 mL of the concentrated HNO3. The vessels were sealed and heated for 6 h in an oven at 150 °C. The rest of the digestion was diluted with mineral-free water up to 25 mL. Before being injected into the chromatograph, the aliquots from the solutions had been filtered through a 0.22 µm membrane filter. The analysis was conducted using an ion chromatograph Dionex ICS 5000 + DP (Thermo Scientific, Waltham, MA, USA) equipped with a conductivity detector. The cations were separated using a Dionex Ion Pac™ CS12A—5 mm (3 mm × 150 mm) cation-exchange column with 20 mM methane sulfonic acid as a mobile phase at a flow rate of 0.5 mL/min. The working standard solutions were prepared by diluting a Fluka 1000 mg/L solutions. The identified cation peaks were confirmed and quantified by data acquisition and spectral evaluation using a Thermo Scientific Dionex Chromeleon 7.0. Chromatography Data System Software. The contents of Na+, K+, Mg2+ and Ca2+ are expressed as mg per 100 g of d.m.

2.5. Statistical Analysis

The data for all the measurements were expressed as a mean. A statistical analysis was performed using the StatSoft Statistica 10 software (StatSoft, Inc. STATISTICA, ver. 10, Hamburg, Germany, the data analysis software system). To test the mean differences, a variance analysis (one-way ANOVA) was performed, followed by Tukey’s HSD test at the significance level of p < 0.05. The ANOVA results show that the total variance of each trait was partitioned into a variance of the components associated with the cultivar and the year. Pearson’s correlation coefficient (r) was used to investigate the relationship between the morphologic traits, the mineral composition and the climatic conditions at a significance level of p < 0.05.

3. Results and Discussion

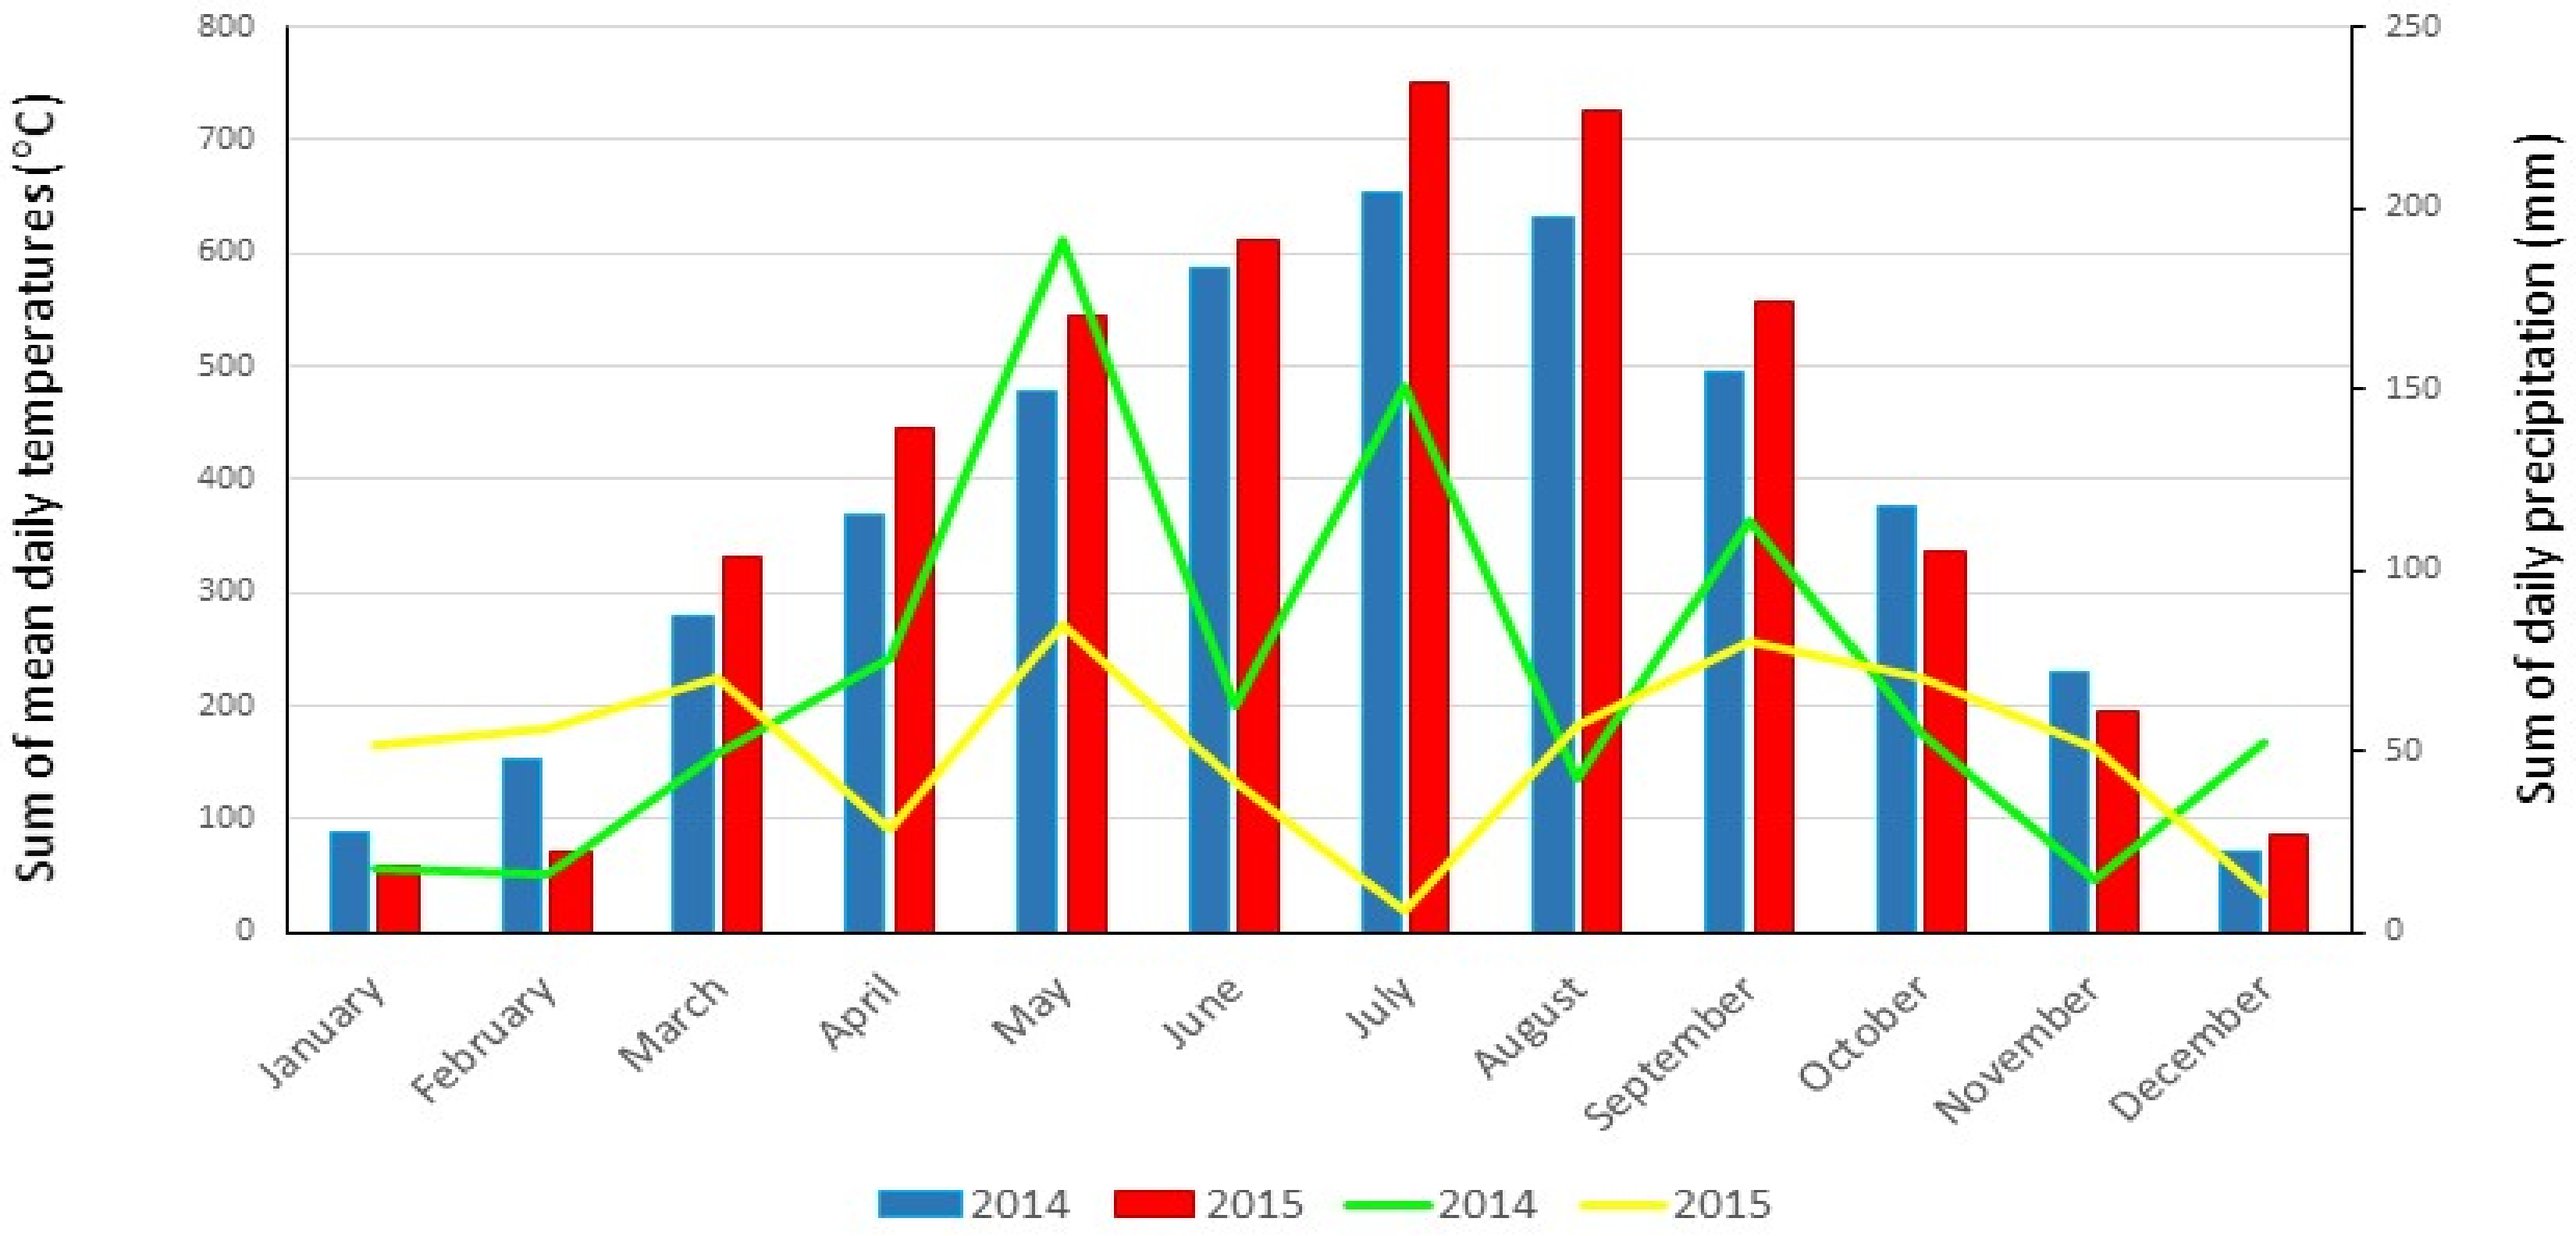
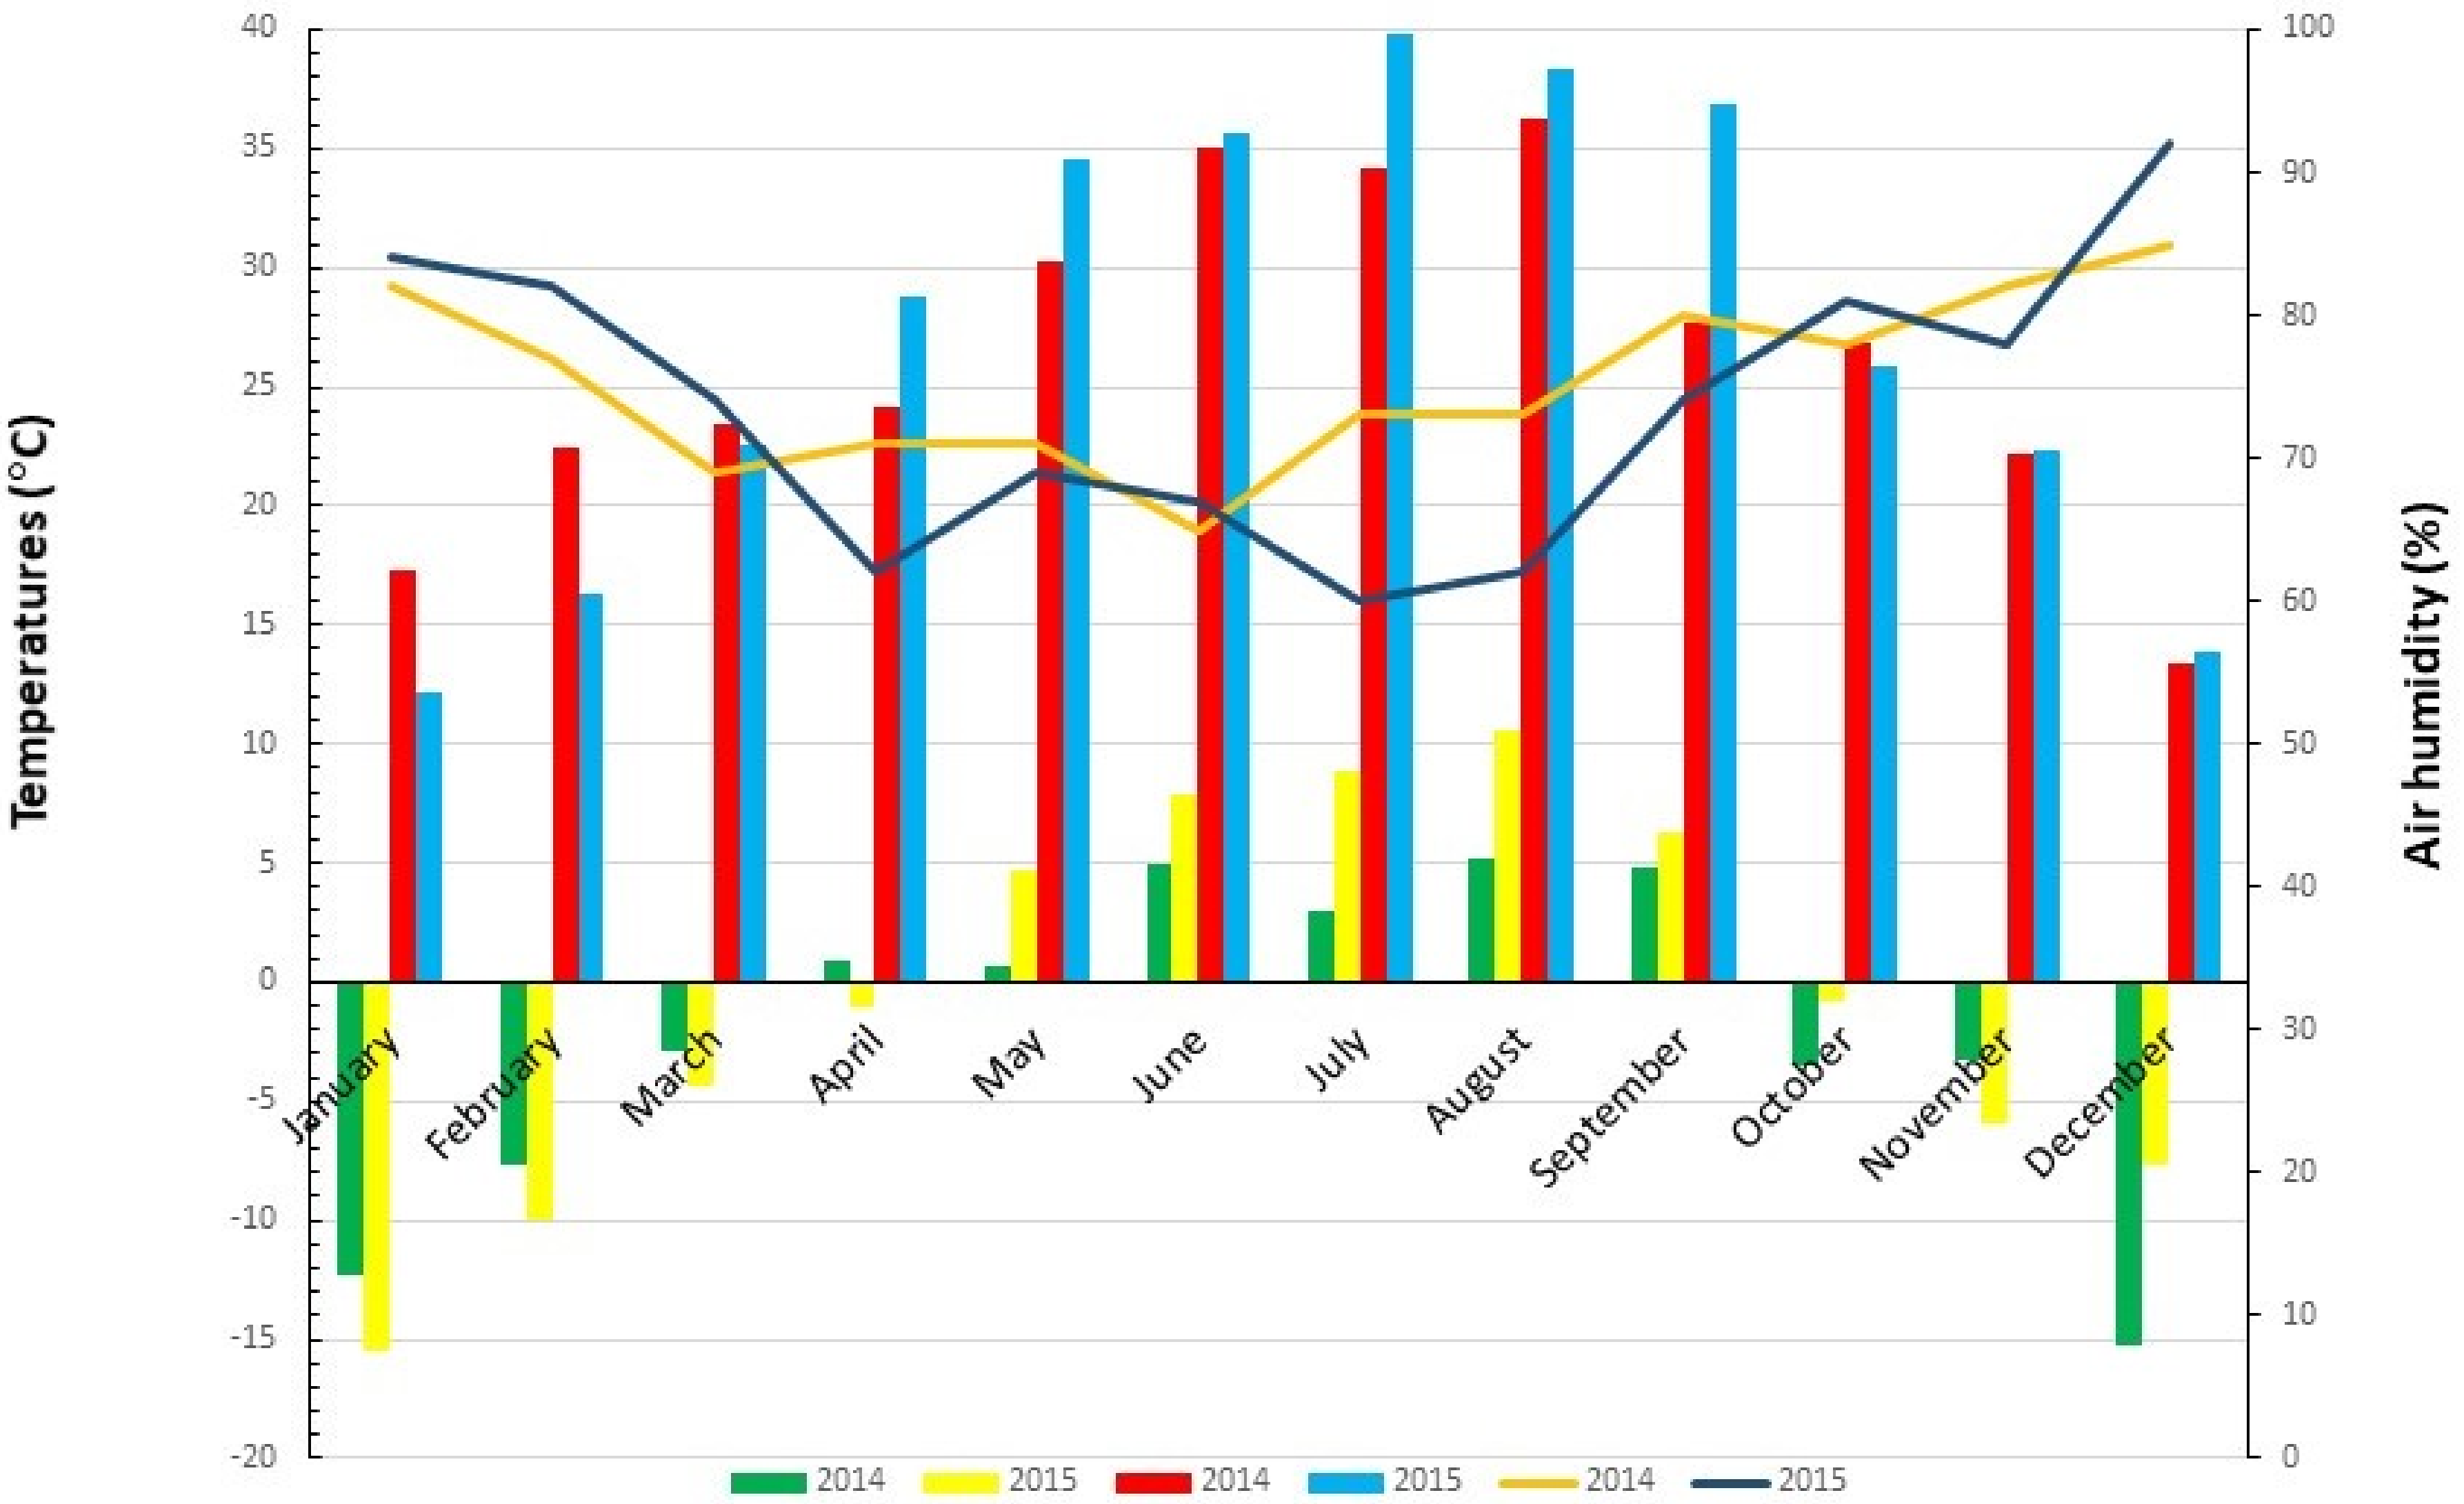
3.1. Meteorological Data

Weather conditions during the two-year experiment differed significantly. A much greater discrepancy between the ecological factors between the two years was noticed during the vegetation period (1 March–31 September). In this period in 2014, the mean average of the daily temperatures was 16.3 °C, whereas in 2015 the average daily temperature was 17.8 °C. Precipitation (685.6 mm) was ~2-fold higher in 2015 compared with 2014 (369.4 mm). The driest and the hottest month during the study was July 2015, with precipitation of only 6.2 mm (26 days without rain) and 22 days with a temperature above 30 °C.
As elaborated in a previous study [37], the climatic parameters during the 2014 experimental season were considered to be favorable for almond growing, whereas the year 2015 was warmer and drier, characterized by a significantly greater sum of the daily temperatures and the temperature maximum lower rainfalls (Figure 1 and Figure 2).

3.2. The Kernel Morphological Traits

To meet industrial requirements and consumer desires, almond nuts should have high-quality attributes [24]. Quality is largely designated by the physical attributes such as the thickness, length and width of the nut and kernels, such attributes being directly related to weight [38].
Weight is the primary quality parameter which designates the market value of almonds. In this study (Table 3), kernel weight varied among the genotypes from 0.76 (5/03) to 1.25 g (‘Texas’), which was in a range from 0.5 to 1.5 g as reported by [6]. In comparison with the kernel weight, the measurements showed a lower genotype variability (Table 3), which corresponds with the literature data [39]. On the contrary, the kernel ratio showed a considerable variability ranging from 17.2 (18/03) to 32.7% (‘Texas’). Although the year 2015 was unfavorable for almond growing, no significant statistical difference was observed for the kernel weight, length, width and thickness, while the almonds harvested in 2015 had a statistically lower kernel ratio compared with 2014. Our findings were in agreement with the recent studies of [40,41], in which no significant differences were reported in terms of kernel weight and yield when regulated-deficit irrigation and low-frequency deficit irrigation were applied during the kernel-filling period, respectively; this is comparable with the low precipitation during the summer of 2015 in our study (Figure 1).

3.3. The Oil Content and the Tocopherol Composition

A considerable variability of the oil content in the commercial and local almond cultivars/selections was reported, ranging from 35% to 66.1% of the fresh kernel weight, and from 20% to 67.5% of the kernel dry weight [25,26,42,43,44,45]. In this study, the genotypes showed a relatively small variation in oil concentration (Table 4), the highest value having been found in ‘Texas’ (60.07%). Except for the genotype A/04, the other Serbian genotypes had a statistically lower oil concentration. The almonds harvested in 2014 had a higher oil content in comparison with those of 2015, which was characterized by lower rainfall and higher temperatures.
Our results are in agreement with the previous, above-mentioned studies as well as with [46], who reported that the oil content appeared to be under polygenic control and hugely affected by environmental conditions. Throughout the study, both the genotype and the climatic conditions significantly affected the oil content (Table 4). The effect of the drought stress on the decrease in the oil percentage in almond kernels and its composition was also observed in the study of [37].
The tocopherol composition in the analyzed almond genotypes showed a high variability (Table 4) with a significant effect of the genotype and the year. As far as the genotypic variability is concerned, the concentration of the total tocopherols ranged between 50.2 mg/kg oil for the genotype 24/03 and 424.1 mg/kg oil for the genotype 15/03. As expected, α-tocopherol was the homologue with the highest concentration, followed by β + γ-tocopherol and δ-tocopherol, which is in accordance with the previous results of [46] reported in the other almond cultivars and selections. The concentration of α-tocopherol ranged between 39.4 mg/kg oil in the genotype 24/03 and 404.4 mg/kg in 15/03. The other tocopherol homologues were present in lower amounts. The concentration of δ-tocopherol showed a range from 2.5 mg/kg in the genotype 24/03 and A/04 to 6.2 mg/kg in 18/03. This variability range is in agreement with the literature summarized by [24] and reviewed by [26], which showed a large variability in the content of individual tocopherols in almond oil (21.3–656.7 mg/kg for α-, 2.4–77.87 for γ- and 0.1–22 for δ-tocopherol). In comparison with ‘Texas’, a higher level of total tocopherols and the α-homologue was noticed in the genotypes A/04 and 15/03, whereas the concentration of δ-tocopherol was higher in the genotypes 15/03 and 18/03. Those genotypes with a high tocopherol concentration, especially 15/03, could be interesting for an introduction to production due to the growing demand for food that has health-promoting compounds as a source of functional foods and prebiotics [47].
The climatic conditions, temperature and precipitation affected the concentration of the different tocopherol homologues (Table 4). Drought and heat were the most important stresses affecting the tocopherol content in the almond [24,37]. Our study showed that the climatic conditions during the fruit growth of 2015 had led to an increase in the level of the total tocopherols and homologues, which supports the previous findings. An exception to this was observed for 18/03, which showed the opposite trend compared with the other genotypes. The tocopherol level increased in response to the variety of abiotic stresses, thus being considered as the evidence of its protective role [48].

3.4. Mineral Composition

The almond kernel is considered to be a good source of mineral elements that play an important role for human health [25]. The main almond minerals include potassium, phosphorus, magnesium, calcium, coper, iron, zinc, selenium, and sodium [49]. Amorello et al. (2016) have also reported on the lithium, strontium and aluminum contents in 21 almond samples taken from three different geographical origins. The minerals K, P, Ca and Mg were thought to be important minerals due to their abundance and their perceived health effects. Calcium, K and the absence of Na in almonds may favorably affect the total dietary levels of these nutrients and work in coordination to decrease the risk of cardiovascular diseases, specifically hypertension [49,50].
The amount of the minerals that significantly varied among the genotypes are shown in Table 5 and Table 6. Analysis of the results indicates that potassium was predominant in all the genotypes, varying from 882.0 (A/04) to 1104.5 mg/100 g (15/03), which is important given the fact that K is necessary for all living cells to be able to function and regulates blood pressure in the body. Following in descending order, phosphorus ranged from 538.0 (A/04) to 656.5 mg/100 g (24/03), magnesium from 297.5 (25/03) to 371.0 mg/100 g (23/03) and calcium from 276.0 (25/03) to 354.5 mg/100 g (Texas). The results obtained for K, P, Mg and Ca are in line with the literature data summarized by [25].
Exceptionally, the values for Na obtained in our study ranged from 91.5 (18/03) to 182.0 mg/100 g (24/03) and were much greater than previous results reported by other authors [12,15,51] for almond genotypes from Italy, Turkey and Iraq, respectively. In comparison with ‘Texas’, some genotypes originating from Serbia showed a significantly higher level of K (15/03), Mn (15/03, 24/03) and P (24/03, 25/03), whereas the concentration of Na was significantly lower in the genotype 18/03 (91.5 mg/100 g). The highest concentration of Ca was recorded for ‘Texas’ (354.5 mg/100 g). the data obtained for the macronutrients were greater than the data observed by [18] in the ‘Texas’ grown in California, especially for K. All the macro-elements under high temperature and water stress in 2015 showed significantly reduced values. Similarly, the results for Ca and Mg were reported by [52], while K increased with water stress in their study.
The composition of heavy metals in foods is important because of their essential or toxic nature. For example, iron, zinc, copper, chromium, cobalt, and manganese are essential, whereas lead, cadmium, nickel, and mercury are toxic at certain levels [53]. The metals generally regarded as nutritionally essential for humans are cobalt, chromium, copper, iron, manganese, molybdenum, selenium, and zinc. Since diet is a major source of heavy metal exposure, it is important to monitor the intake of these heavy metals in order to quantify them. The levels of heavy metals are very important in almond nuts due to their increasing role in human nutrition.
Regarding the microelements (Table 6), the amount of iron ranged from 3.095 (A/04) to 3.708 mg/100 g (15/03) and of zinc from 2.641 (A/04) to 4.765 mg/100 g (15/03), which were found to be much greater than the amounts of the other metals. These other metals were, in descending order, manganese [1.079 (25/03) to 2.056 mg/100 g (24/03)], copper [0.891 (A/04) to 1.148 mg/100 g (23/03)], and molybdenum [less than 1 mg/100 g].
As expected, drought induced an Fe deficiency, in contrast to results observed by [52], probably given the fact that water stress was below the limit needed to reduce the production of the microelements. Contrary to their findings, our study showed that different climate conditions had not affected the Zn content. Although [15] reported that the amount of chromium in the almonds grown in Iraq was much greater than the amount of the other heavy metals, the present study reveals the opposite along with the lowest amount of all the minerals (below 0.1 mg/100 g).
Regarding the influence of the genotype on the microelement content, significant differences were found. The biggest difference was observed for Mo, whereas the lowest fluctuation was observed for Fe. The content of heavy metals in 56 g of kernel (the daily recommended consumption of almonds [54]), in all the samples was below the data for the daily dietary reference intake shown in Table 7, having no health risk for consumers.
The minerals contained in the plant tissue are taken by plants from the soil and from water; due to this, and apart from the genotype, environmental factors and agronomical practices (the location, the soil composition, the water source, irrigation, the fertilizer, rootstock) are responsible for the mineral content in the kernel. It has been previously reported that drought conditions reduced the mineral content transport from root to shoot [55]. Our results are in agreement with that report since the effect of the year was observed for all the minerals, with the exception of the Cr, Zn and Mo amounts. All the macro-elements, Cu, Fe and Mn showed a significant reduction in 2015, characterized by a water deficit and temperatures higher than those in 2014. The opposite reaction was observed for Cu and Zn, whose concentrations were increased in a similar fashion with the results of [56] in pistachio nuts. Concerning the different genotype effect on the mineral concentration, the variability of the major mineral was lower than that for the minor components.

3.5. The Genotype and Year Interactions

The analysis of the variance showed significant genotype × year interactions, indicating the importance of all the components in the expression of the kernel morphology and the biochemical parameter traits of the almond (Table 3, Table 4, Table 5 and Table 6). A significant cultivar × year interaction indicated a similar genotypic behavior in relation to the environment, thus reflecting a higher total tocopherol level, higher levels of all the homologues, as well as higher Fe and Zn amounts and lower content of the macro-elements Cr, Fe, Mn and Mo in the unfavorable climatic conditions during 2015. Based on the observed data, the selections 18/03 and 25/03 were adapted to the unfavorable growing conditions in the year 2015 in a better way since they showed no variability in the total tocopherols and the content of K and Cr in comparison with 2014.

3.6. Correlation Analysis

The Pearson correlation coefficients (r) among the physical characteristics, some chemical traits of the almond kernel and the climatic parameters of the two different years are accounted for in Tables S1–S6. Except for the same positive correlation in both the year 2014 and the year 2015 between the annual sum of mean daily relative humidity and the chromium content in the kernel (r = −0.85 and r = −0.71, respectively), no other correlation could be overlapped between those two different years.
Regarding the morphological traits in the year 2014, when the climatic conditions were optimal, the kernel thickness was negatively correlated with the sum of mean daily relative humidity during vegetation period (r = −0.78), whereas the kernel length was positively correlated with the annual sum of mean daily relative humidity (r = 0.76). In the second year, when the temperatures were much higher and combined with low precipitation, only the kernel thickness was positively correlated with the average daily relative humidity during vegetation period (r = 0.85). No reduction in the kernel weight and size with the water stress reported by [57], or the existence of the correlations among the kernel rate and precipitation reported by [58] in Prunus scoparia, were observed, which is probably due to different environmental conditions of the experimental site which included soil and rootstock.
In the year 2014, δ-tocopherol content was positively correlated with the annual sum of mean daily temperatures (r = 0.85) but negatively correlated with the annual average daily relative humidity (r = −0.71). The oil content was positively correlated with the sum of mean daily temperatures during vegetation period (r = 0.73) and the annual sum of precipitation (r = 0.71), but was negatively correlated with the sum of mean daily relative humidity during vegetation period (r = −0.80). Based on the results of [24,59], correlation between the total tocopherols and the sum of mean daily temperatures during vegetation period was expected, but was not observed, something which can connected with how the applied level of stress may have not been strong enough to affect the tocopherol accumulation.
Regarding the correlations between mineral content and the climatic parameters in the year 2014 (with the favorable climatic conditions), a positive correlation was observed among the sum of precipitation during vegetation period and the content of Ca (r = 0.82), probably due to a higher root uptake. Also, a positive correlation was observed among the annual sum of mean daily temperatures and the content of Cu (r = 0.88), and the sum of mean daily relative humidity during vegetation period and the content of Fe (r = 0.83), and Mo (r = 0.85). The opposite negative correlation was recorded between the annual sum of precipitation and the content of Fe (r = −0.75), just as between the annual sum of mean daily relative humidity and Cr (r = −0.85). For the year 2015, characterized by higher temperatures and lower precipitation, a positive correlation was observed among the sum of precipitation during vegetation and the contents of Cr and Fe (r = 0.82 and 0.85, respectively), among the annual sum of precipitation and the content of Mn (r = 0.73), and between average daily relative humidity during vegetation period and Ca (r = 0.83). On the contrary, the sum of mean daily temperatures during vegetation was negatively correlated with the content of K and Na (r = −0.80 and −0.78, respectively), the sum of mean daily relative humidity during vegetation period was negatively correlated with the content of Ca and P (r = −0.81 and −0.78, respectively), and the annual sum of mean daily relative humidity was negatively correlated with the content of Ca and Cr (r = −0.77 and −0.71, respectively). The reduction in Ca in 2015 was positively correlated with the kernel weight and the kernel ratio (r = 0.77), whereas the content of Zn was negatively correlated with the kernel thickness (r = −0.80). The remaining correlations between the mineral content and the kernel characteristics were insignificant. There is scarce literature to support the correlations between the mineral content and the climatic parameters, whereas those that do exist [60] do not provide enough information about the climatic parameters, soil and rootstock needed for comparison.

4. Conclusions

This study is a comprehensive analysis of the effect of changing climatic conditions on the kernel morphological traits and the chemical composition of the almonds grown in Serbia. As a general conclusion, the fact that low precipitation and high summer temperatures increased the content of tocopherols, Cu and Zn, and decreased the oil content, the level of the macro- and microelements Cr, Fe, Mn and Mo in almond kernels can be highlighted. No kernel morphological traits (except for the kernel ratio) were affected by climatic change. The obtained data indicate some statistically significant correlations among the kernel quality parameters and climate, which can be useful both for breeders and for producers.
Based on the results, the almonds from Serbia were shown to be a good source of tocopherols and minerals, some being even richer in the majority parameters than ‘Texas’. The main detected tocopherol homologue was α-tocopherol, accounting for over 90% of the total tocopherols. Analysis of the macro-elements showed that the amount of potassium was found to be the highest. On the other hand, the micro-elements were present in very low concentrations. The most abundant were Fe and Zn, while Cr was only present only traces. The statistically significant differences in tocopherol and mineral contents and composition were affected by the genotype, the climatic conditions, and their interaction. Taking into consideration it’s health promoting compounds and almond’s shelf time, genotype 15/03 was characterized by the highest level of α-tocopherol, potassium and zinc, so this selection could be included in further breeding programs. The genotypes 18/03 and 25/03 that showed the stability of the total tocopherols and the content of K can be grown in drought conditions without a significant loss of the kernel quality.
From a practical point of view, this research has contributed to an overall understanding of how a climatic condition may affect the kernel quality. This underlines the importance of the evaluation of the local almond germplasm in order to select the genotypes that are more resilient to climatic change, while simultaneously ensuring balanced nutritional components and a health interest. Regarding climate change and global warming, this study has proven the fact that irrigation systems are needed in order to improve the fruit quality if the production site does not provide favorable growing conditions. Therefore, the implementation of adaptation strategies, especially those related to irrigated agriculture in semiarid regions, is urgent.

Supplementary Materials

The following supporting information can be downloaded at: https://www.mdpi.com/article/10.3390/horticulturae8060487/s1, Supplementary Tables S1–S6: The Pearson correlation coefficients (R) among physical characteristics, some chemical traits of the almond kernel and the climatic parameters.

Author Contributions

Conceptualization, S.Č. and M.F.A.; data curation, G.Z. and I.B.; investigation, S.Č., G.Z., I.B. and D.R.; methodology, S.Č. and V.M.S.; resources, Zorica Basić; supervision, S.Č.; validation, Z.B.; writing—original draft, S.Č., Z.B., M.F.A. and V.M.S.; writing—review & editing, S.Č. and M.F.A. All authors have read and agreed to the published version of the manuscript.

Funding

This research study was funded by the Ministry of Education, Science and Technological Development of the Republic of Serbia as a part of the contract of the implementation and financing of scientific research in 2021 between the Institute for the Application of Science in Agriculture, Belgrade, and the Ministry of Education, Science and Technological Development of the Republic of Serbia (Contract number: 451-03-68/2022-14/200045).

Institutional Review Board Statement

Not applicable.

Informed Consent Statement

Not applicable.

Data Availability Statement

Not applicable.

Conflicts of Interest

The authors declare no conflict of interest.

References

  1. Richardson, D.P.; Astrup, A.; Cocaul, A.; Ellis, P. The Nutritional and Health Benefits of Almonds: A Healthy Food Choice. Food Sci. Technol. Bull. Funct. Foods 2009, 6, 41–50. [Google Scholar] [CrossRef]
  2. Beyhan, Ö.; Aktaş, M.; Yilmaz, N.; Şimşek, N.; Gerçekçioǧlu, R. Determination of Fatty Acid Compositions of Some Important Almond (Prunus amygdalus L.) Varieties Selected from Tokat Province and Eagean Region of Turkey. J. Med. Plant Res. 2011, 5, 4907–4911. [Google Scholar]
  3. Jenkins, D.J.A.; Kendall, C.W.C.; Marchie, A.; Josse, A.R.; Nguyen, T.H.; Faulkner, D.A.; Lapsley, K.G.; Singer, W. Effect of Almonds on Insulin Secretion and Insulin Resistance in Nondiabetic Hyperlipidemic Subjects: A Randomized Controlled Crossover Trial. Metabolism 2008, 57, 882–887. [Google Scholar] [CrossRef]
  4. Vadivel, V.; Kunyanga, C.N.; Biesalski, H.K. Health Benefits of Nut Consumption with Special Reference to Body Weight Control. Nutrition 2012, 28, 1089–1097. [Google Scholar] [CrossRef] [PubMed]
  5. Ouzir, M.; El Bernoussi, S.; Tabyaoui, M.; Taghzouti, K. Almond Oil: A Comprehensive Review of Chemical Composition, Extraction Methods, Preservation Conditions, Potential Health Benefits, and Safety. Compr. Rev. Food Sci. Food Saf. 2021, 20, 3344–3387. [Google Scholar] [CrossRef]
  6. Socias i Company, R.; Alonso, J.M.; Kodad, O. Fruit Quality in Almond: Physical Aspects for Breeding Strategies. Acta Hortic. 2009, 814, 475–480. [Google Scholar] [CrossRef]
  7. Godini, A. Almond Fruitfulness and Role of Self-Fertility. In Acta Horticulturae; International Society for Horticultural Science (ISHS): Leuven, Belgium, 2002; pp. 191–203. [Google Scholar] [CrossRef]
  8. Gradziel, T.M. Almond (Prunus dulcis) Breeding BT—Breeding Plantation Tree Crops: Temperate Species; Gradziel, T.M., Ed.; Springer: New York, NY, USA, 2009; pp. 1–31. [Google Scholar] [CrossRef]
  9. Kester, D.E.; Kader, A.A.; Cunningham, S.A. Almonds. In Encyclopedia of Food Sciences and Nutrition, 2nd ed.; Caballero, B., Finglas, P.M., Trugo, L.C., Eds.; Academic Press: Oxford, UK, 2003; pp. 150–155. [Google Scholar] [CrossRef]
  10. Kester, D.E.; Micke, W.C.; Rough, D.; Morrison, D.; Curtis, R. Almond Variety Evaluation. Calif. Agric. 1980, 34, 4–7. [Google Scholar]
  11. Socias i Company, R.; Ansón, J.M.; Espiau, M.T. Taxonomy, Botany and Physiology. Almonds Bot. Prod. Uses 2017, 1–42. [Google Scholar] [CrossRef]
  12. Şimşek, M.; Kizmaz, V. Determination of Chemical and Mineral Compositions of Promising Almond (Prunus amygdalus L.) Genotypes from Beyazsu (Mardin) Region. Int. J. Agri. Wild Sci. 2017, 3, 6–11. [Google Scholar]
  13. Rabadán, A.; Álvarez-Ortí, M.; Gómez, R.; Pardo-Giménez, A.; Pardo, J.E. Suitability of Spanish Almond Cultivars for the Industrial Production of Almond Oil and Defatted Flour. Sci. Hortic. 2017, 225, 539–546. [Google Scholar] [CrossRef]
  14. Roncero, J.M.; Álvarez-Ortí, M.; Pardo-Giménez, A.; Rabadán, A.; Pardo, J.E. Review about Non-Lipid Components and Minor Fat-Soluble Bioactive Compounds of Almond Kernel. Foods 2020, 9, 1646. [Google Scholar] [CrossRef] [PubMed]
  15. Mahmoud, K.M.; Yasin, R.T. Quantitative Analysis of Some Metals in Almond Kernel in Erbil City. Int. J. Pharma Sci. Res. 2016, 7, 32–37. [Google Scholar]
  16. He, F.J.; MacGregor, G.A. Beneficial Effects of Potassium on Human Health. Physiol. Plant. 2008, 133, 725–735. [Google Scholar] [CrossRef]
  17. Bird, R.P.; Eskin, N.A.M. Chapter Two—The Emerging Role of Phosphorus in Human Health. In The Latest Research and Development of Minerals in Human Nutrition; Eskin, N.A.M., Ed.; Advances in Food and Nutrition Research; Academic Press: Cambridge, MA, USA, 2021; Volume 96, pp. 27–88. [Google Scholar] [CrossRef]
  18. Yada, S.; Huang, G.; Lapsley, K. Natural Variability in the Nutrient Composition of California-Grown Almonds. J. Food Compos. Anal. 2013, 30, 80–85. [Google Scholar] [CrossRef] [Green Version]
  19. Mehri, A. Trace Elements in Human Nutrition (II)—An Update. Int. J. Prev. Med. 2020, 11, 2. [Google Scholar] [CrossRef]
  20. Moodley, R.; Kindness, A.; Jonnalagadda, S.B. Elemental Composition and Chemical Characteristics of Five Edible Nuts (Almond, Brazil, Pecan, Macadamia and Walnut) Consumed in Southern Africa. J. Environ. Sci. Health -Part B Pestic. Food Contam. Agric. Wastes 2007, 42, 585–591. [Google Scholar] [CrossRef]
  21. Chen, C.-Y.; Lapsley, K.; Blumberg, J. A Nutrition and Health Perspective on Almonds. J. Sci. Food Agric. 2006, 86, 2245–2250. [Google Scholar] [CrossRef]
  22. Stuetz, W.; Schlörmann, W.; Glei, M. B-Vitamins, Carotenoids and α-/γ-Tocopherol in Raw and Roasted Nuts. Food Chem. 2017, 221, 222–227. [Google Scholar] [CrossRef]
  23. Rizvi, S.; Raza, S.T.; Ahmed, F.; Ahmad, A.; Abbas, S.; Mahdi, F. The Role of Vitamin E in Human Health and Some Diseases. Sultan Qaboos Univ. Med. J. 2014, 14, 157–165. [Google Scholar]
  24. Kodad, O.; Socias i Company, R.; Alonso, J.M. Genotypic and Environmental Effects on Tocopherol Content in Almond. Antioxidants 2018, 7, 6. [Google Scholar] [CrossRef] [PubMed] [Green Version]
  25. Kodad, O. Chemical Composition of Almond Nuts. In Almonds Botany, Production and Uses; Socias i Company, R., Gradziel, T.M., Eds.; CAB International: Wallingford, UK, 2017; pp. 428–448. [Google Scholar]
  26. Čolić, S.; Zec, G.; Natić, M.; Fotirić-Akšić, M. Almond (Prunus dulcis) Oil. In Fruit Oils: Chemistry and Functionality; Ramadan, M.F., Ed.; Springer International Publishing: Cham, Switzerland, 2019; pp. 149–180. [Google Scholar] [CrossRef]
  27. Zacheo, G.; Cappello, M.S.; Gallo, A.; Santino, A.; Cappello, A.R. Changes Associated with Post-Harvest Ageing in Almond Seeds. LWT-Food Sci. Technol. 2000, 33, 415–423. [Google Scholar] [CrossRef]
  28. García-Pascual, P.; Mateos, M.; Carbonell, V.; Salazar, D.M. Influence of Storage Conditions on the Quality of Shelled and Roasted Almonds. Biosyst. Eng. 2003, 84, 201–209. [Google Scholar] [CrossRef]
  29. Aslanta, R.; Güleryüz, M.; Turan, M. Some Chemical Contents of Selected Almond (Prunus amygdalus Batsch) Types. Cah. Options Méditerranéennes 2001, 56, 93–96. [Google Scholar]
  30. Drogoudi, P.D.; Pantelidis, G.; Bacchetta, L.; De Giorgio, D.; Duval, H.; Metzidakis, I.; Spera, D. Protein and Mineral Nutrient Contents in Kernels from 72 Sweet Almond Cultivars and Accessions Grown in France, Greece and Italy. Int. J. Food Sci. Nutr. 2013, 64, 202–209. [Google Scholar] [CrossRef] [PubMed]
  31. Goldhamer, D.A.; Fereres, E. Establishing an Almond Water Production Function for California Using Long-Term Yield Response to Variable Irrigation. Irrig. Sci. 2017, 35, 169–179. [Google Scholar] [CrossRef]
  32. López-López, M.; Espadador, M.; Testi, L.; Lorite, I.J.; Orgaz, F.; Fereres, E. Water Use of Irrigated Almond Trees When Subjected to Water Deficits. Agric. Water Manag. 2018, 195, 84–93. [Google Scholar] [CrossRef]
  33. Čolić, S.D.; Fotirić Akšić, M.M.; Lazarević, K.B.; Zec, G.N.; Gašić, U.M.; Dabić Zagorac, D.; Natić, M.M. Fatty Acid and Phenolic Profiles of Almond Grown in Serbia. Food Chem. 2017, 234, 455–463. [Google Scholar] [CrossRef] [Green Version]
  34. Carpenter, A.P. Determination of Tocopherols in Vegetable Oils. J. Am. Oil Chem. Soc. 1979, 56, 668–671. [Google Scholar] [CrossRef]
  35. Rabrenović, B.B.; Demin, M.A.; Basić, M.G.; Pezo, L.L.; Paunović, D.M.; Sovtić, F.S. Impact of Plum Processing on the Quality and Oxidative Stability of Cold-Pressed Kernel Oil. Grasas Aceites 2021, 72, 4–11. [Google Scholar] [CrossRef]
  36. Bingöl, M.; Yentür, G.; Er, B.; Öktem, A.B. Determination of Some Heavy Metal Levels in Soft Drinks from Turkey Using ICP-OES Method. Czech J. Food Sci. 2010, 28, 213–216. [Google Scholar] [CrossRef] [Green Version]
  37. Čolić, S.D.; Bakić, I.V.; Dabić Zagorac, D.; Natić, M.M.; Smailagić, A.T.; Pergal, M.V.; Pešić, M.B.; Milinčić, D.D.; Rabrenović, B.B.; Fotirić Akšić, M.M. Chemical Fingerprint and Kernel Quality Assessment in Different Grafting Combinations of Almond Under Stress Condition. Sci. Hortic. 2021, 275, 109705. [Google Scholar] [CrossRef]
  38. Imani, A.; Shamili, M. Almond Nut Weight Assessment by Stepwise Regression and Path Analysis. Int. J. Fruit Sci. 2018, 18, 338–343. [Google Scholar] [CrossRef]
  39. Sorkheh, K.; Shiran, B.; Khodambashi, M.; Moradi, H.; Gradziel, T.M.; Martínez-Gómez, P. Correlations between Quantitative Tree and Fruit Almond Traits and Their Implications for Breeding. Sci. Hortic. 2010, 125, 323–331. [Google Scholar] [CrossRef]
  40. García-Tejero, I.F.; Gutiérrez-Gordillo, S.; Ortega-Arévalo, C.; Iglesias-Contreras, M.; Moreno, J.M.; Souza-Ferreira, L.; Durán-Zuazo, V.H. Thermal Imaging to Monitor the Crop-Water Status in Almonds by Using the Non-Water Stress Baselines. Sci. Hortic. 2018, 238, 91–97. [Google Scholar] [CrossRef]
  41. Gutiérrez-Gordillo, S.; Durán-Zuazo, V.H.; García-Tejero, I. Response of Three Almond Cultivars Subjected to Different Irrigation Regimes in Guadalquivir River Basin. Agric. Water Manag. 2019, 222, 72–81. [Google Scholar] [CrossRef]
  42. Abaspour, M.; Imani, A.; Hassanlo, T. Effects of Almond Genotype and Growing Location on Oil Percentage and Fatty Acid Composition of Its Seeds. J. Nuts 2012, 3, 5–12. [Google Scholar]
  43. Maestri, D.; Martínez, M.; Bodoira, R.; Rossi, Y.; Oviedo, A.; Pierantozzi, P.; Torres, M. Variability in Almond Oil Chemical Traits from Traditional Cultivars and Native Genetic Resources from Argentina. Food Chem. 2015, 170, 55–61. [Google Scholar] [CrossRef]
  44. Zhu, Y.; Taylor, C.; Sommer, K.; Wilkinson, K.; Wirthensohn, M. Influence of Deficit Irrigation Strategies on Fatty Acid and Tocopherol Concentration of Almond (Prunus dulcis). Food Chem. 2015, 173, 821–826. [Google Scholar] [CrossRef]
  45. Zamany, A.J.; Samadi, G.R.; Kim, D.H.; Keum, Y.S.; Saini, R.K. Comparative Study of Tocopherol Contents and Fatty Acids Composition in Twenty Almond Cultivars of Afghanistan. JAOCS J. Am. Oil Chem. Soc. 2017, 94, 805–817. [Google Scholar] [CrossRef]
  46. Kodad, O.; Estopañán, G.; Juan, T.; Alonso, J.M.; Espiau, M.T.; Socias i Company, R. Oil Content, Fatty Acid Composition and Tocopherol Concentration in the Spanish Almond Genebank Collection. Sci. Hortic. 2014, 177, 99–107. [Google Scholar] [CrossRef]
  47. Barreca, D.; Nabavi, S.M.; Sureda, A.; Rasekhian, M.; Raciti, R.; Silva, A.S.; Annunziata, G.; Arnone, A.; Tenore, G.C.; Süntar, İ.; et al. Almonds (Prunus dulcis Mill. D. A. Webb): A Source of Nutrients and Health-Promoting Compounds. Nutrients 2020, 12, 672. [Google Scholar] [CrossRef] [PubMed] [Green Version]
  48. Munné-Bosch, S.; Alegre, L. The Function of Tocopherols and Tocotrienols in Plants. CRC Crit. Rev. Plant Sci. 2002, 21, 31–57. [Google Scholar] [CrossRef]
  49. Yada, S.; Lapsley, K.; Huang, G. A Review of Composition Studies of Cultivated Almonds: Macronutrients and Micronutrients. J. Food Compos. Anal. 2011, 24, 469–480. [Google Scholar] [CrossRef]
  50. Ros, E. Health Benefits of Nut Consumption. Nutrients 2010, 2, 652–682. [Google Scholar] [CrossRef] [Green Version]
  51. Amorello, D.; Orecchio, S.; Pace, A.; Barreca, S. Discrimination of Almonds (Prunus dulcis) Geographical Origin by Minerals and Fatty Acids Profiling. Nat. Prod. Res. 2016, 30, 2107–2110. [Google Scholar] [CrossRef]
  52. Lipan, L.; Cano-Lamadrid, M.; Hernández, F.; Sendra, E.; Corell, M.; Vázquez-Araújo, L.; Moriana, A.; Carbonell-Barrachina, Á.A. Long-Term Correlation between Water Deficit and Quality Markers in Hydrosostainable Almonds. Agronomy 2020, 10, 1470. [Google Scholar] [CrossRef]
  53. Onianwa, P.C.; Adetola, I.G.; Iwegbue, C.M.A.; Ojo, M.F.; Tella, O.O. Trace Heavy Metals Composition of Some Nigerian Beverages and Food Drinks. Food Chem. 1999, 66, 275–279. [Google Scholar] [CrossRef]
  54. Qi, Z.; Xiao, J.; Ye, L.; Chuyun, W.; Chang, Z.; Shugang, L.; Fenghong, H. The Effect of the Subcritical Fluid Extraction on the Quality of Almond Oils: Compared to Conventional Mechanical Pressing Method. Food Sci. Nutr. 2019, 7, 2231–2241. [Google Scholar] [CrossRef]
  55. Ahanger, M.A.; Morad-Talab, N.; Abd-Allah, E.F.; Ahmad, P.; Hajiboland, R. Plant Growth under Drought Stress: Significance of Mineral Nutrients. Water Stress Crop Plants A Sustain. Approach 2016, 2, 649–668. [Google Scholar] [CrossRef]
  56. Carbonell-Barrachina, Á.A.; Memmi, H.; Noguera-Artiaga, L.; del Carmen Gijón-López, M.; Ciapa, R.; Pérez-López, D. Quality Attributes of Pistachio Nuts as Affected by Rootstock and Deficit Irrigation. J. Sci. Food Agric. 2015, 95, 2866–2873. [Google Scholar] [CrossRef]
  57. Gutiérrez-Gordillo, S.; Lipan, L.; Durán-Zuazo, V.H.; Carbonell-Barrachina, Á.A.; Cárceles Rodríguez, B.; Rubio-Casal, A.E.; Carbonell-Bojollo, R.; Ordoñez-Fernández, R.; García-Tejero, I.F. Linking Sustainability and Competitiveness of Almond Plantations under Water Scarcity and Changing Climate. In Resources Use Efficiency in Agriculture; Kumar, S., Meena, R.S., Jhariya, M.K., Eds.; Springer Nature: Singapore, 2020. [Google Scholar] [CrossRef]
  58. Rahimi Dvin, S.; Gharaghani, A.; Pourkhaloee, A. Genetic Diversity, Population Structure, and Relationships among Wild and Domesticated Almond (Prunus Spp.) Germplasms Revealed by Issr Markers. Adv. Hortic. Sci. 2020, 34, 287–300. [Google Scholar] [CrossRef]
  59. Kodad, O.; Estopañán, G.; Juan, T.; Mamouni, A. Tocopherol Concentration in Almond Oil: Genetic Variation and Environmental Effects under Warm Conditions. J. Agric. Food Chem. 2011, 59, 6137–6141. [Google Scholar] [CrossRef] [PubMed]
  60. Ibourki, M.; Bouzid, H.A.; Bijla, L.; Aissa, R.; Sakar, E.H.; Ainane, T.; Gharby, S.; El Hammadi, A. Physical Fruit Traits, Proximate Composition, Fatty Acid and Elemental Profiling of Almond [Prunus dulcis Mill. DA Webb] Kernels from Ten Genotypes Grown in Southern Morocco. OCL-Oilseeds Fats Crop. Lipids 2022, 29, 9. [Google Scholar] [CrossRef]
Figure 1. The sum of the mean daily temperatures (bars) and the sum of the daily precipitation (lines) during the two experimental seasons (2014–2015).
Horticulturae 08 00487 g001
Figure 2. The temperatures (min, max; bars) and the air humidity (lines) during the two experimental seasons (2014–2015).
Horticulturae 08 00487 g002
Table 1. Reference information for climatic parameters (1 March–30 September).
YearTemperature (°C)Total Precipitation (mm)Sum of Daily Average Air Humidity (%)
Period AverageSum of Daily AverageMinMax
201416.33497−2.936.3685.6502
201517.83981−4.439.8369.4468
Table 2. The reference information for the climatic parameters (1 January–31 December).
YearTemperature (°C)Total Precipitation (mm)Sum of Daily Average Air Humidity (%)
Period AverageSum of Daily AverageMinMax
201412.94418−15.236.3841.6906
201512.14715−15.539.8609.6885
Table 3. The kernel morphological traits.
Genotype/YearWeight (g)Length (mm)Width (mm)Thickness (mm)Kernel Ratio (%)
‘Texas’1.25 a 127.0 bc13.6 ab7.8 a32.7 a
15/030.76 e26.7 bc11.7 c5.4 c18.2 cd
18/031.08 b27.8 ab12.7 bc5.9 bc17.2 d
23/031.00 c28.1 a12.0 bc6.4 b21.3 b
24/031.01 c25.7 cd14.2 a6.0 bc19.6 c
25/030.92 d24.1 d11.6 c6.6 b21.1 b
A/040.92 d23.4 d13.0 b6.5 b20.1 bc
20141.0225.312.66.723.7 a
20150.9726.912.76.119.3 b
‘Texas’ 20141.29 a26.5 bc13.97.9 a33.5 a
15/03 20140.85 d26.7 bc12.3 c5.6 c21.7 e
18/03 20141.12 b26.7 bc12.8 bc6.1 bc18.2 g
23/03 21041.05 bc27.8 ab12.0 c6.6 b22.9 e
24/03 20140.97 c23.7 cd13.2 b6.7 b24.1 c
25/03 20140.85 d22.3 cd10.8 d7.0 ab23.2 d
A/04 20141.00 c23.4 cd13.4 b6.8 b22.1 de
‘Texas’ 20151.22 a27.4 bc13.3 b7.7 a31.9 b
15/03 20150.68 e26.8 bc11.1 d5.2 c14.8 i
18/03 20151.04 c28.8 a12.6 c5.7 c16.1 h
23/03 20150.96 c28.3 a12.0 c6.2 bc19.8 f
24/03 20151.04 c27.8 ab15.2 a5.4 c15.1
25/03 20150.99 c25.8 d12.4 c6.2 bc19.1 f
A/04 20150.83 d23.3 cd12.6 c6.3 b18.1 g
1 The different letters in the columns indicate that there is a significant difference at p < 0.05.
Table 4. The oil content (%) and the composition of the tocopherols (mg/kg of DW).
Genotype/Yearα-Tocopherolβ + γTocopherolδ-TocopherolTotal TocopherolsOilContent
‘Texas’247.4 c 117.4 a3.9 d268.7 c59.4 a
15/03404.4 a15.1 b4.6 b424.1 a55.4 b
18/03212.4 d17.3 a6.2 a235.9 d50.3 c
23/0339.4 f8.5 e3.9 d51.8 f54.9 b
24/0339.8 f7.9 e2.5 e50.2 f52.4 c
25/03206.4 e10.3 d4.1 c220.8 e52.6 bc
A/04269.4 b12.9 c2.5 e284.8 b59.0 a
2014185.1 b11.6 b2.9 b199.6 b55.8 a
2015220.4 a13.9 a5.1 a239.4 a54.1 b
‘Texas’ 2014235.8 e18.1 b4.2 d258.1 e60.7 a
15/03 2014387.5 b18.5 b1.3 g407.3 b56.3 b
18/03 2014218.7 f14.1 e3.3 d236.1 f51.3 d
23/03 210432.5 j5.8 i3.3 e41.6 j55.8 bc
24/03 201426.5 j5.4 j0.0031.9 k53.2 c
25/03 2014204.2 g10.6 g4.9 c219.7 g53.6 c
A/04 2014190.1 h8.4 i3.0 e201.5 h59.7 a
‘Texas’ 2015258.9 d16.6 d3.7 de279.2 d59.4 a
15/03 2015421.4 a11.6 f7.9 b440.9 a54.5 bc
18/03 2015206.1 g20.4 a9.1 a235.6 f49.3 d
23/03 201545.9 i11.2 f4.6 cd61.7 i54.0 bc
24/03 201552.9 i10.5 g4.9 c68.5 i51.6 d
25/03 2015208.6 g9.9 h3.3 e221.8 g51.7 d
A/04 2015348.6 c17.5 c2.1 f368.2 c58.4 a
1 The different letters in the columns indicate that there is a significant difference at p < 0.05.
Table 5. The composition of the macro-elements (mg/100 g DW).
Genotype/YearPotassiumSodiumMagnesiumCalciumPhosphorus
‘Texas’1006.0 b 1156.0 b317.5 e354.5 a592.0 d
15/031104.5 a180.0 a339.5 c308.5 d614.5 c
18/03973.5 c91.5 d348.5 b296.0 e606.5 c
23/03972.5 c156.5 b371.0 a298.0 e575.0 b
24/03983.0 bc182.0 a350.5 b328.0 b656.5 b
25/03988.0 bc147.5 c327.0 d276.0 f702.5 a
A/04882.0 d148.0 c297.5 f319.0 c538.0 e
20141033.0 a177.6 a347.9 a351.6 a629.6 a
2015941.1 b125.7 b324.0 b271.3 b594.7 b
‘Texas’ 20141130 a156 c321 d349 ef563 ij
15/03 20141058 c205 b350 b398 h644 cd
18/03 2014978 d84 f364 b335 e634 de
23/03 21041096 b206 b460 a373 g593 g
24/03 20141088 b235 a335 c365 fg682 b
25/03 2014987 d158 c319 d279 c752 a
A/04 2014894 e199 b286 f362 f539 k
‘Texas’ 2015882 e156 c314 de360 f621 f
15/03 20151151 a155 b329 cd219 a585 gh
18/03 2015969 d99 e333 c257 b579 hi
23/03 2015849 f107 e282 f223 a557 j
24/03 2015878 ef129 d366 b291 d631 ef
25/03 2015989 d137 d335 c273 c653 c
A/04 2015870 ef97 e309 e276 c537 k
1 The different letters in the columns indicate that there is a significant difference at p < 0.05.
Table 6. The composition of the micro elements (mg/100 g of DW).
Genotype/YearChromiumCopperIronManganeseZinkMolybdenum
20140.0260.922 b3.523 a1.658 a3.3020.101
20150.0241.026 a3.340 b1.349 b3.3630.092
‘Texas’ 20140.031 b0.965 e0.031 e1.181 f2.829 j0.038 g
15/03 20140.026 c1.036 cd4.178 a2.510 a5.047 a0.133 d
18/03 20140.018 d0.949 e3.725 b1.637 d3.177 g0.225 a
23/03 21040.021 d1.050 bc3.453 d1.590 d3.255 f0.035 g
24/03 20140.031 b0.557 h3.523 c2.198 b2.987 h0.099 e
25/03 20140.035 a1.017 d3.444 d1.002 i3.424 d0.048 fg
A/04 20140.019 d0.878 f3.247 g1.489 e2.392 k0.131 d
‘Texas’ 20150.028 bc1.070 b0.028 ef1.419 c2.778 h0.033 e
15/03 20150.018 d0.994 d3.238 e1.457 ef4.483 b0.155 c
18/03 20150.020 d0.925 ef3.103 f0.935 i3.320 e0.178 b
23/03 20150.026 c1.246 a3.275 e1.296 g3.023 h0.021 h
24/03 20150.028 bc0.815 g3.658 c1.913 c3.767 c0.102 e
25/03 20150.032 ab1.231 a3.730 b1.155 h3.282 f0.057 f
A/04 20150.016 d0.904 f2.943 fg1.268 g2.889 i0.101 e
1 The different letters in the columns indicate that there is a significant difference at p < 0.05.
Table 7. The dietary reference intake of the heavy metals.
Heavy MetalsRDA per DayUL per DayAI per Day
Chromium20–35 μg 1-
Copper900 μg10 mg
Iron12–18 mg45 mg
Manganese-11 mg1.8–2.3 mg
Zink8–11 mg40 mg
Molybdenum45 μg2 mg
Chromium20–35 μg-
1 Food and Nutrition Board, Institute of Medicine (2001) Recommended Dietary Allowance (RDA); Tolerable Upper Intake Level (UL); Adequate Intake (AI).
Publisher’s Note: MDPI stays neutral with regard to jurisdictional claims in published maps and institutional affiliations.

