Communication

Expression Profiling of Heat Shock Protein Genes as Putative Early Heat-Responsive Members in Lettuce

1
World Vegetable Center Korea Office, Wanju-gun 55365, Korea
2
Technological Support Division, National Institute of Horticultural & Herbal Science (NIHHS), Rural Development Administration (RDA), Wanju-gun 55365, Korea
3
Vegetable Research Division, National Institute of Horticultural & Herbal Science (NIHHS), Rural Development Administration (RDA), Wanju-gun 55365, Korea
4
World Vegetable Center, Shanhua, Tainan 74151, Taiwan
*
Author to whom correspondence should be addressed.
Horticulturae 2021, 7(9), 312; https://doi.org/10.3390/horticulturae7090312
Submission received: 10 August 2021 / Revised: 9 September 2021 / Accepted: 11 September 2021 / Published: 15 September 2021
(This article belongs to the Special Issue Abiotic Stress Responses of Vegetable Crops)

Abstract

:
High temperatures due to global warming can cause harmful effects on the productivity of lettuce, a cool-season crop. To identify lettuce heat shock protein (HSP) genes that could be involved in early responses to heat stress in plants, we compared RNA transcriptomes between lettuce plants with and without heat treatment of 37 °C for 1 h. Using transcriptome sequencing analyses, a total of 7986 differentially expressed genes (DEGs) were identified including the top five, LsHSP70A, LsHSP70B, LsHSP17.3A, LsHSP17.9A and LsHSP17.9B, which were the most highly differentially expressed genes. In order to investigate the temporal expression patterns of 24 lettuce HSP genes with a fold-change greater than 100 under heat stress, the expression levels of the genes were measured by qRT-PCR at 0, 1, 4, 8, 14, and 24 h time points after heat treatment. The 24 LsHSP genes were classified into three groups based on the phylogenetic analysis and/or major domains available in each protein, and we provided a potential link between the phylogenetic relationships and expression patterns of the LsHSP genes. Our results showed putative early heat-responsive lettuce HSP genes that could be possible candidates as breeding guides for the development of heat-tolerant lettuce cultivars.

1. Introduction

Lettuce (Lactuca sativa L.) is one of the most economically important leafy vegetables in the world and its production is currently increasing due to the growing interest in healthy food [1]. Lettuce is a cool-season crop, with an optimal growing temperature range of 17 to 28 °C, and floral initiation generally occurs between 21 and 27 °C [2]. Heat stress refers to a temperature environment exceeding the optimal limit for a certain species. When exposed to heat stress, physiological disorders such as tip burn, premature bolting, puffy heads and rib discoloration are commonly observed in lettuce [3].
Climate change is expected to increase the frequency and severity of extremes in temperature, resulting in significant damage to vegetable crop production [4]. According to the global climate report issued by the National Oceanic and Atmospheric Administration, USA. (NOAA), 2020 was ranked as the second warmest year in 141 years of recording, with the global land and ocean surface temperature increasing by an average of +0.98 °C [5]. In addition to the continuous increase in average temperature due to the greenhouse effect, short periods of abnormally high temperatures, resulting in a significant reduction in crop growth and yield are also a result of climate change [6]. Peng et al. (2004) found a decline of approximately 10% in yield for each 1 °C increase during the dry season [7]. Even a few hours of temperatures that are higher than optimal can induce dormancy in lettuce seeds [8]. Spinach and lettuce may produce stalks (bolt) and cucumber tends to produce a higher ratio of male to female flowers in response to high temperature, which can reduce yield and commercial value [9].
Unlike animals, plants are unable to change their position when directly exposed to persistently changing environmental stresses [10]. Thus, plants cannot avoid the exposure to heat stress, which poses a serious threat to plants [11]; however, plants have a sophisticated adaptive system at the cellular and molecular levels [12,13]. Heat shock proteins (HSPs), also called stress proteins, play a central role in the protection of cells exposed to different types of stress in plant tissue [14]. In plants, these proteins are grouped into five principal classes based on their approximate molecular weight: (1) Hsp100 family, (2) Hsp90 family, (3) Hsp70 family, (4) Hsp60 family, and (5) small heat shock proteins (sHsps) family [15]. Under heat stress, HSPs, as molecular chaperones, bind to heat-denatured proteins and mediate refolding, assembly for repairing denatured proteins or degradation of misfolded proteins to maintain homeostasis of proteins [16,17,18].
It is important to develop heat tolerant lettuce varieties because there is a very low consumer acceptance threshold for lettuce with symptoms typically associated with exposure to heat stress. So far, studies on lettuce transcriptomics under cold or diverse light conditions are limited [19,20] since the genetically validated reference genome of lettuce was first reported in 2017 [21]. There is a need to identify the genes that respond to heat stress and investigate their expression patterns during the stress. In this study, we focused on identifying putative early heat stress-responsive HSP genes in lettuce by analyzing transcriptomes and their temporal expression patterns during heat stress and the phylogenetic relationships among them. This information will be helpful in developing the next generation of lettuce cultivars with enhanced heat tolerance through molecular breeding.

2. Materials and Methods

2.1. Plant Material and Growth Conditions

Korean blue leaf lettuce (Lactuca sativa cv. LB Sang 169) seeds obtained from the National Institute of Horticultural and Herbal Science (NIHHS), Korea were sown in 50 cell trays and grown in the NIHHS greenhouse, which was maintained at an optimal temperature of 22/20 °C (day/night). At 18 days after sowing, seedlings were transferred into a temperature-controlled LED growth chamber (VS-91G09M-HL. VISION Co., Daejeon, Korea). Seedlings were grown under white light at an intensity of 120 umol m−2 s−1 and a 16/8 h day/night photoperiod, with the temperature maintained at 20/18 °C (day/night), and 60–65% humidity. The 25-day-old plants were exposed to a heat stress treatment of 37/35 °C (day/night), without any change in the light intensity. At different time points (0 h, 1 h, 4 h, 8 h, 14 h and 24 h after heat treatment), the aerial part of the lettuce was sampled, frozen in liquid nitrogen and stored at −80 °C. After 24 h of heat treatment, plants were transferred back to the optimal temperature for observation of phenotypic alteration (Supplementary Materials, Figure S1).

2.2. Morphometric Analysis

The maximal length (maximal length from the apical to the basal parts of the leaf) and width of the 4th leaf (measured at the midpoint) of each plant were measured at 3, 6, 10 and 13 days after heat treatment. At 13 days after heat stress treatment, the fresh weight of each plant was measured and the dry weight was determined by oven-drying it at 70 °C for 72 h.

2.3. RNA Preparation and Transcriptome Sequencing Analysis

Total RNA was extracted from the frozen leaf samples using a Plant RNeasy Extraction Kit (Qiagen, Hilden, Germany). The RNA samples were treated with DNase I (Qiagen, Germany), and cDNA was synthesized using the iScript cDNA synthesis kit (Bio-Rad, Hercules CA, USA). The integrity of the RNA was examined by agarose gel electrophoresis. RNA-Seq libraries were generated with a TruSeq Stranded Total RNA LT Sample Prep Kit (Illumina, San Diego CA, USA) and sequenced by a paired-end-sequencing method using Illumina’s HiSEquation 2000 (Macrogen, Seoul, Korea).

2.4. Data Analysis Quality Control

Quality control (QC) of raw paired-end reads was done by FastQC v0.11.7. The Q20% and Q30% are the proportion of nucleotides with a quality score > 20 and 30, respectively. In order to reduce biases in the analysis, artifacts such as low-quality reads, adaptor sequence, contaminant DNA or polymerase chain reaction (PCR) duplicates were trimmed by using Trimmomatic (http://www.usadellab.org/cms/?page=trimmomatic, accessed on 29 January 2021). Trimmed reads were mapped to reference genome (Lsat_Salinas_v7) with HISAT2 version 2.1.0, Bowtie2 2.3.4.1 (https://ccb.jhu.edu/software/hisat2/index.shtml, accessed on 29 January 2021). After mapping reads, StringTie version 2.1.3b (https://ccb.jhu.edu/software/stringtie/, accessed on 29 January 2021) was used for transcript assembly and the expression profiles of the assembled transcript for each sample were calculated. The FPKM (fragment per kilobase of transcript per million mapped reads) value is used as the expression profile in the case of paired-end sequencing.

2.5. Differentially Expressed Genes (DEG)

DEG analysis was performed to compare samples grown under high temperature (37/35 °C day/night) and optimal temperature (20/18 °C day/night, control) conditions. Statistical analysis was conducted using the fold change (FC) per comparison pair. The significant results were selected based on conditions of |FC| ≥ 2 and p-value < 0.05.

2.6. Quantitative RT-PCR (qRT-PCR) Analysis

The synthesized cDNA was used for qRT-PCR analysis by using AccuPower 2X GreenStar qPCR Master Mix (Bioneer, Daejeon, Korea) and a CFX96 Touch Real-Time PCR Detection System (Bio-Rad, Hercules, CA, USA). Relative mRNA levels were determined by normalizing the PCR threshold cycle number of each target gene with that of the reference gene, UBQ21 [22]. In the qRT-PCR analysis, three technical repeats were measured for each biological replicate analyzed. The primers used for qRT-PCR analyses are presented in Supplementary Materials, Table S1.

2.7. Phylogenetic Analysis

Protein sequences of lettuce HSPs were aligned using ClustalW and the phylogenetic tree was generated based on the neighbor-joining method implemented in MEGA X [23] under the parameters of the Jones–Taylor–Thornton (JTT) model with uniform rates among sites, and pairwise deletion of gaps.

3. Results

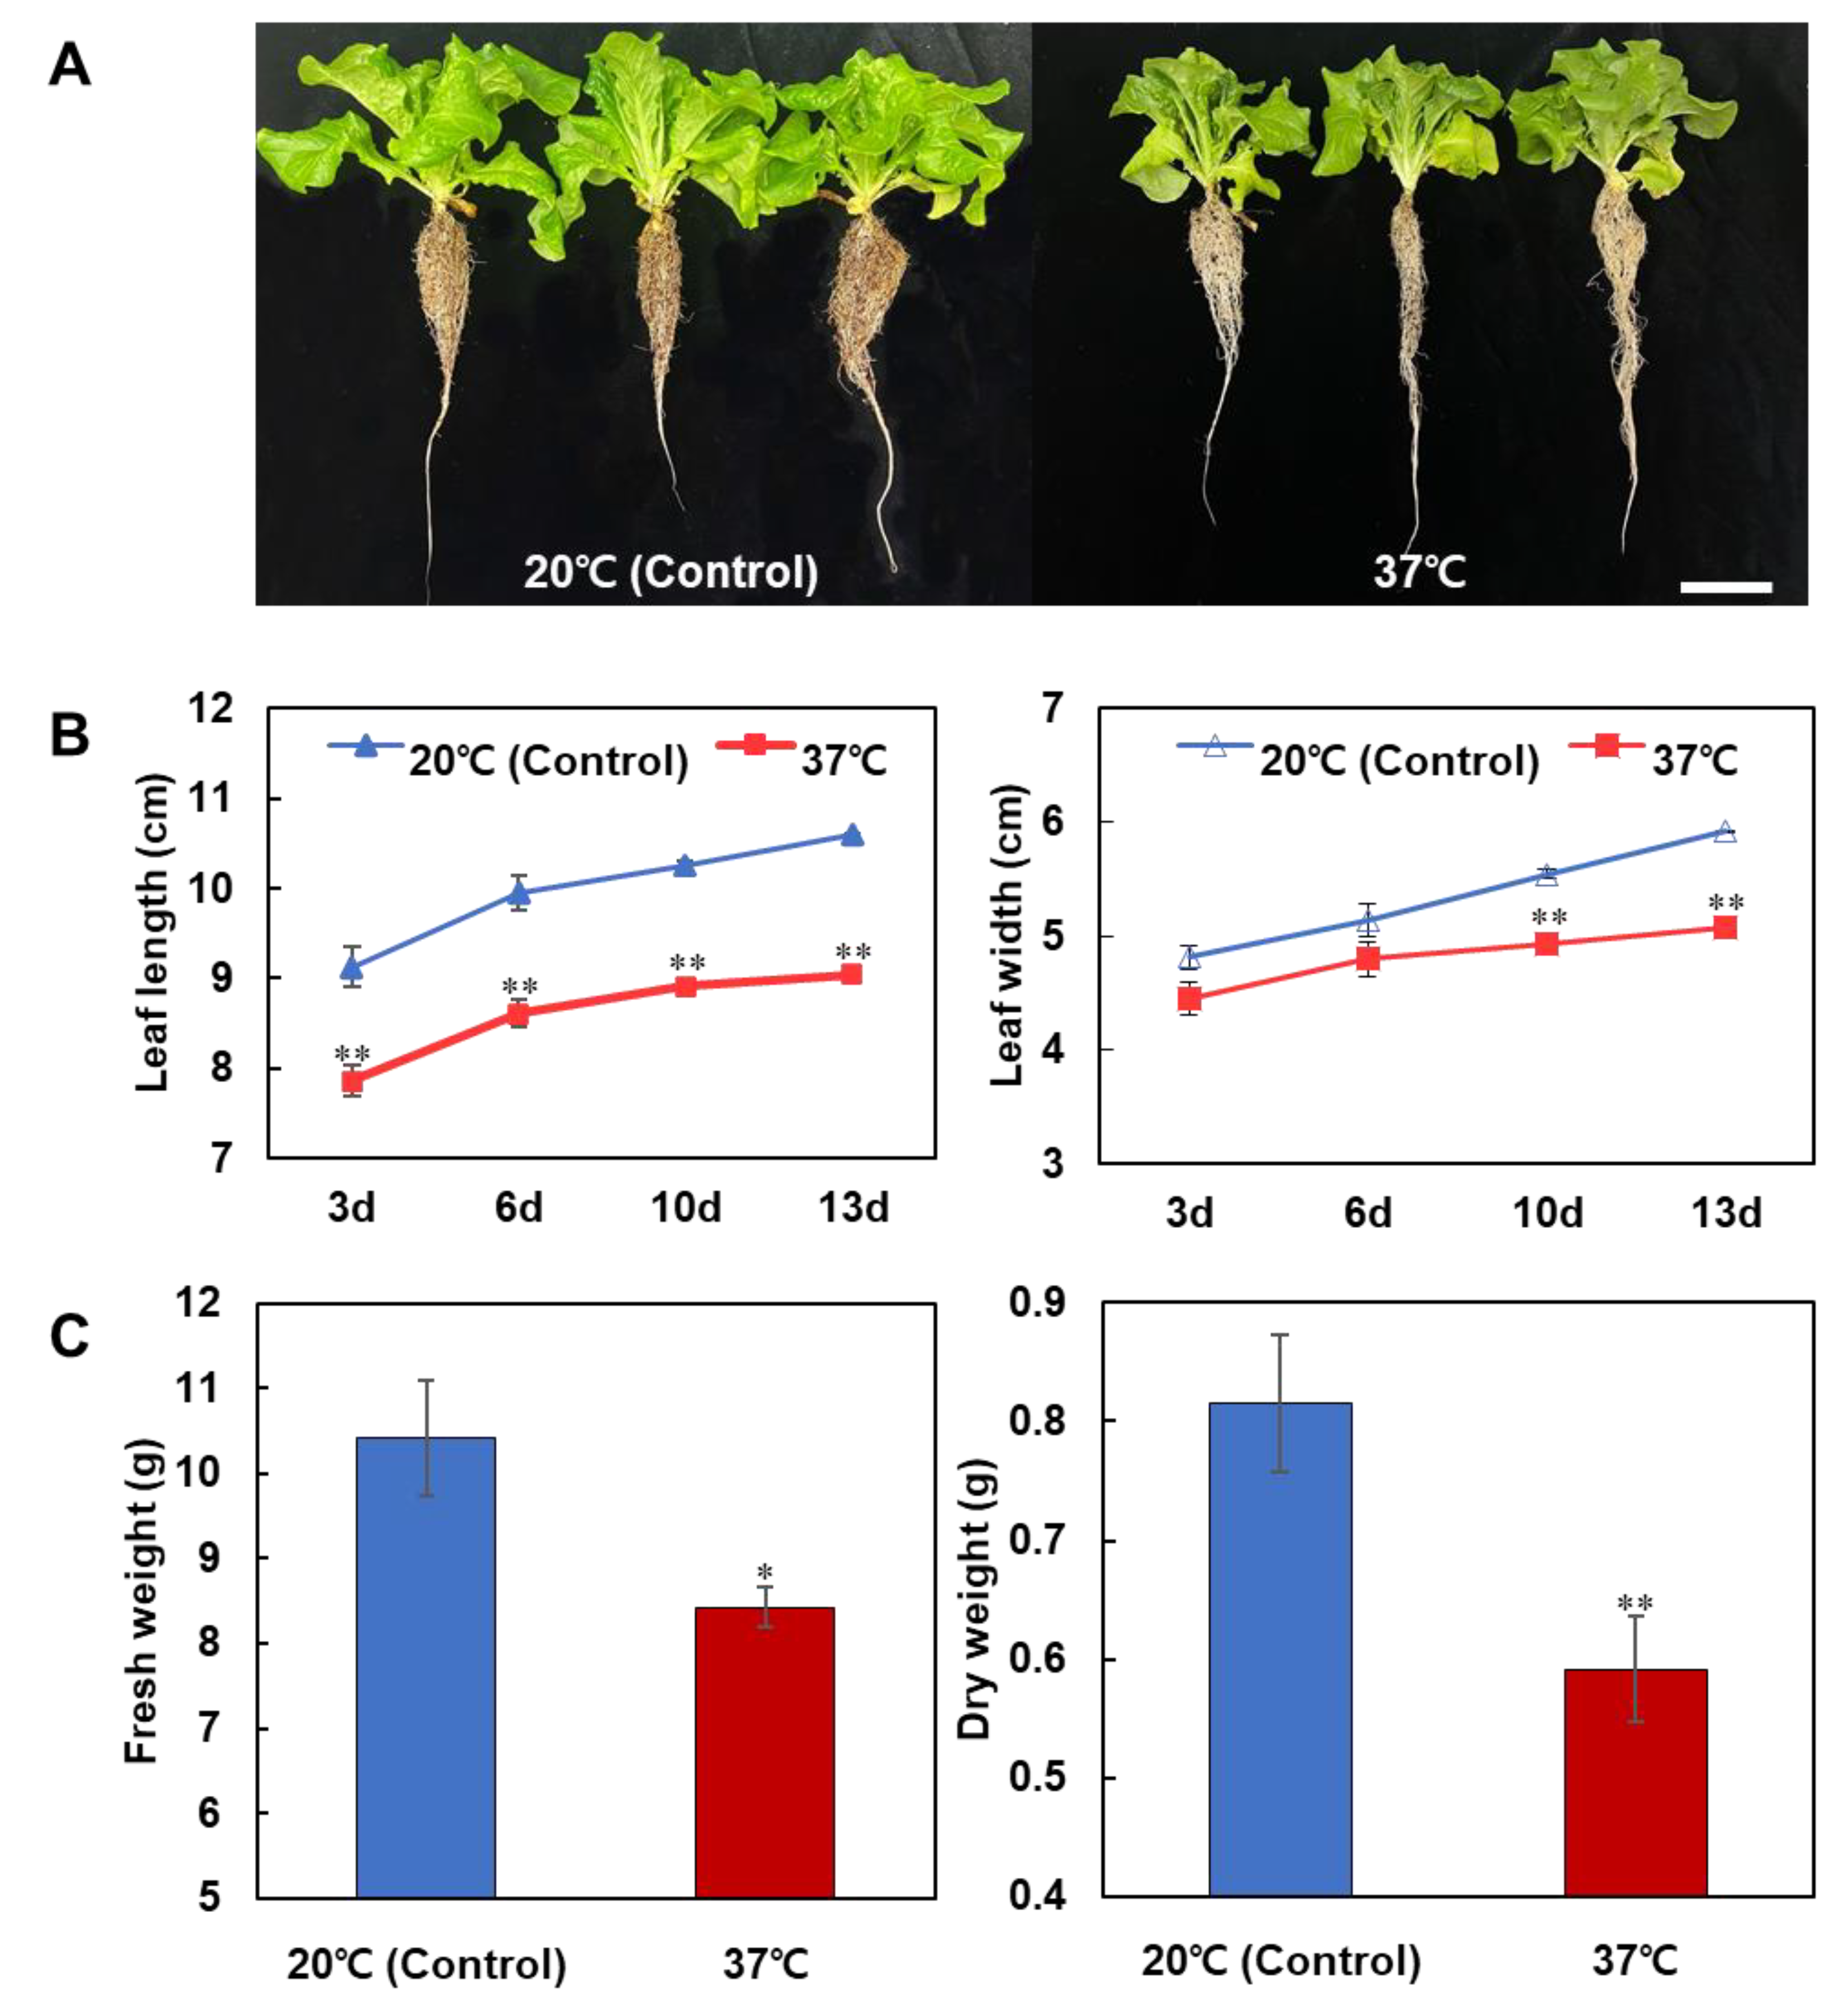
3.1. Effects of Heat Stress on the Early Vegetative Growth of Lettuce

To examine the effect of heat stress on the early vegetative growth of lettuce, lettuce plants were exposed to high temperature conditions (37/35 °C day/night) for 24 h. The morphological traits of the lettuce were investigated after 3, 6, 10 and 13 days of the heat treatment compared to those grown under the optimal temperature condition (20/18 °C day/night, control). Heat-induced inhibition of leaf growth was observed in the lettuce with the heat stress compared to control (Figure 1A,B). Comparison of leaf size between plants with and without heat treatment exhibited a significant difference at the 13-day time point after heat treatment: the length and width of the leaves in the plants with heat treatment decreased by 15% and 14%, respectively, compared to control. Furthermore, both fresh and dry weights of lettuce with heat treatment were also significantly reduced by 19% and 27%, respectively, compared to control (Figure 1C). There were no signs of physiological disorders associated with high temperature stress such as tip burn, premature bolting, or rib discoloration observed in our experiment with a 24 h heat treatment.

3.2. Heat Treatment Induced the Expression of a Heat Shock Protein Gene, LsHSP70-2711 in Lettuce

In order to investigate the expression levels of a known lettuce heat shock protein gene, LsHSP70-2711 (COGE: Lsat_1_v5_gn_9_22920.1) during heat stress [24], the abundance of the transcript was determined by qRT-PCR analyses in lettuce at different time points of heat treatment (1, 4, 8, 14 and 24 h). A significant increase in LsHSP70-2711 expression was observed in lettuce under heat stress condition for all time points examined, compared to the control (Supplementary Materials, Figure S2). Based on the highest expression level of LsHSP70-2711 at the 1 h time point of heat stress treatment, RNA samples prepared at the time point were applied for transcriptome sequencing to identify early heat-responsive HSP genes in lettuce.

3.3. Transcriptome Profiling of Lettuce with Heat Treatment

To compare the expression profiles of lettuce grown in two different conditions—with and without heat treatment—whole transcriptome sequencing was conducted using RNA isolated from each group at the 1 h time point after heat treatment. The FASTQC software was utilized for quality control of the raw sequence data. After removing low-quality reads and adaptor sequences, we generated 67,144,596 clean reads, including 6,763,559,164 total read bases from the sample under heat stress (37/35 °C day/night) for 1 h, and 75,171,018 clean reads, including 7,571,262,233 total read bases from the sample under optimal temperature (20/18 °C day/night, control). Trimmed data were mapped against the reference genome (Lsat_Salinas_v7) using the HISAT2 program. The obtained mapped reads were then assembled successfully using StringTie-e version 2.1.3b, based on the reference genome (Table 1).

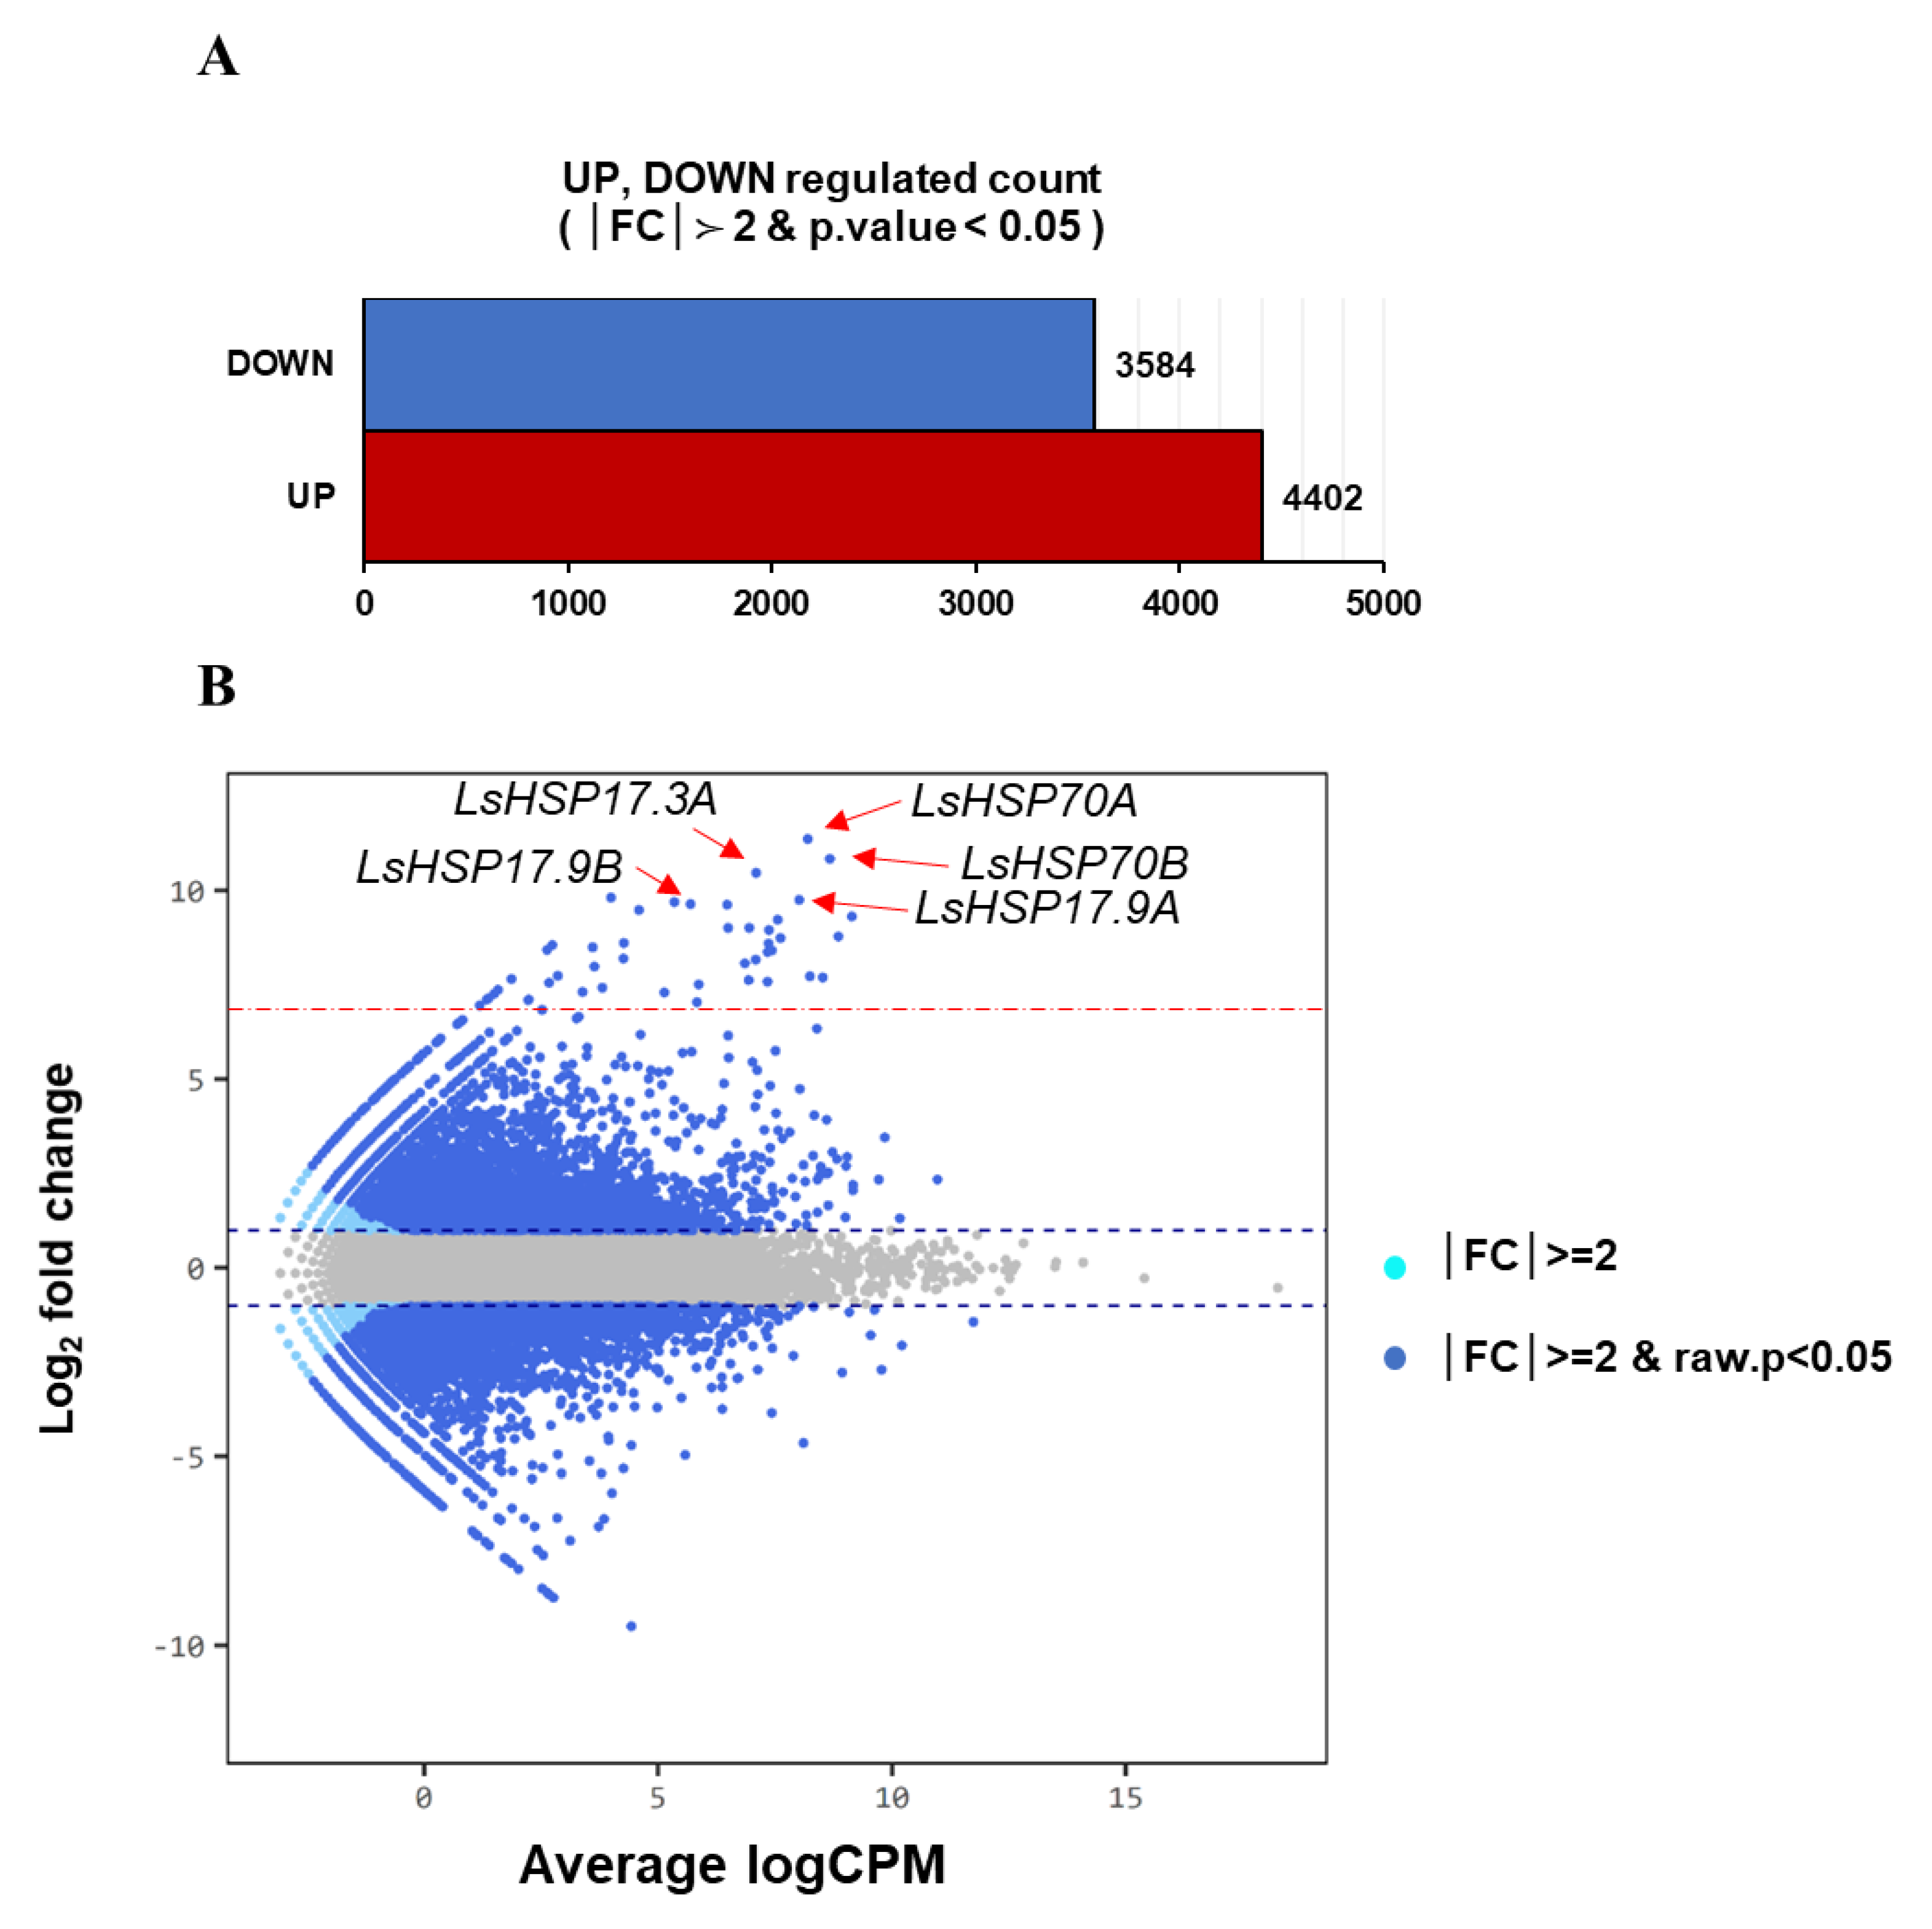
3.4. Differentially Expressed Gene Analysis

Significantly up- and downregulated genes with |FC| ≥ 2 and raw p-value < 0.05 were identified (Figure 2A). A total of 7986 unigenes were discovered to be differentially expressed between samples with and without heat treatment. Compared to the sample with optimal temperature, 4402 unigenes were upregulated and 3584 were downregulated in the sample with heat treatment (Figure 2A).
The smear plot in Figure 2B represents the distribution of DEGs in the up- or downregulated section and confirms the genes are differentially expressed compared to the control according to expression volume, which is defined as the geometric mean of two groups’ expression level. Twenty-four LsHSP genes upregulated more than a 100-fold under the 1 h heat treatment were selected for further studies (Table 2). Among them, the five HSP genes with the highest differential expression were LsHSP70A, LsHSP70B, LsHSP17.3A, LsHSP17.9A and LsHSP17.9B.

3.5. Experimental Validation of Gene Expression by qRT-PCR

To further validate the comparative transcriptome results for the 24 HSP genes, transcript level variances between the heat-stressed and optimal conditions were examined using qRT-PCR analyses. The transcript levels of 24 genes were highly upregulated in the lettuce treated with 1 h heat stress, which coincided with the gene expression detected by the transcriptome analyses (Figure 3).

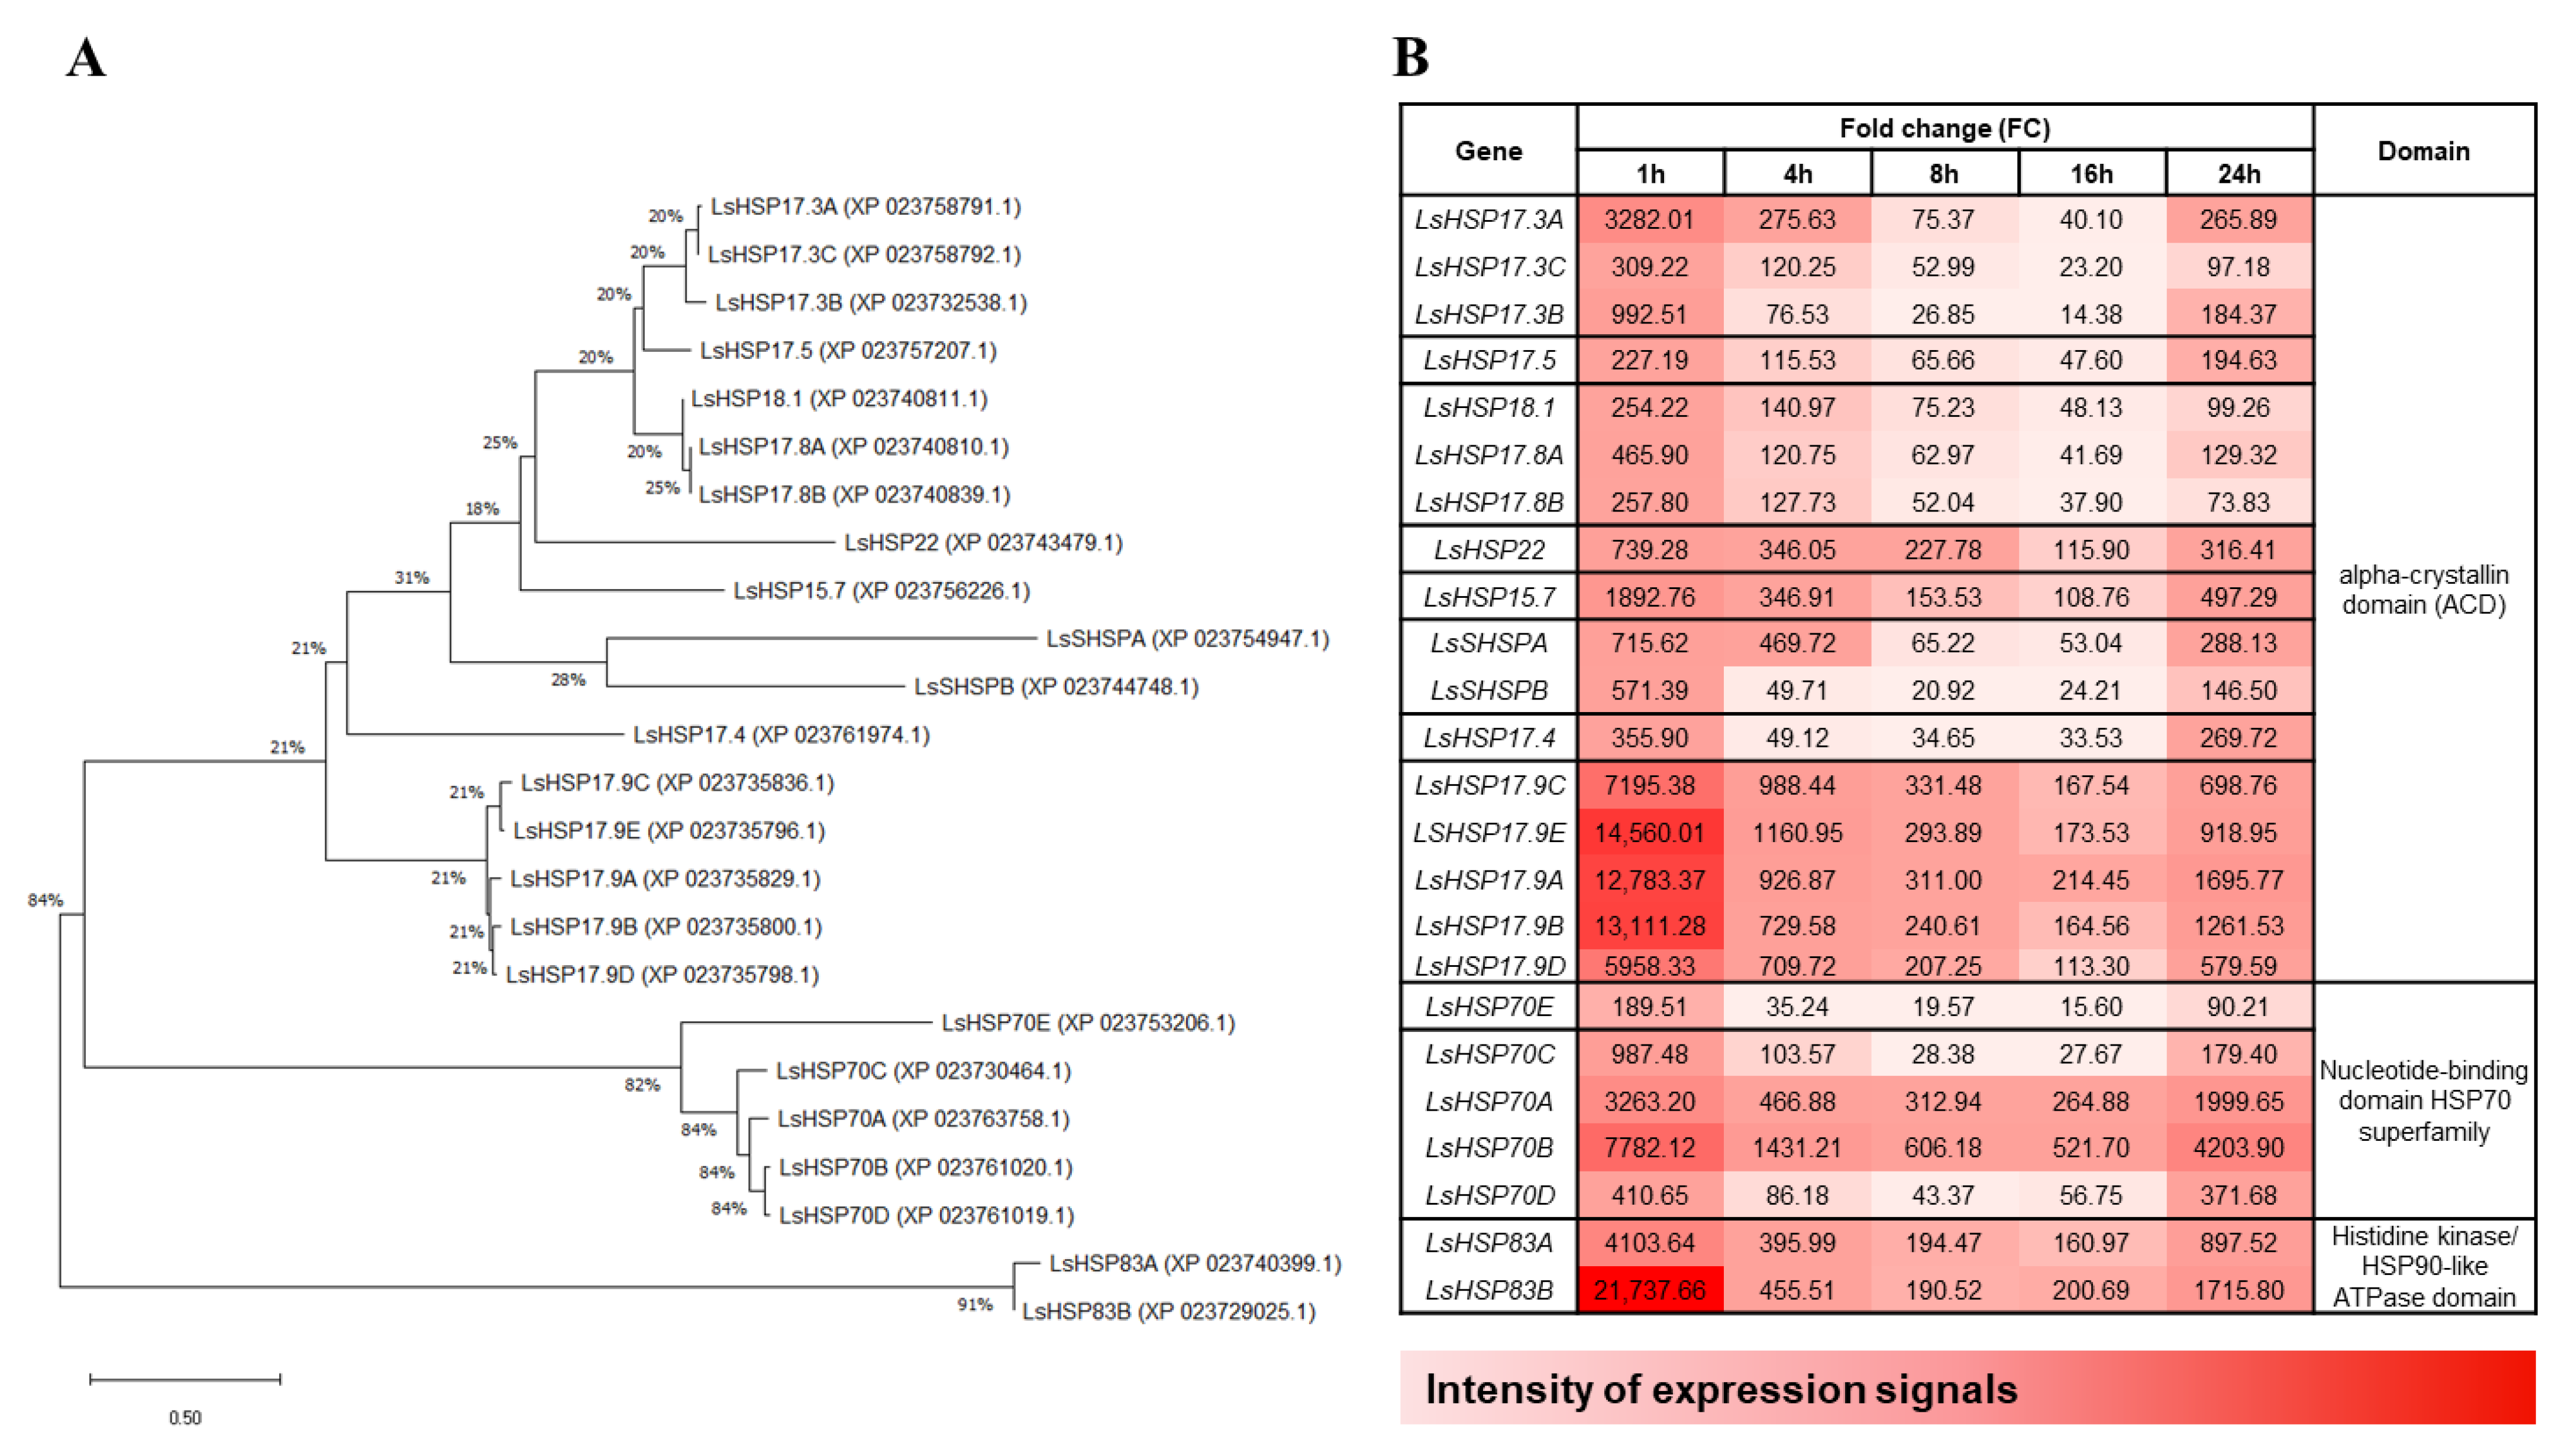
3.6. Time-Course Gene Expression Patterns of the Lettuce HSPs and Their Phylogenetic Relationships

To investigate changes in the gene expression under heat stress, the expression levels of the 24 LsHSP genes in plants exposed to heat stress for 0 h, 1 h, 4 h, 8 h, 14 h and 24 h were determined by qRT-PCR. The highest expression level of the 24 LsHSP genes was observed at the 1 h time point after heat treatment, suggesting that all the LsHSP genes selected are likely to respond early to heat stress (Figure 4). Almost all the LsHSP genes examined had a distinct peak expression in response to heat at the 1 h time point, which drastically declined at the 4 h time point, with the exceptions of LsSHSPA, LsHSP17.5 and LsHSP18.1, which exhibited more than 50% of their peak expression at the 4 h time point.
Using the 24 protein sequences of lettuce HSPs with mRNA levels greater than 100-fold increase compared to those of the control, a phylogenetic tree was constructed using MEGA X (Figure 5A). Three major clusters were identified among the lettuce HSPs based on the available domains (Figure 5B). The first cluster of genes contained the alpha-crystallin domain, the next cluster contained the nucleotide-binding domain (NBD) of the HSP70 superfamily, and the last cluster contained the Histidine kinase/HSP90-like ATPase domain. To visualize the expression levels of the LsHSP genes under heat stress, a heat map was also generated displaying the changes in gene expression at each time point examined under heat stress together with the available domains in the HSPs (Figure 5B). It is noteworthy that similar expression patterns were detected among members belonging to the same group in the phylogenetic tree, which raises the possibility of a conserved functional activity.

4. Discussion

4.1. Effects of Heat Stress Treatment on the Early Vegetative Growth of Lettuce

Heat stress is one of the major problems that limit plant growth and metabolism, leading to significant loss of yield potential for various agricultural crops around the globe [25]. Due to drastic and rapid changes in the global climate, the negative effects of these stresses on the crop have been aggravated [26,27]. Each plant species has a specific temperature range for minimum, maximum, and optimum growth and development [28]. Lettuce is a cool-season crop with an optimal growing temperature ranging from 17 to 28 °C [29]. We demonstrated that the growth of lettuce was significantly suppressed by heat treatment for 24 h, indicating that a short period of abnormal high temperatures can have serious implications for lettuce yields [6].

4.2. Heat Stress Treatment Increased the Expression of LsHSP70-2711 in Lettuce

To identify lettuce HSP genes that respond early to heat stress, lettuce samples were harvested at different time points under heat stress and the expression level of LsHSP70-2711, a known lettuce HSP gene was examined [24]. The expression level of the gene was the highest at the 1 h time point after heat treatment, and then decreased gradually until the 16 h time point. At the 24 h time point, when ambient temperature increased by 2 °C, a slight increase in the gene expression was observed. A previous work supports our experimental data, where LsHSP70-2711 exhibited the highest expression levels after heat stress for 1 h, although it was not among the 24 greatest differentially expressed HSP genes we identified [24].
Heat stress can trigger several mechanisms of defense such as induced gene expression to produce stress-associated molecular chaperones called HSPs. In general, major HSPs play important roles in preventing mis-folded, denatured and aggregated proteins caused by stress conditions [30,31], which contribute to abiotic and biotic stress tolerance and facilitate recovery and survival after a return to normal growth conditions [32]. Thus, the peak of LsHSP70-2711 expression at the 1 h time point in response to heat stress supports the notion that LsHSP70 may play an important role in early responses to stress, which are associated with the accumulation of unfolded or denatured proteins.

4.3. Transcriptome Profiling of Heat-Treated Lettuce and DEG Analysis

Transcriptome analyses have recently been reported in vegetables such as tomato [33], pepper [34], radish [35], and bottle gourd [36] under heat stress conditions. However, transcriptome analyses regarding heat stress in lettuce have not yet been reported. Thus, based on the temporal gene expression pattern of LsHSP70-2711 under heat stress, we compared the expression profile of lettuce treated with and without heat treatment for 1 h through whole transcriptome sequencing. We identified the most upregulated five genes, LsHSP70A, LsHSP70B, LsHSP17.3A, LsHSP17.9A and LsHSP17.9B, which are all HSPs that were revealed by transcriptomic analyses. We also selected 24 lettuce HSP genes that showed more than a 100-fold upregulation as candidate genes for further analyses. Those HSP genes with the highest expression at the 1 h time point after heat stress may contribute to the recognition of stress and production of HSPs to prevent the irreversible aggregation of other proteins and may participate in refolding proteins during the heat stress condition [37].

4.4. Temporal Expression Patterns of Lettuce HSP Genes under Heat Stress

We performed qRT-PCR to examine the expression patterns of the identified 24 HSP genes during heat stress. The expression of the 24 genes was dramatically elevated in lettuce with heat treatment for 1 h compared to control. However, the expression of 24 HSP genes tended to be reduced as the heat stress condition continued. Thus, the level of difference in the expression of 24 LsHSP genes in lettuce plants with and without heat treatment was greatest at the 1 h time point after heat stress, but was reduced as plants adapted to the stress over time. These observations are consistent with the previous result showing that maximum expression levels of HSP18.1 and HSP17.9 occurred at the beginning of a 4 h heat stress period and declined by the end of the 4 h stress despite the continued exposure to high leaf temperature [38]. Some endogenous factors other than heat stress may also regulate the expression of HSP genes when plants are consistently exposed to heat stress.
In the current study, most genes had a dramatically decreased level of gene expression at the 4 h time point, while LsSHSPA, LsHSP17.5 and LsHSP18.1 had relatively gradual decreases in expression. These three genes retained a level of expression of over 50% at the 4 h time point compared to the peak expression at the 1 h time point under the heat stress condition. Various HSPs have been identified in many crop plants that are related to heat stress, with different expression patterns under heat stress and with overlapping and distinct functions [39]. The gene expression of 9 HSP genes in rice (Oryza sativa) had different maximum expressions at various time points depending on the gene [40], supporting our finding that some HSP genes are quickly and sharply induced in response to heat stress, while others can be induced slowly to induce adaptation to higher temperatures.
The 24 LsHSP genes were grouped based on the phylogenetic analysis and/or major domains available in each protein. Small HSPs (sHSPs) with low molecular weight of 15–42 kDa were the most dominant proteins produced in plants during heat stress [38,41,42,43] and these proteins have a conserved alpha-crystallin domain (ACD) [44]. In our study, we found that the most dominant genes among top 24 HSP genes code for sHSPs, and particularly, the expression of LsHSP17.9 genes was highly upregulated under the heat stress conditions. The major function of sHSPs is involvement in the degradation of the misfolded proteins, mostly through the ubiquitin–proteasome pathway [45] and/or preventing irreversible unfolding or wrong protein aggregation by binding to partially folded or denatured proteins [43]. One of the characteristics that distinguishes sHSPs from other HSP class members is that they exhibit an ATP-independent chaperone activity [46]. Thus, the high expression level of sHSP genes may be primarily responsible for the regulation of the early response when plants are exposed to heat stress.
In addition to sHSP genes, HSP70 genes were also significantly induced in response to heat stress. Previous research has shown that HSP70s are a class of molecular chaperones that play a crucial role in protecting plant cells from the detrimental effects of heat stress [47]. Structurally, HSP70s contain three major functional domains: a N-terminal nucleotide-binding domain (NBD) with ATPase activity, a substrate-binding domain (SBD), and a C-terminal lid region that covers the SBD [48,49,50]. The binding of ATP at the NBD, and its subsequent hydrolysis influences the substrate binding affinity of the SBD through allostery, suppressing protein aggregation and refolding misfolded proteins [51]. HSP83 is homologous to the chaperone HSP90, which has a histidine kinase/HSP90-like ATPase domain and also plays an important role in protein folding from the early stage of protein synthesis together with HSP70 and other associated co-chaperones [52]. The expression of HSP83 has been shown to increase during heat shock in Arabidopsis thaliana [53]. We also found that the expression of LsHSP83 was enhanced under heat stress conditions. Thus, it is suggested that LsHSP70 and LsHSP83 play a critical role in protecting lettuce cells from heat stress.

5. Conclusions

In the present study, we identified 24 lettuce HSP genes through transcriptome sequencing that were highly upregulated within 1 h of heat stress treatment. They were divided into three clusters based on phylogenetic relationships together with the conserved domains available in each protein. Furthermore, we demonstrated potential relationships between the temporal expression patterns of LsHSP genes at different time points of heat treatment and the phylogenetic relationships. Functional validation of each LsHSP gene remains to be examined in our future work.

Supplementary Materials

The following are available online at https://www.mdpi.com/article/10.3390/horticulturae7090312/s1, Table S1: Sequences of primers used in qRT-PCR; Figure S1: Schematic representation of experimental design used for heat treatment on lettuce. The diagram illustrates the experimental photoperiod (16 h light), heat treatment period (pink bar—24 h), zeitgeber time (ZT, time after light onset), sampling time (blue bar) and experimental flow for qRT-PCR analyses; Figure S2: Relative expression level of a heat shock protein gene, LsHSP70-2711 at different time points examined under the heat stress condition in lettuce. Relative expression of a heat shock protein gene LsHSP70-2711 in lettuce at indicat-ed time points under the heat stress condition (37 °C).

Author Contributions

Conceptualization, S.J.; methodology, Y.K. and S.J.; formal analysis, Y.K.; investigation, Y.K. and S.J.; resources, S.-W.J. and H.J.L.; writing—original draft preparation, Y.K. and S.J.; writing—review and editing, S.J. and D.W.B.; supervision, S.J. All authors have read and agreed to the published version of the manuscript.

Funding

Funding for this research was provided by the World Vegetable Center Korea Office (Grant No. #10000379) and long-term strategic donors to the World Vegetable Center: Taiwan, UK aid from the UK government, United States Agency for International Development (USAID), Australian Centre for International Agricultural Research (ACIAR), Germany, Thailand, Philippines, Korea and Japan.

Institutional Review Board Statement

Not applicable.

Informed Consent Statement

Not applicable.

Data Availability Statement

All the data is contained within the article.

Acknowledgments

The authors are grateful to Hye Ryun An for the arrangement of growth chambers used in this study.

Conflicts of Interest

The authors declare no conflict of interest.

References

  1. Shatilov, M.V.; Razin, A.F.; Ivanova, M.I. Analysis of the world lettuce market. IOP Conf. Ser. Earth Environ. Sci. 2019, 395, 012053. [Google Scholar] [CrossRef] [Green Version]
  2. Wallace, R.; Wszelaki, A.; Miles, C.; Cowan, J.; Martin, J.; Roozen, J.; Gundersen, B.; Inglis, D. Lettuce Yield and Quality When Grown in High Tunnel and Open-Field Production Systems Under Three Diverse Climates. HortTechnology 2012, 22, 659–668. [Google Scholar] [CrossRef]
  3. Lee, A.-C.; Liao, F.-S.; Lo, H.-F. Temperature, Daylength, and Cultivar Interact to Affect the Growth and Yield of Lettuce Grown in High Tunnels in Subtropical Regions. HortScience 2015, 50, 1412. [Google Scholar] [CrossRef] [Green Version]
  4. Porter, J.R. Rising temperatures are likely to reduce crop yields. Nature 2005, 436, 174. [Google Scholar] [CrossRef] [Green Version]
  5. NOAA. State of the Climate: Global Climate Report for Annual 2020; National Centers for Environmental Information: Asheville, NC, USA, 2021. [Google Scholar]
  6. Mearns, L.O.; Katz, R.W.; Schneider, S.H. Extreme high-temperature events: Changes in their probabilities with changes in mean temperature. J. Appl. Meteorol. Climatol. 1984, 23, 1601–1613. [Google Scholar] [CrossRef] [Green Version]
  7. Peng, S.; Huang, J.; Sheehy, J.E.; Laza, R.C.; Visperas, R.M.; Zhong, X.; Centeno, G.S.; Khush, G.S.; Cassman, K.G. Rice yields decline with higher night temperature from global warming. Proc. Natl. Acad. Sci. USA 2004, 101, 9971–9975. [Google Scholar] [CrossRef] [PubMed] [Green Version]
  8. Nascimento, W.M. Preventing thermoinhibition in a thermosensitive lettuce genotype by seed imbibition at low temperature. Sci. Agric. 2003, 60, 477–480. [Google Scholar] [CrossRef] [Green Version]
  9. Wien, H.C. The Physiology of Vegetable Crops; CAB International: Wallingford, UK, 1997. [Google Scholar]
  10. Wu, G.; Zhang, C.; Chu, L.-Y.; Shao, H.-B. Responses of higher plants to abiotic stresses and agricultural sustainable development. J. Plant Interact. 2007, 2, 135–147. [Google Scholar] [CrossRef]
  11. Wahid, A.; Gelani, S.; Ashraf, M.; Foolad, M.R. Heat tolerance in plants: An overview. Environ. Exp. Bot. 2007, 61, 199–223. [Google Scholar] [CrossRef]
  12. Mittler, R. Abiotic stress, the field environment and stress combination. Trends Plant Sci 2006, 11, 15–19. [Google Scholar] [CrossRef]
  13. Rai, G.K.; Kumar, R.R.; Bagati, S. Abiotic Stress Tolerance Mechanisms in Plants; CRC Press: Boca Raton, FL, USA, 2021; Volume 370. [Google Scholar]
  14. Bhattacharya, A. Chapter 3—Effect of High Temperature on Protein Metabolism in Plants. In Effect of High Temperature on Crop Productivity and Metabolism of Macro Molecules; Bhattacharya, A., Ed.; Academic Press: Cambridge, MA, USA, 2019; pp. 217–309. [Google Scholar]
  15. Gupta, S.C.; Sharma, A.; Mishra, M.; Mishra, R.K.; Chowdhuri, D.K. Heat shock proteins in toxicology: How close and how far? Life Sci. 2010, 86, 377–384. [Google Scholar] [CrossRef]
  16. Hu, W.; Hu, G.; Han, B. Genome-wide survey and expression profiling of heat shock proteins and heat shock factors revealed overlapped and stress specific response under abiotic stresses in rice. Plant Sci. 2009, 176, 583–590. [Google Scholar] [CrossRef]
  17. Kotak, S.; Larkindale, J.; Lee, U.; von Koskull-Döring, P.; Vierling, E.; Scharf, K.D. Complexity of the heat stress response in plants. Curr. Opin. Plant Biol. 2007, 10, 310–316. [Google Scholar] [CrossRef]
  18. Morimoto, R.I.; Santoro, M.G. Stress-inducible responses and heat shock proteins: New pharmacologic targets for cytoprotection. Nat. Biotechnol. 1998, 16, 833–838. [Google Scholar] [CrossRef] [PubMed]
  19. Park, S.; Shi, A.; Mou, B. Genome-wide identification and expression analysis of the CBF/DREB1 gene family in lettuce. Sci. Rep. 2020, 10, 5733. [Google Scholar] [CrossRef] [PubMed]
  20. Zhang, Y.; Xu, S.; Cheng, Y.; Peng, Z.; Han, J. Transcriptome profiling of anthocyanin-related genes reveals effects of light intensity on anthocyanin biosynthesis in red leaf lettuce. PeerJ 2018, 6, e4607. [Google Scholar] [CrossRef] [PubMed]
  21. Reyes-Chin-Wo, S.; Wang, Z.; Yang, X.; Kozik, A.; Arikit, S.; Song, C.; Xia, L.; Froenicke, L.; Lavelle, D.O.; Truco, M.-J.; et al. Genome assembly with in vitro proximity ligation data and whole-genome triplication in lettuce. Nat. Commun. 2017, 8, 14953. [Google Scholar] [CrossRef]
  22. Borowski, J.M.; Galli, V.; da Silva Messias, R.; Perin, E.C.; Buss, J.H.; dos Anjos e Silva, S.D.; Rombaldi, C.V. Selection of candidate reference genes for real-time PCR studies in lettuce under abiotic stresses. Planta 2014, 239, 1187–1200. [Google Scholar] [CrossRef]
  23. Kumar, S.; Stecher, G.; Li, M.; Knyaz, C.; Tamura, K. MEGA X: Molecular Evolutionary Genetics Analysis across Computing Platforms. Mol. Biol. Evol. 2018, 35, 1547–1549. [Google Scholar] [CrossRef] [PubMed]
  24. Liu, R.; Su, Z.; Zhou, H.; Huang, Q.; Fan, S.; Liu, C.; Han, Y. LsHSP70 is induced by high temperature to interact with calmodulin, leading to higher bolting resistance in lettuce. Sci. Rep. 2020, 10, 15155. [Google Scholar] [CrossRef]
  25. Fahad, S.; Bajwa, A.A.; Nazir, U.; Anjum, S.A.; Farooq, A.; Zohaib, A.; Sadia, S.; Nasim, W.; Adkins, S.; Saud, S.; et al. Crop Production under Drought and Heat Stress: Plant Responses and Management Options. Front. Plant Sci. 2017, 8, 1147. [Google Scholar] [CrossRef] [Green Version]
  26. Barnabás, B.; Jäger, K.; Fehér, A. The effect of drought and heat stress on reproductive processes in cereals. Plant Cell Env. 2008, 31, 11–38. [Google Scholar] [CrossRef] [PubMed]
  27. Demirevska-Kepova, K.; Holzer, R.; Simova-Stoilova, L.; Feller, U. Heat stress effects on ribulose-1,5-bisphosphate carboxylase/oxygenase, Rubisco binding protein and Rubisco activase in wheat leaves. Biol. Plant. 2005, 49, 521–525. [Google Scholar] [CrossRef]
  28. Hatfield, J.L.; Prueger, J.H. Temperature extremes: Effect on plant growth and development. Weather Clim. Extrem. 2015, 10, 4–10. [Google Scholar] [CrossRef] [Green Version]
  29. Holmes, S.C.; Wells, D.E.; Pickens, J.M.; Kemble, J.M. Selection of Heat Tolerant Lettuce (Lactuca sativa L.) Cultivars Grown in Deep Water Culture and Their Marketability. Horticulturae 2019, 5, 50. [Google Scholar] [CrossRef] [Green Version]
  30. Al-Whaibi, M.H. Plant heat-shock proteins: A mini review. J. King Saud Univ. Sci. 2011, 23, 139–150. [Google Scholar] [CrossRef] [Green Version]
  31. Ul Haq, S.; Khan, A.; Ali, M.; Khattak, A.M.; Gai, W.X.; Zhang, H.X.; Wei, A.M.; Gong, Z.H. Heat Shock Proteins: Dynamic Biomolecules to Counter Plant Biotic and Abiotic Stresses. Int. J. Mol. Sci. 2019, 20, 5321. [Google Scholar] [CrossRef] [PubMed] [Green Version]
  32. Timperio, A.M.; Egidi, M.G.; Zolla, L. Proteomics applied on plant abiotic stresses: Role of heat shock proteins (HSP). J. Proteom. 2008, 71, 391–411. [Google Scholar] [CrossRef] [PubMed]
  33. Keller, M.; Bokszczanin, K.L.; Bostan, H.; Bovy, A.; Chaturvedi, P.; Chen, Y.; Chiusano, M.L.; Firon, N.; Fragkostefanakis, S.; Iannacone, R.; et al. The coupling of transcriptome and proteome adaptation during development and heat stress response of tomato pollen. BMC Genom. 2018, 19, 447. [Google Scholar] [CrossRef]
  34. Kang, W.-H.; Sim, Y.M.; Koo, N.; Nam, J.-Y.; Lee, J.; Kim, N.; Jang, H.; Kim, Y.-M.; Yeom, S.-I. Transcriptome profiling of abiotic responses to heat, cold, salt, and osmotic stress of Capsicum annuum L. Sci. Data 2020, 7, 17. [Google Scholar] [CrossRef] [Green Version]
  35. Yang, Z.; Li, W.; Su, X.; Ge, P.; Zhou, Y.; Hao, Y.; Shu, H.; Gao, C.; Cheng, S.; Zhu, G.; et al. Early Response of Radish to Heat Stress by Strand-Specific Transcriptome and miRNA Analysis. Int. J. Mol. Sci. 2019, 20, 3321. [Google Scholar] [CrossRef] [PubMed] [Green Version]
  36. Wang, M.; Jiang, B.; Liu, W.; Lin, Y.E.; Liang, Z.; He, X.; Peng, Q. Transcriptome Analyses Provide Novel Insights into Heat Stress Responses in Chieh-Qua (Benincasa hispida Cogn. var. Chieh-Qua How). Int. J. Mol. Sci. 2019, 20, 883. [Google Scholar] [CrossRef] [PubMed] [Green Version]
  37. Tripp, J.; Mishra, S.K.; Scharf, K.D. Functional dissection of the cytosolic chaperone network in tomato mesophyll protoplasts. Plant Cell Environ. 2009, 32, 123–133. [Google Scholar] [CrossRef]
  38. Derocher, A.E.; Helm, K.W.; Lauzon, L.M.; Vierling, E. Expression of a Conserved Family of Cytoplasmic Low Molecular Weight Heat Shock Proteins during Heat Stress and Recovery. Plant Physiol. 1991, 96, 1038–1047. [Google Scholar] [CrossRef] [Green Version]
  39. Usman, M.G.; Rafii, M.; Ismail, M.; Malek, M.A.; Latif, M.; Oladosu, Y. Heat Shock Proteins: Functions and Response against Heat Stress in Plants. Int. J. Sci. Technol. Res. 2014, 3, 204–218. [Google Scholar]
  40. Ye, S.; Yu, S.; Shu, L.; Wu, J.; Wu, A.; Luo, L. Expression profile analysis of 9 heat shock protein genes throughout the life cycle and under abiotic stress in rice. Chin. Sci. Bull. 2012, 57, 336–343. [Google Scholar] [CrossRef] [Green Version]
  41. Mansfield, M.A.; Key, J.L. Synthesis of the Low Molecular Weight Heat Shock Proteins in Plants 1. Plant Physiol. 1987, 84, 1007–1017. [Google Scholar] [CrossRef] [PubMed] [Green Version]
  42. Nagao, R.T.; Czarnecka, E.; Gurley, W.B.; Schöffl, F.; Key, J.L. Genes for low-molecular-weight heat shock proteins of soybeans: Sequence analysis of a multigene family. Mol. Cell Biol. 1985, 5, 3417–3428. [Google Scholar] [CrossRef] [Green Version]
  43. Sun, W.; Van Montagu, M.; Verbruggen, N. Small heat shock proteins and stress tolerance in plants. Biochim. Biophys. Acta Gene Struct. Expr. 2002, 1577, 1–9. [Google Scholar] [CrossRef]
  44. Seo, J.S.; Lee, Y.-M.; Park, H.G.; Lee, J.-S. The intertidal copepod Tigriopus japonicus small heat shock protein 20 gene (Hsp20) enhances thermotolerance of transformed Escherichia coli. Biochem. Biophys. Res. Commun. 2006, 340, 901–908. [Google Scholar] [CrossRef]
  45. Ferguson, D.L.; Guikema, J.A.; Paulsen, G.M. Ubiquitin Pool Modulation and Protein Degradation in Wheat Roots during High Temperature Stress. Plant Physiol. 1990, 92, 740–746. [Google Scholar] [CrossRef] [PubMed] [Green Version]
  46. Mogk, A.; Bukau, B. Role of sHsps in organizing cytosolic protein aggregation and disaggregation. Cell Stress Chaperones 2017, 22, 493–502. [Google Scholar] [CrossRef] [PubMed]
  47. Yu, A.; Li, P.; Tang, T.; Wang, J.; Chen, Y.; Liu, L. Roles of Hsp70s in Stress Responses of Microorganisms, Plants, and Animals. BioMed Res. Int. 2015, 2015, 510319. [Google Scholar] [CrossRef] [PubMed] [Green Version]
  48. Hartl, F.U.; Hayer-Hartl, M. Molecular chaperones in the cytosol: From nascent chain to folded protein. Science 2002, 295, 1852–1858. [Google Scholar] [CrossRef] [Green Version]
  49. Mayer, M.P.; Bukau, B. Hsp70 chaperones: Cellular functions and molecular mechanism. Cell Mol. Life Sci. 2005, 62, 670–684. [Google Scholar] [CrossRef] [Green Version]
  50. Zhu, X.; Zhao, X.; Burkholder, W.F.; Gragerov, A.; Ogata, C.M.; Gottesman, M.E.; Hendrickson, W.A. Structural analysis of substrate binding by the molecular chaperone DnaK. Science 1996, 272, 1606–1614. [Google Scholar] [CrossRef] [Green Version]
  51. Chakafana, G.; Zininga, T.; Shonhai, A. The Link That Binds: The Linker of Hsp70 as a Helm of the Protein’s Function. Biomolecules 2019, 9, 543. [Google Scholar] [CrossRef] [Green Version]
  52. Szabo, A.; Langer, T.; Schröder, H.; Flanagan, J.; Bukau, B.; Hartl, F.U. The ATP hydrolysis-dependent reaction cycle of the Escherichia coli Hsp70 system DnaK, DnaJ, and GrpE. Proc. Natl. Acad. Sci. USA 1994, 91, 10345–10349. [Google Scholar] [CrossRef] [Green Version]
  53. Conner, T.W.; LaFayette, P.R.; Nagao, R.T.; Key, J.L. Sequence and Expression of a HSP83 from Arabidopsis thaliana. Plant Physiol. 1990, 94, 1689–1695. [Google Scholar] [CrossRef] [Green Version]
Figure 1. Effect of heat stress on the early vegetative development of lettuce. (A) Lettuce plants treated with heat stress (37 °C) and with optimal temperature (20 °C) during 24 h. Scale bar = 5 cm. (B) Changes in leaf length and width in lettuce at 3, 6, 10 and 13 days after heat treatment compared to control. (C) Changes in fresh weight and dry weight in lettuce with and without heat treatment. Asterisks indicate significant differences compared with the control (* p < 0.05, ** p < 0.01, Student’s t test). Each bar represents mean ± SE of three independent experiments.
Horticulturae 07 00312 g001
Figure 2. Transcriptome profiling of gene expression dynamics in lettuce with heat treatment. (A) Number of differentially expressed genes (DEGs) in lettuce with heat treatment (37 °C) compared to those with optimal temperature (20 °C) for 1 h. (B) The EdgeR smear plot shows the Log2 fold change (FC, y-axis) against the average log count per million (CPM, x-axis). The dashed red line shows the location of the value of FC = 100. Points above the line have FC > 100 and those below the line have FC < 100 values. The red arrows indicate the top five LsHSP genes displaying both a large magnitude of FC and high expression volume. The two dashed blue lines represent two-fold changes. This plot is colored such that those points having a fold-change less than |FC|< 2 are shown in gray, |FC|≥ 2 in pale blue, and |FC|≥ 2, raw. p-value < 0.05 in dark blue.
Horticulturae 07 00312 g002
Figure 3. Validation of expression levels of selected lettuce heat shock protein genes. Validation of the heat-induced alterations in the expression of 24 LsHSP genes detected by transcriptome sequencing was carried out by qRT-PCR (p < 0.05, Student’s t test). The x-axis represents temperature and the y-axis represents relative transcript level ( × Log2fold change). Each bar represents mean ± SE of three independent experiments.
Horticulturae 07 00312 g003
Figure 4. Relative expression level of heat shock protein genes at different time points under heat stress. Alterations in expression levels of lettuce heat shock protein genes with (37 °C) and without (20 °C) heat treatment for 24 h. The expression levels of LsHSP genes are higher in lettuce plants with heat treatment at all the time points examined, compared to control (p < 0.05, Student’s t test). Each bar represents mean ± SE of three independent experiments.
Horticulturae 07 00312 g004
Figure 5. Phylogenetic tree based on protein sequences of heat shock proteins (HSP). Phylogenetic analysis of the LsHSPs whose mRNA expression is upregulated under heat stress in lettuce. (A) The neighbor-joining phylogenetic tree was constructed using MEGA X and tested by 1000 bootstraps. Those proteins can be grouped by their main domain: (1) the upper cluster contained the alpha-crystallin domain, (2) the middle cluster contained the nucleotide-binding domain (NBD) of the HSP70 superfamily, and (3) the last cluster contained the α-crystallin domain (ACD). (B) The expression level pattern of LsHSP genes under heat stress are visualized in a heat map. The darker red represents the high intensity of expression signals.
Horticulturae 07 00312 g005
Table 1. Summary statistics of transcriptome analyses.
Total Read BasesTotal Processed ReadsGC (%)QC20 (%)QC30 (%)Mapped ReadsMapped Ratio (%)
Optimal
temperature (20 ℃)
7,571,262,23375,171,01845.0599.1396.6466,549,75588.53
High
temperature (37 ℃)
6,763,559,16467,144,59644.0099.1896.7764,208,69995.63
Table 2. The 24 differentially expressed lettuce heat shock protein genes selected in this study.
Gene NameGene SymbolDescriptionFold Change
(High
Temperature)
/Optimal
Temperature)
High
Temperature FPKM
Optimal Temperature FPKM
LsHSP70ALOC111912265heat shock cognate 70 kDa protein 2-like2652.36253.410.08
LsHSP70BLOC111909436heat shock cognate 70 kDa protein 2-like1842.68346.310.16
LsHSP17.3ALOC11190724117.3 kDa class I heat shock protein-like1430.81314.210.18
LsHSP17.9ALOC11188373617.9 kDa class II heat shock protein-like867.15575.130.59
LsHSP17.9BLOC11188370717.9 kDa class II heat shock protein-like804.25118.730.11
LsHSP70CLOC111878184heat shock 70 kDa protein79773.230.08
LsSHSPALOC111903402small heat shock protein, chloroplastic722.2844.250.05
LsHSP83ALOC111888460heat shock protein 83-like642.29430.690.61
LsHSP17.9CLOC11188374217.9 kDa class II heat shock protein-like599.83382.160.55
LsHSP17.9DLOC11188370517.9 kDa class II heat shock protein-like521.53297.660.49
LsHSP70DLOC111909434heat shock cognate 70 kDa protein 2-like500.86134.680.24
LsHSP83BLOC111876685heat shock protein 83430.44146.870.30
LsHSP17.3BLOC11188034717.3 kDa class I heat shock protein-like388.74329.520.75
LsHSP17.8ALOC11188890517.8 kDa class I heat shock protein-like37815.510.01
LsHSP15.7LOC11190472915.7 kDa heat shock protein, peroxisomal364.1532.80.08
LsHSP17.8BLOC11188893717.8 kDa class I heat shock protein-like346.5114.040.01
LSHSP17.9ELOC11188370417.9 kDa class II heat shock protein-like343.39375.451.00
LsSHSPBLOC111892899small heat shock protein, chloroplastic331.61306.430.82
LsHSP70ELOC111901569stromal 70 kDa heat shock-related protein, chloroplastic-like288.39106.590.33
LsHSP17.3CLOC11190724217.3 kDa class I heat shock protein212.52617.272.65
LsHSP17.5LOC11190571717.5 kDa class I heat shock protein-like209.04793.213.46
LsHSP22LOC11189165022.0 kDa class IV heat shock protein-like160.1319.880.11
LsHSP17.4LOC11191036217.4 kDa class III heat shock protein157.8491.110.51
LsHSP18.1LOC11188890718.1 kDa class I heat shock protein-like139.0410.470.04
Publisher’s Note: MDPI stays neutral with regard to jurisdictional claims in published maps and institutional affiliations.

