Article

Nutraceutical Content and Daily Value Contribution of Sweet Potato Accessions for the European Market

1
Department of Agronomy, Food, Natural Resources, Animal and Environment–DAFNAE, University of Padova, 35020 Legnaro, Italy
2
Tropical Root and Starches Center (CERAT), Botucatu, São Paulo State University (UNESP), São Paulo CEP 18.610-034, Brazil
*
Author to whom correspondence should be addressed.
Horticulturae 2021, 7(2), 23; https://doi.org/10.3390/horticulturae7020023
Submission received: 31 December 2020 / Revised: 23 January 2021 / Accepted: 25 January 2021 / Published: 30 January 2021
(This article belongs to the Special Issue Nutritional and Antioxidant Value of Horticulturae Products)

Abstract

:
Sweet potatoes (SPs) are considered by the FAO as a primary crop for “traditional agriculture” in the tropics, but in Europe, its consumption is not widespread. However, consumer demand has grown exponentially over the past five years. This study has evaluated the quality and nutrient contents of storage roots of 29 SPs accessions to characterize their role in improving the human diet. Roots were analyzed for nutraceuticals, sugars, and minerals. Results underlined a considerable variability of nutrient content related to color among SPs accessions. The deep-orange-fleshed SPs showed a higher content of β-carotene compared to the light orange- and cream-fleshed ones; 100 g of edible product of HON86 can supply 32.3% of the daily value contribution of vitamin A, followed by the pale orange-fleshed BRA32 and BRA54. The total phenolic content of the purple ecotypes was about two to five times higher than the other genotypes. The calcium content was generally low, whereas, in many accessions, magnesium and phosphorus content reached 20%, or higher of the contribution to the daily value. Such a high variability suggests different use of the different accessions according to their strengths, but might also be used for breeding to improve quality traits of the commercial varieties.

1. Introduction

The sweet potato (Ipomoea batatas Lam.) is a tropical herbaceous plant cultivated worldwide that plays a significant role in human and animal nutrition, as well as being a source of starch for the food industry, only in tropical countries [1]. According to the FAO, in a tropical climate sweet potatoes (SPs) are considered a primary crop for “traditional agriculture” and is widely consumed, in particular in Asian and African countries [2]. The worldwide production of SP reached 91.8 × 10⁷ tons in 2019 and is the seventh most cultivated food crop in the world [3].
The main edible parts of SP are its tuberous roots, where significant amounts of sugars [4], as well as vitamins, are stored. SPs are highly adaptive to sub-optimal climatic conditions, and thus they can be cultivated outside of tropical environments; its cultivation in Europe is not widespread, and its consumption is still unusual. However, consumer demand is growing exponentially, thanks to the rising interest in ethnic vegetables mediated by globalization and by nutraceutical research. For these reasons, both imports and consumption are rapidly growing, increasing by 100% over the last five years [5].
The phenological variability of SPs can influence the nutritional contents as reported by several authors [6,7]. The qualitative and nutritional characteristics of the sweet potato are many and concern different categories of nutrients including sugars, fibers, and vitamins, but the parameters that significantly increase their value towards the quality of the diet refer to the content of pigments and polyphenols. As is well known, despite being characterized by a general availability of food and good economic conditions, the European context presents important nutritional deficiencies especially in relation to micronutrients [8,9,10]. Indeed, red-orange-fleshed SPs rich in β-carotene can be considered as a smart food to fulfill the daily intake of carotenoids as reported by Islam et al. [11]. At the same time, the purple-fleshed varieties may increase the consumer’s intake of valuable compounds such as anthocyanins, vitamin C, and oligo-elements that can be used for counteracting food insecurity [11]. Anthocyanins, as well as carotenoids, can be accumulated and stored in plant cells and affect the color of plant tissues. Polyphenols such as carotenoids are involved as scavengers of reactive oxidative species (ROS) in cells. It is widely accepted that anthocyanins might be considered active compounds that reduce the risk of many inflammatory diseases (as observed in vitro) or might regulate diabetes and glycemic levels [12,13]. Although these compounds are present in all varieties of SPs, many studies reported that the highest amount of anthocyanins is contained in purple-fleshed varieties [14,15,16]. Therefore, orange- and purple-fleshed varieties might be appreciated by health-oriented consumers and hearten the consumption of SPs in Europe.
On the basis of the aforementioned premises, the purpose of the present study was to evaluate the content of nutritional and nutraceutical compounds in roots of 29 accessions of SPs deriving from different countries, Italy included, some of which were cultivated for the first time in Europe.

2. Materials and Methods

2.1. Plant Material

The field experiment was performed at the Experimental Farm of the University of Padova (45°21′ N; 11°58′ E; 6 m a.s.l.). The site has an annual average temperature of 12.3 °C and an annual rainfall of 811 mm. According to the USDA classification, the soil is a silty loam (11% clay, 65% silt, 24% sand) with a pH of 8.2 and 1.65% organic matter.
The propagation material of 29 accessions of SPs (Table 1), used in the experiment, was obtained from the genetic bank of Padova University in cooperation with the Tropical Root and Starches Center (São Paulo State University). On 22 January 2018, SP roots (100–150 g) were potted in a peat-based substrate (Potgrond H Klasmann-Deilmann GmbH, Geeste, Germany) amended with 20% (v/v) of perlite (Perlite Italiana, Corsico, Italy) and forced in a greenhouse at a temperature regime of 25/18 °C day/night temperature, under natural light. On 6 June, the cuttings (0.30–0.35 m in length) were collected and transplanted in an open field. Each accession was grown in plots of 7 m2 with four rows 0.8 m apart and with an in-row spacing of 0.29 m (30 plants per plot). Each plot was replicated three times and arranged in a randomized block design. The soil was fertilized with 80, 70, and 210 kg ha−1 of N, P2O5, and K2O, respectively.
Cuttings were manually plugged at a depth of 0.10 m on raised beds and irrigated with about 100 mL of water per cutting.
During the growing period plants were irrigated three times, providing about 30 mm for each irrigation. SPs were then harvested at the commercial size, on 29th September. Harvested roots were cured and stored in the dark at room temperature (17–20 °C and RH of 65–70%) for six weeks before sampling. Sweet potato roots (250–300 g and at least 120 mm long) were randomly taken from each accession. Then stored roots were washed and brushed with tap water to remove any soil residues and dried with tissue paper. Afterward, roots were analyzed for dry matter content by weighing 30 roots per accession and replication before and after drying in a ventilated oven. The other qualitative assessments were performed on the same number of samples as shown below.

2.2. Chemical Reagents

Acetic acid (glacial) and anhydrous sodium carbonate were purchased from Riedel-de Haën (Hanover, Germany). Gallic acid monohydrate was obtained from Fluka (Sigma-Aldrich, Milan, Italy), methanol from VWR Prolabo (Fontenay-sous-Bois, France), and Folin-Ciocalteu’s (FC) reagent from Labochimica (Padova, Italy). Chlorogenic acid hemihydrates, maltose, D-(+)-glucose, and D-(–)-fructose were purchased from Aldrich Chemical Company (Sigma-Aldrich); caffeic acid, p-coumaric acid, and ferulic acid from Sigma and methanol from Carlo Erba (Milan, Italy). Deionized water (18 MΩ) was prepared using an ultrapure water purification system (Arium® pro; Sartorius, Muggiò, Italy). All reagents and standards were of analytical and high-performance liquid chromatography (HPLC) grade.

2.3. Extraction of Phenols for Analysis

Freeze-dried (Scanvac, Coolsafe model, LaboGene, Denmark) samples (0.5 g) were extracted in methanol (20 mL) with an Ultra Turrax T25 (IKA-Labortechnik, Staufen, Germany) at 13,500 rpm until a uniform consistency was achieved. Samples were filtered (589 filter paper; Whatman, Germany) and appropriate aliquots of extracts were assayed by FC reagent for total phenolic (TP) content and by the ferric reducing antioxidant power (FRAP method) for antioxidant activity. For HPLC analyses, extracts were further filtered by cellulose acetate syringe filters (0.45 μm porosity).

2.4. Determination of TP Content by the FC Assay

The content of TP was determined by the FC assay with gallic acid as a calibration standard, using a UV-1800 spectrophotometer (Shimadzu, Columbia, MD, USA). The FC assay was carried out on 200 μL of SP extract in a 10 mL test tube, followed by the addition of FC reagent (1000 μmL). The mixture was vortexed for 20–30 s and 800 μL of filtered 20% sodium carbonate solution was added within 1–8 min after the FC reagent addition. The mixture was then vortexed again for 20–30 s (time 0). After two hours at room temperature, the absorbance of the colored reaction product was measured at 765 nm by a Shimadzu UV-1800 spectrophotometer (Columbia, MD, USA). The TP content in extracts was calculated from a standard calibration curve obtained with different concentrations of gallic acid, ranging from 0 to 600 μg mL–1 (correlation coefficient: r2 = 0.9993). The results are expressed as mg gallic acid equivalent (GAE) kg–1 dry weight.

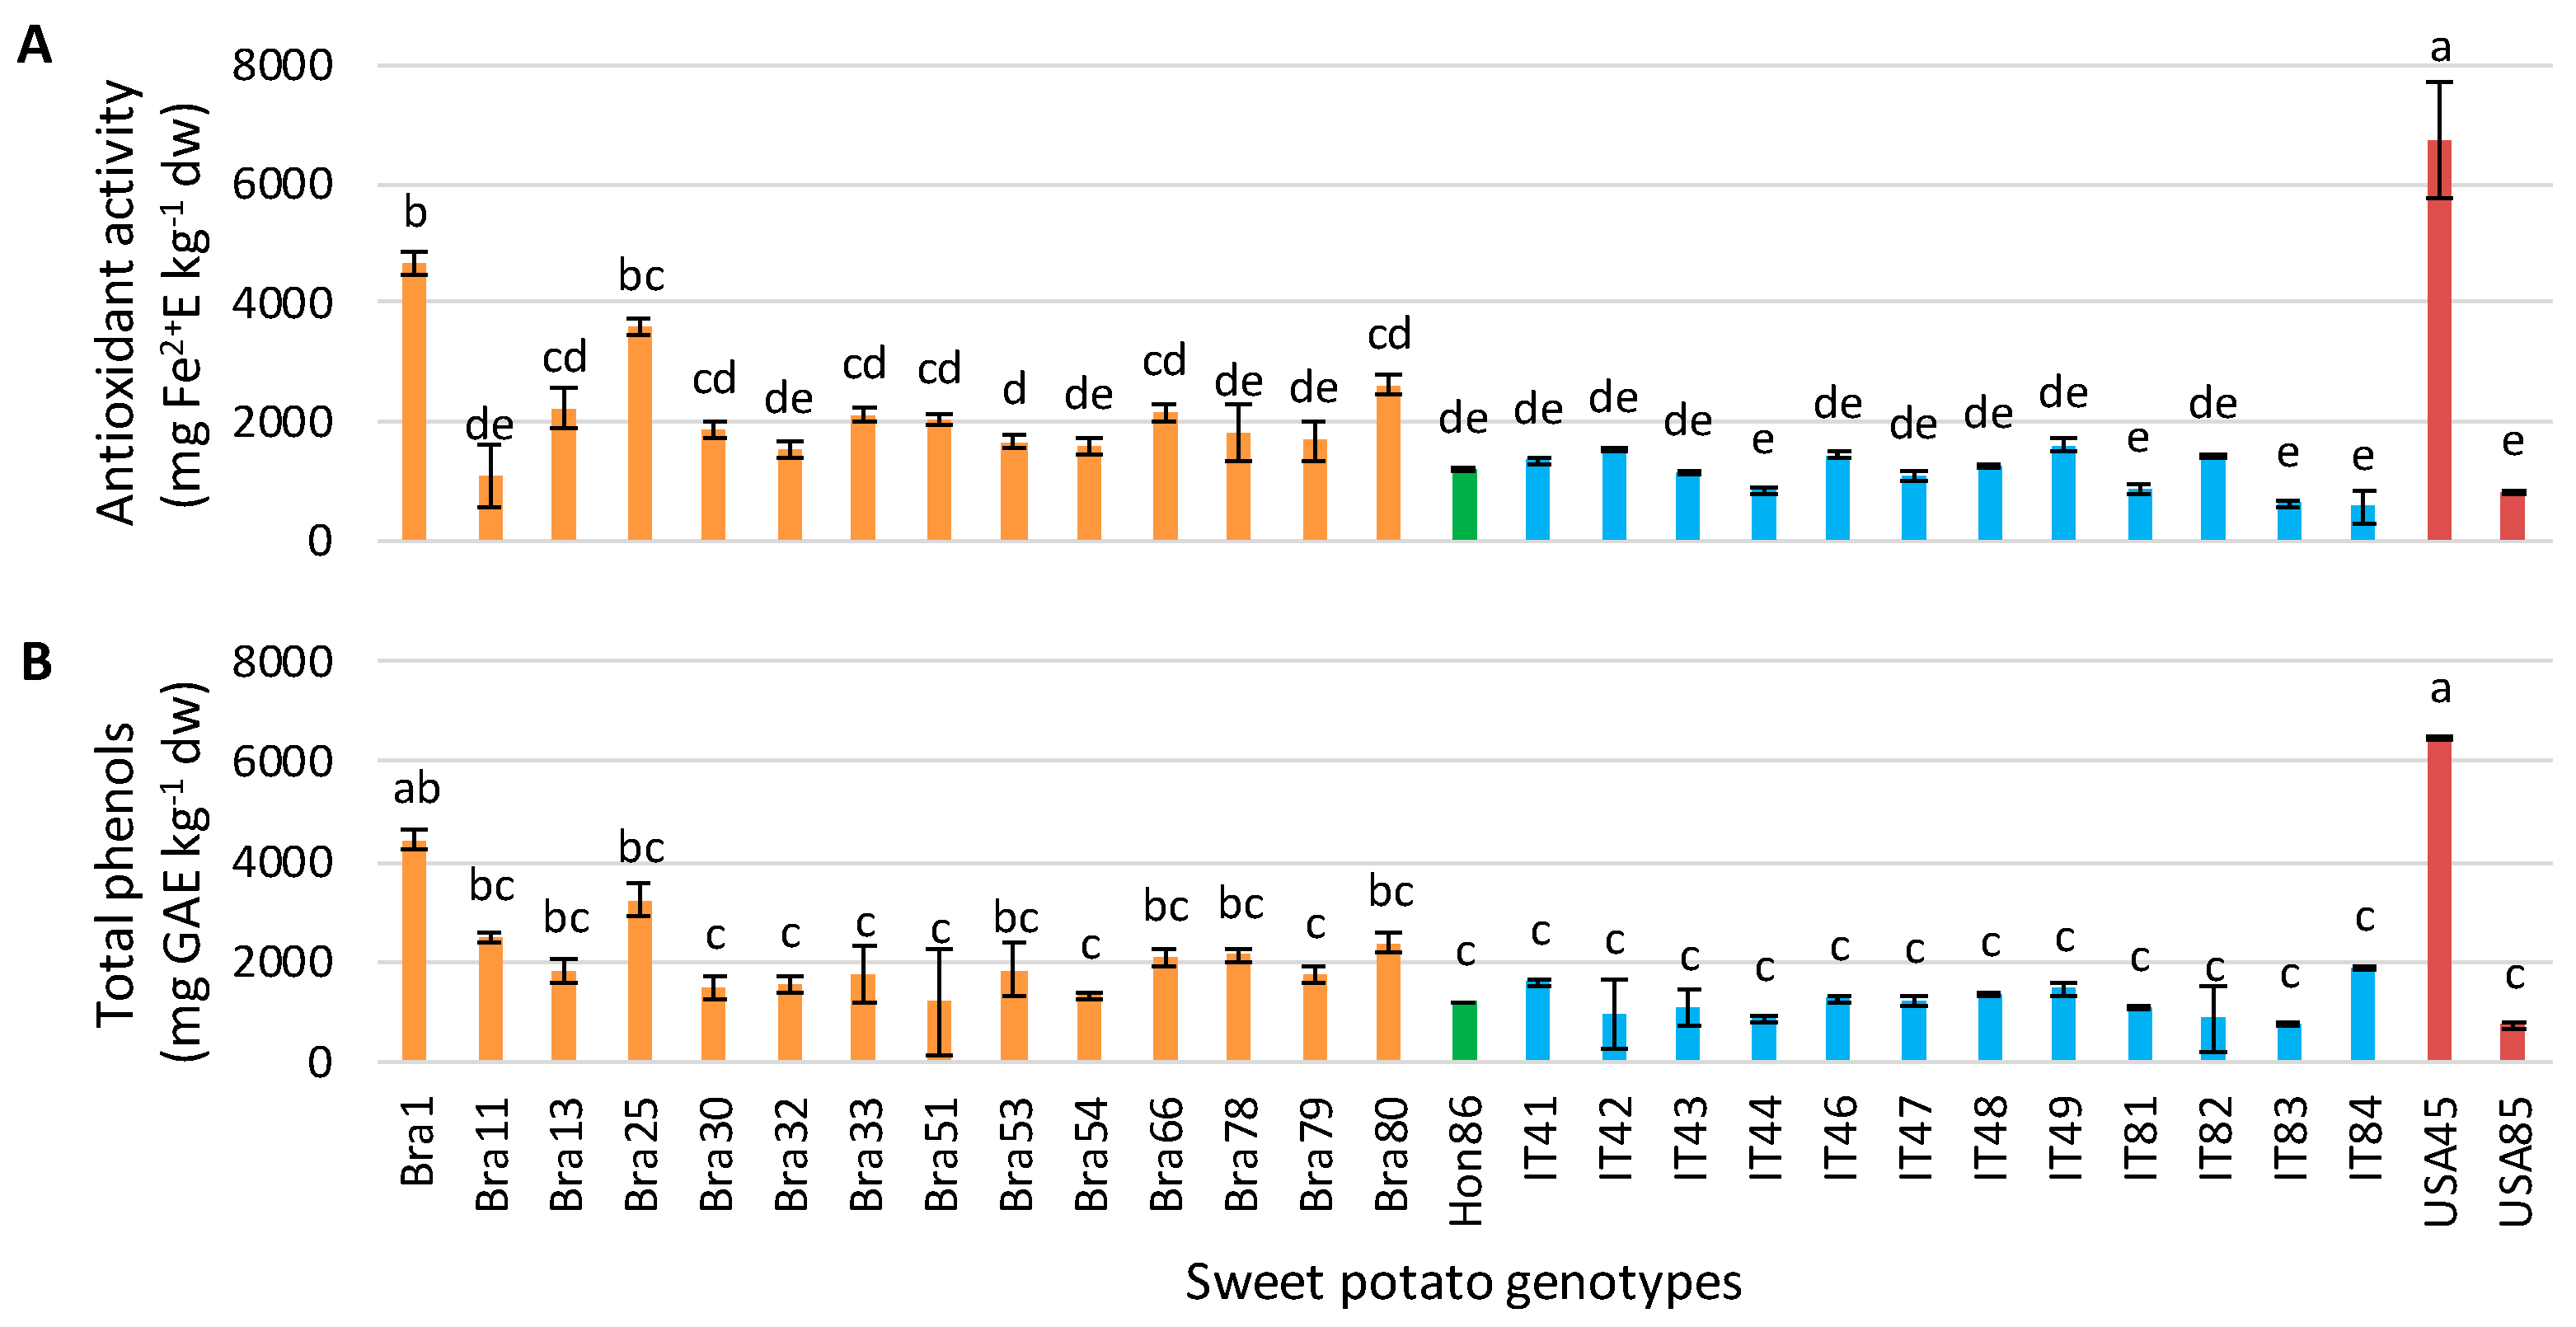
2.5. Determination of Total Antioxidant Activity (TAA) by FRAP

The FRAP reagent was freshly prepared and consisted of 1 mmol L–1 of 2,4,6-tripyridyl-2-triazine and 2 mmol L–1 of ferric chloride in a 0.25 mol L–1 sodium acetate solution (pH 3.6). A methanol extract aliquot (100 μL) was added to the FRAP reagent (1900 μL) and accurately mixed. After four min at room temperature, the absorbance was determined at 593 nm by a Shimadzu UV-1800 spectrophotometer. The calibration was performed with a standard curve (0–1200 μg mL–1 Fe2+) (correlation coefficient: r2 = 0.9985), obtained by the addition of freshly prepared ammonium ferrous sulfate. FRAP values were calculated as μg mL–1 Fe2+ (ferric reducing power) from three determinations and reported as mg kg–1 of Fe2+ (ferrous ion equivalent) on dry matter.

2.6. Extraction and Determination of Ascorbic Acid

Ascorbic acid was determined by a standard method (ISO 6557/2, 1984). SPs freeze-dried samples (1 g) were homogenized until a uniform consistency was achieved with an Ultra Turrax in 20 mL of meta-phosphoric acid and acetic acid solution. As a colorant reagent, a solution of 2,6-dichlorophenolindophenol was employed. Samples, after adding xylene and 3 min of centrifugation at 4000 rpm, were measured with a Shimadzu UV-1800 spectrophotometer at a wavelength of 500 nm.

2.7. Quantitative Determination of Sugars by HPLC

SPs root freeze-dried samples (0.2 g) were homogenized in demineralized water (20 mL) with an Ultra Turrax T25 at 13,500 rpm until a uniform consistency was achieved. Samples were filtered through filter paper (589; Schleicher), and the extracts were further filtered through cellulose acetate syringe filters (0.45 µm) and analyzed by HPLC. The liquid chromatography apparatus utilized in this analysis was a Jasco X.LC system consisting of a model PU-2080 pump, a model RI-2031 refractive index detector, a model AS-2055 autosampler, and a model CO-2060 column. ChromNAV Chromatography Data System software was used for the analysis of the results. The separation of sugars was achieved on a Hyper-Rez XP Carbohydrate Pb++ analytical column (7.7 × 300 mm; Thermo Scientific, Waltham, MA, USA), operating at 80 °C. Isocratic elution was effected using water at a flow rate of 0.6 mL min–1. D-(+)-glucose, D-(–)-fructose, and maltose were quantified by a calibration method. All standards utilized in the experiments were accurately weighed, dissolved in water and the calibration curves were generated with concentrations ranging from 100 to 1000 mg L–1 of standards.

2.8. Quantitative Determination of Ions by IC and Organic Nitrogen

For the estimation of anions and cations, each freeze-dried sample (0.2 g) was extracted in water (50 mL) and shaken at 150 rpm for 20 min. Samples were filtered through filter paper (589 Schleicher), and the extracts were further filtered through cellulose acetate syringe filters (0.20 µm) before analysis by ion chromatography (IC). The IC was performed using an ICS-900 Ion Chromatography system (Dionex Corporation) equipped with a dual-piston pump, a model AS-DV autosampler, an isocratic column at room temperature, a DS5 conductivity detector, and an AMMS 300 suppressor (4 mm) for anions and CMMS 300 suppressor (4 mm) for cations. Chromeleon 6.5 Chromatography Management Software was used for system control and data processing. A Dionex Ion-Pac AS23 analytical column (4 mm × 250 mm) and a guard column (4 mm × 50 mm) were used for anion separations, whereas a Dionex IonPac CS12A analytical column (4 mm × 250 mm) and a guard column (4 mm × 50 mm) were used for cation separations. The eluent consisted of 4.5 mM sodium carbonate and 0.8 mM sodium bicarbonate at a flow rate of 1 mL min−1 for anions and of 20 mM methanesulphonic acid for cations at the same flow rate. Anions and cations were quantified following a calibration method. Dionex solutions containing seven anions at different concentrations and five cations were taken as standards, and the calibration curves were generated with concentrations ranging from 0.4 mg L−1 to 20 mg L−1 and from 0.5 mg L−1 to 50 mg L−1 of standards, respectively.

2.9. β-Carotene Quantification

Beta-carotene was measured according to the procedure described by [17,18] with some modifications. For HPLC determination, 0.2 g of freeze-dried material for each cultivar sample was used and carotenoids were extracted with 20 mL of tetrahydrofuran (THF). The mixture was mechanically stirred for 30 s and the extract was filtrated with syringe filters in regenerated cellulose 0.45 µm. The samples were injected into an HPLC model Shimadzu liquid chromatography system (model SCL 10AT VP) equipped with a high-pressure pump (model LC-10AT VP), automatic loop injector (50 μL; model SIL-10AF). Column: Tracer Extrasil ODS2 (250 × 45 mm, 5 µm) using the mobile phase methanol:THF:water (67:27:6, v/v/v). The flow-rate of the mobile phase was 1 mL min−1 and the absorbance was measured at 470 nm.

2.10. Starch Determination

The starch content was determined using the modified AOAC Official Method 996.11 Starch (total) in cereal products and AOAC Official Method 979.10-Starch in Cereals reported by Bulletin 339–2000.

2.11. Sweet Potato Contribution to Daily Value (SP Contribution to Daily Value)

The contributions of SPs to the daily recommended intake (daily value, DV) for Vitamin A, Vitamin C, potassium, phosphorus, calcium, and magnesium were calculated by assuming an intake of 100 g fresh product per day. The dietary reference values were set according to the European Food Safety Authority (https://www.efsa.europa.eu/en/interactive-pages/drvs). Values of retinol, vitamin C, potassium, phosphorus, calcium, and magnesium were calculated for adults (>18 years) and children/adolescents (1–17 years). For each value, the corresponding percentage to DV was calculated by the following equation:
DV (%) = nutrient content in 100 g (FW) 100/average daily requirement.

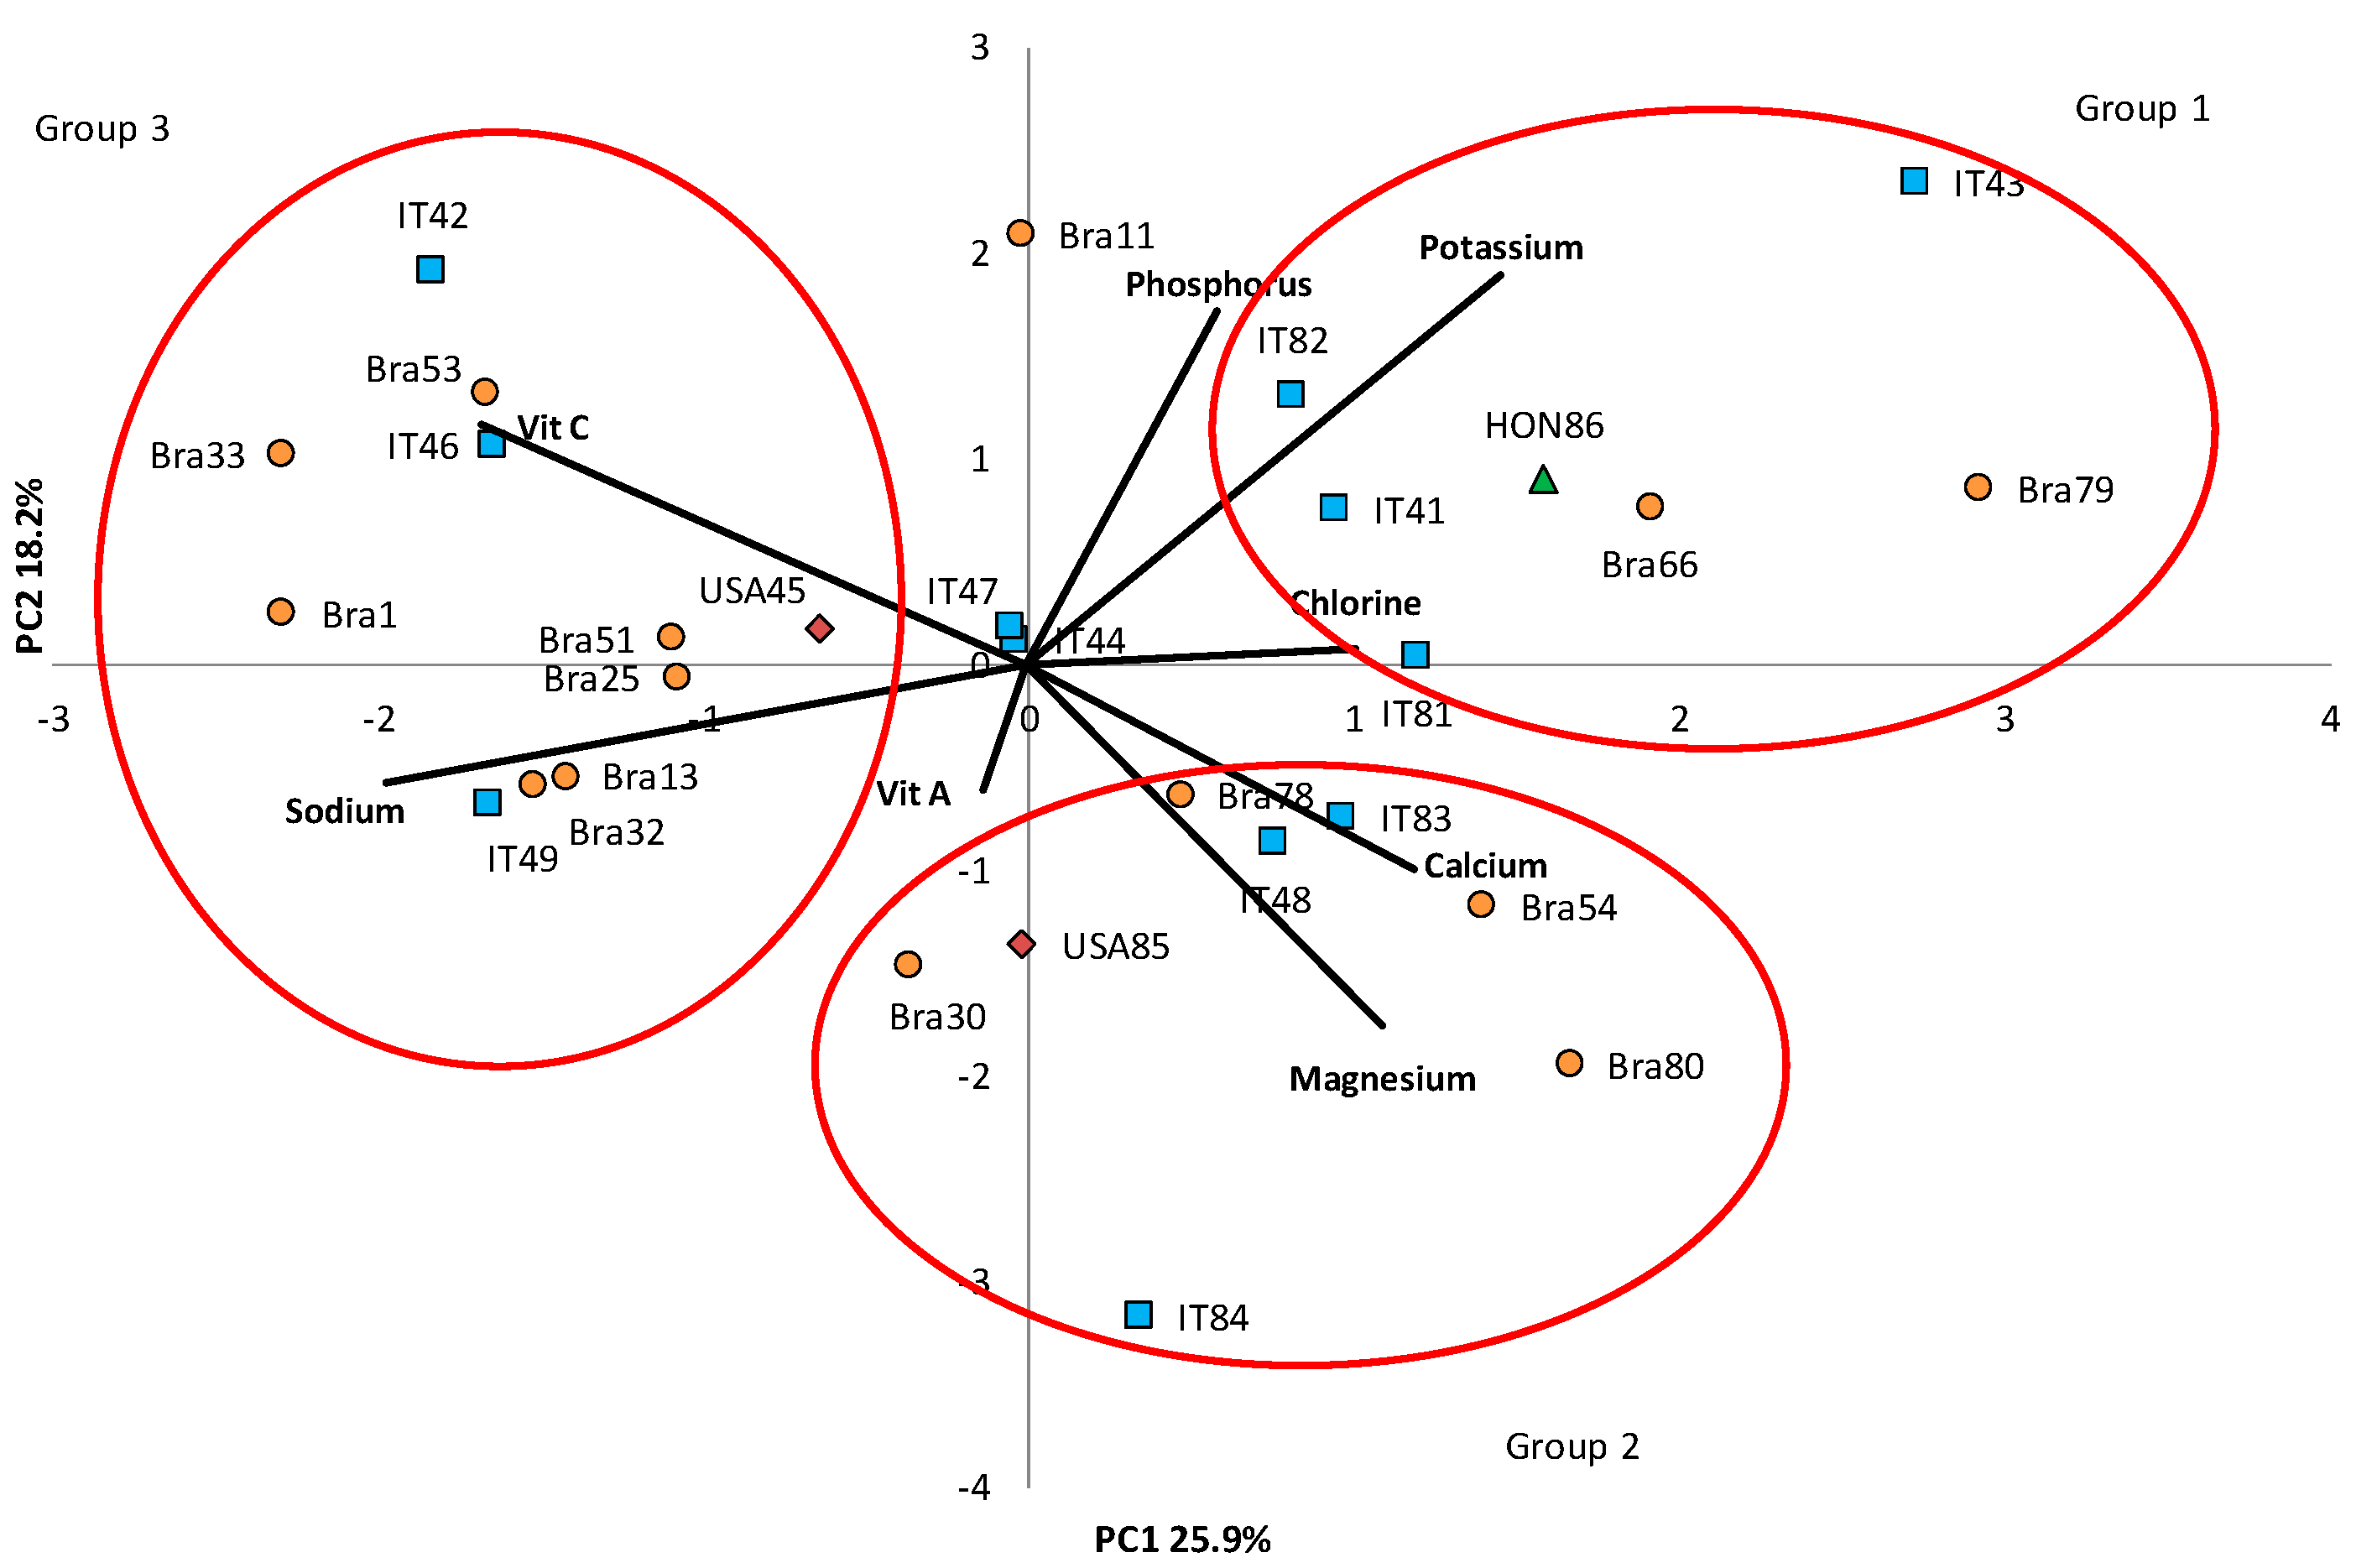
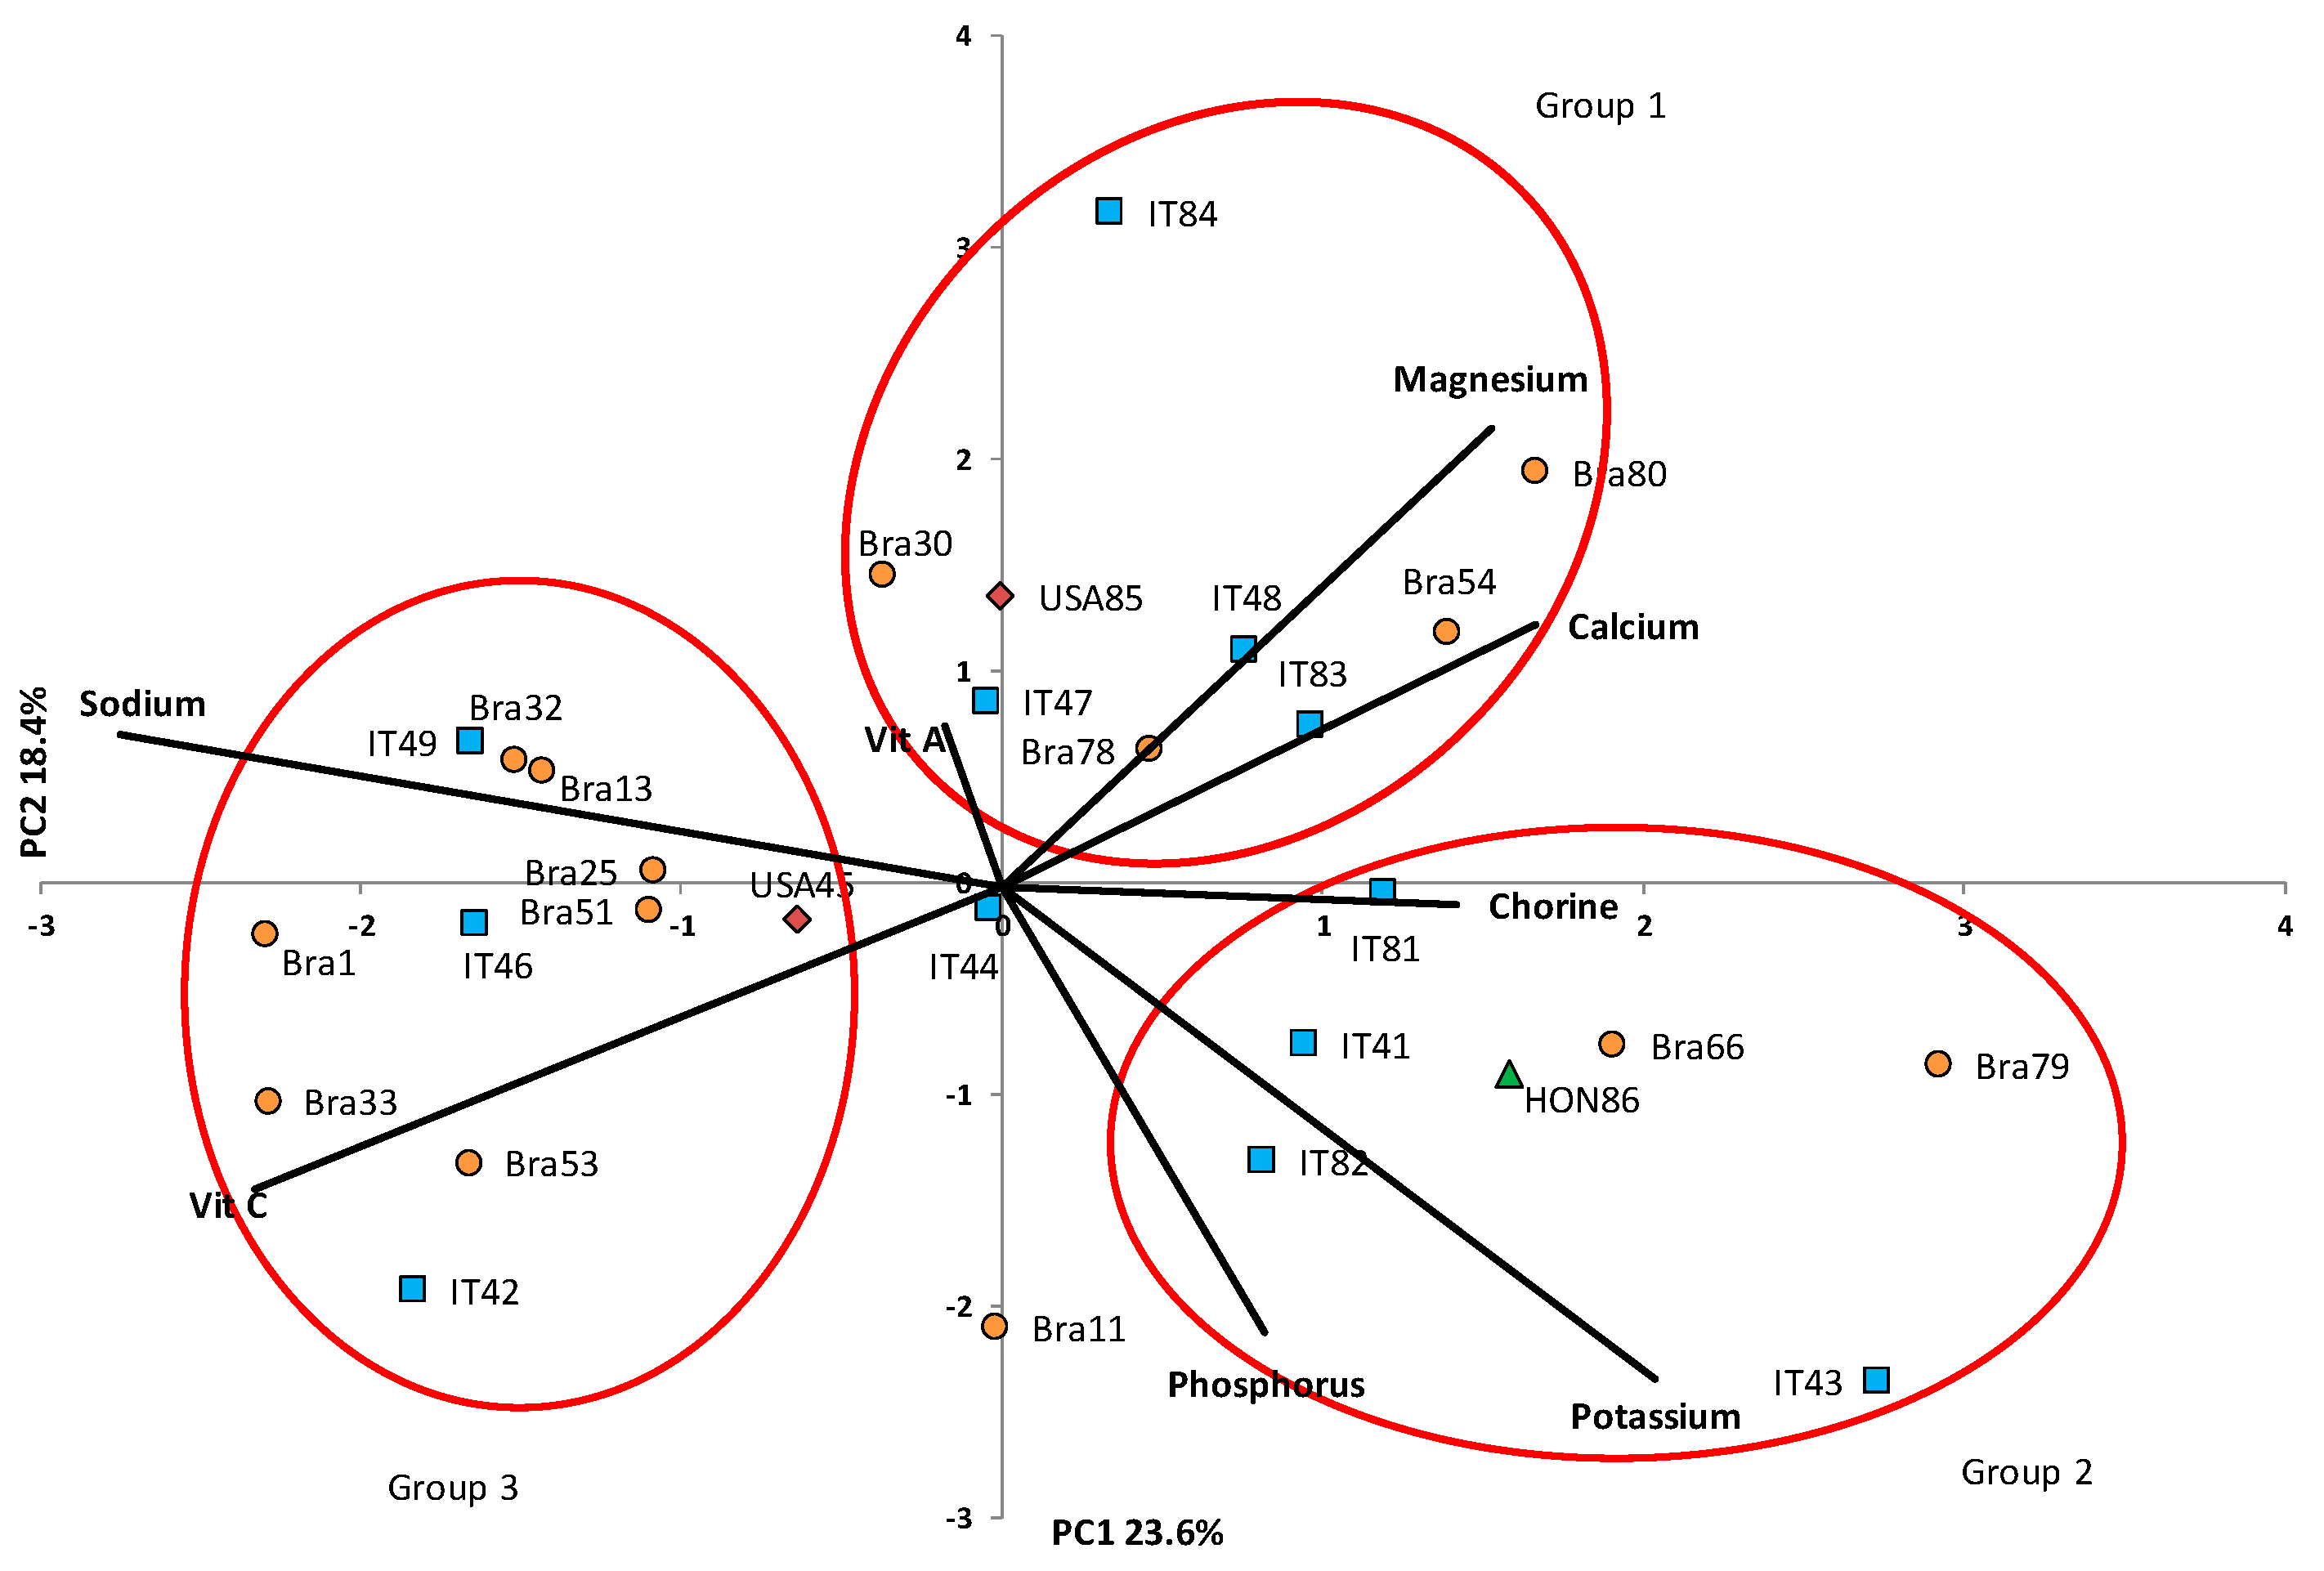
2.12. Statistical Analysis

The complete set of data for each variety was analyzed by the PCA procedure using the software Statgraphics Centurion 18.1.06 (Statgraphics Technologies, Inc., The Plains, VA, USA). All qualitative trait data were processed by ANOVA using the software CoStat 6.400 (CoHort Software, CA, USA). The comparison has been realized among all the sweet potato genotypes using a one-way randomized block analysis type. In the case of significant differences, mean values were separated by Tukey HSD test.

3. Results

The highest percentages of dry matter content in the root (>40%) were found in the accessions Bra66, Bra78, Bra80, and IT48, and the lowest (<31%) in Bra30, Bra1, and IT49 (Table 2).
The percentage of starch in SP accessions ranged from 52.3% of Hon86 to 91.3% of IT47. Dividing the accessions according to starch content (<70%, 70–80%, and >80%) into three groups 9 out of the 29 accessions showed low starch content, 15 accessions the intermediate content, and 5 accessions the high content. Considering the origin of the accessions, Brazilian accessions had lower values (71.3%, on average) than the Italian ones (77.5%, on average) (Table 2).
Results on the raw product showed that the sucrose content of Bra66 (150 g kg−1 dw) was four-times higher than USA45 (36.4 g kg−1 dw) (Table 2). Glucose content in storage roots varied from 4.94 to 46.6 g kg−1 dw; Bra51, Bra30, and Hon86 had the highest amount of glucose, with values 10-times higher than the lower one (IT44). Hon86 showed the higher values of fructose (46.2 g kg−1 dw), statistically similar to those of Bra51 and IT42 (43.5 and 36.6 g kg−1 dw, respectively). Accessions with the lowest content of fructose were found for cream-fleshed SP and white-fleshed SP, such as IT81, IT44, and IT84, with values ranging between 3.83 and 4.43 g kg−1 dw.
Figure 1 shows the TP contents and TAA of raw SP roots on a dry weight basis. Content of TP ranged between 870 and 6440 mg GAE kg−1 dw. In the purple ecotypes, the TP content was about two to five times higher than other genotypes. The TAA of roots decreased from purple-fleshed > white-fleshed > orange-fleshed > cream-fleshed SP accessions. The higher antioxidant activity was found in purple-fleshed accessions USA45, Bra1, Bra25, and Bra80, with 6700, 4654, 3562, and 2561 mg Fe2+E kg−1 dw, respectively.
As for the content in mineral elements and vitamins C and A, the values determined in the different accessions have been transformed into the percentage of contribution that a portion of 100 g can provide to the consumer. The reference values used for this processing (SP% contribution to DV) refer to the standards of the European Food Safety Agency (EFSA) and were calculated for both the adult (Table 3) and children (Table 4) consumers.
In Table 3, the higher levels of phosphorus were found in USA45, IT43, IT44, Bra53, and Bra54. One hundred grams of raw SP may provide up to 12.6% contribution to the DV of potassium; the lowest values belong to the colored accessions (purple-, pale-yellow, or orange-fleshed PS), whereas the accessions with pale colors had the highest contribution to the DV. The same pattern was observed for magnesium, and the accessions with the highest contribution to the DV were IT84, IT83, Bra78, and IT44, (39.5%, 31.9%, 28.1%, and 28.0%, respectively). The contribution of the SPs to the DV of calcium ranged between 4.99% and 10.9%. IT84, Bra80, Bra54, Bra79, Hon86, and USA85 accessions had the highest content of calcium. The contribution of the SPs to the DV of vitamin C showed a high variation among the accessions with values ranging from 26.2% to 197%; the cream-fleshed SPs and purple-fleshed SPs were found to have the highest supply of vitamin C.
As for the contribution to the DV of vitamin A, some accessions did not show relevant values. However, Hon86 had the highest values (32.3%). The white-fleshed SPs showed really low values of vitamin A, and in some accessions, the contents were lower than those assessable by the method. The accessions with cream- or light-orange-flesh had the intermediate levels and, in any case, lower than 5% (Table 3). In Table 4, the values of the nutritional parameters have presented the same trends described for the adult consumer, obviously these results are conditioned by a different daily requirement that distinguishes the consumer under the age of 17.
It is interesting to underline that some genotypes can satisfy significant amounts of nutrients such as USA45 for phosphorus (11.2%), IT43 for potassium (27.9%), IT84 for magnesium (46%), and BRA80 for calcium (13%). Most of the accessions considered (>75%) can completely satisfy the need for vitamin C, additionally, HON86 contributes more than 50% of the daily requirement of retinol (vitamin A). The analysis of the PCA and the vector components summarize in a clear way the behavior of the SP accessions in relation to the nutritional potential of a 100 g ration for an adult (Figure 2) and a child (Figure 3). The data of the two categories of consumers are quite similar. However, in both, it is possible to identify three groups of accession able to better satisfy nutritional needs. Particularly, group 1 includes accessions able to supply a significant amount of phosphorus, potassium, and chlorine; for group 2 calcium and magnesium are the most present elements; finally, the third group is characterized by a higher concentration of sodium and vitamin C. Some genotypes have intermediate characteristics, such as IT47 and IT44, which are placed in the center of the figure, and Bra11 which is positioned between groups 1 and 3.

4. Discussion

The overall nutritional picture that emerged from this work highlights the high potential that SP can offer the consumer in relation to the accession. From a qualitative point of view, the content of starch and soluble sugars represents a relevant aspect considering that the carbohydrate content is directly linked to the sensory aspects that characterize this product.
Roots of SPs are generally stored before the commercialization to increase their sweetness index, so the content of the main metabolic sugars such as glucose, sucrose, and fructose can be influenced either by post-harvest conditions or by the specific physiology of every accession. Indeed, sugar composition is specific to every accession. Sucrose and starch are largely responsible for the post-harvest behavior and the taste of the SP. The cooking procedure can further modify the sugar composition [19]. Conversely, four breeding lines and five commercial varieties of SPs analyzed by Lewthwaite et al. [20], showed that orange-fleshed SPs had a higher content of glucose and fructose compared to the others. Similarly, Agnes et al. [21] found a relationship between sucrose content and color of the flesh: the white-fleshed SP contained less sucrose than the orange-fleshed SP and yellow-fleshed SP. An opposite trend was found for the glucose and fructose contents, as well. Sucrose content is also a physiological signal for the formation of storage roots because there is a trigger of several genes involved in the tissue differentiation. Besides, sucrose is loaded in root cells, and it is converted to hexoses inside amyloplasts and stored as starch. Cervantes-Flores et al. [22] demonstrated that SPs varieties with orange-flesh have lower concentrations of starch. According to them, the concentration of starch and the amount of β-carotene are inversely related, most likely because these two substances compete for the synthesizing sites in the plastids. Our data are in agreement with these findings as the orange genotype Hon86 was characterized by a lower starch content.
The low content of soluble sugars slows the retrogradation of starch, improving the texture after cooking [23]. The genotypes with a lower content of total sugars were Bra33, USA45, and IT48, therefore, they could be used by the food processing industry because the low content of soluble sugars increases the shelf life [24]. As a high amount of sugar can affect the final color and the texture of the food, high levels of simple sugars can interfere with the starch hydration due to the competition with the starch for free water in the flour-water system. During cooking at high temperature, the free sugars interact with proteins and confer brown coloration during the process of caramelization. The dehydration of the carbohydrates at high temperatures provides characteristic color and flavor. Therefore, due to the proportion of sugars, Bra51, Hon86, Bra32, and IT43, could be suitable for frying. It is strategic for the food industry to also consider the ratio of sugars and the starch content of SP roots because these properties can change the chemical-physical properties of the food. The accessions of SP with high starch content, low total sugar, and high dry matter content are suitable for frying, roasting, or baking [21]. Overall, USA45 and Bra33 have interesting characteristics for home cooking. Concerning the dry matter, the values varied between 29.5% and 43.1% and are in line with what was reported by Ellong et al. [25], but higher than that found by Laurie et al. [26] in other genotypes. Therefore, considering the values detected in this experiment, it seems useful to use the classification proposed by Truong et al. [27] which allows to identify all genotypes with a percentage of dry matter higher than 30% as “dry”, whereas the BRA51 genotype can be classified as “intermediate”.
Cooking methods can influence the nutrient retention of raw SPs, therefore it is essential to use the correct cooking system to maintain as much as possible the nutritional values that the product is able to offer, especially for phenols, vitamin C, or carotenoids. This aspect should be considered for the estimation of the percent of contribution to DV. Several studies have demonstrated that high retention of total carotenoids is reached by using oven drying, with losses ranging from 10 to 4% compared to the raw product. The boiling and the frying processes are characterized by a carotenoid loss from 15% to 10% and from 23% to 15%, respectively [28]. The preservation of carotenoids is essential, as they are linked to protective effects against the mutagenic activity and free radicals [29]. Indeed, regular consumption of food rich in phenols, such as fruits and vegetables, can contribute to the prevention of several diseases, such as cardiac pathology, cancer, and infections [30,31,32]. Heating can affect the content of the phenolic compounds and antioxidants because the temperature affects the structure of the cells which then release pigments from the cell wall [33]. Nicoletto et al. [19] measured the effect of the cooking process on the qualitative traits of SP and demonstrated an increase in the total phenol and antioxidant capacity content after cooking. For instance, the fried samples had 78% higher antioxidants content than raw samples. Indeed, Padda and Picha [14] compared the phenolic and antioxidant activity and found a similar difference among the 14 SP varieties tested. Our results agree with previous studies, where purple-flashed SPs had a higher amount of phenolic compounds [14,16,34]. The same varieties showed a higher amount of these compounds and the cream- and white-fleshed varieties had a lower content. The genetic variability of the genotypes may be the cause of the variation in phenolic content. The vegetables with red or purple-blue color had a high amount of phenolic and antioxidant compounds, and the levels of some accessions of SPs are comparable to those found in strawberries and blackberries [34].
According to the World Health Organization (WHO), as reported by Stone et al. [35], an insufficient intake of minerals is one of the main risks for human health worldwide. In some countries, the occurrence of this problem is driven by the resource shortages, becoming a leading concern to public health. Significant steps are being taken to address malnutrition: globally, stunting among children under the age of five decreased from 32.6% in 2000 to 22.2% in 2017, whereas there was a slight decrease in underweight women from 11.6% in 2000 to 9.7% in 2016. However, this slow and piecemeal improvement must be pursued further. It should also be considered that the consumption of SP can improve the health of consumers even in developed countries, especially with regard to food with high fiber and a low or medium glycemic index, which can be beneficial for diabetic or insulin-resistant consumers [36]. Moreover, dietary fiber can play an important role in human health revealing a good relationship with the incidence of constipation, obesity, cardiovascular diseases, colon cancer, and diabetes mellitus [37,38,39]. The diary intake of food with a high antioxidant, phenols, and vitamin contents could be a possible solution for those consuming nutritionally deficient diets.
The WHO and the Europe Food Safety Authority (EFSA) have guidelines for nutrients ingest and the level of necessary intake to satisfy the daily demand for healthy nutrients. For instance, phosphorus plays a role in the metabolism of carbohydrates and fats, making it indispensable for the human body; potassium participates in the osmoregulation of cells, and its absorption by the body is about 90% [35]. According to these aspects, it is important to highlight that some of the accessions considered in this trial can provide a significant amount of phosphorus and potassium such as IT43 and IT81, respectively. Vitamin C, an essential and well-known antioxidant that protects cells against free radical damage, can be supplied in a high amount in SPs. Ten out of the 29 accessions tested in this experiment can fully provide the daily intake by eating a 100 g portion. The assimilation of Vitamin C is high and, during digestion, up to 70–90% is absorbed [40].
Vitamin A is a group of fat-soluble compounds including retinol, retinal, and some esters; it plays a fundamental role in the visual system, immunity, and maintenance of the cells’ function. The human body needs a small amount but cannot synthesize it. The demands are more critical in infancy, adolescence, and pregnancy/lactation [41], and vitamin A deficiency is an essential matter in developing countries. Despite the losses due to the cooking process, about 26% [42] of the orange-fleshed SPs showed a higher contribution to the DV. These results agree with those of Burri [43], Huang et al. [42], and Tumwegamire et al. [44]. Therefore, SP can be a considerable a valuable source for a vitamin A deficient population. For example, Burri [43] calculated that one person needs to eat only half a cup of orange-fleshed SP to supply 100% DV of vitamin A. In accordance with what was found by Palumbo et al. [45], the content of vitamin C and vitamin A does not appear to be linked to high concentrations of potassium and calcium, as it is well shown in Figure 2 and Figure 3.

5. Conclusions

According to the obtained data, the consumption of SP could help the intake of phosphorous, potassium, magnesium, calcium, vitamin C, and vitamin A. In particular, orange- and purple-fleshed SPs provide a significant antioxidant and vitamin contribution to the human diet. SP is a staple food in many countries and breeding it to fortify some nutritional values could be the key to enhance the diet value of populations in many regions of the world. In Europe, the growing demand for this product has attracted farmers who are now looking for new opportunities. SP crop production in temperate zones is quite recent, and research is limited. This study has attempted to give guidelines from a nutritional point of view for further research in order to expand both production and consumption of SPs in Europe. Some interesting accessions for consumption were highlighted, in particular USA45 and Bra33, whereas Bra33, USA45, and IT48 showed great traits of their potential use by the food processing industry.
These sweet potato accessions can improve the daily intake of minerals in the diet giving guidelines for deeper research and to expand the production and consumption of sweet potatoes in Europe.

Author Contributions

Conceptualization, A.C.G., C.N., P.S., and P.F.V.; methodology, A.C.G. and C.N.; software, A.C.G. and C.N.; validation, A.C.G. and C.N.; formal analysis, A.C.G., C.N., and G.Z.; investigation, A.C.G. and C.N.; resources, P.S.; data curation, A.C.G. and C.N.; writing—original draft preparation, A.C.G. and C.N.; writing—review and editing, A.C.G., C.N., G.Z., P.S., and P.F.V.; supervision, P.S.; project administration, P.S.; funding acquisition, P.S. All authors have read and agreed to the published version of the manuscript.

Funding

This research received no external funding.

Institutional Review Board Statement

Not applicable.

Informed Consent Statement

Not applicable.

Conflicts of Interest

The authors declare no conflict of interest.

References

  1. Mussoline, W.A.; Wilkie, A.C. Feed and fuel: The dual-purpose advantage of an industrial sweetpotato. J. Sci. Food Agric. 2017, 97, 1567–1575. [Google Scholar] [CrossRef]
  2. Low, J.; Ball, A.; Magezi, S.; Njoku, J.; Mwanga, R.; Andrade, M.; van Mourik, T. Sweet potato development and delivery in sub-Saharan Africa. Afr. J. Food Agric. Nutr. Dev. 2017, 17, 11955–11972. [Google Scholar] [CrossRef]
  3. FAOSTAT. 2019. Crop Production Statistics. 2018. Available online: http://faostat3.fao.org/home/E (accessed on 30 December 2020).
  4. Altemimi, A.B. Extraction and Optimization of Potato Starch and Its Application as a Stabilizer in Yogurt Manufacturing. Foods 2018, 7, 14. [Google Scholar] [CrossRef] [Green Version]
  5. CBI Market Intelligence. CBI Product Factsheet Fresh Sweet Potatoes in Europe. 2015. Available online: https://it.scribd.com/document/326237170/Product-Factsheet-Europe-Fresh-Sweet-Potatoes-2015 (accessed on 30 December 2020).
  6. Neela, S.; Fanta, S.W. Review on nutritional composition of orange-fleshed sweet potato and its role in management of vitamin A deficiency. Food Sci. Nutr. 2019, 7, 1920–1945. [Google Scholar] [CrossRef] [Green Version]
  7. Cartier, A.; Woods, J.; Sismour, E.; Allen, J.; Ford, E.; Githinji, L.; Xu, Y. Physiochemical, nutritional and antioxidant properties of fourteen Virginia-grown sweet potato varieties. J. Food Meas. Charact. 2017, 11, 1333–1341. [Google Scholar] [CrossRef]
  8. Bruins, M.J.; Bird, J.K.; Aebischer, C.P.; Eggersdorfer, M. Considerations for Secondary Prevention of Nutritional Deficiencies in High-Risk Groups in High-Income Countries. Nutrients 2018, 10, 47. [Google Scholar] [CrossRef] [Green Version]
  9. Kehoe, L.; Walton, J.; Flynn, A. Nutritional challenges for older adults in Europe: Current status and future directions. Proc. Nutr. Soc. 2019, 78, 1–13. [Google Scholar] [CrossRef]
  10. Lockyer, S.; White, A.; Buttriss, J.L. Biofortified crops for tackling micronutrient deficiencies–what impact are these having in developing countries and could they be of relevance within Europe? Nutr. Bull. 2018, 43, 319–357. [Google Scholar] [CrossRef]
  11. Islam, S.N.; Nusrat, T.; Begum, P.; Ahsan, M. Carotenoids and β-carotene in orange fleshed sweet potato: A possible solution to vitamin A deficiency. Food Chem. 2016, 199, 628–631. [Google Scholar] [CrossRef]
  12. Zhao, J.-G.; Yan, Q.-Q.; Lu, L.-Z.; Zhang, Y.Q. In vivoantioxidant, hypoglycemic, and anti-tumor activities of anthocyanin extracts from purple sweet potato. Nutr. Res. Pr. 2013, 7, 359–365. [Google Scholar] [CrossRef] [Green Version]
  13. Salawu, S.O.; Udi, E.; Akindahunsi, A.A.; Boligon, A.A.; Athayde, M.L. Antioxidant potential, phenolic profile and nutrient composition of flesh and peels from Nigerian white and purple skinned sweet potato (Ipomea batatas L.). Asian J. Plant. Sci. 2015, 5, 14–23. [Google Scholar]
  14. Padda, M.S.; Picha, D.H. Quantification of phenolic acids and antioxidant activity in sweetpotato genotypes. Sci. Hortic. 2008, 119, 17–20. [Google Scholar] [CrossRef]
  15. Ji, H.; Zhang, H.; Li, H.; Li, Y. Analysis on the Nutrition Composition and Antioxidant Activity of Different Types of Sweet Potato Cultivars. Food Nutr. Sci. 2015, 6, 161–167. [Google Scholar] [CrossRef] [Green Version]
  16. Teow, C.C.; Truong, V.-D.; McFeeters, R.F.; Thompson, R.L.; Pecota, K.V.; Yencho, G.C. Antioxidant activities, phenolic and β-carotene contents of sweet potato genotypes with varying flesh colours. Food Chem. 2007, 103, 829–838. [Google Scholar] [CrossRef]
  17. Xu, F.; Yuan, Q.P.; Dong, H.R. Determination of lycopene and & beta-carotene by high-performance liquid chromatography using sudan I as internal standard. J. Chromatogr. B 2006, 838, 44–49. [Google Scholar] [CrossRef]
  18. Barba, A.O.I.; Hurtado, M.C.; Mata, M.S.; Ruiz, V.F.; De Tejada, M.L.S. Application of a UV–vis detection-HPLC method for a rapid determination of lycopene and β-carotene in vegetables. Food Chem. 2006, 95, 328–336. [Google Scholar] [CrossRef]
  19. Nicoletto, C.; Vianello, F.; Sambo, P. Effect of different home-cooking methods on textural and nutritional properties of sweet potato genotypes grown in temperate climate conditions. J. Sci. Food Agric. 2018, 98, 574–581. [Google Scholar] [CrossRef]
  20. Lewthwaite, S.L.; Sutton, K.H.; Triggs, C.M. Free sugar composition of sweetpotato cultivars after storage. N. Z. J. Crop. Hortic. Sci. 1997, 25, 33–41. [Google Scholar] [CrossRef]
  21. Agnes, N.; Agnes, N.; Yusuf, B.; Judith, N.; Trude, W. Potential use of selected sweetpotato (Ipomea batatas Lam) varieties as defined by chemical and flour pasting characteristics. Food Nutr. Sci. 2012, 3, 889–896. [Google Scholar]
  22. Cervantes-Flores, J.C.; Sosinski, B.; Pecota, K.V.; Mwanga, R.O.M.; Catignani, G.L.; Truong, V.D.; Watkins, R.H.; Ulmer, M.R.; Yencho, G.C. Identification of quantitative trait loci for dry-matter, starch, and β-carotene content in sweetpotato. Mol. Breed. 2011, 28, 201–216. [Google Scholar] [CrossRef]
  23. Kohyama, K.; Nishinari, K. Effect of soluble sugars on gelatinization and retrogradation of sweet potato starch. J. Agric. Food Chem. 1991, 39, 1406–1410. [Google Scholar] [CrossRef]
  24. Chang, S.-M.; Liu, L.-C. Retrogradation of Rice Starches Studied by Differential Scanning Calorimetry and Influence of Sugars, NaCl and Lipids. J. Food Sci. 1991, 56, 564–566. [Google Scholar] [CrossRef]
  25. Ellong, E.N.; Billard, C.; Adenet, S. Comparison of Physicochemical, Organoleptic and Nutritional Abilities of Eight Sweet Potato (Ipomoea batatas) Varieties. Food Nutr. Sci. 2014, 5, 196–311. [Google Scholar] [CrossRef] [Green Version]
  26. Laurie, S.M.; van Jaarsveld, P.J.; Faber, M.; Philpott, M.F.; Labuschagne, M.T. Trans-b-carotene, selected mineral content and potential nutritional contribution of 12 sweet potato varieties. J. Food Compost. Anal. 2012, 27, 151–159. [Google Scholar] [CrossRef]
  27. Truong, V.D.; Hamann, D.D.; Walter, W.M. Relationship between instrumental and sensory parameters of cooked sweetpotato texture. J. Texture Stud. 1997, 28, 163–185. [Google Scholar] [CrossRef]
  28. Vimala, B.; Nambisan, B.; Hariprakash, B. Retention of carotenoids in orange-fleshed sweet potato during processing. J. Food Sci. Technol. 2011, 48, 520–524. [Google Scholar] [CrossRef] [Green Version]
  29. Rumbaoa, R.G.O.; Cornago, D.F.; Geronimo, I.M. Phenolic content and antioxidant capacity of Philippine sweet potato (Ipomoea batatas) varieties. Food Chem. 2009, 113, 1133–1138. [Google Scholar] [CrossRef]
  30. Giglio, R.V.; Patti, A.M.; Cicero, A.F.; Lippi, G.; Rizzo, M.; Toth, P.P.; Banach, M. Polyphenols: Potential Use in the Prevention and Treatment of Cardiovascular Diseases. Curr. Pharm. Des. 2018, 24, 239–258. [Google Scholar] [CrossRef]
  31. Li, S.; Tan, H.-Y.; Wang, N.; Cheung, F.; Hong, M.; Feng, Y. The Potential and Action Mechanism of Polyphenols in the Treatment of Liver Diseases. Oxidative Med. Cell. Longev. 2018, 2018, 1–25. [Google Scholar] [CrossRef] [Green Version]
  32. Oak, M.-H.; Auger, C.; Belcastro, E.; Park, S.-H.; Lee, H.-H.; Schini-Kerth, V.B. Potential mechanisms underlying cardiovascular protection by polyphenols: Role of the endothelium. Free. Radic. Biol. Med. 2018, 122, 161–170. [Google Scholar] [CrossRef]
  33. Huang, Y.-C.; Chang, Y.-H.; Shao, Y.-Y. Effects of genotype and treatment on the antioxidant activity of sweet potato in Taiwan. Food Chem. 2006, 98, 529–538. [Google Scholar] [CrossRef]
  34. Cevallos-Casals, B.A.; Cisneros-Zevallos, L. Stoichiometric and kinetic studies of phenolic antioxidants from Andean purple corn and red-fleshed sweetpotato. J. Agric. Food Chem. 2003, 51, 3313–3319. [Google Scholar] [CrossRef]
  35. Stone, M.S.; Martyn, L.; Weaver, C.M. Potassium Intake, Bioavailability, Hypertension, and Glucose Control. Nutrients 2016, 8, 444. [Google Scholar] [CrossRef] [Green Version]
  36. Allen, C.J.; Corbitt, D.A.; Maloney, P.K.; Butt, S.M.; Truong, V.D. Glycemic index of sweet potato as affected by cooking methods. Open Nutr. J. 2012, 6, 1–11. [Google Scholar] [CrossRef]
  37. Redondo-Cuenca, A.; Villanueva-Suárez, M.J.; Rodríguez-Sevilla, M.D.; Mateos-Aparicio, I. Chemical composition and dietary fibre of yellow and green commercial soybeans (Glycine max). Food Chem. 2007, 101, 1216–1222. [Google Scholar] [CrossRef]
  38. Mei, X.; Mu, T.-H.; Han, J.-J. Composition and Physicochemical Properties of Dietary Fiber Extracted from Residues of 10 Varieties of Sweet Potato by a Sieving Method. J. Agric. Food Chem. 2010, 58, 7305–7310. [Google Scholar] [CrossRef]
  39. Yoshimoto, M.; Yamakawa, O.; Tanoue, H. Potential Chemopreventive Properties and Varietal Difference of Dietary Fiber from Sweetpotato (Ipomoea batatas L.) Root. Jpn. Agric. Res. Quarterly 2005, 39, 37–43. [Google Scholar] [CrossRef] [Green Version]
  40. World Health Organization. Global Prevalence of Vitamin a Deficiency in Populations at Risk 1995–2005: WHO Global Database on Vitamin a Deficiency; WHO Press: Geneva, Switzerland, 2009; Volume 55, ISBN 978 92 4 159801 9. [Google Scholar]
  41. Almeida, L.B.; Penteado, M.V. Carotenoids and pro-vitamin A value of white fleshed Brazilian sweet potatoes (Ipomoea batatas Lam.). J. Food Compos. Anal. 1988, 1, 341–352. [Google Scholar] [CrossRef]
  42. Huang, A.S.; Tanudjaja, L.; Lum, D. Content of Alpha-, Beta-Carotene, and Dietary Fiber in 18 Sweetpotato Varieties Grown in Hawaii. J. Food Compos. Anal. 1999, 12, 147–151. [Google Scholar] [CrossRef]
  43. Burri, B.J. Evaluating Sweet Potato as an Intervention Food to Prevent Vitamin A Deficiency. Compr. Rev. Food Sci. Food Saf. 2011, 10, 118–130. [Google Scholar] [CrossRef]
  44. Tumwegamire, S.; Kapinga, R.; Rubaihayo, P.R.; LaBonte, D.R.; Grüneberg, W.J.; Burgos, G.; Felde, T.Z.; Carpio, R.; Pawelzik, E.; Mwanga, R.O. Evaluation of Dry Matter, Protein, Starch, Sucrose, β-carotene, Iron, Zinc, Calcium, and Magnesium in East African Sweetpotato [Ipomoea batatas (L.) Lam] Germplasm. HortScience 2011, 46, 348–357. [Google Scholar] [CrossRef]
  45. Palumbo, F.; Galvao, A.C.; Nicoletto, C.; Sambo, P.; Barcaccia, G. Diversity Analysis of Sweet Potato Genetic Resources Using Morphological and Qualitative Traits and Molecular Markers. Genes 2019, 10, 840. [Google Scholar] [CrossRef] [PubMed] [Green Version]
Figure 1. Total phenols content and total antioxidant activity of sweet potato genotypes. Histogram values without common letters significantly differed at p < 0.05 according to Tukey’s HSD test.
Horticulturae 07 00023 g001
Figure 2. Principal components analysis (PCA) of the sweet potato core collection based on qualitative traits and their contribution to the daily nutritional intake according to adults’ needs (European Food Safety Agency standards). Genotypes origin: Horticulturae 07 00023 i001 Honduras; Horticulturae 07 00023 i002 United States; Horticulturae 07 00023 i003 Italy; Horticulturae 07 00023 i004 Brazil.
Horticulturae 07 00023 g002
Figure 3. Principal components analysis (PCA) of the sweet potato core collection based on qualitative traits and their contribution to the daily nutritional intake according to children’s needs (European Food Safety Agency standards). Genotypes origin: Horticulturae 07 00023 i001 Honduras; Horticulturae 07 00023 i002 United States; Horticulturae 07 00023 i003 Italy; Horticulturae 07 00023 i004 Brazil.
Horticulturae 07 00023 g003
Table 1. List of the sweet potato genetic materials and their main morphological traits.
Genetic MaterialCountry of OriginFlesh ColorSkin ColorRoots Shape
Bra1BrazilPurpleDark purpleElliptic
Bra11BrazilCreamPinkRound elliptic
Bra13BrazilWhiteCreamElliptic
Bra25BrazilPurpleCreamLong oblong
Bra30BrazilWhitePinkLong irregular
Bra32BrazilPale orangePinkOblong
Bra33BrazilPurpleCreamOblong
Bra51BrazilWhiteCreamLong elliptic
Bra53BrazilPurpleWhiteOblong
Bra54BrazilIntermediate orangeYellowElliptic
Bra66BrazilWhiteWhiteLong irregular
Bra78BrazilCreamPinkLong irregular
Bra79BrazilPurplePinkObovate
Bra80BrazilPurpleDark purpleObovate
Hon86HondurasDeep orangePurple-redRound elliptic
IT41ItalyCreamCreamLong irregular
IT42ItalyCreamPinkRound
IT43ItalyPale yellowPinkObovate
IT44ItalyWhiteCreamElliptic
IT46ItalyCreamPinkObovate
IT47ItalyCreamCreamOvate
IT48ItalyCreamCreamRound elliptic
IT49ItalyPale yellowPinkRound elliptic
IT81ItalyCreamCreamObovate
IT82ItalyCreamCreamRound elliptic
IT83ItalyCreamCreamObovate
IT84ItalyCreamCreamLong irregular
USA85USAPale yellowCream Round elliptic
USA45USAPurpleDark purpleLong oblong
Table 2. Main qualitative composition of the tested sweet potato accessions.
Genetic MaterialsDry Matter (%)Starch (% dw)Sucrose g/kg dwGlucose g/kg dwFructose g/kg dw
Bra135.9 b69.5 c76.0 hij21.7 def16.2 efg
Bra1134.7 b72.4 b88.8 ghi19.8 efg14.9 efg
Bra1332.3 bc64.6 c106 efg 8.58 ijk6.09 g
Bra2535.9 b71.6 b55.7 jkl32.6 bcd32.5 bcd
Bra3030.7 c69.5 c68.2 ijk46.2 a34.1 abcd
Bra3232 bc71.8 b138 abc16.7 efg14.4 efg
Bra3335.9 b82.5 ab37.5 kl27.1 cde30.2 cd
Bra5129.5 c69.6 c114 cde46.6 a43.5 ab
Bra5334.3 b70.5 bc117 cde22.1 def23.2 def
Bra5436.6 b77.9 b134 bcd13.9 ghi11.2 fg
Bra6641.5 a63.6 c150 a6.72 jk7.16 g
Bra7841.8 a69.8 c97.8 fgh19.1 efg15.1 efg
Bra7937.2 b71.2 b110 cde13.7 ghi12.0 fg
Bra8043.1 a74.4 b93.2 fgh10.5 ghi9.50 g
Hon8635.9 b52.3 d95.5 fgh43.2 ab46.2 a
IT4136.6 b82.9 ab103 efg9.30 hij7.63 g
IT4234.3 b72.6 b74.0 hij38.1 abc36.6 abc
IT4333.2 bc73.4 b144 ab12.3 ghi10.4 g
IT4436.8 b78.9 b109 def4.94 k3.87 g
IT4634.2 b74.7 b76.3 hij15.5 efg15.5 efg
IT4735.7 b91.3 a95.9 fgh7.38 ijk5.16 g
IT4840.4 a89.2 a93.2 fgh7.90 ijk5.52 g
IT4930.4 c79.5 b92.2 ghi36.8 abc24.5 cde
IT8136.2 b72.2 b125 bcd5.24 k3.83 g
IT8233.9 bc73.4 b111 cde10.9 ghi8.98 g
IT8339.5 ab76.8 b107 def7.87 ijk5.97 g
IT8439.6 ab69.9 c94.7 fgh7.00 jk4.43 g
USA4535.9 b81.4 ab36.4 l37.0 abc35.2 abcd
USA8535.9 b60.1 cd69.6 ijk26.4 cde31.5 bcd
Within each parameter, values without common letters significantly differed at p < 0.05 according to Tukey’s HSD test.
Table 3. Percentage of the contribution to the daily value of minerals and vitamins based on 100 g fresh sweet potato consumption per day for the different accessions according to adults’ needs (European Food Safety Agency standards).
Genetic MaterialPKNaClMgCaVit CVit A
Bra16.78 ef5.44 n5.28 a3.41 a15.2 gh7.20 bc186 an.d.
Bra118.14 ab10.4 ef2.38 hi1.54 ij14.4 gh6.45 cd119 abn.d.
Bra136.56 fgh6.77 m4.93 ab3.18 ab24.4 de6.74 cd105 bn.d.
Bra256.10 hi7.25 kl3.89 cd2.51 cd16.2 gh7.94 bc119 abn.d.
Bra303.46 o5.94 n3.51 ef2.26 ef18.6 ef5.97 den.d.0.49 c
Bra324.67 lm7.40 kl5.27 a3.40 a15.0 gh7.74 bc167 a4.55 b
Bra337.25 cd6.99 lm3.58 de2.31 de15.0 gh5.97 de154 abn.d.
Bra515.66 ij7.93 ij3.77 de2.43 de17.3 fg5.64 de126 ab0.18 c
Bra538.68 ab8.78 gh5.14 a3.31 a17.0 fg9.62 bcn.d.n.d.
Bra548.49 ab6.98 lm3.47 ef2.24 ef27.4 cd10.1 ab93.0 bc3.67 b
Bra667.64 bc12.6 bc2.65 hi1.71 ij26.9 cd7.84 bc106 b0.17 c
Bra788.23 ab8.18 hi4.77 ab3.08 ab28.1 bc7.96 bc58.3 dn.d.
Bra797.62 bc12.9 b0.88 l0.57 l19.6 ef9.70 bcn.d.n.d.
Bra805.91 ij7.28 kl2.93 gh1.89 gh26.9 cd10.9 a190 an.d.
Hon867.24 cd12.2 c1.77 k1.14 k22.5 de8.61 bc98.7 bc32.3 a
IT417.11 cd11.1 d2.20 ij1.42 jk22.5 de6.58 cd85.8 cn.d.
IT426.84 de11.0 de4.47 bc2.88 bc11.1 h5.97 de197 a0.75 c
IT438.78 ab14.3 a0.86 l0.55 l16.4 gh6.83 cdn.d.n.d.
IT448.37 ab8.47 hi2.74 gh1.77 hi28.0 bc7.45 bc69.2 dn.d.
IT465.84 ij9.97 f5.10 a3.29 a20.0 ef5.93 den.d.n.d.
IT474.83 lm6.99 lm2.54 hi1.64 ij21.7 de6.52 cdn.d.n.d.
IT485.11 kl7.83 ij2.77 gh1.79 hi23.1 de7.53 bc92.2 bcn.d.
IT493.87 no6.81 m4.03 cd2.60 cd20.0 ef4.99 e46.9 d1.11 c
IT815.18 jk12.6 bc2.18 ij1.40 jk27.9 bc7.33 81102 bn.d.
IT826.69 fgh12.5 bc2.09 jk1.35 jk22.3 de6.41 cd103 bn.d.
IT836.90 de9.89 f3.35 fg2.16 fg31.9 ab8.45 bc72.4 dn.d.
IT844.38 mn5.57 n3.30 fg2.13 fg39.5 a9.31 bc129 abn.d.
US458.99 a7.56 jk5.02 ab3.24 ab24.8 de6.83 cd26.2 en.d.
US855.12 kl9.19 g2.66 hi1.71 ij20.7 ef8.55 bc63.5 dn.d.
Within each parameter, values without common letters significantly differed at p < 0.05 according to Tukey’s HSD test. n.d = not detected.
Table 4. Percentage of the contribution to the daily value of minerals and vitamins based on 100 g fresh sweet potato consumption per day for the different accessions according to children needs (European Food Safety Agency standards).
Genetic MaterialPKNaClMgCaVit CVit A
Bra18.47 ef10.6 n6.21 a2.57 bc17.7 fg8.55 ab419 an.d.
Bra1110.2 bc20.1 ef2.80 hi2.58 bc16.8 gh7.65 bc268 bn.d.
Bra138.21 gh13.2 m5.80 ab2.02 hi28.4 bc8.00 bc238 bn.d.
Bra257.63 hi14.1 kl4.58 cd1.95 ij18.9 fg9.43 ab267 bn.d.
Bra304.32 o11.5 n4.13 de2.83 ab21.7 cd7.09 cdn.d.0.87 c
Bra325.83 lm14.4 kl6.20 a2.85 ab17.5 fg9.19 ab376 ab8.11 b
Bra339.06 cd13.6 lm4.21 de1.23 m17.4 fg7.09 cd348 abn.d.
Bra517.07 ij15.4 ij4.44 de2.05 hi20.2 de6.70 de284 b0.32 c
Bra5310.9 bc17.1 gh6.04 a2.22 ef19.8 ef11.4 abn.d.n.d.
Bra5410.6 bc13.6 lm4.08 de2.32 ef32.0 bc12.0 ab209 bc6.53 b
Bra669.54 cd24.5 bc3.12 hi2.97 a31.4 bc9.31 ab239 b0.32 c
Bra7810.3 bc15.9 hi5.61 ab2.55 bc32.8 bc9.45 ab131 cn.d.
Bra799.52 cd25.1 b1.04 l2.36 ef22.8 cd11.5 abn.d.n.d.
Bra807.39 ij14.2 kl3.44 fg2.48 cd31.3 bc13.0 a427 an.d.
Hon869.05 cd23.7 c2.08 k2.27 ef26.2 bc10.2 ab222 b57.5 a
IT418.89 de21.6 d2.59 ij2.26 ef26.3 bc7.81 bc193 bcn.d.
IT428.55 ef21.4 de5.26 bc1.74 kl12.9 h7.09 cd444 a1.34 c
IT4311.0 ab27.9 a1.01 l2.73 ab19.1 fg8.11 bcn.d.n.d.
IT4410.5 bc16.5 hi3.23 gh1.49 lm32.6 bc8.85 ab155 cn.d.
IT467.30 ij19.4 f6.00 a1.36 m23.4 cd7.04 cdn.d.n.d.
IT476.04 lm13.6 lm2.99 hi2.18 fg25.4 bc7.74 bcn.d.n.d.
IT486.38 kl15.2 ij3.26 gh2.45 de27.0 bc8.94 ab207 bcn.d.
IT494.84 no13.2 m4.74 cd2.18 fg23.3 cd5.93 e105 d1.97 c
IT816.47 jk24.5 bc2.56 ij2.11 gh32.5 bc8.70 ab230 bn.d.
IT828.36 fg24.4 bc2.46 jk2.33 ef26.0 bc7.61 bc233 bn.d.
IT838.63 de19.2 f3.94 ef2.11 gh37.3 ab10.0 ab162 cn.d.
IT845.47 mn10.8 n3.89 ef1.85 jk46.0 a11.1 ab292 bn.d.
USA4511.2 a14.7 jk5.90 ab2.29 ef29.0 bc8.11 bc59.0 en.d.
USA856.40 kl17.9 g3.12 hi1.83 jk24.2 cd10.1 ab142 cn.d.
Within each parameter, values without common letters significantly differed at p < 0.05 according to Tukey’s HSD test. n.d = not detected.
Publisher’s Note: MDPI stays neutral with regard to jurisdictional claims in published maps and institutional affiliations.

