Fertilization and Pre-Sowing Seed Soaking Affect Yield and Mineral Nutrients of Ten Microgreen Species

Abstract
:1. Introduction
2. Materials and Methods
2.1. Plant Materials and Microgreen Culture
2.2. Shoot Harvest and Data Collection
2.3. Mineral Nutrient Analyses
2.4. Experimental Design and Statistical Analyses
3. Results
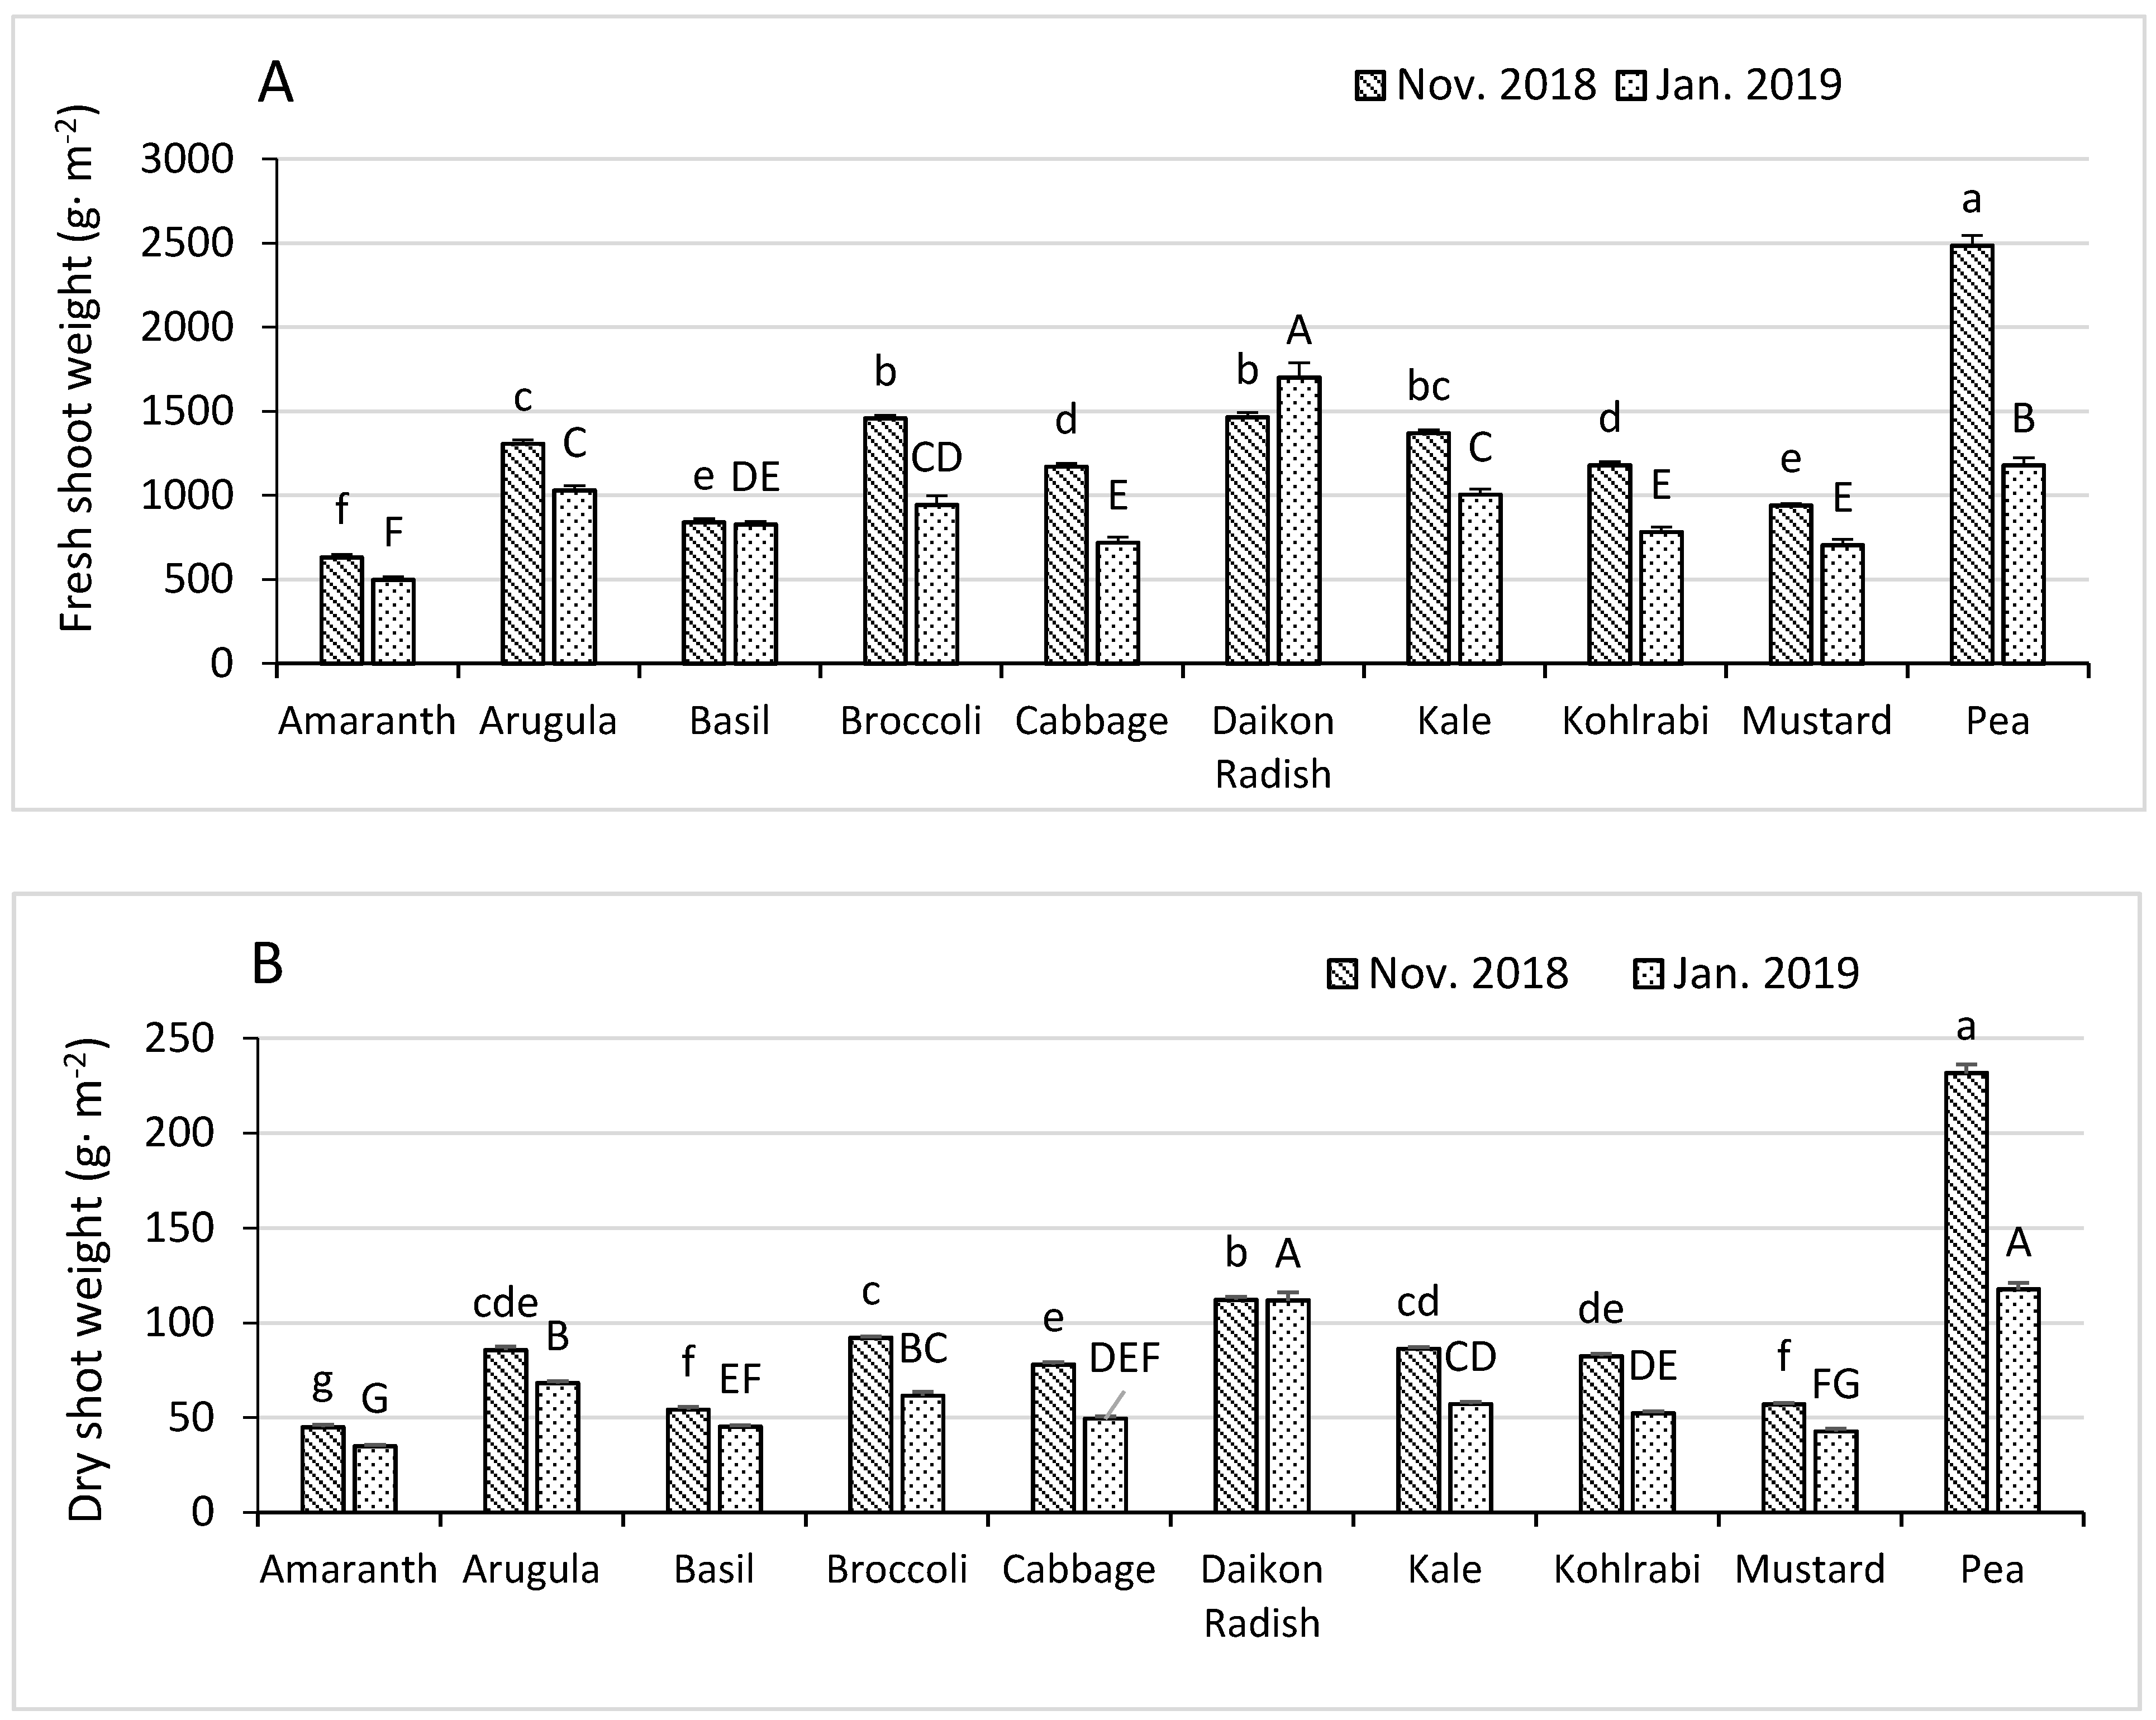
3.1. Fresh and Dry Shoot Weights
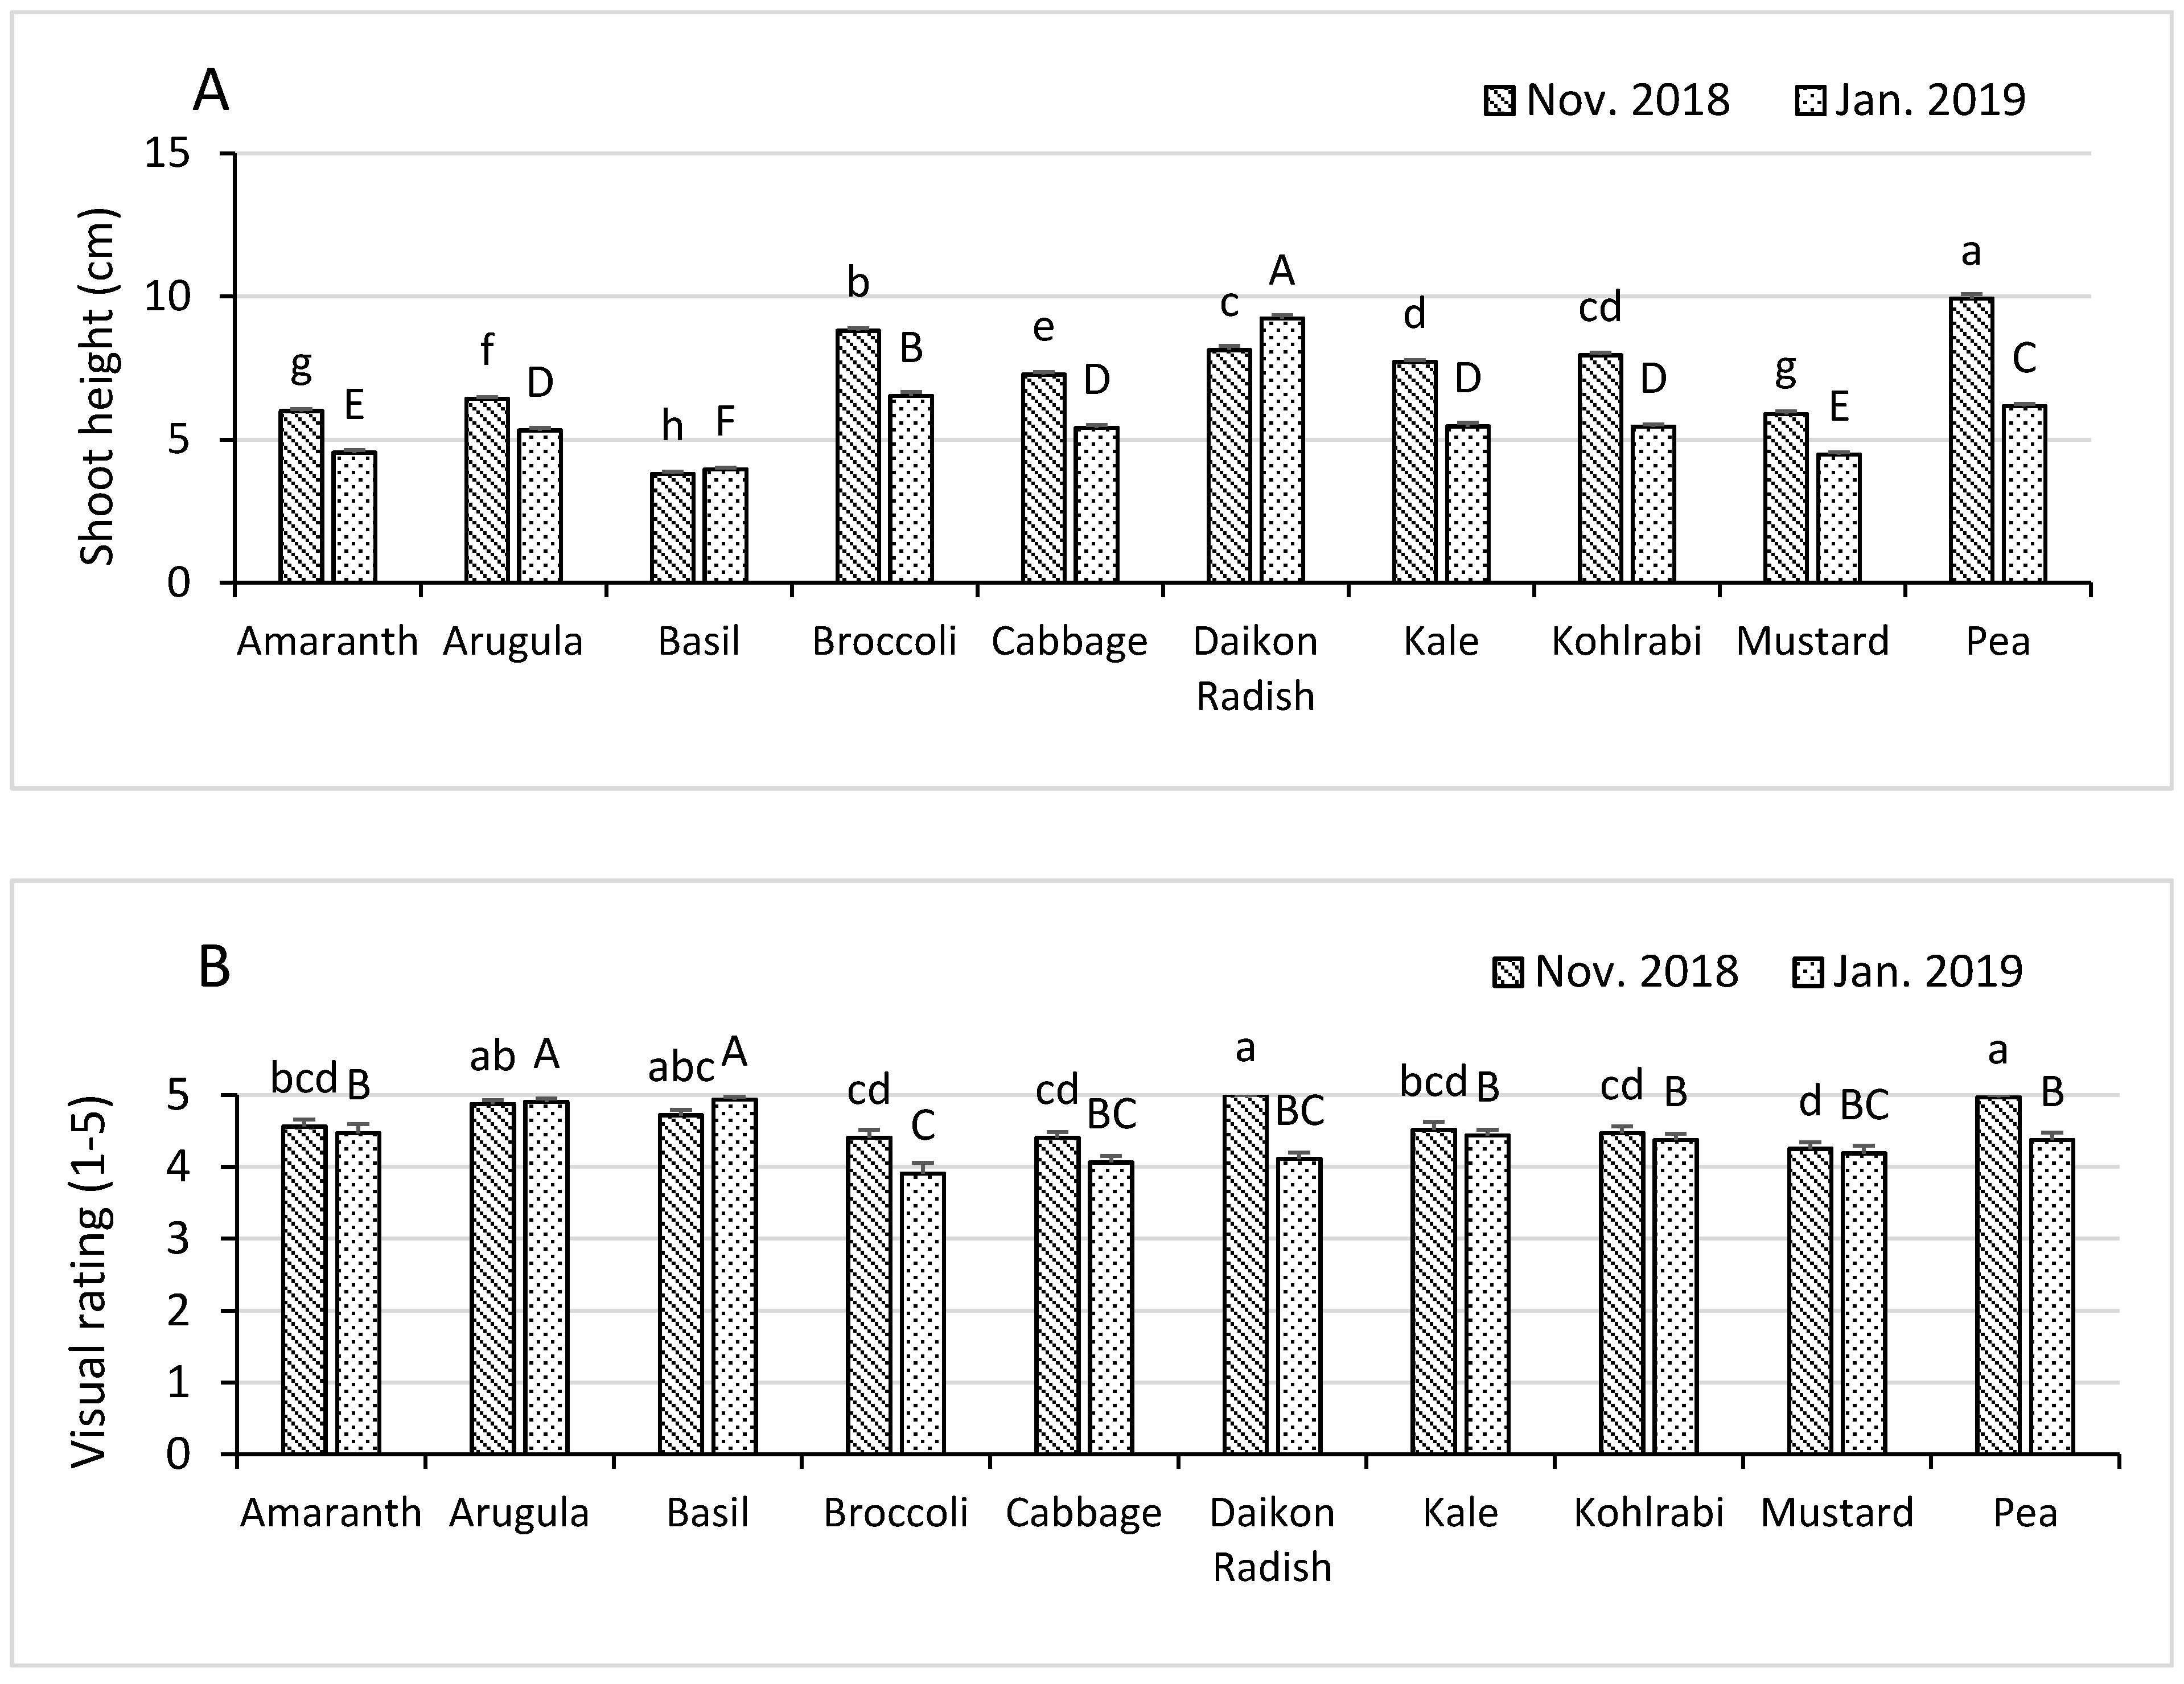
3.2. Shoot Height and Visual Rating
3.3. Macronutrient Concentrations
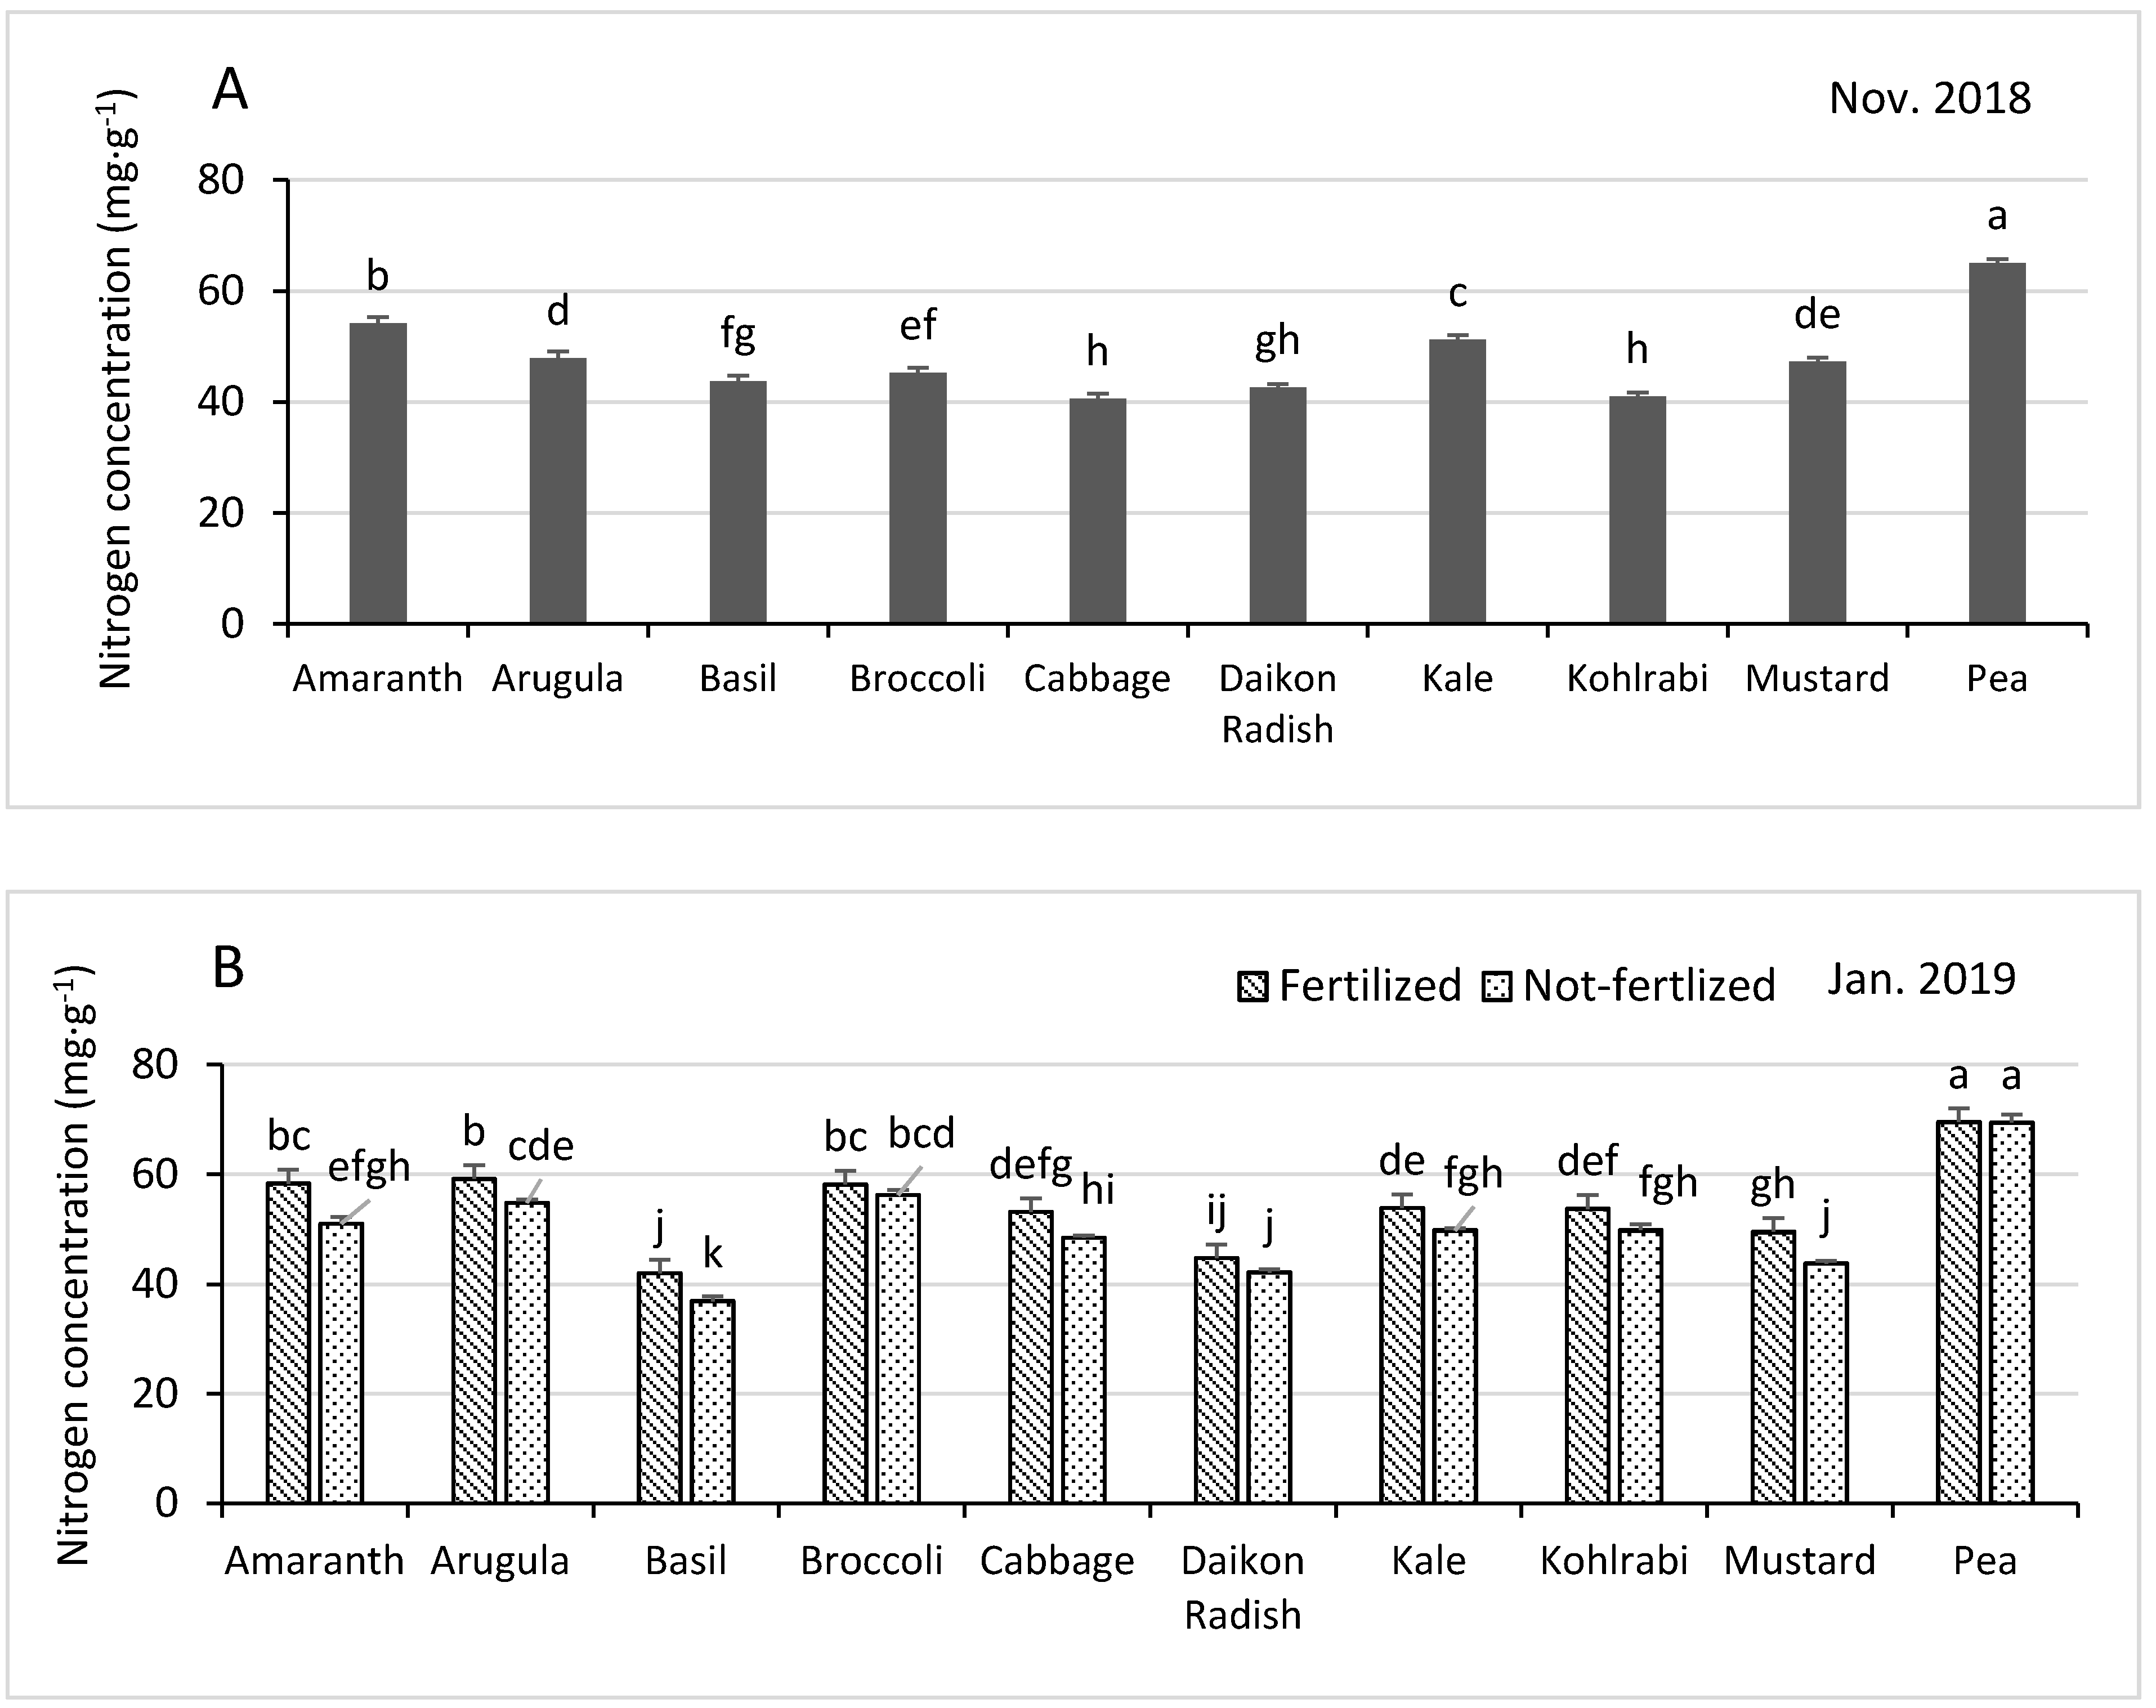
3.3.1. Nitrogen
3.3.2. Phosphorus
3.3.3. Potassium
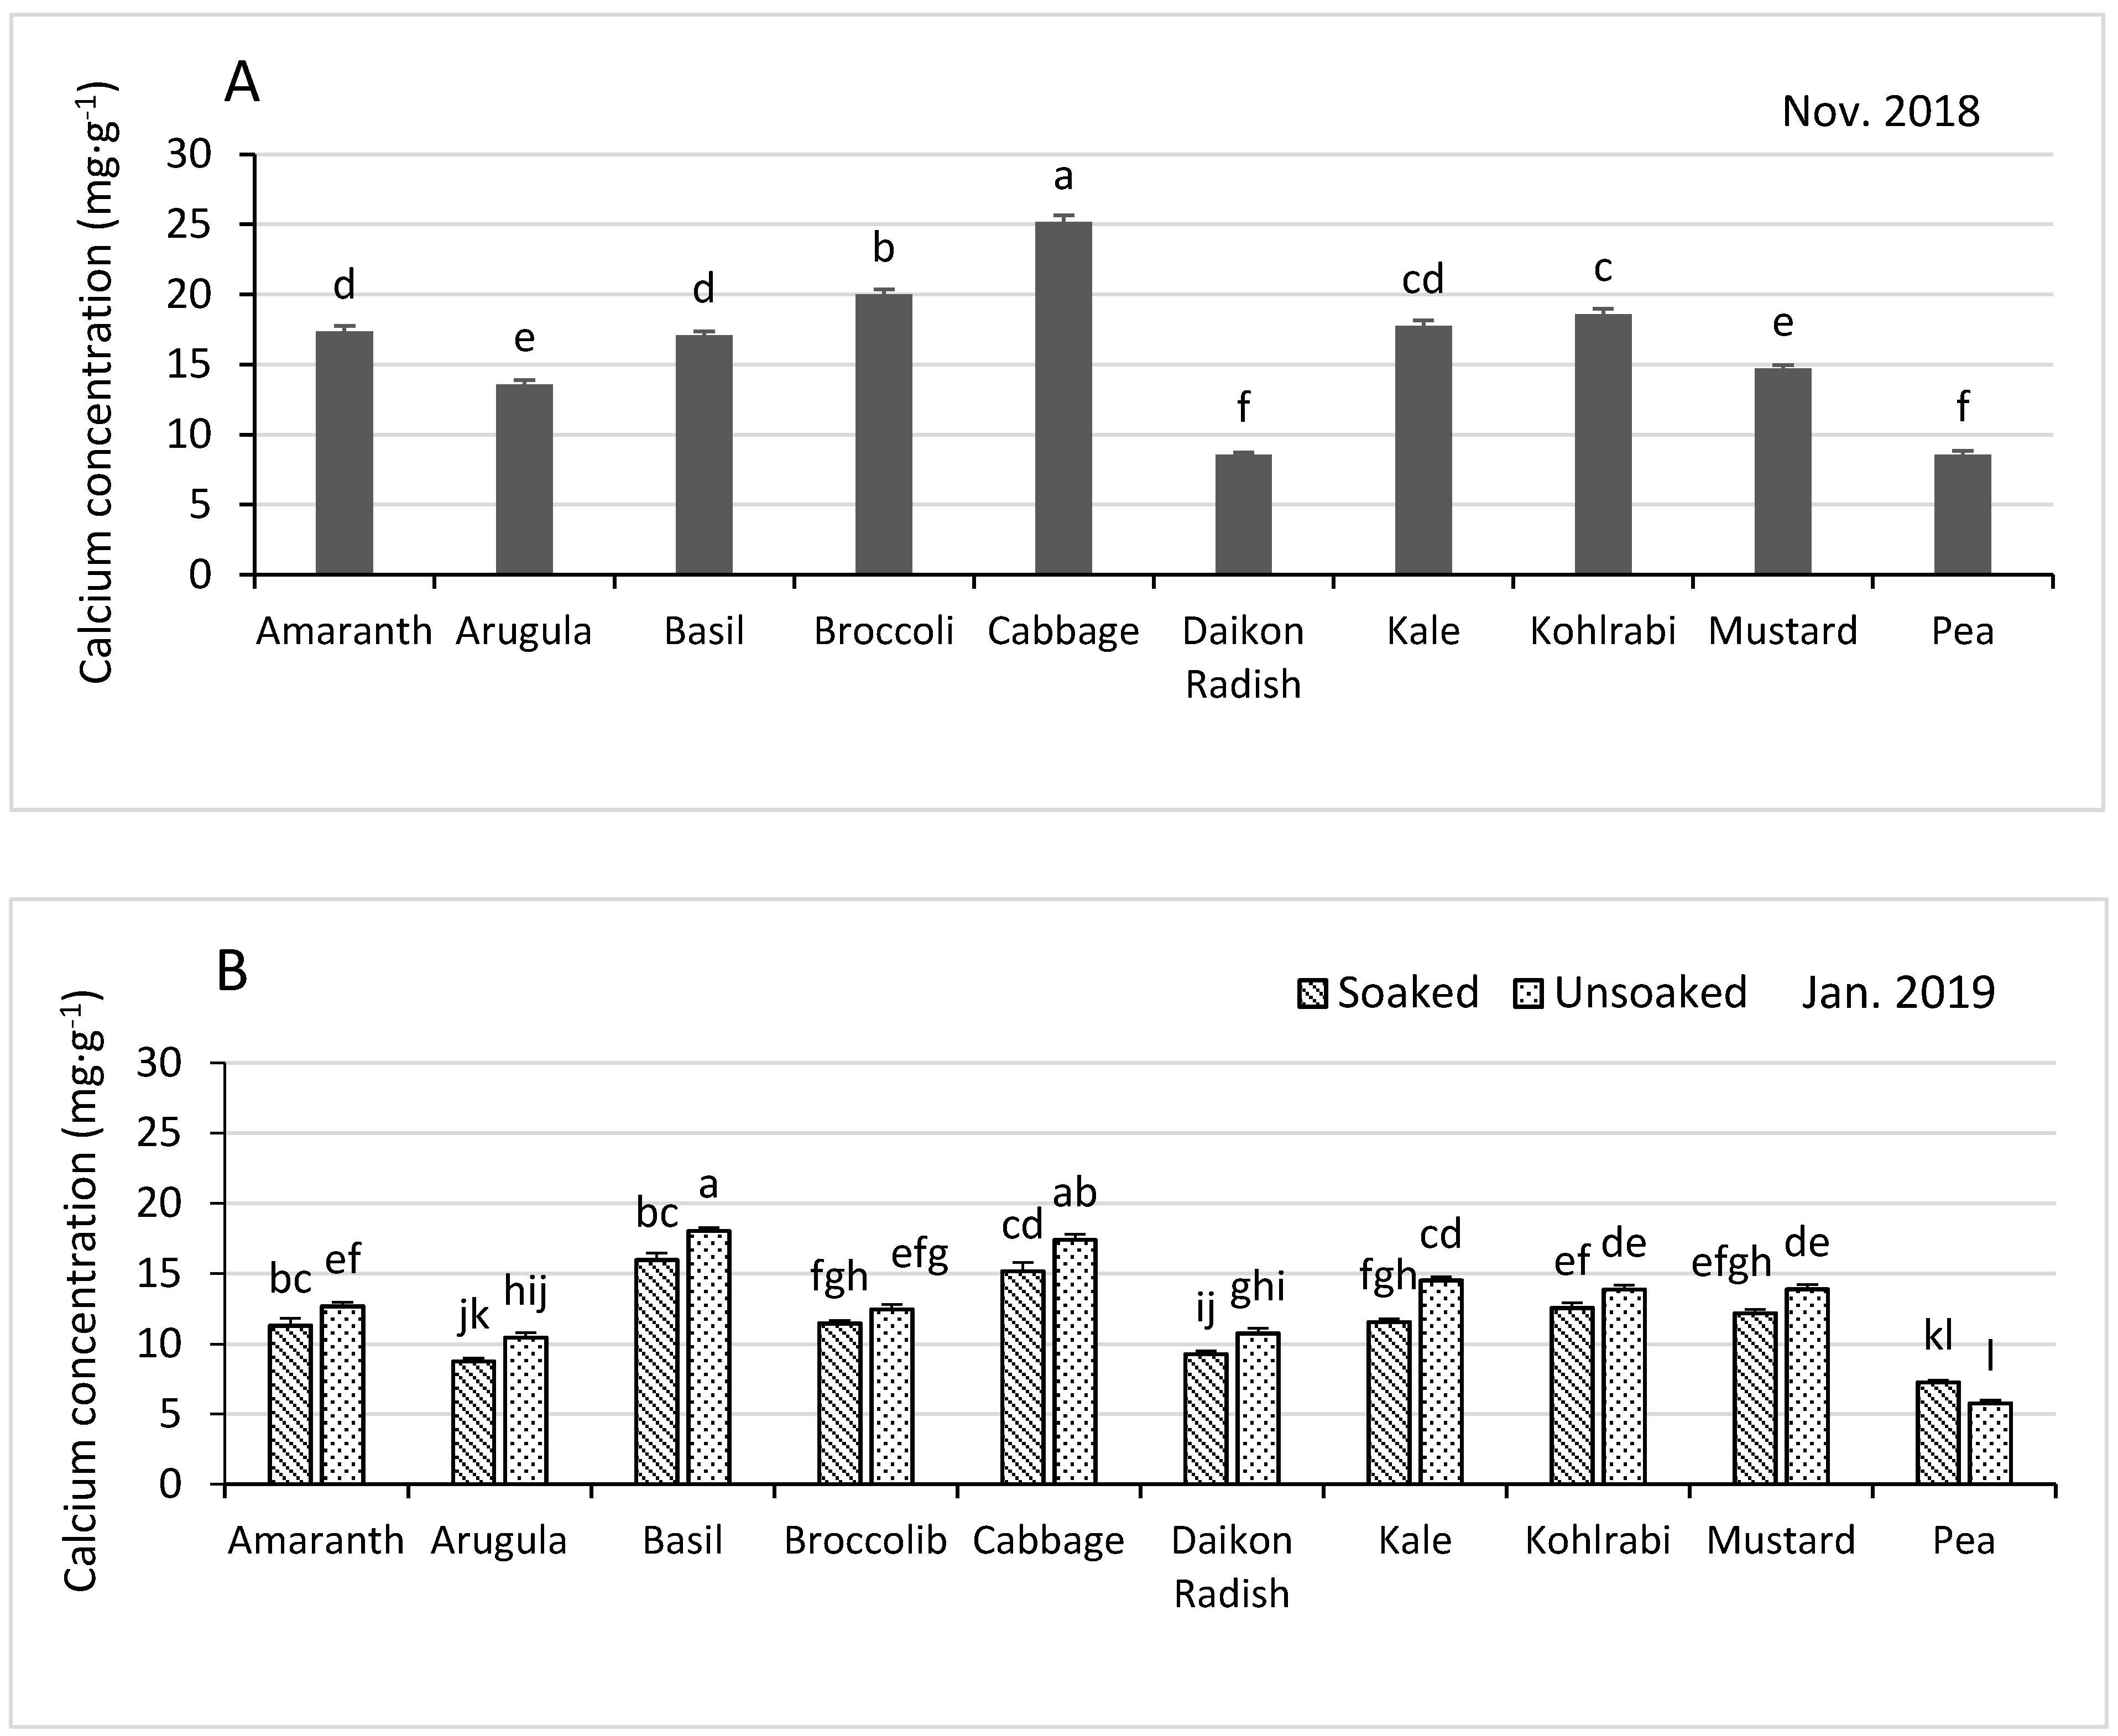
3.3.4. Calcium
3.3.5. Magnesium
3.4. Micronutrient Concentrations
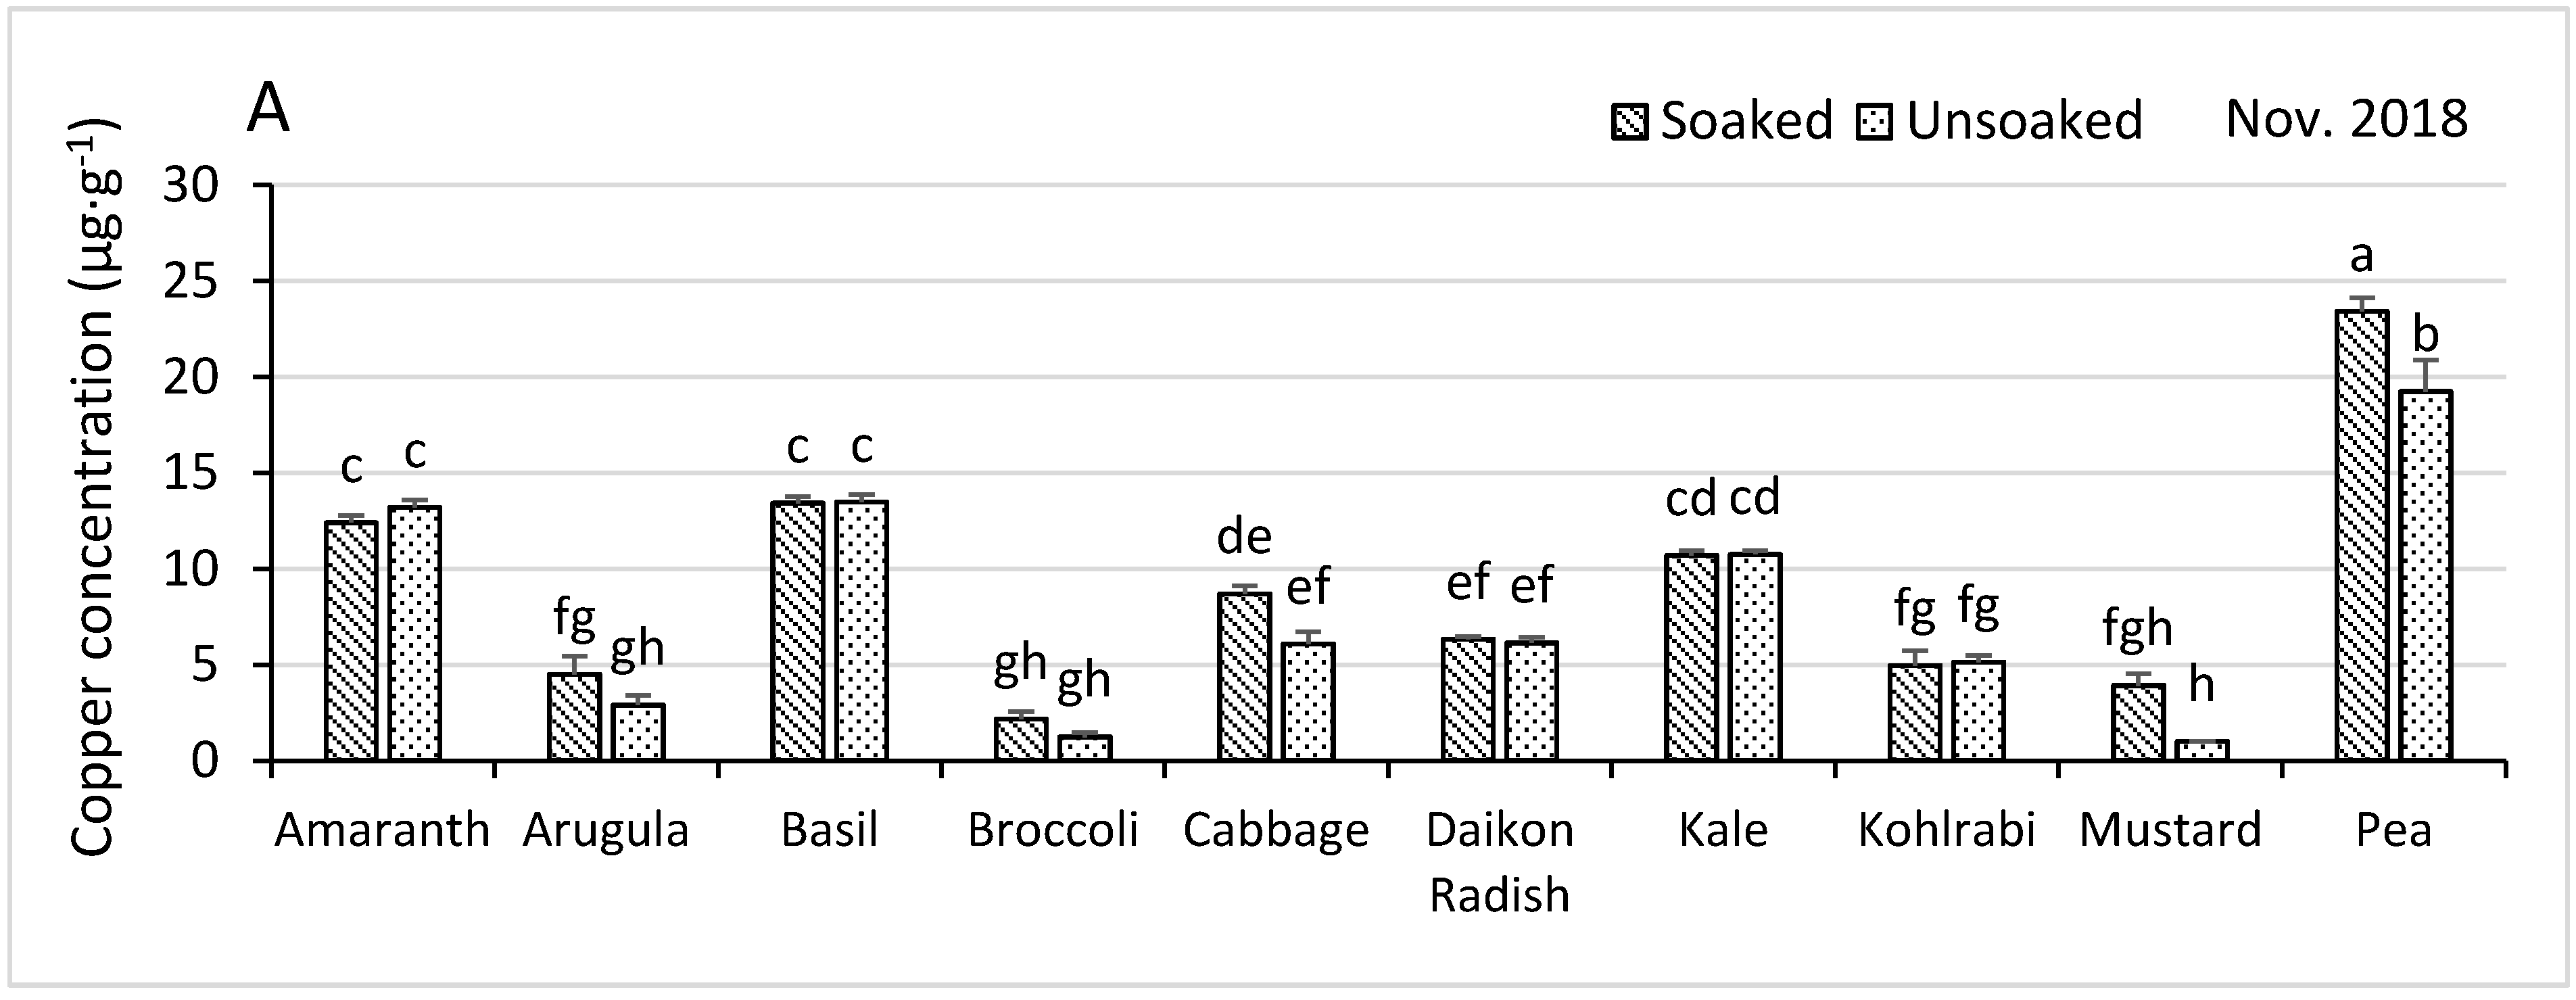
3.4.1. Copper
3.4.2. Iron
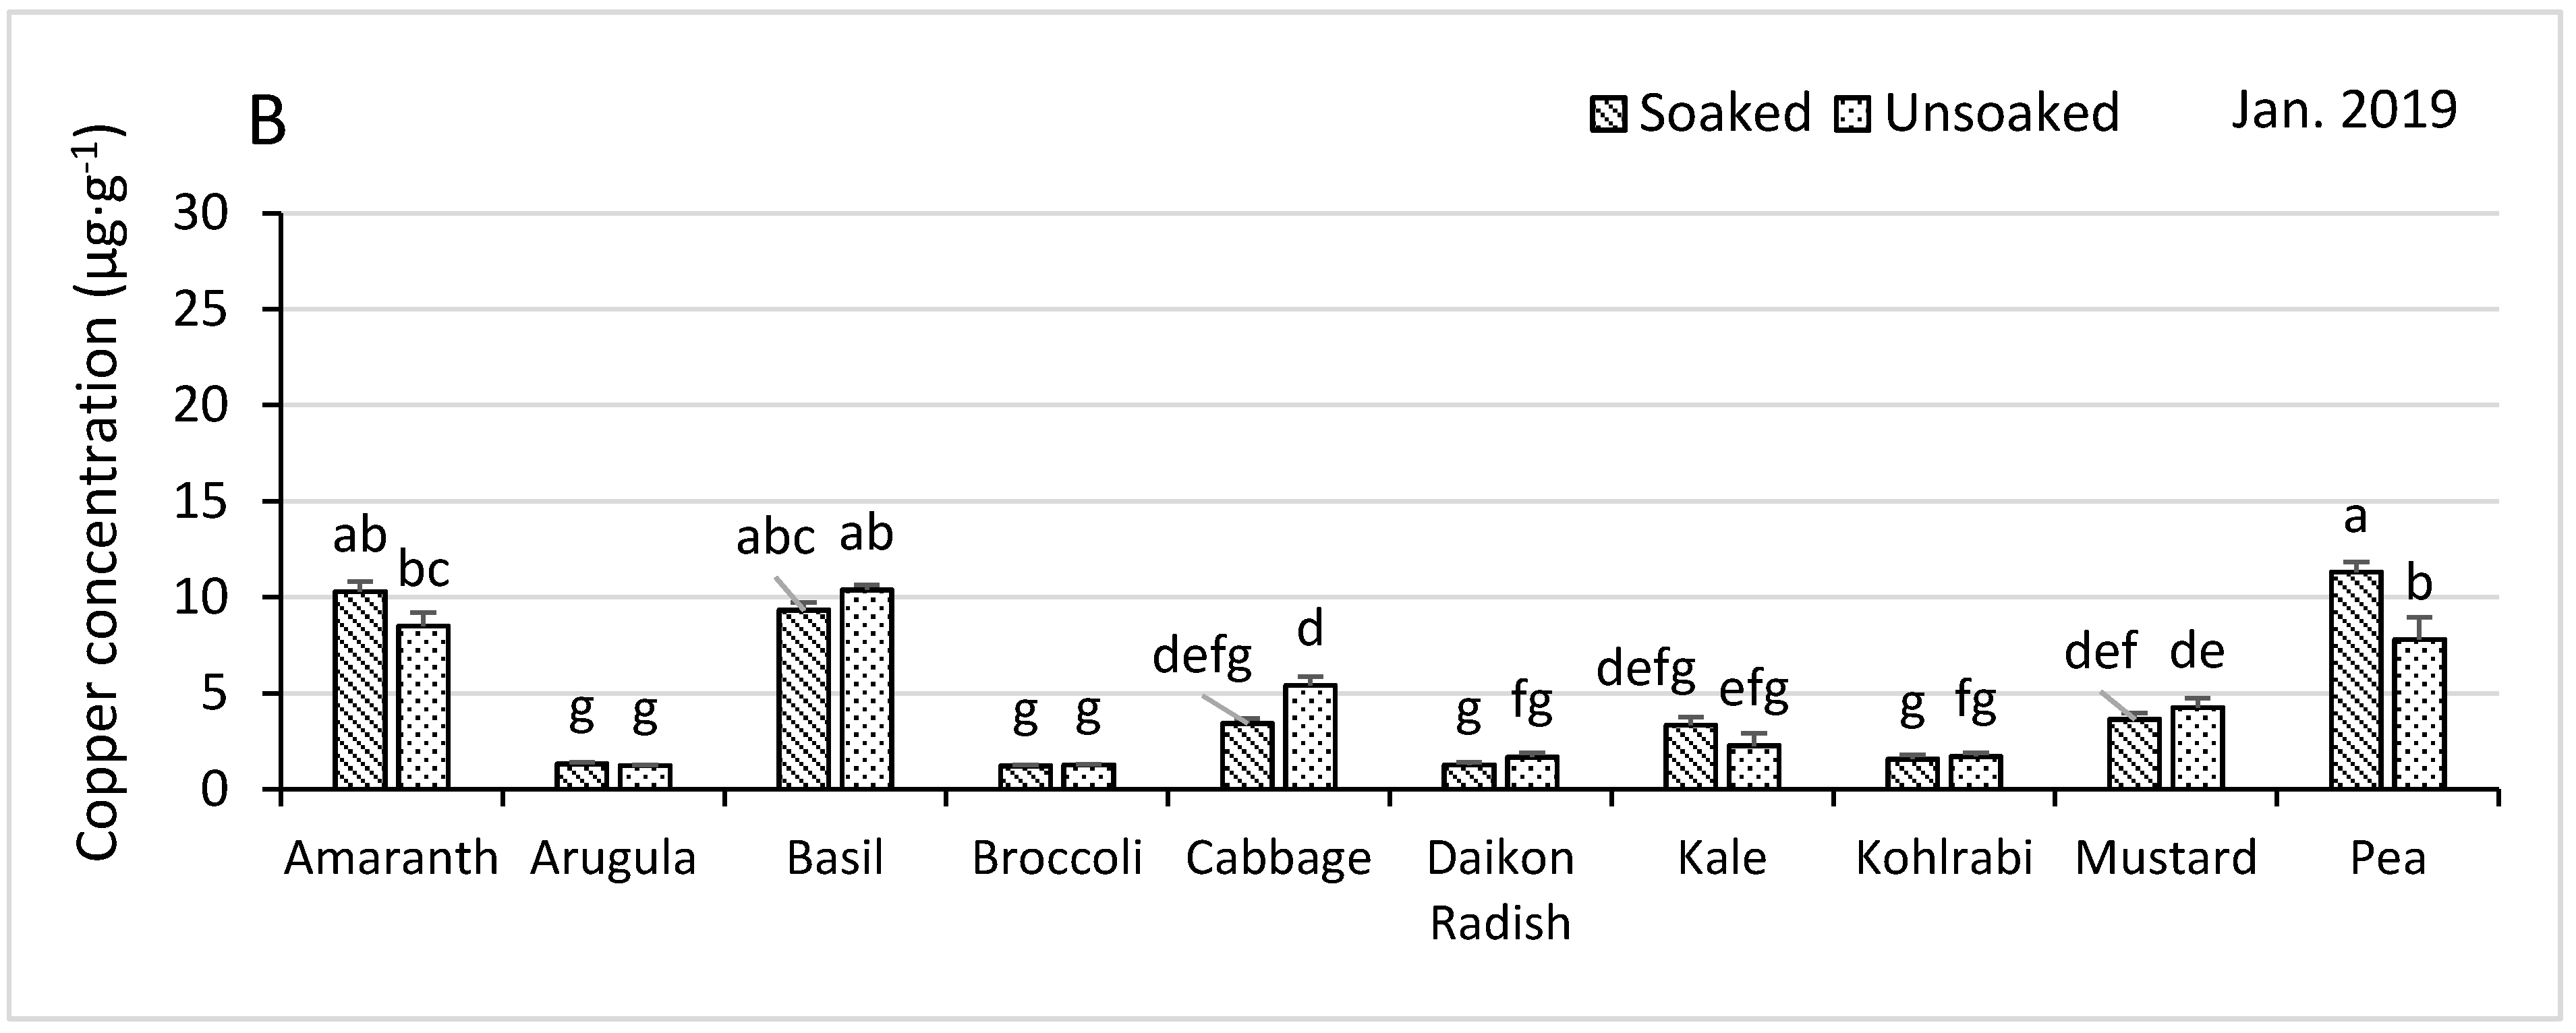
3.4.3. Manganese
3.4.4. Zinc
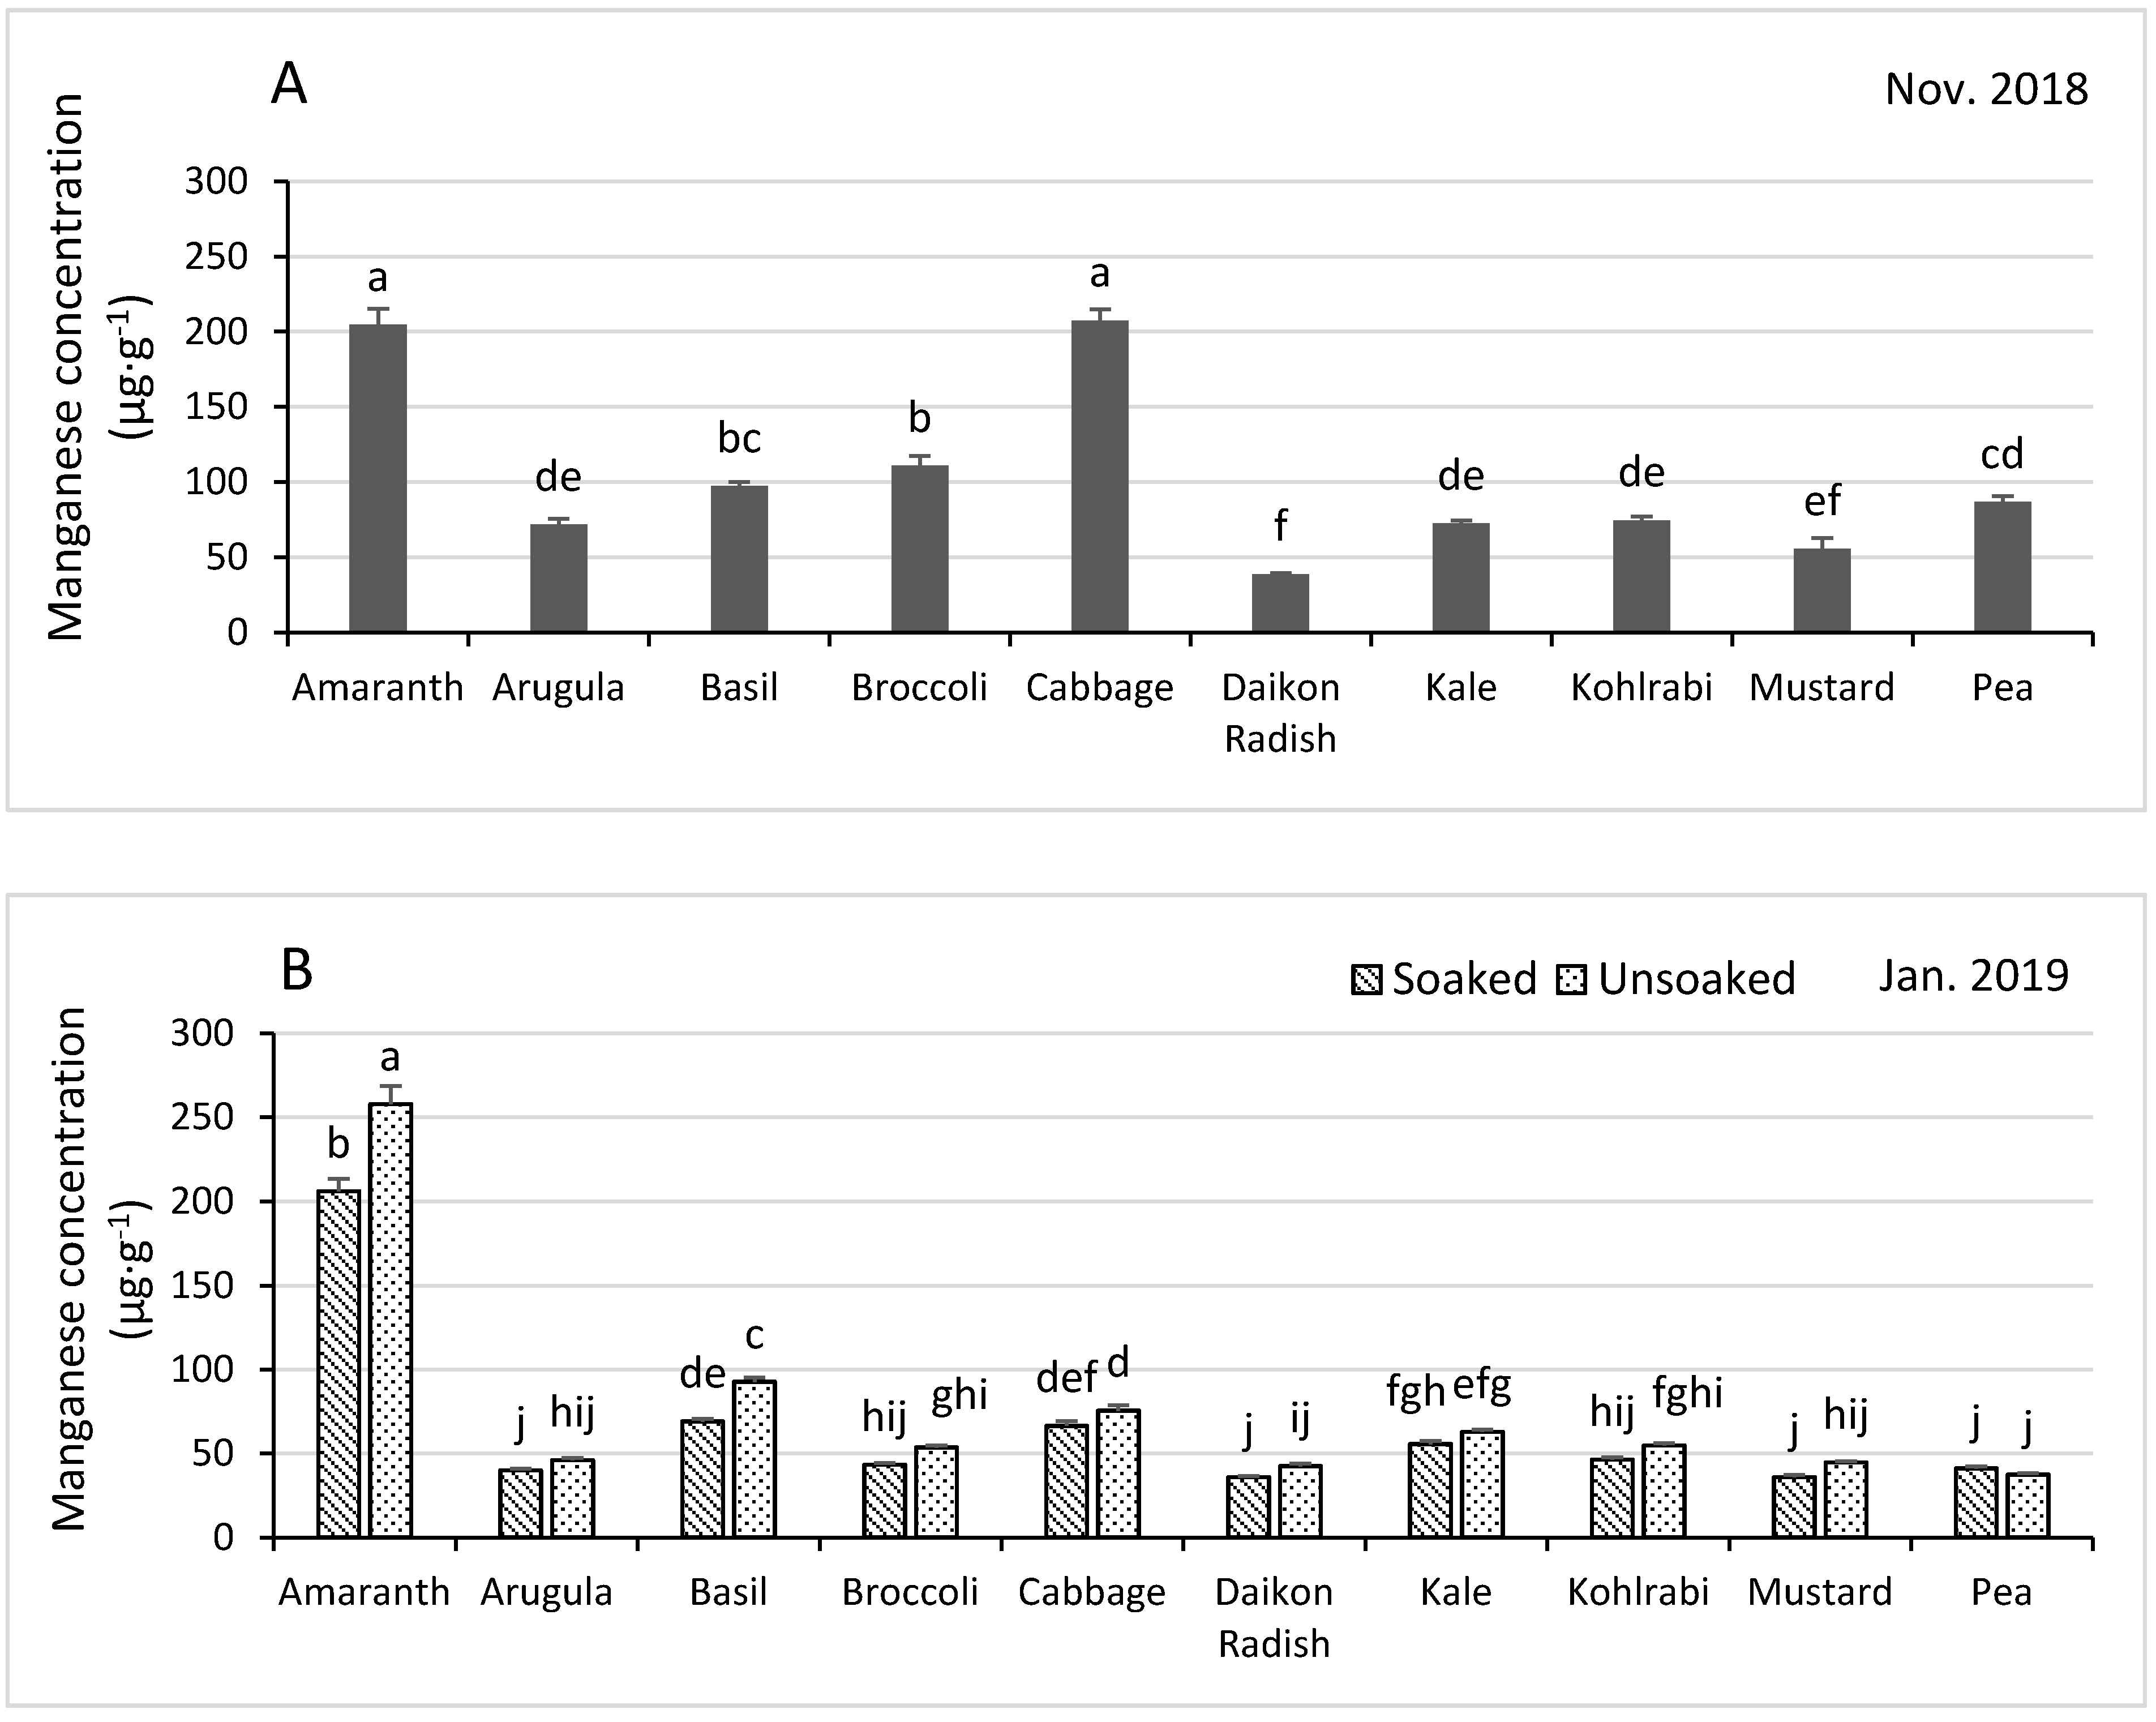
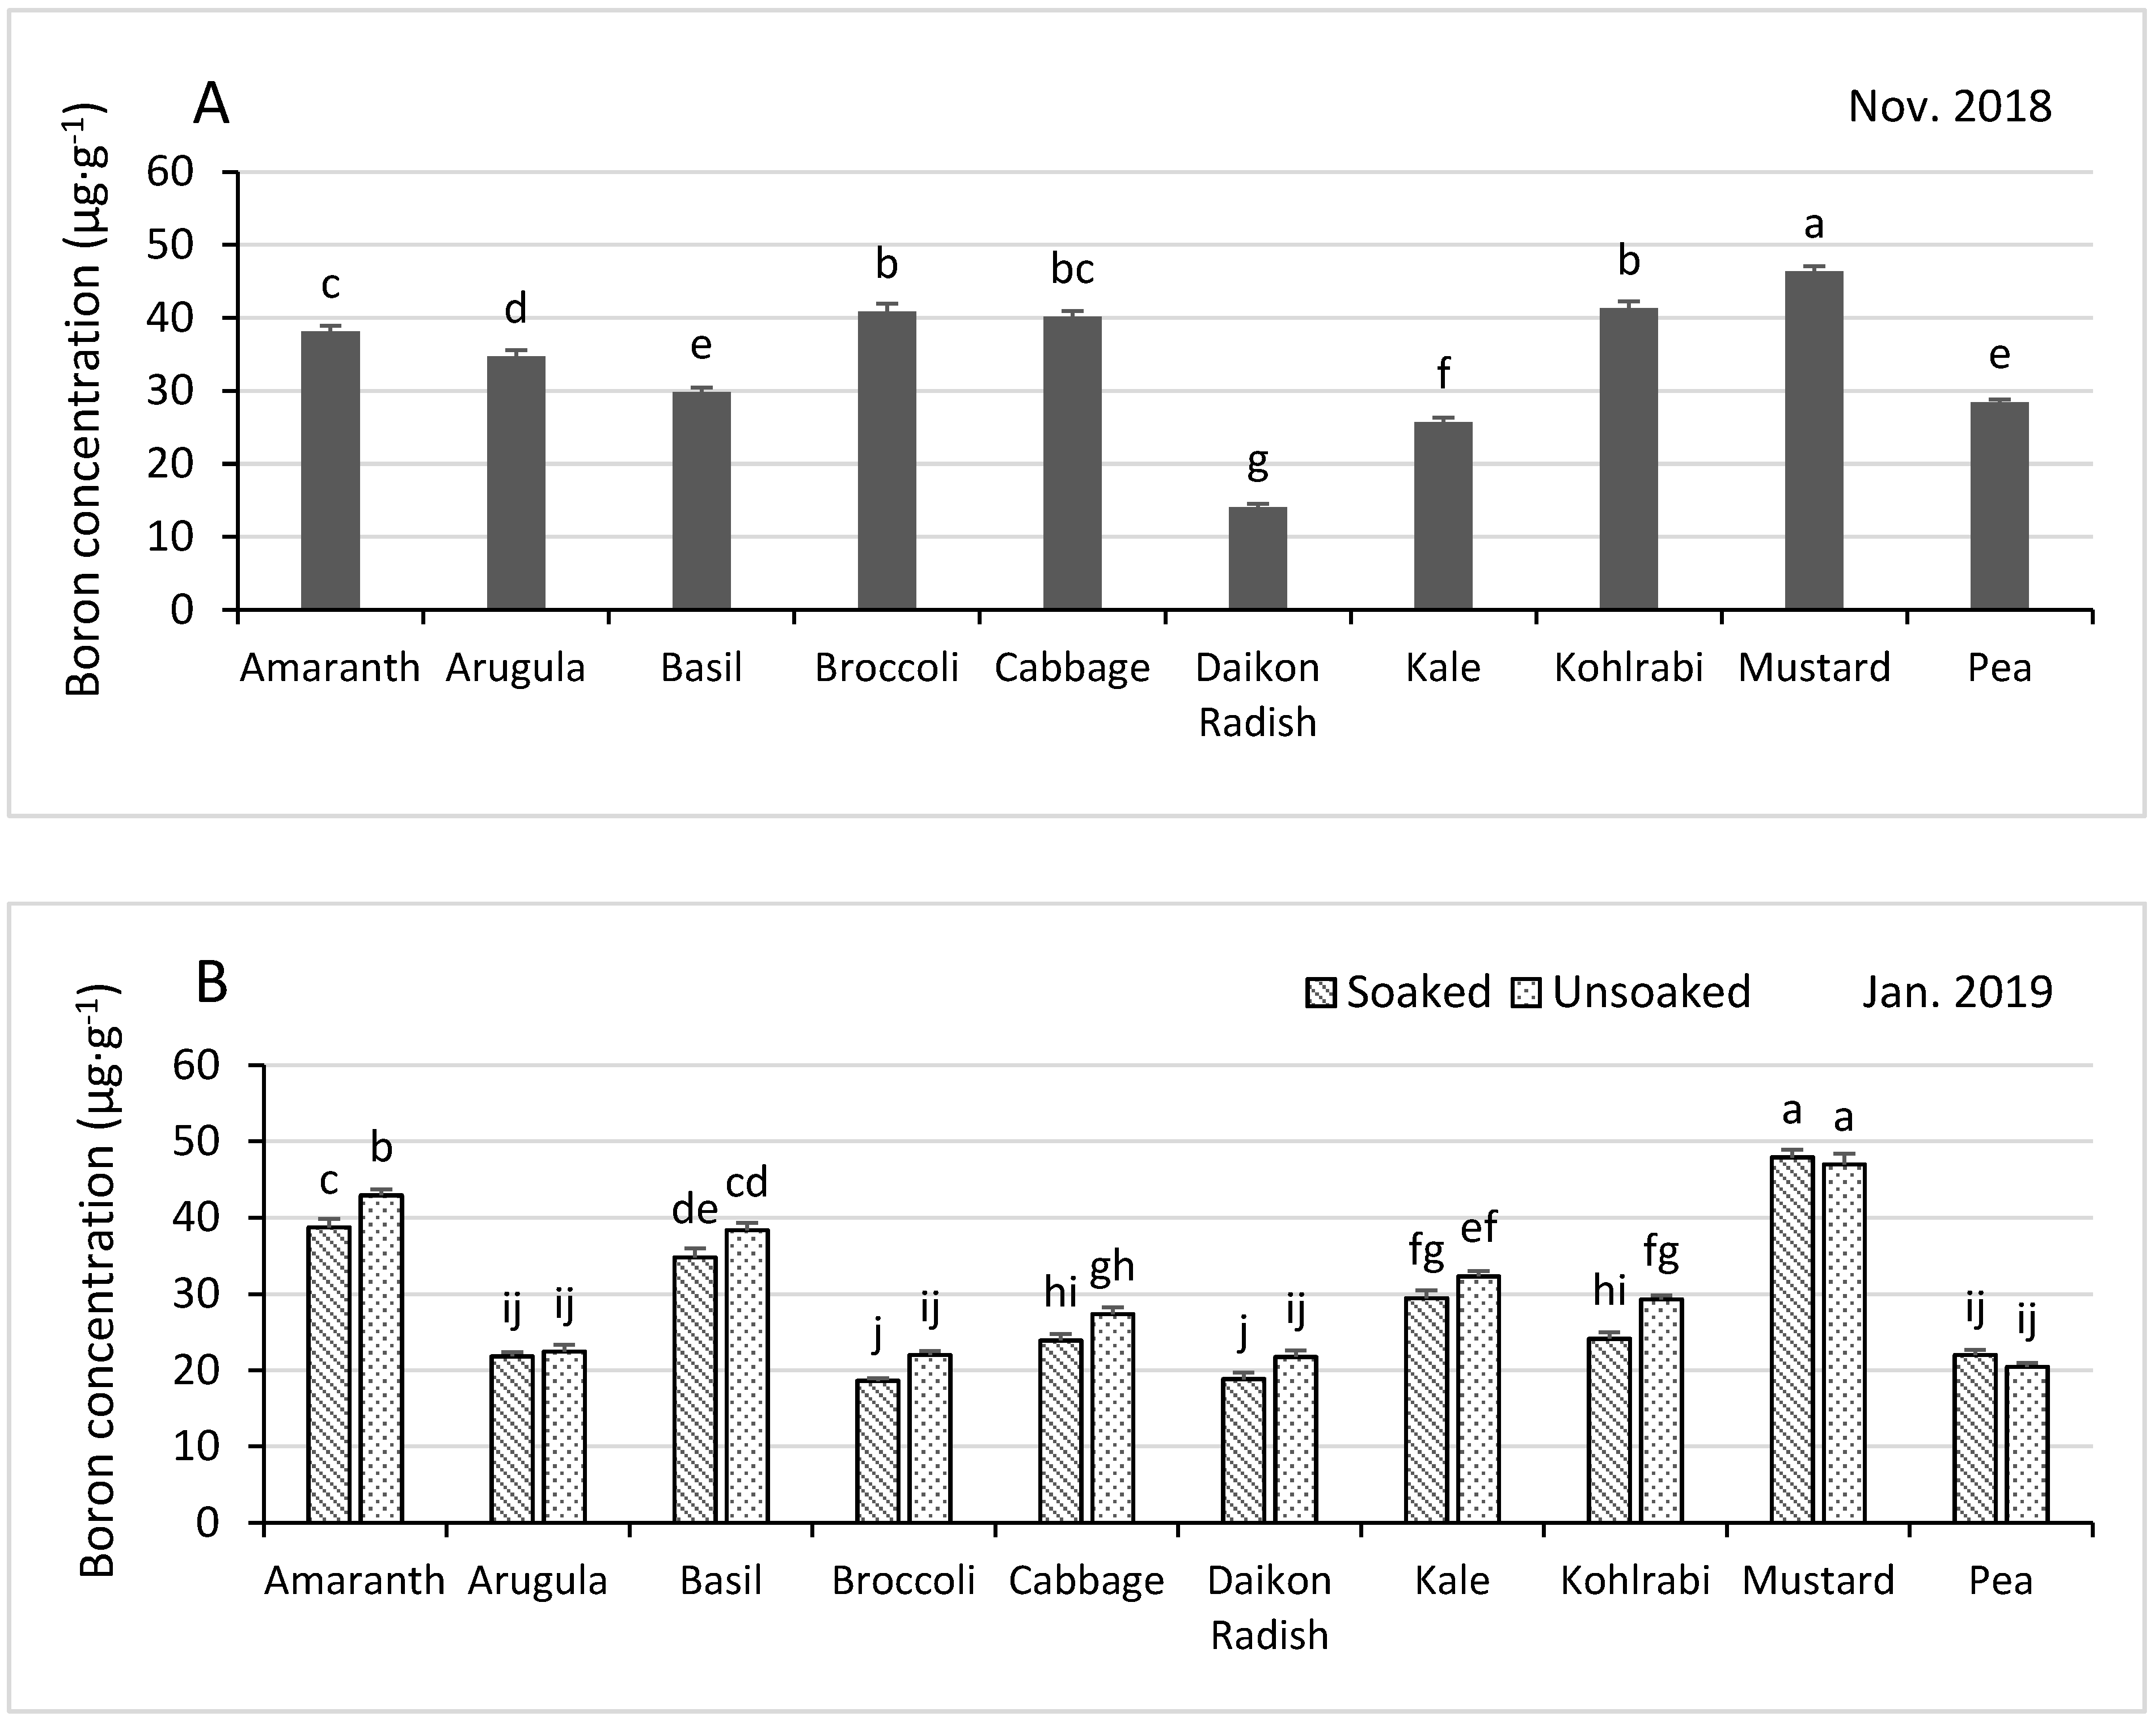
3.4.5. Boron
4. Discussion
5. Conclusions
Supplementary Materials
Author Contributions
Funding
Institutional Review Board Statement
Informed Consent Statement
Data Availability Statement
Conflicts of Interest
References
- Gerovac, J.R.; Craver, J.K.; Boldt, J.K.; Lopez, R.G. Light intensity and quality from sole-source light emitting diodes impact growth, morphology, and nutrient content of Brassica microgreens. HortScience 2016, 51, 497–503. [Google Scholar] [CrossRef] [Green Version]
- Bachman, G.R. Growing Microgreens for the Mississippi Gardener; Mississippi State University Extension Service: Starkville, MS, USA, 2014; p. 2857. [Google Scholar]
- Murphy, C.J.; Llort, K.F.; Pill, W.G. Factors affecting the growth of microgreen table beet. Intl. J. Veg. Sci. 2010, 16, 253–266. [Google Scholar] [CrossRef]
- Waterland, N.L.; Moon, Y.; Tou, J.C.; Kim, M.J.; Pena-Yewtukhiw, E.M.; Park, S. Mineral content differs among microgreen, baby leaf, and adult stages in three cultivars of kale. HortScience 2017, 52, 566–571. [Google Scholar] [CrossRef] [Green Version]
- Turner, E.R.; Luo, Y.; Buchanan, R.L. Microgreen nutrition, food safety, and shelf life: A review. J. Food Sci. 2020, 85, 870–882. [Google Scholar] [CrossRef] [Green Version]
- Bachman, G.R. Microgreens Varieties for the Mississippi Gardener; Mississippi State University Extension Service: Starkville, MS, USA, 2015; p. 2884. [Google Scholar]
- Treadwell, D.D.; Hochmuth, R.; Landrum, L.; Laughlin, W. Microgreens: A New Specialty Crop; University of Florida IFAS Extension: Gainesville, FL, USA, 2020; HS1164; Available online: https://edis.ifas.ufl.edu/pdffiles/HS/HS116400.pdf (accessed on 7 December 2020).
- Wood, L. Worldwide Indoor Farming Market Outlook 2019–2024—The Decrease in Cultivatable Land Is Driving Growth; 2019; Available online: https://www.globenewswire.com/news-release/2019/04/10/1801787/0/en/Worldwide-Indoor-Farming-Market-Outlook-2019-2024-The-Decrease-in-Cultivable-Land-is-Driving-Growth.htmL (accessed on 7 December 2020).
- Kyriacou, M.C.; Rouphael, Y.; Di Gioia, F.; Kyratzis, A.; Serio, F.; Renna, M.; De Pascale, S.; Santamaria, P. Micro-scale vegetable production and the rise of microgreens. Trends Food Sci. Technol. 2016, 57, 103–115. [Google Scholar] [CrossRef]
- Pinto, E.; Almeida, A.A.; Aguiar, A.A.; Ferreira, I.M. Comparison between the mineral profile and nitrate content of microgreens and mature lettuces. J. Food Compos. Anal. 2015, 37, 38–43. [Google Scholar] [CrossRef]
- Xiao, Z.; Lester, G.F.; Luo, Y.; Wang, Q. Assessment of vitamin and carotenoid concentrations of emerging food products: Edible microgreens. J. Agric. Food Chem. 2012, 60, 7644–7651. [Google Scholar] [CrossRef] [PubMed]
- Kyriacou, M.C.; El-Nakhel, C.; Pannico, A.; Graziani, G.; Soteriou, G.A.; Giordano, M.; Zarrelli, A.; Ritieni, A.; De Pascale, S.; Rouphael, Y. Genotype-specific modulatory effects of select spectral bandwidths on the nutritive and phytochemical composition of microgreens. Front. Plant Sci. 2019, 10, 1501. [Google Scholar] [CrossRef]
- Xiao, Z.; Codling, E.E.; Luo, Y.; Nou, X.; Lester, G.E.; Wang, Q. Microgreens of Brassicaceae: Mineral composition and content of 30 varieties. J. Food Compos. Anal. 2016, 49, 87–93. [Google Scholar] [CrossRef] [Green Version]
- Kyriacou, M.C.; El-Nakhel, C.; Graziani, G.; Pannico, A.; Soteriou, G.A.; Giordano, M.; Ritieni, A.; De Pascale, S.; Rouphael, Y. Functional quality in novel food sources: Genotypic variation in the nutritive and phytochemical compostion of thirteen microgreens species. Food Chem. 2019, 277, 107–118. [Google Scholar] [CrossRef]
- Xiao, Z.; Rausch, S.R.; Luo, Y.; Sun, J.; Yu, L.; Wang, Q.; Chen, P.; Yu, L.; Stommel, J.R. Microgreens of Brassicaceae: Genetic diversity of phytochemical concentrations and antioxidant capacity. LWT 2019, 101, 731–737. [Google Scholar] [CrossRef]
- Murphy, C.J.; Pill, W.G. Cultural practices to speed the growth of microgreen arugula (roquette; Eruca vesicaria subsp. sativa). J. Hort. Sci. Biotechnol. 2010, 85, 171–176. [Google Scholar] [CrossRef]
- Brazaitytė, A.; Vaštakaitė, V.; Viršilė, A.; Jankauskienė, J.; Samuolienė, G.; Sakalauskienė, S.; Novičkovas, A.; Miliauskienė, J.; Duchovskis, P. Changes in mineral element content of microgreens cultivated under different lighting conditions in a greenhouse. Acta Hort. 2018, 1227, 507–516. [Google Scholar] [CrossRef]
- Dixon, G.R. Vegetable Brassicas and Related Crucifers; Crop Production Science in Horticulture; No. 14; CABI: Cambridge, MA, USA, 2007. [Google Scholar]
- Lee, J.S.; Pill, W.G.; Cobb, B.B.; Olszewski, M. Seed treatments to advance greenhouse establishment of beet and chard microgreens. J. Hort. Sci. Biotechnol. 2004, 79, 565–570. [Google Scholar] [CrossRef]
- Lee, J.; Pill, W.G. Advancing greenhouse establishment of radish, kale, and amaranth microgreens through seed treatments. J. Korean. Soc. Hort. Sci. 2005, 46, 363–368. [Google Scholar]
- Freytag, J. Sprouting and Microgreens with Mucilaginous Seeds. True Leaf Market. 2017. Available online: https://www.trueleafmarket.com/blogs/articles/sprouting-and-microgreening-with-mucilaginous-seeds (accessed on 8 December 2020).
- Hartmann, H.T.; Kester, D.E.; Davis, F.T., Jr.; Geneve, R.L. Hartmann & Kester’s Plant Propagation: Principles and Practices, 8th ed.; Prentice Hall: Upper Saddle River, NJ, USA, 2011. [Google Scholar]
- Bulgari, R.; Baldi, A.; Ferrante, A.; Lenzi, A. Yield and quality of basil, Swiss chard, and rocket microgreens grown in a hydroponic system. N. Z. J. Crop Hort. Sci. 2017, 45, 119–129. [Google Scholar] [CrossRef]
- Kou, L.; Yang, T.; Luo, Y.; Liu, X.; Huang, L.; Codling, E. Pre-harvest calcium application increases biomass and delays senescence of broccoli microgreens. Postharvet Bio. Technol. 2014, 87, 70–78. [Google Scholar] [CrossRef]
- Di Gioia, F.; De Bellis, P.; Minini, C.; Santamaria, P.; Serio, F. Physicochemical, agronomical and microbiological evaluation of alternative growing media for the production of rapini (Brassica rapa L.) microgreens. J. Sci. Food Agric. 2016, 97, 1212–1219. [Google Scholar] [CrossRef]
- Muchjajib, U.; Muchjajib, S.; Suknikom, S.; Butsai, J. Evaluation of organic media alternatives for the production of microgreens in Thailand. Acta Hort. 2015, 1102, 157–162. [Google Scholar] [CrossRef]
- Sun, J.; Kou, L.; Geng, P.; Huang, H.; Yang, T.; Luo, Y.; Chen, P. Metabolomic assessment reveals an elevated level of glucosinolate content in CaCl2 treated broccoli microgreens. J. Agric. Food Chem. 2015, 63, 1863–1868. [Google Scholar] [CrossRef]
- Lalk, G.T.; Bi, G.; Zhang, Q.; Harkess, R.L.; Li, T. Hight-tunnel production of strawberries using black and red plastic mulches. Horticulturae 2020, 6, 73. [Google Scholar] [CrossRef]
- Di Gioia, F.; Santamaria, P. Microgreens: Novel, Fresh and Functional Food to Explore All the Value of Biodiversity; ECO-logica: Bari, Italy, 2015. [Google Scholar]
- Charlebois, S. Microgreens with Big Potential; Wilton Consulting Group, 2019; Available online: https://static1.squarespace.com/static/59a566808419c2c20ebc2768/t/5bec6f7840ec9a4b55d39143/1542221690715/Microgreens+with+big+potential_CaseStudy.pdf (accessed on 16 December 2020).
- Kopsell, D.A.; Sams, C.E. Increases in shoot tissue pigments, glucosinates, and mineral elements in sprouting broccoli after exposure to short-duration blue light from light emitting diodes. J. Am. Soc. Hort. Sci. 2013, 138, 31–37. [Google Scholar] [CrossRef] [Green Version]
- Samuolienė, G.; Brazaitytė, A.; Jankauskienė, J.; Viršilė, A.; Sirtautas, R.; Novičkovas, A.; Sakalauskienė, S.; Sakalauskaitė, J.; Duchovskis, P. LED irradiance level affects growth and nutritional quality of Brassica microgreens. Cent. Eur. J. Biol. 2013, 8, 1241–1249. [Google Scholar] [CrossRef]
- Vaštakaitė, V.; Viršilė, A.; Brazaitytė, A.; Samuolienė, G.; Jankauskienė, J.; Novičkovas, A.; Duchovskis, P. Pulsed light-emitting diodes for a higher phytochemical level in microgreens. J. Agric. Food Chem. 2017, 65, 6529–6534. [Google Scholar] [CrossRef]
- Alrifai, O.; Hao, X.; Marcone, M.F.; Tsao, R. Current review of the modulatory effects of LED lights on photosynthesis of secondary metabolites and future perspectives of microgreen vegetables. J. Agric. Food Chem. 2019, 67, 6075–6090. [Google Scholar] [CrossRef]
- Puccinelli, M.; Malorgio, F.; Rosellini, I.; Pezzarossa, B. Production of selenium-biofortified microgreens from selenium-enriched seeds of basil. J. Sci. Food Agric. 2019, 99, 5601–5605. [Google Scholar] [CrossRef]
- Reed, E.; Ferreira, C.M.; Bell, R.; Brown, E.W.; Zheng, J. Plant-microbe and abiotic factors influencing salmonella survival and growth on alfalfa sprouts and Swiss chard microgreens. Appl. Environ. Microbiol. 2018, 84, 1–11. [Google Scholar] [CrossRef] [Green Version]
- Wright, K.M.; Holden, N.J. Quantification and colonisation dynamics of Escherichia coli O157:H7 inoculation of microgreens species and plant growth substrates. Int. Food Microbiol. 2018, 273, 1–10. [Google Scholar] [CrossRef]
- Xiao, Z.; Bauchan, G.; Nichols-Russell, L.; Luo, Y.; Wang, Q.; Nou, X. Proliferation of Escherichia coli O157:H7 in soil-substitute and hydroponic microgreen production systems. J. Food Prot. 2015, 78, 1785–1790. [Google Scholar] [CrossRef] [Green Version]
- Yang, Y.; Meier, F.; Lo, J.A.; Yuan, W.; Sze, V.L.P.; Chung, H.L.; Yuk, H.G. Overview of recent events in the microbiological safety of sprouts and new intervention technologies. Compr. Rev. Food Sci. Food Saf. 2015, 12, 265–280. [Google Scholar] [CrossRef]


| Common Name | Scientific Name | Seeding Rate (g·m−2) | 100 Seed wt. (g) | Harvest Date (DAP) z |
|---|---|---|---|---|
| Red Garnet amaranth | Amaranthus tricolour | 60.5 | 0.087 ± 0.01 | 11–13 |
| Slow bolt arugula | Eruca sativa | 75.6 | 0.21 ± 0.05 | 10–15 |
| Genovese basil | Ocimum basilicum | 52.9 | 0.20 ± 0.005 | 16–18 |
| Waltham broccoli | Brassica oleracea var. italica | 98.3 | 0.44 ± 0.015 | 8–13 |
| Red Acre cabbage | Brassica oleracea var. capitata | 83.1 | 0.44 ± 0.016 | 8–14 |
| Daikon radish | Raphanus sativus var. longipinnatus | 173.8 | 1.63 ± 0.03 | 6–7 |
| Red Russian kale | Brassica napus var. pabularia | 75.6 | 0.23 ± 0.008 | 10–13 |
| Early White Vienna kohlrabi | Brassica oleracea var. gongylodes | 75.6 | 0.39 ± 0.02 | 9–13 |
| Red Garnet mustard | Brassica juncea | 60.5 | 0.18 ± 0.003 | 10–12 |
| Green pea | Pisum sativum | 1285 | 15.33 ± 0.08 | 6–8 |
| Shoot Growth and Nutrient Concentrations in November 2018 | ||||||||||
|---|---|---|---|---|---|---|---|---|---|---|
| Fresh Shoot wt. | Dry wt. Percentage | Nitrogen | Phosphorus | Potassium | Calcium | Magnesium | Iron | Zinc | Boron | |
| (g·m−2) | (%) | (mg·g−1) | (mg·g−1) | (mg·g−1) | (mg·g−1) | (mg·g−1) | (µg·g−1) | (µg·g−1) | (µg·g−1) | |
| Fertilized z | 1304 | 6.8 | 50.3 | 12.3 | 39.8 | 15.9 | 4.59 | 187.9 | 118 | 34.5 |
| Not fertilized | 1264 | 7.1 | 45.5 | 11.3 | 37.6 | 16.4 | 4.74 | 170.6 | 110.8 | 33.4 |
| p-Value y | 0.025 | <0.0001 | <0.0001 | <0.0001 | 0.037 | 0.006 | 0.014 | 0.0008 | 0.0008 | 0.013 |
| Shoot Growth and Nutrient Concentrations in January 2019 | ||||||||||
|---|---|---|---|---|---|---|---|---|---|---|
| Fresh Shoot wt. | Dry Shoot wt. | Dry wt. Percentage | Shoot Height | Visual Rating | Phosphorus | Magnesium | Iron | Manganese | Boron | |
| (g·m−2) | (g·m−2) | (%) | (cm) | (1–5) | (mg·g−1) | (mg·g−1) | (µg·g−1) | (µg·g−1) | (µg·g−1) | |
| Fertilized z | 1001 | 66.5 | 6.6 | 5.7 | 4.4 | 12.0 | 4.83 | 136.1 | 68.6 | 30.2 |
| Not fertilized | 875.4 | 61.7 | 7.0 | 5.6 | 4.3 | 11.2 | 5.02 | 129.6 | 72.2 | 28.2 |
| p-Value y | <0.0001 | <0.0001 | <0.0001 | 0.043 | 0.021 | <0.0001 | 0.004 | 0.0017 | 0.0014 | <0.0001 |
| Nutrient Concentrations in November 2018 | Shoot Growth and Nutrient Concentrations January 2019 | |||||||||
|---|---|---|---|---|---|---|---|---|---|---|
| Nitrogen | Magnesium | Boron | Fresh Shoot wt. | Dry Shoot wt. | Shoot Height | Phosphorus | Magnesium | Iron | Zinc | |
| (mg·g−1) | (mg·g−1) | (µg·g−1) | (g·m−2) | (g·m−2) | (cm) | (mg·g−1) | (mg·g−1) | (µg·g−1) | (µg·g−1) | |
| Soaked z | 47.5 | 4.6 | 33.3 | 875 | 61.0 | 5.5 | 11.4 | 4.82 | 129.6 | 77.9 |
| Unsoaked | 48.3 | 4.8 | 34.7 | 1001 | 67.2 | 5.8 | 11.8 | 5.03 | 136.1 | 80.4 |
| p-Value y | 0.036 | 0.004 | 0.0015 | <0.0001 | <0.0001 | <0.0001 | 0.011 | <0.0001 | 0.0016 | 0.015 |
Publisher’s Note: MDPI stays neutral with regard to jurisdictional claims in published maps and institutional affiliations. |
© 2021 by the authors. Licensee MDPI, Basel, Switzerland. This article is an open access article distributed under the terms and conditions of the Creative Commons Attribution (CC BY) license (http://creativecommons.org/licenses/by/4.0/).
Share and Cite
Li, T.; Lalk, G.T.; Bi, G. Fertilization and Pre-Sowing Seed Soaking Affect Yield and Mineral Nutrients of Ten Microgreen Species. Horticulturae 2021, 7, 14. https://doi.org/10.3390/horticulturae7020014
Li T, Lalk GT, Bi G. Fertilization and Pre-Sowing Seed Soaking Affect Yield and Mineral Nutrients of Ten Microgreen Species. Horticulturae. 2021; 7(2):14. https://doi.org/10.3390/horticulturae7020014
Chicago/Turabian StyleLi, Tongyin, Geoffrey T. Lalk, and Guihong Bi. 2021. "Fertilization and Pre-Sowing Seed Soaking Affect Yield and Mineral Nutrients of Ten Microgreen Species" Horticulturae 7, no. 2: 14. https://doi.org/10.3390/horticulturae7020014