Article

Water Use Efficiency and Nutritional Status of a New Grapevine Rootstock Selection

Dipartimento di Scienze Agrarie ed Ambientali, Università degli Studi di Milano, Via Giovanni Celoria 2, 20133 Milano, Italy
*
Authors to whom correspondence should be addressed.
Horticulturae 2021, 7(11), 503; https://doi.org/10.3390/horticulturae7110503
Submission received: 27 October 2021 / Revised: 12 November 2021 / Accepted: 16 November 2021 / Published: 18 November 2021
(This article belongs to the Special Issue Rootstock Genetics and Improvement in Breeding)

Abstract

:
The production and quality of grapes are determined by the hydric and nutritional status of the vine. In modern viticulture, the interface between grapevine and soil is represented by the rootstock, which modulates the uptake of water and nutrients. Thus, selection of new rootstocks for abiotic stress tolerance represents an adaptation strategy for viticulture to the new environmental conditions imposed by climate change. The aim of this work is to evaluate the water-use efficiency (WUE) and the nutritional status of a selection of 30 new rootstock genotypes, originating from several breeding programs. WUE and gas exchange were measured for each genotype in two environments characterized by different water availability, and the levels of N, P, K, Mg, Ca, Na, Fe, Mn, and Zn in the leaf blades were determined during the phenological stages of flowering and ripening. Water availability was different in the two environments, affecting gas exchange, with mean values of carbon assimilation of 10.43 ± 0.32 and 3.84 ± 0.34 µmol CO2 m−2 s−1, respectively. Genotypes were classified according to their water stress tolerance, vigor, and affinity for macronutrients and micronutrients. A total of 14 genotypes showed tolerance to water stress, and 10 of them reported high vigor and carbon assimilation. Furthermore, the majority of water-stress-tolerant genotypes had greater affinity for Mg than for K. In further studies, the most promising rootstocks will be evaluated in grafting combination with Vitis vinifera.

1. Introduction

In the new environmental conditions caused by climate change, adaptation of viticulture to abiotic stresses is becoming a crucial issue to preserve the production and quality of grapes and wines. Since the end of the 19th century, grapevine (Vitis vinifera) has been grafted onto rootstocks worldwide to avoid attacks by phylloxerae (Daktulosphaira vitifoliae). Thus, tolerance of grapevine to abiotic stresses not only depends on the cultivar, but is mediated by the rootstock genotype [1]. In a recent study, 15 rootstocks were studied for 5 years in terms of growth and grape production, in grafting combination with two scion varieties (Chardonnay and Cabernet Sauvignon). The effect of rootstock genotype and its interactions on grape yield has been assessed to be 13.29%, while the contribution to sugar content has been evaluated at 14.80% [2]. The effect of rootstocks on the yield and quality of grapes can be explained by the different uptake of water and nutrients from the soil and the vigor induced to the scion [3,4].
The use of tolerant rootstocks is a strategy to overcome drought in adaptation to climate change [5]. Tolerant rootstocks respond to water deficit by enhancing the water-use efficiency (WUE) through the control of gas exchange [6,7]. WUE at the leaf level is defined as the ratio between carbon assimilation and stomatal conductance or leaf transpiration [8]. Stomatal conductance and transpiration are controlled by the rootstock through both hydraulic and hormonal signaling [9]. Hydraulic signaling consists of a direct effect of the drop in water potential in all plant tissues, including guard cells of stomata, in response to water deficit. The hormonal pathway includes the production of abscisic acid (ABA) in roots and leaves, and the transduction of the signal to the stomata, inducing the stomatal closure and reducing the gas exchange [9].
The vigor of the shoot is induced by rootstocks, causing an effect on the vegetative–productive balance [2,10]. In fact, rootstock genotype affects the assimilation of carbon from the air and the uptake of macronutrients from the soil, such as nitrogen (N) and phosphorous (P)—directly related to the development of biomass [11,12,13]. Carbon (C) is assimilated in the leaves via the photosynthetic pathway. This process supports the vegetative growth of the plant and the ripening of the grapes. Excess or deficit of N can affect the yeast assimilable nitrogen (YAN) in the must, causing microbial instability during fermentation [14].
The uptake of other macronutrients—such as potassium (K), magnesium (Mg), and calcium (Ca)—depends on rootstock genotypes, in addition to environmental conditions. In a recent study, rootstocks with Vitis riparia in their genetic background reported lower levels of Mg than rootstocks without V. riparia [15]. Antagonisms in the uptake of K and Mg have been reported in the literature, along with synergies between Mg and Ca [16,17]. Rootstocks can be ranked according to the levels of K in the leaves, grapes, and must [18]. High levels of K in the must can be involved in a reduction in the total acidity, due to the salinification of tartaric acid [19]. The choice of a rootstock with affinity for Mg rather than K can be made as an agronomical decision to maintain the acidity of wines under unfavorable environmental conditions, and to avoid Mg deficit. Rootstocks also affect the uptake of micronutrients, such as iron (Fe), manganese (Mn), zinc (Zn), and sodium (Na) [15]. The ability to uptake Fe is relevant when there are high concentrations of limestone in the soil. Some rootstocks can cope with limestone in the soil, and they can be chosen to avoid Fe deficit, inducing specific uptake strategies [20].
The hydric and nutritional status of vines are driven by environmental conditions; thus, the plasticity of rootstocks plays a key role in the interaction of genotypes with the environment: rootstocks that respond to changes in external conditions by modifying their performance are defined as “plastic”, whereas rootstocks that maintain a stable performance under different environments are defined as “elastic” [21,22]. The plasticity of specific traits related to hydric and nutritional status should be considered in the selection process of new rootstocks able to cope with abiotic stresses.
The Department of Agricultural and Environmental Sciences (DiSAA) of the University of Milano is currently working on the selection of new grapevine rootstocks with tolerance to abiotic stresses. The four genotypes of the M-series were recently released to cope with different environmental conditions. In particular, M1 was selected for limestone tolerance, M2 reported high efficiency in K and Mg uptake, M3 showed affinity for K, and M4 reported high tolerance to water deficit and salt stress. A new selection of 30 genotypes originating from the same breeding programs is currently under investigation. A first screening on water stress tolerance was performed by Bianchi et al. [23], whereas a first screening on mineral nutrition was reported by Bianchi et al. [24]. The aims of this work are: (1) to assess the water-use efficiency and the transpiration control of the new selection of genotypes; (2) to evaluate their vigor and carbon assimilation; (3) to analyze their nutritional status in terms of macro- and micronutrients, along with their affinity for K or Mg; (4) to investigate the plasticity of key traits in response to different environments; and (5) to identify among them the most promising rootstocks for abiotic stress tolerance.

2. Materials and Methods

2.1. Experimental Design

The experiment was carried out in 2019. Thirty new grapevine rootstock genotypes were studied in non-grafted conditions, and the commercial rootstock M2 was used as a control. The genetic background of all genotypes is reported in the work of Migliaro et al. [25]. Genotypes were analyzed under field conditions in two different environments, located in Arcagna (45.340276 N, 9.449786 E, 83 m a.s.l.) and Riccagioia (44.984783 N, 9.089038 E, 133 m a.s.l.). At each site, three biological repetitions per genotype were considered, represented by three different plants. Estimation of water status using thermography was performed on three days per site, during the phenological stages of flowering (DOY 164), veraison (DOY 200), and ripening (DOY 220). During ripening, gas exchange was also measured. Concurrently with the phenological stages of flowering and ripening, leaf samples were collected for mineral analysis. To assess the vigor of vines, pruning weight was measured at the two sites during winter.

2.2. Characterization of the Experimental Sites

The two experimental fields were located in Lombardy, Italy, and the distance between them was ~46 km. The experimental field in Riccagioia was set up in 2014, with inter-row distance between plants of 2.40 m and intra-row distance of 1.10 m. The soil in Riccagioia is classified as sandy clay loam (USDA Textural Soil Classification), consisting of 58% sand, 19% silt, and 23% clay. Total organic matter amounted to 8.95 g/kg, and the CEC was 14.5 me 100g−1. The values of pH in Riccagioia were 7.3 and 6.9 in H2O and KCl, respectively. N content in the soil was 5500 ppm, and the K/Mg ratio was 0.29. Daily meteorological data for Riccagioia were provided by the station network of ARPA Lombardia (reference station of Voghera). The experimental field in Arcagna was set up in 2015, with inter-row distance between plants of 3.10 m and intra-row distance of 2.00 m. According to the USDA Textural Soil Classification, the soil type was sandy loam, consisting of 75% sand, 14% silt, and 11% clay. Total organic matter amounted to 11.30 g/kg, and the CEC was 8.0 me 100g−1. The N content was 4000 ppm, and the K/Mg ratio amounted to 1.04. Temperature and precipitation in Arcagna were monitored in situ from a meteorological station. In both sites, vines were trained in a creeping system.

2.3. Leaf Temperature and Gas Exchange

On DOY 164, 200, and 220, the water status of plants was monitored via thermography. Thermal images were recorded using a Thermo Gear G100EX/G120EX thermal camera (detector—uncooled focal plane array; number of pixels—320 H × 240 V; spectral range—8–14 µm; dynamic resolution—14 bit), produced by InfReC, NEC Avio Infrared Technologies CO., Ltd. (Tachikawa, Japan). Emittance was set to 0.96, as suggested for grapevine leaves by Grant et al. [26]. One image was taken for each biological repetition, and three shaded leaves [27] were chosen in each image. Temperature was recorded at three points per leaf using the “InfReC Analyzer NS9500 Lite” software. Leaf temperature was normalized against a dry reference (Tdry) and wet reference (Twet) to determine the crop water stress index (CWSI), proposed by Idso et al. [28] and modified by Jones [29], as follows:
CWSI = T C T wet T dry T wet
where TC is the canopy temperature; Twet is the reference temperature for fully closed stomata; and Tdry is the reference temperature for fully transpiring leaves.
On DOY 220, gas exchange was measured in one sunny leaf per biological repetition using a portable leaf photosynthesis system (CIRAS-3, PP Systems, Amesbury, MA, USA) equipped with an 18 mm circular PLC6 (U) cuvette (2.5 cm2 head plate), under a constant saturating PPFD of 1500 µmol photons m−2 s−1, a CO2 concentration of 300 µmol mol−1, a block temperature of 25 °C, and relative humidity between 60% and 70%, allowing ~1.5 kPa of VPD inside the leaf chamber. Instantaneous water-use efficiency (WUE) was determined as the ratio between carbon assimilation (A) and the transpiration rate (E), whereas intrinsic water-use efficiency (iWUE) was calculated as the ratio between A and stomatal conductance (gs). Plasticity of iWUE (diWUE) and A (dA) were calculated as the absolute value of the difference in each trait between the two environments (Arcagna and Riccagioia).

2.4. Mineral Analysis

The nutritional status of vines was assessed based on the mineral composition of leaves. During flowering (DOY 164) and ripening (DOY 220), 3 samples per biological repetition were collected, and each sample was composed of 3 leaves close to bunches. Samples were dried in an oven at 60 °C until a constant mass was achieved, and then ground. An amount of 0.3 g for each sample was mineralized in 10 mL of HNO3 (>60%) at 210 °C for 20 min, followed by 20 min of cooling, and then filtered on a 0.45 µm nylon membrane. Levels of P, K, Ca, Mg, Na, Mn, Fe, and Zn were determined in the leaf samples via inductively coupled plasma mass spectrometry (ICP-MS), using a quadrupole spectrometer (Aurora M90, Bruker, Billerica, MA, USA). An amount of 7 mg of each ground sample was processed by an elemental analyzer (NA 1500 series 2 NC, Carlo Erba, Italy) to detect the levels of C and N. Photosynthetic nitrogen-use efficiency (PNUE) was calculated as the ratio between A and the level of N per unit of leaf area. The ratios K/Mg (KMg) and K/(Mg + Ca) (KMgCa) were also determined. The plasticity of KMgCa (dKMgCa) and Fe (dFe) were calculated as the absolute value of the difference in each trait between Arcagna and Riccagioia.

2.5. Statistical Analysis

All data were processed using Microsoft Office Excel Professional Plus 2016 and R statistical environment [30]. Single effects of factors and their interactions were tested by univariate ANOVA, after accounting for normality of distribution and homogeneity of variance. The level of significance was considered to be p ≤ 0.05. Data were standardized for multivariate analyses according to z distribution. Cluster analyses were performed using the Euclidean distance and a complete linkage method. Principal component analysis (PCA) was carried out using the factoextra R package. A Venn diagram was obtained using the jvenn open-source component for web environments [31].

3. Results and Discussion

3.1. Plasticity of Traits in Response to the Environment

The water and nutritional status of rootstocks were affected by environmental conditions, as well as by the genotype. During the vegetative period, the site of Riccagioia reported lower cumulative precipitation than Arcagna, amounting to 202.6 mm and 277.8 mm, respectively. The water deficit in Riccagioia and well-watered conditions in Arcagna were confirmed by the soil water potential, measured over the vegetative period during the phenological stages of flowering, veraison, and ripening. On DOY 164, 200, and 220, the soil water potential in Riccagioia was −0.04 MPa, −0.17 MPa, and −0.20 MPa, respectively, whereas in Arcagna it was −0.01 MPa, −0.09 MPa, and −0.14 MPa, respectively. The effects of the environment and its interaction with the genotype were significant for all of the physiological parameters related to water stress, with the exception of WUE (Table 1). Riccagioia reported higher CWSI than Arcagna throughout the entire vegetative period, and the largest differences between the two sites occurred during the stages of veraison and ripening. During ripening, average stomatal conduction in Arcagna amounted to 201.71 ± 10.47 mmol H2O m−2 s−1, whereas in Riccagioia it was 46.18 ± 3.49 mmol H2O m−2 s−1. The same trend was shown for transpiration and photosynthesis. The photosynthetic rate in Arcagna was higher than in Riccagioia, amounting to 10.43 ± 0.32 and 3.84 ± 0.34 µmol CO2 m−2 s−1, respectively, whereas the iWUE was higher in Riccagioia, amounting to 93.24 ± 8.47 µmol CO2 mol−1 H2O.
Differences between the two sites also occurred in the nutritional status of rootstocks. A significant effect of the environment was found for all of the nutrients analyzed in the leaves, except for P, Ca, and Zn during ripening, and Na during flowering (Table 1). Significant interaction of the environment and genotypes was also reported for all nutrients, except for C, P, Na, and Zn during ripening. The site of Arcagna reported higher levels of K, Fe, and Mn than Riccagioia during both physiological stages, as well as higher K/Mg and K/(Mg + Ca) ratios. During both stages, the levels of Mg were higher in Riccagioia, whereas the levels of N were higher in Arcagna during flowering and in Riccagioia during ripening. PNUE in Arcagna during ripening was higher than in Riccagioia, amounting to 4.64 ± 0.14 µmol CO2 g−1 N s−1 and 1.98 ± 0.16 µmol CO2 g−1 N s−1, respectively. At the end of the season, the produced biomass estimated by pruning weight amounted to 1.2 ± 0.06 kg in Arcagna and 0.48 ± 0.03 kg in Riccagioia. Correlation between all traits are reported in Supplementary Materials (Figure S1).
The measured parameters worked together to establish different water conditions in the two environments. The lack of precipitation in Riccagioia led to low water potential of the soil during the phenological stages of veraison and ripening, as well as to physiological responses of the vines in terms of stomatal closure and the consequent reduction in photosynthesis. The stomatal conductance in Riccagioia amounted to 46.18 ± 3.49 mmol H2O m−2 s−1; this value was below the threshold of gs for severe water stress (50 mmol H2O m−2 s−1) reported by Cifre et al. [32], who reviewed several studies with different grapevine varieties. Due to stomatal closure, the temperature of the leaves in Riccagioia generally increased, as detected based on the CWSI thermal index. Some thresholds for the water status of grapevines (Vitis vinifera cv. Pinot Noir) based on CWSI were reported previously by Bellvert et al. [33]. According to these thresholds, the level of CWSI in Riccagioia showed conditions of severe water stress during veraison and moderate water stress during ripening, whereas the level in Arcagna was below the threshold of mild water stress. The different water conditions in the two environments led to differences in terms of nutrient levels, with higher uptake of K in Arcagna—most likely promoted by the wider water availability [18].
Despite the marked effect of the environment, a significant effect of rootstock was found for all traits related to water stress, vigor, photosynthetic activity, and the affinity for most nutrients. Using different genotypes, a significant effect of rootstock on these traits was reported in the literature [2,15].

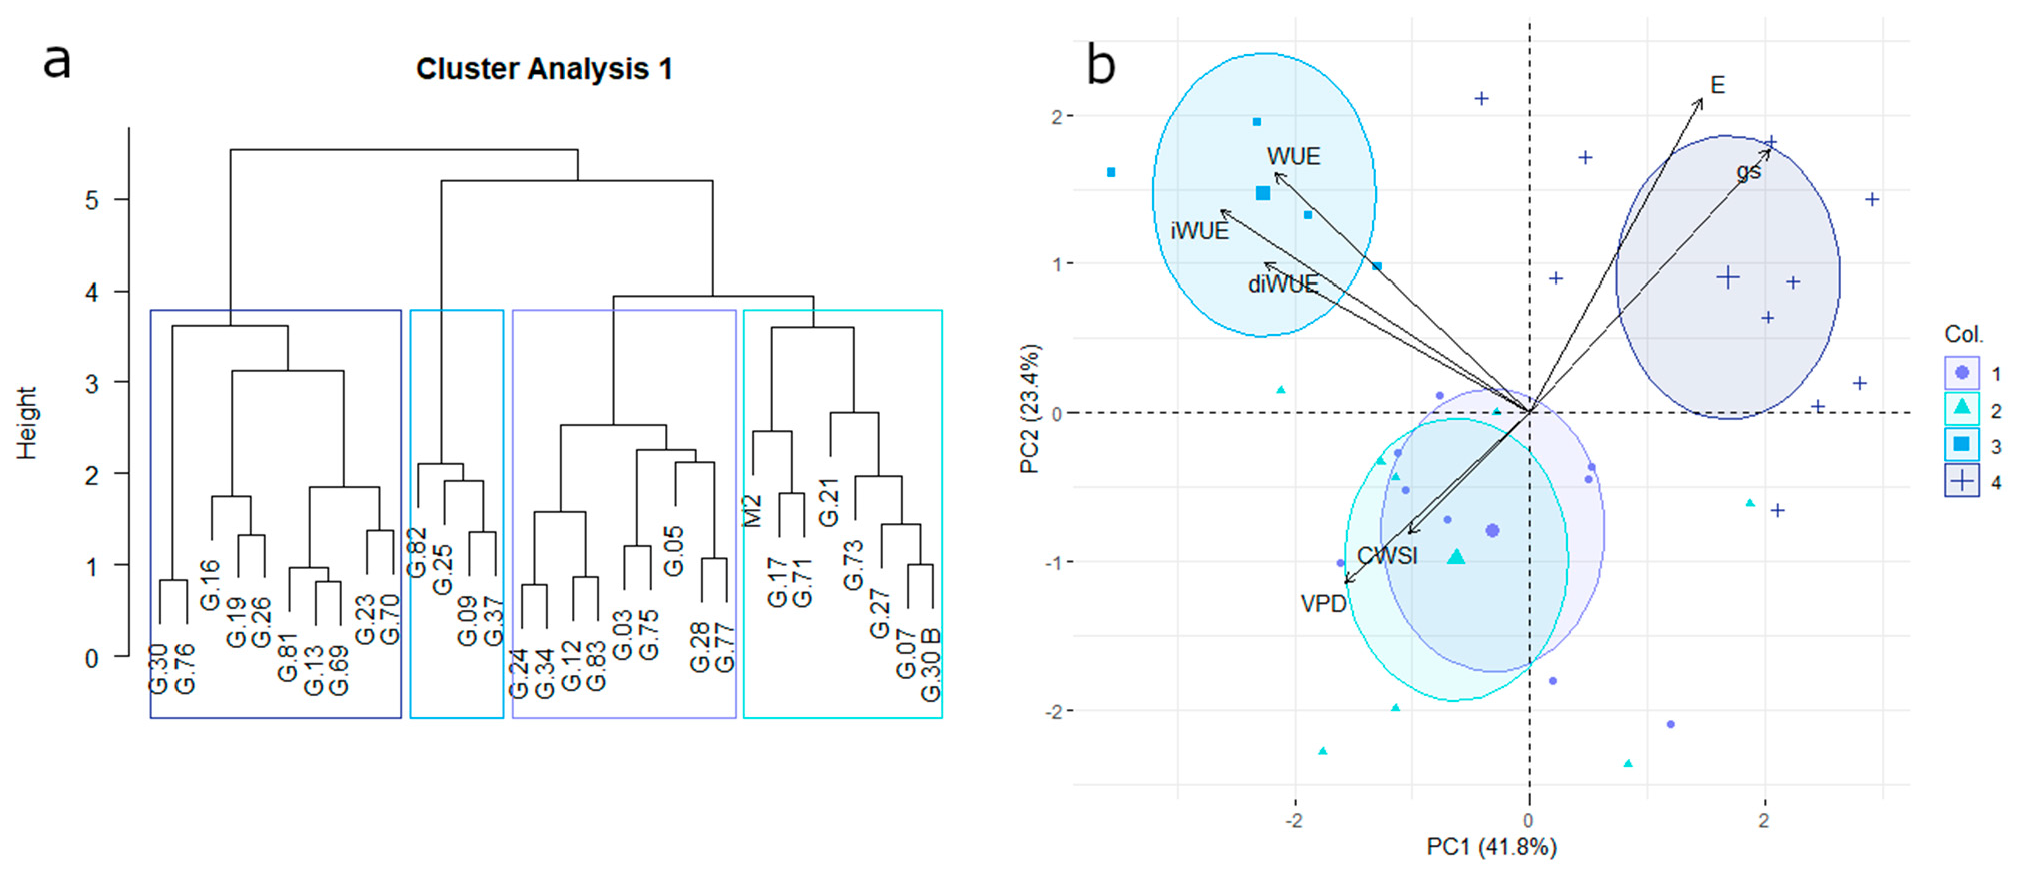
3.2. Water-Use Efficiency and Transpiration Control

Rootstock genotypes were classified according to gs, E, CWSI, iWUE, and the plasticity of iWUE in response to water deficit (diWUE). Based on Euclidean distance, 4 groups were identified: group 1 contained 9 genotypes; group 2 amounted to 8 genotypes, including rootstock M2; 4 genotypes belonged to group 3; and 10 genotypes belonged to group 4 (Figure 1a). The behavioral differences between groups were analyzed by PCA, including all of the parameters related to water stress. Two principal components were identified, representing ~65% of the total variance: The first component explained 41.8% of the variance, and it was positively affected by gs and E, and negatively affected by VPD, CWSI, WUE, iWUE, and diWUE. The second principal component explained 23.6% of the variance, and it increased along with gs, E, WUE, iWUE, diWUE, and decreased with VPD and CWSI. The biplot of the two first principal components is reported in Figure 1b: genotypes belonging to groups 1 and 2 reported high levels of VPD and CWSI; the four genotypes in group 3 reported high WUE, iWUE, and diWUE; whereas genotypes in group 4 reported high gs and E.
The groups of genotypes detected via cluster analysis were confirmed by PCA. The physiological meaning of the first principal component can be identified in the regulation of stomatal conductance. The second principal component was related to the tolerance to water stress, regardless of the adopted strategy. The best performance was shown by groups 3 and 4, but different strategies were adopted: group 4 reported a higher transpiration rate, maintaining similar iWUE in the two environments without altering the gas exchange; group 3 reported a higher iWUE, reducing the stomatal conductance, but preserving the photosynthetic activity in the environment under water deficit, as shown by diWUE. Groups 1 and 2 were more susceptible to water stress, reporting low iWUE and stomatal conductance, which was related to low transpiration rate and high VPD in the sub-stomatal chamber; thus, the temperature of the leaves increased, as detected by the CWSI thermal index. Genotypes belonging to groups 3 and 4 reported better water-use efficiency and stomatal conductance than rootstock M2, which is considered to be tolerant to water deficit conditions. In a preliminary study, some genotypes belonging to group 4 (i.e., G.13, G.19, G.23, G.26, G.30, and G.76) showed a mechanism of tolerance to water stress, notably increasing the wood hydrophobicity in order to reduce embolisms, or repairing them via starch remobilization [20]. In a recent study [34], some genotypes of group 4 (G.13, G.16, G.19, and G.81) and G.25—classified in group 3—increased the concentration of chlorophyll in woody tissues under water deficit, as a possible strategy of detoxification related to stem photosynthetic activity.

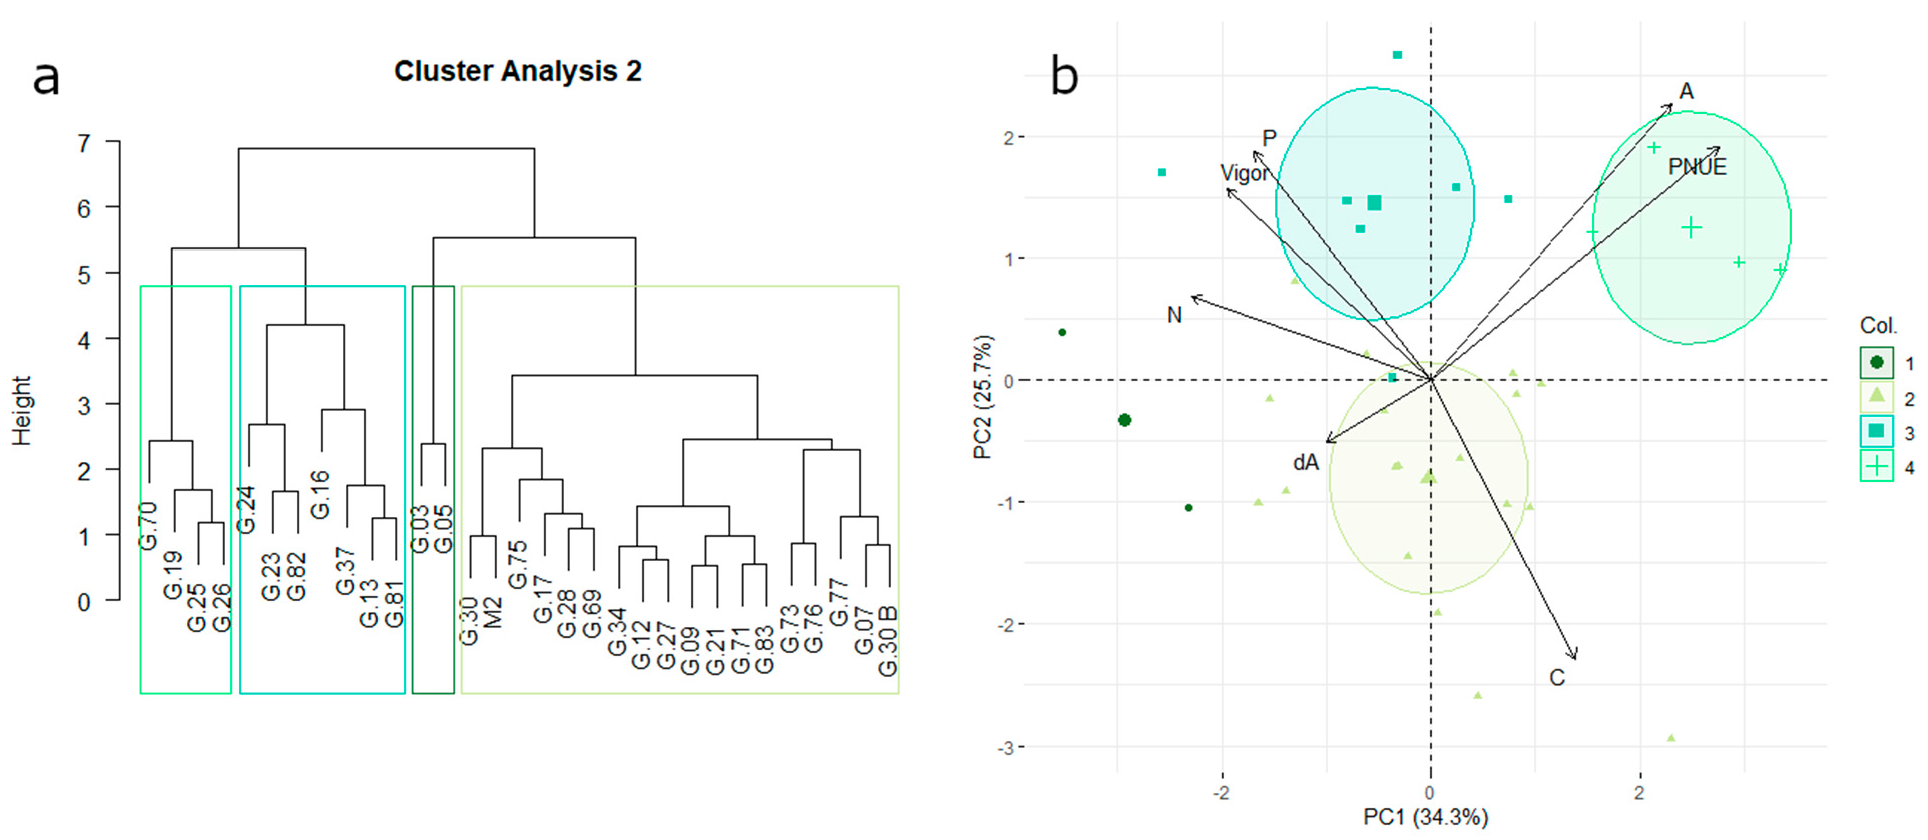
3.3. Vegetative Growth, Carbon Assimilation, and Nitrogen-Use Efficiency

A second cluster analysis classified the genotypes according to their vigor (represented by the pruning weight), carbon assimilation, levels of N and P, and photosynthetic nitrogen-use efficiency (PNUE). Results of the analysis identified four groups: group 1 was composed of 2 genotypes; group 2 comprised 18 genotypes, including M2; group 3 contained 7 genotypes; and group 4 included 4 genotypes (Figure 2a). Groups were characterized by PCA, considering two principal components able to explain ~60% of the total variance: The first principal component represented 34.3% of the variance, and was negatively affected by vigor and N, whereas it was positively affected by A and PNUE. The second component was mainly related to A, PNUE, C, and P, and explained 25.7% of the variance. The highest vigor was reported by genotypes belonging to groups 1 and 3, whereas the highest carbon assimilation and PNUE were reported by groups 3 and 4. Both low vigor and low photosynthesis were shown by genotypes belonging to group 2, which reported high levels of C and the largest differences in carbon assimilation between the two environments (Figure 2b).
Wide differences in terms of vigor were found between genotypes at the end of the season. The high vigor of genotypes in group 3 was also supported by high photosynthetic activity during the season and high levels of N in the leaves. In contrast, genotypes belonging to group 4 reported low levels of N and low vigor, but the highest photosynthetic rate during the season; this was related to high photosynthetic nitrogen-use efficiency. Group 4 also reported elastic behavior in terms of photosynthesis, reporting similar performance in the two environments. These results suggest that genotypes of group 4 can be used in several environments to maintain photosynthetic activity and to support vegetative growth and the ripening of grapes. On the other hand, genotypes of group 3 can confer vigor to the scion under limiting environments, ensuring high N and P uptake. The high N levels of genotypes belonging to group 3 (i.e., G.24, G.37, G.82, G.13, G.16, and G.23) confirmed the results obtained in a first screening of the mineral nutrition of the same genotypes [24].

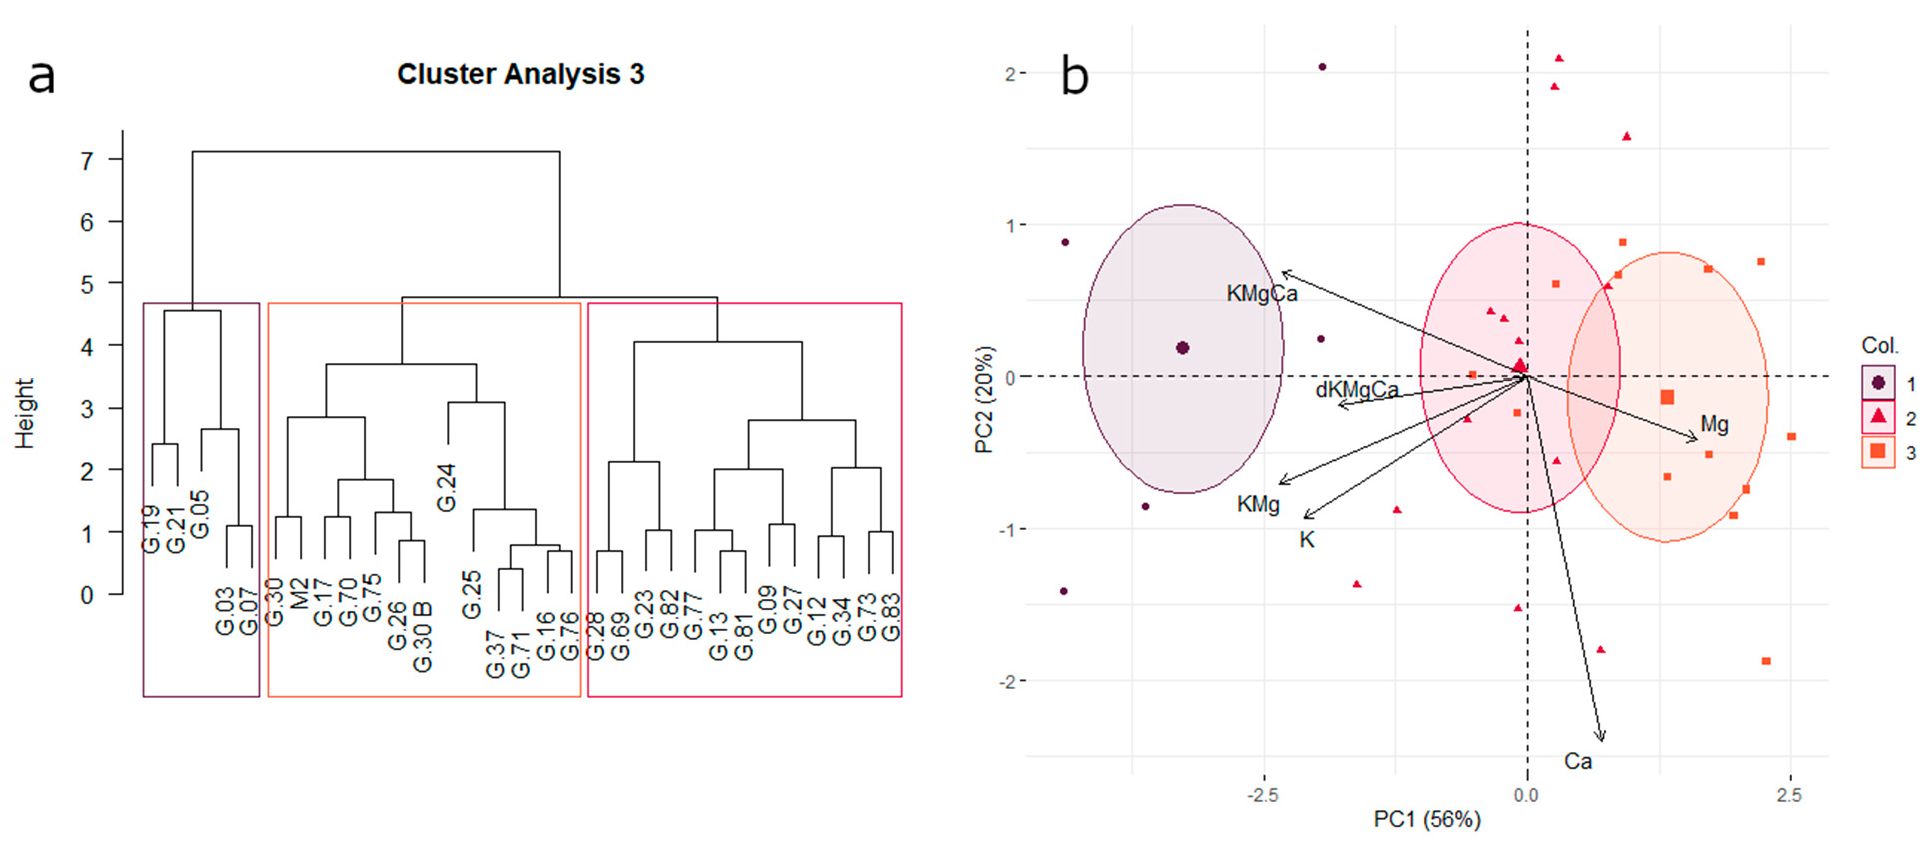
3.4. Affinity for Potassium or Magnesium Uptake

Genotypes were further classified according to their affinity for K or Mg. Three groups were identified via cluster analysis. The first group included 5 genotypes, the second group contained 13 genotypes, and the third group included 13 genotypes, including rootstock M2 (Figure 3a). Two principal components were found by PCA, explaining 76% of the total variance: The first component represented 56% of the variance, and it increased along with the level of Mg, while decreasing with the level of K, the k/Mg and K/(Mg + Ca) ratios, and the plasticity of K/(Mg + Ca) (i.e., dKMgCa). The second principal component explained 20% of the variance, and it was mainly affected by the level of Ca. The three groups of genotypes were well discriminated based on the first principal component (Figure 3b). Group 1 reported the highest levels of K and high values of the K/Mg and K/(Mg + Ca) ratios. Group 3 reported high levels of Mg and low levels of K, whereas group 2 reported intermediate levels of both K and Mg. Group 1 also reported the widest differences between the two environments in terms of K/(Mg + Ca). Two subgroups can be identified in group 3: the first included genotypes G.16, G.24, G.25, G.37, G.71, and G.76, which reported high levels of Ca, whereas the second subgroup included genotypes G.17, G.26, G.30, G.30B, G.70, and G.75, with low levels of Ca.
The three groups identified by cluster analysis showed different affinity for K or Mg. Genotypes with high levels of K generally reported low levels of Mg, confirming the antagonism in the uptake of these nutrients [16,17]. Affinity for K and Mg was described by the first principal component of PCA, whereas the second component was related to Ca uptake. Genotypes collected in group 1 displayed affinity for K and excluded Mg. These genotypes have previously reported high levels of K in a preliminary study—except for G.19, which reported an average K level [24]. Group 1 also reported the largest differences of the affinity for K, Mg, and Ca in response to the environment, showing plastic behavior. On the other hand, group 3 showed affinity for Mg, with lower levels of K. In group 3, genotypes G.17, G.24, G.26, G.30, G.70, G.71, and G.75 confirmed the affinity for Mg indicated by the first screening [24]. Genotypes in group 3 showed elastic behavior, maintaining similar levels of Mg and K in the two environments. Avoiding Mg deficit, they could reduce the risk of desiccation of the rachis. Furthermore, for specific oenological goals, these genotypes can be use as rootstocks to limit the uptake of K, reducing the salinification of tartaric acid and maintaining the acidity and freshness of wines [19].

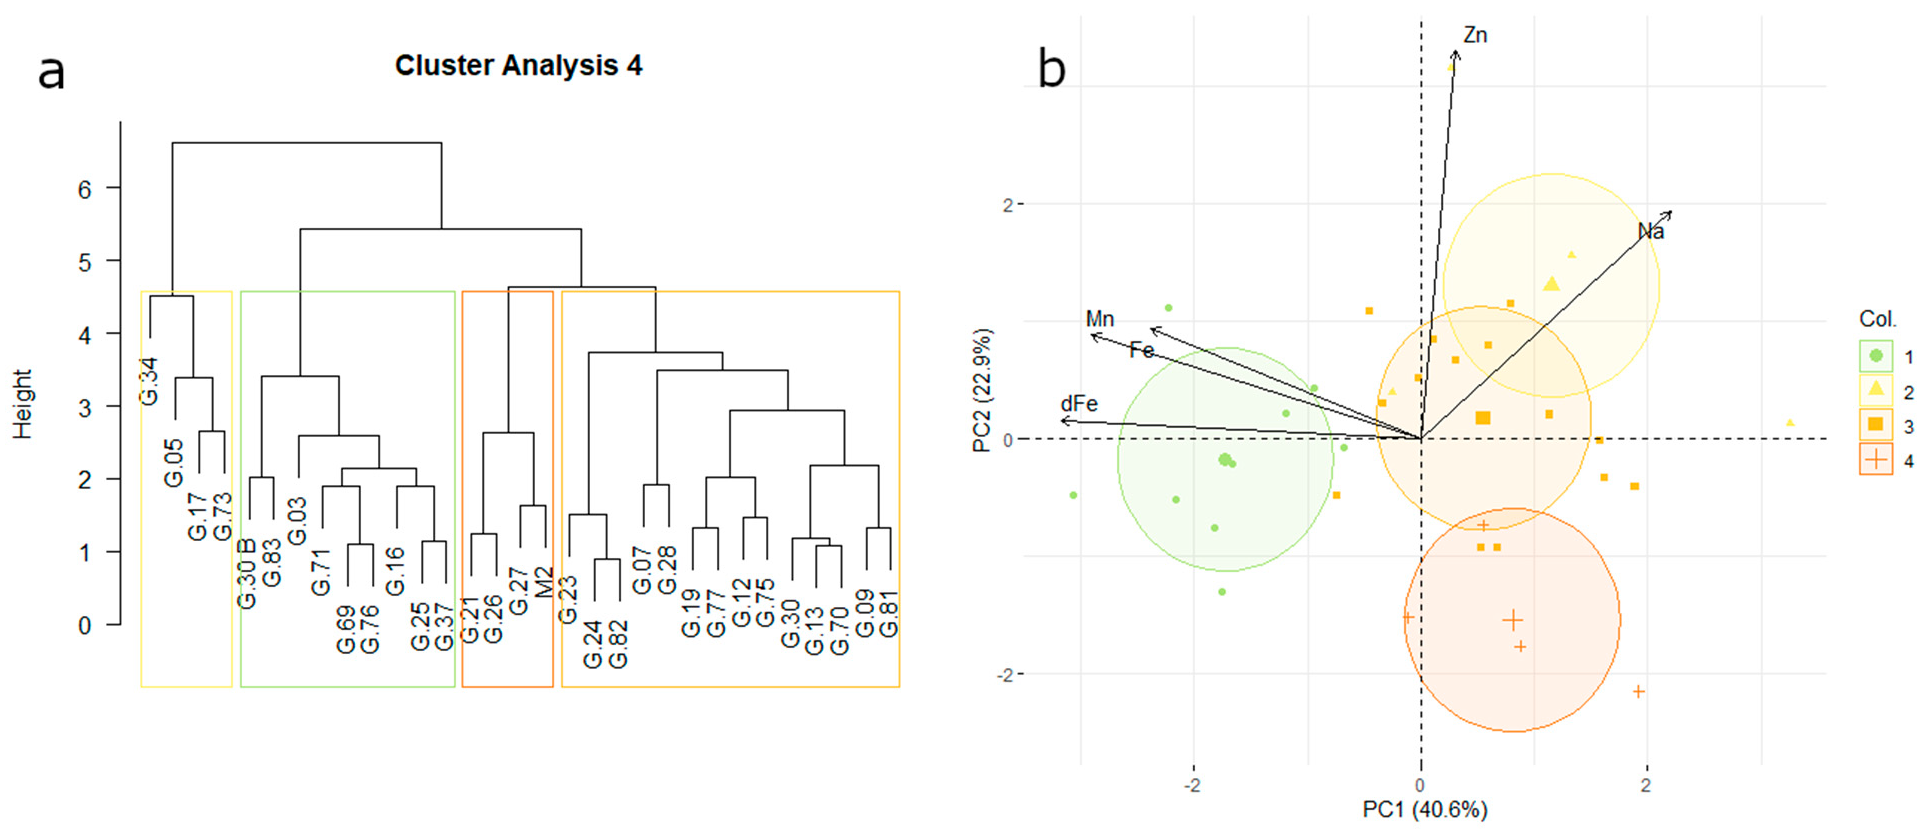
3.5. Uptake Affinity for Micronutrients

Differences between genotypes also occurred in terms of micronutrient levels. Cluster analysis was used to classify the genotypes according to their levels of Fe, Mg, Na, and Zn. The plasticity of Fe in response to the environment was also considered (dFe). In the analysis, four groups were identified (Figure 4a): group 1 comprised 9 genotypes; group 2 and group 4 counted 4 genotypes each; and group 3 contained 14 genotypes. Rootstock M2 was included in group 4. PCA was used to analyze the differences between groups (Figure 4b). The first two principal components explained 40.6% and 22.9% of the total variance, respectively. The first principal component was positively affected by the levels of Fe and Mg, as well as by dFe, whereas it was negatively affected by the level of Na. The second principal component was mainly related to the levels of Zn and Na. Group 1 could be differentiated from others based on the first principal component, reporting high levels of Mn and Fe, as well as high dFe. The other three groups were discriminated by the second principal component. Levels of Zn and Na were high in group 2 and low in group 4. Group 3 reported average levels of the analyzed micronutrients.
Genotypes showed different affinities for micronutrients. Genotypes in group 1 were able to uptake high levels of Fe and Mn; they also showed plastic behavior in Fe uptake in response to the environment, with higher levels of Fe in Arcagna. On the other hand, genotypes belonging to group 2 showed affinity for Zn and Na uptake. Genotypes in group 4 reported low levels of all of the analyzed micronutrients, and were the most susceptible to deficits of these elements. Genotypes in group 3 were particularly interesting because of their balance in the levels of micronutrients, reporting no deficits of specific elements. Genotypes in this group have previously shown affinity for Na (G.12, G.28, G.30, G.70, G.77, G.81, and G.82), Mn (G.09, G.12, G.13, G.23, G.24, G.30, G.75, and G.81), and Fe (G.07, G.13, G.19, G.23, G.24, and G.82) in a preliminary study on their nutritional status [24]. In the same study, genotypes of group 1 confirmed high levels of Mn (G.16, G.25, G.30B, G.71, and G.83) and Fe (G.16, G.30B, G76, and G.83).

3.6. Promising Rootstocks for Adaptation to Abiotic Stresses

The groups identified in the four cluster analyses were compared using a Venn diagram (Figure 5). In the diagram, the set “water stress tolerance” considers the genotypes belonging to group 3 and 4 from cluster analysis 1. Similarly, the set “vigor and carbon assimilation” includes groups 3 and 4 from cluster analysis 2. The sets “affinity for Mg” and “balance in micronutrients” consider group 3 from cluster analysis 3 and cluster analysis 4, respectively. Overall, the number of genotypes in the diagram amounts to 23. A total of 10 genotypes each belonged to the sets “water stress tolerance” and “vigor and carbon assimilation”; among them, 5 genotypes (G.16, G.25, G.26, G.37, and G.70) were also included in “affinity for Mg”, whereas 6 genotypes (G.13, G.19, G.23, G.70, G.81, and G.82) were also included in “balance in micronutrients”. Only G.70 belonged to all four sets, and the control rootstock M2 was only included in the set “affinity for Mg”.
A Venn diagram was used to summarize the results from the four cluster analyses, in order to characterize the promising genotypes for all of the analyzed traits. Except for G.24, all of the genotypes with high photosynthetic activity (groups 3 and 4 in cluster analysis 2) also reported high tolerance to water stress, in terms of transpiration or water-use efficiency (groups 3 and 4 in cluster analysis 1). The majority of genotypes that were tolerant to water stress also reported affinity for Mg rather than K. Among the genotypes with affinity for Mg, only four of them (G.24, G.30, G.70, and G.75) reported a balance in micronutrients.

4. Conclusions

In this work, a recent selection of 30 rootstock genotypes was phenotyped for their tolerance to abiotic stresses. The genotypes were ranked for all of the traits related to water stress, photosynthetic activity, vigor, and nutrient levels. The different growing conditions of genotypes at the two experimental sites allowed us to assess the plasticity of key traits in response to the environment. Among the genotypes, we identified promising rootstocks for abiotic stress tolerance. In particular, 14 genotypes exhibited a high WUE or transpiration rate, 11 genotypes showed high vigor and carbon assimilation, 5 genotypes were efficient in K uptake, and 13 genotypes showed affinity for Mg. In future studies, the promising genotypes identified in this work could be further investigated for water stress tolerance and mineral nutrition, in grafting combination with some cultivars of Vitis vinifera, under different environmental conditions. Furthermore, their tolerance to other abiotic stresses—such as limestone in the soil—could be tested. All of the collected data can be used to characterize the new rootstocks and their fundamental role in the adaptation of viticulture to the new environmental conditions imposed by climate change.

Supplementary Materials

The following are available online at https://www.mdpi.com/article/10.3390/horticulturae7110503/s1: Figure S1: Pearson’s correlation among all of the traits analyzed in the study. Significant correlations are considered for 0.01 ≤ p ≤ 0.05 (*), 0.001 ≤ p ≤ 0.01 (**), and p ≤ 0.001 (***).

Author Contributions

Conceptualization, L.B. and D.B.; methodology, L.B. and D.B.; software, D.B.; investigation, D.B.; resources, L.B.; data curation, D.B.; writing—original draft preparation, D.B.; writing—review and editing, L.B.; supervision, L.B.; project administration, L.B.; funding acquisition, L.B. All authors have read and agreed to the published version of the manuscript.

Funding

This research received no external funding.

Institutional Review Board Statement

Not applicable.

Informed Consent Statement

Not applicable.

Acknowledgments

This research was carried out in collaboration with WINEGRAFT-innovative solutions. We are grateful to the students Stefano Panighi, Riccardo Poletto, and Marco Lonati for their participation in the data collection.

Conflicts of Interest

The authors declare no conflict of interest.

References

  1. Khan, M.M.; Akram, M.T.; Qadri, R.W.K.; Al-Yahyai, R. Role of grapevine rootstocks in mitigating environmental stresses: A review. J. Agric. Mar. Sci. 2020, 25, 1–12. [Google Scholar] [CrossRef]
  2. Migicovsky, Z.; Cousins, P.; Jordan, L.M.; Myles, S.; Striegler, R.K.; Verdegaal, P.; Chitwood, D.H. Grapevine rootstocks affect growth-related scion phenotypes. Plant Direct 2021, 5, e00324. [Google Scholar] [CrossRef]
  3. Zombardo, A.; Crosatti, C.; Bagnaresi, P.; Bassolino, L.; Reshef, N.; Puccioni, S.; Faccioli, P.; Tafuri, A.; Delledonne, M.; Fait, A.; et al. Transcriptomic and biochemical investigations support the role of rootstock-scion interaction in grapevine berry quality. BMC Genom. 2020, 21, 468. [Google Scholar] [CrossRef]
  4. Keller, M. From the ASEV Soil Environment and Vine Mineral Nutrition Symposium: Deficit irrigation and vine mineral nutrition. Am. J. Enol. Vitic. 2005, 56, 267–283. [Google Scholar]
  5. Quénol, H.; Marie, G.; Barbeau, G.; Van Leeuwen, C.; Foss, C.; Irimia, L.; Rochard, J.; Boulanger, J.; Tissot, C.; Quénol, H.; et al. Adaptation of viticulture to climate change: High resolution observations of adaptation scenario for viticulture: The adviclim european project. Bull. l’OIV 2014, 87, 395–406. [Google Scholar]
  6. Galbignani, M.; Merli, M.; Magnanini, E.; Bernizzoni, F.; Talaverano, I.; Gatti, M.; Tombesi, S.; Palliotti, A.; Poni, S. Gas exchange and water—Use efficiency of cv. Sangiovese grafted to rootstocks of varying water—Deficit tolerance. Irrig. Sci. 2016, 34, 105–116. [Google Scholar] [CrossRef]
  7. Frioni, T.; Biagioni, A.; Squeri, C.; Tombesi, S.; Gatti, M.; Poni, S. Grafting cv. grechetto gentile vines to new m4 rootstock improves leaf gas exchange and water status as compared to commercial 1103p rootstock. Agronomy 2020, 10, 708. [Google Scholar] [CrossRef]
  8. Mirás-Avalos, J.M.; Araujo, E.S. Optimization of Vineyard Water Management: Challenges, Strategies, and Perspectives. Water 2021, 13, 746. [Google Scholar] [CrossRef]
  9. Zhang, L.; Marguerit, E.; Rossdeutsch, L.; Ollat, N.; Gambetta, G.A. The influence of grapevine rootstocks on scion growth and drought resistance. Theor. Exp. Plant Physiol. 2016, 28, 143–157. [Google Scholar] [CrossRef]
  10. Leão, P.C.d.S.; Chaves, A.R.d.M. Agronomic responses of grapevine ‘Chenin Blanc’ as a function of training systems and rootstocks. Sci. Agric. 2020, 78, e20180413. [Google Scholar] [CrossRef]
  11. Rossdeutsch, L.; Schreiner, R.P.; Skinkis, P.A.; Deluc, L. Nitrate Uptake and Transport Properties of Two Grapevine Rootstocks With Varying Vigor. Front. Plant Sci. 2021, 11, 608813. [Google Scholar] [CrossRef]
  12. Verdugo-Vásquez, N.; Gutiérrez-Gamboa, G.; Díaz-Gálvez, I.; Ibacache, A.; Zurita-Silva, A. Modifications induced by rootstocks on yield, vigor and nutritional status on vitis vinifera cv syrah under hyper-arid conditions in Northern Chile. Agronomy 2021, 11, 979. [Google Scholar] [CrossRef]
  13. Ibacache, A.; Verdugo-Vásquez, N.; Zurita-Silva, A. Rootstock: Scion combinations and nutrient uptake in grapevines. Fruit Crops Diagn. Manag. Nutr. Constraints 2019, 297–316. [Google Scholar] [CrossRef]
  14. Bell, S.J.; Henschke, P.A. Implications of nitrogen nutrition for grapes, fermentation and wine. Aust. J. Grape Wine Res. 2005, 11, 242–295. [Google Scholar] [CrossRef]
  15. Gautier, A.T.; Cookson, S.J.; Lagalle, L.; Ollat, N.; Marguerit, E. Influence of the three main genetic backgrounds of grapevine rootstocks on petiolar nutrient concentrations of the scion, with a focus on phosphorus. Oeno One 2020, 54, 1–13. [Google Scholar] [CrossRef]
  16. Casanova-Gascón, J.; Martín-Ramos, P.; Martí-Dalmau, C.; Badía-Villas, D. Nutrients Assimilation and Chlorophyll Contents for Different Grapevine Varieties in Calcareous Soils in the Somontano DO (Spain). Beverages 2018, 4, 90. [Google Scholar] [CrossRef] [Green Version]
  17. Toumi, M.; Nedjimi, B.; Halitim, A.; Garcia, M. Effects of K-Mg ratio on growth and cation nutrition of Vitis vinifera L. cv. “Dattier de Beiruth” grafted on SO4 rootstock. J. Plant Nutr. 2016, 39, 904–911. [Google Scholar] [CrossRef]
  18. Brancadoro, L.; Reina, L.V.A.; Scienza, A. Potassium content of grapevine during the vegetative period: The role of the rootstock. J. Plant Nutr. 1994, 17, 2165–2175. [Google Scholar] [CrossRef]
  19. Kodur, S. Effects of juice pH and potassium on juice and wine quality, and regulation of potassium in grapevines through rootstocks (Vitis): A short review. Vitis J. Grapevine Res. 2011, 50, 1–6. [Google Scholar]
  20. Marastoni, L.; Lucini, L.; Miras-Moreno, B.; Trevisan, M.; Sega, D.; Zamboni, A.; Varanini, Z. Changes in physiological activities and root exudation profile of two grapevine rootstocks reveal common and specific strategies for Fe acquisition. Sci. Rep. 2020, 10, 18839. [Google Scholar] [CrossRef] [PubMed]
  21. Dal Santo, S.; Zenoni, S.; Sandri, M.; De Lorenzis, G.; Magris, G.; De Paoli, E.; Di Gaspero, G.; Del Fabbro, C.; Morgante, M.; Brancadoro, L.; et al. Grapevine field experiments reveal the contribution of genotype, the influence of environment and the effect of their interaction (G×E) on the berry transcriptome. Plant J. 2018, 93, 1143–1159. [Google Scholar] [CrossRef]
  22. Pinto, D.L.P.; Brancadoro, L.; Dal Santo, S.; De Lorenzis, G.; Pezzotti, M.; Meyers, B.C.; Pè, M.E.; Mica, E. The influence of genotype and environment on small RNA profiles in grapevine berry. Front. Plant Sci. 2016, 7, 1459. [Google Scholar] [CrossRef] [PubMed] [Green Version]
  23. Bianchi, D.; Grossi, D.; Tincani, D.T.G.; Simone Di Lorenzo, G.; Brancadoro, L.; Rustioni, L. Multi-parameter characterization of water stress tolerance in Vitis hybrids for new rootstock selection. Plant Physiol. Biochem. 2018, 132, 333–340. [Google Scholar] [CrossRef] [PubMed]
  24. Bianchi, D.; Grossi, D.; Simone Di Lorenzo, G.; Zi Ying, Y.; Rustioni, L.; Brancadoro, L. Phenotyping of the “G series” Vitis hybrids: First screening of the mineral composition. Sci. Hortic. 2020, 264, 109155. [Google Scholar] [CrossRef]
  25. Migliaro, D.; De Lorenzis, G.; Simone Di Lorenzo, G.; De Nardi, B.; Gardiman, M.; Failla, O.; Brancadoro, L.; Crespan, M. Grapevine non-vinifera genetic diversity assessed by SSR markers as a starting-point for new rootstock breeding programs. Am. J. Enol. Vitic. 2019, in press. [Google Scholar] [CrossRef]
  26. Grant, O.M.; Chaves, M.M.; Jones, H.G. Optimizing thermal imaging as a technique for detecting stomatal closure induced by drought stress under greenhouse conditions. Physiol. Plant. 2006, 127, 507–518. [Google Scholar] [CrossRef]
  27. Jones, H.G.; Stoll, M.; Santos, T.; De Sousa, C.; Chaves, M.M.; Grant, O.M. Use of infrared thermography for monitoring stomatal closure in the field: Application to grapevine. J. Exp. Bot. 2002, 53, 2249–2260. [Google Scholar] [CrossRef] [PubMed]
  28. Idso, S.B.; Jackson, R.D.; Pinter, P.J., Jr.; Reginato, R.J.; Hatfield, J.L. Normalizing the stress-degree-day parameter for environmental variability. Agric. Meteorol. 1981, 24, 45–55. [Google Scholar] [CrossRef]
  29. Jones, H.G. Use of thermography for quantitative studies of spatial and temporal variation of stomatal conductance over leaf surfaces. Plant Cell Environ. 1999, 22, 1043–1055. [Google Scholar] [CrossRef] [Green Version]
  30. R Core Team. R: A Language and Environment for Statistical Computing; R Foundation for Statistical Computing: Vienna, Austria, 2021. [Google Scholar]
  31. Bardou, P.; Mariette, J.; Escudié, F.; Djemiel, C.; Klopp, C. SOFTWARE Open Access jvenn: An interactive Venn diagram viewer. BMC Bioinform. 2014, 15, 293. [Google Scholar] [CrossRef] [Green Version]
  32. Cifre, J.; Bota, J.; Escalona, J.M.; Medrano, H.; Flexas, J. Physiological tools for irrigation scheduling in grapevine (Vitis vinifera L.) An open gate to improve water-use efficiency? Agric. Ecosyst. Environ. 2005, 106, 159–170. [Google Scholar] [CrossRef]
  33. Bellvert, J.; Zarco-Tejada, P.J.; Girona, J.; Fereres, E. Mapping crop water stress index in a ‘Pinot-noir’ vineyard: Comparing ground measurements with thermal remote sensing imagery from an unmanned aerial vehicle. Precis. Agric. 2014, 15, 361–376. [Google Scholar] [CrossRef]
  34. Rustioni, L.; Bianchi, D. Drought increases chlorophyll content in stems of Vitis interspecific hybrids. Theor. Exp. Plant Physiol. 2021, 33, 69–78. [Google Scholar] [CrossRef]
Figure 1. Classification of rootstock genotypes for water-use efficiency and transpiration control based on cluster analysis (a) and PCA (b). WUE: instantaneous water-use efficiency; iWUE: intrinsic water-use efficiency; diWUE: plasticity of water-use efficiency; E: transpiration rate; gs: stomatal conductance; VPD: vapor pressure deficit; CWSI: crop water stress index.
Horticulturae 07 00503 g001
Figure 2. Classification of rootstock genotypes for vigor, carbon assimilation, and nitrogen uptake based on cluster analysis (a) and PCA (b). A: carbon assimilation; dA: plasticity of carbon assimilation; PNUE: photosynthetic nitrogen-use efficiency; N: nitrogen; P: phosphorous; C: carbon.
Horticulturae 07 00503 g002
Figure 3. Classification of rootstock genotypes for potassium and magnesium based on cluster analysis (a) and PCA (b). K = potassium; Mg: magnesium; Ca: calcium; KMg: potassium–magnesium ratio; KMgCa: potassium–magnesium–calcium ratio; dKMgCa: plasticity of the potassium–magnesium–calcium ratio.
Horticulturae 07 00503 g003
Figure 4. Classification of rootstock genotypes for micronutrients based on cluster analysis (a) and PCA (b). Na: sodium; Zn: zinc; Mn: magnesium; Fe: iron; dFe: plasticity of iron level.
Horticulturae 07 00503 g004
Figure 5. Venn diagram of promising rootstocks for abiotic stress tolerance.
Horticulturae 07 00503 g005
Table 1. Mean values and standard error for each analyzed trait in the two environments (Arcagna and Riccagioia) at each phenological stage.
TraitStageu.m.ArcagnaRiccagioiaEGG × E
gsrmmol H2O m−2 s−1201.71 ± 10.4746.18 ± 3.49*********
Ermmol H2O m−2 s−13.22 ± 0.121.2 ± 0.07*********
WUErmmol CO2 mol−1 H2O3.48 ± 0.133.17 ± 0.26n.s.******
iWUErµmol CO2 mol−1 H2O61.68 ± 3.1193.24 ± 8.47*********
VPDrkPa1.94 ± 0.062.95 ± 0.09*********
CWSIf-0.39 ± 0.010.52 ± 0.01********
CWSIv-0.20 ± 0.010.71 ± 0.01*********
CWSIr-0.23 ± 0.010.63 ± 0.01*********
Vigordkg1.20 ± 0.060.48 ± 0.03*********
Arµmol CO2 m−2 s−110.43 ± 0.323.84 ± 0.34*********
Cf%44.72 ± 0.1343.48 ± 0.13***n.s.*
Cr%43.68 ± 0.3845.08 ± 0.17**n.s.n.s.
Nf%2.99 ± 0.062.63 ± 0.04*********
Nr%1.62 ± 0.031.86 ± 0.02*********
PNUErµmol CO2 g−1 N s−14.64 ± 0.141.98 ± 0.16*********
Pf%0.32 ± 0.010.37 ± 0.02*******
Pr%0.22 ± 0.010.22 ± 0.01n.s.***n.s.
Kf%0.98 ± 0.020.76 ± 0.03********
Kr%0.95 ± 0.040.44 ± 0.01*********
Mgf%0.18 ± 0.010.27 ± 0.01*********
Mgr%0.31 ± 0.010.52 ± 0.01*********
Caf%1.54 ± 0.051.38 ± 0.05*******
Car%2.57 ± 0.072.51 ± 0.05n.s.******
KMgf-6.03 ± 0.342.99 ± 0.14*********
KMgr-3.75 ± 0.330.93 ± 0.05*********
KMgCaf-0.62 ± 0.030.51 ± 0.03*********
KMgCar-0.36 ± 0.020.15 ± 0.01*******
Nafppm37.68 ± 2.8646.96 ± 3.92n.s.n.s.**
Narppm59.36 ± 7.3334.56 ± 2.27**n.s.n.s.
Fefppm235.51 ± 7.44120.5 ± 5.94*********
Ferppm313.79 ± 8.95276.03 ± 6.53********
Mnfppm179.16 ± 7.34144.02 ± 7.43*********
Mnrppm156.26 ± 6.9462.21 ± 2.61*********
Znfppm21.75 ± 1.0240.06 ± 3.22*********
Znrppm24.91 ± 1.4925.15 ± 1.46n.s.n.s.n.s.
Values shown are means ± standard error; f: flowering; v: veraison; r: ripening; d: dormancy. Significant effects of environment (E), genotype (G), and their interaction (G × E) are reported for p ≤ 0.001 (***), 0.001 ≤ p ≤ 0.01 (**), 0.01 ≤ p ≤ 0.05 (*), and p > 0.05 (n.s.).
Publisher’s Note: MDPI stays neutral with regard to jurisdictional claims in published maps and institutional affiliations.

