Article

Comparative Transcriptomic Analyses Provide Insights into the Enzymatic Browning Mechanism of Fresh-Cut Sand Pear Fruit

1
Research Institute of Fruit and Tea, Hubei Academy of Agricultural Science, Wuhan 430064, China
2
Citrus Research and Education Center, University of Florida, 700 Experiment Station Rd., Lake Alfred, FL 33850, USA
3
Hubei Hongshan Laboratory, Huazhong Agricultural University, Wuhan 430070, China
*
Author to whom correspondence should be addressed.
Horticulturae 2021, 7(11), 502; https://doi.org/10.3390/horticulturae7110502
Submission received: 22 October 2021 / Revised: 15 November 2021 / Accepted: 15 November 2021 / Published: 16 November 2021

Abstract

:
Pear (Pyrus spp.) is one of the most commonly consumed temperate fruits, having considerable economic and health importance. Fresh-cut or processed pear fruits are prone to browning because of the abundant phenolic compounds; however, little is known about the molecular mechanisms underlying enzymatic browning of fresh-cut sand pear fruit. In this study, fruits of two sand pear genotypes (low browning cultivar ‘Eli No.2′ and high browning cultivar ‘Weiningdahuangli’) were used to analyze the molecular mechanism of enzymatic browning by SMRT-seq and RNA-seq. The results generated 69,122 consensus isoforms, 21,336 new transcripts, 7105 alternative splicing events, and 254 long non-coding RNAs (lncRNAs). Furthermore, five genes related to enzymatic browning were predicted to be targets of six lncRNAs, and 9930 differentially expressed genes (DEGs) were identified between two different flesh browning cultivars. Meanwhile, most DEGs (e.g., PAL, 4CL, CAD, CCR, CHS, and LAR) involved in the phenylpropanoid biosynthesis pathway were up-regulated, and the expression of PPO and POD were highly expressed in the high-browning cultivar. Interestingly, the transcript level of PbrPPO4 (Pbr000321.4) was significantly higher than other PPO and POD genes, and a high level of total polyphenol and PPO activity were observed in the high browning cultivar. We found that the expression of lncRNA PB.156.1 was significantly positively correlated with the target gene PbrPPO4 (Pbr000321.4). The results suggest that PbrPPO4 might act as a major contributor and a key enzyme encoding gene in regulating fresh-cut sand pear fruit enzymatic browning; the expression of PbrPPO4 was probably regulated by lncRNA PB.156.1. Altogether, the transcriptomic and physiological analyses expand the knowledge of sand pear flesh enzymatic browning at the molecular level and provide a foundation for germplasm resources for molecular breeding of high polyphenol and low browning cultivars in sand pears.

Graphical Abstract

1. Introduction

Browning of fruits and vegetables during cutting, peeling, packaging, storing, and processing is a common phenomenon, which affects produce quality. This phenomenon, known as enzymatic browning, refers to the oxidation of phenolic compounds into quinones by polyphenol oxidase (PPO) in fruits and vegetables [1]. Pear (Pyrus spp.), one of the most commonly consumed and widespread fruits in the world, has considerable economic and health importance. However, pear fruits are prone to browning during fresh-cut, processing, and postharvest storage, and the browning seriously reduces their appearance, shelf life, taste, flavor, and nutrition [2,3,4].
PPO and peroxidase (POD) are the key enzymes engaged in the polyphenol degradation and browning discoloration in horticultural products [5]. PPO acts on phenols under oxygen conditions, and POD catalyzes the oxidation of phenolic compounds under hydrogen peroxide conditions, leading to the formation of brown degradation products [5]. PPO is encoded by a multi-gene family which is highly conserved and differentially expressed in different tissues, indicating a functional diversity of these genes [6,7,8]. Two PPO genes were found to be involved in browning reactions in potato tuber tissues, but their roles were different, with StuPPO2 playing a major role [9]. Mutations in the StPPO2 by the CRISPR/Cas9 system led to a 73% reduction in enzymatic browning compared to the control [10]. In apples, ten PPO genes associated with browning were initially identified and located on three main chromosomes; among them, one PPO gene Md-PPO was thought to be activated more to regulate the polyphenolic metabolic pathway [11]. The different expression of PPO genes was regulated by transcription factor or miRNA [12,13]. POD and PPO can promote the degradation of phenols [14].
In fruits, the enzymatic browning substrates are variety of phenolics [1]. Polyphenols are major secondary metabolites in fruits and vegetables. Early studies showed that pears contain a variety of phenolic compounds such as chlorogenic acid, arbutin, epicatechin, and catechin [15,16,17]. These phenolic compounds have positive benefits because of their antioxidant and anti-inflammatory properties [18,19,20]. However, on the other hand, the phenolic substrates significantly contribute to pear fresh-cut browning [2,21], cold storage core browning [3,22], and refrigerated storage peel browning [23]. Most polyphenols such as chlorogenic acid, catechin, and epicatechin are synthesized by the phenylpropanoid and flavonoid biosynthesis pathway; phenylalanine ammonia-lyase (PAL), cinnamate 4-hydroxylase (C4H), 4-coumarate-CoA ligase (4CL), and chalcone synthase (CHS) are members of the common phenylpropanoid pathway in plants [24,25,26]. L-Phenylalanine is an important precursor for the synthesis of phenylpropanoids, and is synthesized from the shikimate pathway [27].
Previous studies have focused on the technique of physical and chemical anti-browning. Currently, many approaches are being used to reduce enzymatic browning by stunting the activities of the PPO and POD enzymes, such as the use of 1-methylcyclopropene [3], melatonin [21], ultrasound [28], xanthan gum-based edible coating [29], and L-cysteine [30]. Several reports have also described the use of RNA silencing and genome editing to down-regulate PPO genes in order to reduce the enzymatic browning in potatos [9,10], apples [31], eggplants [32], and mushrooms [33].
European pear (P. communis), sand pear (P. pyrifolia), Ussurian pear (P. ussuriensis), and white pear (P. bretschneideri) are the four major cultivated pears in the world. Sand pear is distributed mainly in China, Japan, and Korea. However, less is known about the browning mechanism of fresh-cut sand pear flesh. Here, we chose two sand pear cultivars with low and high flesh browning characters. In this study, single molecular real-time (SMRT) sequencing and RNA-seq analysis were used to conduct transcriptomic profiling of the two contrasting browning sand pear cultivars. The key differentially expressed genes (DEGs) related to sand pear fruit enzymatic browning were identified. With the physiological analysis of phenolic content, PPO and POD enzyme activities were detected. We focused on the responsive mechanisms of fresh-cut sand pear flesh browning for two different materials by integrating plant physiological and transcriptional approaches. Our results provide new insights into the molecular mechanism of sand pear flesh browning.

2. Materials and Methods

2.1. Plant Materials

For this study, 10-year-old healthy and vigorously grown plants, grafted on P. calleryana, were selected from National Sand Pear Germplasm Repository in Wuhan, Hubei, China (N30.29, E114.15). Fifteen immature and mature fruits of two sand pear cultivars (P. pyrifolia), the high browning (HB) cultivar (Weiningdahuangli), and the low browning (LB) cultivar (Eli No.2) were obtained. The two samples were both full bloom on 20 March 2017. Immature fruit samples of both cultivars were collected at 90 days after flowering, while mature fruit samples of LB and HB were collected on 28 July 2017 and 14 September 2017, respectively. The mature fruits of HB are oblate, with an average weight of 266 g and an average total soluble solids (TSS) of 11.2%; the mature fruits of LB are obovate, with an average weight of 208 g and an average TSS of 12.3%. Fresh peel and pulp tissues were dissected from immature and mature fruits. In addition, some fruits were cut and kept at room temperature and after 1 h mature pulp tissues were collected. All samples were immediately frozen in liquid nitrogen and stored at −80 °C for subsequent analysis.

2.2. Browning Measurement in Sand Pear Flesh Slices

The color changes were measured with a Konica-Minolta CR-5 chromameter (Osaka, Japan) in mature sand pear flesh slices. Three mature fruits and six replicate flesh slices per mature fruit were analyzed. The CIELAB colour parameters (L*, a*, b*) were measured immediately after the sand pear fruit was cut (L0*, a0*, b0*), and then the second reading was taken after 1 h (L1*, a1*, b1*). The browning index (BI Equation (1)) and total color changes (ΔE Equation (3)) were calculated as follows.
BI = (x − 0.31)/0.172 × 100
where x was calculated as in Equation (2).
x = (a* + 1.75 L*)/(5.645 L* + a* − 3.012 b*)
ΔE = [(L1*L0*)2 + (a1*a0*)2 + (b1*b0*)2]½

2.3. RNA Extraction

Total RNA was extracted using a TaKaRa Plant RNA extraction kit (Takara, Kyoto, Japan) following the provided protocol. RNA quality was checked and quantified using a Nanodrop ND-1000 (Thermo Fisher Scientific, Waltham, MA, USA) and the Agilent 2100 Bioanalyzer (Agilent Technologies, Santa Clara, CA, USA). For SMRT sequencing, equal amounts of RNA from ten different tissues (immature peel, immature flesh, mature peel, mature flesh, and mature fresh-cut at 1 h of HB and LB cultivars) were combined. For Illumina sequencing, the total RNA from mature fruit fresh-cut at 0 h and 1 h of two cultivars was used.

2.4. SMRT, Illumina RNA Sequencing, and Data Analysis

Full-length (FL) transcriptome sequencing of SMRT sequencing was carried out at Biomarker Technologies Co., Ltd. (Beijing, China), following the manufacturer’s protocols. Size fractionation and selection (1–2 kb, 2–3 kb, and >3 kb) were performed using the BluePippin™ Size Selection System (Sage Science, Beverly, MA, USA). Three SMRT libraries were generated by using Pacific Biosciences’ 1.0 template prep kit. The Illumina cDNA libraries were generated by the NEBNext Ultra™ RNA Library Prep Kit (NEB, Beverly, MA, USA) according to the manufacturer’s instructions. These processes were repeated for each sample three times.
FL isoforms, open reading frames (ORFs), and alternative splicing (AS) were generated from data assembly. In long noncoding RNA (lncRNA) identification from PacBio sequences, four pervasive coding potential assessment approaches, namely, Coding Potential Calculator (CPC), Coding–Non-coding Index (CNCI), Coding Potential Assessment Tool (CPAT), and Pfam database 27.0 analyses, were combined to sort the non-protein coding RNA candidates from putative protein-coding RNAs in the transcripts.
BLASTX alignment was performed between these unigene sequences and public protein databases: COG (Clusters of Orthologous Groups), eggNOG (evolutionary genealogy of genes: Non-supervised Orthologous Groups), NR (NCBI non-redundant), Pfam (a database of conserved protein families or domains), SWISS-PROT (a manually annotated and reviewed protein sequence database), GO (Gene Ontology), and KEGG (Kyoto Encyclopedia of Genes and Genomes). Transcript expression levels were quantified by the FPKM method (fragments per kilobase of transcript per million mapped reads). Differentially expressed genes (DEGs) with |Fold Change| ≥ 2 and FDR (false discovery rate) < 0.01 were defined after digitally normalized filtering.
KEGG pathway enrichment analysis was used as the unit of significance enrichment analysis. Hypergeometric tests were performed to identify pathways that were significantly enriched in DEGs compared to the whole gene background.

2.5. Quantitative Real-Time PCR (qRT-PCR) Analysis

The first-strand cDNA was performed using the PrimeScript™ RT Reagent Kit with gDNA Eraser (TaKaRa) according to the manufacturer’s instructions. The qRT-PCR was performed on a CFX real-time PCR system (BioRad, Hercules, CA, USA) using Luna® Universal qPCR Master Mix (NEB). The relative expression level was calculated using the comparative Ct method (2−ΔΔCt). The primers used in this study are shown in Table S1, and the YLS8 gene was used as a reference gene [34]. Each treatment process was duplicated three times.

2.6. Measurement of Total Phenolic Content and Monomeric Compounds

The Folin–Ciocalteu spectrophotometric method was used to measure the total phenolics (µg gallic acid/g fresh weight) of the sand pear flesh as previously described by Zheng [21]. The total phenolics content was quantified at 760 nm using a spectrophotometer (Hanon, Jinan, China). Folin-Ciocalteu reagent was supplied from Beijing Solarbio Science & Technology Co. (Beijing, China).The extraction and quantification of chlorogenic acid, catechin, and epicatechin were performed by using the high-throughput and multiplexed LC/MS/MRM method [16,17]. Monomeric phenolic compounds profiling was analyzed using an LC-MS system (1290 Infinity LC and Agilent 6420 QQQ, Agilent Technologies, USA). The detailed information is shown in the Supplementary Materials.

2.7. Assessment of Enzyme Activity

The activity of PPO and POD enzymes were detected using the operation manual of Ruixinbio (Quanzhou Ruixin Biological Technology, Quanzhou, China). PPO and POD enzyme activities were measured at 530 nm and 470 nm with a spectrophotometer system, respectively. One unit of enzyme activity (1 UEA) was defined as an increase in absorbance of 0.005 min−1 per g fresh tissue per mL reaction. Five repetitions were performed for each sample.

3. Results

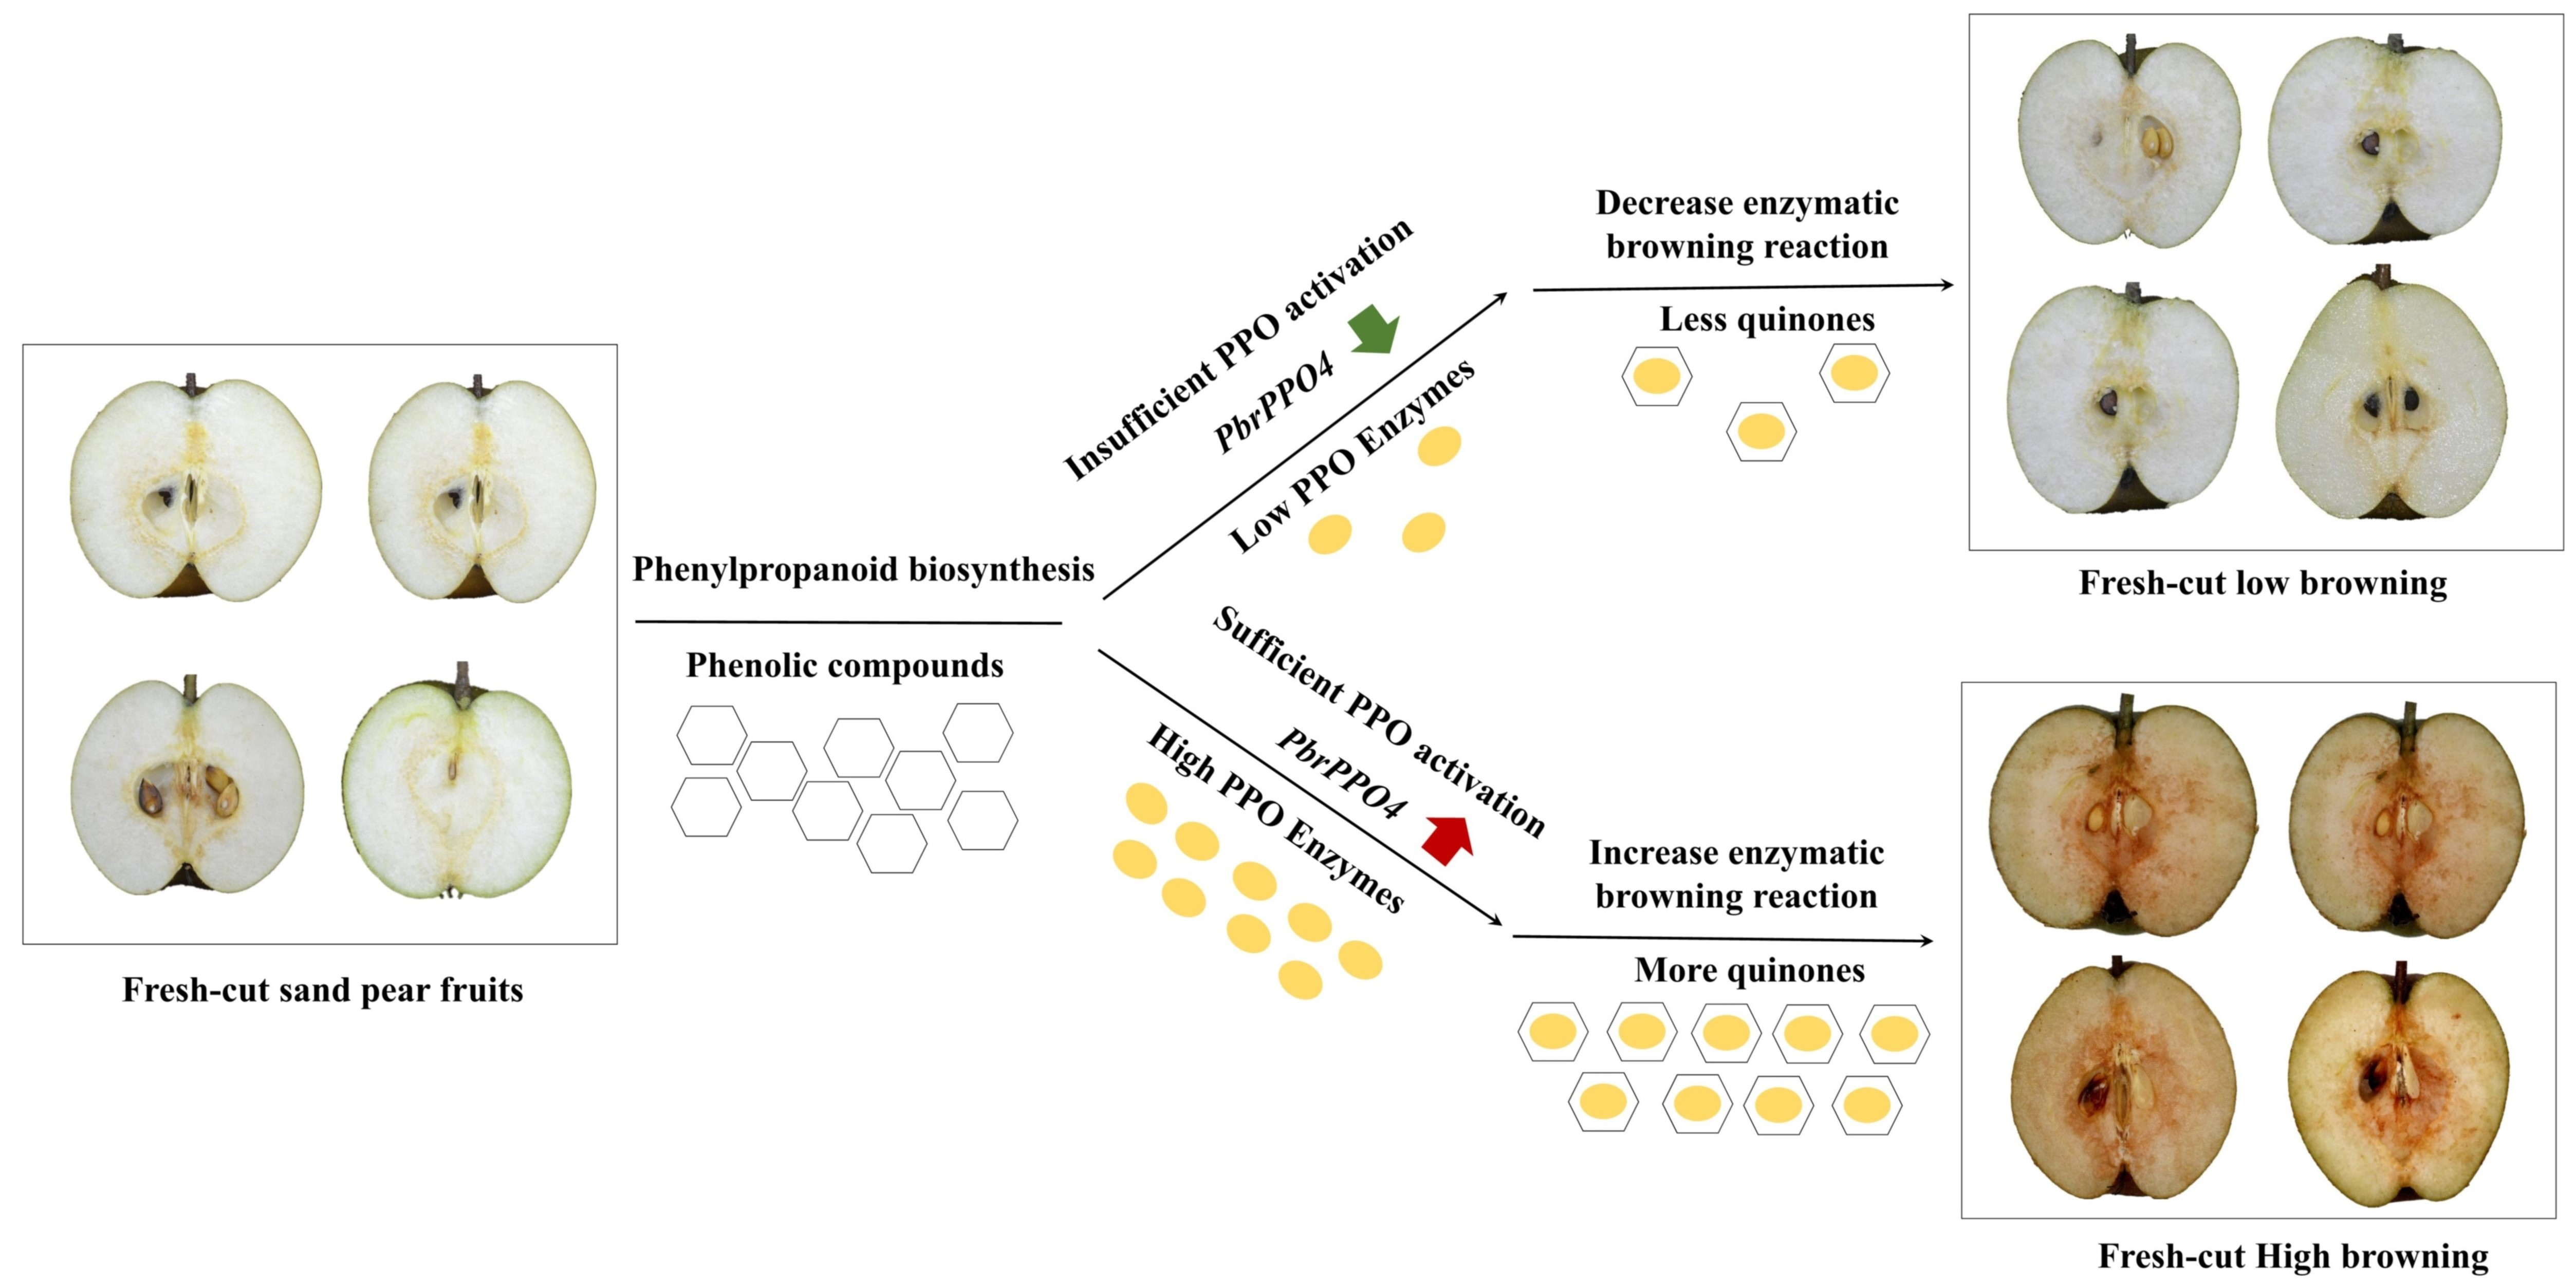
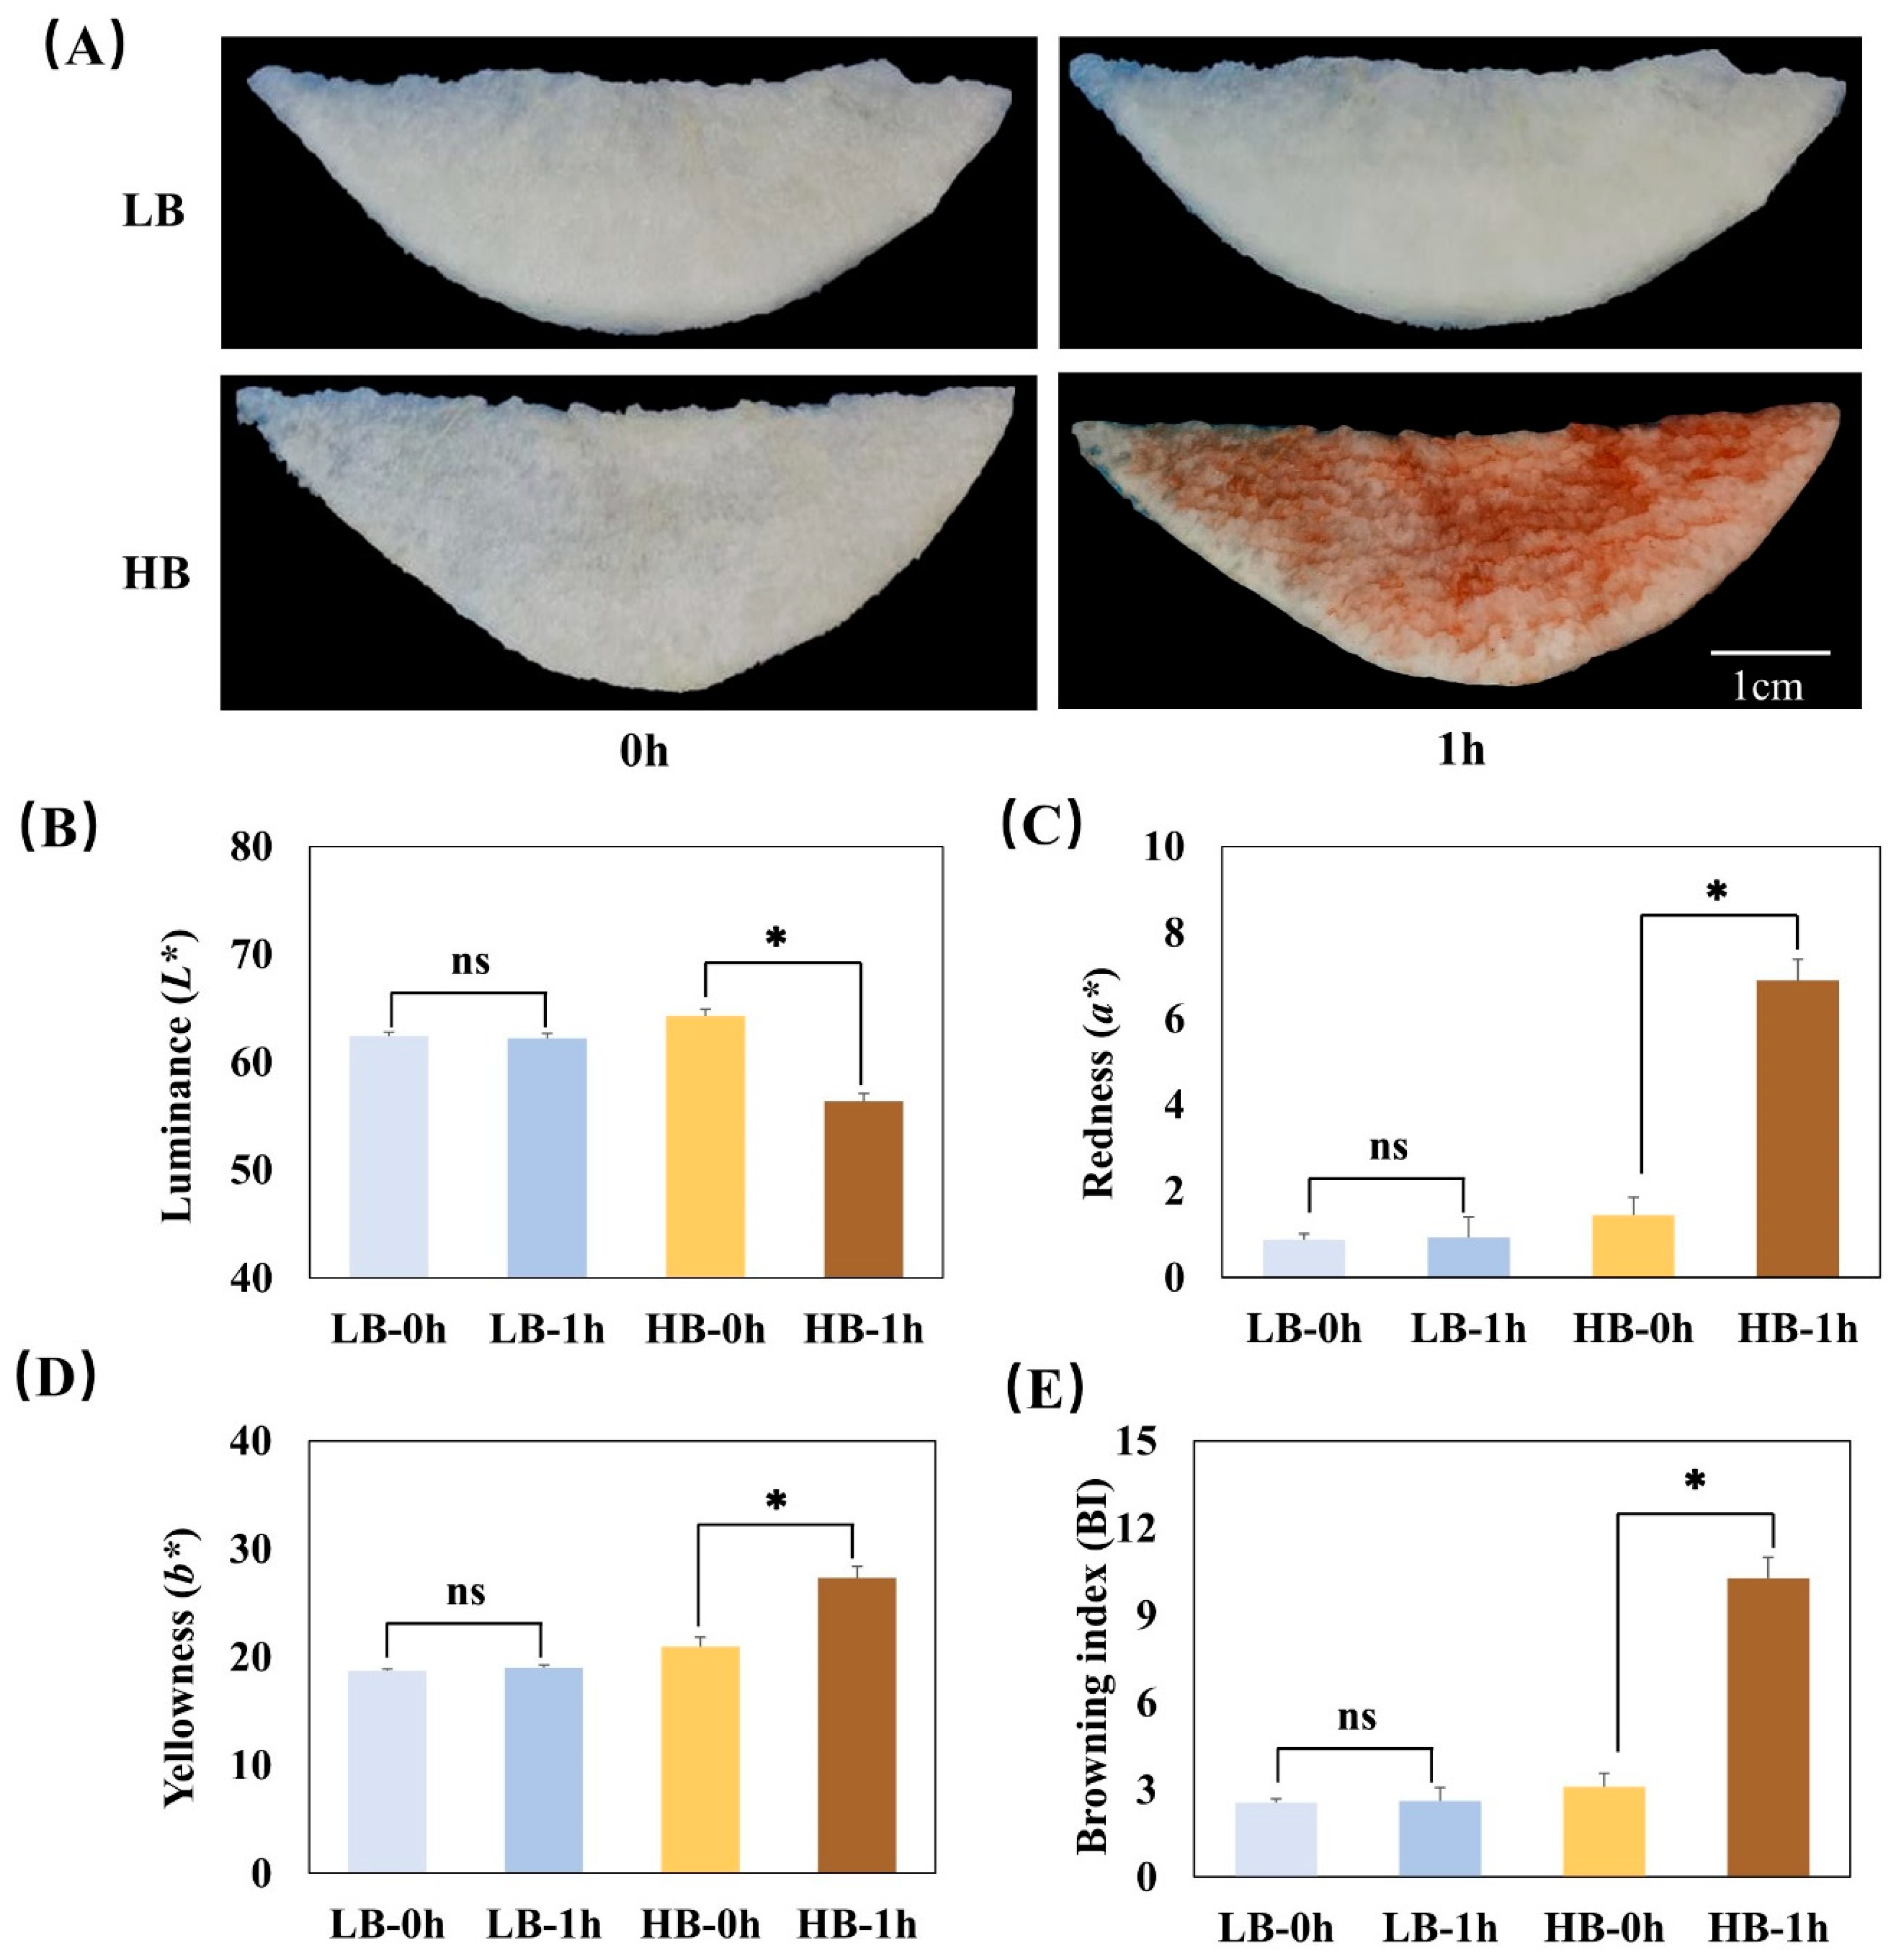
3.1. Flesh Browning Intensity

The flesh from ‘Weiningdahuangli’ (HB) showed a higher browning intensity compared with ‘Eli No.2′ (LB) (Figure 1A). The L* of the HB flesh slices largely decreased more over 1 h than that of the LB slices (Figure 1B); the HB flesh slices had higher red (a*) and yellow (b*) components than the LB slices (Figure 1C,D); and a pronounced increase in BI was distinctive in the HB flesh slices (Figure 1E). To compare the flesh browning variation between two cultivars over time, total color changes (ΔE) were determined. HB flesh slices had a more pronounced total color difference (ΔE = 11.57 ± 1.95) compared with the LB slices (ΔE = 0.69 ± 0.31).

3.2. SMRT- and Illumina RNA-seq

To better understand the potential enzymatic browning mechanism of sand pear fruit, we obtained a representative full-length transcriptome to three libraries with different size fractions (1–2 Kb, 2–3 Kb, and 3–6 Kb) on six SMRT cells using the PacBio sequencing platform (Figure S1). A total of 351,260 reads of insert (ROI) with a mean length of 2702 bp and 175,633 full-length non-chimeric (FLNC) with an average length of 2087 bp were screened (Table S2). In total, 69,122 consensus isoforms were identified with SMRT analysis using ICE (Iterative Clustering for Error Correction) algorithms (Table S3). The 47,797 high-quality isoforms were corrected with the Quiver program in combination with FLNC. We obtained 314 million clean reads of twelve sand pear flesh cDNA libraries with Illumina RNA-seq, and 21,325 low-quality isoforms were rectified using Illumina RNA-seq data (Table S4). A total of 27,610 full-length transcripts were obtained by comparing the consensus isoforms with the reference genome using GMAP. There were 21,336 new transcripts which were found by alternative splicing analysis of full-length transcripts. Using TransDecoder, 20,571 ORFs were identified, of which 16,552 (80.46%) were complete ORFs, and the length of the ORFs is shown in Figure S2. A total of 21,074 new transcripts were blasted to eight public databases, of which 8255 transcripts,12,584 transcripts, 9115 transcripts, 12,346 transcripts, 17,425 transcripts, 14,586 transcripts, 20,562 transcripts, and 17,531 transcripts were annotated in COG, GO, KEGG, KOG, Pfam, SWISS-PROT, eggnog, and NR, respectively (Table S5).

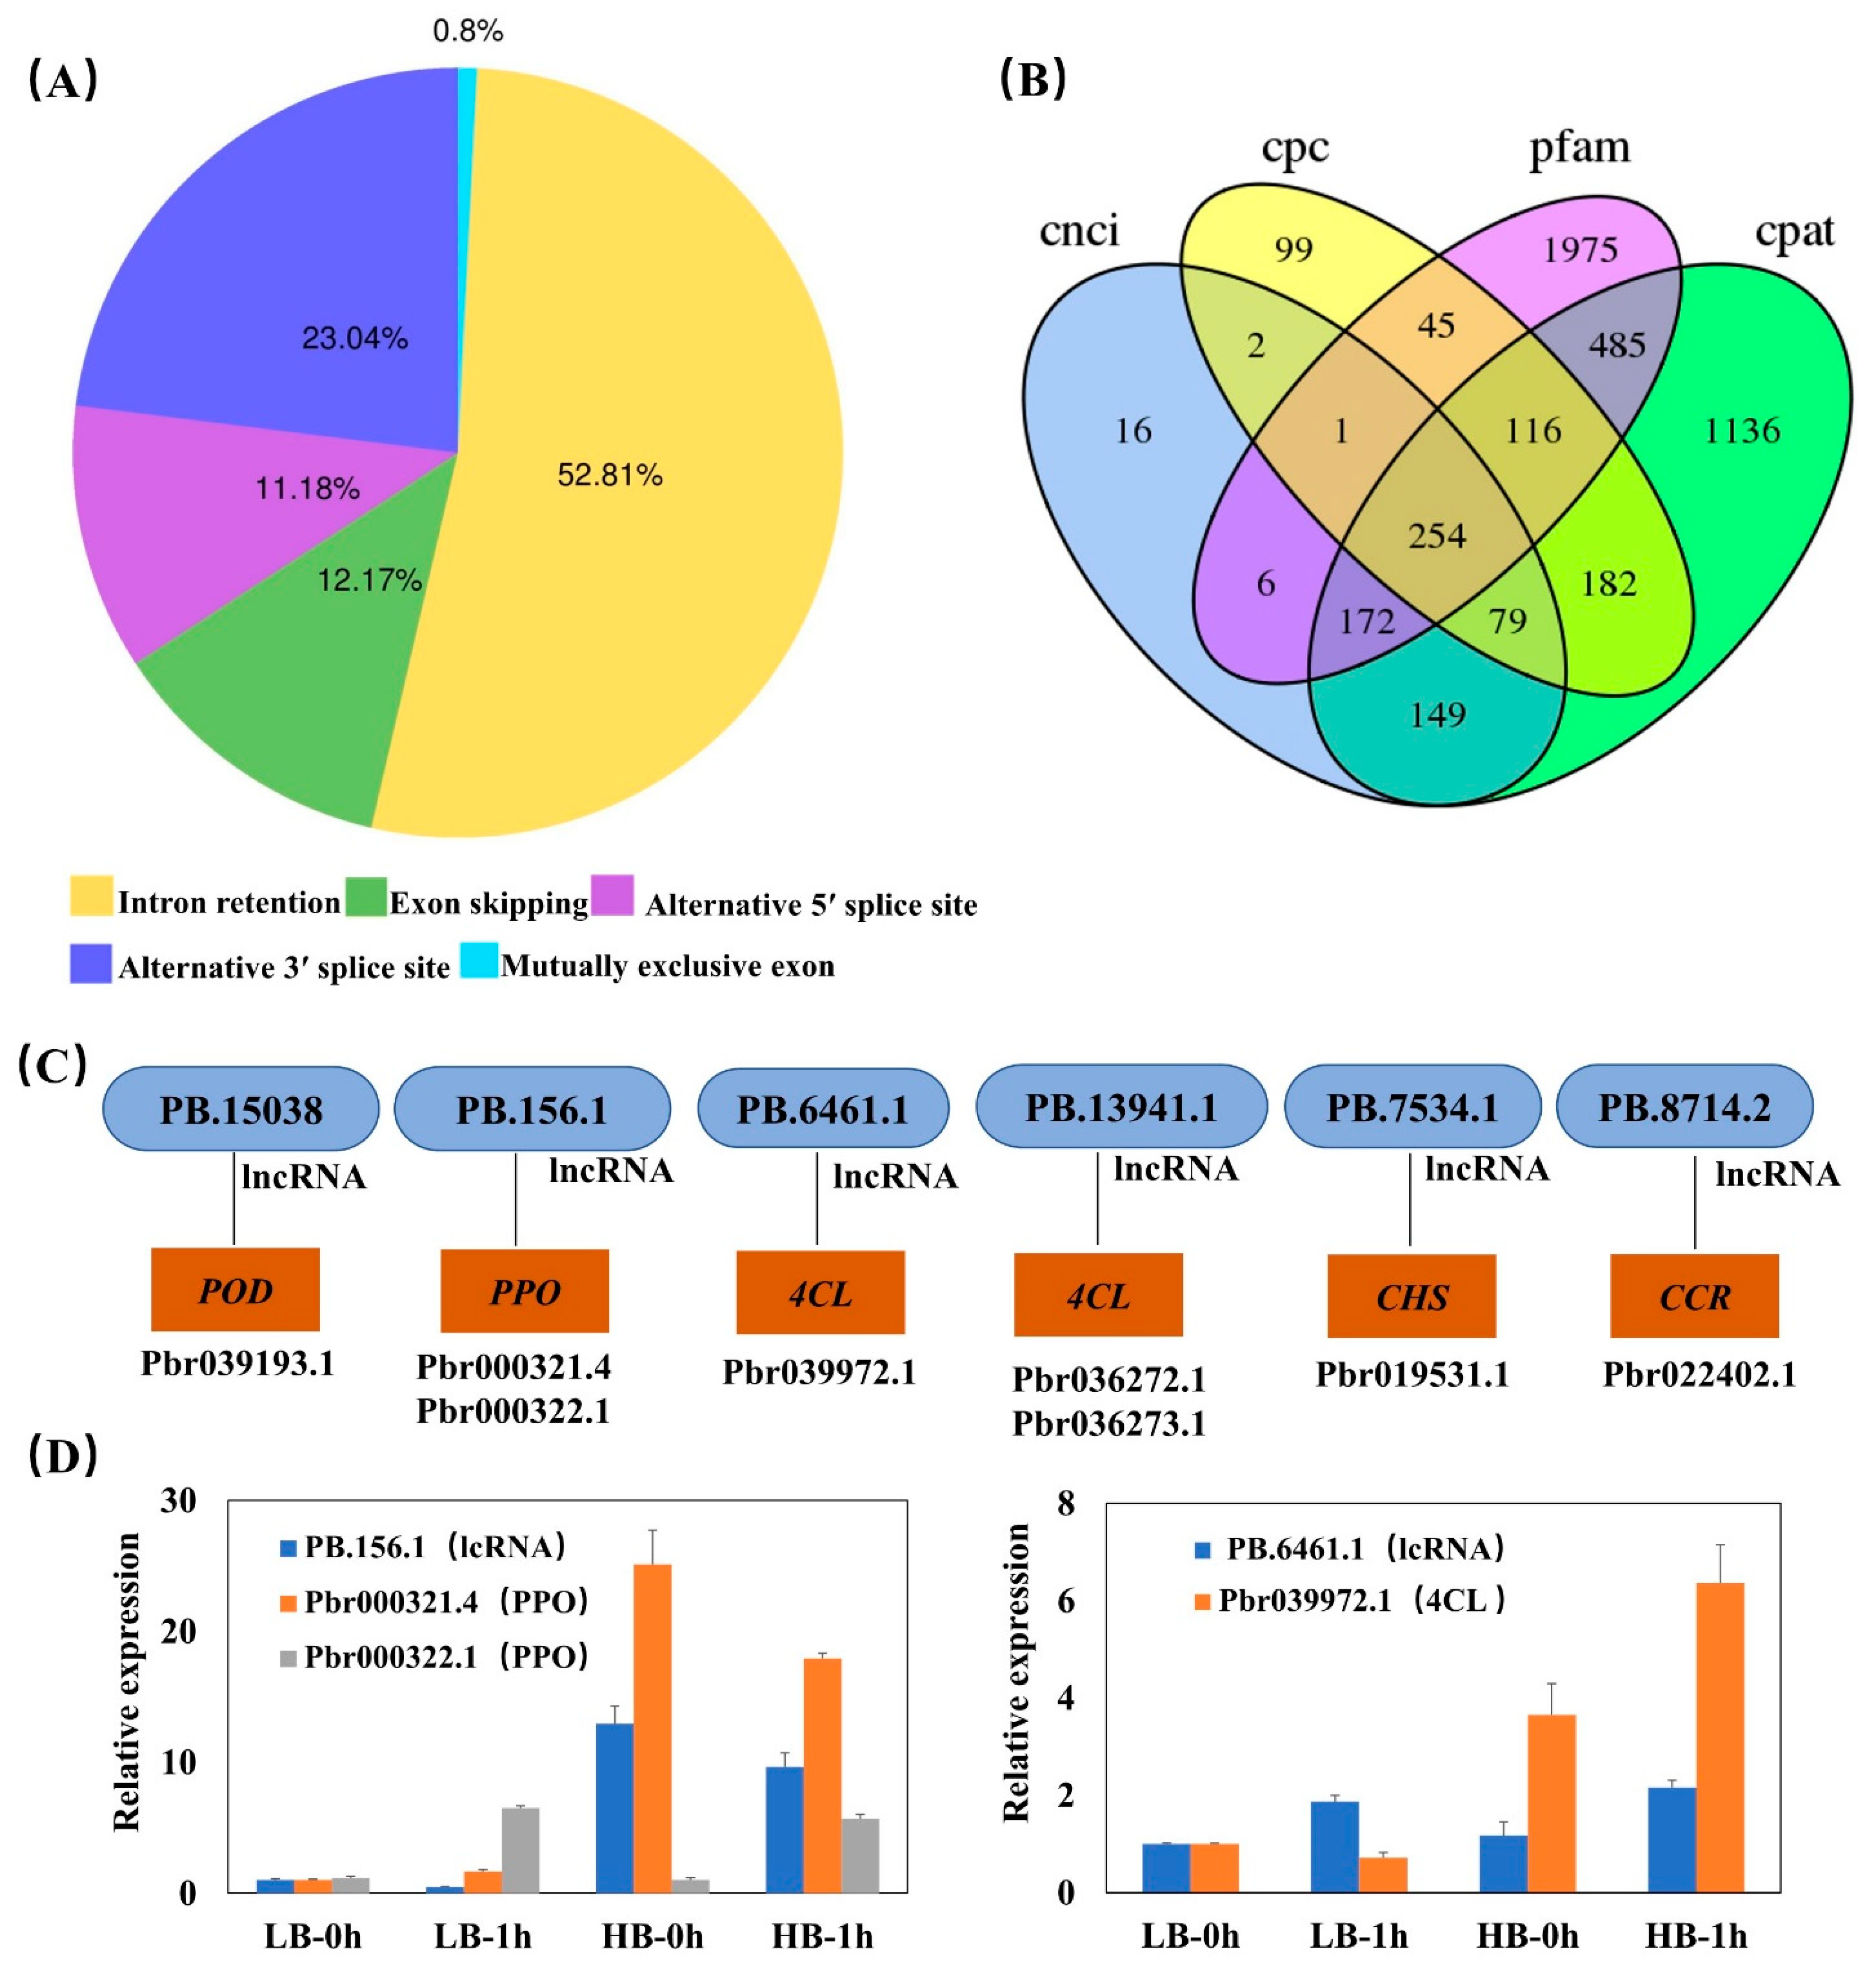
3.3. Identification of AS and lncRNAs

AS plays a significant role in controlling plant processes and gene expression [35]. In this study, 7105 AS events were identified in sand pear fruit, of which intron retention was the most common form (IR, 52.81%), followed by alternative 3′ splice site (A3SS, 23.04%), exon skipping (ES, 12.17%), alternative 5′ splice site (A5SS, 11.18%), and mutually exclusive exon (MXE, 0.8%) (Figure 2A). For example, we discovered that PbrAroD (3-dehydroquinate dehydratase)/SkDH (shikimate dehydrogenase), which was located upstream of phenylpropanoid biosynthesis, had two types of AS events with IR and A3SS to form 12 isomers.
LncRNAs are implicated in the regulation of a diversity of plant developmental processes such as flowering time, reproductive growth, fruit ripening, and abiotic stresses [36,37]. A total of 254 lncRNAs were found from sand pear fruit among all the CPC, CNCI, CPAT and Pfam datasets (Figure 2B). Of these lncRNAs, 153 lincRNAs, 30 antisense-lncRNAs, 9 intronic-lncRNAs, and 48 sense-lncRNAs were identified.
LncRNA is often used as a signal molecule to regulate the expression of adjacent target genes. The target genes of lncRNA were predicted based on the lncRNA cis target and sequence complementarity. We concentrated on the target genes of lncRNAs involved in enzymatic browning. Five genes related to enzymatic browning were predicted to be targets of six lncRNAs (Figure 2C). These genes included POD (Pbr039193.1 target of lncRNA PB.15038), PPO (Pbr000321.4 and Pbr000322.1 target of lncRNA PB.156.1), 4CL (Pbr039972.1 target of lncRNA PB.6461.1, and Pbr036272.1, Pbr036273.1 target of lncRNA PB.13941.1), CHS (Pbr019531.1 target of lncRNA PB.7534.1), and cinnamoyl-CoA reductase (CCR, Pbr022402.1 target of lncRNA PB.8714.2). The expression level of these lncRNAs and target genes were determined by qRT-PCR. We found that the expression trend of lncRNA PB.156.1 was consistent with one target gene, PPO (Pbr000321.4), and lncRNA PB.6461.1 expression exhibited a consistent trend to the target gene 4CL (Pbr039972.1) (Figure 2D). A significant positive correlation was observed between the expression of lncRNA PB.156.1 and PPO gene Pbr000321.4 (r = 0.998, p < 0.05). These results imply a potentially important role of lncRNAs for regulating target gene expression during sand pear flesh browning.

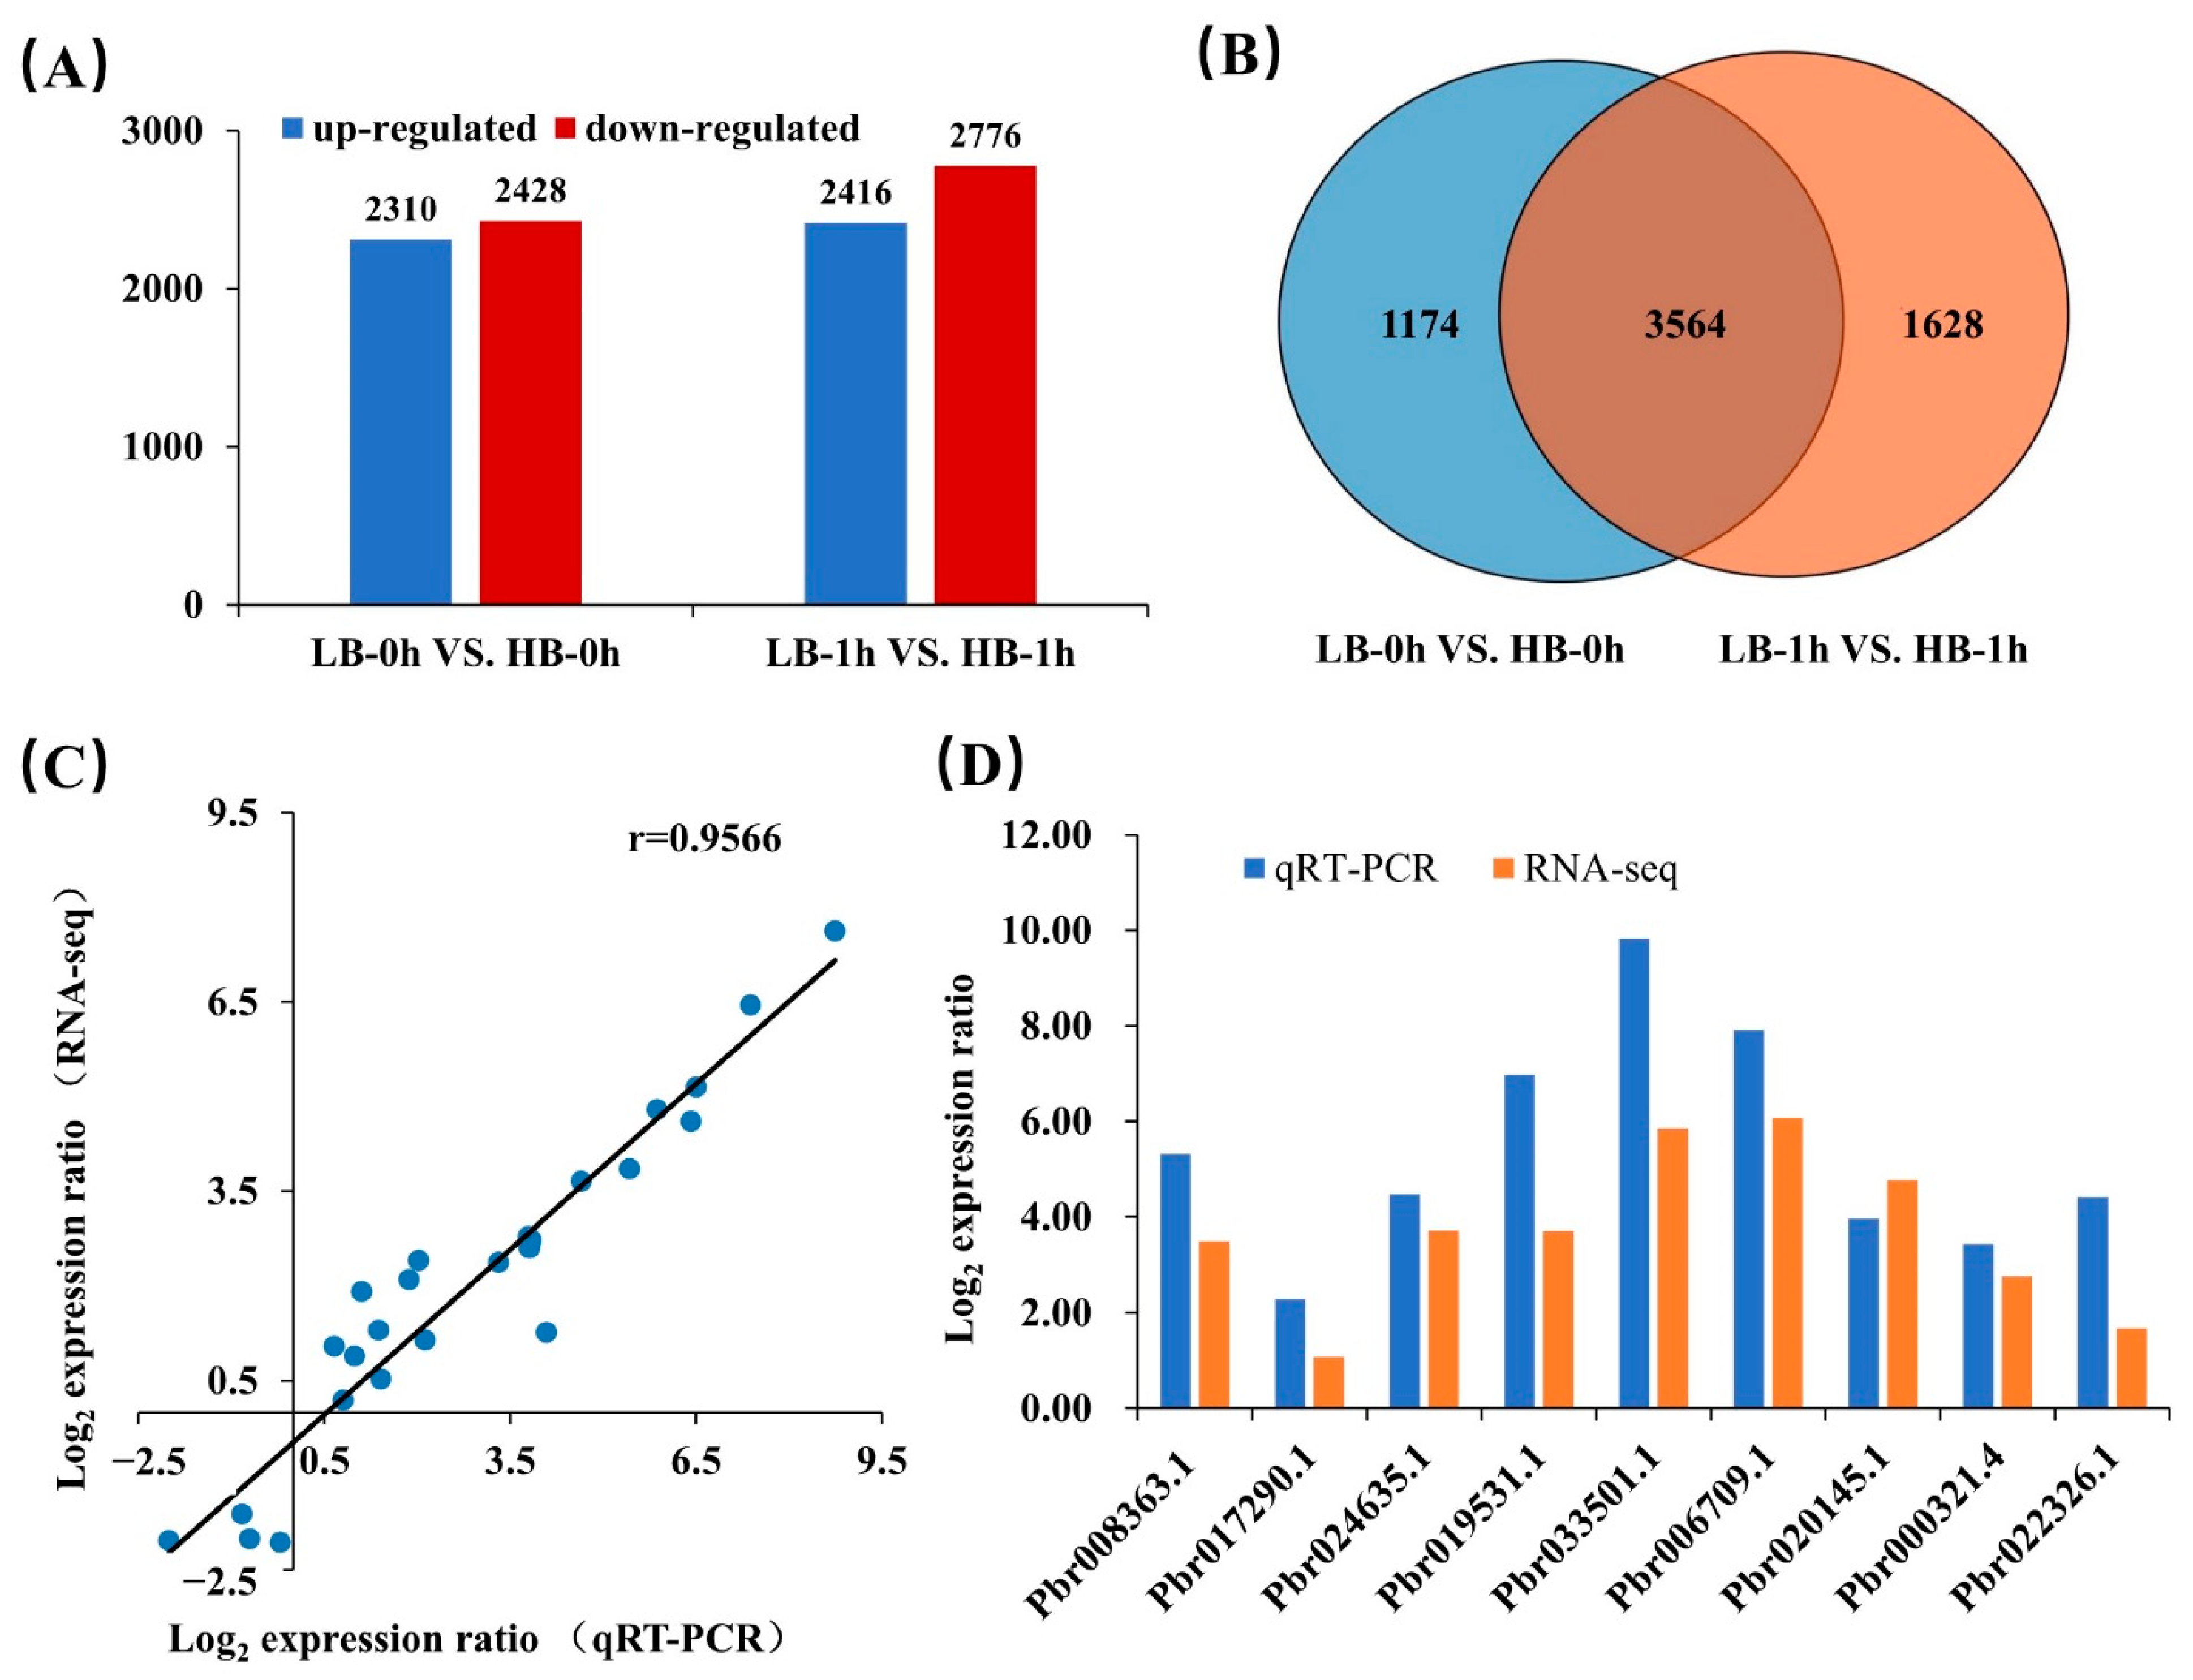
3.4. Analysis of DEGs and qRT-PCR Confirmation

Transcriptome profiling identified 9930 DEGs in sand pear flesh through comparison between two cultivars at 0 h and 1 h. Among the DEGs, 4738 and 5192 DEGs were found between LB-0h vs. HB-0h, and LB-1h vs. HB-1h, respectively (Figure 3A). Twenty-six DEGs were chosen for the qRT-PCR analysis to proof the RNA-seq data; the results showed a significant correlation (r = 0.9566, p < 0.05) and a consistent expression trend between qRT-PCR and RNA-seq (Figure 3C). A total of 3564 DEGs were expressed in two cultivars at 0 h and 1 h (Figure 3B), of which nine candidate genes related to phenylpropanoid and flavonoid biosynthesis were up-regulated in HB compared to LB at 1 h (Figure 3D). For instance, five DEGs (Pbr008363.1, Pbr017290.1, Pbr024635.1, Pbr006709.1, and Pbr022326.1) related to phenylpropanoid biosynthesis were found to encode PAL, C4H, 4CL, shikimate O-hydroxycinnamoyl transferase (HCT), and POD, respectively.

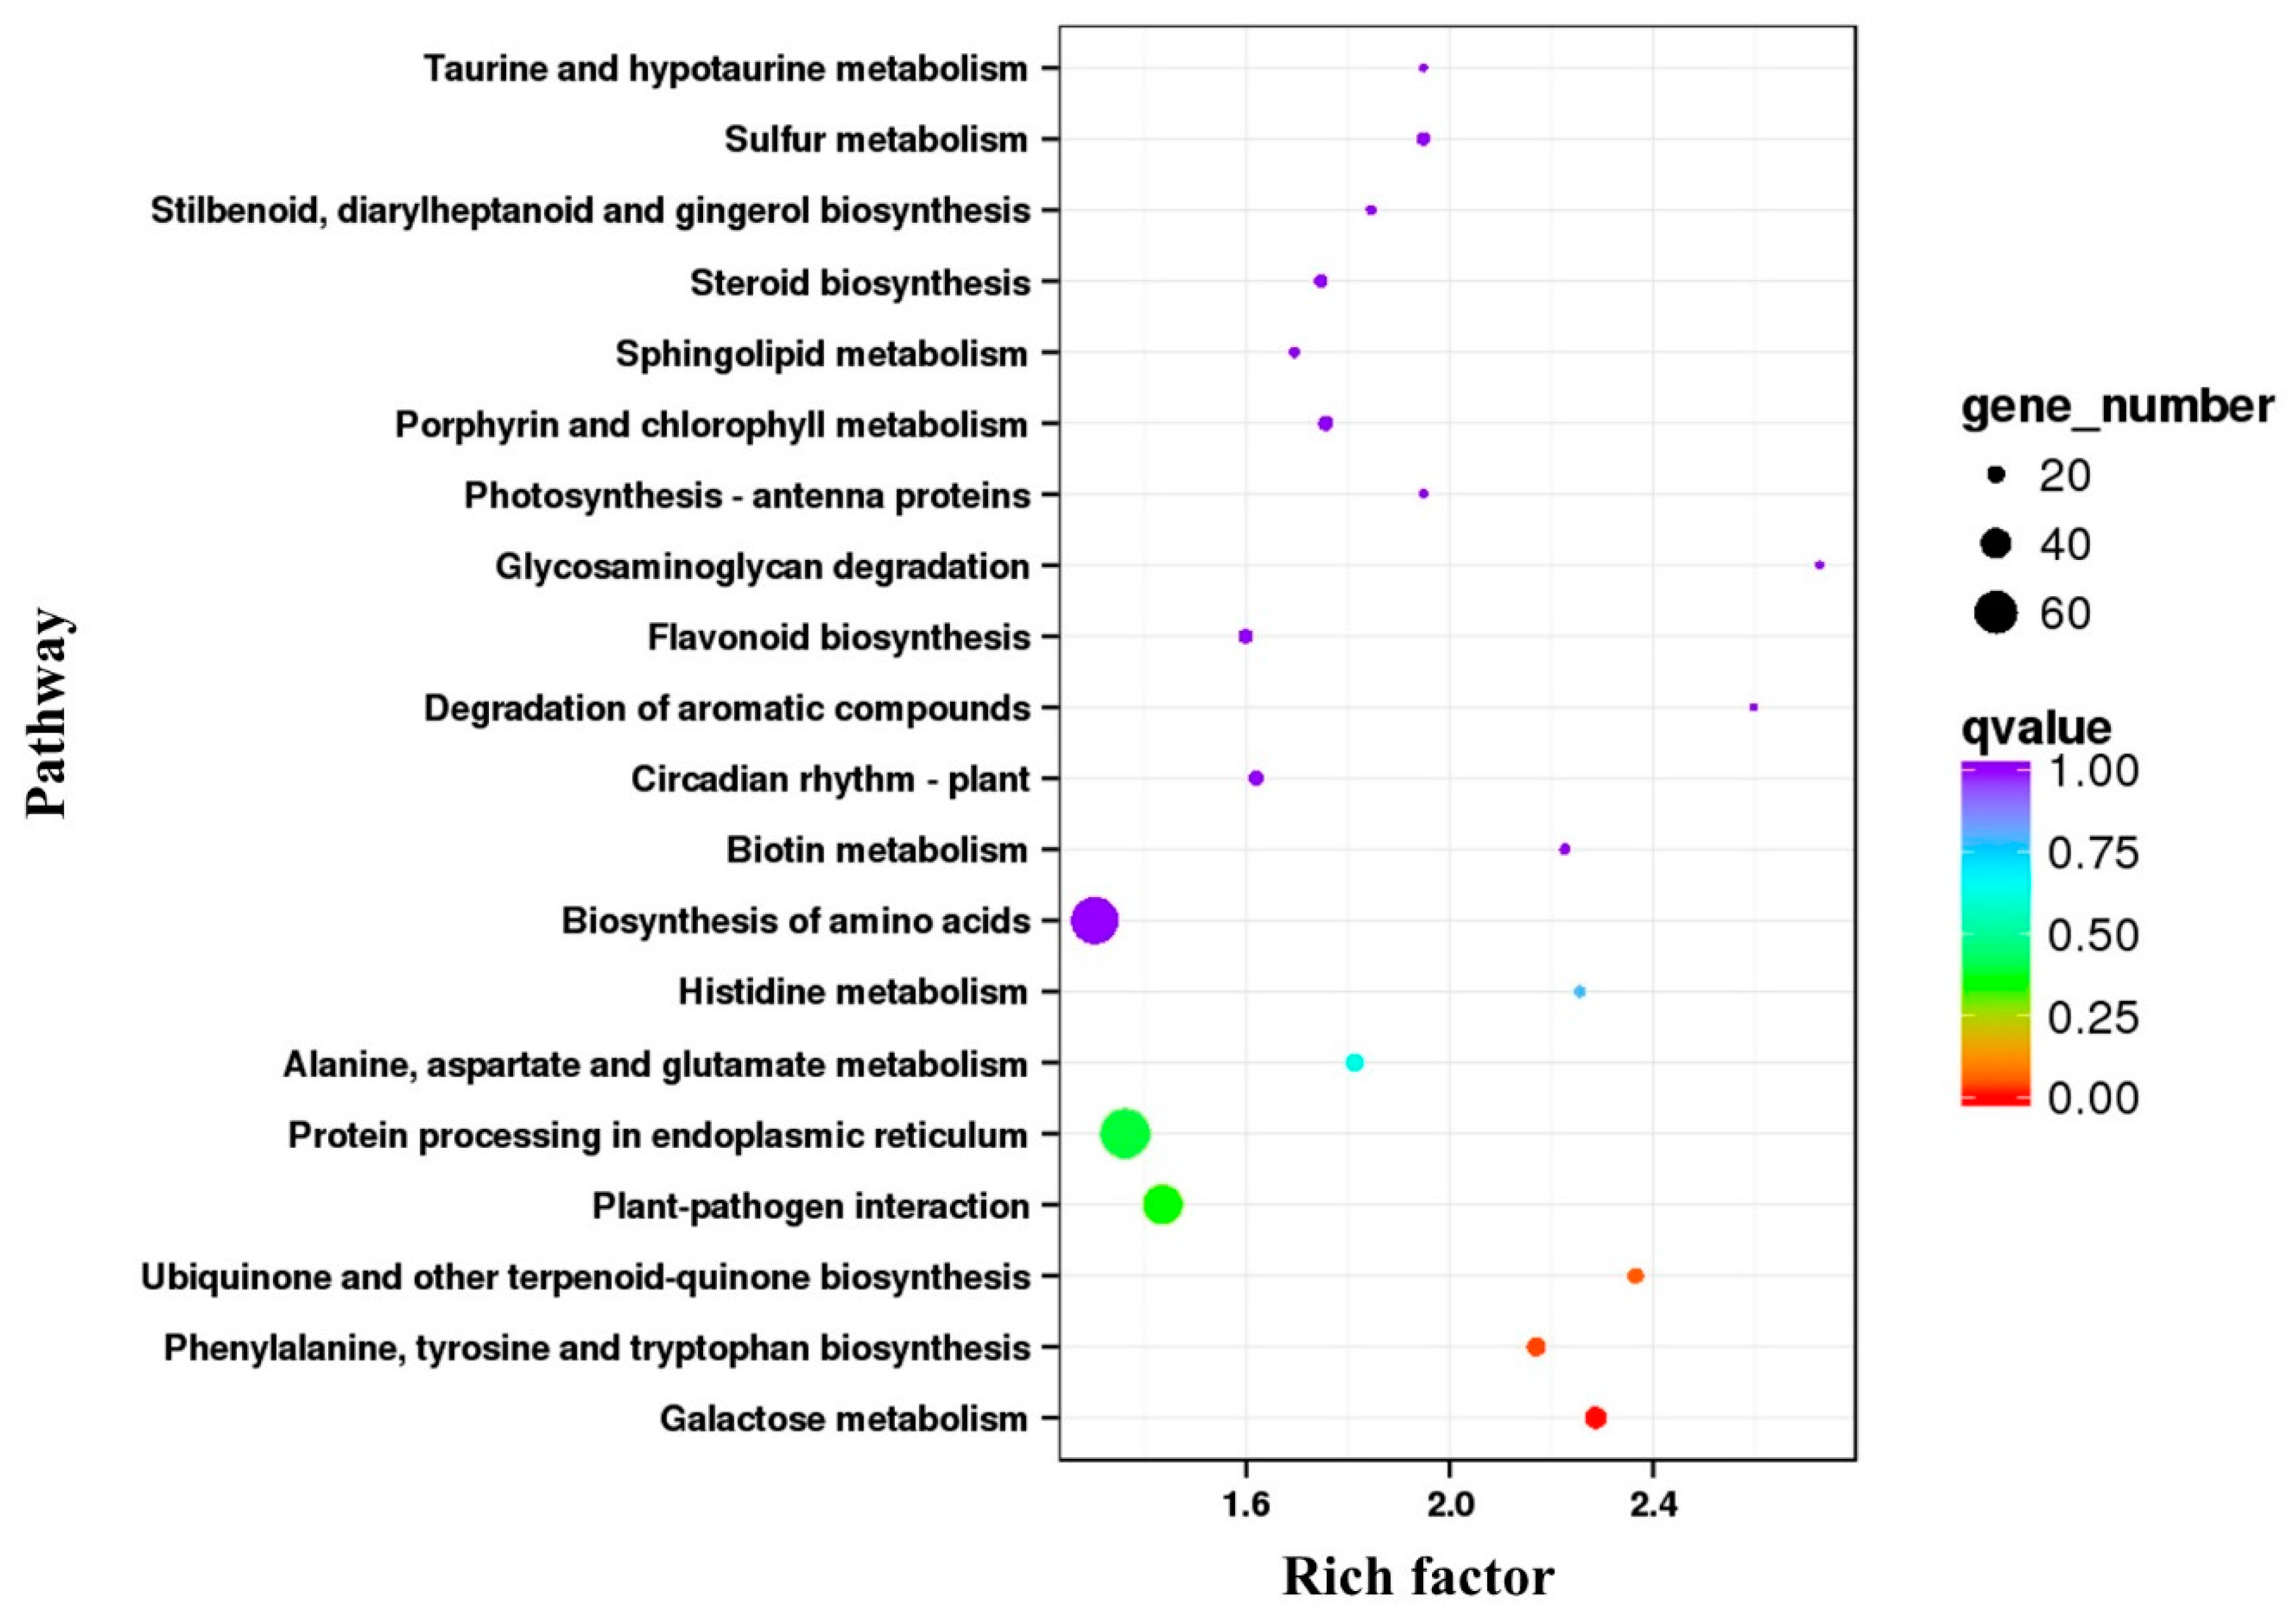
3.5. Annotation and Enrichment Analysis of DEGs

In order to understand the function of the DEGs and identify the enzymatic browning related genes in sand pear flesh, all DEGs from the LB and HB cultivar RNA-seq data were annotated in the COG, eggNOG, NR, Pfam, SWISS-PROT, GO, and KEGG databases. In total, 4738 and 5192 DEGs in both cultivars at 0 h and 1 h were successfully annotated using the above mentioned seven databases (Table S6).
According to the GO annotation, 2614 and 2845 DEGs at 0 h and 1 h were assigned to the three main GO functional categories (Figure S3). These DEGs in the biological classification were mainly involved in the metabolic process, the cellular process, and the single-organism process at both time points. For the cellular components, cell part, cell, and organelle accounted for the majority. In molecular function, the dominant terms were catalytic activity, binding, and transporter activity. To evaluate the metabolic differences between the two cultivars, the biological pathways were analyzed using the KEGG database. Pathway enrichment of DEGs is used to analyze whether there is over-presentation on a particular pathway. The pathway enrichment analysis based on the KEGG database showed that the top three significantly enriched pathways were phenylalanine, tyrosine, and tryptophan biosynthesis (ko00400); protein processing in the endoplasmic reticulum (ko04141) and galactose metabolism (ko00052) in the LB vs. HB cultivars at 0 h (Table S7), and galactose metabolism (ko00052), phenylalanine, tyrosine, and tryptophan biosynthesis (ko00400) and ubiquinone and other terpenoid-quinone biosynthesis (ko00130) were significantly enriched in the LB vs. HB cultivars at 1 h (Figure 4, Table S7).

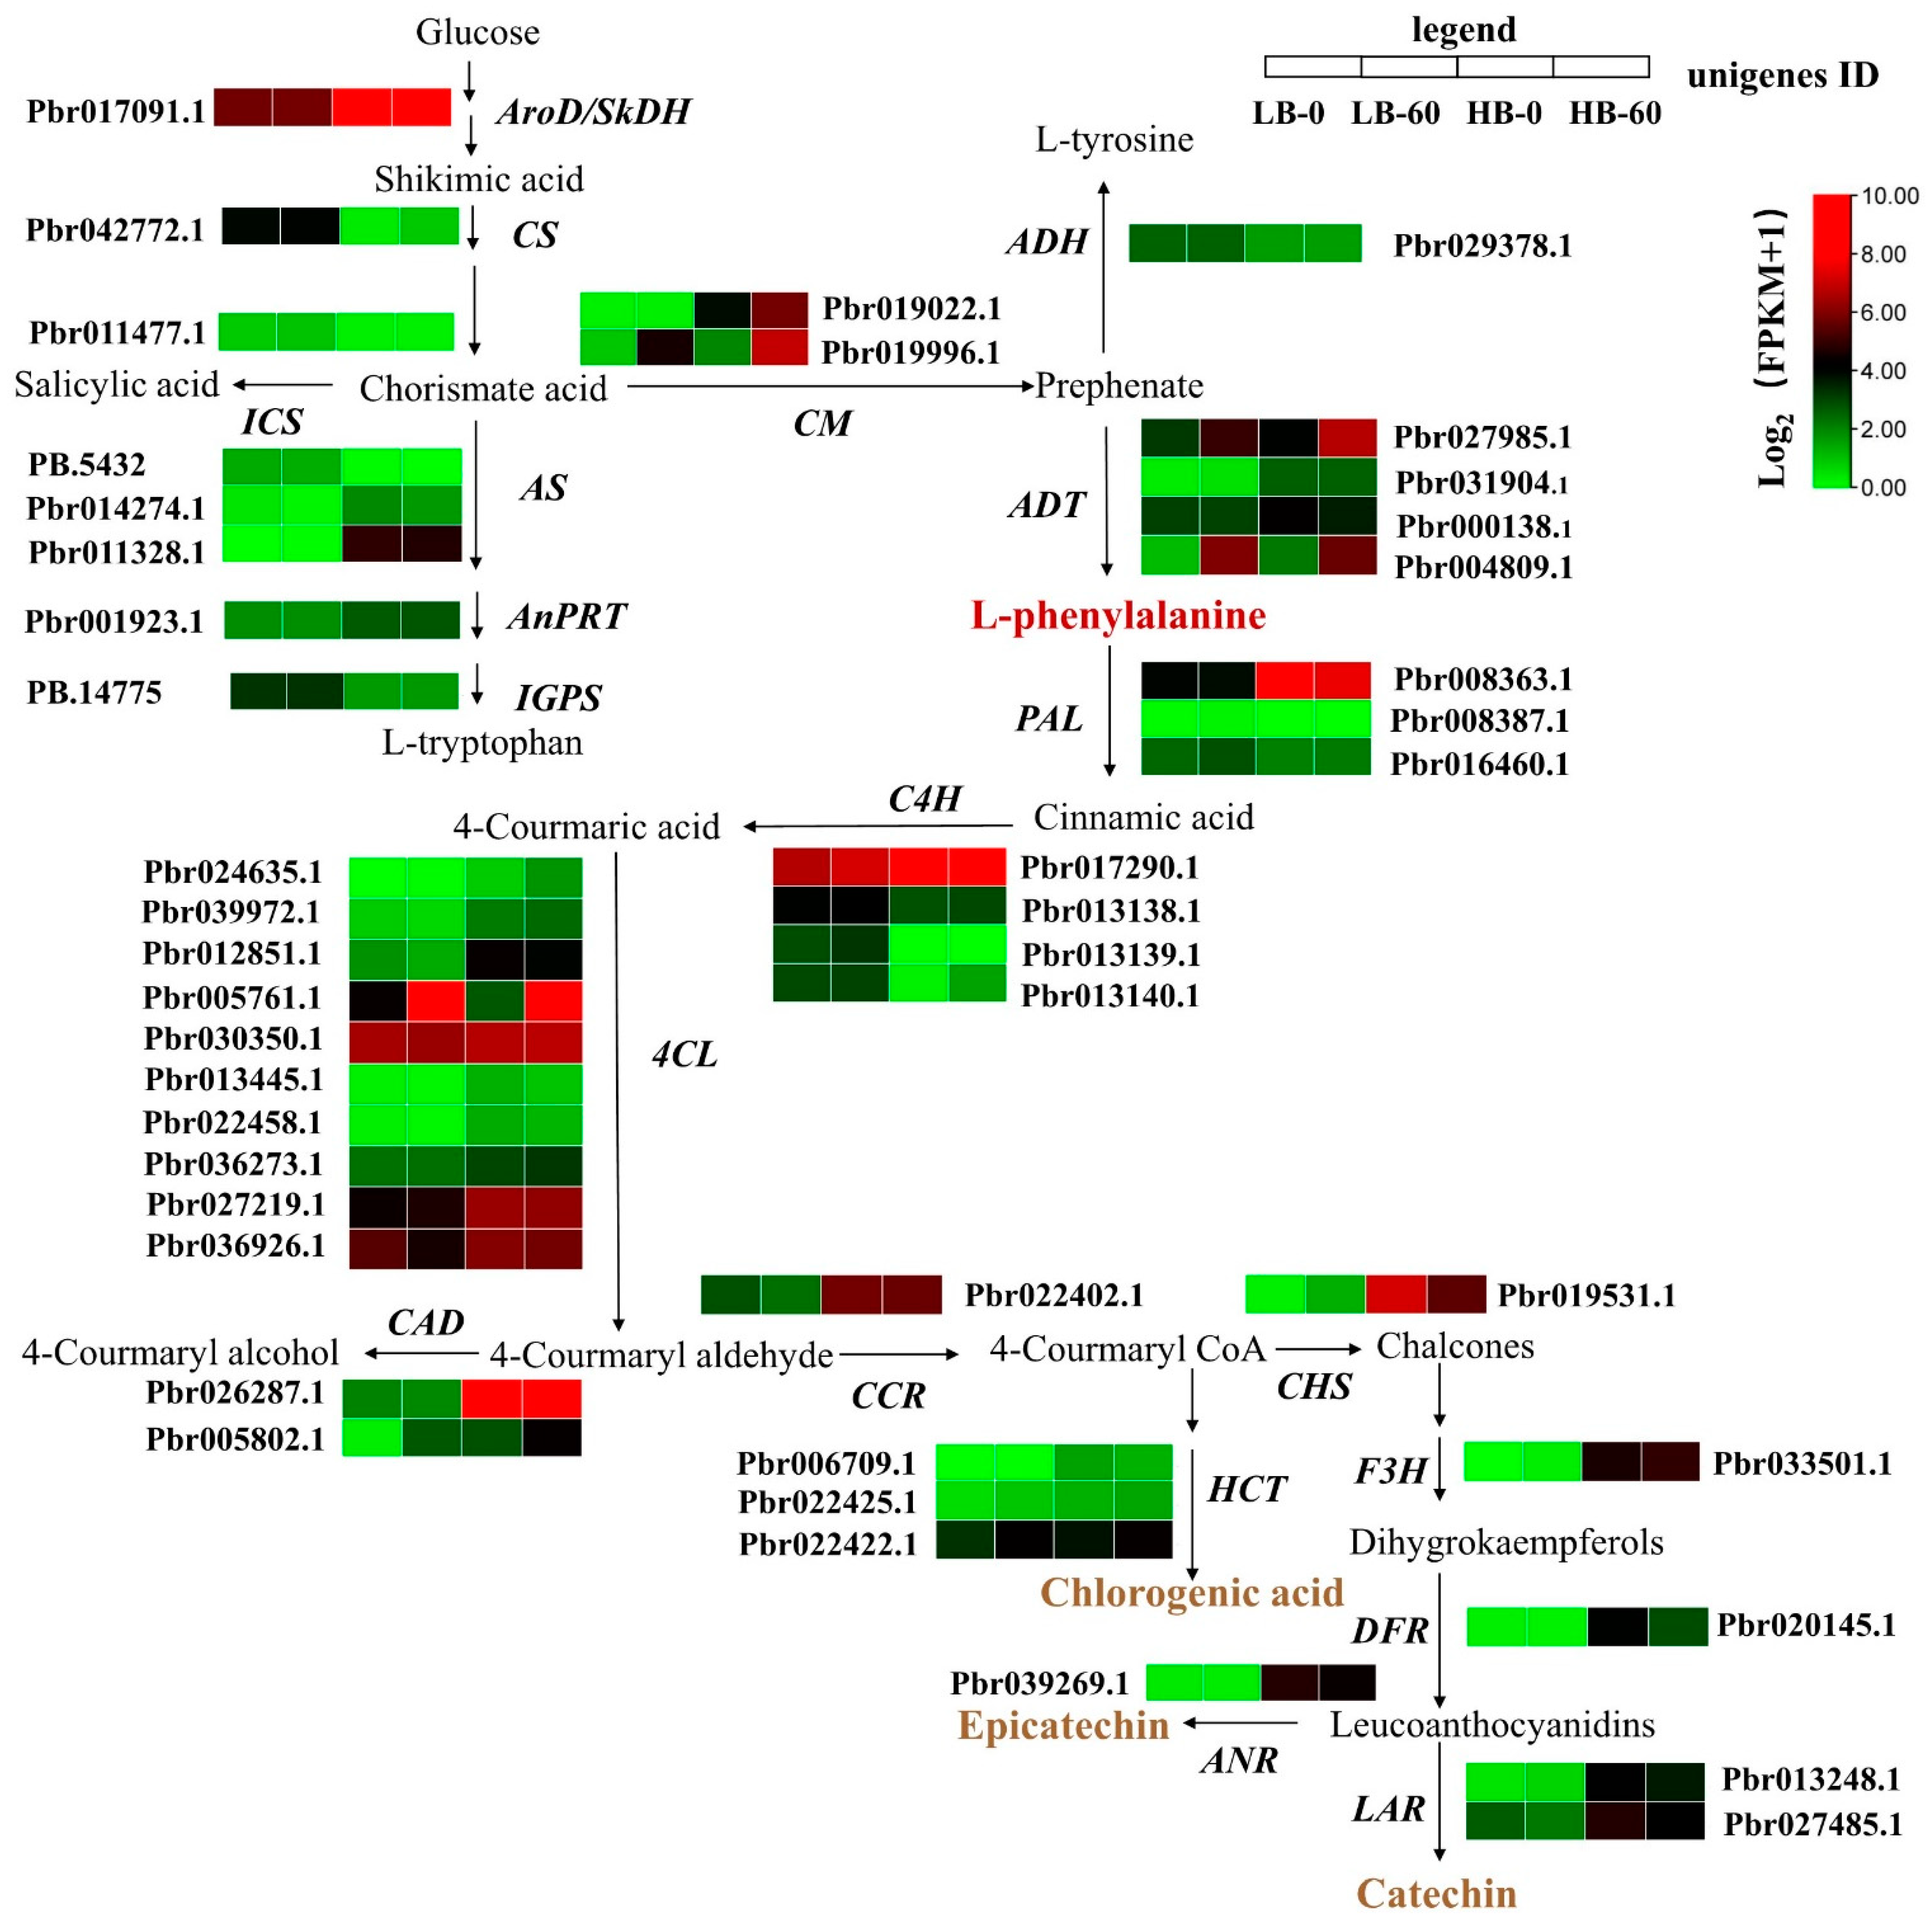
3.6. Phenylpropanoid and Flavonoid Biosynthesis Related Gene Dynamics and Polyphenol Quantification

The gene expression in the RNA-seq data was normalized to FPKM (fragments per kilobase of exon model per million mapped reads) in different browning sand pear fruits flesh, and the expression levels of these metabolic pathway-related genes were calculated using FPKM value.
In the shikimate pathway, the results indicated that most of the phenylalanine biosynthesis-related genes, one Arod/SkdH gene (Pbr017091.1), two chorismate mutase (CM) genes (Pbr019022.1 and Pbr019996.1), and four arogenate dehydratase (ADT) genes, were up-regulated during flesh browning in the HB cultivar compared to the LB cultivar (Figure 5). In the branch of the shikimate pathway, isochorismate synthase (ICS) was involved in salicylic acid biosynthesis, and most DEGs from shikimic acid to salicylic acid, tryptophan, and tyrosine were down-regulated in the HB cultivar compared to the LB cultivar (Figure 5). In the phenylpropanoid pathway, one PAL (Pbr008363.1) gene, three 4CL (Pbr012851.1, Pbr027219.1, and Pbr036926.1) genes, two cinnamyl alcohol dehydrogenase (CAD) genes (Pbr026287.1 and Pbr005802.1), one cinnamoyl-CoA reductase (CCR) gene (Pbr022402.1), one chalcone synthase (CHS) gene (Pbr019531.1), one flavanone 3-hydroxylase (F3H) gene (Pbr033501.1), one dihydroflavonol 4-reductase (DFR) gene (Pbr020145.1), one anthocyanidin reductase (ANR) gene (Pbr039269.1), and two leucoanthocyanidin reductase (LAR) genes (Pbr013248.1 and Pbr027485.1) were significantly up-regulated during flesh browning in the HB cultivar compared to the LB cultivar (Figure 5). Except for these DEGs, phenylpropanoid biosynthesis-related genes such as C4H and HCT were unremarkably up-regulated in the HB cultivar compared to the LB cultivar.
To understand the dynamic changes in phenolics metabolism during fruit browning, we examined total and monomeric polyphenol contents. The total polyphenol content in the HB flesh was higher than that of the LB flesh before browning (at 0 h), and the content of total phenol and monomer phenol of the HB cultivar decreased more than that of the LB cultivar in sand pear flesh during browning (Table 1).

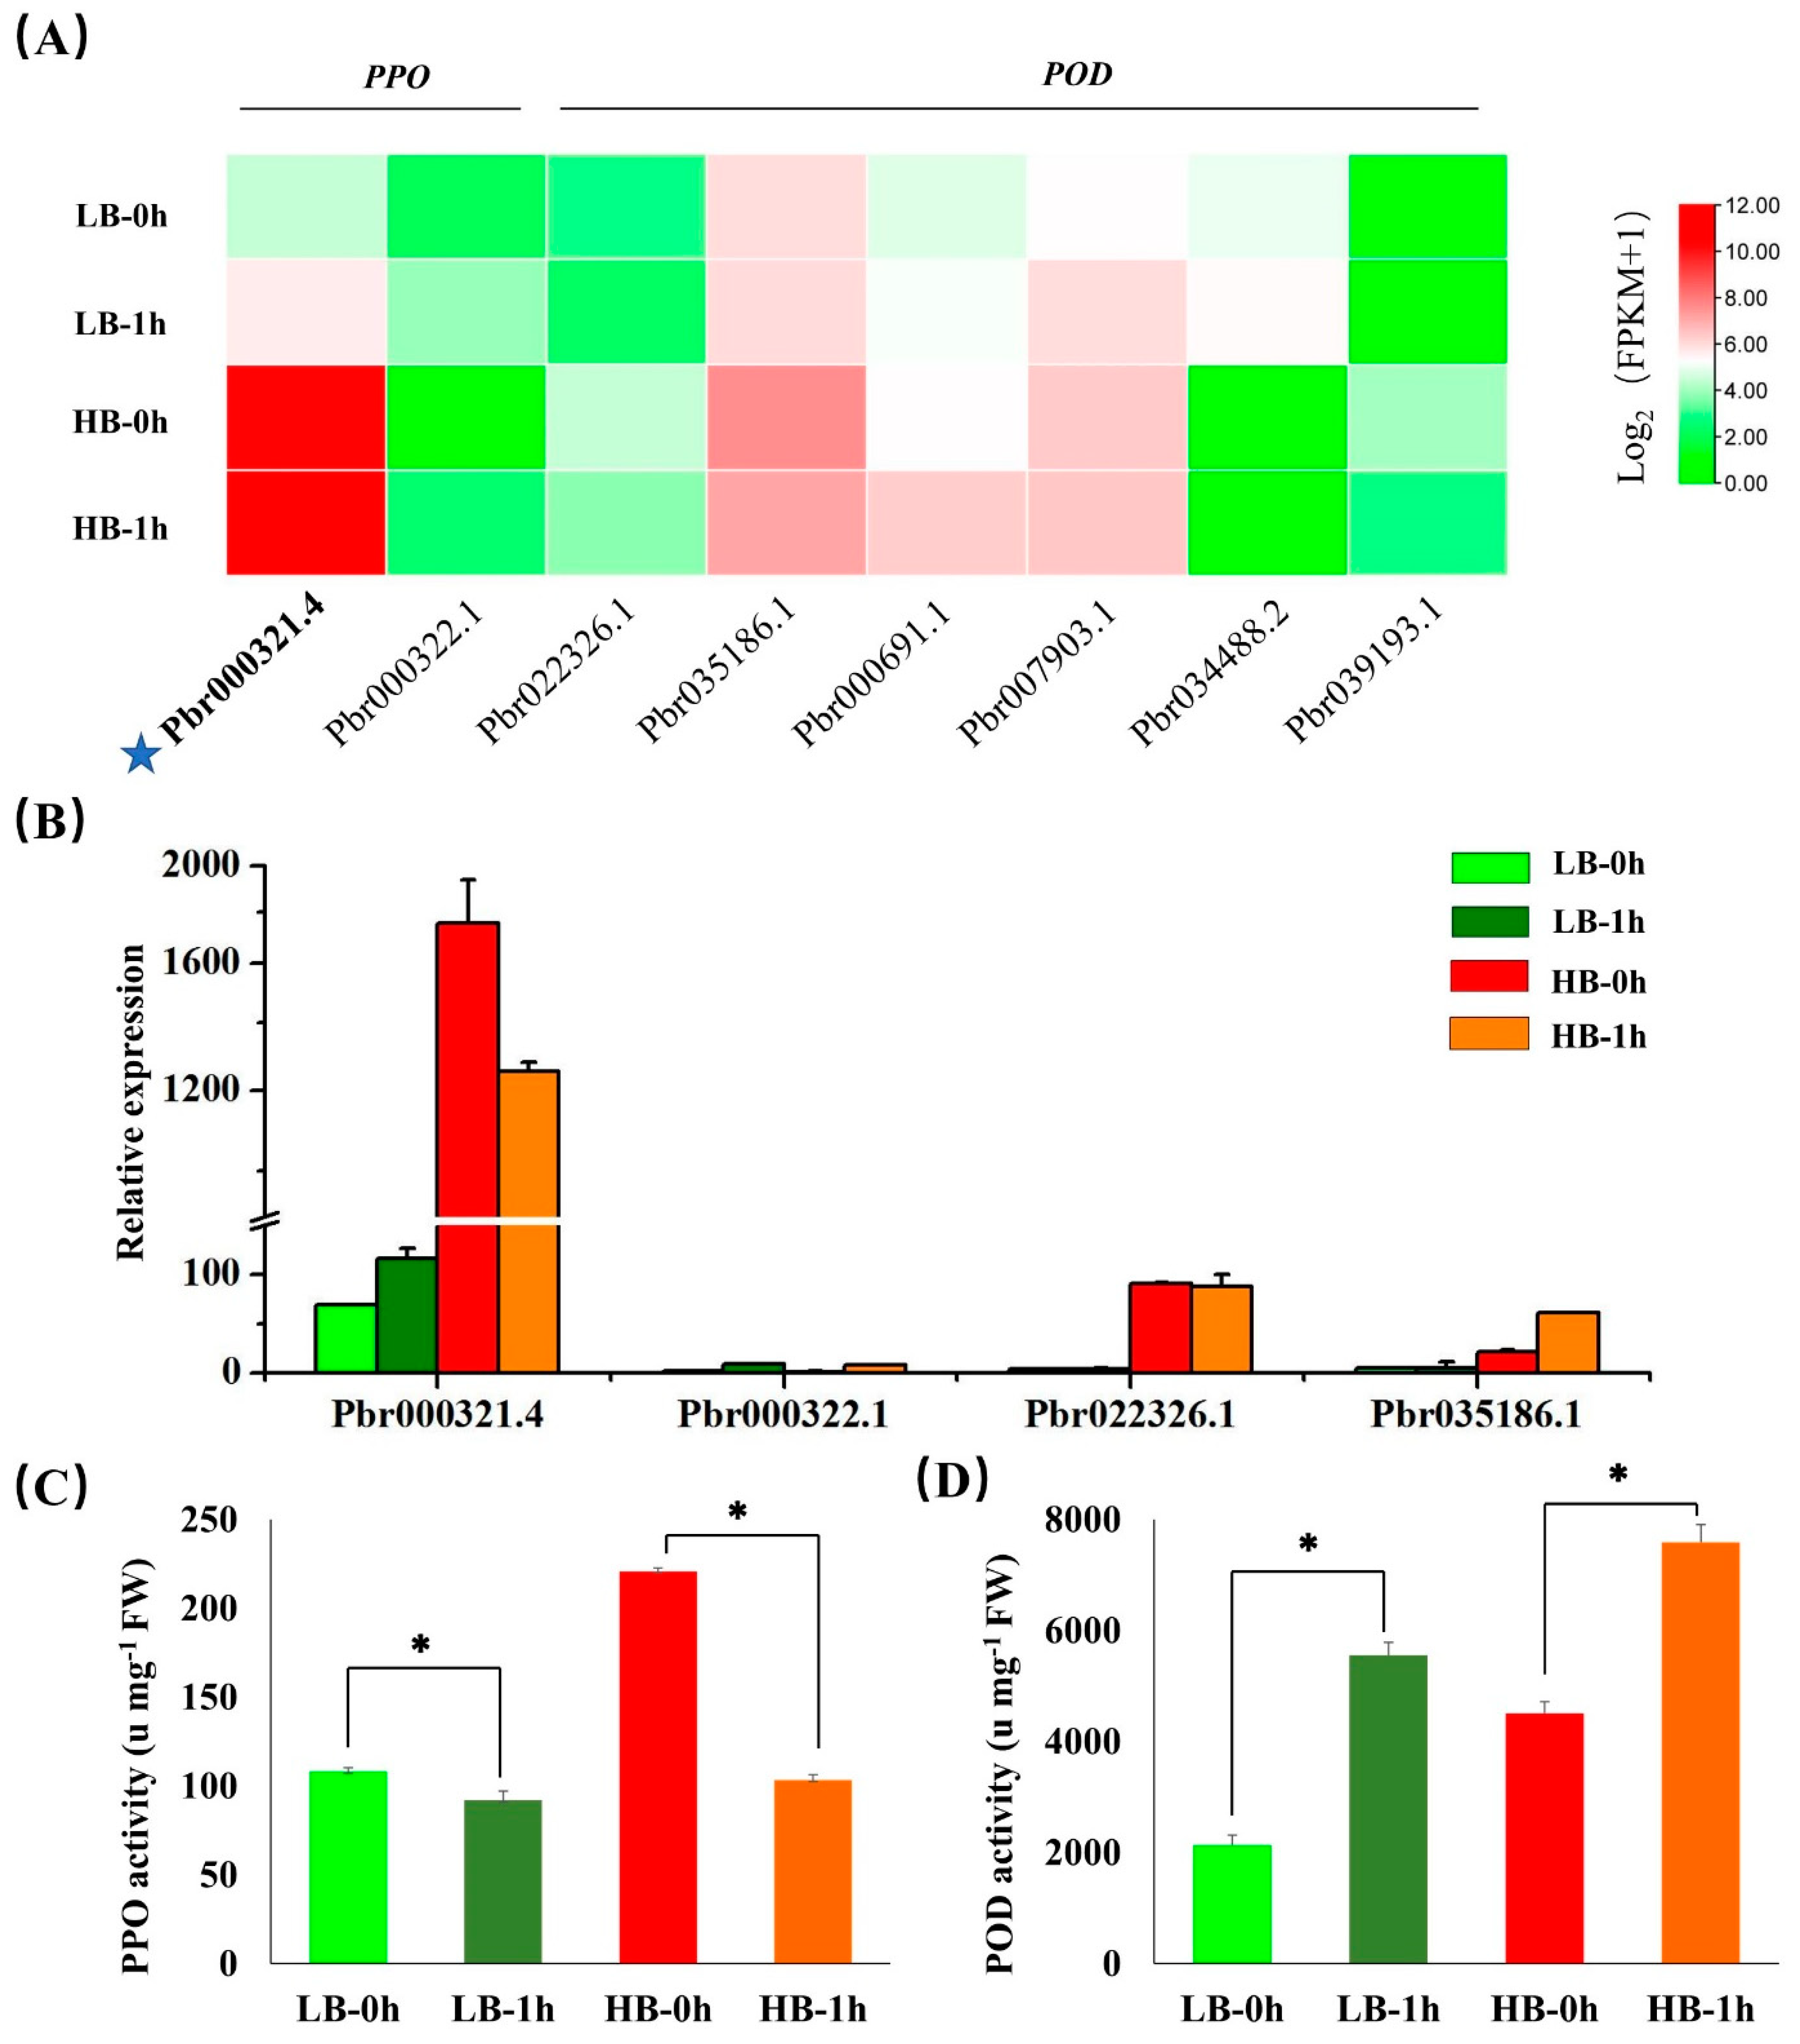
3.7. PPO and POD Gene Expression and Enzyme Activities

There were two PPO genes and six POD genes that were identified as DEGs, except for one POD gene, in which PPO and POD genes were up-regulated in the HB cultivar. In particular, the expression of one PPO gene (Pbr000321.4), which was annotated as PbrPPO4, was significantly higher than that of the other PPO and POD genes in the HB cultivar at 0 h and 1 h (Figure 6A). Several PPO and POD genes were subsequently verified by qRT-PCR; this result also suggested that the relative expression of PbrPPO4 (Pbr000321.4) in the HB cultivar was ~25-fold higher than that in the LB cultivar at 0 h and ~1200-fold higher than another PPO gene (Pbr000322.1) in the HB cultivar (Figure 6B).
PPO had significantly decreased and POD had significantly increased activity at 1 h in both cultivars compared with 0 h (Figure 6C,D). The results show that PPO activity was higher before flesh browning than after browning in the HB cultivar, and this finding was consistent with the expression trend of PbrPPO4 (Pbr000321.4). Compared to LB fruits, a significantly higher PPO and POD activity was detected in HB fruits (Figure 6C,D).

4. Discussion

Full length (FL) transcripts can significantly upgrade the accuracy of genome annotation and assembly, which help to identify full length isoforms of a gene, AS events, lncRNAs, and alternative polyadenylation (APA) sites [38]. Recent advances in comprehensive information with SMRT-seq and Illumina RNA-seq have been applied to detect more gene isoforms and expose functional variety [39,40]. SMRT sequencing was used to obtain diverse FL cDNA sequences and enhance gene annotation in birch-leaf pear (P. betulifolia Bunge) [41], but the error rate of these data was not overcome by correction of Illumina RNA-Seq. In this study, 69,122 consensus isoforms were generated by SMRT from sand pear fruit and corrected by Illumina RNA-Seq. This complete transcriptome was used to detect 7105 AS events and 254 lncRNAs (Figure 2).
Plant lncRNAs are involved in induced responses to various abiotic and biotic stresses [37]. In birch-leaf pear, 251 lncRNAs were related to drought stress responses [42]. In ginkgo, four genes involved in phenylpropanoid biosynthesis targeted by five lncRNAs were identified [43]. We firstly identified 254 lncRNAs in P. prifolia during fruit fresh-cut browning. Five genes related to enzymatic browning were predicted to be targets of six lncRNAs (Figure 2). The target genes were involved in PPO, POD, and phenylpropanoid pathway-related genes. It is worth mentioning that two PPO (Pbr000321.4 and Pbr000322.1) targets of lncRNA PB.156.1 were predicted (Figure 2). PPOs have been concerned in several functional processes, including plant defense, regulation of plastidic oxygen levels, and the phenylpropanoid pathway [8]. In bananas, non-coding RNA miR528, which targets PPO genes, plays an important role in the peel browning during cold-stress [13]. Our findings on lncRNAs in sand pears indicate that the expression of lncRNA PB.156.1 was significantly positively correlated with the target gene PbrPPO4 (Pbr000321.4) during flesh browning.
The type and content of phenolic compounds significantly determine the browning characteristics [44]. In pears, cultivars with less phenolic contents were less susceptible to browning than cultivars with higher phenolic contents [45], and the degree of browning was closely correlated with the initial amount of phenolic compounds [46]. The content of phenolic compounds declined during pear slice browning [29], pear wine browning [47], pear internal browning [48], and apple flesh browning [11]. Similarly, we found that the content of total phenolics was higher in the HB cultivar than that examined in the LB cultivar at 0 h before flesh browning. After flesh browning, the concentration of total phenolics was reduced in the HB cultivar at 1 h (Table 1). The HB flesh probably provided sufficient phenolic substances to PPO after wounding, which caused high browning.
The metabolism of phenolic compounds is also related to the flow of the phenylpropanoid and flavonoid biosynthesis pathways, and these pathways are downstream pathway of the shikimate pathway [27]. From glucose to phenylalanine, most DEGs were up-regulated at the HB cultivar compared to the LB cultivar (Figure 5). This means that the HB cultivar might synthesize more L-Phenylalanine precursors during sand pear flesh browning in phenylpropanoid and flavonoid biosynthesis pathways, which contain a diversity of key enzymes, such as PAL, C4H, CCR, CHS, HCT, and LAR. In ‘Yali’ pears, the PbPAL1 and PbPAL2 might regulate core browning under modified atmosphere storage [22]. The expression of MdPAL, MdCHS, MdCHI, MdANS, MdFLS, and MdANR was positively correlated with Fuji apple flesh browning [49]. PAL CHS and 4CL genes were significantly expressed in the brown husk of walnuts [50]. After lettuce cutting, the expression of LsPALs was significantly higher after wounding at 4 h [51]. The expression of PAL encoded genes was largely up-regulated in lotus root pericarp unpacked after 30 days, but the expression was low in those packed with anti-browning solution such as 0.1% ascorbic acid solution, 1% onion solution, and 0.1% citrus powder solution [52]. In our study, most DEGs (e.g., PAL, 4CL, CAD, CCR CHS, and LAR) involved in the phenylpropanoid biosynthesis pathway were up-regulated (Figure 5). This indicates that phenylpropanoid biosynthesis-related genes plays an important role in protecting plants against wounding-induced abiotic stresses and enhancing the relevant enzymes activity, causing an increase in phenolic compounds during sand pear flesh browning. Actually, in this study, a reduction of the total phenolics was observed during HB pear browning. This suggests that sand pear flesh high browning might depend on the initial number of phenolic compounds and the activation of enzymes.
PPO and POD play an important role in the browning of fresh-cut fruits and vegetables. The methods of reducing enzymatic browning are mainly achieved by inhibiting PPO and POD activity. A decreased expression of enzymatic browning related genes (POD, PPO1, PPO5, and LOX1) and reduced PPO activity were found in pear flesh cut with melatonin treatment at 0.1 mM [21]. The expression of PbPPO1 was correlated with the changes of core browning, phenolic contents, and PPO activity, but the expression of PbPPO4, PbPPO5, and PbPPO6 had no significant relation between core tissue and core browning [22]. PbPPO1 and PbPPO5 were involved in the core browning in ‘Yali’ pears during cold storage, but the expression of PbPPO4 and PbPPO6 were not correlated with the core browning [3].
In this study, two PPO genes and six POD genes were differentially regulated in LB and HB cultivars. The expression of most PPO and POD in the HB cultivar was significantly higher than that in the LB cultivar, and the expression of PbrPPO4 (Pbr000321.4) was ~25-fold higher in the HB cultivar than in the LB cultivar at 0 h (Figure 6). In a transcriptomic analysis of ‘Whangkeumbae’ pear core browning, the DEGs of PPO4 (Pbr000321.4) were up-regulated under low-temperature storage [53]. The expression level of PPO4 showed discordance between ‘Yali’ pear [3,22], ‘Whangkeumbae’ pear [53], and two cultivars of this study with core browning and flesh browning. Therefore, this suggests that PbrPPO4 in different pear cultivars with different types of browning might be regulated independently and have a variety functions. In potato tuber tissue browning, inhibition of PPO by artificial microRNAs (amiRNAs) technology found that the different PPO genes had different contributions to the total PPO protein content, with StuPPO2 as the major contributor. Moreover, the accounting of StuPPO2 and StuPPO1 was ~55% and ~25–30%, respectively, while the accounting of StuPPO3 and StuPPO4 together was less than 15% [9]. Our results showed that the expression PbrPPO4 (Pbr000321.4) was significantly higher than that of other PPO and POD genes, and the expression trend of PbrPPO4 (Pbr000321.4) was consistent with the trend of PPO activity in the HB cultivar at 0 h and 1 h (Figure 6). According to these results, PbrPPO4 (Pbr000321.4) might act as a major contributor and a key enzyme encoding gene in regulating sand pear flesh enzymatic browning.

5. Conclusions

A combination of single molecular real-time (SMRT) sequencing and Illumina RNA sequencing was used to detect FL isoforms, ORFs, AS, lncRNAs, DEGs, and functional annotations. A total of 9930 DEGs were found in sand pear flesh of the high-browning and low-browning cultivars at 0 h and 1 h. The expression profiles of all members of the phenylpropanoid and flavonoid biosynthesis, and the PPO and POD gene families were also analyzed, and many of them had higher expression in the HB cultivar than in the LB cultivar. PbrPPO4 (Pbr000321.4) had a significantly higher transcript level than other PPO and POD genes. A high level of total polyphenol and PPO activity were observed in the high browning cultivar, and the expression of PbrPPO4 declined during sand pear fresh-cut browning in the high browning cultivar as the PPO activity decreased and the intensity of sand pear fresh-cut browning increased. This work provides a transcriptome database and candidate genes for future molecular studies of enzymatic browning and lays a theoretical foundation for molecular breeding of high polyphenol and low browning germplasm resources in sand pears.

Supplementary Materials

The following are available online at https://www.mdpi.com/article/10.3390/horticulturae7110502/s1, Figure S1: Summary of PacBio RS II single-molecule real-time (SMRT) sequencing, Figure S2: Length distribution of ORFs with new transcripts, Figure S3: Gene ontology (GO) categorization of sand pear flesh DEGs. (A) GO analysis of DEGs between low browning (LB) and high browning (HB) at 0 h in three main categories. (B) GO analysis of DEGs between low browning (LB) and high browning (HB) at 1 h in three main categories, Table S1: Primers designed for qRT-PCR validation, Table S2: The PacBio SMRT sequencing information of sand pear fruit, Table S3: ICE (Iterative clustering for error correction) cluster result statistics, Table S4: Samples sequencing data evaluation, Table S5:Annotation of new transcript datasets to eight public databases, Table S6: Summary of annotated differentially expressed genes between LB and HB sand pear flesh at 0 h and 1 h, Table S7: KEGG pathway enrichment of LB vs. HB at 0 h and 1 h in RNA-Seq.

Author Contributions

Conceptualization, J.F. and H.-J.H.; methodology, J.F., W.D. and J.-G.Z.; formal analysis, J.F. and W.D.; investigation, J.F., H.-J.H., X.-P.Y. and Q.-L.C., writing—original draft preparation, J.F.; writing—review and editing, J.F., H.-J.H., S.B.H. and W.D.; supervision, Q.-L.C. and X.-P.Y.; project administration, J.F.; funding acquisition, H.-J.H. All authors have read and agreed to the published version of the manuscript.

Funding

This research was funded by National Key Research and Development Program (2019YFD1001400), the China Agriculture Research System of MOF and MARA (CARS-28), and Hubei Agricultural Science and Technology Innovation Center (2020-620-000-002-05).

Institutional Review Board Statement

Not applicable.

Informed Consent Statement

Not applicable.

Conflicts of Interest

The authors declare no conflict of interest.

References

  1. Friedman, M. Food browning and its prevention: An overview. J. Agric. Food Chem. 1996, 44, 631–653. [Google Scholar] [CrossRef]
  2. Gomes, M.H.; Vieira, T.; Fundo, J.F.; Almeida, D.P. Polyphenoloxidase activity and browning in fresh-cut ‘Rocha’ pear as affected by pH, phenolic substrates, and antibrowning additives. Postharvest Biol. Technol. 2014, 91, 32–38. [Google Scholar] [CrossRef] [Green Version]
  3. Cheng, Y.; Liu, L.; Feng, Y.; Dong, Y.; Guan, J. Effects of 1-MCP on fruit quality and core browning in ‘Yali’ pear during cold storage. Sci. Hortic. 2019, 243, 350–356. [Google Scholar] [CrossRef]
  4. Liao, T.; Liu, J.; Sun, Y.; Zou, L.; Zhou, L.; Liu, C.; Terefe, N.S.; Liu, W. Differential inhibitory effects of organic acids on pear polyphenol oxidase in model systems and pear puree. LWT Food Sci. Technol. 2020, 118, 108704. [Google Scholar] [CrossRef]
  5. Terefe, N.S.; Buckow, R.; Versteeg, C. Quality-related enzymes in fruit and vegetable products: Effects of novel food processing technologies, part 1: High-pressure processing. Crit. Rev. Food Sci. Nutr. 2014, 54, 24–63. [Google Scholar] [CrossRef] [PubMed]
  6. Mayer, A.M. Polyphenol oxidases in plants and fungi: Going places? A review. Phytochemistry 2006, 67, 2318–2331. [Google Scholar] [CrossRef] [PubMed]
  7. Tran, L.T.; Taylor, J.S.; Constabel, C.P. The polyphenol oxidase gene family in land plants: Lineage-specific duplication and expansion. BMC Genom. 2012, 13, 395. [Google Scholar] [CrossRef] [Green Version]
  8. Zhang, J.; Sun, X. Recent advances in polyphenol oxidase-mediated plant stress responses. Phytochemistry 2021, 181, 112588. [Google Scholar] [CrossRef]
  9. Chi, M.; Bhagwat, B.; Lane, W.D.; Tang, G.; Su, Y.; Sun, R.; Oomah, B.D.; Wiersma, P.A.; Xiang, Y. Reduced polyphenol oxidase gene expression and enzymatic browning in potato (Solanum tuberosum L.) with artificial microRNAs. BMC Plant. Biol. 2014, 14, 62. [Google Scholar] [CrossRef] [Green Version]
  10. González, M.N.; Massa, G.A.; Andersson, M.; Turesson, H.; Olsson, N.; Fält, A.-S.; Storani, L.; Décima Oneto, C.A.; Hofvander, P.; Feingold, S.E. Reduced enzymatic browning in potato tubers by specific editing of a polyphenol oxidase gene via ribonucleoprotein complexes delivery of the CRISPR/Cas9 system. Front. Plant. Sci. 2020, 10, 1649. [Google Scholar] [CrossRef] [PubMed]
  11. Di Guardo, M.; Tadiello, A.; Farneti, B.; Lorenz, G.; Masuero, D.; Vrhovsek, U.; Costa, G.; Velasco, R.; Costa, F. A multidisciplinary approach providing new insight into fruit flesh browning physiology in apple (Malus x domestica Borkh.). PLoS ONE 2013, 8, e78004. [Google Scholar] [CrossRef] [PubMed]
  12. Liu, D.; Meng, S.; Xiang, Z.; Yang, G.; He, N. An R1R2R3 MYB transcription factor, MnMYB3R1, regulates the polyphenol oxidase gene in mulberry (Morus notabilis). Int. J. Mol. Sci. 2019, 20, 2602. [Google Scholar] [CrossRef] [PubMed] [Green Version]
  13. Zhu, H.; Chen, C.; Zeng, J.; Yun, Z.; Liu, Y.; Qu, H.; Jiang, Y.; Duan, X.; Xia, R. Micro RNA 528, a hub regulator modulating ROS homeostasis via targeting of a diverse set of genes encoding copper-containing proteins in monocots. New Phytol. 2020, 225, 385–399. [Google Scholar] [CrossRef]
  14. Taranto, F.; Pasqualone, A.; Mangini, G.; Tripodi, P.; Miazzi, M.M.; Pavan, S.; Montemurro, C. Polyphenol oxidases in crops: Biochemical, physiological and genetic aspects. Int. J. Mol. Sci. 2017, 18, 377. [Google Scholar] [CrossRef]
  15. Tanrıöven, D.; Ekşi, A. Phenolic compounds in pear juice from different cultivars. Food Chem. 2005, 93, 89–93. [Google Scholar] [CrossRef]
  16. Li, X.; Wang, T.; Zhou, B.; Gao, W.; Cao, J.; Huang, L. Chemical composition and antioxidant and anti-inflammatory potential of peels and flesh from 10 different pear varieties (Pyrus spp.). Food Chem. 2014, 152, 531–538. [Google Scholar] [CrossRef] [PubMed]
  17. Kolniak-Ostek, J. Identification and quantification of polyphenolic compounds in ten pear cultivars by UPLC-PDA-Q/TOF-MS. J. Food Compos. Anal. 2016, 49, 65–77. [Google Scholar] [CrossRef]
  18. Li, X.; Zhang, J.-Y.; Gao, W.-Y.; Wang, Y.; Wang, H.-Y.; Cao, J.-G.; Huang, L.-Q. Chemical composition and anti-inflammatory and antioxidant activities of eight pear cultivars. J. Agric. Food Chem. 2012, 60, 8738–8744. [Google Scholar] [CrossRef]
  19. Wang, X.; Liu, C.; Wang, Q.; Liu, C.; Sun, H.; Zhang, M.; Lyu, D.; Du, G. A comparative study on antioxidant, anti-inflammatory, antimicrobial activities and chemical composition of Pyrus ussuriensis cultivars from northeastern China. Hortic. Environ. Biotechnol. 2021, 62, 477–491. [Google Scholar] [CrossRef]
  20. Wang, Z.; Barrow, C.J.; Dunshea, F.R.; Suleria, H.A. A comparative investigation on phenolic composition, characterization and antioxidant potentials of five different Australian grown pear varieties. Antioxidants 2021, 10, 151. [Google Scholar] [CrossRef]
  21. Zheng, H.; Liu, W.; Liu, S.; Liu, C.; Zheng, L. Effects of melatonin treatment on the enzymatic browning and nutritional quality of fresh-cut pear fruit. Food Chem. 2019, 299, 125116. [Google Scholar] [CrossRef] [PubMed]
  22. Cheng, Y.; Liu, L.; Zhao, G.; Shen, C.; Yan, H.; Guan, J.; Yang, K. The effects of modified atmosphere packaging on core browning and the expression patterns of PPO and PAL genes in ‘Yali’ pears during cold storage. LWT Food Sci. Technol. 2015, 60, 1243–1248. [Google Scholar] [CrossRef]
  23. Zhang, L.; Wang, J.-W.; Zhou, B.; Liu, Y.-F.; Xia, X.-L.; Xiao, Z.-G.; Fei, L.; Ji, S.-J. Calcium inhibited peel browning by regulating enzymes in membrane metabolism of ‘Nanguo’ pears during post-ripeness after refrigerated storage. Sci. Hortic. 2019, 244, 15–21. [Google Scholar] [CrossRef]
  24. Dixon, R.A.; Achnine, L.; Kota, P.; Liu, C.J.; Reddy, M.S.; Wang, L. The phenylpropanoid pathway and plant defence-a genomics perspective. Mol. Plant. Pathol. 2002, 3, 371–390. [Google Scholar] [CrossRef]
  25. MacLean, D.; Murr, D.; DeEll, J.; Mackay, A.; Kupferman, E. Inhibition of PAL, CHS, and ERS1 in ‘Red d’Anjou’ pear (Pyrus communis L.) by 1-MCP. Postharvest Biol. Technol. 2007, 45, 46–55. [Google Scholar] [CrossRef]
  26. Wang, J.; Dong, S.; Jiang, Y.; He, H.; Liu, T.; Lv, M.; Ji, S. Influence of long-term cold storage on phenylpropanoid and soluble sugar metabolisms accompanied with peel browning of ‘Nanguo’ pears during subsequent shelf life. Sci. Hortic. 2020, 260, 108888. [Google Scholar] [CrossRef]
  27. Vogt, T. Phenylpropanoid biosynthesis. Mol. Plant. 2010, 3, 2–20. [Google Scholar] [CrossRef] [PubMed] [Green Version]
  28. Saeeduddin, M.; Abid, M.; Jabbar, S.; Wu, T.; Hashim, M.M.; Awad, F.N.; Hu, B.; Lei, S.; Zeng, X. Quality assessment of pear juice under ultrasound and commercial pasteurization processing conditions. LWT Food Sci. Technol. 2015, 64, 452–458. [Google Scholar] [CrossRef]
  29. Sharma, S.; Rao, T.R. Xanthan gum based edible coating enriched with cinnamic acid prevents browning and extends the shelf-life of fresh-cut pears. LWT Food Sci. Technol. 2015, 62, 791–800. [Google Scholar] [CrossRef]
  30. Zhou, X.; Xiao, Y.; Meng, X.; Liu, B. Full inhibition of Whangkeumbae pear polyphenol oxidase enzymatic browning reaction by L-cysteine. Food Chem. 2018, 266, 1–8. [Google Scholar] [CrossRef]
  31. Steinwand, M.A.; Ronald, P.C. Crop biotechnology and the future of food. Nat. Food 2020, 1, 273–283. [Google Scholar] [CrossRef]
  32. Maioli, A.; Gianoglio, S.; Moglia, A.; Acquadro, A.; Valentino, D.; Milani, A.M.; Prohens, J.; Orzaez, D.; Granell, A.; Lanteri, S. Simultaneous CRISPR/Cas9 editing of three PPO genes reduces fruit flesh browning in Solanum melongena L. Front. Plant. Sci. 2020, 11, 1883. [Google Scholar] [CrossRef]
  33. Wang, T.; Zhang, C.; Zhang, H.; Zhu, H. CRISPR/Cas9-mediated gene editing revolutionizes the improvement of horticulture food crops. J. Agric. Food Chem. 2021. [Google Scholar] [CrossRef]
  34. Liu, Z.; Cheng, K.; Qin, Z.; Wu, T.; Li, X.; Tu, J.; Yang, F.; Zhu, H.; Yang, L. Selection and validation of suitable reference genes for qRT-PCR analysis in pear leaf tissues under distinct training systems. PLoS ONE 2018, 13, e0202472. [Google Scholar] [CrossRef] [PubMed]
  35. Syed, N.H.; Kalyna, M.; Marquez, Y.; Barta, A.; Brown, J.W. Alternative splicing in plants-coming of age. Trends Plant. Sci. 2012, 17, 616–623. [Google Scholar] [CrossRef] [Green Version]
  36. Correa, J.P.d.O.; Silva, E.M.; Nogueira, F.T. Molecular control by non-coding RNAs during fruit development: From gynoecium patterning to fruit ripening. Front. Plant. Sci. 2018, 9, 1760. [Google Scholar] [CrossRef] [PubMed] [Green Version]
  37. Waseem, M.; Liu, Y.; Xia, R. Long non-coding RNAs, the dark matter: An emerging regulatory component in plants. Int. J. Mol. Sci. 2021, 22, 86. [Google Scholar] [CrossRef]
  38. Wang, B.; Tseng, E.; Regulski, M.; Clark, T.A.; Hon, T.; Jiao, Y.; Lu, Z.; Olson, A.; Stein, J.C.; Ware, D. Unveiling the complexity of the maize transcriptome by single-molecule long-read sequencing. Nat. Commun. 2016, 7, 11708. [Google Scholar] [CrossRef] [PubMed] [Green Version]
  39. Tian, B.; Lu, T.; Xu, Y.; Wang, R.; Chen, G. Identification of genes associated with ricinoleic acid accumulation in Hiptage benghalensis via transcriptome analysis. Biotechnol. Biofuels 2019, 12, 16. [Google Scholar] [CrossRef] [Green Version]
  40. Rao, S.; Yu, T.; Cong, X.; Xu, F.; Lai, X.; Zhang, W.; Liao, Y.; Cheng, S. Integration analysis of PacBio SMRT and Illumina RNA-seq reveals candidate genes and pathway involved in selenium metabolism in hyperaccumulator Cardamine violifolia. BMC Plant. Biol. 2020, 20, 492. [Google Scholar] [CrossRef]
  41. Yang, Q.; Wang, J.; Wang, Z.; Li, X.; Kan, J.; Lin, J. SMRT sequencing of full-length transcriptome of birch-leaf pear (Pyrus betulifolia Bunge) under drought stress. J. Genet. 2021, 100, 29. [Google Scholar] [CrossRef] [PubMed]
  42. Wang, J.; Lin, J.; Kan, J.; Wang, H.; Li, X.; Yang, Q.; Li, H.; Chang, Y. Genome-wide identification and functional prediction of novel drought-responsive lncRNAs in Pyrus betulifolia. Genes 2018, 9, 311. [Google Scholar] [CrossRef] [Green Version]
  43. Ye, J.; Cheng, S.; Zhou, X.; Chen, Z.; Kim, S.U.; Tan, J.; Zheng, J.; Xu, F.; Zhang, W.; Liao, Y. A global survey of full-length transcriptome of Ginkgo biloba reveals transcript variants involved in flavonoid biosynthesis. Ind. Crop. Prod. 2019, 139, 111547. [Google Scholar] [CrossRef]
  44. Mishra, B.B.; Gautam, S.; Sharma, A. Free phenolics and polyphenol oxidase (PPO): The factors affecting post-cut browning in eggplant (Solanum melongena). Food Chem. 2013, 139, 105–114. [Google Scholar] [CrossRef]
  45. Hamauzu, Y.; Yasui, H.; Inno, T.; Kume, C.; Omanyuda, M. Phenolic profile, antioxidant property, and anti-influenza viral activity of Chinese quince (Pseudocydonia sinensis Schneid.), quince (Cydonia oblonga Mill.), and apple (Malus domestica Mill.) fruits. J. Agric. Food Chem. 2005, 53, 928–934. [Google Scholar] [CrossRef]
  46. Amiot, M.J.; Tacchini, M.; Aubert, S.Y.; Oleszek, W. Influence of cultivar, maturity stage, and storage conditions on phenolic composition and enzymic browning of pear fruits. J. Agric. Food Chem. 1995, 43, 1132–1137. [Google Scholar] [CrossRef]
  47. Yang, H.; Tian, T.; Gu, H.; Li, X.; Cai, G.; Sun, J.; Wu, D.; Lu, J. Analysis of factors related to browning of Dangshan pear (Pyrus spp.) wine. Food Chem. 2020, 308, 125665. [Google Scholar] [CrossRef]
  48. Fan, M.; Li, W.; Hu, X.; Sun, Y.n.; Yu, G.; Zhang, X. Effect of micro-vacuum storage on active oxygen metabolism, internal browning and related enzyme activities in Laiyang pear (Pyrus bretschneideri Reld). LWT Food Sci.Technol. 2016, 72, 467–474. [Google Scholar] [CrossRef]
  49. Tang, T.; Xie, X.; Ren, X.; Wang, W.; Tang, X.; Zhang, J.; Wang, Z. A difference of enzymatic browning unrelated to PPO from physiology, targeted metabolomics and gene expression analysis in Fuji apples. Postharvest Biol. Technol. 2020, 170, 111323. [Google Scholar] [CrossRef]
  50. Zhang, S.; Tian, L.; Zhang, Y.; Zhao, H.; Zhao, J.; Guo, J.; Zhu, G.-P. De novo transcriptome assembly of the fresh-cut white husk of Juglans cathayensis Dode: Insights for enzymatic browning mechanism of fresh-cut husk of walnut. Sci. Hortic. 2019, 257, 108654. [Google Scholar] [CrossRef]
  51. Huang, S.-J.; Lin, S.-Y.; Wang, T.-T.; Hsu, F.-C. Combining acetic acid and ethanol as an anti-browning treatment for lettuce butt discoloration through repression of the activity and expression of phenylalanine ammonia lyase. Postharvest Biol. Technol. 2020, 164, 111151. [Google Scholar] [CrossRef]
  52. Worarad, K.; Suzuki, T.; Norii, H.; Mochizuki, Y.; Ishii, T.; Shinohara, K.; Miyamoto, T.; Kuboyama, T.; Inoue, E. Transcriptome profiling for pericarp browning during long-term storage of intact lotus root (Nelumbo nucifera). Plant. Growth Regul. 2021, 95, 207–221. [Google Scholar] [CrossRef]
  53. Zhou, H.; Tian, M.; Huang, W.; Luo, S.; Hu, H.; Zhang, Y.; Zhang, L.; Li, P. Physiological and transcriptomic analysis of ‘Whangkeumbae’ pear core browning during low-temperature storage. Gene Expr. Patterns 2020, 36, 119113. [Google Scholar] [CrossRef] [PubMed]
Figure 1. Flesh browning of two sand pear cultivars at 0 h and 1 h. (A) Sand pear flesh slices browning of LB (low browning cultivar ‘Eli No.2′) and HB (high browning cultivar ‘Weiningdahuangli’). (BE) Changes in color coordinates L* (B), a* (C), b* (D), and browning index (E). Scale bar = 1 cm; * indicates statistical significance (p < 0.05), ns: no significance.
Horticulturae 07 00502 g001
Figure 2. Identification of sand pear fruit alternative splicing (AS) and long noncoding RNAs (lncRNAs). (A) Number and categories of AS events based on the PacBio platform. (B) Number of lncRNAs analyzed by CNCI, CPC, Pfam, and CPAT based on the PacBio platform. (C) The lncRNA–mRNA regulatory network related to sand pear flesh enzymatic browning. (D) The expression level of lncRNAs and target genes by qRT-PCR.
Horticulturae 07 00502 g002
Figure 3. Characteristics and qRT-PCR validation of the differentially expressed genes (DEGs). (A) Numbers of DEGs in pairwise comparisons in two sand pear cultivars at 0 h and 1 h. (B) Venn diagram showing the number of DEGs in two sand pear cultivars at 0 h and 1 h. (C) Correlation analysis of the DEGs expression ratios obtained from the qRT-PCR and RNA-seq data of 26 DEGs (p < 0.05). (D) Expression ratios of nine phenylpropanoid and flavonoid biosynthesis-related genes quantified by qRT-PCR and RNA-seq.
Horticulturae 07 00502 g003
Figure 4. KEGG pathway enrichment analysis in sand pear flesh of two cultivars at 1 h. Rich factor refers to the ratio of the DEGs number annotated in this pathway and the number in all genes; large rich factor indicates significant enrichment. The color of the circle represents the value, which is an adjusted p-value by multiple hypothesis testing.
Horticulturae 07 00502 g004
Figure 5. Heat map diagrams of relative expression levels of phenylpropanoid and flavonoid biosynthesis-related genes in two sand pear cultivars at 0 h and 1 h. LB: Low browning cultivar, HB: high browning cultivar, AroD/SkDH: 3-dehydroquinate dehydratase/shikimate dehydrogenase, CS: chorismate synthase, ICS: isochorismate synthase, CM: chorismate mutase, AS: Anthranilate synthase, AnPRT: anthranilate phosphoribosyl transferase, IGPS: indole-3-glycerol phosphate synthase, ADH: arogenate dehydrogenase, ADT: arogenate dehydratase, PAL: phenylalanine ammonia-lyase, C4H: cinnamate 4-hydroxylase, 4CL: 4-coumaroyl: CoA ligase, CAD: cinnamyl alcohol dehydrogenase, CCR: cinnamoyl-CoA reductase, CHS: chalcone synthase, HCT: shikimate O-hydroxycinnamoyl transferase, F3H: flavanone 3-hydroxylase, DFR: dihydroflavonol 4-reductase, LAR: leucoanthocyanidin reductase, ANR: anthocyanidin reductase.
Horticulturae 07 00502 g005
Figure 6. Expression and enzyme activities of polyphenol oxidase (PPO) and peroxidase (POD). (A) Heat map depicting Log2(FPKM + 1) values for PPO and POD of LB and HB at 0 h and 1 h. (B) Relative expression of PPO and POD in two sand pear cultivars at 0 h and 1 h by qRT-PCR analysis. (C,D) PPO (C) and POD (D) enzymes activities in LB and HB at 0 h and 1 h. LB: Low browning cultivar, HB: high browning cultivar; * indicates statistical significance (p < 0.05), ns: no significance.
Horticulturae 07 00502 g006
Table 1. Total and monomeric polyphenol (μg/g fresh weight) in two cultivars at 0 h and 1 h.
CompoundSamples
LB-0hLB-1hHB-0hHB-1h
Total polyphenolic117 ± 11 a118 ± 10 a683 ± 34 b *503 ± 38 c
Chlorogenic acid0.17 ± 0.1 a0.12 ± 0.1 a78.1 ± 9.8 b *42.9 ± 9.3 c
CatechinNDNDNDND
EpicatechinNDNDNDND
Note: LB: Low browning cultivar, HB: high browning cultivar, ND: none detected; different letters indicate significant difference at the level of p < 0.05 in the same compound, * indicates statistical significance (p < 0.05) in the same cultivar.
Publisher’s Note: MDPI stays neutral with regard to jurisdictional claims in published maps and institutional affiliations.

