Article

Transcription Analysis of the Acid Tolerance Mechanism of Pichia kudriavzevii NBRC1279 and NBRC1664

by
Hironaga Akita
1 and
Akinori Matsushika
2,*
1
Department of Basic Science, College of Industrial Technology, Nihon University, 2-11-1 Shinei, Narashino 275-8575, Chiba, Japan
2
Department of Biotechnology and Chemistry, Faculty of Engineering, Kindai University, Higashi-Hiroshima 739-2116, Hiroshima, Japan
*
Author to whom correspondence should be addressed.
Fermentation 2023, 9(6), 559; https://doi.org/10.3390/fermentation9060559
Submission received: 6 May 2023 / Revised: 24 May 2023 / Accepted: 6 June 2023 / Published: 12 June 2023

Abstract

:
Simultaneous saccharification and fermentation (SSF) has been investigated for the efficient production of ethanol because it has several advantages such as simplifying the manufacturing process, operating easily, and reducing energy input. Previously, using lignocellulosic biomass as source materials, we succeeded in producing ethanol by SSF with Pichia kudriavzevii NBRC1279 and NBRC1664. However, various acids that fermentation inhibitors are also produced by the hydrolysis of lignocellulosic biomass, and the extent to which these acids affect the growth and ethanol productivity of the two strains has not yet been investigated. In this study, to better understand the acid tolerance mechanism of the two strains, a spot assay, growth experiment, and transcriptome analysis were carried out using Saccharomyces cerevisiae BY4742 as a control. When the three strains were cultured in SCD medium containing 15 mM formic acid, 35 mM sulfuric acid, 60 mM hydrochloric acid, 100 mM acetic acid, or 550 mM lactic acid, only P. kudriavzevii NBRC1664 could grow well under all conditions, and it showed the fastest growth rates. The transcriptome analysis showed that “MAPK signaling pathway-yeast” was significantly enriched in P. kudriavzevii NBRC1664 cultured with 60 mM hydrochloric acid, and most genes involved in the high osmolarity glycerol (HOG) pathway were up-regulated. Therefore, the up-regulation of the HOG pathway may be important for adapting to acid stress in P. kudriavzevii. Moreover, the log2-transformed fold change value in the expression level of Gpd1 was 1.3-fold higher in P. kudriavzevii NBRC1664 than in P. kudriavzevii NBRC1279, indicating that high Gpd1 expression may be accountable for the higher acid tolerance of P. kudriavzevii NBRC1664. The transcriptome analysis performed in this study provides preliminary knowledge of the molecular mechanism of acid stress tolerance in P. kudriavzevii. Our data may be useful for future studies on methods to improve the tolerance of P. kudriavzevii to acids produced from lignocellulose hydrolysis.

1. Introduction

Since the 2000s, the production of biofuel using biomass as a raw material has been studied because the amount of greenhouse gases in the atmosphere does not increase when biomass is consumed [1]. The fermentation of bioethanol is one of the most well-known examples of the utilization of biomass as a raw material. Bioethanol can be classified as first, second, or third-generation based on differences in the source materials or the production method. First-generation bioethanol is produced from food crops, which are different in the countries. For example, corn, sugarcane, and potato are used as raw materials in the United States, Brazil, and Europe, respectively [1]. Those raw materials are used because the carbon source required for the growth of the microorganisms used in bioethanol fermentation can be easily extracted. Using food crops as raw materials, more than 130 billion liters of ethanol are produced by fermentation worldwide, and the USA and Brazil are the main suppliers [1]. However, nowadays, the utilization of food crops for fermentation is concerned with increasing global population growth and decreasing arable land area. Thus, the production method of second-generation bioethanol, which does not compete with food crop consumption, has been studied since the 2010s.
Second-generation bioethanol is produced from lignocellulosic biomass through the following process [2,3]: (1) hydrothermal treatment of particles from lignocellulosic biomass; (2) enzymatic hydrolysis of the hydrothermally treated samples to prepare the hydrolysate; and (3) fermentation of ethanol using the hydrolysate. Based on this process, we performed pilot-scale production of ethanol using a xylose-utilizing recombinant Saccharomyces cerevisiae MA-R4 [4], in which the XYL1 and XYL2 genes encoding xylose reductase and xylitol dehydrogenase from Scheffersomyces (Pichia) stipitis, and XKS1 gene encoding xylulokinase from S. cerevisiae are expressed by chromosomal integration into the flocculent S. cerevisiae IR-2 [5], in 50 L scale solid mixer and 70 L scale fermenter [6]. As a result, 53.5 g/L of ethanol was successfully produced from hydrolysate prepared using Japanese eucalyptus particles after 72 h of fermentation, and the ethanol yield (82.2% of the theoretical yield) was comparable to that observed in laboratory-scale production. However, the operation time from the hydrothermal treatment of the Japanese eucalyptus particles to the fermentation of ethanol with the hydrolysate was 8 days, and the operation was complicated, which resulted in high production costs.
To simplify the production process and ease of operation, and reduce the required energy input, simultaneous saccharification and fermentation (SSF) has been performed for ethanol production using the thermostable yeast strains Pichia kudriavzevii NBRC1279 and NBRC1664 with particles from Japanese cedar or eucalyptus [7]. Compared to the above method, the manufacturing process is simpler because enzymatic hydrolysis and fermentation are simultaneously performed in the same vessel. However, the ethanol concentration when produced by SSF is only 21 to 24 g/L, thus the production yield needs to be improved for industrial use. The inhibitory effect of acids on fermentation is thought to be one of the reasons for the decreased production yield. When lignocellulosic biomass is hydrolyzed using cellulase and xylanase, mixed sugars are generated, and several kinds of inhibitors such as aldehydes (furfural and 5-hydroxymethylfurfural) and acids (acetic acid and formic acid) are also generated. In particular, large amounts of acetic acid and formic acid are generated, and they may inhibit the growth of both P. kudriavzevii NBRC1279 and NBRC1664 [8]. In ethanol production at the industrial level, hydrochloric acid or sulfuric acid is widely used for acid-based pretreatment methods, and dilute acid is added periodically during fermentation to maintain the optimal pH for ethanol production. Thus, residual acids inhibit fermentation by yeasts, and it is believed that the ethanol production yield can be enhanced by improving the acid tolerance of P. kudriavzevii NBRC1279 and NBRC1664, since the strains would be less susceptible to growth inhibition by the organic and inorganic acids. In this regard, we have previously isolated and characterized a novel gene (GAS1) encoding glycosylphosphatidylinositol (GPI)-anchored protein that confers low-pH and salt tolerance in S. cerevisiae BY4742 by screening a genomic DNA library of P. kudriavzevii NBRC1279 [9]. The IoGas1 protein may be involved in maintaining cell wall integrity during environmental stress. Moreover, the tolerance mechanism of acetic acid [10] and lactic acid [11] stresses are investigated by transcriptome analyses, and both tolerances have been reported to convert those organic acids to secondary metabolites by activating various metabolic pathways including the pyruvate metabolic pathway. On the other hand, to date, no detailed comparative analysis has been performed on how P. kudriavzevii NBRC1279 and NBRC1664 are acid-tolerant mechanisms to various acids.
In this study, to better understand the acid tolerance mechanism of P. kudriavzevii NBRC1279 and NBRC1664, acid tolerance tests and a transcriptome analysis were carried out using S. cerevisiae BY4742 as a control. The results of the present study provide useful knowledge for better understanding the acid tolerance mechanism of P. kudriavzevii NBRC1279 and NBRC1664, and are expected to be useful in the development of more useful strains for ethanol production by SSF.

2. Materials and Methods

2.1. Yeast Strains and Media
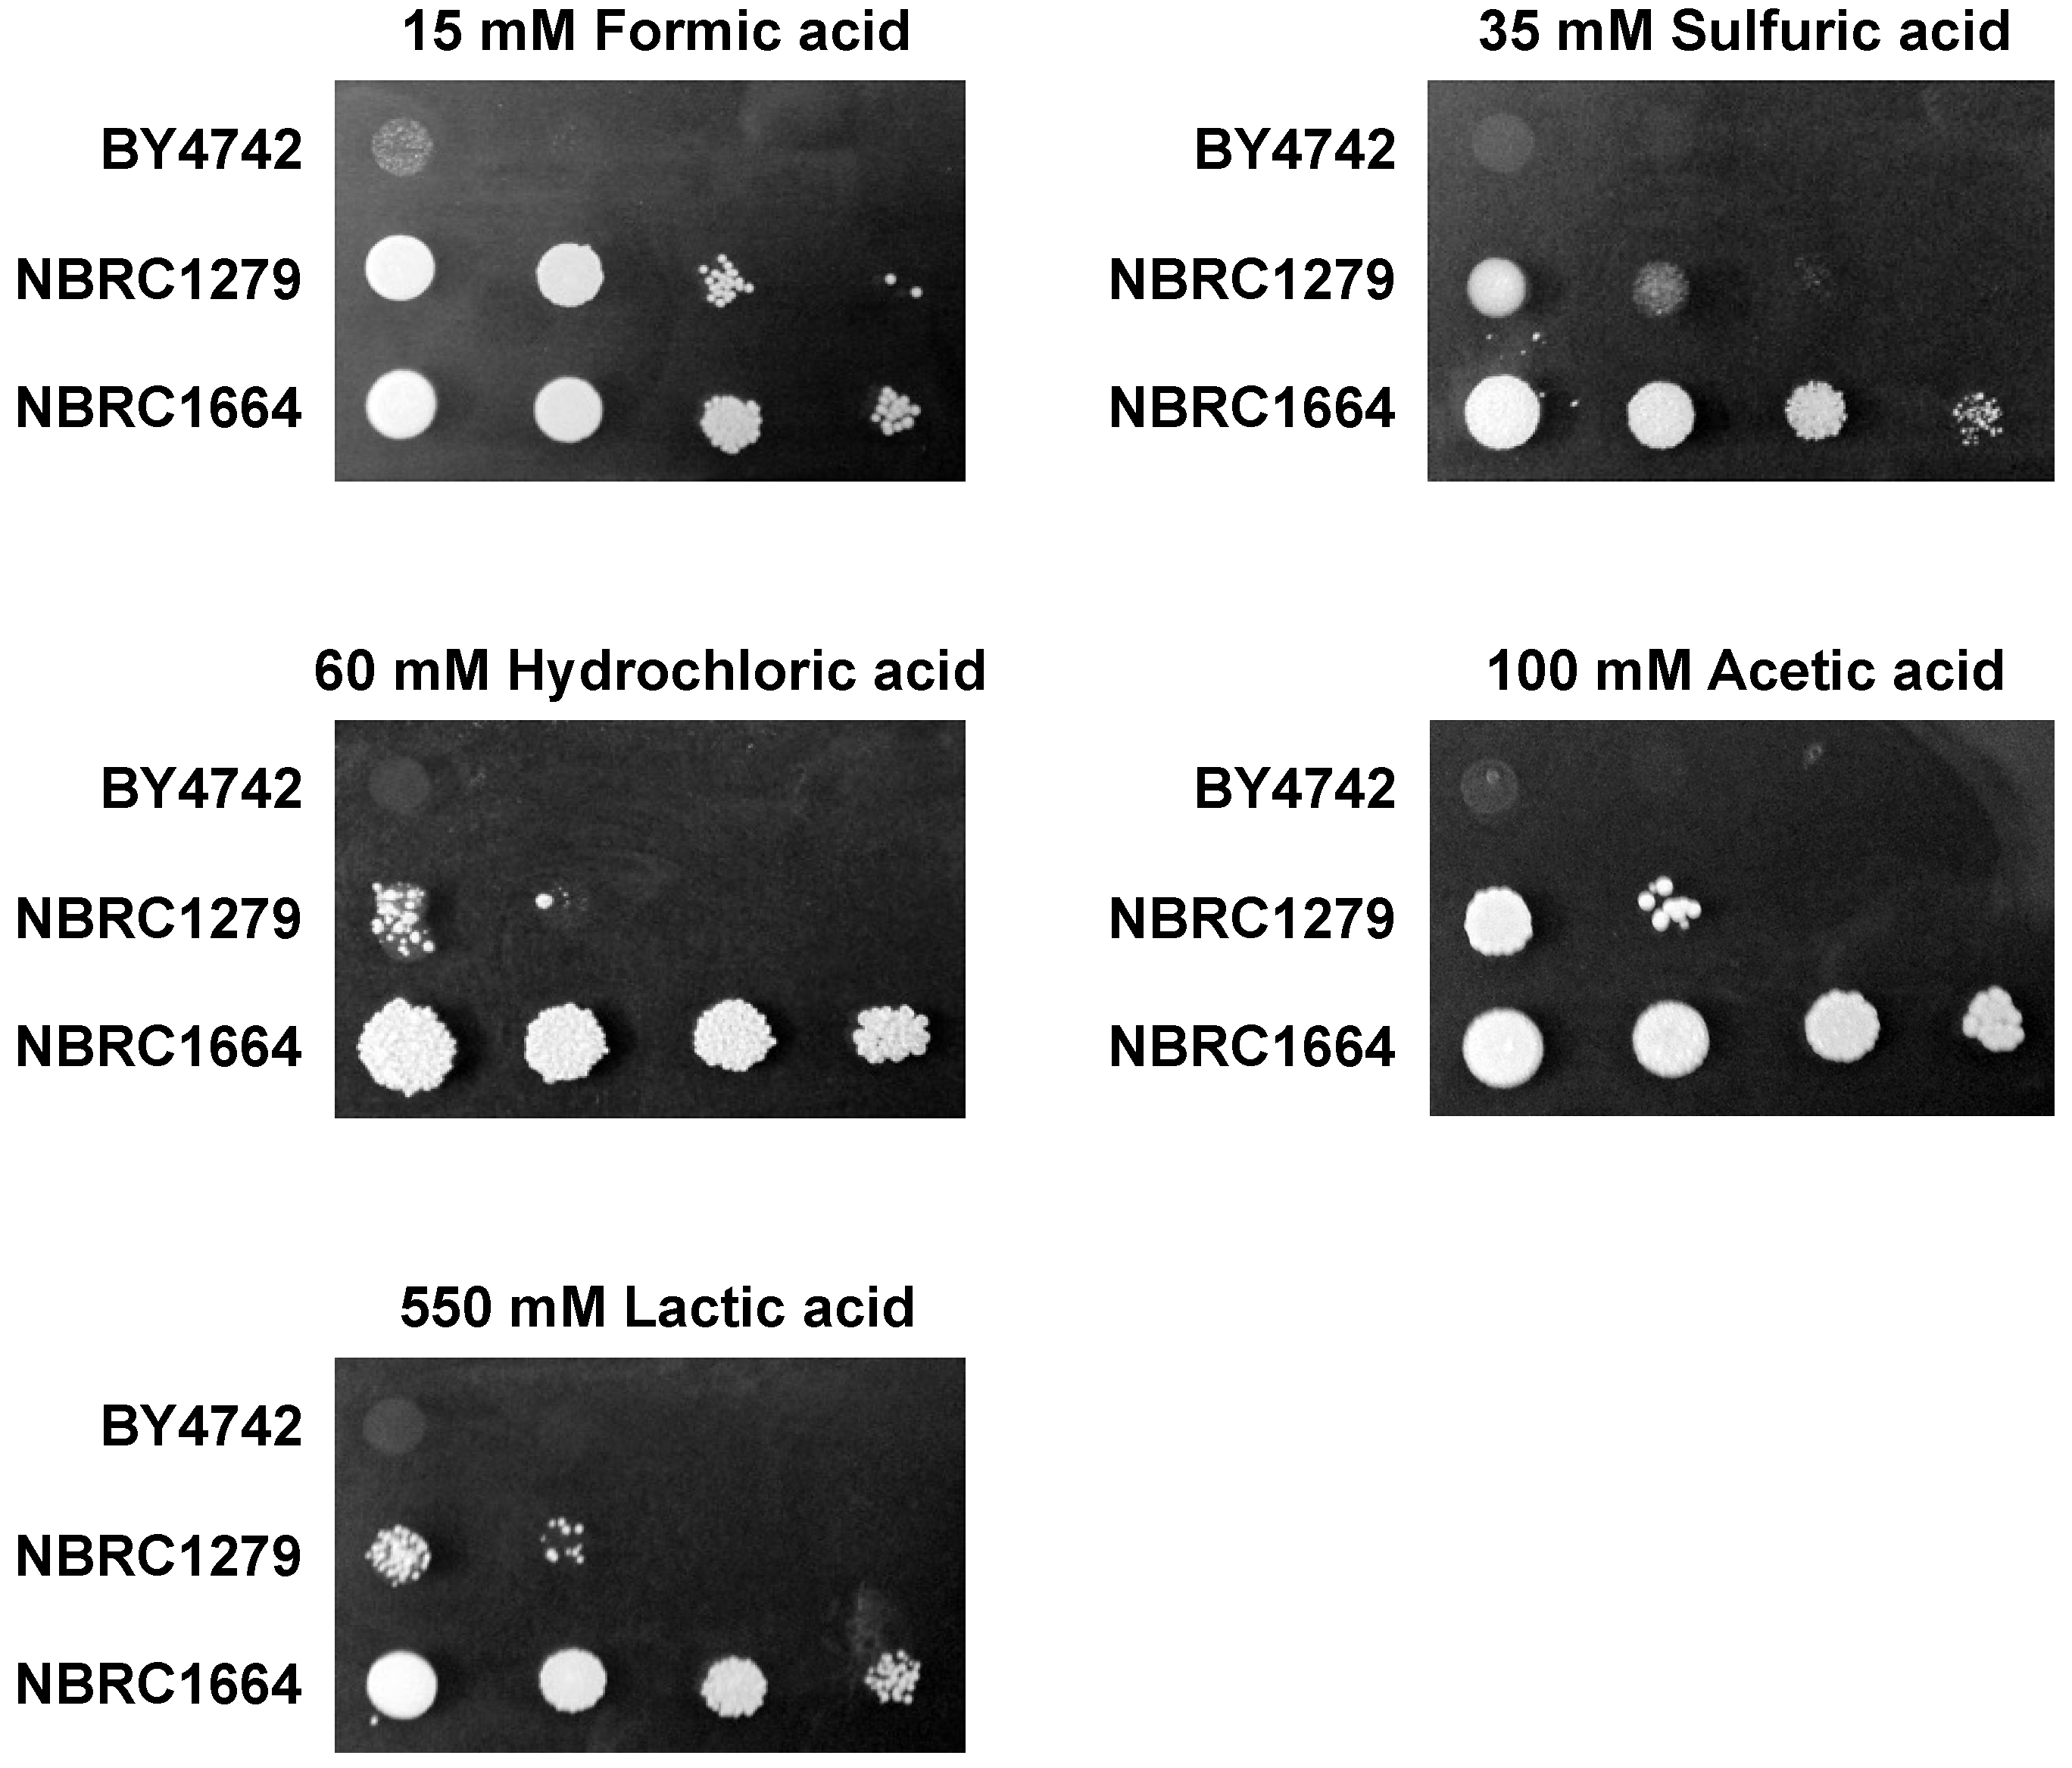
To investigate the acid tolerance mechanism in P. kudriavzevii NBRC1279 and NBRC1664, these yeast strains and S. cerevisiae BY4742 (MATα his3Δ1 leu2Δ0 lys2Δ0 ura3Δ0) as control strain were used. The two strains of P. kudriavzevii (NBRC1279 and NBRC1664) were purchased from the NITE Biological Resource Center (NBRC, Chiba, Japan), and S. cerevisiae BY4742 was obtained from Open Biosystems (Huntsville, AL, USA). Three yeast strains were grown in yeast peptone dextrose (YPD) broth or on agar plates (10 g/L yeast extract, 20 g/L peptone, 20 g/L glucose) unless otherwise noted. For spot assay and aerobic growth experiment, these three yeast strains were grown in synthetic complete (SC) minimal medium (6.7 g/L yeast nitrogen base without amino acids) supplemented with the appropriate amino acids and nucleic acids [12], and 20 g/L glucose (SCD medium).

2.2. Spot Assay

The acid sensitivity of P. kudriavzevii NBRC1279 and NBRC1664 as well as S. cerevisiae BY4742 was determined by the standard drop test technique. Yeast cultures were cultivated in SCD medium until the cells reached an early stationary phase of growth, and then they were diluted with fresh SCD medium to an absorbance at 600 nm (A600) of 0.02. Next, 2 μL of each suspension of 3-fold serial dilutions of P. kudriavzevii NBRC1279 and NBRC1664, and S. cerevisiae BY4742 were spotted onto SCD plates containing different acids (15 mM formic acid, 35 mM sulfuric acid, 60 mM hydrochloric acid, 100 mM acetic acid, or 550 mM lactic acid). The plates were photographed after 2 to 6 days of incubation at 30 °C.

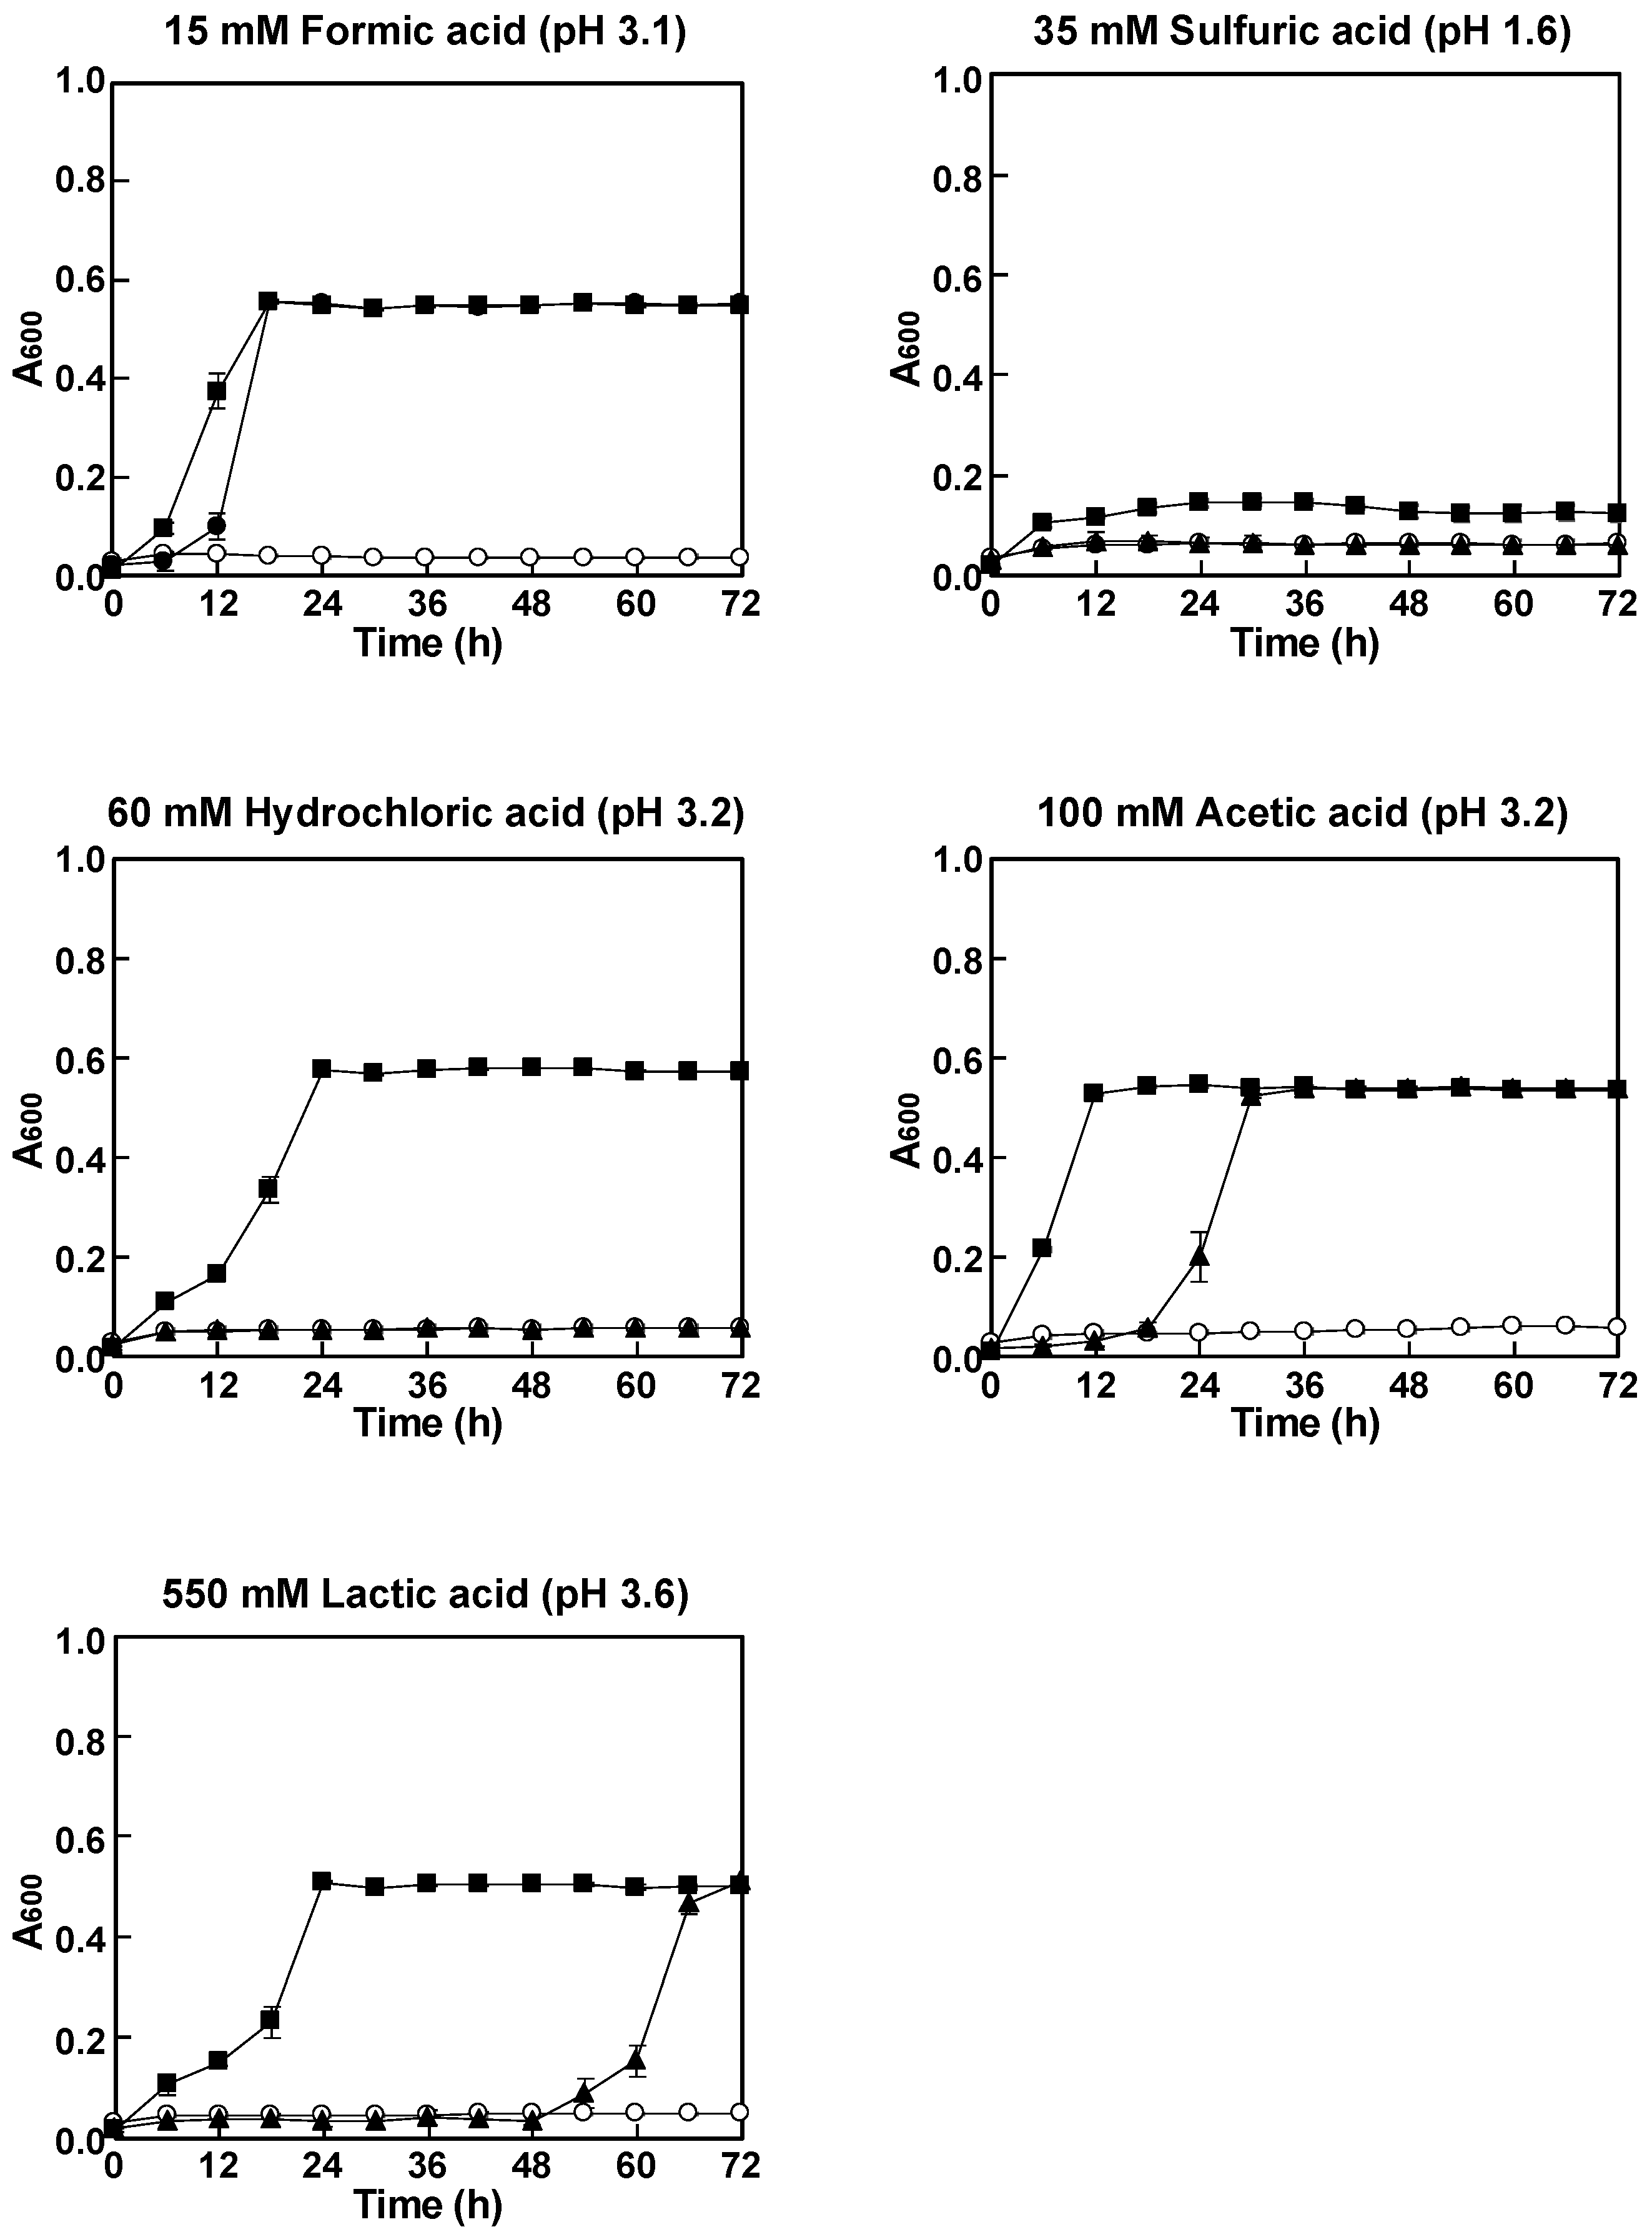
2.3. Aerobic Growth Experiment

The three yeast strains were pre-cultivated aerobically in SCD medium (pH 5.8) at 30 °C for 16 h. The cells were then washed with sterile water, and inoculated into an SCD medium containing the same concentration as a spot assay of acidic reagents (formic acid, sulfuric acid, hydrochloric acid, acetic acid, or lactic acid) in 96-well plates at an initial A600 of 0.02. All 96-well microplates were cultivated with mild agitation (150 rpm) at 30 °C, and the absorbance (A600) was measured using a HiTS microplate reader (Scinics, Tokyo, Japan) as described previously [13]. Cultivation was repeated three times.

2.4. RNA Preparation

The three yeast strains were cultivated separately in an SCD medium containing 60 mM hydrochloric acid at 30 °C for 12 h. To prepare sufficient amounts of RNA for transcriptome analysis, three yeast strains were grown in 100 mL of the medium. After the cells were washed with sterile water, the total RNA was extracted using Yeast Processing Reagent (Takara Bio, Shiga, Japan) and NucleoSpin RNA (Takara Bio) according to the manufacturer’s instructions. The concentration and quality of the resulting RNA were measured using a NanoDrop ND-1000 (Thermo Fisher Scientific, Waltham, MA, USA) and an Agilent 2100 Bioanalyzer (Agilent Technologies, Palo Alto, CA, USA), respectively.

2.5. Transcriptome Analysis

The extracted total RNA samples were subjected to quality tests, including assessments of the RNA concentration, RNA integrity number, as well as contamination by DNA, protein, and salt ions. Subsequently, the mRNA was enriched using magnetic beads with Oligo dT, then an appropriate amount of stop reagent was added to the fragments. A cDNA library was constructed using the mRNA as a template, and was sequenced using the BGISEQ-500 platform.
To obtain high-quality cleaned reads, quality control was carried out on the raw sequencing reads. After the reads containing 5% or more unknown bases, adaptor-polluted reads, and low-quality reads were removed, the remaining reads were used as clean reads for the subsequent experimental studies. De novo assembly was performed by Trinity v2.0.6 (Parameters: --min_contig_length150 --CPU8--min_kmer_cov3--min_glue3--bfly_opts’-V5--edge-thr=0.1-- stderr’) [14] using the cleaned reads. Differentially expressed genes (DEGs) were detected by PossionDis (Parameters: Fold Change ≥ 2.00, False discovery rate (FDR) ≤ 0.001) [15]. Functional annotation was performed using gene ontology (GO) enrichment (Parameters: default) [16] and Kyoto Encyclopedia of Genes and Genomes (KEGG; Parameters: default) [17] pathways. Based on the results of the functional annotation, DEGs were classified. After calculating the FDR for each p-value, the gene was enriched when the FDR was greater than 0.01.

3. Results and Discussion

3.1. Effect of Different Acids on Growth

To investigate the acid tolerance of P. kudriavzevii NBRC1279 and NBRC1664 as well as S. cerevisiae BY4742 (a control strain), these strains were grown on SCD plates containing multiple acids, including formic acid, sulfuric acid, hydrochloric acid, acetic acid, or lactic acid (Figure 1). Among the three strains, only P. kudriavzevii NBRC1664 grew well under all conditions, while P. kudriavzevii NBRC1279 showed weak growth, and S. cerevisiae BY4742 was unable to grow on all plates. These results indicated that the acid tolerance of P. kudriavzevii NBRC1664 was stronger than that of P. kudriavzevii NBRC1279.
To further investigate the acid tolerance of P. kudriavzevii NBRC1279 and NBRC1664 as well as S. cerevisiae BY4742, the strains were cultured aerobically in SCD media containing various acids (Figure 2). The reason why the acid concentrations in the liquid media for aerobic cultivation were the same as that in the spot assay was to further verify whether P. kudriavzevii NBRC1664 had better acid tolerance than P. kudriavzevii NBRC1279 even in liquid media at these acid concentrations. Under all conditions, the growth of S. cerevisiae BY4742 was markedly inhibited, which was consistent with the results of the spot assay (Figure 1). When cultured in SCD medium containing 15 mM formic acid, P. kudriavzevii NBRC1279 and NBRC1664 showed no growth inhibition. When cultured in SCD medium containing 100 mM acetic acid or 550 mM lactic acid, P. kudriavzevii NBRC1279 and NBRC1664 showed similar growth curves, although the time to reach the stationary phase differed. In contrast, when cultured in SCD medium containing 60 mM hydrochloric acid or 35 mM sulfuric acid, P. kudriavzevii NBRC1279 showed slight growths (the A600 values increased to about 0.07), while P. kudriavzevii NBRC1664 showed more growth in the medium containing 60 mM hydrochloric acid than in that containing 35 mM sulfuric acid. P. kudriavzevii NBRC1664 showed faster growth rates than P. kudriavzevii NBRC1279, except in the medium with 550 mM lactic acid (Table 1). Notably, the growth rate of P. kudriavzevii NBRC1664 was more than 16-fold higher than that of P. kudriavzevii NBRC1279 in SCD medium with 60 mM hydrochloric acid. In any event, P. kudriavzevii NBRC1664 grew better than P. kudriavzevii NBRC1279 on these acidic media.
Based on the observed growth phenotypes (Figure 1), growth curves (Figure 2), and growth rates (Table 1), P. kudriavzevii NBRC1279 and NBRC1664 were shown to have superior acid tolerance compared to S. cerevisiae BY4742. Moreover, it appears that P. kudriavzevii NBRC1664 has higher acid tolerance than P. kudriavzevii NBRC1279 because P. kudriavzevii NBRC1664 showed remarkable growths in the presence of inorganic acids such as hydrochloric acid and sulfuric acid and the time to reach the stationary phase is short in the presence of organic acids. A higher yield of ethanol is expected using P. kudriavzevii NBRC1664 than P. kudriavzevii NBRC1279 when performing SSF with acid-based pretreatment methods, which is consistent with the results of our previous study that carried out SSF with particles from Japanese cedar or eucalyptus as raw materials [7]. Thus, in the future, we will use the P. kudriavzevii NBRC1664 strain to develop SSF with acid-based pretreatment methods.

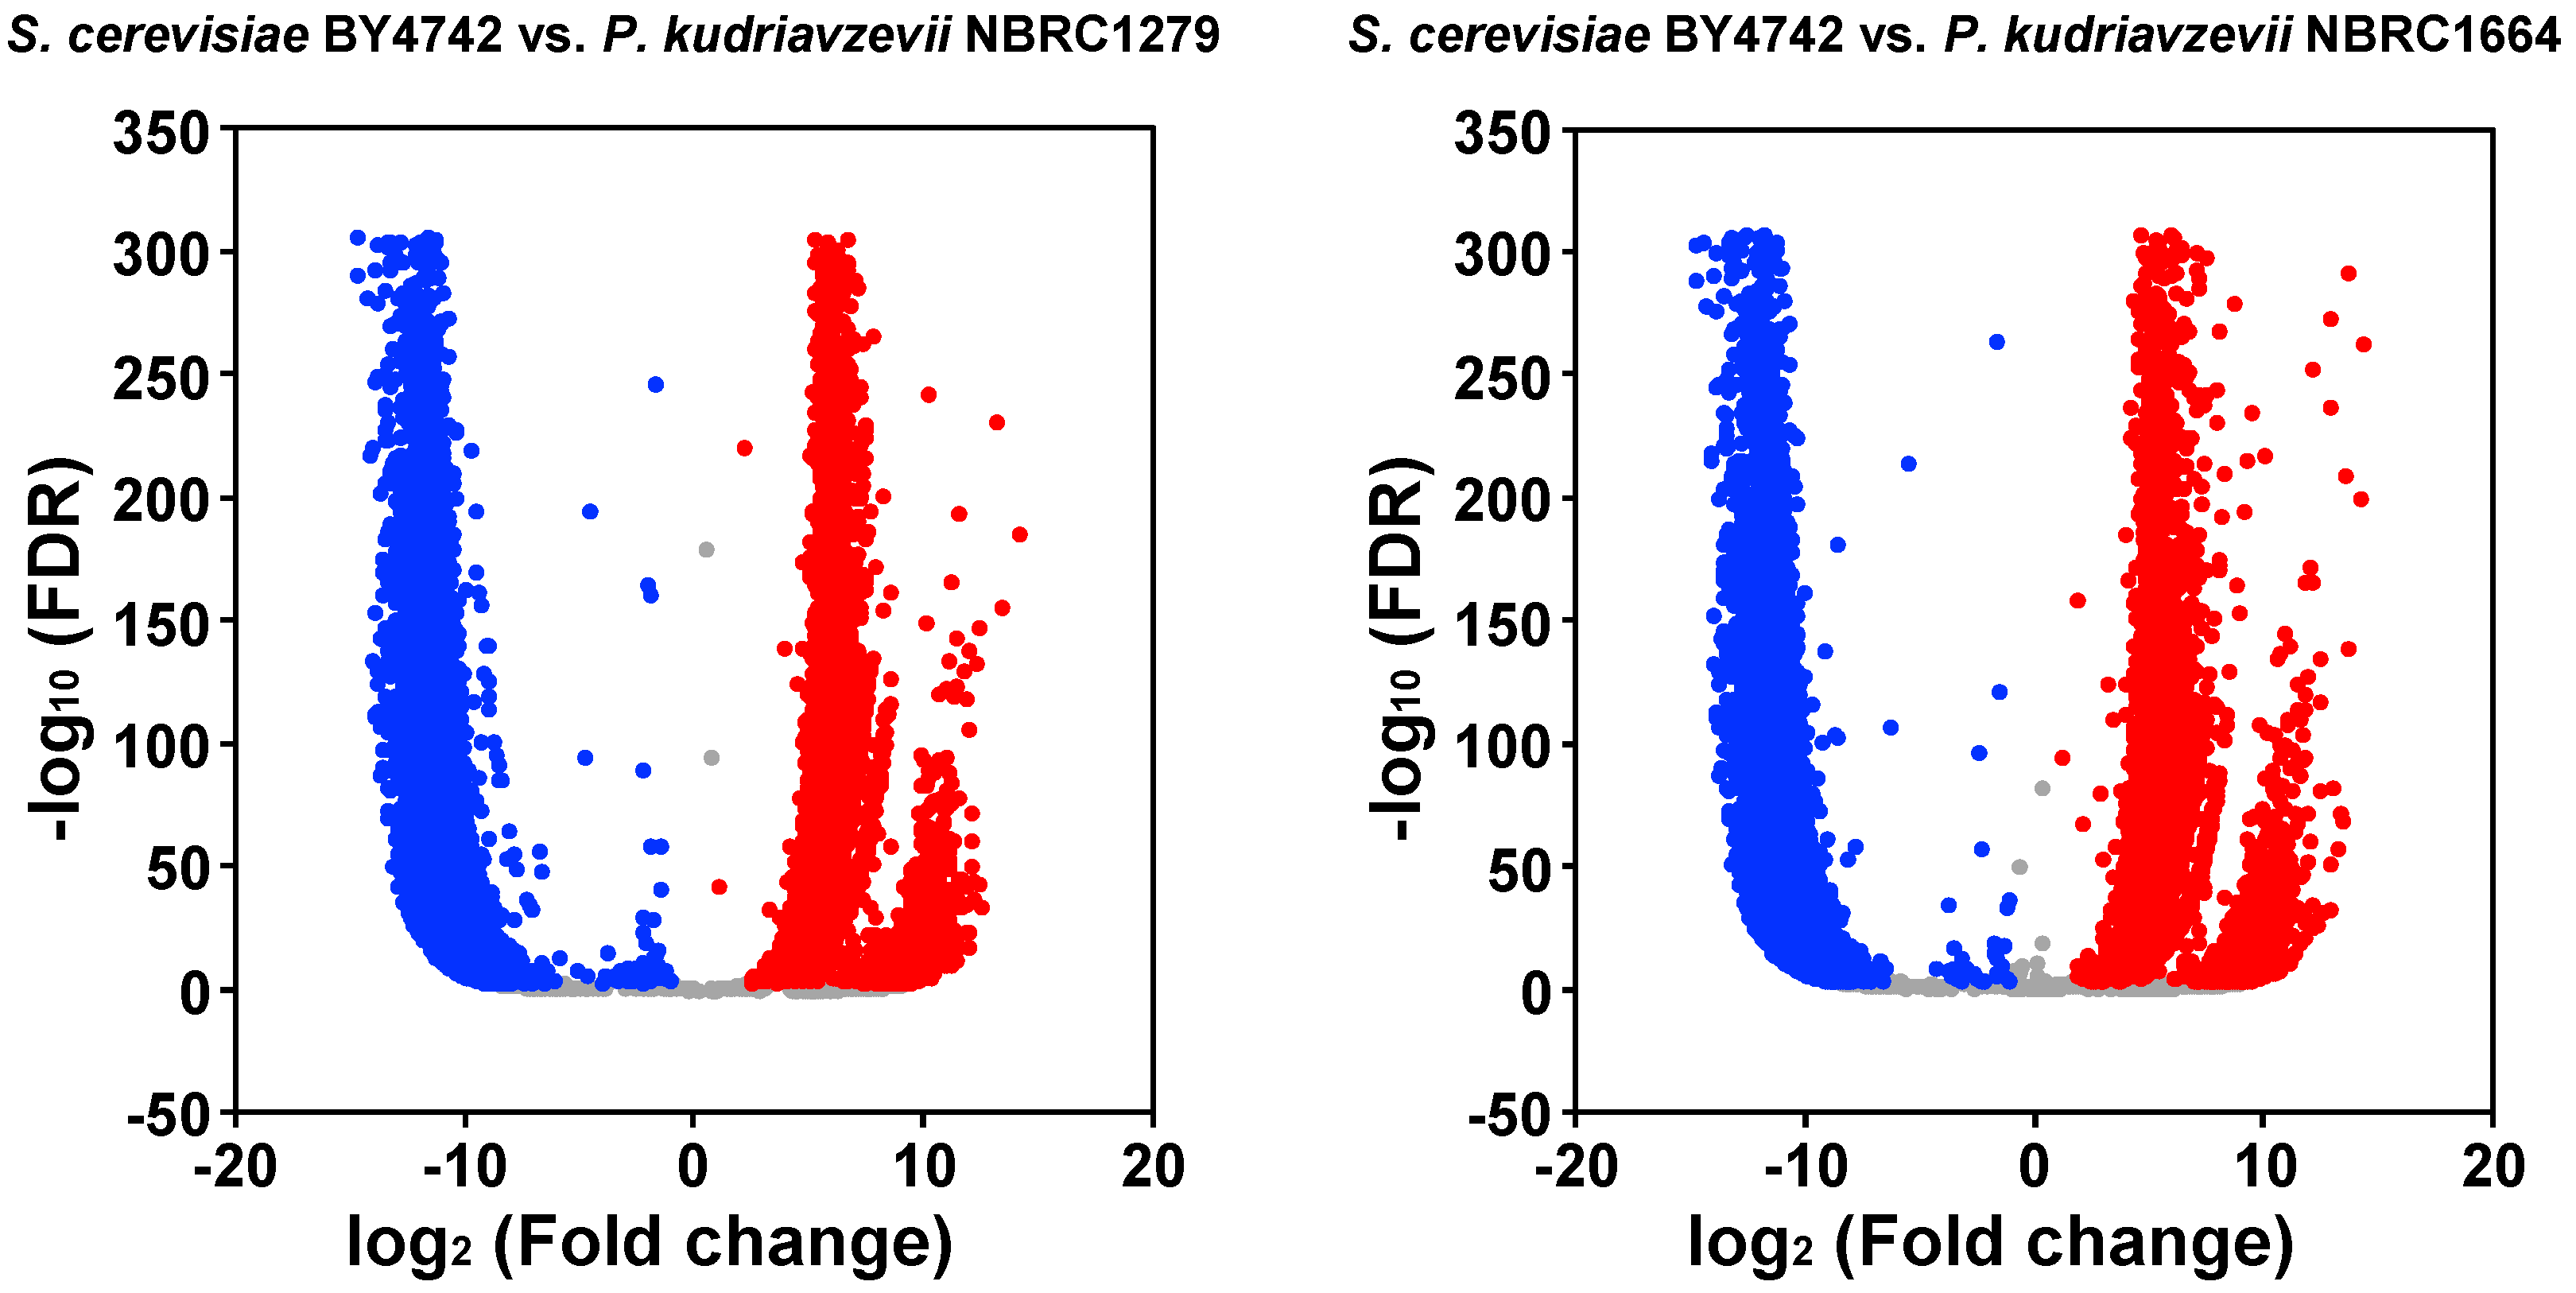
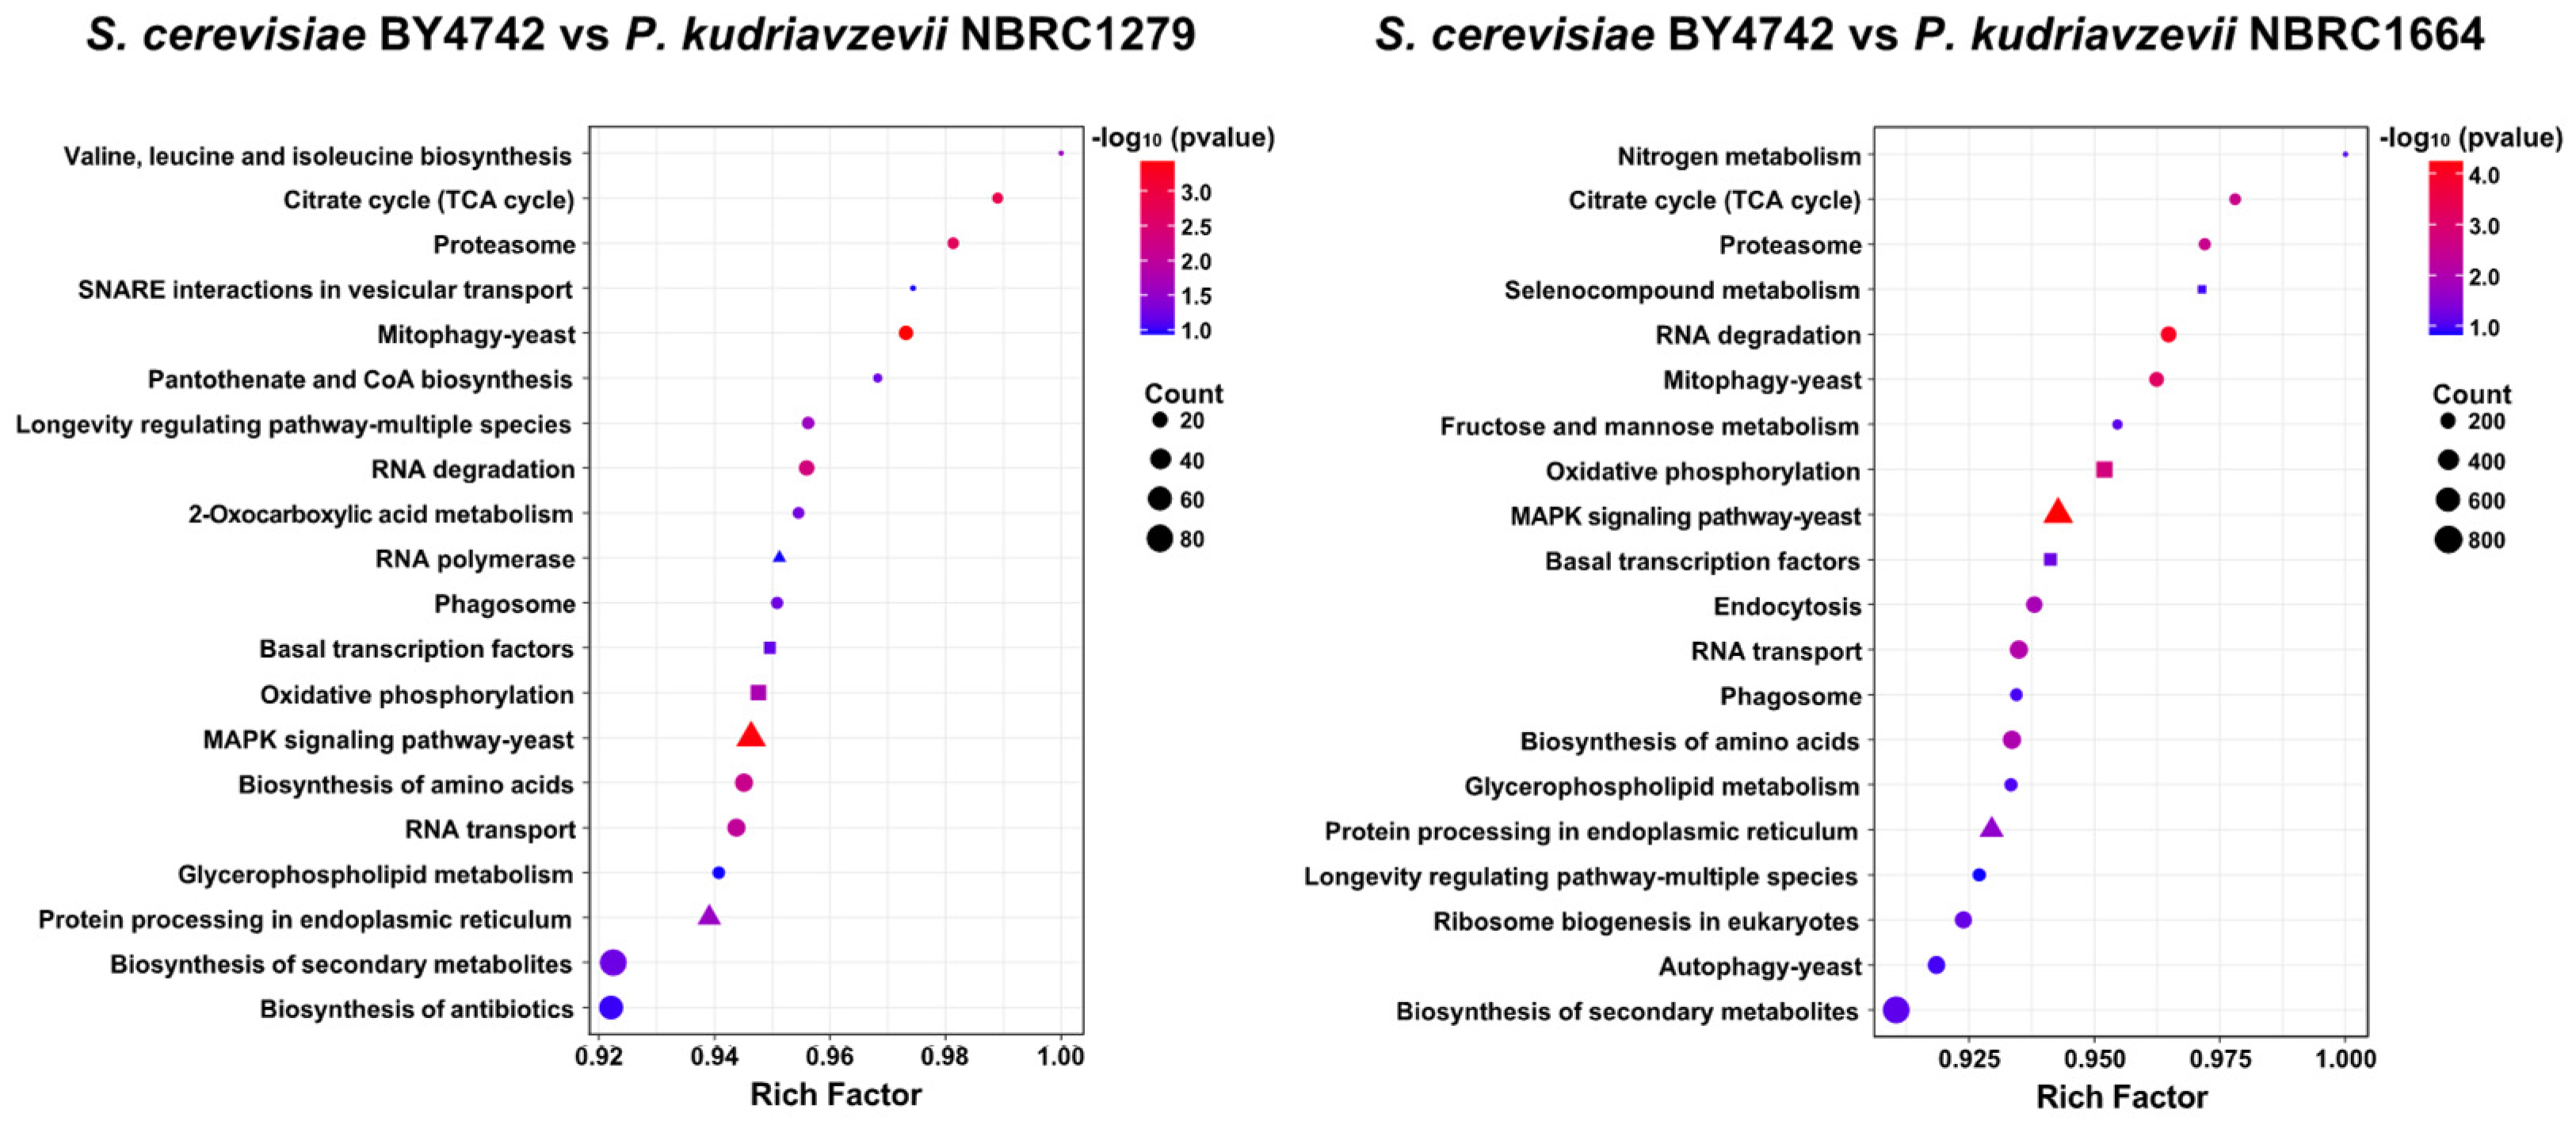
3.2. Transcriptome Analysis of Yeast Strains under Hydrochloric Acid Stress

To investigate the differences in the acid tolerance mechanism under acid stress of P. kudriavzevii NBRC1279 and NBRC1664, the three yeast strains cultured in SCD media containing 60 mM hydrochloric acid were used for transcriptome analyses (Figure 3) because hydrochloric acid made the most significant differences in growth phenotypes (Figure 1), growth curves (Figure 2) and growth rates (Table 1) among the acids used in our experiment. Furthermore, hydrochloric acid is used in the pretreatment method of particles from lignocellulosic biomass and as a pH adjustment solution for fermentation of ethanol at the industrial level. Therefore, we thought that it would be advantageous to perform a comprehensive analysis of genes related to acid tolerance between P. kudriavzevii NBRC1279 and NBRC1664 using hydrochloric acid as a representative acid in this experiment.
In total, 15,644 DEGs with significantly different expression levels were identified between S. cerevisiae BY4742 and P. kudriavzevii NBRC1279; 5633 were up-regulated DEGs, and 10,011 were down-regulated DEGs. Similarly, 15,338 DEGs were identified between S. cerevisiae BY4742 and P. kudriavzevii NBRC1644; 5349 were up-regulated DEGs and 9989 were down-regulated DEGs.
Subsequently, to obtain functional information on the DEGs, we performed GO enrichment analysis, which provides three types of descriptions for gene products, namely, biological process (BP), cellular component (CC), and molecular function (MF). Using the GO enrichment analysis data, KEGG pathway analysis was carried out (Figure 4). From the comparisons of S. cerevisiae BY4742 vs. P. kudriavzevii NBRC1279 and S. cerevisiae BY4742 vs. P. kudriavzevii NBRC1664, 14 enriched pathways were identified to be in common for both P. kudriavzevii NBRC1279 and NBRC1664, namely, pathways related to BP [“basal transcription factors”, “biosynthesis of amino acids”, “biosynthesis of secondary metabolites”, “citrate cycle (TCA cycle)”, “glycerophospholipid metabolism”, “longevity regulating pathway-multiple species”, “mitophagy-yeast”, “phagosome”, “proteasome”, “RNA degradation”, and “RNA transport”], CC (“MAPK signaling pathway-yeast”, and “protein processing in endoplasmic reticulum”), and MF (“oxidative phosphorylation”). In particular, “MAPK signaling pathway-yeast” was significantly enriched (p-value < 0.00045).
In yeast cells, the MAPK signaling pathway is activated through a cascade of three sequentially activated kinases when the cells are exposed to environmental stress, resulting in the up-regulation of transcription factors and the expression of specific sets of genes to respond to the stress. For example, in S. cerevisiae cells, the MAPK signaling pathway is involved in cell-wall integrity, hyperosmotic adaptation, mating response, pseudohyphal development, and sporulation [18,19]. In the draft DNA genomes of P. kudriavzevii NBRC1279 and NBRC1664, the gene sets for the MAPK signaling pathway are conserved, which indicates that both strains have a similar mechanism of acid tolerance when compared to the mechanisms of other known yeasts.

3.3. Involvement of the HOG Pathway in Acid Stress Tolerance

The high osmolarity glycerol (HOG) pathway is one of the most well-studied MAPK pathways [18]. When the dissolved solute concentration in the extracellular medium is higher than the internal osmotic pressure in the cell, in the absence of mechanisms to restore osmotic balance, cell growth becomes severely inhibited, which can lead to cell death. As a means of counteracting extracellular hypertonic stress, yeast cells increase the synthesis of glycerol through the HOG pathway to increase the internal osmotic density. The HOG pathway consists of two upstream osmotic sensors (SLN1 and SHO1), and a downstream MAPK cascade (SSK2/SSK22 and STE11 MAPKKK, PBS2 MAPKK, and HOG1 MAPK) [19]. In response to osmostress, signals are transduced from Sln1 and Sho1, which are integrated by Pbs2 to activate HOG1. Ultimately, the activated HOG proteins are rapidly translocated into the nucleus, where they promote the expression of osmo-responsive genes through several transcription factors. To examine the differences between P. kudriavzevii NBRC1279 and NBRC1664, the expression levels of genes related to the HOG pathway were compared between the two strains (Table 2).
When cultivated in SCD medium containing 60 mM hydrochloric acid, Hkr1, Sho1, Ste20, Ste11, Ste50, Pbs2, Hog1, Sln1, Ypd1, Ssk1, Ssk2, Smp1, and Gpd1 were up-regulated in both P. kudriavzevii NBRC1279 and NBRC1664. This indicated that the acid tolerance of P. kudriavzevii NBRC1279 and NBRC1664 may be attributable to the increased expression levels of the genes involved in the HOG pathway. When the log2-transformed fold change values of the up-regulated genes of both strains, except for Gpd1, the values of P. kudriavzevii NBRC1279 were 1.1–1.5-fold higher than those of P. kudriavzevii NBRC1664. Similarly, the log2-transformed fold change value of GAS1 of P. kudriavzevii NBRC1279 was 1.3-fold higher than that of P. kudriavzevii NBRC1664. Those results indicated that P. kudriavzevii may show acid resistance through the utilization of the HOG pathway proteins, in addition to the expression of GAS1. On the other hand, the phenotypic analyses showed that P. kudriavzevii NBRC1664 has a superior acid tolerance compared to P. kudriavzevii NBRC1279. Based on those results, we considered that P. kudriavzevii NBRC1664 may show superior acid tolerance by the expression of Gpd1.

3.4. Effect of Gpd1 Expression on Acid Tolerance

When acetic acid-responsive transcriptional activators, which are encoded as HAA1 or PPR1, are overexpressed in S. cerevisiae cells, acetic acid tolerance is enhanced [20,21,22]. Similarly, ethanol production is improved under acetic acid stress by overexpression of SET, which encodes histone methyltransferase [22]. HAA1, PPR1 and SET are conserved in both P. kudriavzevii NBRC1279 and NBRC1664, but those genes were down-regulated under the hydrochloric acid stress (Table 3). Those results indicated that the acetic acid tolerance mechanisms reported in S. cerevisiae may be present in both P. kudriavzevii NBRC1279 and NBRC1664, but those mechanisms do not function in both strains under the hydrochloric acid stress.
To further examine the mechanism for the higher acid tolerance of P. kudriavzevii NBRC1664, we focused on Gpd1. Gpd1 encodes NAD+-dependent glycerol-3-phosphate dehydrogenase, which catalyzes the production of glycerol-3-phosphate as the precursor of glycerol [23]. Glycerol is an important metabolite of alcoholic fermentation, and it is involved in the maintenance of the intracellular osmotic balance needed for growth under acid stress. According to Remize et al., in the S. cerevisiae cells, overexpression of Gpd1 decreases ethanol production and increases glycerol production [24]. Overexpression of Gpd1 may alter cell numbers in response to the acetaldehyde concentration during the growth phase, which promotes glycerol production. A similar character is confirmed in ΔAld6 mutants of S. cerevisiae, the glycerol concentration was enhanced by overexpression of Gpd1 [25]. On the other hand, when the native strain and ΔGpd1 mutants of S. cerevisiae were cultured in YNB media containing 100 g/L glucose as a carbon source, the glycerol concentration of ΔGpd1 mutants was 1.8-fold lower than that of the native strain, whereas the ethanol concentration of ΔGpd1 mutants was 1.1-fold higher than that of native strain [26]. Thus, an increase in Gdp1-expression levels is considered one of the means to increase intracellular glycerol levels. Comparison of the up-regulated DEGs between P. kudriavzevii NBRC1279 and NBRC1664 showed that the log2-transformed fold change in the expression level of Gpd1 was 1.3-fold higher in P. kudriavzevii NBRC1664 than in P. kudriavzevii NBRC1279 (Table 1). However, the amino acid sequence of NAD+-dependent glycerol-3-phosphate dehydrogenase is the same in P. kudriavzevii NBRC1279 and NBRC1664, which indicated that the catalytic capacity of both enzymes is the same. Thus, we considered that the superior acid tolerance of P. kudriavzevii NBRC1664 is attributed to the increase in Gdp1-expression levels. Moreover, P. kudriavzevii NBRC1664 may have higher promoter activity than P. kudriavzevii NBRC1279 for the expression of Gpd1. To identify the promoter of P. kudriavzevii NBRC1664, we are now planning to perform a reporter analysis of the promoter region by the methods of Fujii et al. [27]. In this method, the promoter sequence can be identified by measuring the enzyme activity using each promoter sequence prepared to any length. We consider that a metabolic flux analysis is also needed. Based on a metabolic flux analysis, it may be possible to increase glycerol production without decreasing ethanol production by reducing the balance of carbon influx into other metabolic pathways [28]. These results will be described elsewhere in the future.

4. Conclusions

In this study, using the acids that are produced when lignocellulosic biomass is hydrolyzed, we performed a spot assay and growth experiment to examine the acid tolerance of P. kudriavzevii NBRC1279 and NBRC1664 as well as S. cerevisiae BY4742. Among the three strains, only P. kudriavzevii NBRC1664 could grow well under all conditions, and it showed the fastest growth rates. In particular, P. kudriavzevii NBRC1664 showed the fastest growth rate in SCD medium containing 60 mM hydrochloric acid or 35 mM sulfuric acid. To examine the differences in the acid tolerance mechanism of P. kudriavzevii NBRC1279 and NBRC1664, a transcriptome analysis was carried out using cells cultivated under acid stress with 60 mM hydrochloric acid, and the results revealed that “MAPK signaling pathway-yeast” was significantly enriched in both strains. Among the MAPK signaling pathways, we found that the expression levels of most genes involved in the HOG pathway were up-regulated, and that the log2-transformed fold change in the expression level of Gpd1 was 1.3-fold higher in P. kudriavzevii NBRC1664 than in P. kudriavzevii NBRC1279 (Table 1), which may be among the main reasons why P. kudriavzevii NBRC1664 showed higher tolerance to various acids.

Author Contributions

Conceptualization, H.A. and A.M.; methodology, H.A. and A.M.; validation, H.A.; formal analysis, H.A. and A.M.; investigation, H.A. and A.M.; resources, A.M.; data curation, H.A.; writing—original draft preparation, H.A.; writing—review and editing, H.A. and A.M.; visualization, H.A.; supervision, H.A. and A.M. All authors have read and agreed to the published version of the manuscript.

Funding

This study was supported by a Grant-in-Aid for Scientific Research (C) (to A.M.) (KAKENHI Grant Number JP22K04848) from the Japan Society for the Promotion of Science (JSPS).

Institutional Review Board Statement

Not applicable.

Informed Consent Statement

Not applicable.

Data Availability Statement

Draft genome sequences of P. kudriavzevii NBRC1279 and NBRC1664 were deposited in the DDBJ/EMBL/GenBank databases under the accession numbers BHFO01000001–BHFO01000079 and BHFP01000001–BHFP01000076, respectively.

Acknowledgments

The authors thank BGI Genomics Co., Ltd., for their assistance in conducting the bioinformatics analysis. We also thank Zheng Xiahong for technical support.

Conflicts of Interest

The authors declare no conflict of interest.

References

  1. Tse, T.J.; Wiens, D.J.; Reaney, M.J.T. Production of Bioethanol—A Review of Factors Affecting Ethanol Yield. Fermentation 2021, 7, 268. [Google Scholar] [CrossRef]
  2. Robak, K.; Balcerek, M. Review of second generation bioethanol production from residual biomass. Food Technol. Biotechnol. 2018, 56, 174–187. [Google Scholar] [CrossRef]
  3. Agbor, V.B.; Cicek, N.; Sparling, R.; Berlin, A.; Levin, D.B. Biomass pretreatment: Fundamentals toward application. Biotechnol. Adv. 2011, 29, 675–685. [Google Scholar] [CrossRef] [PubMed]
  4. Matsushika, A.; Inoue, H.; Murakami, K.; Takimura, O.; Sawayama, S. Bioethanol production performance of five recombinant strains of laboratory and industrial xylose-fermenting Saccharomyces cerevisiae. Bioresour. Technol. 2009, 100, 2392–2398. [Google Scholar] [CrossRef] [PubMed]
  5. Matsushika, A.; Watanabe, S.; Kodaki, T.; Makino, K.; Inoue, H.; Murakami, K.; Takimura, O.; Sawayama, S. Expression of protein engineered NADP+-dependent xylitol dehydrogenase increases ethanol production from xylose in recombinant Saccharomyces cerevisiae. Appl. Microbiol. Biotechnol. 2008, 81, 243–255. [Google Scholar] [CrossRef] [PubMed]
  6. Fujii, T.; Murakami, K.; Endo, T.; Fujimoto, S.; Minowa, T.; Matsushika, A.; Yano, S.; Sawayama, S. Bench-scale bioethanol production from eucalyptus by high solid saccharification and glucose/xylose fermentation method. Bioprocess Biosyst. Eng. 2014, 37, 749–754. [Google Scholar] [CrossRef] [Green Version]
  7. Akita, H.; Goshima, T.; Suzuki, T.; Itoiri, Y.; Kimura, Z.; Matsushika, A. Application of Pichia kudriavzevii NBRC1279 and NBRC1664 to simultaneous saccharification and fermentation for bioethanol production. Fermentation 2021, 7, 83. [Google Scholar] [CrossRef]
  8. Akita, H.; Yusoff, M.Z.M.; Fujimoto, S. Preparation of oil palm empty fruit bunch hydrolysate. Fermentation 2021, 7, 81. [Google Scholar] [CrossRef]
  9. Matsushika, A.; Negi, K.; Suzuki, T.; Goshima, T.; Hoshino, T. Identification and characterization of a novel Issatchenkia orientalis GPI-anchored protein, IoGas1, required for resistance to low pH and salt stress. PLoS ONE 2016, 11, e0161888. [Google Scholar] [CrossRef] [PubMed] [Green Version]
  10. Li, Y.; Wu, Z.; Li, R.; Miao, Y.; Weng, P.; Wang, L. Integrated transcriptomic and proteomic analysis of the acetic acid stress in Issatchenkia orientalis. J. Food Biochem. 2020, 44, e13203. [Google Scholar] [CrossRef] [PubMed]
  11. Du, H.; Fu, Y.; Deng, N.; Xu, Y. Transcriptional profiling reveals adaptive response and tolerance to lactic acid stress in Pichia kudriavzevii. Foods 2022, 11, 2725. [Google Scholar] [CrossRef] [PubMed]
  12. Matsushika, A.; Oguri, E.; Sawayama, S. Evolutionary adaptation of recombinant shochu yeast for improved xylose utilization. J. Biosci. Bioeng. 2010, 110, 102–105. [Google Scholar] [CrossRef] [PubMed]
  13. Matsushika, A.; Suzuki, T.; Goshima, T.; Hoshino, T. Evaluation of Saccharomyces cerevisiae GAS1 with respect to its involvement in tolerance to low pH and salt stress. J. Biosci. Bioeng. 2017, 124, 164–170. [Google Scholar] [CrossRef]
  14. Grabherr, M.G.; Haas, B.J.; Yassour, M.; Levin, J.Z.; Thompson, D.A.; Amit, I.; Adiconis, X.; Fan, L.; Raychowdhury, R.; Zeng, Q.; et al. Full-length transcriptome assembly from RNA-Seq data without a reference genome. Nat. Biotechnol. 2011, 29, 644–652. [Google Scholar] [CrossRef] [PubMed] [Green Version]
  15. Soneson, C.; Delorenzi, M. A comparison of methods for differential expression analysis of RNA-seq data. BMC Bioinform. 2013, 14, 91. [Google Scholar] [CrossRef] [Green Version]
  16. Young, M.D.; Wakefield, M.J.; Smyth, G.K.; Oshlack, A. Gene ontology analysis for RNA-seq: Accounting for selection bias. Genome Biol. 2010, 11, R14. [Google Scholar] [CrossRef] [PubMed] [Green Version]
  17. Kanehisa, M.; Araki, M.; Goto, S.; Hattori, M.; Hirakawa, M.; Itoh, M.; Katayama, T.; Kawashima, S.; Okuda, S.; Tokimatsu, T.; et al. KEGG for linking genomes to life and the environment. Nucleic Acids Res. 2008, 36, D480–D484. [Google Scholar] [CrossRef]
  18. Chen, R.E.; Thorner, J. Function and regulation in MAPK signaling pathways: Lessons learned from the yeast Saccharomyces cerevisiae. Biochim. Biophys. Acta 2007, 1773, 1311–1340. [Google Scholar] [CrossRef] [Green Version]
  19. Furukawa, K.; Hohmann, S. Synthetic biology: Lessons from engineering yeast MAPK signalling pathways. Mol. Microbiol. 2013, 88, 5–19. [Google Scholar] [CrossRef]
  20. Sakihama, Y.; Hasunuma, T.; Kondo, A. Improved ethanol production from xylose in the presence of acetic acid by the overexpression of the HAA1 gene in Saccharomyces cerevisiae. J. Biosci. Bioeng. 2015, 119, 297–302. [Google Scholar] [CrossRef]
  21. Inaba, T.; Watanabe, D.; Yoshiyama, Y.; Tanaka, K.; Ogawa, J.; Takagi, H.; Shimoi, H.; Shima, J. An organic acid-tolerant HAA1-overexpression mutant of an industrial bioethanol strain of Saccharomyces cerevisiae and its application to the production of bioethanol from sugarcane molasses. AMB Express 2013, 3, 74. [Google Scholar] [CrossRef] [PubMed] [Green Version]
  22. Zhang, M.M.; Zhao, X.Q.; Cheng, C.; Bai, F.W. Improved growth and ethanol fermentation of Saccharomyces cerevisiae in the presence of acetic acid by overexpression of SET5 and PPR1. Biotechnol. J. 2015, 10, 1903–1911. [Google Scholar] [CrossRef] [PubMed]
  23. Oliveira, B.M.; Barrio, E.; Querol, A.; Pérez-Torrado, R. Enhanced enzymatic activity of glycerol-3-phosphate dehydrogenase from the cryophilic Saccharomyces kudriavzevii. PLoS ONE 2014, 9, e87290. [Google Scholar] [CrossRef] [Green Version]
  24. Remize, F.; Roustan, J.L.; Sablayrolles, J.M.; Barre, P.; Dequin, S. Glycerol overproduction by engineered Saccharomyces cerevisiae wine yeast strains leads to substantial changes in by-product formation and to a stimulation of fermentation rate in stationary phase. Appl. Environ. Microbiol. 1999, 65, 143–149. [Google Scholar] [CrossRef] [PubMed] [Green Version]
  25. Cambon, B.; Monteil, V.; Remize, F.; Camarasa, C.; Dequin, S. Effects of GPD1 overexpression in Saccharomyces cerevisiae commercial wine yeast strains lacking ALD6 genes. Appl. Environ. Microbiol. 2006, 72, 4688–4694. [Google Scholar] [CrossRef] [Green Version]
  26. Michnick, S.; Roustan, J.L.; Remize, F.; Barre, P.; Dequin, S. Modulation of glycerol and ethanol yields during alcoholic fermentation in Saccharomyces cerevisiae strains overexpressed or disrupted for GPD1 encoding glycerol 3-phosphate dehydrogenase. Yeast 1997, 13, 783–793. [Google Scholar] [CrossRef]
  27. Fujii, T.; Inoue, H.; Ishikawa, K.; Hoshino, T. Deletion analysis of GH7 endoglucanase gene (cel7B) promoter region in a Talaromyces cellulolyticus ligD-disrupted strain. Appl. Biochem. Biotechnol. 2017, 183, 1516–1525. [Google Scholar] [CrossRef]
  28. Yuzawa, T.; Shirai, T.; Orishimo, R.; Kawai, K.; Kondo, A.; Hirasawa, T. 13C-metabolic flux analysis in glycerol-assimilating strains of Saccharomyces cerevisiae. J. Gen. Appl. Microbiol. 2021, 67, 142–149. [Google Scholar] [CrossRef]
Figure 1. Growth phenotypes of the three yeast strains in the presence of different acids. Aliquots (2 mL) of 3-fold serial dilutions (starting from the absorbance of 0.1 at 600 nm) of the wild-type S. cerevisiae BY4742 and P. kudriavzevii NBRC1279 and NBRC1664 were spotted onto SCD plates containing various acids (15 mM formic acid, 35 mM sulfuric acid, 60 mM hydrochloric acid, 100 mM acetic acid, and 550 mM lactic acid). The various plates then were incubated at 30 °C for 2, 3, 6, 2, or 3 days, respectively.
Fermentation 09 00559 g001
Figure 2. Growth curves of the three yeast strains cultured in the presence of various acids. The aerobic growth of P. kudriavzevii NBRC1279 (closed triangles) and NBRC1664 (closed squares) as well as S. cerevisiae BY4742 (open circles) in SCD medium containing 15 mM formic acid, 35 mM sulfuric acid, 60 mM hydrochloric acid, 100 mM acetic acid, and 550 mM lactic acid was measured over 72 h by assaying the absorbance at 600 nm. Error bars indicate the standard error (n = 3). Values are the means of three independent experiments.
Fermentation 09 00559 g002
Figure 3. Volcano plot of the DEGs. The y and x axes show the −log10-transformed significance and log2-transformed fold change, respectively. Red, blue, and gray points represent up-regulated DEGs, down-regulated DEGs, and not significantly differently regulated DEGs, respectively.
Fermentation 09 00559 g003
Figure 4. KEGG pathway enrichment analysis. The y and x axes show the KEGG pathways and rich factors, respectively. The depth of the colors shows the significance of the enrichment. The pathways related to BP, CC, and MF are indicated as circles, triangles, and squares, respectively.
Fermentation 09 00559 g004
Table 1. Growth rates (h−1) of the three yeast strains at log phase when cultured in the presence of various acids.
Yeast15 mM Formic Acid35 mM Sulfuric Acid60 mM Hydrochloric Acid100 mM Acetic Acid550 mM Lactic Acid
S. cerevisiae BY47420.00280.00800.00400.00640.0010
P. kudriavzevii NBRC12790.2430.00490.005700.1610.138
P. kudriavzevii NBRC16640.2880.01770.09450.5200.132
Table 2. Differentially expressed genes related to the HOG pathway in strains cultured with 60 mM hydrochloric acid.
S. cerevisiae BY4742 vs. P. kudriavzevii NBRC1279S. cerevisiae BY4742 vs. P. kudriavzevii NBRC1664
GeneDescriptionRegulationlog2 (Fold Change)Regulationlog2 (Fold Change)
Hkr1Signaling mucin HKR1Up7.27Up4.73
Sho1Osmosensor SHO1Up4.75Up3.39
Opy2Protein OPY2Down−11.5Down−11.5
Cdc42Cell division control
protein 42
Down−11.3Down−11.3
Cdc24Cell division control
protein 24
Down−10.3Down−11.2
Ste20p21-Activated kinase1Up5.53Up4.97
Cla4Serine/threonine-protein kinase CLA4Up6.07Down−10.4
Ste11Mitogen-activated protein kinase kinase kinaseUp5.85Up5.01
Ste50Protein STE50Up5.21Up4.43
Pbs2Mitogen-activated protein kinase kinaseUp10.1Up9.06
Hog1Mitogen-activated protein kinase HOG1Up6.55Up5.97
Sln1Sensor histidine kinase SLN1Up5.49Up4.75
Ypd1Phosphorelay intermediate protein YPD1Up5.54Up4.60
Ssk1Mitogen-activated protein kinase kinase kinase SSK1Up7.38Up6.56
Ssk2Mitogen-activated protein kinase kinase kinase SSK2Up6.46Up5.68
Ssk22Mitogen-activated protein kinase kinase kinase SSK22Down−10.3Down−10.3
Ptp2Tyrosine protein phosphatase PTP2Down−13.0Down−13.0
Ptp3Tyrosine protein phosphatase PTP3Down−9.93Down−9.93
Hot1High-osmolarity-induced transcription protein 1Down−10.1Down−10.1
Smp1Transcription factor SMP1Up6.38Up5.51
Gpd1NAD+-dependent glycerol-3-phosphate dehydrogenaseUp10.4Up13.1
Table 3. Differentially expressed genes related to acid tolerance mechanism in strains cultured with 60 mM hydrochloric acid.
S. cerevisiae BY4742 vs. P. kudriavzevii NBRC1279S. cerevisiae BY4742 vs. P. kudriavzevii NBRC1664
GeneDescriptionRegulationlog2 (Fold Change)Regulationlog2 (Fold Change)
HAA1Transcriptional activatorDown−11.9Down−11.9
PPR1Transcriptional activatorDown−10.3Down−9.1
SET1Histone methyltransferaseDown−10.2Down−10.1
Disclaimer/Publisher’s Note: The statements, opinions and data contained in all publications are solely those of the individual author(s) and contributor(s) and not of MDPI and/or the editor(s). MDPI and/or the editor(s) disclaim responsibility for any injury to people or property resulting from any ideas, methods, instructions or products referred to in the content.

