Communication

Pyruvic Acid Production from Sucrose by Escherichia coli Pyruvate Dehydrogenase Variants

by
W. Chris Moxley
1 and
Mark A. Eiteman
1,2,*
1
Department of Microbiology, University of Georgia, Athens, GA 30602, USA
2
School of Chemical, Materials and Biomedical Engineering, University of Georgia, Athens, GA 30602, USA
*
Author to whom correspondence should be addressed.
Fermentation 2023, 9(5), 478; https://doi.org/10.3390/fermentation9050478
Submission received: 28 March 2023 / Revised: 20 April 2023 / Accepted: 10 May 2023 / Published: 16 May 2023
(This article belongs to the Special Issue Microbial Biorefineries)

Abstract

:
Sucrose is an abundant, cheap, and renewable carbohydrate which makes it an attractive feedstock for the biotechnological production of chemicals. Escherichia coli W, one of the few safe E. coli strains able to metabolize sucrose, was examined for the production of pyruvate. The repressor for the csc regulon was deleted in E. coli W strains expressing a variant E1 component of the pyruvate dehydrogenase complex, and these strains were screened in a shake flask culture for pyruvate formation from sucrose. The pyruvate accumulated at yields of 0.23–0.57 g pyruvate/g sucrose, and the conversion also was accompanied by the accumulation of some fructose and/or glucose. Selected strains were examined in 1.25 L controlled batch processes with 40 g/L sucrose to obtain time–course formation of pyruvate and monosaccharides. Pyruvate re-assimilation was observed in several strains, which demonstrates a difference in the metabolic capabilities of glucose- and sucrose-grown E. coli cultures. An engineered strain expressing AceE[H106M;E401A] generated 50.6 g/L pyruvate at an overall volumetric productivity of 1.6 g pyruvate/L·h and yield of 0.68 g pyruvate/g sucrose. The results demonstrate that pyruvate production from sucrose is feasible with comparable volumetric productivity and yield to glucose-based processes.

1. Introduction

The biobased production of fuels and chemicals relies on the availability of inexpensive and renewable feedstocks. Glucose has predominantly been used as the carbon source for many microbial products such as ethanol, succinic acid, and lactic acid. Sucrose is an attractive alternative to glucose which can be directly recovered from renewable sugar cane or sugar beets with minimal processing, resulting in a lower cost than glucose in some parts of the world [1,2,3]. While the glucose metabolism in many bacteria, such as Escherichia coli, is well studied, sucrose metabolism is less understood. Only a few non-pathogenic wild-type E. coli strains are known to metabolize sucrose, including EC3132, B-62, and W [4,5,6]. Over the past two decades, E. coli has been engineered to produce several biochemicals from sucrose, including poly-3-hydroxybutyrate, 2,3-butanediol, 1,4-butanediol, succinate, D-lactate, and L-threonine [3,7,8,9,10,11].
E. coli W is the best-studied sucrose metabolizing strain [5,12,13,14], and it contains the csc regulon encoding four proteins: a transcriptional repressor (CscR), sucrose permease (CscB), invertase (CscA), and fructokinase (CscK). These csc genes allow E. coli W to metabolize sucrose efficiently to support high growth rates when the sucrose concentration is above 10 g/L, although deletion of the repressor coded by cscR improves growth at lower sucrose concentrations [4,5]. Additionally, E. coli W growing on sucrose generates minimal acetate, facilitating growth to high cell densities on a defined medium, making it an attractive strain for industrial applications [12,15].
Pyruvate is a key metabolic intermediate in glycolysis which is a commodity chemical and serves as an intermediate for the production of 2,3-butanediol, valine, alanine, and isoprenoids [8,16,17,18,19,20,21]. Pyruvate will accumulate in E. coli to nearly 80% yield from glucose using strains having a deletion or reduced expression of the pyruvate dehydrogenase complex (PDH) [21,22,23,24]. To the best of our knowledge, pyruvate accumulation has never been studied using sucrose as a carbon source. To this end, the goal of this study was to engineer E. coli W to accumulate pyruvate from sucrose. Deletions of poxB (pyruvate oxidase), ldhA (lactate dehydrogenase), ppsA (phosphoenolpyruvate synthase), and cscR (csc repressor protein) were incorporated into E. coli W. Additionally, the flux through PDH was reduced by the use of aceE variants [25]. Strains were evaluated for pyruvate production in batch and fed-batch processes using sucrose as the sole carbon source.

2. Materials and Methods

2.1. Strains and Genetic Modifications

Strains used in this study are shown in Table 1. Gene knockouts in E. coli W were constructed by methods previously described [26]. Knockouts were selected on plates supplemented with kanamycin. Gene knockouts were verified by polymerase chain reaction (PCR). Primers used to amplify the kanR cassette from pKD4 targeting cscR were previously described (Sabri et al., 2013 [5]). Forward (5′-GATACAGCGGCAGCACAATGATCC-3′) and reverse (5′-CGAACATTACGGATTACAGCTCG-3′) primers external to the target gene were used to confirm proper chromosomal integration.

2.2. Media

Cultures were routinely grown on Lysogeny Broth (LB) during strain construction, while aceE mutants were grown on TYA medium containing (per L) 10 g tryptone, 5 g NaCl, 1 g yeast extract, and 1 g sodium acetate trihydrate [21]. As needed, antibiotics were included in the media (final concentration): ampicillin (100 µg/mL), kanamycin (40 µg/mL), and chloramphenicol (20 µg/mL).
The defined basal medium to which carbon/energy sources were added contained (per L): 8 g NH4Cl, 1.2 g KH2PO4, 1.0 g K2HPO4, 2.0 g K2SO4, 0.6 g MgSO4·7H2O, 0.25 mg ZnSO4·7H2O, 0.125 mg CuCl2·2H2O, 1.25 mg MnSO4·H2O, 0.875 mg CoCl2·6H2O, 0.06 mg H3BO3, 0.25 mg Na2MoO4·2H2O, 5.5 mg FeSO4·7H2O, 20 mg Na2EDTA·2H2O, 20 mg citric acid, 20 mg thiamine·HCl. Shake flask cultures contained 20.9 g/L 3-[N-morpholino]propanesulfonic acid (100 mM MOPS), while batch and fed-batch processes contained 25 mM MOPS. Thiamine was filter sterilized, and other medium components were autoclaved in compatible mixtures, combined and then adjusted to pH 7.1 with 20% (w/v) KOH.

2.3. Shake Flask Experiments

A single colony from an LB plate was used to inoculate 3 mL TYA. After 6–10 h of growth, this culture was used to inoculate 3 mL of basal medium with 5 g/L sucrose to an initial optical density at 600 nm (OD) of 0.05. After 8–12 h of growth, this culture was used to inoculate three 125 mL baffled shake flasks containing 25 mL of basal medium with 20 g/L sucrose at an initial pH of 7 to an initial OD of 0.02. Some cultures were supplemented with 2.34 g/L Na(CH3COO)·3H2O (1.0 g/L acetate). All cultures were grown at 37 °C on a rotary shaker at 225 rpm. Flasks were sampled for extracellular metabolite concentrations after 6–10 h of growth.

2.4. Batch Processes

A single colony from an LB plate was used to inoculate 3 mL TYA. After 6–10 h, this culture was used to inoculate a 250 mL shake flask containing 50 mL of basal medium with 20 g/L sucrose to an OD of 0.02, with some cultures supplemented with 9.36 g/L Na(CH3COO)·3H2O (4.0 g/L acetate) as described. When the shake flask culture reached an OD of 1.5–2, the 50 mL were used to inoculate a 2.5 L bioreactor (Bioflo 2000, New Brunswick Scientific Co., New Brunswick, NJ, USA) containing 1.2 L basal medium with 40 g/L sucrose and acetate as described. Duplicate batch processes were conducted with an initial agitation of 400 rpm and at 37 °C. Air and/or oxygen-supplemented air was sparged at 1.25 L/min to maintain dissolved oxygen (DO) concentration above 40% saturation. The pH was controlled at 7.0 using 30% (w/v) KOH or 20% (w/v) H2SO4. Antifoam 204 (Sigma, St. Louis, MO, USA) was used to control foaming.

2.5. Fed-Batch Processes

Duplicate fed-batch processes using MEC1363 were initiated as the batch processes, using nominally 40 g/L sucrose and 8 g/L acetate. When the DO increased suddenly, indicating acetate depletion, a 33% (w/v) acetic acid solution was fed continuously at 3 mL/h. Twice when sucrose had decreased to approximately 20 g/L, a 40 mL solution containing 37.5 g sucrose was added into the bioreactor. The dissolved oxygen concentration, pH and temperature were controlled for the batch processes.

2.6. Analytical Methods

The optical density at 600 nm (OD, UV-650 spectrophotometer, Beckman Instruments, San Jose, CA, USA) was used to monitor cell growth. Samples were routinely frozen at −20 °C for further analysis, and thawed samples were centrifuged (4 °C, 10,000× g for 10 min) and filtered (0.45 µm nylon, Acrodisc, Pall Corporation, Port Washington, NY, USA). Liquid chromatography with refractive index detection was used to quantify pyruvate, sucrose, fructose, glucose, and other organic products with sulfuric acid (5.5 mN) as eluent at a column temperature of 30 °C [28], conditions which minimized hydrolysis of sucrose.

3. Results

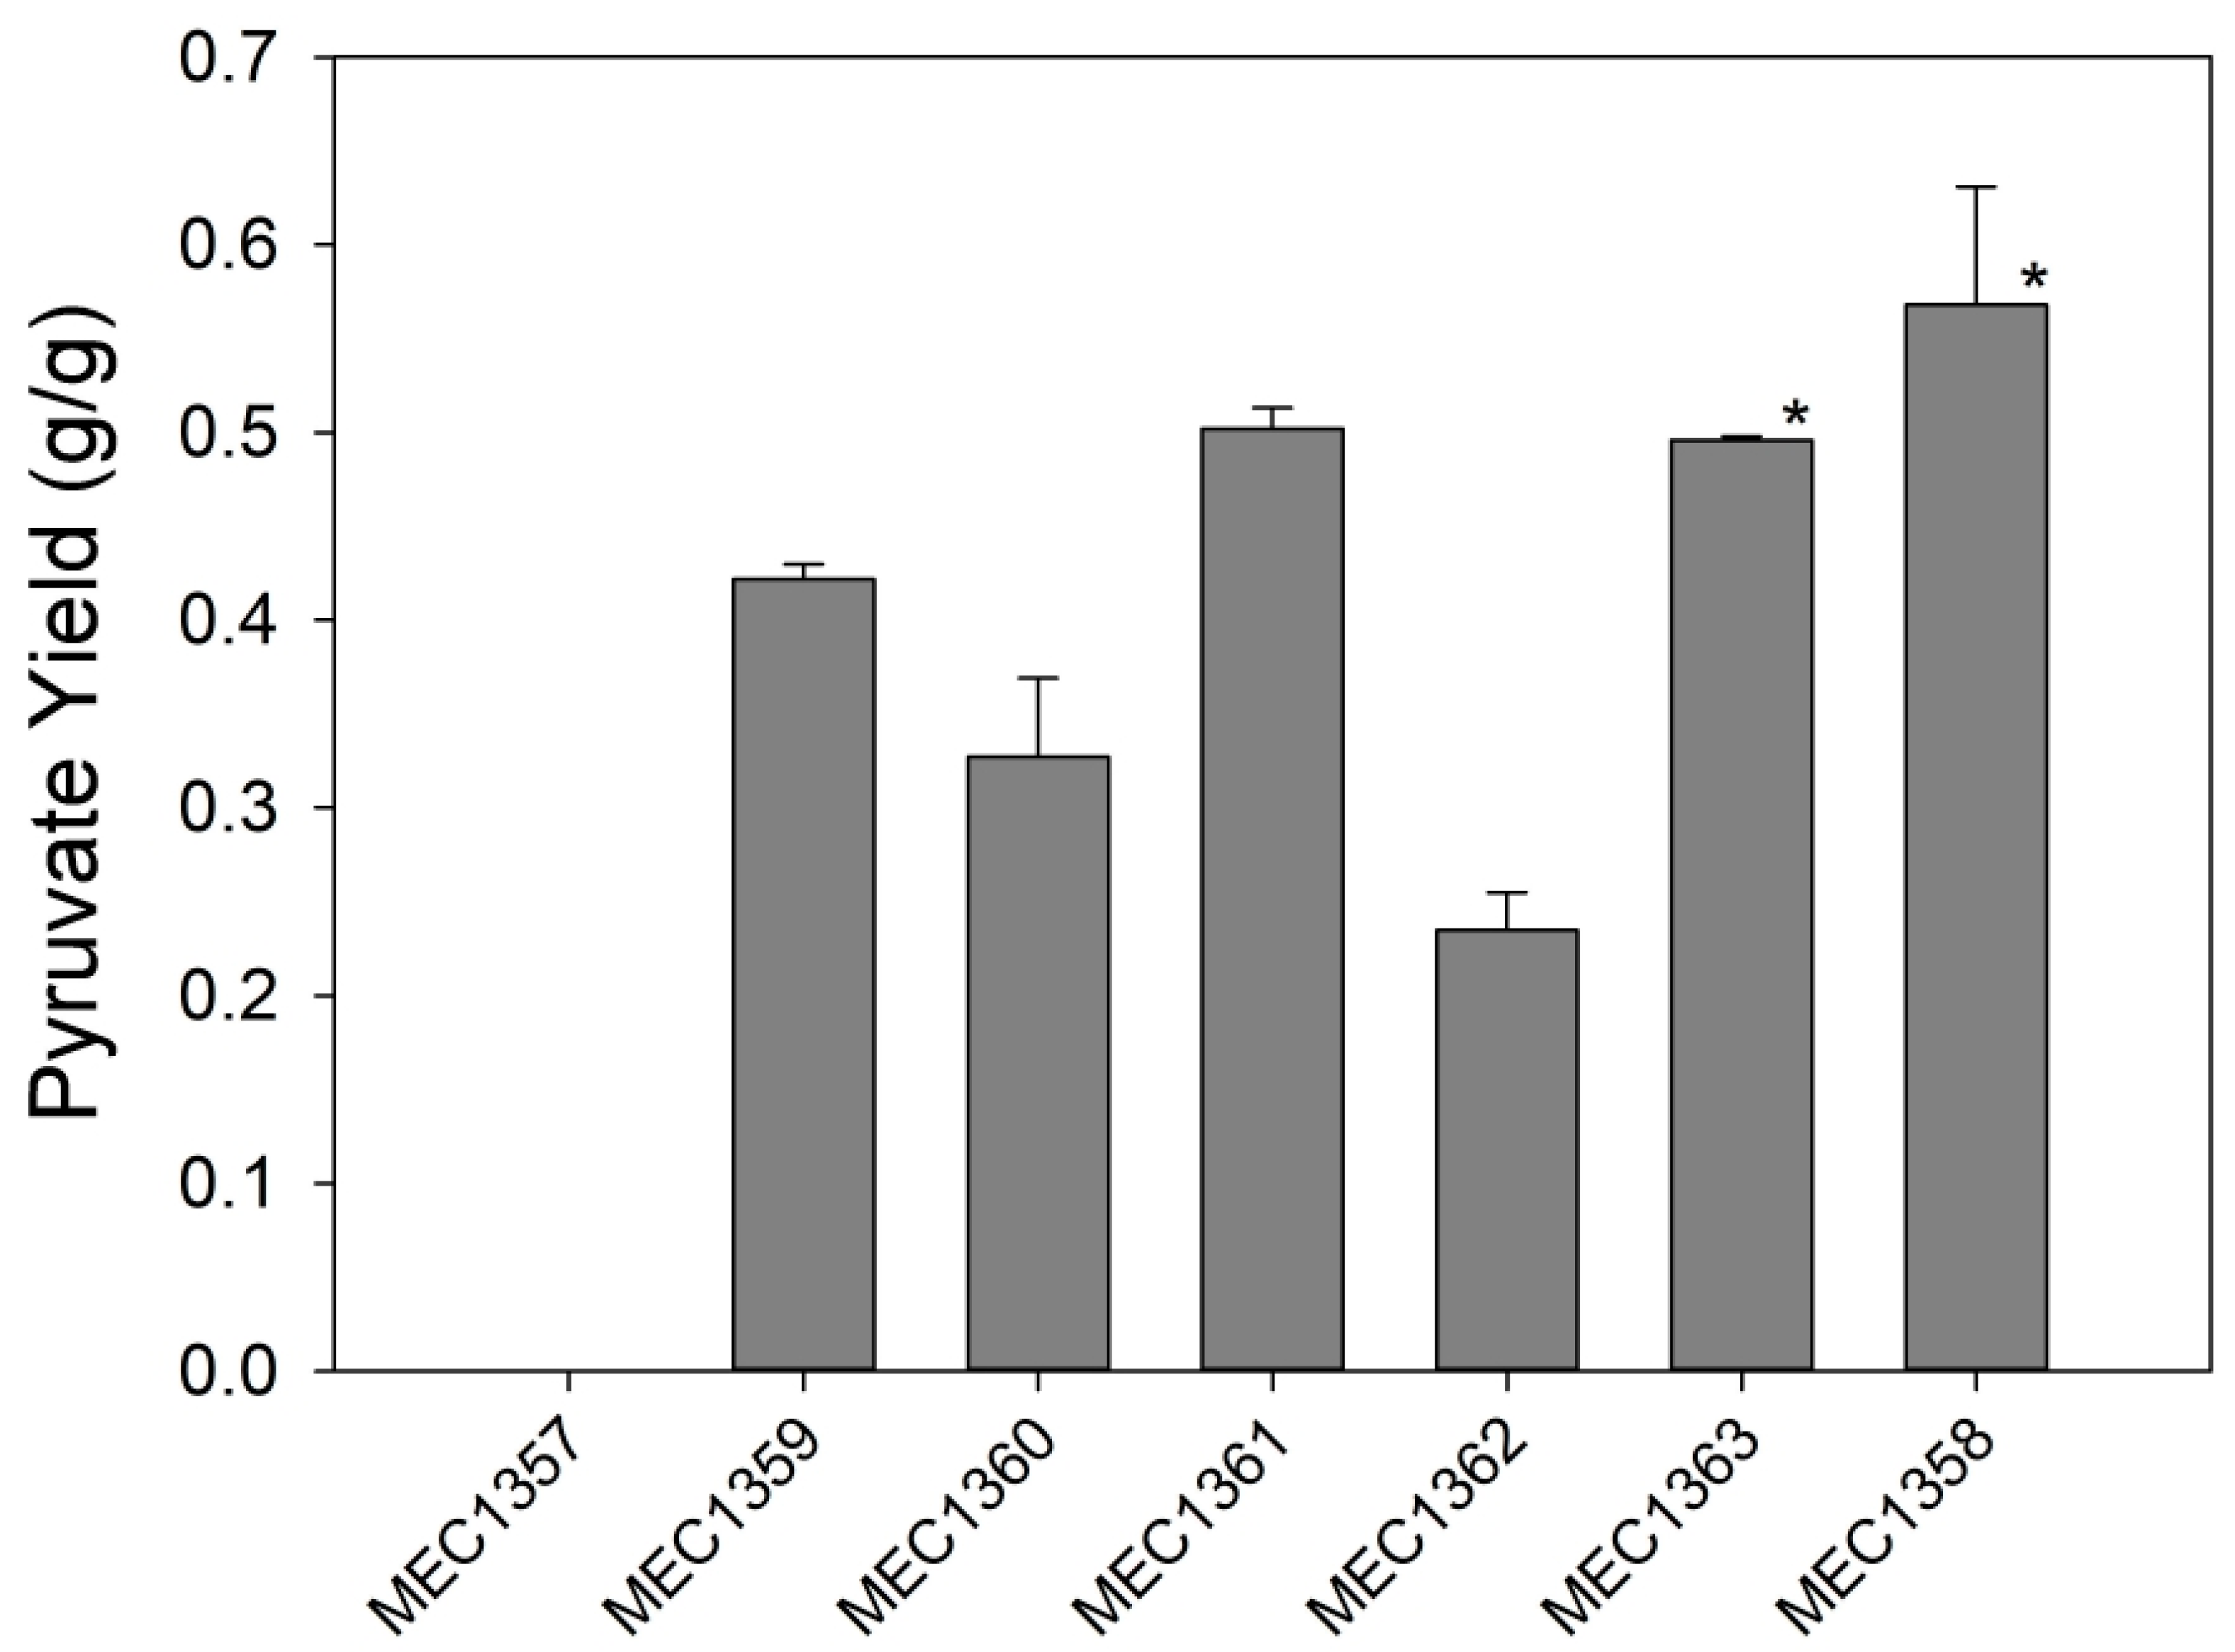
3.1. Variant Strain Screening for Pyruvate Yield

Previous studies have shown that E. coli ldhA poxB ppsA containing variant aceE alleles accumulate pyruvate when grown on glucose as the sole carbon source [25]. The aceE gene encodes the E1 component of the PDH complex, which is the rate limiting step of pyruvate oxidation to acetyl CoA in aerobically grown E. coli [29]. Based on this principle, E. coli W, which natively contains the csc regulon expressing non-phosphotransferase system (PTS) sucrose catabolism proteins, was engineered to produce pyruvate from sucrose.
To assess pyruvate formation from sucrose, several E. coli W ldhA poxB ppsA cscR strains containing variant aceE alleles were screened for pyruvate yield in triplicate shake flasks using 20 g/L sucrose as the sole carbon source (Figure 1). MEC1357, containing the wild-type aceE, did not accumulate pyruvate. Of the variants able to grow on sucrose as the sole carbon source, MEC1361 (AceE[V169A;P190Q;F532L]) obtained the highest pyruvate yield at 0.50 ± 0.01 g/g and MEC1362 (AceE[H106M]) obtained the lowest pyruvate yield of 0.23 ± 0.02 g/g. MEC1360 (AceE[N276S;R465C;V668A;Y696N]) and MEC1359 (AceE[H106V]) obtained pyruvate yields of 0.33 ± 0.04 g/g and 0.42 ± 0.01 g/g, respectively.
MEC1358, containing an aceE deletion, and MEC1363 (AceE[H106M;E401A]) were unable to grow on sucrose as the sole carbon source, necessitating the supplementation of acetate to support biomass formation. MEC1358 achieved a slightly higher pyruvate yield (0.57 ± 0.06 g/g) compared to MEC1363 (0.50 ± 0.00 g/g). Because some sucrose remained in the culture, and fructose and/or glucose were detected in all samples, the yield was calculated based on the mass of pyruvate formed divided by the mass of monosaccharide units consumed.
The control strain expressing the wild-type AceE protein (MEC1357) accumulated a small quantity of fructose (only) at a yield of 0.02 g/g. MEC1358, MEC1359, MEC1360, and MEC1363 accumulated approximately equal molar quantities of glucose and fructose at yields of 0.08–0.10 g/g (each). MEC1361 and MEC1362 accumulated approximately equal molar quantities of glucose and fructose at yields of 0.04 g/g and 0.20 g/g, respectively. Because the calculated monosaccharide “yields” represent a single time point in growth, they do not represent the full extent of accumulation and re-assimilation. Therefore, time course studies were planned to understand the accumulation of monosaccharides and pyruvate under controlled conditions.

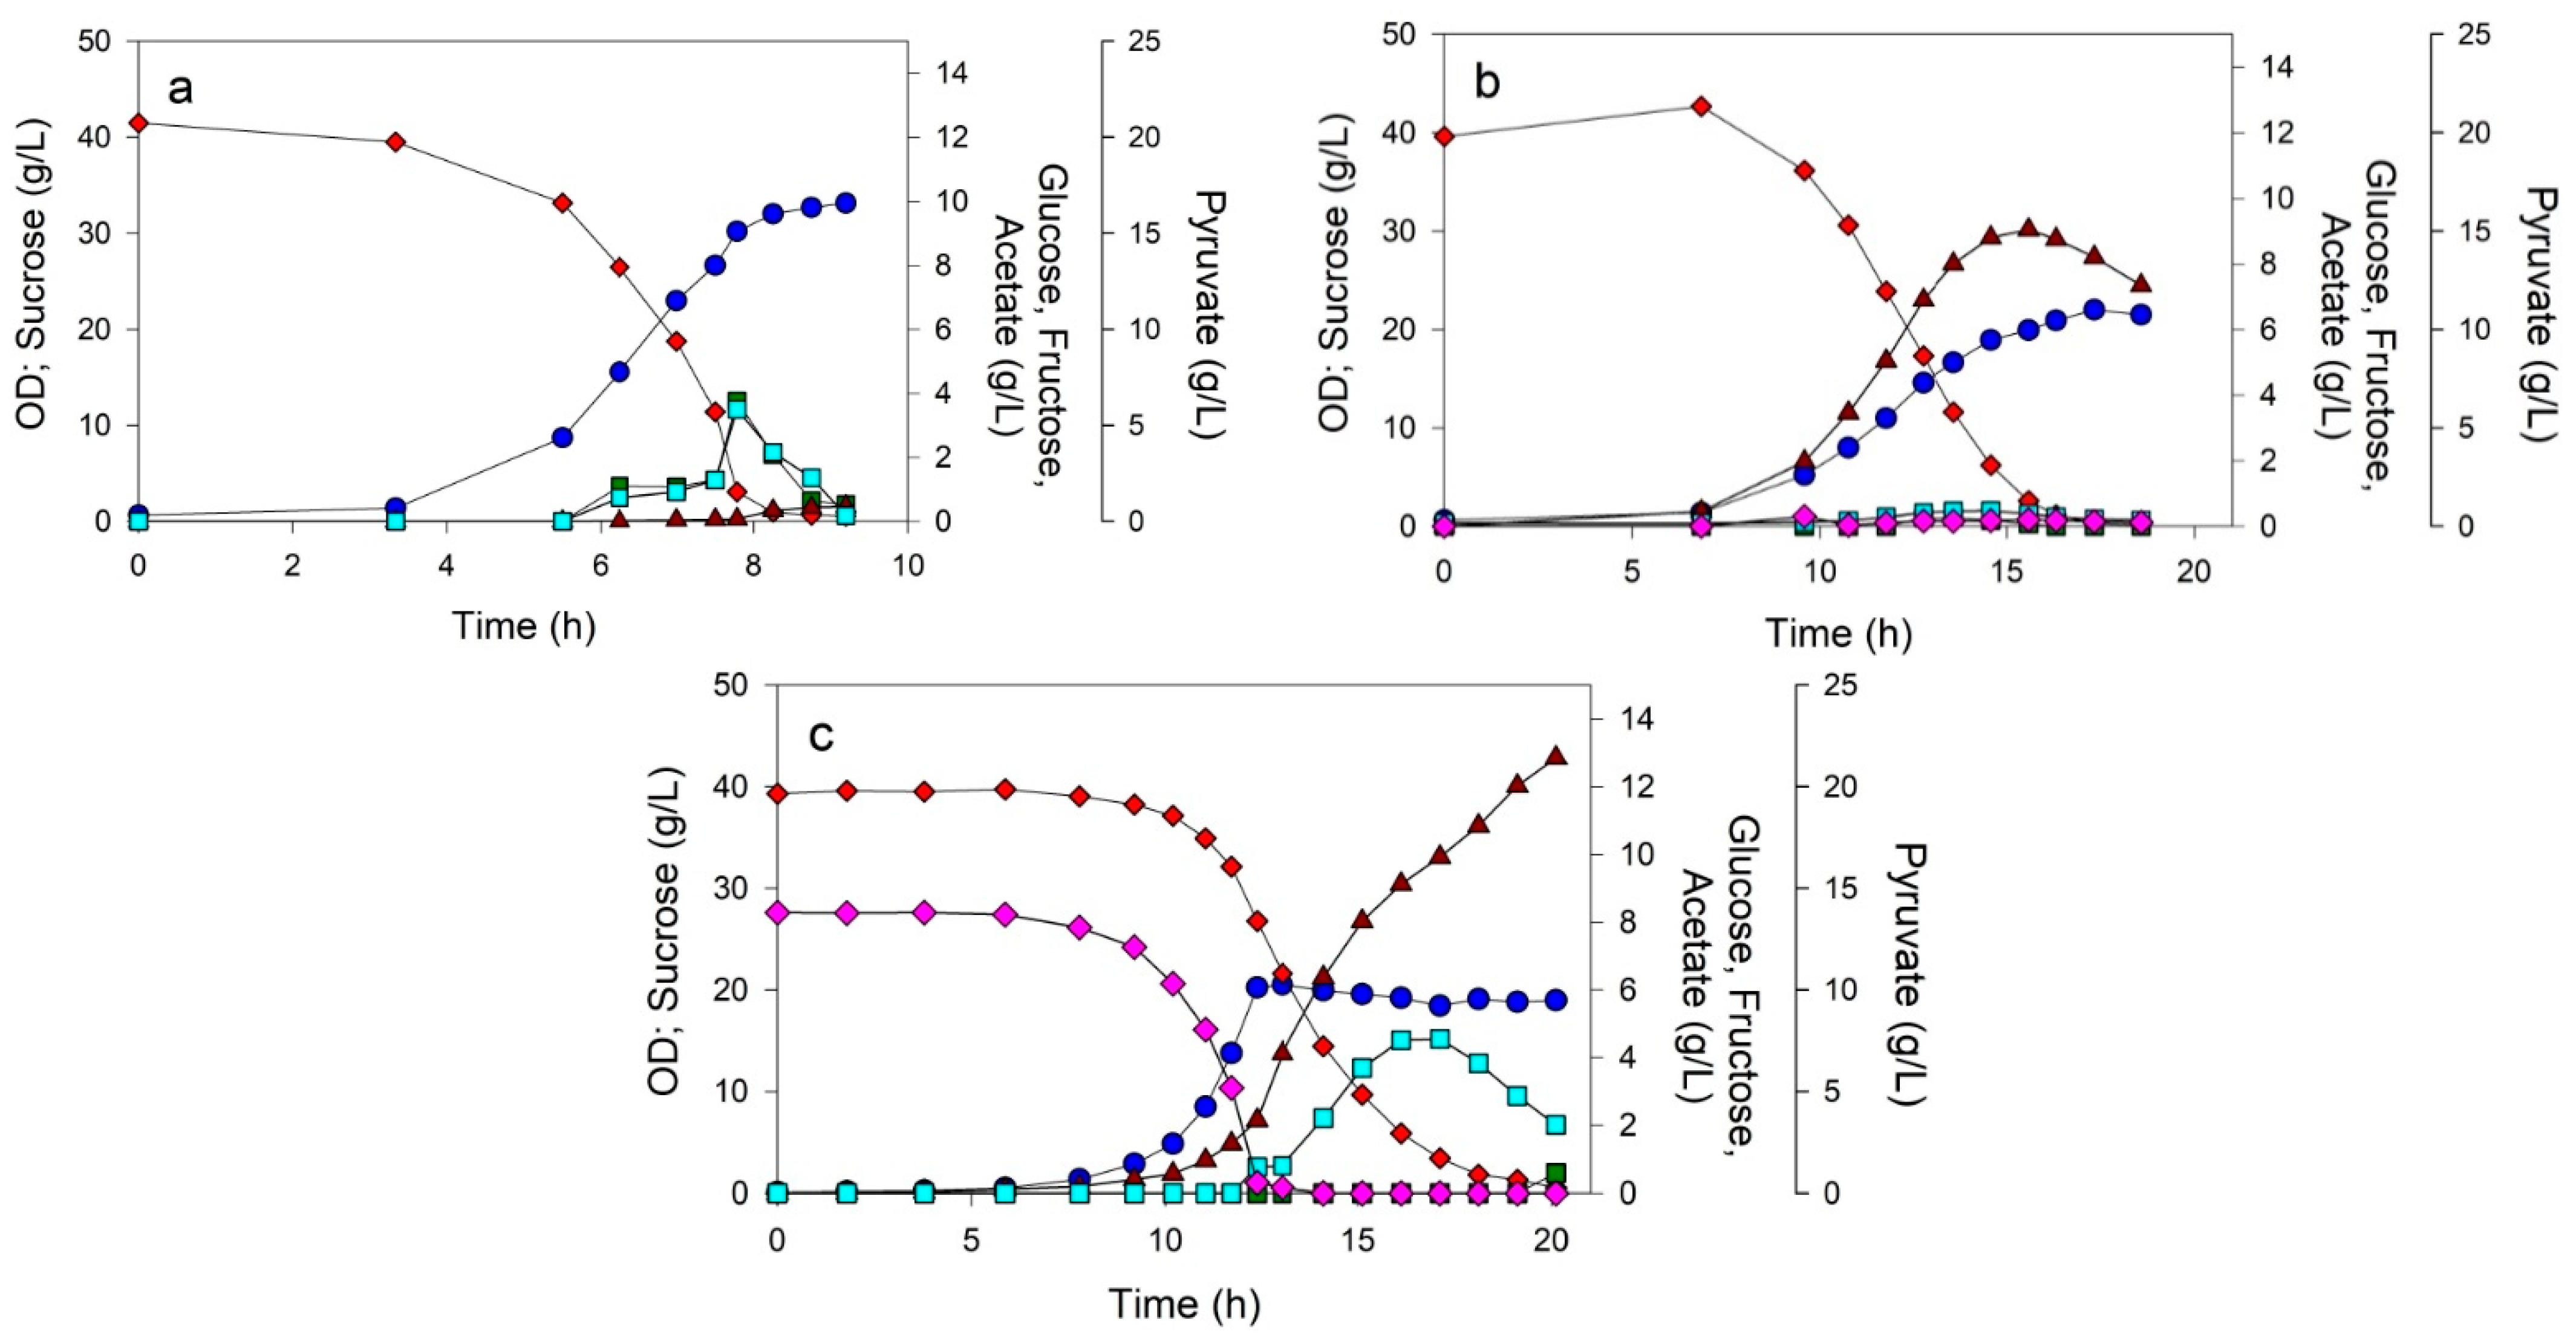
3.2. Controlled Batch Processes

Maximal sucrose uptake rate and glycolytic flux has been previously observed when the sucrose concentration is higher than 10 g/L [12]. Thus, selected strains were studied in controlled batch culture using 40 g/L sucrose (Figure 2). MEC1357 achieved a growth rate of 0.79 h−1 and accumulated 0.60 g/L pyruvate in 9 h (Figure 2a). Glucose and fructose accumulated in approximately equimolar amounts, reaching a maximum concentration of 4 g/L at about 8 h, before being metabolized completely within 2 h. MEC1361, which generated the greatest pyruvate yield from sucrose under shake flask experiments (Figure 1), achieved a growth rate of 0.43 h−1 and accumulated 15.1 g/L pyruvate in 16 h before pyruvate was slowly re-assimilated (Figure 2b). In this case, glucose and fructose accumulated to 0.3 g/L and 0.5 g/L, respectively.
As noted above, MEC1363 has a severe mutation in AceE necessitating acetate supplementation to support reasonable biomass formation, but this strain is preferred over the ΔaceE strain (MEC1358) because the variant provides greater pyruvate productivity from glucose (Moxley et al., 2020). When MEC1363 was grown on 40 g/L sucrose and 8 g/L acetate, the acetate was depleted in 13 h, at which time pyruvate concentration was 2 g/L, and the concentrations of fructose and glucose were both less than 1 g/L (Figure 2c). During the next 7 h after acetate depletion, pyruvate accumulated to 21.8 ± 0.6 g/L with a productivity of 2.3 ± 0.1 g/L·h and yield of 0.71 ± 0.02 g/g. In this case, pyruvate was not re-assimilated, and surprisingly only fructose accumulated, not glucose. The maximum fructose concentration was about 4 g/L at 17 h, and fructose was metabolized slowly as sucrose became depleted.

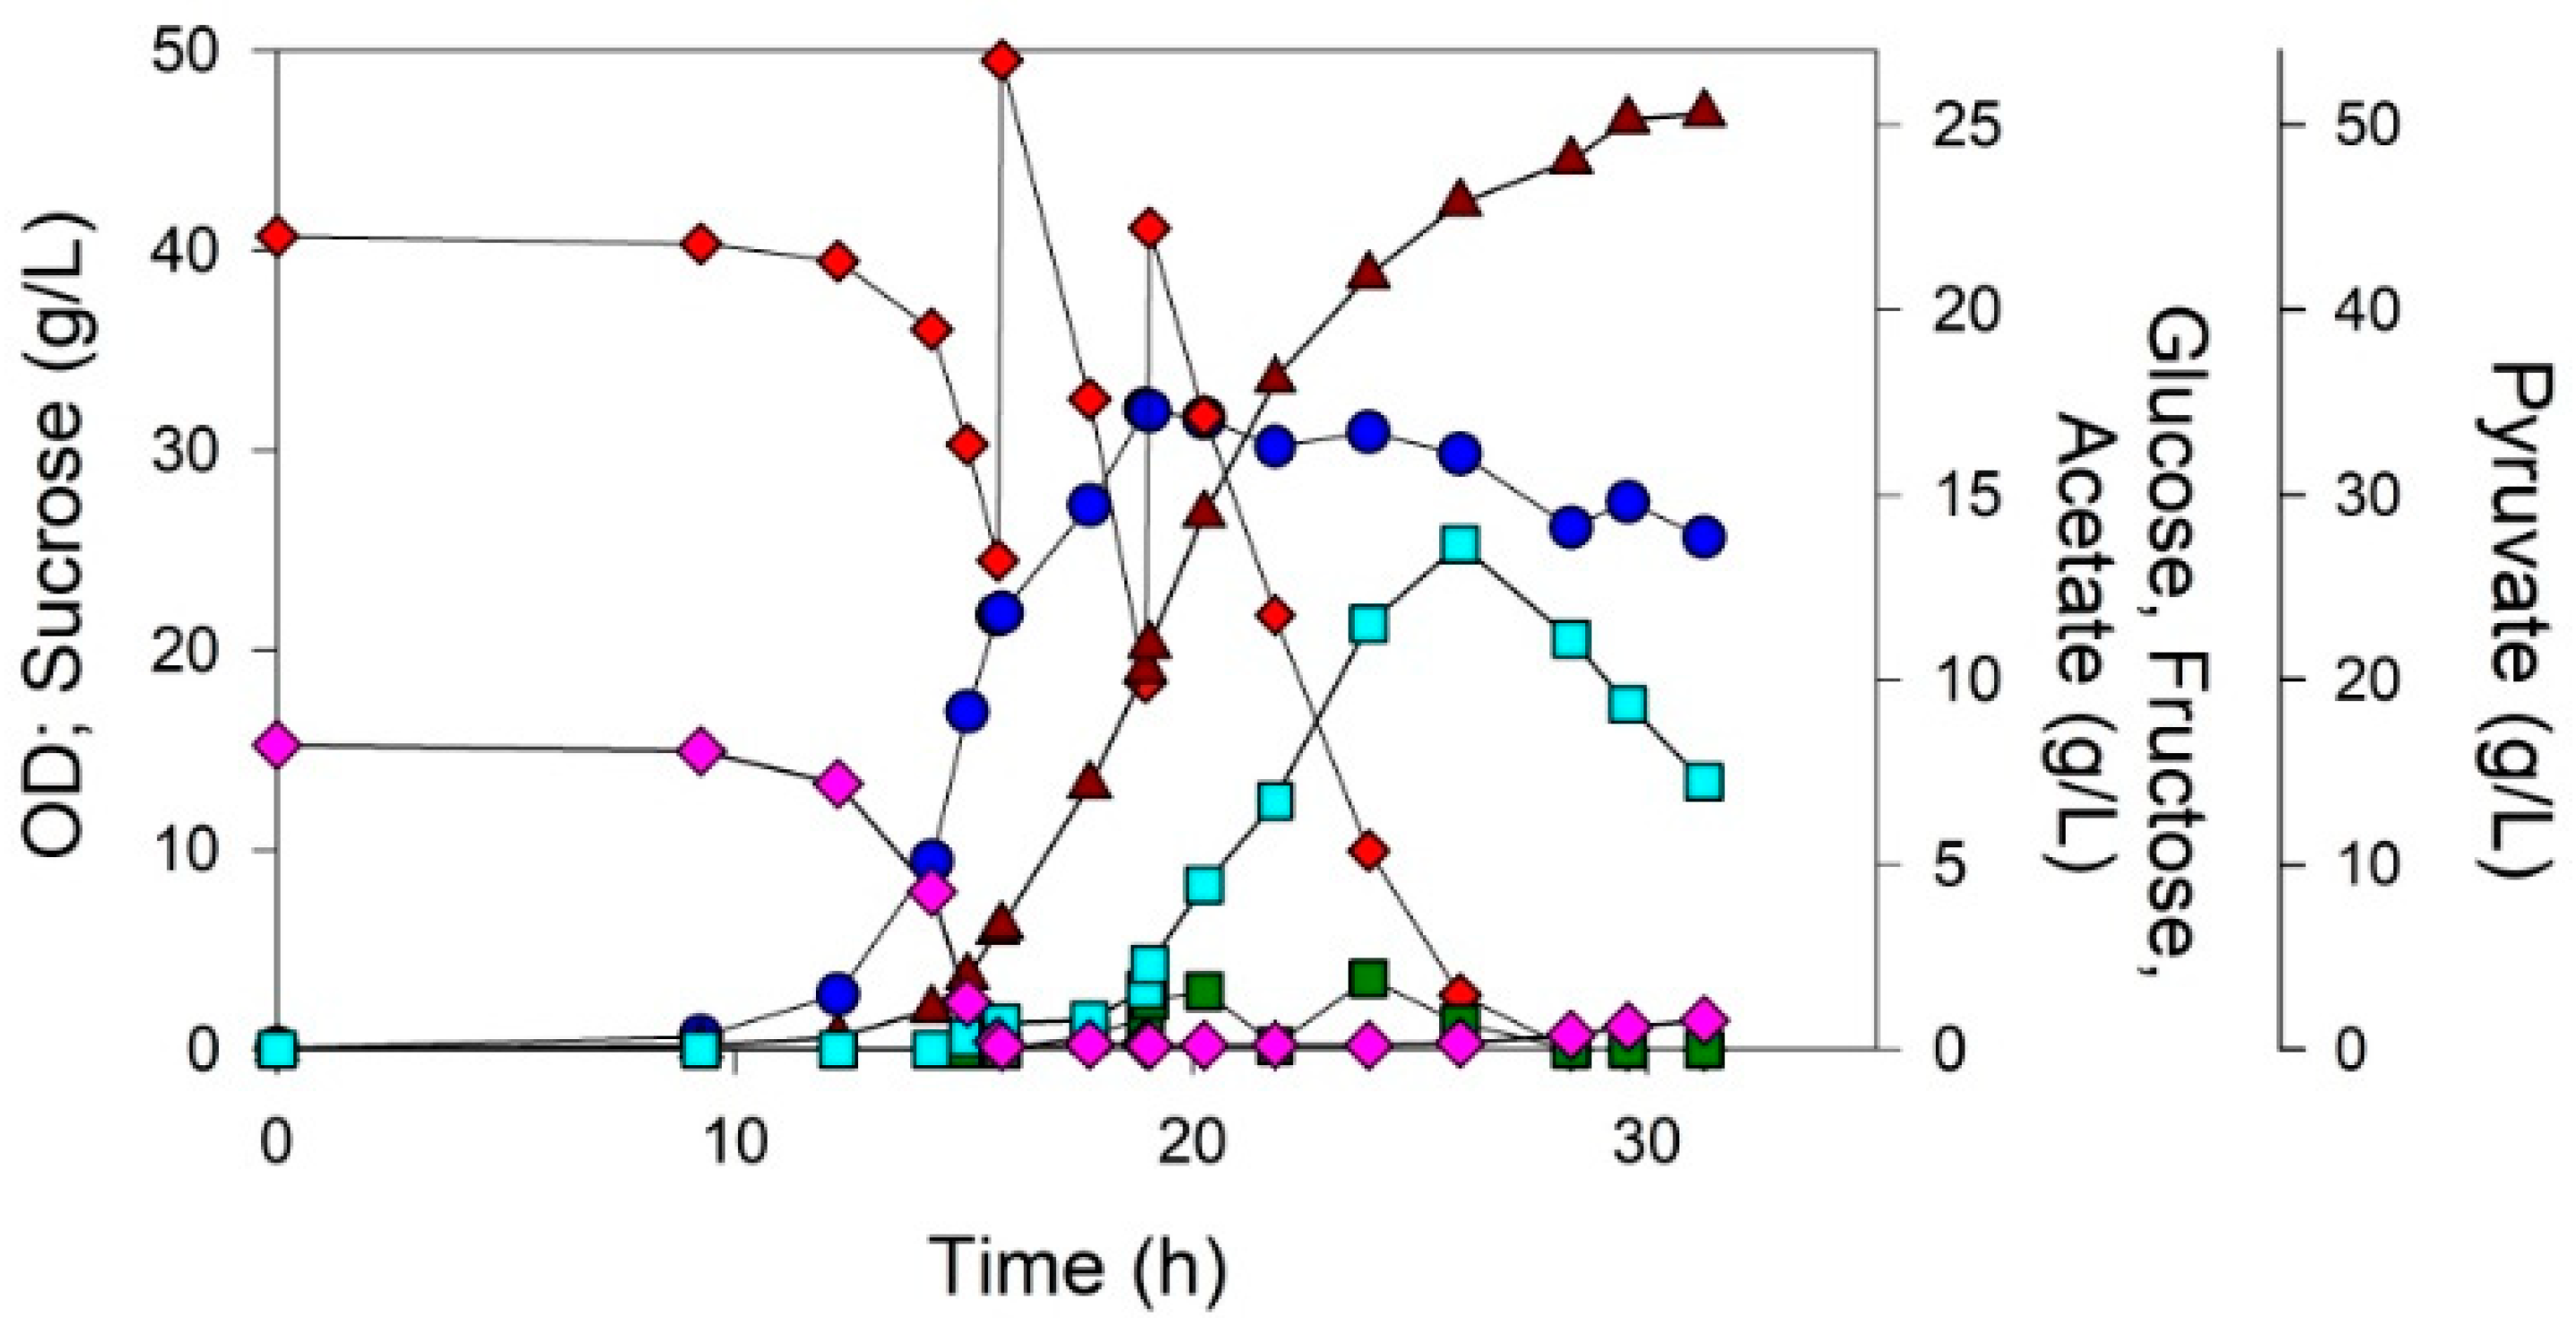
3.3. Fed-Batch Process

Because MEC1363 achieved the greatest pyruvate yield and did not re-assimilate pyruvate, we selected this strain for prolonged, repeated batch processes containing an initial 40 g/L sucrose. In these processes, sucrose was twice added when the sucrose concentration decreased to 20 g/L. Furthermore, to encourage prolonged growth, we fed in acetate slowly after the initial 8 g/L was depleted. During a 31.3 h process, 50.6 g/L pyruvate accumulated (Figure 3), corresponding to 64 g/L accounting for the dilution from acetate, base and sucrose addition. Interestingly, fructose accumulated to nearly 14 g/L at 26 h, corresponding to the time of ultimate sucrose depletion. The pyruvate yield from sucrose was 0.68 g/g, and the overall pyruvate productivity was 1.6 g/L·h.

4. Discussion

The goal of this research was to examine pyruvate production from sucrose using E. coli W. Seven strains with differences in the aceE allele were first screened in shake flask studies: a wild-type aceE, a ΔaceE strain, and five containing mutations which have previously been shown to support pyruvate accumulation from glucose [25,27]. These mutated strains contain amino acid substitutions, which likely impact pyruvate dehydrogenase activity, although their effect on protein structure and activity has not been determined. Briefly, H106 (substitutions found in MEC1359, MEC1362, MEC1363) is within the active site and appears to be involved in pyruvate orientation, while E401 (MEC1363) is on a mobile loop and contributes to its stability [29,30]. P190 (MEC1361) is proximal to active site residues V192 and M194, which together stabilize the cofactor thiamine diphosphate [30]. A P190Q substitution would likely be a severe structural change, ultimately destabilizing thiamine diphosphate binding. F532 (MEC1361) is in an alpha helix proximal to active site residues D521 and E522 and would likely shift the position of the active site. V668 and Y696 (MEC1360) are located near the active site channel [30], and substitutions at these sites could destabilize the channel structure. N276 (MEC1360) faces the AceE N-terminus and could impact the interaction of this protein with AceF, thereby affecting complex activity [31].
All strains contained deletions of the ldhA, poxB, ppsA, and cscR genes. We did not examine the effect of any of these knockouts individually. To ensure sucrose uptake rates in shake flasks were representative of batch cultures, where relatively high sugar concentrations are typically used, the initial sucrose concentration was 20 g/L. Each variant aceE allele and the ΔaceE strain indeed accumulated pyruvate (Figure 1), suggesting that the carbon flux distribution at the pyruvate node is similar when grown on either glucose or sucrose. Surprisingly, the PDH variants also showed some accumulation of fructose and/or glucose, necessitating more detailed batch studies under controlled conditions.
PTS-mediated glucose uptake and subsequent catabolism through glycolysis is well studied and has evolved to support high glucose uptake rates and glycolytic fluxes. Similarly, the fructose PTS system facilitates the import of fructose and belongs to the same PTS superfamily as the glucose PTS system [32,33]. One characteristic of these uptake processes is that pyruvate formation is coupled with sugar import through the phosphorylation of EI, for which phosphoenolpyruvate serves as the phosphate donor generating P~EI and pyruvate. During growth on glucose and other PTS-associated sugars, the majority of pyruvate is generated by EI phosphorylation [34,35]. In contrast, the sucrose catabolism pathway, encoded by the csc regulon genes, is not PTS-mediated and relies on a sucrose-H+ symporter (CscB) to transport sucrose into the cell [4]. Sucrose is subsequently hydrolyzed into glucose and fructose intracellularly by invertase (CscA).
Since CscB is not an active transporter, the sucrose uptake rate is directly related to sucrose concentration [12]. Additionally, csc gene expression is negatively regulated by CscR, which contributes to drastically decreased growth rates at sucrose concentrations less than 2 g/L [5]. To maximize sucrose uptake rates, cscR was deleted in all strains. In batch cultures with initially 40 g/L sucrose, each selected aceE variant and wild-type aceE strain exhibited decelerated specific sucrose uptake when the sucrose concentration decreased to less than 10 g/L (Figure 2). This observation is consistent with previous studies and demonstrates the benefit of using relatively high sucrose concentrations even when the csc genes are fully derepressed [5,7]. This potential disadvantage of using sucrose as the carbon source could be overcome by a fed-batch or repeated-batch process, which maintains a sucrose concentration above 10 g/L [8].
In most batch cultures, glucose and fructose accumulated in the medium, reaching maximum concentrations in the late exponential phase before being co-metabolized. Others have reported the accumulation of these monosaccharides from bacteria metabolizing sucrose through the csc pathway [5,36]. For example, 1.25 g/L glucose and fructose were reported during E. coli W growth on 20 g/L sucrose [5]. Fructose and glucose also accumulated during sucrose utilization in Pseudomonas putida KT2440, expressing invertase (cscA) and sucrose transporter (cscB) [36]. That study noted that the expression of invertase, in the absence of the sucrose transporter, conferred sucrose utilization by its extracellular cleavage [36]. Extracellular invertase activity was confirmed and suggested that CscA, a cytosolic enzyme, can leak out across the cell membrane [36]. Similarly, conferring sucrose utilization to E. coli K-12, a strain incapable of utilizing sucrose as a carbon source, demonstrated that the overexpression of invertase alone was sufficient for sucrose utilization [37]. In this case, invertase activity detected in the periplasmic space and the cell-free supernatant indicated that high expression of CscA leads to its leakage, permitting extracellular sucrose cleavage and subsequent availability of monosaccharides used for cell growth [37]. In E. coli W, a strain which naturally metabolizes sucrose, the appearance of glucose and fructose suggests that invertase might similarly be present in the membrane, periplasm or supernatant.
An interesting observation is the apparent suppression of glucose/fructose accumulation when MEC1363 grows on a mixture of sucrose and acetate (Figure 2c). Because MEC1363 requires acetate for growth, it was the only strain studied in a batch culture that was supplemented with acetate. This result implies a regulatory relationship between acetate uptake/metabolism and invertase secretion or fructose/glucose uptake. Moreover, during the batch culture of MEC1363 after acetate depletion, only fructose accumulated (Figure 2c), a result distinct from other strains which showed equimolar accumulation of both glucose and fructose. One possible explanation is that in this strain, having limited pyruvate dehydrogenase activity, sucrose is hydrolyzed extracellularly, and glucose is co-consumed with sucrose resulting in the accumulation of only fructose. Genes coding for the glucose PTS system are downregulated during growth on sucrose, which is consistent with results from batch experiments without acetate supplementation during which glucose and fructose were co-metabolized (Figure 2a,b) [12].
One distinct difference between aceE variant strains grown on sucrose or glucose is the consumption of pyruvate observed when grown on sucrose that was not observed when the strains were grown on glucose [25]. The deletion of genes responsible for pyruvate consumption (ldhA, poxB, and ppsA) is sufficient to prevent pyruvate metabolism when variants are grown on glucose [25]. When strains differing only in having a cscR knockout are grown on sucrose, however, the accumulated pyruvate is re-assimilated, seemingly dependent on the relative flux through the PDH. That is, pyruvate re-assimilation was observed most in strains having the least PDH perturbation: consumption of pyruvate was not observed in MEC1363 with severe AceE substitutions even after acetate was metabolized (Figure 2c), but pyruvate consumption was observed in MEC1361 with moderate substitutions in AceE (Figure 2b). When pyruvate is re-assimilated in ΔpoxB ΔppsA ΔldhA strains, it presumably is oxidized to acetyl-CoA and enters the TCA cycle via condensation with oxaloacetate to form citrate via citrate synthase [GltA; EC 2.3.3.16]. Thus, the re-assimilation of pyruvate through acetyl-CoA would depend on the availability of oxaloacetate. Interestingly, the oxaloacetate pool is known to be elevated during growth on sucrose compared to growth on glucose [12]. Thus, the absence of pyruvate re-assimilation during growth on glucose compared to pyruvate re-assimilation during growth on sucrose could be attributed to oxaloacetate. A greater oxaloacetate concentration in W during growth on sucrose would facilitate the consumption of acetyl-CoA via citrate synthase, drawing down pyruvate to provide maintenance energy for the cell.
The present study demonstrates the pyruvate production from sucrose using E. coli W with yields approaching 0.7 g/g, similar to yields obtained from glucose [21,25]. Important considerations for pyruvate production in E coli W using sucrose were ensuring sucrose concentrations above 10 g/L and greatly diminishing the flux through PDH. This work expands the substrate range for pyruvate production to sucrose, a cheap and readily available fermentation feedstock. Further studies on the relationship between acetate and monosaccharide accumulation or consumption could contribute to our understanding of sucrose metabolism in E. coli W. For example, it is unclear whether glucose/fructose accumulation is regulated by acetate depletion in an acetate-requiring strain or, more generally, when these monosaccharides accumulate during growth on sucrose and whether this accumulation differs in these strains with the native cscR gene. A time course batch study under controlled conditions using E. coli W (with and without cscR) growing on sucrose in the presence or absence of acetate would clarify any interaction. Similarly, understanding the mechanism for the re-assimilation of accumulated pyruvate, which has not been observed during growth on glucose, would further explain differences between sucrose metabolism and glucose metabolism in E. coli.

Author Contributions

Conceptualization, W.C.M. and M.A.E.; methodology, W.C.M. and M.A.E.; software, W.C.M. and M.A.E.; validation, W.C.M. and M.A.E.; formal analysis, W.C.M. and M.A.E.; investigation, W.C.M.; resources, W.C.M. and M.A.E.; data curation, W.C.M. and M.A.E.; writing—original draft preparation, W.C.M.; writing—review and editing, W.C.M. and M.A.E.; visualization, W.C.M. and M.A.E.; supervision, M.A.E.; project administration, M.A.E.; funding acquisition, M.A.E. All authors have read and agreed to the published version of the manuscript.

Funding

This research was funded by U.S. National Science Foundation (CBET-1802533).

Institutional Review Board Statement

Not applicable.

Informed Consent Statement

Not applicable.

Data Availability Statement

Not applicable.

Acknowledgments

The authors acknowledge the financial support of the U.S. National Science Foundation (CBET-1802533).

Conflicts of Interest

The authors declare no conflict of interest.

References

  1. Kunamneni, A.; Singh, S. Response surface optimization of enzymatic hydrolysis of maize starch for higher glucose production. Biochem. Eng. J. 2005, 27, 179–190. [Google Scholar] [CrossRef]
  2. van der Poel, P.; Schiweck, H.; Schwartz, T. Sugar Technology, Beet and Cane Sugar Manufacture, Sugar Technology; Verlag Dr. Albert Bartens KG: Berlin, Germany, 1998. [Google Scholar] [CrossRef]
  3. Yim, H.; Haselbeck, R.; Niu, W.; Pujol-Baxley, C.; Burgard, A.; Boldt, J.; Khandurina, J.; Trawick, J.D.; Osterhout, R.E.; Stephen, R.; et al. Metabolic engineering of Escherichia coli for direct production of 1,4-butanediol. Nat. Chem. Biol. 2011, 7, 445–452. [Google Scholar] [CrossRef]
  4. Bockmann, J.; Heuel, H.; Lengeler, J.W. Characterization of a chromosomally encoded, non-PTS metabolic pathway for sucrose utilization in Escherichia coli EC3132. Mol. Gen. Genet. 1992, 235, 22–32. [Google Scholar] [CrossRef]
  5. Sabri, S.; Nielsen, L.K.; Vickers, C.E. Molecular control of sucrose utilization in Escherichia coli W, an efficient sucrose-utilizing strain. Appl. Environ. Microbiol. 2013, 79, 478–487. [Google Scholar] [CrossRef]
  6. Tsunekawa, H.; Azuma, S.; Okabe, M.; Okamoto, R.; Aiba, S. Acquisition of a sucrose utilization system in Escherichia coli K-12 derivatives and its application to industry. Appl. Environ. Microbiol. 1992, 58, 2081–2088. [Google Scholar] [CrossRef]
  7. Arifin, Y.; Sabri, S.; Sugiarto, H.; Krömer, J.O.; Vickers, C.E.; Nielsen, L.K. Deletion of cscR in Escherichia coli W improves growth and poly-3-hydroxybutyrate (PHB) production from sucrose in fed batch culture. J. Biotechnol. 2011, 156, 275–278. [Google Scholar] [CrossRef]
  8. Erian, A.M.; Gibisch, M.; Pflügl, S. Engineered E. coli W enables efficient 2,3-butanediol production from glucose and sugar beet molasses using defined minimal medium as economic basis. Microb. Cell Fact. 2018, 17, 190. [Google Scholar] [CrossRef] [PubMed]
  9. Lee, J.W.; Choi, S.; Park, J.H.; Vickers, C.E.; Nielsen, L.K.; Lee, S.Y. Development of sucrose-utilizing Escherichia coli K-12 strain by cloning β-fructofuranosidases and its application for L-threonine production. Appl. Microbiol. Biotechnol. 2010, 88, 905–913. [Google Scholar] [CrossRef]
  10. Shukla, V.B.; Zhou, S.; Yomano, L.P.; Shanmugam, K.T.; Preston, J.F.; Ingram, L.O. Production of d(−)-lactate from sucrose and molasses. Biotechnol. Lett. 2004, 26, 689–693. [Google Scholar] [CrossRef]
  11. Wang, J.; Zhu, J.; Bennett, G.N.; San, K.Y. Succinate production from sucrose by metabolic engineered Escherichia coli strains under aerobic conditions. Biotechnol. Prog. 2011, 27, 1242–1247. [Google Scholar] [CrossRef] [PubMed]
  12. Arifin, Y.; Archer, C.; Lim, S.A.; Quek, L.E.; Sugiarto, H.; Marcellin, E.; Vickers, C.E.; Krömer, J.O.; Nielsen, L.K. Escherichia coli W shows fast, highly oxidative sucrose metabolism and low acetate formation. Appl. Microbiol. Biotechnol. 2014, 98, 9033–9044. [Google Scholar] [CrossRef] [PubMed]
  13. Archer, C.T.; Kim, J.F.; Jeong, H.; Park, J.H.; Vickers, C.E.; Lee, S.Y.; Nielsen, L.K. The genome sequence of E. coli W (ATCC 9637): Comparative genome analysis and an improved genome-scale reconstruction of E. coli. BMC Genom. 2011, 12, 9. [Google Scholar] [CrossRef]
  14. Steen, J.A.; Bohlke, N.; Vickers, C.E.; Nielsen, L.K. The Trehalose Phosphotransferase System (PTS) in E. coli W can transport low levels of sucrose that are sufficient to facilitate induction of the csc sucrose catabolism operon. PLoS ONE 2014, 9, e88688. [Google Scholar] [CrossRef] [PubMed]
  15. Lee, S.Y.; Chang, H.N. High cell density cultivation of Escherichia coli W using sucrose as a carbon source. Biotechnol. Lett. 1993, 15, 971–974. [Google Scholar] [CrossRef]
  16. Maleki, N.; Eiteman, M.A. Recent progress on the microbial production of pyruvic acid. Fermentation 2017, 3, 8. [Google Scholar] [CrossRef]
  17. Blombach, B.; Schreiner, M.E.; Holátko, J.; Bartek, T.; Oldiges, M.; Eikmanns, B.J. L-Valine production with pyruvate dehydrogenase complex-deficient Corynebacterium glutamicum. Appl. Environ. Microbiol. 2007, 73, 2079–2084. [Google Scholar] [CrossRef] [PubMed]
  18. Rinaldi, M.A.; Ferraz, C.A.; Scrutton, N.S. Alternative metabolic pathways and strategies to high-titre terpenoid production in Escherichia coli. Nat. Prod. Rep. 2022, 39, 90–118. [Google Scholar] [CrossRef]
  19. Rolf, J.; Julsing, M.K.; Rosenthal, K.; Lütz, S. A gram-scale limonene production process with engineered Escherichia coli. Molecules 2020, 25, 1881. [Google Scholar] [CrossRef]
  20. Smith, G.M.; Lee, S.A.; Reilly, K.C.; Eiteman, M.A.; Altman, E. Fed-batch two-phase production of alanine by a metabolically engineered Escherichia coli. Biotechnol. Lett. 2006, 28, 1695–1700. [Google Scholar] [CrossRef]
  21. Zhu, Y.; Eiteman, M.A.; Altman, R.; Altman, E. High glycolytic flux improves pyruvate production by a metabolically engineered Escherichia coli strain. Appl. Environ. Microbiol. 2008, 74, 6649–6655. [Google Scholar] [CrossRef]
  22. Tomar, A.; Eiteman, M.A.; Altman, E. The effect of acetate pathway mutations on the production of pyruvate in Escherichia coli. Appl. Microbiol. Biotechnol. 2003, 62, 76–82. [Google Scholar] [CrossRef] [PubMed]
  23. Zelić, B.; Gerharz, T.; Bott, M.; Vasić-Rački, Đ.; Wandrey, C.; Takors, R. Fed-batch process for pyruvate production by recombinant Escherichia coli YYC202 Strain. Eng. Life Sci. 2003, 3, 299–305. [Google Scholar] [CrossRef]
  24. Ziegler, M.; Hägele, L.; Gäbele, T.; Takors, R. CRISPRi enables fast growth followed by stable aerobic pyruvate formation in Escherichia coli without auxotrophy. Eng. Life Sci. 2021, 22, 70–84. [Google Scholar] [CrossRef]
  25. Moxley, W.C.; Eiteman, M.A. Pyruvate production by Escherichia coli by use of pyruvate dehydrogenase variants. Appl. Environ. Microbiol. 2021, 87, e00487-21. [Google Scholar] [CrossRef]
  26. Datsenko, K.A.; Wanner, B.L. One-step inactivation of chromosomal genes in Escherichia coli K-12 using PCR products. Proc. Natl. Acad. Sci. USA 2000, 97, 6640–6645. [Google Scholar] [CrossRef] [PubMed]
  27. Moxley, W.C.; Brown, R.E.; Eiteman, M.A. Escherichia coli aceE variants coding pyruvate dehydrogenase improve the generation of pyruvate-derived acetoin. Eng. Life Sci. 2023, 23, 2200054. [Google Scholar] [CrossRef]
  28. Eiteman, M.A.; Chastain, M.J. Optimization of the ion-exchange analysis of organic acids from fermentation. Anal. Chim. Acta 1997, 338, 69–75. [Google Scholar] [CrossRef]
  29. Kale, S.; Arjunan, P.; Furey, W.; Jordan, F. A dynamic loop at the active center of the Escherichia coli pyruvate dehydrogenase complex E1 component modulates substrate utilization and chemical communication with the E2 component. J. Biol. Chem. 2007, 282, 28106–28116. [Google Scholar] [CrossRef]
  30. Arjunan, P.; Nemeria, N.; Brunskill, A.; Chandrasekhar, K.; Sax, M.; Yan, Y.; Jordan, F.; Guest, J.R.; Furey, W. Structure of the pyruvate dehydrogenase multienzyme complex E1 component from Escherichia coli at 1.85 Å resolution. Biochemistry 2002, 41, 5213–5221. [Google Scholar] [CrossRef]
  31. Park, Y.H.; Wei, W.; Zhou, L.; Nemeria, N.; Jordan, F. Amino-terminal residues 1–45 of the Escherichia coli pyruvate dehydrogenase complex E1 subunit interact with the E2 subunit and are required for activity of the complex but not for reductive acetylation of the E2 subunit. Biochemistry 2004, 43, 14037–14046. [Google Scholar] [CrossRef]
  32. Jeckelmann, J.M.; Erni, B. Carbohydrate transport by group translocation: The bacterial phosphoenolpyruvate: Sugar phosphotransferase system, in: Subcellular. Biochemistry 2019, 92, 223–274. [Google Scholar] [CrossRef]
  33. Postma, P.W.; Lengeler, J.W.; Jacobson, G.R. Phosphoenolpyruvate:carbohydrate phosphotransferase systems of bacteria. Microbiol. Rev. 1993, 57, 543–594. [Google Scholar] [CrossRef]
  34. Emmerling, M.; Dauner, M.; Ponti, A.; Fiaux, J.; Hochuli, M.; Szyperski, T.; Wüthrich, K.; Bailey, J.E.; Sauer, U. Metabolic flux responses to pyruvate kinase knockout in Escherichia coli. J. Bacteriol. 2002, 184, 152–164. [Google Scholar] [CrossRef]
  35. Sauer, U.; Eikmanns, B.J. The PEP—Pyruvate—Oxaloacetate node as the switch point for carbon flux distribution in bacteria. FEMS Microbiol. Rev. 2005, 29, 765–794. [Google Scholar] [CrossRef]
  36. Löwe, H.; Schmauder, L.; Hobmeier, K.; Kremling, A.; Pflüger-Grau, K. Metabolic engineering to expand the substrate spectrum of Pseudomonas putida toward sucrose. Microbiolgyopen 2017, 6, e00473. [Google Scholar] [CrossRef]
  37. Sahin-Tóth, M.; Lengyel, Z.; Tsunekawa, H. Cloning, sequencing, and expression of cscA invertase from Escherichia coli B-62. Can. J. Microbiol. 1999, 45, 418–422. [Google Scholar] [CrossRef] [PubMed]
Figure 1. Comparison of pyruvate yield (g/g) in E. coli W ΔldhA ΔpoxB ΔppsA ΔcscR AceE variants grown in shake flasks with 20 g/L sucrose. Error bars indicate standard deviation from three replicates. Asterisk (*) indicates that culture was supplemented with 1.0 g/L acetate.
Fermentation 09 00478 g001
Figure 2. Controlled batch growth of E. coli W ΔldhA ΔpoxB ΔppsA ΔcscR harboring AceE variants with 40 g/L sucrose. (a) MEC1357; (b) MEC1361; and (c) MEC1363. Sucrose (), pyruvate (), OD (), acetate (), glucose (), and fructose ().
Fermentation 09 00478 g002
Figure 3. Controlled fed-batch growth of MEC1363 with 40 g/L sucrose initially. When the dissolved oxygen increased suddenly indicating the acetate depletion (15.1 h), a 33% (w/v) acetic acid solution was fed continuously at 3 mL/h. When the sucrose concentration had decreased to approximately 20 g/L (twice), a 40 mL solution containing 37.5 g sucrose was added (15.8 h and 19.0 h). Sucrose (), pyruvate (), OD (), acetate (), glucose (), and fructose ().
Fermentation 09 00478 g003
Table 1. Strains used in this study.
StrainRelevant CharacteristicsReference
ATCC 9637Escherichia coli WWild-type
MEC1319ATCC 9637 ΔldhA ΔpoxB ΔppsA[27]
MEC1320MEC1319 ΔaceE::cam-sacB[27]
MEC1322ATCC 9637 ΔldhA ΔpoxB ΔppsA ΔaceE [27]
MEC1332ATCC 9637 ΔldhA ΔpoxB ΔppsA ΔaceE::aceE[H106V] [27]
MEC1339ATCC 9637 ΔldhA ΔpoxB ΔppsA ΔaceE::aceE[N276S;R465C;V668A;Y696N][27]
MEC1340ATCC 9637 ΔldhA ΔpoxB ΔppsA ΔaceE::aceE[V169A;P190Q;F532L][27]
MEC1341ATCC 9637 ΔldhA ΔpoxB ΔppsA ΔaceE::aceE[H106M][27]
MEC1342ATCC 9637 ΔldhA ΔpoxB ΔppsA ΔaceE::aceE[H106M;E401A][27]
MEC1357MEC1319 ΔcscR::KanThis study
MEC1358MEC1322 ΔcscR::KanThis study
MEC1359MEC1332 ΔcscR::KanThis study
MEC1360MEC1339 ΔcscR::KanThis study
MEC1361MEC1340 ΔcscR::KanThis study
MEC1362MEC1341 ΔcscR::KanThis study
MEC1363MEC1342 ΔcscR::KanThis study
Disclaimer/Publisher’s Note: The statements, opinions and data contained in all publications are solely those of the individual author(s) and contributor(s) and not of MDPI and/or the editor(s). MDPI and/or the editor(s) disclaim responsibility for any injury to people or property resulting from any ideas, methods, instructions or products referred to in the content.

