Article

Glucose Conversion for Biobutanol Production from Fresh Chlorella sorokiniana via Direct Enzymatic Hydrolysis

1
College of Life Sciences, Hebei Agricultural University, Baoding 071001, China
2
College of Life Science and Technology, Beijing University of Chemical Technology, Beijing 100029, China
3
Hebei Key Laboratory of Plant Physiology and Molecular Pathology, Baoding 071001, China
4
Hebei Engineering Research Center for Agricultural Waste Resource Utilization, Baoding 071001, China
*
Author to whom correspondence should be addressed.
Fermentation 2023, 9(3), 284; https://doi.org/10.3390/fermentation9030284
Submission received: 30 January 2023 / Revised: 9 March 2023 / Accepted: 9 March 2023 / Published: 14 March 2023
(This article belongs to the Special Issue Algae—the Medium of Bioenergy Conversion)

Abstract

:
Microalgae, which accumulate considerable carbohydrates, are a potential source of glucose for biofuel fermentation. In this study, we investigated the enzymatic hydrolysis efficiency of wet microalgal biomass compared with freeze-dried and oven-dried biomasses, both with and without an acidic pretreatment. With the dilute sulfuric acid pretreatment followed by amy (α-amylase and amyloglucosidase) and cellulase hydrolysis, approximately 95.4% of the glucose was recovered; however, 88.5% was released by the pretreatment with 2% (w/v) sulfuric acid, which indicates the potential of the acids for direct saccharification process. There were no considerable differences in the glucose yields among the three kinds of materials. In the direct amy hydrolysis without any pretreatment, a 78.7% glucose yield was obtained, and the addition of cellulase had no significant effect on the hydrolysis to glucose. Compared with the oven-dried biomass, the wet biomass produced a substantially higher glucose yield, which is possibly because the cross-linked cells of the oven-dried biomass prevented the accessibility of the enzymes. According to the results, the fresh microalgal biomass without cell disruption can be directly used for enzymatic hydrolysis to produce glucose. The enzymatic hydrolysate of the wet microalgal biomass was successfully used for acetone–butanol–ethanol (ABE) fermentation, which produced 7.2 g/L of ABE, indicating the application potential of wet microalgae in the bioalcohol fuel fermentation process.

Graphical Abstract

1. Introduction

Microalgae are a potential feedstock for bioalcohol fuels, such as bioethanol and biobutanol production, because they can accumulate considerable carbohydrates that can be used for fermentation, they fix CO2, and grow faster and at a higher rate than terrestrial plants [1]. Prior to biofuel fermentation, the carbohydrates of microalgae are hydrolyzed to fermentable sugars. The microalgae-based carbohydrates are primarily in the form of starch and cellulose, which can be decomposed to glucose that is easily fermented into biofuel [2]. Microalgae contain no lignin and only a small amount of hemicellulose to block the decomposition of the glucose-based carbohydrates [3]. Thus, the conversion of microalgal biomass to glucose is more effective than that of lignocellulosic materials [4,5,6].
To date, there have been many investigations into the use of microalgae-based carbohydrates for bioethanol or biobutanol production [7,8,9]. However, the carbohydrates are in the cellular matrix of microalgae [10], and the processing of starch-rich microalgae cells to obtain glucose is hindered by the rigid cell wall, which prevents access to the intracellular starch [11]. Thus, cell disruption as a pretreatment process is an essential step in the release of starch for hydrolysis. This is similar to the processing of lignocellulosic materials, for which a pretreatment can enhance the hydrolysis of cellulose and the bioethanol production [12,13,14]. The cell disruption methods for microalgae include mechanical and nonmechanical processes [15]. The mechanical methods include high-pressure homogenizers, ball mills, French presses, and ultrasounds. The nonmechanical methods include osmotic shock, freezing and thawing, heating, drying, alkali cell disruption, solvents, detergents, acids, and enzymatic methods.
After the cell disruption, researchers commonly perform chemical processes with mineral acids and alkaline solutions or enzymatic saccharification processes with enzymes for the hydrolysis of the released starch into fermentable glucose [16]. While chemical hydrolysis is faster, acidic conditions may lead to the corrosion of the reactors and the decomposition of the sugars into toxic compounds that inhibit fermentation [16]. Saccharification by enzymes involves the use of cellulases, amylases, and amyloglucosidases. Enzymatic hydrolysis can be conducted under mild conditions and produce a high glucose yield without the formation of sugar-degrading products that could affect the fermentation of bioethanol production [16,17]. Thus, saccharification by enzymes is regarded as an efficient, economic, and environmentally friendly method for producing fermentable glucose.
The successful use of microalgal biomasses as biofuel feedstock depends on the abovementioned processing efficiency for fermentable glucose production. As reported in the literature, the glucose yield varies with the application of different microalgae species, different pretreatment and hydrolysis methods, and reaction conditions [16,18,19]. Nevertheless, the harvesting-related processes, such as drying, might also have a direct influence on the cost and quality of the biomass for the hydrolysis to glucose, thus affecting the efficiency of the biofuel production. The drying methods include natural sun-drying, freeze-drying, drum-drying, oven-drying, and spray-drying [20]. In previous studies, researchers used freeze-dried and oven-dried microalgal cells as the materials [5,21,22,23]. However, the drying of microalgal biomasses is not advisable for biofuel production [24]. In the context of bioalcohol fuel production, the hydrolysis efficiency of using wet biomasses compared to using dry biomasses has not attracted much attention.
In this study, we hypothesized that using fresh microalgal biomass for fermentable glucose production is comparable to using dry biomass, which makes the process more cost-effective [20]. Moreover, although there are studies in which the researchers address the necessity of the pretreatment step for the cell wall rupture of microalgae [25], how it affects the hydrolysis efficiencies of wet and dry biomasses has not been studied. Thus, we used dry (freeze- and oven-dried) and fresh microalgal biomasses for the acidic pretreatment followed by enzymatic hydrolysis, and for direct enzymatic hydrolysis to produce the fermentable glucose. The hydrolysis efficiencies of these materials were compared. Finally, the hydrolysate of the fresh microalgal biomass was used for biobutanol production to evaluate its feasibility for biofuel production. The expected results provide the databases for increasing the feasibility of bioalchol fuel production from microalgae-based biomasses.

2. Materials and Methods

2.1. Microalgae Cultivation and Harvest

C. sorokiniana UTEX1230 was purchased from the Culture Collection of Algae at the University of Texas at Austin (UTEX). The cultivation of C. sorokiniana was conducted in a plastic flatbed-based algal culture system in a greenhouse [26]. In this system, the medium was contained in polyethylene bags, fabricated with 0.08 mm greenhouse film rolls (double layers). The films were hollow and cylinder-shaped when inflated and cut at the desired length with two ends open. They were laid on a leveled surface and raised with wood planks at both ends to form flatbeds to hold the culture medium. The temperature in the greenhouse was controlled at 25–35 °C. The flatbed was illuminated by sunlight for 12 h, with an intensity of over 500 μmol m−2s−1 at noon and approximately 300 μmol m−2s−1 at 9:00 a.m. and 5:00 p.m. In the cloudy days, artificial light (Gold halide lamp, JLZ400kn, Yaming, Shanghai, China) was used to provide supplementary light with a light intensity of over 100 μmol m−2s−1.
The culture volume was 10 L, and a tris-acetate-phosphate (TAP) medium with a sulfur limitation was used. The main components and final concentration of the TAP medium were as follows: Tris, 2.0 × 10⁻² M. TAP salts, NH4Cl, 7.0 × 10⁻³ M, MgSO4·7H2O, 4.06 × 10⁻⁴ M, CaCl2·2H2O, 3.4 × 10⁻⁴ M. Phosphate buffer, K2HPO4, 4.74 × 10⁻⁴ M, KH2PO4, 3.97 × 10⁻⁴ M. Trace element, EDTA-Na2, 5.7 × 10⁻² M, (NH4)6Mo7O24, 2.85 × 10⁻² μM, Na2SeO3, 0.1 μM, ZnSO4·7H2O, 2.5 μM, MnCl2·4H2O, 6 μM, FeCl3·6H2O, 20.0 μM, CuCl2, 2.0 μM, Na2CO3, 22 μM, glacial acetic acid, 1.75 × 10⁻² M. Use of the S-limitation medium (TAP-S) requires that MgSO4 is removed from the TAP salts, with subsequent supplementing of the medium with 4.06 × 10⁻⁴ M MgCl2 in order to ensure the concentrations of magnesium ions and other reagents remain unchanged.
We let the microalgae culture stand for 1 h to allow the biomass to settle. The supernatant was removed, and then the slurry was centrifuged using a centrifugal machine (DD5M, Kaida, Changsha, China) at 4000× g for 5 min. After that, the wet biomass was divided into three portions. One portion was dried in a freezer dryer (FD5-3T, GOLD-SIM, USA) for 24 h, one portion was dried in an oven (GLF-45, LABOTERY, Tianjin, China) at 105 °C for 12 h, and the other portion was used as the wet biomass. The water content of the wet biomass was 73.98%, which was the mean value calculated based on the dry weight ratio of the biomasses for freeze-drying and oven-drying. Briefly, the portions for drying were preweighed, and after drying, they were weighed again. The dry weight ratio was calculated. The three kinds of materials (freeze-dried, oven-dried, and wet biomasses) were stored in a freezer at −20 °C and used for the subsequent analyses.

2.2. Chemical Composition Analysis

The content of the glucose-based carbohydrates in C. sorokiniana was measured according to the protocol of the National Renewable Energy Laboratory [27]. The three kinds of materials, each weighing 25 mg according to the dry weight, were treated with 72% (w/w) sulfuric acid for 1 h at 30 °C in a 15 mL centrifuge tube with a screw cap. The samples were then diluted to 4% sulfuric acid with deionized water and autoclaved for 1 h at 121 °C. After cooling, the supernatant was collected for the glucose analyses using an SBA 40C biosensor analyzer (Biology Institute, Shandong Academy of Sciences, Jinan, China).
The lipid content was measured using the sulfo-phospho-vanillin (SPV) method [28]. The three kinds of materials (3 mg in dry weight) were suspended in 100 μL water, and 2 mL of concentrated (98%) sulfuric acid was added. The solution was heated for 10 min at 100 °C, and then cooled for 5 min in an ice bath. A total of 5 mL of freshly prepared phospho-vanillin reagent was then added, and the sample was incubated in an incubator shaker for 15 min at 37 °C and 200 rpm. The optical density at 530 nm was measured to quantify the lipid content. Corn oil was used to prepare the standard lipid stocks at 50 mg in 50 mL chloroform.
The protein content was measured using a BCA assay kit (Beyotime Institute of Biotechnology, Nantong, China). The three kinds of materials were lysed with an extraction solution, containing 50 mM tris (pH 8.1), 1% sodium dodecyl sulfate (SDS), sodium pyrophosphate, β-glycerophosphate, sodium orthovanadate, sodium fluoride, EDTA, and phenylmethanesulfonyl fluoride (PMSF). The supernatant was collected to measure the optical density at 562 nm with the spectrophotometer.

2.3. Dilute Acid Pretreatment Followed by Enzymatic Hydrolysis

The freshly collected biomasses, which were characterized in terms of the water content and dry weight, were pretreated with 0, 0.5, 1.0, 1.5, and 2% (w/v) sulfuric acid at 121 °C for 60 min for cell rupture. The freeze-dried and oven-dried biomass were also pretreated. The dry matter contents in the reaction systems were 2% (w/v). After the reaction, the liquid was cooled, and the supernatant was taken for the glucose content analysis.
The residue was also collected, supplemented with the same amount of water as the pretreatment liquid, and subjected to enzymatic hydrolysis by adding amylase, amyloglucosidase, and cellulase. High-temperature-resistant α-amylase (Aladdin, Shanghai, China), amyloglucosidase (Aladdin, Shanghai, China), and cellulase (Cellic® CTec2) (Novozymes A/S, Bagsværd, Denmark) were used for the hydrolysis of the microalgal biomasses (Table 1). The dosages of α-amylase and amyloglucosidase were 8 U/g dry matter (DM), set according to the activities of α-amylase and amyloglucosidase provided by the manufacturer (Table 1). The dosage of cellulase was 10 FPU/g DM, set according to our previous study [29]. Hydrolysis was conducted in a shaking incubator at 180 rpm and 50 °C for 48 h. After the hydrolysis, the reaction was stopped by boiling the samples in a water bath for 10 min. The glucose contents in the supernatant after pretreatment and enzymatic hydrolysis were analyzed to calculate the hydrolysis efficiency.

2.4. Direct Enzymatic Hydrolysis

The enzymatic hydrolysis of the microalgal biomasses for glucose yield calculations was conducted with 2, 6, 10, and 20% dry matter (DM) loading in tubes with 5 mL of water or 50 mM sodium citrate buffer (pH 5.0). Hydrolysis was conducted in a shaking incubator at 180 rpm and 50 °C. The dosages of α-amylase and amyloglucosidase were 8 U/g DM. For the test of the cellulase effect, the cellulase dosages were 0, 2, 5, 10, and 15 FPU/g DM, respectively. The pure starch was also hydrolyzed as a control to investigate the effects of enzyme mixtures and buffer solutions. After all the hydrolysis, the reaction was terminated via a boiling water bath for 10 min. The supernatant was collected to determine the glucose content.

2.5. Scanning Electron Microscopy Analysis

Fresh cells of C. sorokiniana were collected by centrifugation, cleaned twice with phosphate-buffer-saline (PBS), fixed with an electron microscopy fixative for 2 h at room temperature, and then transferred to 4 °C for preservation. The cells were washed three times with 0.1 M phosphate buffer (PB, pH 7.4) for 15 min each time, then transferred into 1% OsO4 in 0.1 M PB for 1–2 h at room temperature. After that, the cells were again washed in 0.1 M PB three times for 15 min each time. The cells were dehydrated in gradient ethanol solutions (30%–50%–70%–80%–95%–100%) and in pure isoamyl acetate. After drying with a critical point dryer (Quorum, K850), the specimens, as well as the freeze-dried and oven-dried samples, were attached to metallic stubs using carbon stickers and sputter-coated with gold for 30 s. The cells were observed and imaged with a scanning electron microscope (Hitachi, SU8100).

2.6. Biobutanol Fermentation

Clostridium acetobutylicum ATCC 824 was used for the acetone–butanol–ethanol (ABE) fermentation. According to our previous study [30], freeze-stored culture was activated in 50 mL of reinforced clostridial medium [31] for 14–16 h.
The fermentation was conducted in 125-mL screw-capped bottles containing 50-mL enzymatic hydrolysates for 120 h. In order to increase the glucose concentration for suitable fermentation, the hydrolysates were derived from 6% (w/v) microalgal biomass. The hydrolysis was conducted in 250-mL bottles. The wet biomasses with 6 g of dry weight were added to 100 mL of water, which included the water in the wet biomasses. Correspondingly, α-amylase and amyloglucosidase with 8 U/g DM were added. Hydrolysis was also conducted in a shaking incubator at 180 rpm and 50 °C for 48 h. The pH of the enzymatic hydrolysates was adjusted to 6.5 with Ca(OH)2 prior to fermentation. The hydrolysates were purged with N2 for 10 min to maintain an anaerobic condition and were sterilized at 121 °C for 20 min. Fermentation started statically at 37 °C when inoculated into the C. acetobutylicum ATCC 824 culture (10%, v/v). Prior to the inoculation, each of the filter-sterilized stock solutions (buffer: KH2PO4, 50 g/L; K2HPO4, 50 g/L; ammonium acetate, 220 g/L; mineral: MgSO4·7H2O, 20 g/L; MnSO4·H2O, 1 g/L; FeSO4·7H2O, 1 g/L; NaCl, 1 g/L; and vitamin: para-aminobenzoic acid, 0.1 g/L; thiamin, 0.1 g/L; biotin, 0.001 g/L) was added to the hydrolysate media [30]. Fermentation samples were taken at 24-h intervals.

2.7. Analysis

The glucose analysis was conducted using an SBA 40C biosensor analyzer (Biology Institute, Shandong Academy of Sciences, Jinan, China). The equations for the calculation of the glucose-based carbohydrate content and glucose yields are as follows:
Glucose-based carbohydrate content (%) = Glucose in microalgal biomass (g) ÷ Dry weight of microalgal biomass (g) × 100
Glucose yield (%) = Glucose in the hydrolysate (g) ÷ Glucose in microalgal biomass (g) × 100
Acetone, butanol, and ethanol were determined using a gas chromatograph (TRACE 1300, Thermo, Waltham, MA, USA) equipped with a hydrogen flame ionization detector and a packed column (Porapack Q, 80/100) [32].

2.8. Statistical Analysis

All experiments were conducted with at least three biological replicates. Experimental results were analyzed using one-way ANOVA with Duncan’s multiple range test (SPPS vs. 20).

3. Results

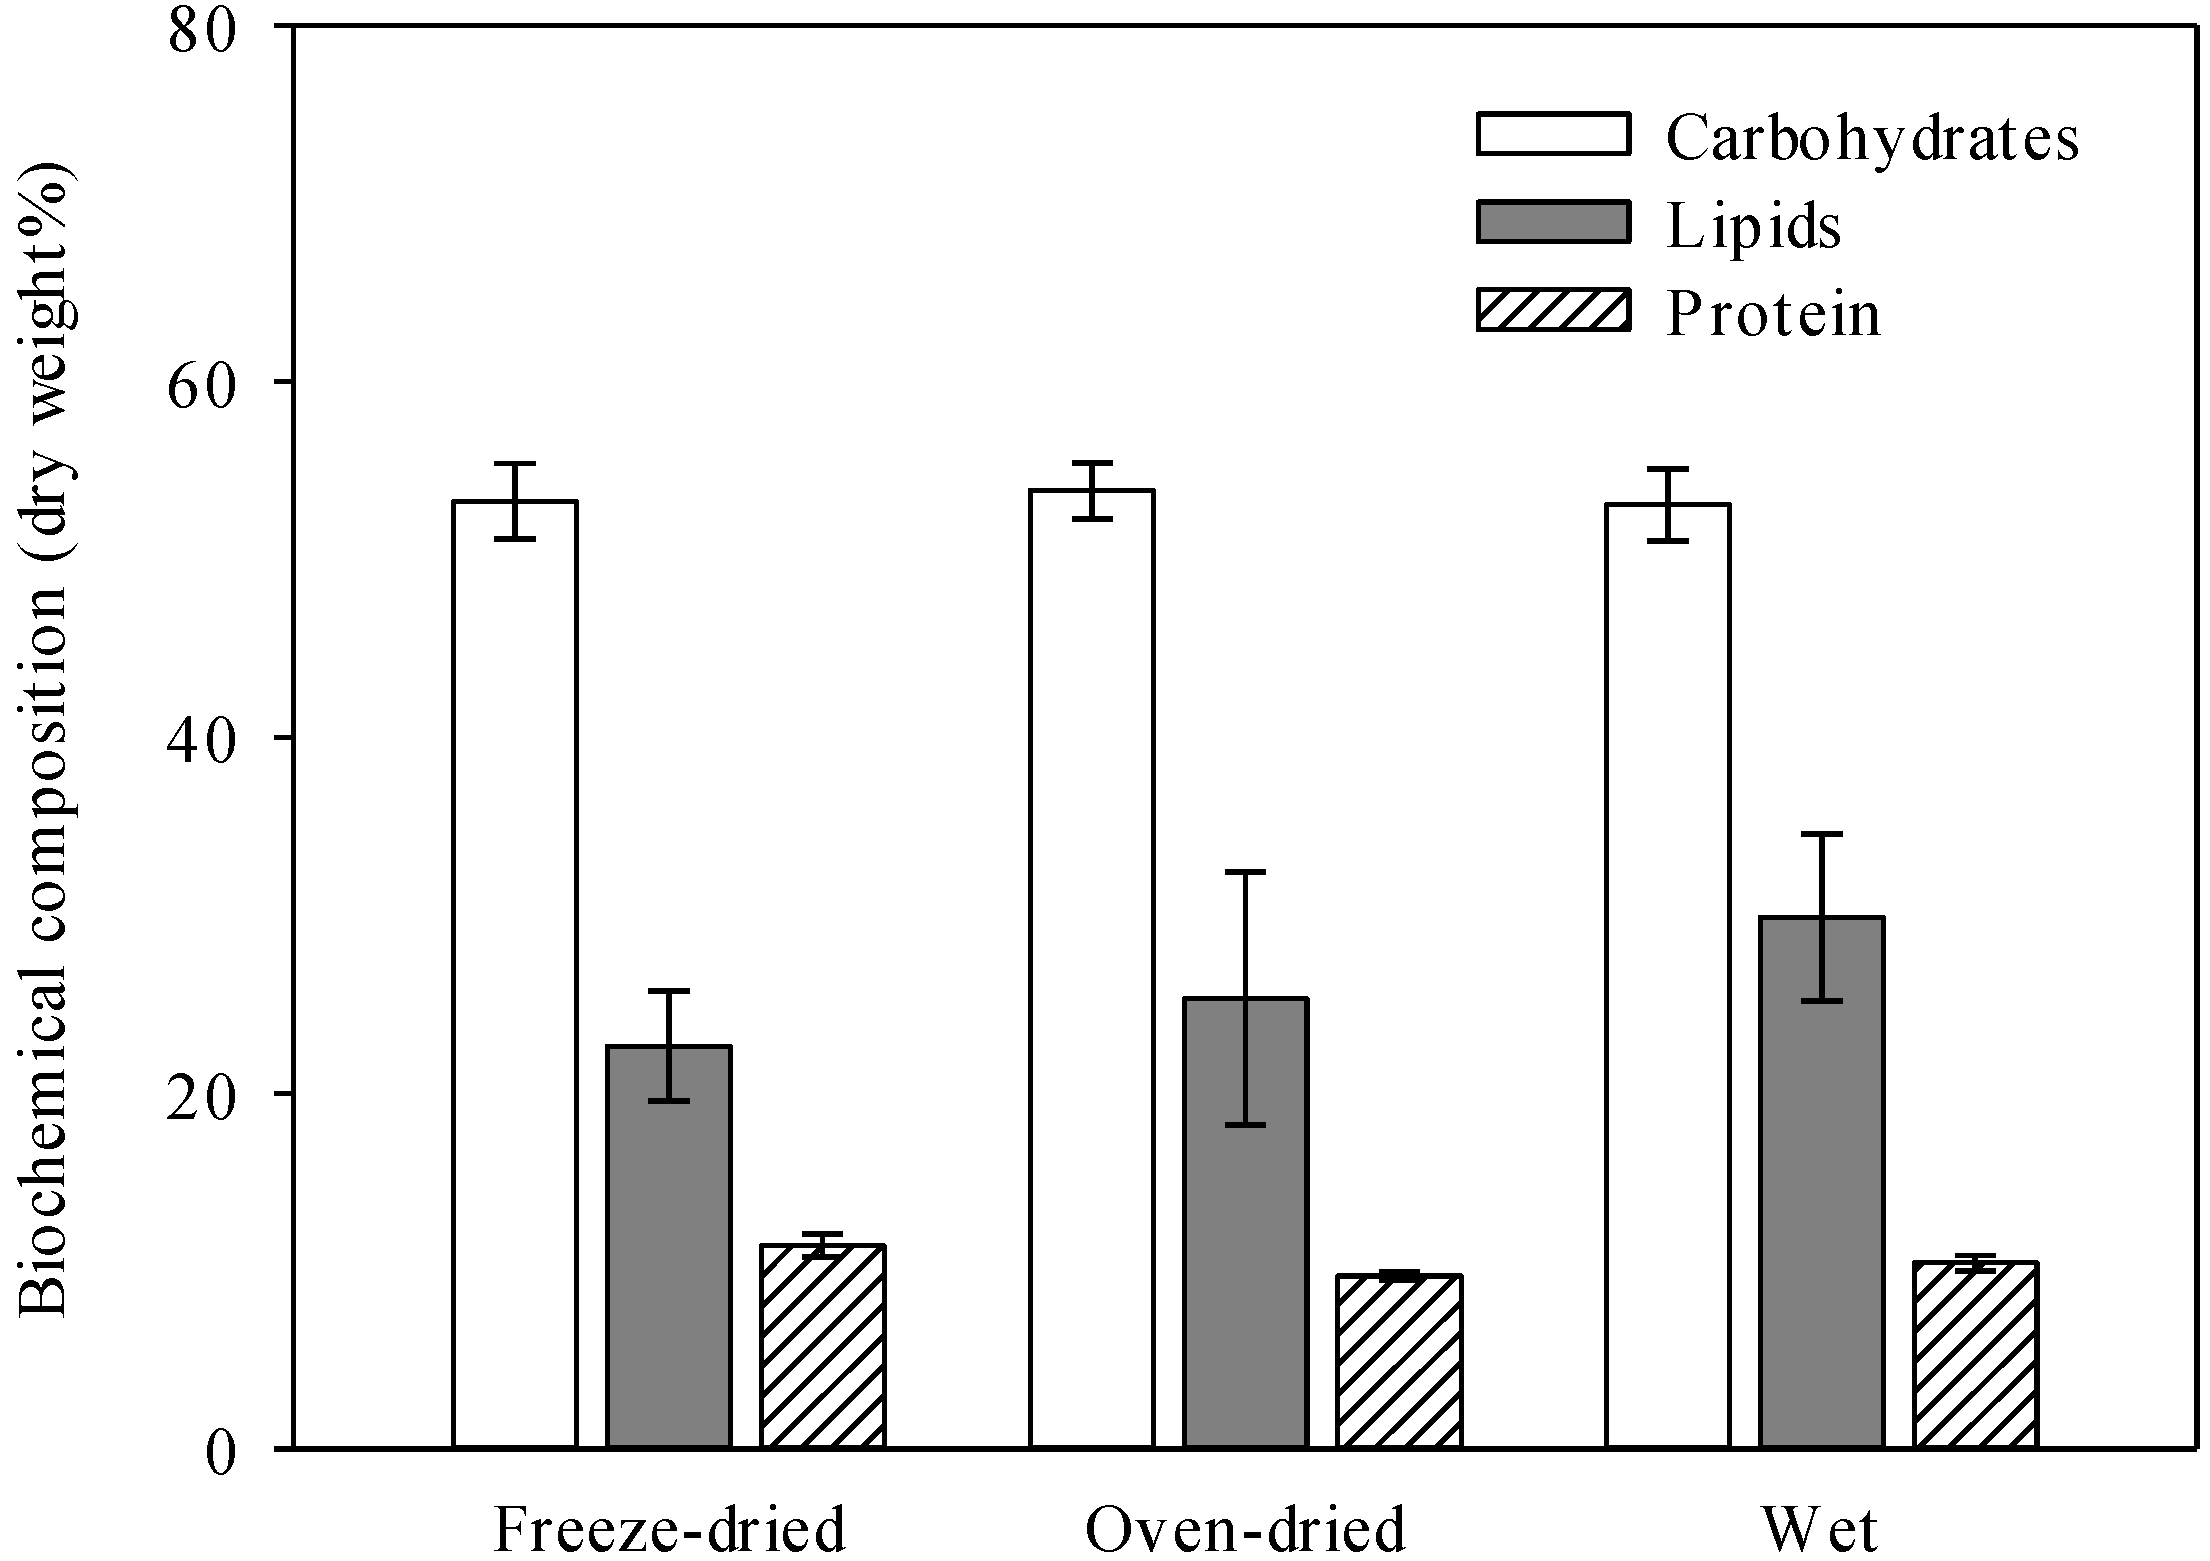
3.1. Wet and Dry Biomasses Used for Composition Analysis

The freeze-dried and oven-dried biomass, and wet biomass of C. sorokiniana were used for the main composition analysis, including the carbohydrates, lipids, and protein contents. The carbohydrate contents of the freeze-dried, oven-dried, and wet biomasses were 53.2%, 53.8%, and 53.1% in dry weight, respectively, with no significant differences (Figure 1). Lipids contents ranged from 22.6 to 29.9%, and protein contents ranged from 9.7 to 11.4% in dry weight, respectively. According to the results, the wet microalgae produced comparable composition content values to those of the freeze-dried and oven-dried biomasses, which indicated the feasibility of using the wet biomass for the composition analysis.
The chemical composition of microalgae, such as the content of carbohydrate, is usually investigated for the calculation of the hydrolysis efficiency of microalgal biomass. The carbohydrate contents were comparable with those of studies on C. vulgaris, in which a considerable number of carbohydrates accumulated under nutritional stress [33]. As reported earlier, a lack of nutrients can exert stress on microalgae, which leads to changes in their cellular metabolic processes and the accumulation of energy storage metabolites, such as starches and lipids [34]. The high carbohydrate content in the C. sorokiniana biomass suggested its potential for use in bioalcohol fermentation. However, the drying process makes its use more complicated and energy-intensive. As reported previously, the freeze-drying and oven-drying took 24 h and 12 h, and the energy consumption was 6 kW and 21.96 kW, respectively [20]. Correspondingly, the use of wet biomass could increase the feasibility of microalgal biofuel production. Thus, we compared the abilities of these three materials to produce fermentable glucose through hydrolysis.

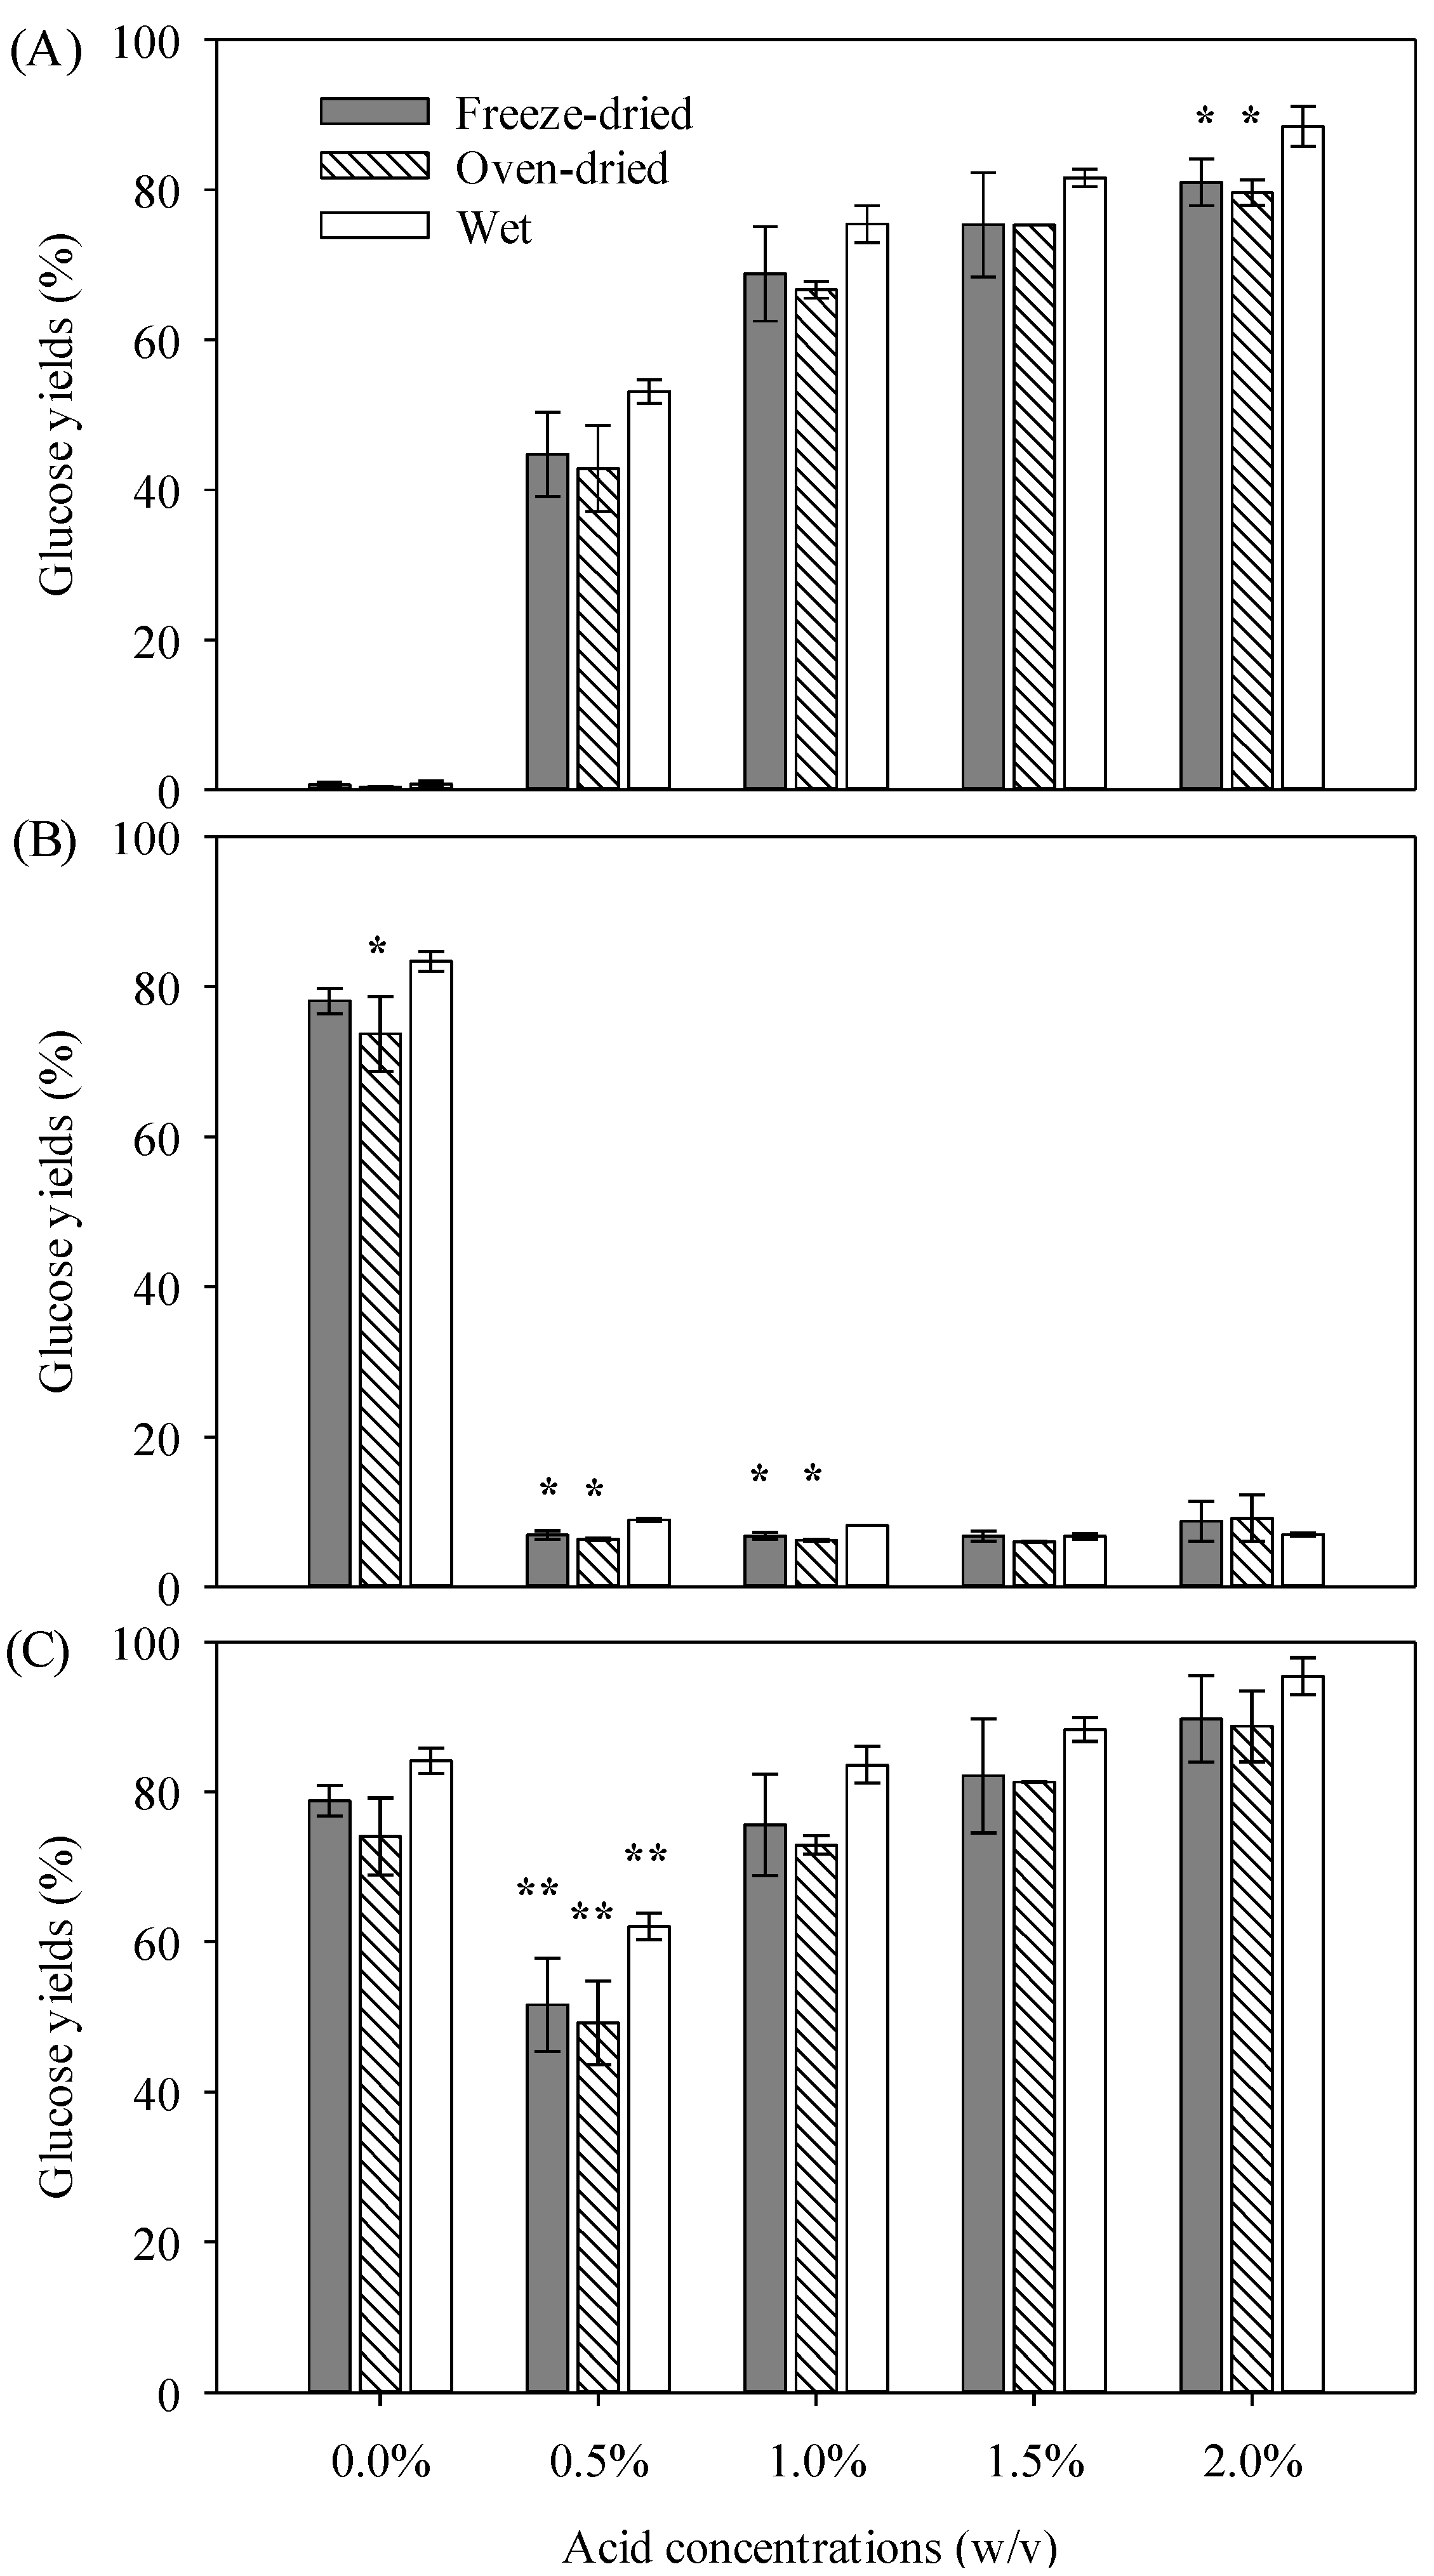
3.2. Acidic Pretreatment Followed by Enzymatic Hydrolysis

A diluted sulfuric acid treatment was applied as the pretreatment process to disrupt the cell wall, followed by the enzymatic hydrolysis of the released starch. With the increasing acid concentrations, the glucose released into the pretreated hydrolysates increased (Figure 2A). Using freeze-dried and oven-dried biomasses, 81.0% and 79.6% of glucose yields were obtained with 2% (w/w) of sulfuric acid, respectively. Comparatively, the wet biomass produced an 88.5% glucose yield, which was higher (p < 0.05) than that of the dry biomass. According to the results, most of the glucose was released from the raw biomass into the pretreated hydrolysates. The relatively lower concentrations of acid did not result in any substantial differences in the glucose yields between the wet and dry biomasses.
The residual biomass after the acid pretreatment was further hydrolyzed using a one-pot process with an enzyme mixture that included α-amylase, amyloglucosidase, and cellulase (Figure 2B). The hydrolysis reaction was performed at 50 °C, which accommodated the condition for cellulase because the starch was hydrolyzed during the pretreatment, which left behind more cellulose. After the hydrolysis, an approximately 83.4% glucose yield was obtained from the wet biomass in the control group (without acid) (Figure 2B). The glucose yields from the residual biomass after the acid pretreatment were as low as under 10%, which further confirmed that a large proportion of the glucose-based carbohydrates were hydrolyzed with the dilute acid and that the glucose was released to the pretreated hydrolysates.
By combining the glucose yields of both the pretreated and enzymatic hydrolysates, a total glucose yield of 95.5% was obtained after the 2% sulfuric acid pretreatment followed by enzymatic hydrolysis (Figure 2C). Interestingly, substantially lower glucose yields were obtained with 0.5% sulfuric acid followed by enzymatic hydrolysis. This was probably because the carbohydrates were hydrolyzed into the oligosaccharides, which were present in the acid-treated hydrolysates. As reported earlier, the starch degraded into oligosaccharides with a low sulfuric acid concentration and a lower reaction time [35]. There were not any substantial differences in the total glucose yields with different concentrations of acid between the freeze-dried, oven-dried, and wet biomasses, which indicated that efficient and direct hydrolysis can be achieved by using the wet microalgal biomass.
The conversion of the carbohydrates in microalgae to glucose is one of the key steps in biofuel production. Acidic treatments are usually used as pretreatments or in the direct hydrolysis process [5,8,23]. From the point of view of the hydrolysis process, considerable glucose yields were obtained regardless of whether the dry or wet biomass was used (Figure 2A). As reported earlier, a maximum glucose yield of 95.0% was achieved from the hydrolysis of algal biomass at 100 °C for 30 min by using 3.0 wt.% sulfuric acid [36]. The glucose yields obtained in our study were comparable or superior to those of other studies in which the researchers used the acidic hydrolysis method (Table 2), indicating that the conversion of microalgal biomass to fermentable glucose can be achieved efficiently via the direct acidic saccharification process. Additionally, most of the studies used freeze-dried and oven-dried biomass for the hydrolysis (Table 2). The glucose yield was lower than that in the study of wet S. obliquus CNW-N, which was probably due to the different acid percentages used in volume and mass for the hydrolysis, and also, the glucose yields obtained were probably species-dependent, as we all know, the Chlorella possesses a rigid cell wall, which could make the efficiency of hydrolysis lower. According to the results presented here, the use of fresh microalgae-based carbohydrates for biofuel production is feasible.
On the other hand, when the acids were used as pretreatment to disrupt the cell walls of the microalgal biomasses, the enzymatic hydrolysis was usually followed. The results of this study showed that a low amount of glucose was obtained after enzymatic hydrolysis (Figure 2B), which indicated the high efficiency of the acid for the direct hydrolysis of the biomass. In this case, it is probably not worth performing the subsequent enzymatic hydrolysis, considering the process complexity and enzyme costs. The relatively low concentrations of acids, such as 0.5%, caused the incomplete hydrolysis of the carbohydrates. Nevertheless, the control group (without acid) was effective for the enzymatic hydrolysis and the attainment of reasonable glucose yields. Hydrothermal treatment is also one of the methods for cell rupture, however, it could not hydrolyze the starch. Although it can leave the starch for glucose release in the second enzymatic step, from an economic point of view, the fewer the steps, the better. Thus, we will next investigate the direct hydrolysis of microalgal biomasses by enzymes without any pretreatment.

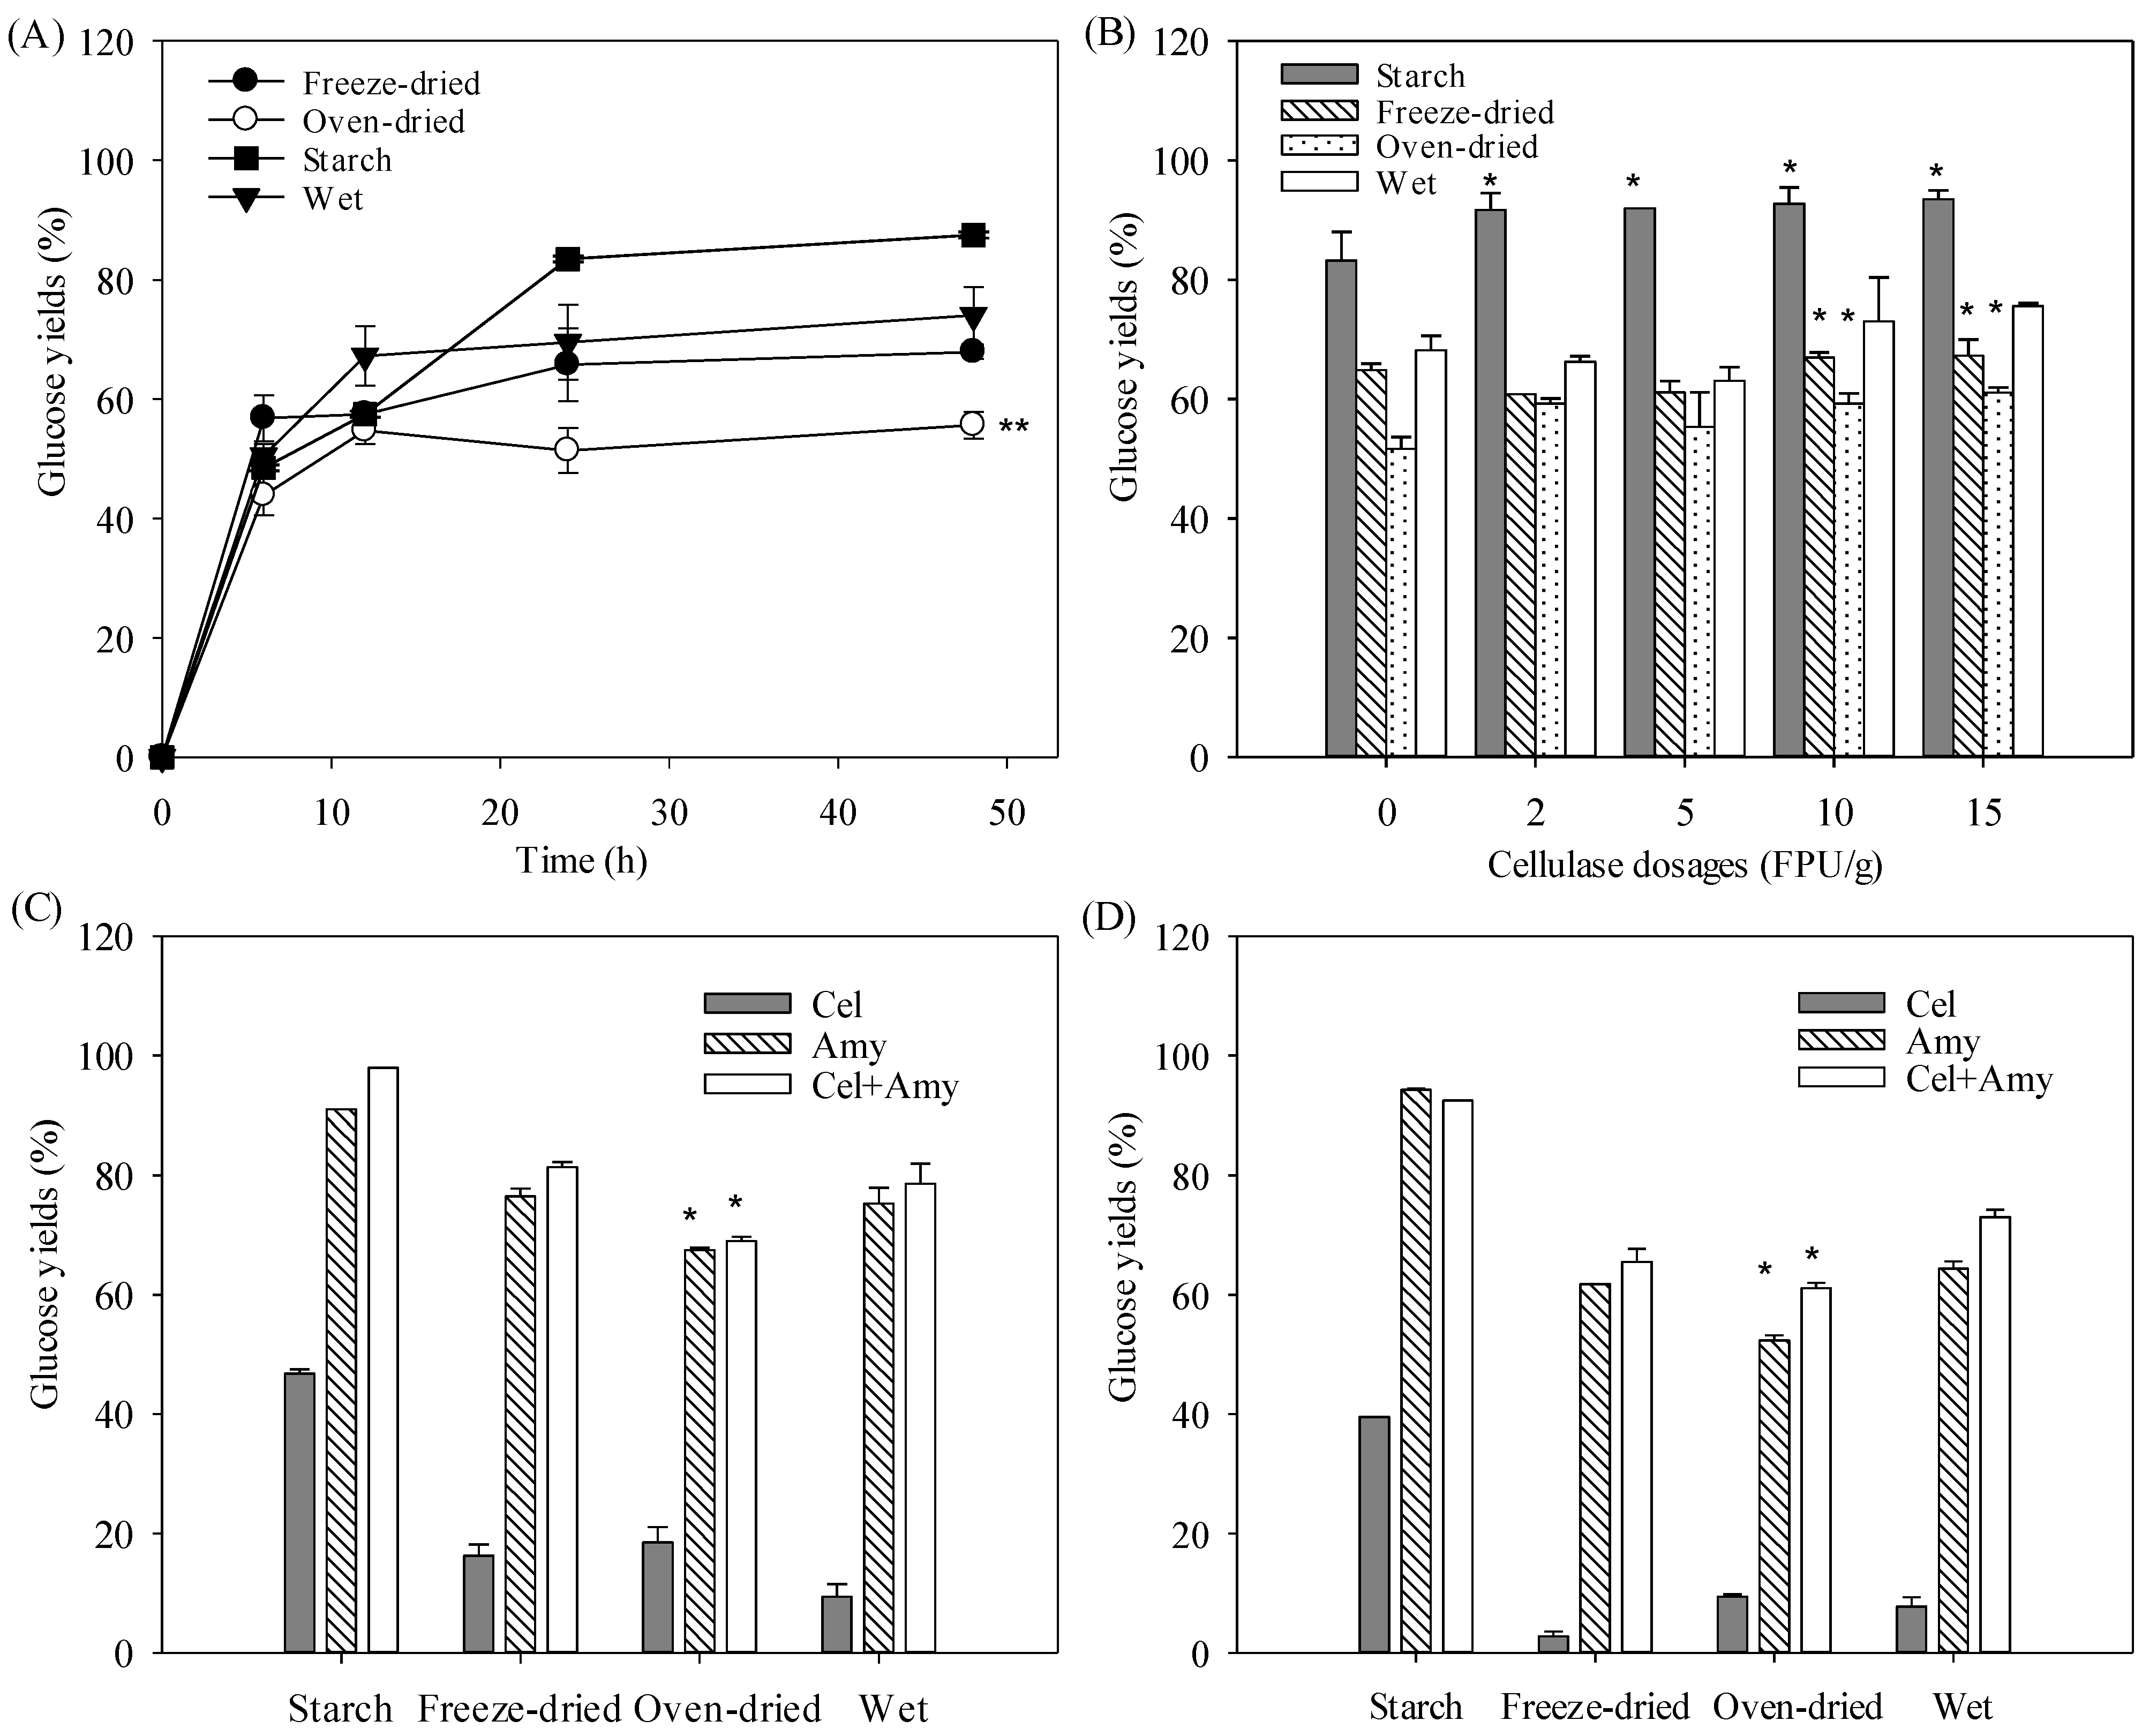
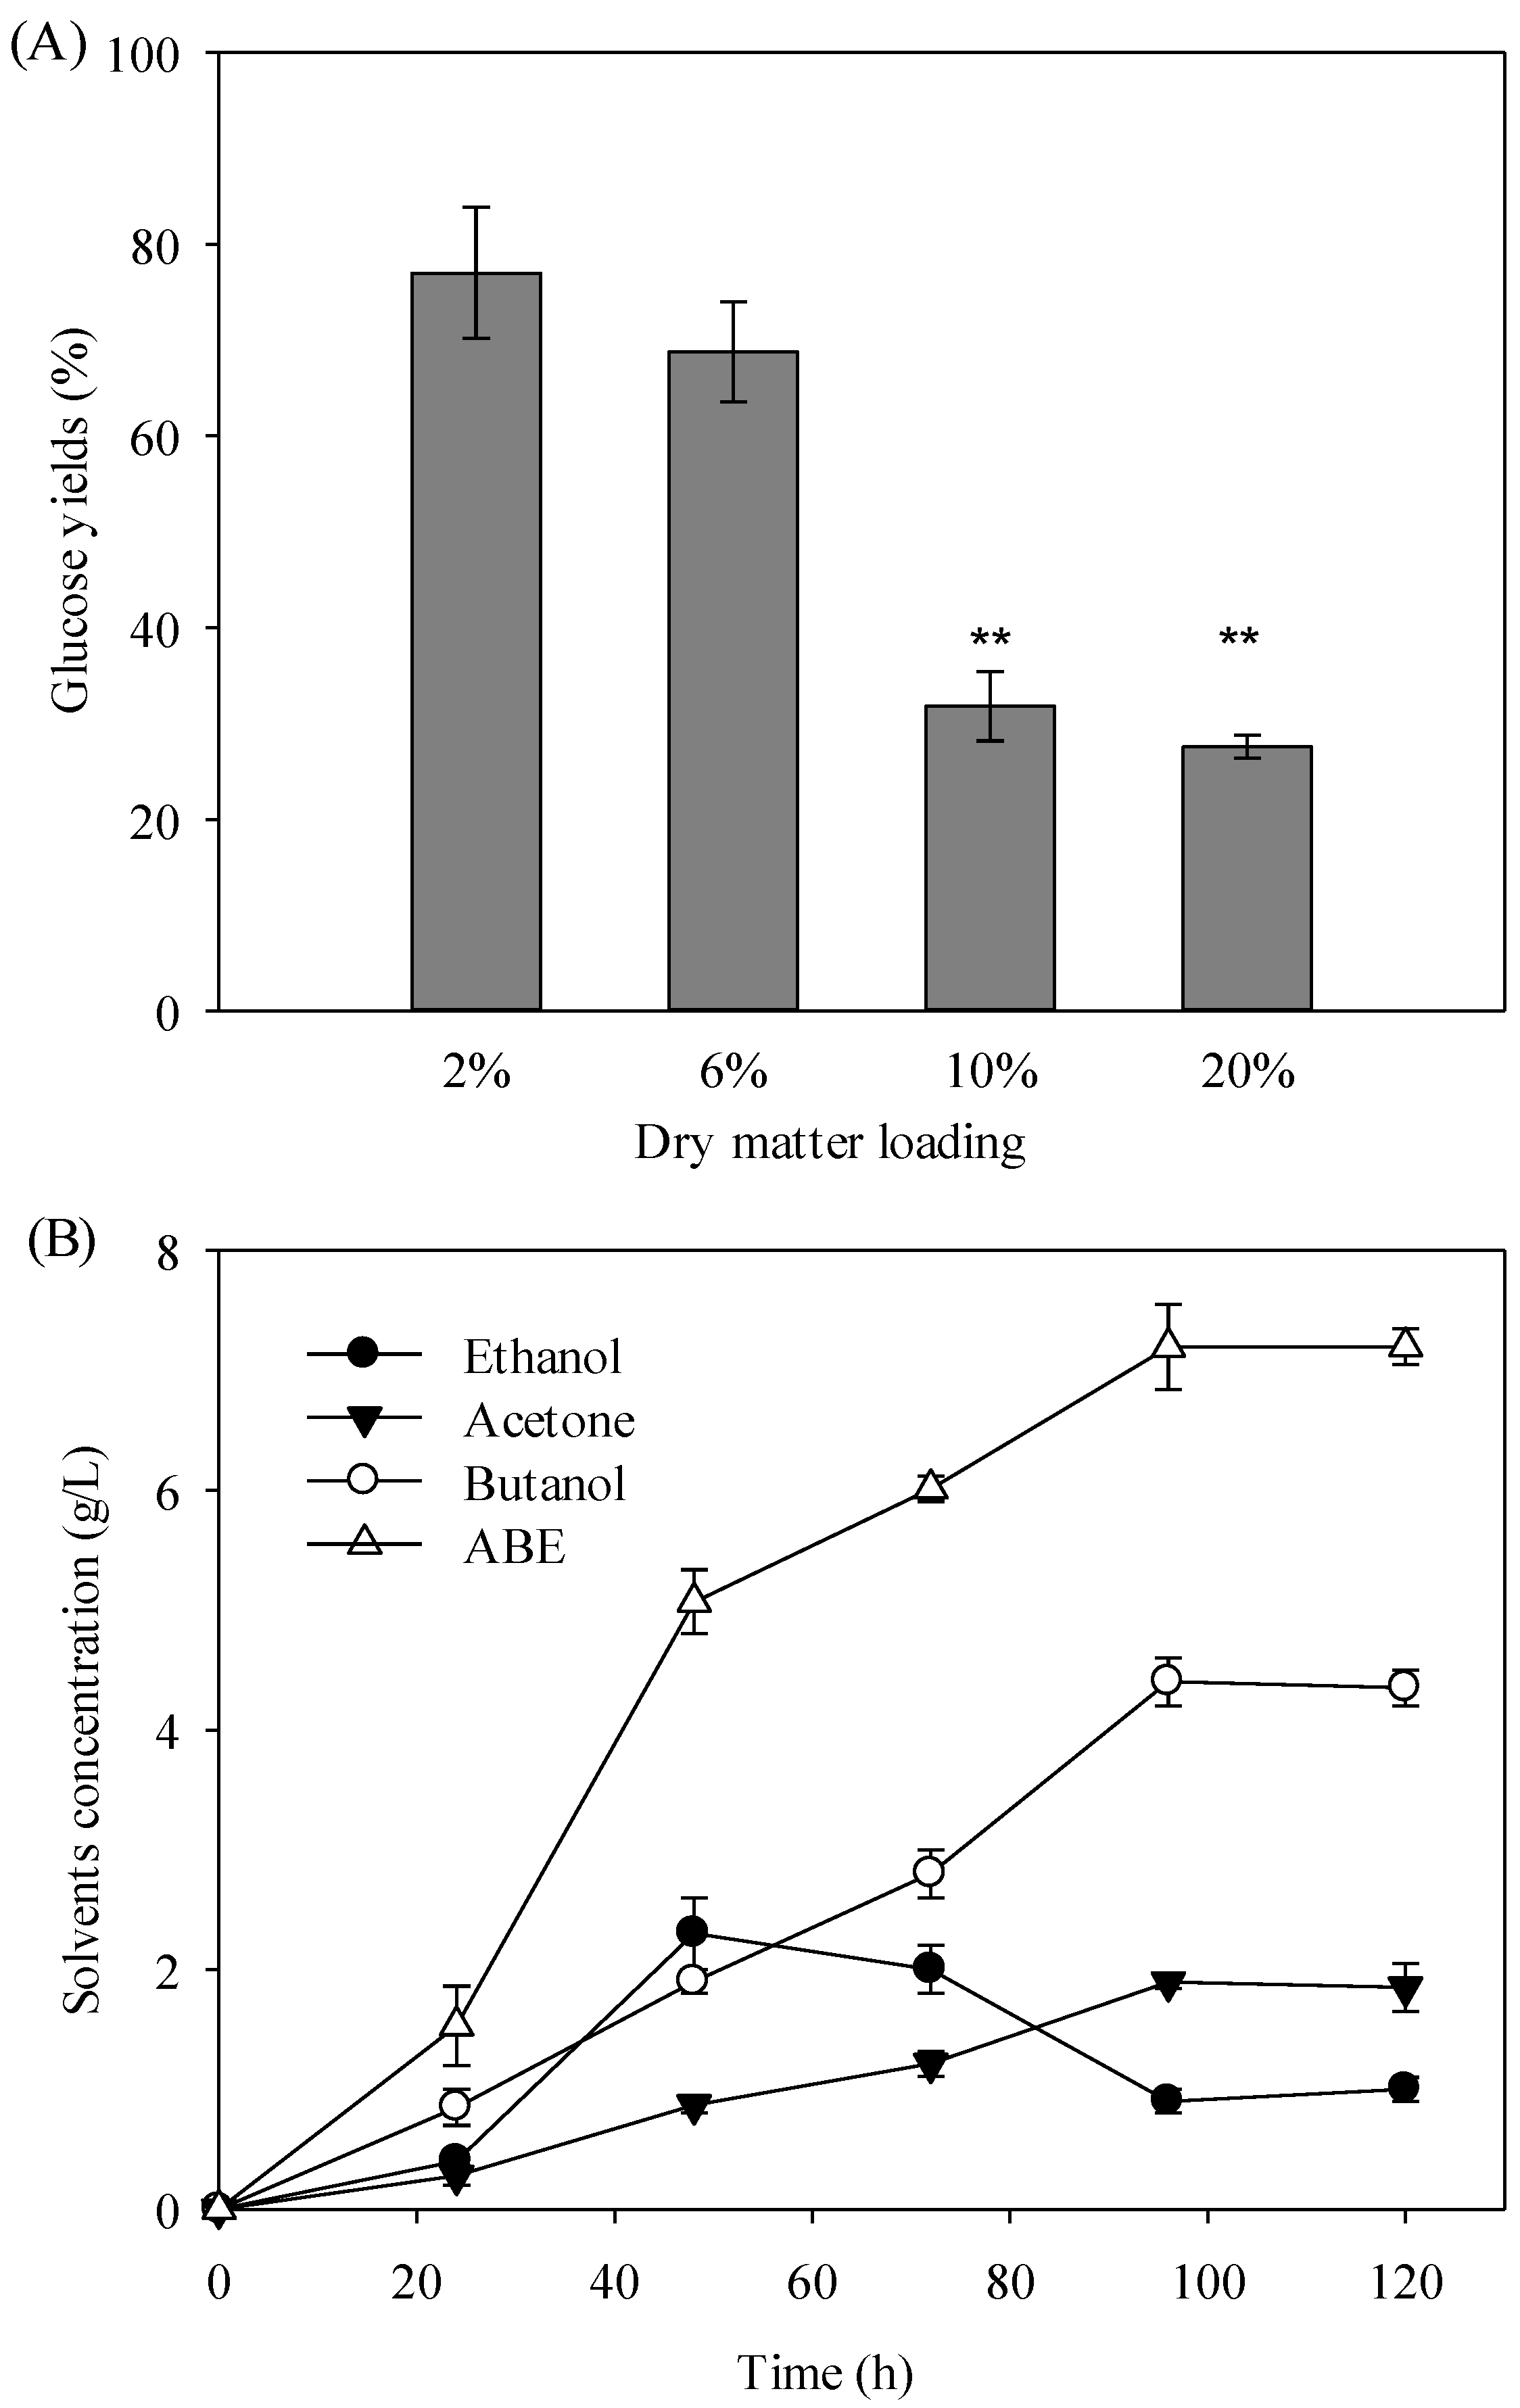
3.3. Direct Enzymatic Hydrolysis

The microalgal biomasses were first hydrolyzed by α-amylase and amyloglucosidase (Figure 3A). To simplify the process, the one-pot process was also performed at 50 °C in the water system, because under these conditions, a glucose yield of 87.5% can be obtained from pure starch. With increasing time, the hydrolysis yields of the freeze-dried, oven-dried, and wet biomass increased. After 48 h, the maximum glucose yields of 67.9%, 55.6%, and 74.0% were obtained, respectively. The yields of the freeze-dried and wet biomass were significantly higher (p < 0.01) than those of the oven-dried biomass. However, the glucose yields were lower than those obtained by the pretreatment with acids.
Since the Chlorella genus has rigid cell walls, the disruption of their structure by cellulase is an option to allow the amylases access to the intracellular starch, which would increase the hydrolysis yields. Thus, different dosages of cellulase were added to the hydrolysis system (Figure 3B). According to the results, there were no substantial increases in the hydrolysis yields with the action of cellulase below the dosage of 10 FPU/g. The oven-dried biomass produced lower glucose yields than the freeze-dry and wet biomasses. The glucose yield of the pure starch as a control was 93.5% with the addition of 10 FPU/g cellulase, which significantly increased (p < 0.05) compared with that without cellulase.
The results suggested that the wet biomass can also be directly used for enzymatic hydrolysis, and comparable glucose yields were obtained with the dry biomass. For the further optimization of the hydrolysis yields, the wet biomass was hydrolyzed in the system containing the citrate buffer and water, respectively. An approximately 98.0% glucose yield was obtained from the pure starch in the citrate buffer with the action of the enzyme mixture containing α-amylase, amyloglucosidase, and cellulase (Cel) (Figure 3C). The Cel alone can also hydrolyze starch, which could be the reason for the increase in glucose yield from starch with the help of the Cel (Figure 3B). With Cel alone, the glucose yield of the wet biomass was 9.4%, which was slightly lower than that of the dry biomass. With amy (α-amylase and amyloglucosidase), the glucose yield of the wet biomass significantly increased to 75.3%, and it slightly increased to 78.5% with the addition of Cel. The results were comparable to those of the freeze-dried biomass, but they were significantly higher (p < 0.01) than those of the oven-dried biomass. The glucose yields obtained in the water system were all lower than those obtained with the use of the citrate buffer (Figure 3D), which indicates the positive effect of the buffer solution on the enzymes. However, the cost issue must be considered, as we obtained 73.0% of the yield from the water system. The maximum glucose yield in this study was comparable to those of previous studies in which researchers used enzymes for hydrolysis (Table 3). Choi et al. (2010) obtained a sugar conversion of 0.57 g sugar/g of algal biomass with two different commercial enzymes, including amylase from B. licheniformis and glucoamylases from Aspergillus niger [41]. In the other example, Chlorococum humicola biomass was hydrolyzed with enzymes from Trichoderma reesei, obtaining a saccharification yield of 64.2% (w/w) [42].
According to the results presented here, using amylase and amyloglucosidase could efficiently hydrolyze the carbohydrates of the microalgal biomasses. It means that α-amylase and amyloglucosidase played central roles in the glucose release from the microalgal biomasses. We expected that the addition of cellulase would be conducive to the release of the starch in the microalgal cells, and promote hydrolysis efficiency. As reported earlier, the sugar release could be increased from 67 to 101 mg/g DW with the addition of cellulase [46]. However, no obvious effect of the cellulase on the hydrolysis efficiency was observed (Figure 3C,D). The results indicated that the energy-intensive physical pretreatment like in previous studies (Table 3) or expensive enzymatic pretreatment used in this study may not be necessary during the saccharification of microalgal biomasses. Although the glucose yield in this study was relatively lower than that in some of the other studies (Table 3), it is possible to adjust the hydrolysis conditions to maximize the amylase and amyloglucosidase activities instead of using the one-pot process, which would allow the glucose yields to be further increased.

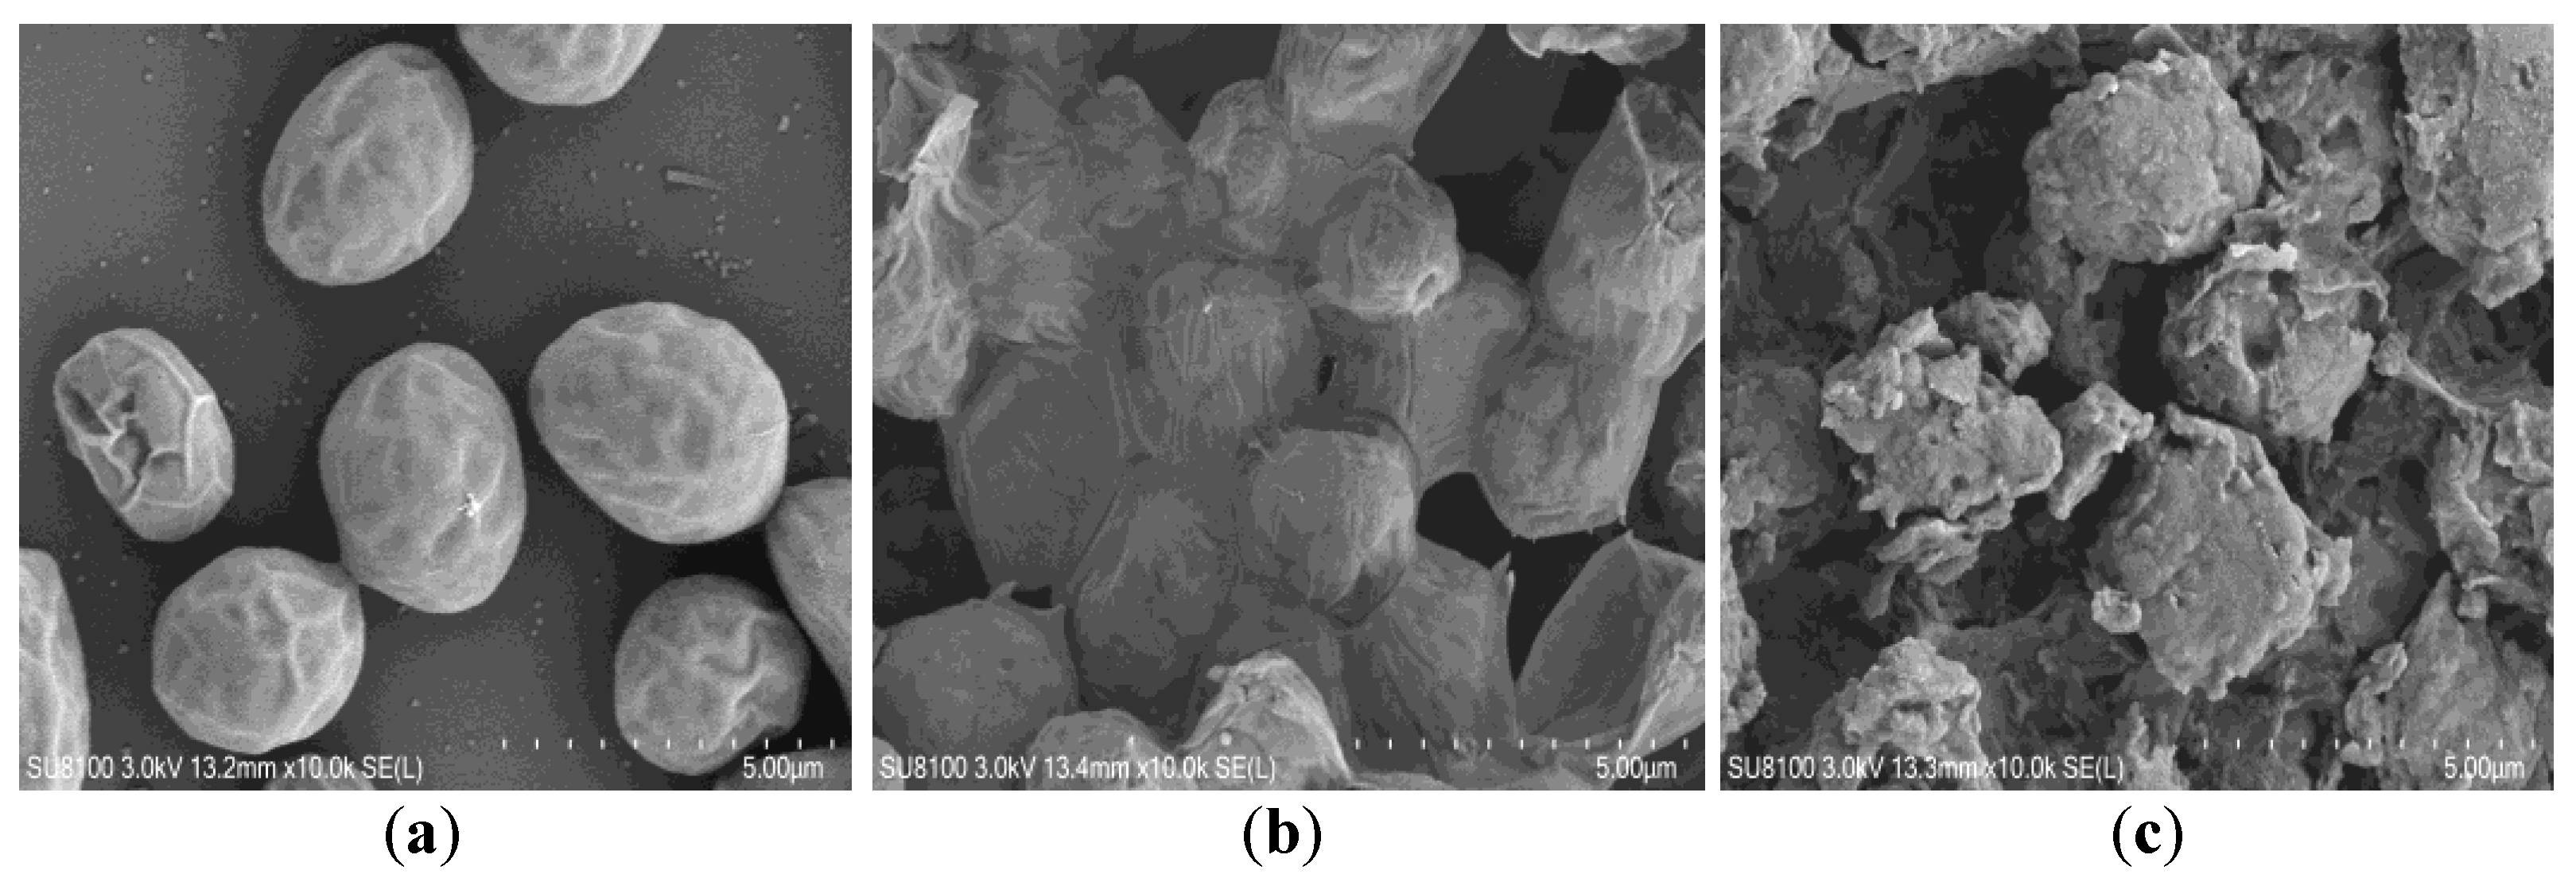
3.4. Cellular Morphology of Dry and Wet Microalgal Biomass

To investigate the reason why different enzymatic hydrolysis performances were observed with the wet and dry biomass, SEM analyses of the freeze-dried, oven-dried, and wet biomasses were conducted (Figure 4). The freeze-dried sample showed the individual cells, and they were intact and free of extracellular substance. However, the cells of the oven-dried sample were cross-linked together, which seems to create a barrier to the intercellular space, limiting the access for enzymes. There could be extracellular substances that tightly linked the cells and formed a “film” during the oven-drying. The wet samples showed irregular cellular morphology. We speculated that there were also exopolymeric substances in the wet biomasses, but they surrounded the cells loosely. According to the results of the enzymatic hydrolysis, the freeze-dried and wet biomasses produced higher glucose yields than the oven-dried biomass, which was possibly because of their different cellular structures. The “film” formed on the oven-dried biomasses probably prevented the accessibility of enzymes. Although wet biomasses also showed the extracellular substance, these substances could probably be dissolved during the hydrolysis in water, thus leaving the free cells to enzymes. As reported earlier, the morphology of microalgae cells could closely dictate the mechanism of enzyme adsorption on the microalgae surface [47].

3.5. Biobutanol Fermentation of Wet Microalgal Hydrolysate

The ability of the enzymatic hydrolysate of the wet microalgal biomass was tested to produce biobutanol via acetone–butanol–ethanol (ABE) fermentation. To reach a suitable glucose concentration for the fermentation, different DM loadings for enzymatic hydrolysis were investigated (Figure 5A). The results showed that there was no significant difference in glucose yield with 6% DM loading compared to 2%, indicating the feasibility of direct enzymatic hydrolysis with relatively higher DM loading. However, significantly lower yields were observed with 10 and 20% DM loadings. The corresponding glucose concentrations were shown in Table 4. Thus, the hydrolysates derived from 6% DM were fermented into ABE solvents. The hydrolysate produced a total of 7.2 g/L ABE over 96 h, of which 4.6 g/L was butanol, 2.5 g/L was acetone, and 1.5 g/L was ethanol (Figure 5B). The butanol and ABE yields were 0.22 and 0.35 g/g glucose, respectively, which were comparable to those obtained in previous studies on fermentation using C. acetobutylicum with sugars from microalgae [7,48,49,50].
Microalgae grown under appropriate conditions with high carbohydrates contents and simple pretreatment processes for cell rupture can serve as an efficient feedstock for ABE production [18]. Although the carbohydrates of the microalgal biomasses were as high as over 50%, the cultivation condition was under a sulfur limitation, which could have affected the biomass yields, leading to low carbohydrate productivity. In such a case, it is beneficial to choose an algal strain that has a very high carbohydrate content.
The butanol and ABE yields obtained from microalgal biomasses were comparable to those from liquefied starch [51], which suggests that the fermentation is no different from that of starchy materials, and that no inhibitory effect of the microalgal hydrolysate was observed. The fact was that the initial glucose concentration in the hydrolysate was only 23 g/L, which was not sufficient to further increase the ABE titers. As reported earlier, to achieve efficient ABE fermentation, the initial glucose concentration should be in the range of 50–60 g/L [18]. Therefore, improving the hydrolysis efficiency of high biomass loadings, similar to those attempts on lignocellulosic materials, could increase the feasibility of the commercial use of fresh microalgal biomasses for biofuel production.

4. Conclusions

The use of microalgae for biofuel production depends on the efficiency of the biomass processing, of which the drying process is costly and should be eliminated. This study confirmed that fresh biomass could be directly used for acidic and enzymatic hydrolysis, which produced 88.5% and 75% of glucose yields, respectively. The glucose yields were comparable to those of the freeze-dried biomass, and they were higher than those of the oven-dried biomass. The results suggest that the energy-intensive pretreatment is not necessary for the conversion of microalgal biomass to fermentable glucose. However, to obtain ideal glucose yields, a relatively higher acid concentration (e.g., 2%) is needed. Comparatively, with enzymes, only amylase and amyloglucosidase were effective, which indicates the potential for similar applications with starchy materials. The enzymatic hydrolysate of the fresh microalgal biomass was successfully applied for biobutanol fermentation, and the butanol and ABE yields were comparable to those of liquidized starch. However, there is space to further increase the biobutanol production by increasing the initial glucose content of the fermentation. Thus, improving the hydrolysis efficiency of high biomass loading could increase the feasibility of using fresh microalgal biomasses for biofuel production.

Author Contributions

Conceptualization, M.Y. and D.C.; methodology, J.Y. and C.Z.; validation, X.L. and L.Z.; formal analysis, Q.P. and Y.H.; investigation, J.Y.; writing—original draft preparation, M.Y. and J.Y.; writing—review and editing, G.L. and M.Y.; supervision, G.L. and M.Y. All authors have read and agreed to the published version of the manuscript.

Funding

This study was supported by the Hebei Natural Science Foundation (B2021204034), the Key Research and Development Program in Hebei Province (21322917D), the Fundamental Research Funds for the Provincial Universities of Hebei (KY2021040), and Start-up Fund for Introduced Talents of Hebei Agricultural University (YJ201910).

Institutional Review Board Statement

Not applicable.

Informed Consent Statement

Not applicable.

Data Availability Statement

Not applicable.

Conflicts of Interest

The authors declare no conflict of interest.

References

  1. Wang, Y.; Xu, H.; Yang, J.; Zhou, Y.; Wang, X.; Dou, S.; Li, L.; Liu, G.; Yang, M. Effect of sulfur limitation strategies on glucose-based carbohydrate production from Chlorella sorokiniana. Renew. Energy 2022, 200, 449–456. [Google Scholar] [CrossRef]
  2. Domozych, D.S.; Ciancia, M.; Fangel, J.U.; Mikkelsen, M.D.; Ulvskov, P.; Willats, W.G. The cell walls of green algae: A journey through evolution and diversity. Front. Plant Sci. 2012, 3, 82. [Google Scholar] [CrossRef] [PubMed]
  3. Demuez, M.; Mahdy, A.; Tomas-Pejo, E.; Gonzalez-Fernandez, C.; Ballesteros, M. Enzymatic cell disruption of microalgae biomass in biorefinery processes. Biotechnol. Bioeng. 2015, 112, 1955–1966. [Google Scholar] [CrossRef]
  4. Harun, R.; Danquah, M.K. Influence of acid pre-treatment on microalgal biomass for bioethanol production. Process Biochem. 2011, 46, 304–309. [Google Scholar] [CrossRef]
  5. Ho, S.H.; Huang, S.W.; Chen, C.Y.; Hasunuma, T.; Kondo, A.; Chang, J.S. Bioethanol production using carbohydrate-rich microalgae biomass as feedstock. Bioresour. Technol. 2013, 135, 191–198. [Google Scholar] [CrossRef] [PubMed]
  6. John, R.P.; Anisha, G.S.; Nampoothiri, K.M.; Pandey, A. Micro and macroalgal biomass: A renewable source for bioethanol. Bioresour. Technol. 2011, 102, 186–193. [Google Scholar] [CrossRef] [PubMed]
  7. Wang, Y.; Guo, W.; Cheng, C.L.; Ho, S.H.; Chang, J.S.; Ren, N. Enhancing bio-butanol production from biomass of Chlorella vulgaris JSC-6 with sequential alkali pretreatment and acid hydrolysis. Bioresour. Technol. 2016, 200, 557–564. [Google Scholar] [CrossRef]
  8. Naresh Kumar, A.; Chatterjee, S.; Hemalatha, M.; Althuri, A.; Min, B.; Kim, S.H.; Venkata Mohan, S. Deoiled algal biomass derived renewable sugars for bioethanol and biopolymer production in biorefinery framework. Bioresour. Technol. 2020, 296, 122315. [Google Scholar] [CrossRef]
  9. Ha, G.S.; El-Dalatony, M.M.; Kim, D.H.; Salama, E.S.; Kurade, M.B.; Roh, H.S.; El-Fatah Abomohra, A.; Jeon, B.H. Biocomponent-based microalgal transformations into biofuels during the pretreatment and fermentation process. Bioresour. Technol. 2020, 302, 122809. [Google Scholar] [CrossRef]
  10. Halim, R.; Harun, R.; Danquah, M.K.; Webley, P.A. Microalgal cell disruption for biofuel development. Appl. Energy 2012, 91, 116–121. [Google Scholar] [CrossRef]
  11. de Souza, M.F.; Rodrigues, M.A.; Freitas, S.P.; Bon, E.P.d.S. Effect of milling and enzymatic hydrolysis in the production of glucose from starch-rich Chlorella sorokiniana biomass. Algal Res. 2020, 50, 101961. [Google Scholar] [CrossRef]
  12. Zahoor; Wang, W.; Tan, X.; Guo, Y.; Zhang, B.; Chen, X.; Yu, Q.; Zhuang, X.; Yuan, Z. Mild Urea/KOH pretreatment to enhance enzymatic hydrolysis of corn stover with liquid waste recovery for plant growth. J. Clean. Prod. 2021, 284, 125392. [Google Scholar] [CrossRef]
  13. Zahoor; Wang, W.; Tan, X.; Imtiaz, M.; Wang, Q.; Miao, C.; Yuan, Z.; Zhuang, X. Rice straw pretreatment with KOH/urea for enhancing sugar yield and ethanol production at low temperature. Ind. Crops Prod. 2021, 170, 113776. [Google Scholar] [CrossRef]
  14. Wang, Q.; Wang, W.; Zahoor; Tan, X.; Zhuang, X.; Miao, C.; Guo, Y.; Chen, X.; Yu, Q.; Yuan, Z. Recycling of Black Liquor for Treating Sugarcane Bagasse at Low Temperature to Attain High Ethanol Production without Washing Step. ACS Sustain. Chem. Eng. 2020, 8, 17016–17021. [Google Scholar] [CrossRef]
  15. Menegazzo, M.L.; Fonseca, G.G. Biomass recovery and lipid extraction processes for microalgae biofuels production: A review. Renew. Sustain. Energy Rev. 2019, 107, 87–107. [Google Scholar] [CrossRef]
  16. Chen, C.Y.; Zhao, X.Q.; Yen, H.W.; Ho, S.H.; Cheng, C.L.; Lee, D.J.; Bai, F.W.; Chang, J.S. Microalgae-based carbohydrates for biofuel production. Biochem. Eng. J. 2013, 78, 1–10. [Google Scholar] [CrossRef]
  17. Shokrkar, H.; Ebrahimi, S.; Zamani, M. Bioethanol production from acidic and enzymatic hydrolysates of mixed microalgae culture. Fuel 2017, 200, 380–386. [Google Scholar] [CrossRef]
  18. Wang, Y.; Ho, S.H.; Yen, H.W.; Nagarajan, D.; Ren, N.Q.; Li, S.; Hu, Z.; Lee, D.J.; Kondo, A.; Chang, J.S. Current advances on fermentative biobutanol production using third generation feedstock. Biotechnol. Adv. 2017, 35, 1049–1059. [Google Scholar] [CrossRef]
  19. de Carvalho Silvello, M.A.; Severo Gonçalves, I.; Patrícia Held Azambuja, S.; Silva Costa, S.; Garcia Pereira Silva, P.; Oliveira Santos, L.; Goldbeck, R. Microalgae-based carbohydrates: A green innovative source of bioenergy. Bioresour. Technol. 2022, 344, 126304. [Google Scholar] [CrossRef]
  20. Guldhe, A.; Singh, B.; Rawat, I.; Ramluckan, K.; Bux, F. Efficacy of drying and cell disruption techniques on lipid recovery from microalgae for biodiesel production. Fuel 2014, 128, 46–52. [Google Scholar] [CrossRef]
  21. Zhou, N.; Zhang, Y.; Wu, X.; Gong, X.; Wang, Q. Hydrolysis of Chlorella biomass for fermentable sugars in the presence of HCl and MgCl2. Bioresour. Technol. 2011, 102, 10158–10161. [Google Scholar] [CrossRef]
  22. Kim, K.H.; Choi, I.S.; Kim, H.M.; Wi, S.G.; Bae, H.-J. Bioethanol production from the nutrient stress-induced microalga Chlorella vulgaris by enzymatic hydrolysis and immobilized yeast fermentation. Bioresour. Technol. 2014, 153, 47–54. [Google Scholar] [CrossRef]
  23. Miranda, J.R.; Passarinho, P.C.; Gouveia, L. Pre-treatment optimization of Scenedesmus obliquus microalga for bioethanol production. Bioresour. Technol. 2012, 104, 342–348. [Google Scholar] [CrossRef]
  24. Pôjo, V.; Tavares, T.; Malcata, F.X. Processing methodologies of wet microalga biomass toward oil separation: An overview. Molecules 2021, 26, 641. [Google Scholar] [CrossRef]
  25. Ngamsirisomsakul, M.; Reungsang, A.; Liao, Q.; Kongkeitkajorn, M.B. Enhanced bio-ethanol production from Chlorella sp. biomass by hydrothermal pretreatment and enzymatic hydrolysis. Renew. Energy 2019, 141, 482–492. [Google Scholar] [CrossRef]
  26. Wang, X.; Zhou, Y.; Peng, Q.; Han, Y.; Yang, J.; Xu, H.; Li, C.; Li, L.; Dou, S.; Yang, M.; et al. Development of plastic flatbed-based algal culture system deployable on non-arable land. Algal Res. 2022, 66, 102814. [Google Scholar] [CrossRef]
  27. Wychen, S.V.; Laurens, L.M.L. Determination of Total Carbohydrates in Algal Biomass; NREL: Golden, CO, USA, 2013. [Google Scholar]
  28. Mishra, S.K.; Suh, W.I.; Farooq, W.; Moon, M.; Shrivastav, A.; Park, M.S.; Yang, J.W. Rapid quantification of microalgal lipids in aqueous medium by a simple colorimetric method. Bioresour. Technol. 2014, 155, 330–333. [Google Scholar] [CrossRef]
  29. Wang, Y.; Guo, X.; Li, K.; Nan, Y.; Wang, J.; Zhang, J.; Dou, S.; Li, L.; Liu, G.; Yang, M. Comparison of a solvent mixture assisted dilute acid and alkali pretreatment in sugar production from hybrid Pennisetum. Ind. Crops Prod. 2019, 141, 111806. [Google Scholar] [CrossRef]
  30. Yang, M.; Kuittinen, S.; Vepsalainen, J.; Zhang, J.; Pappinen, A. Enhanced acetone-butanol-ethanol production from lignocellulosic hydrolysates by using starchy slurry as supplement. Bioresour. Technol. 2017, 243, 126–134. [Google Scholar] [CrossRef] [PubMed]
  31. Hirsch, A.; Grinsted, E. Methods for the growth and enumeration of anaerobic spore-formers from cheese, with observations on the effect of nisin. J. Dairy Res. 1954, 21, 101–110. [Google Scholar] [CrossRef]
  32. Cai, D.; Zhang, T.; Zheng, J.; Chang, Z.; Wang, Z.; Qin, P.Y.; Tan, T.W. Biobutanol from sweet sorghum bagasse hydrolysate by a hybrid pervaporation process. Bioresour. Technol. 2013, 145, 97–102. [Google Scholar] [CrossRef]
  33. Dragone, G.; Fernandes, B.D.; Abreu, A.P.; Vicente, A.A.; Teixeira, J.A. Nutrient limitation as a strategy for increasing starch accumulation in microalgae. Appl. Energy 2011, 88, 3331–3335. [Google Scholar] [CrossRef]
  34. Ran, W.; Wang, H.; Liu, Y.; Qi, M.; Xiang, Q.; Yao, C.; Zhang, Y.; Lan, X. Storage of starch and lipids in microalgae: Biosynthesis and manipulation by nutrients. Bioresour. Technol. 2019, 291, 121894. [Google Scholar] [CrossRef]
  35. Yang, M.; Kuittinen, S.; Zhang, J.; Keinanen, M.; Pappinen, A. Effect of dilute acid pretreatment on the conversion of barley straw with grains to fermentable sugars. Bioresour. Technol. 2013, 146, 444–450. [Google Scholar] [CrossRef]
  36. Thu, N.M.; Choi, S.P.; Lee, J.; Lee, J.H.; Sim, S.J. Hydrothermal acid pretreatment of Chlamydomonas reinhardtii biomass for ethanol production. J. Microbiol. Biotechnol. 2009, 19, 161–166. [Google Scholar] [CrossRef]
  37. Kumar, V.B.; Pulidindi, I.N.; Kinel-Tahan, Y.; Yehoshua, Y.; Gedanken, A. Evaluation of the potential of Chlorella vulgaris for bioethanol production. Energy Fuels 2016, 30, 3161–3166. [Google Scholar] [CrossRef]
  38. Harun, R.; Jason, W.S.Y.; Cherrington, T.; Danquah, M.K. Exploring alkaline pre-treatment of microalgal biomass for bioethanol production. Appl. Energy 2011, 88, 3464–3467. [Google Scholar] [CrossRef]
  39. Onay, M. Bioethanol production via different saccharification strategies from H. tetrachotoma ME03 grown at various concentrations of municipal wastewater in a flat-photobioreactor. Fuel 2019, 239, 1315–1323. [Google Scholar] [CrossRef]
  40. Ho, S.H.; Li, P.J.; Liu, C.C.; Chang, J.S. Bioprocess development on microalgae-based CO2 fixation and bioethanol production using Scenedesmus obliquus CNW-N. Bioresour. Technol. 2013, 145, 142–149. [Google Scholar] [CrossRef] [PubMed]
  41. Choi, S.P.; Nguyen, M.T.; Sim, S.J. Enzymatic pretreatment of Chlamydomonas reinhardtii biomass for ethanol production. Bioresour. Technol. 2010, 101, 5330–5336. [Google Scholar] [CrossRef]
  42. Harun, R.; Danquah, M.K. Enzymatic hydrolysis of microalgal biomass for bioethanol production. Chem. Eng. J. 2011, 168, 1079–1084. [Google Scholar] [CrossRef]
  43. de Farias Silva, C.E.; Meneghello, D.; Bertucco, A. A systematic study regarding hydrolysis and ethanol fermentation from microalgal biomass. Biocatal. Agric. Biotechnol. 2018, 14, 172–182. [Google Scholar] [CrossRef]
  44. Alam, M.A.; Yuan, T.; Xiong, W.; Zhang, B.; Lv, Y.; Xu, J. Process optimization for the production of high-concentration ethanol with Scenedesmus raciborskii biomass. Bioresour. Technol. 2019, 294, 122219. [Google Scholar] [CrossRef] [PubMed]
  45. Cheng, J.; Sun, J.; Huang, Y.; Feng, J.; Zhou, J.; Cen, K. Dynamic microstructures and fractal characterization of cell wall disruption for microwave irradiation-assisted lipid extraction from wet microalgae. Bioresour. Technol. 2013, 150, 67–72. [Google Scholar] [CrossRef]
  46. Hernández, D.; Riaño, B.; Coca, M.; García-González, M.C. Saccharification of carbohydrates in microalgal biomass by physical, chemical and enzymatic pre-treatments as a previous step for bioethanol production. Chem. Eng. J. 2015, 262, 939–945. [Google Scholar] [CrossRef]
  47. Ma, Y.; Wang, P.; Wang, Y.; Liu, S.; Wang, Q.; Wang, Y. Fermentable Sugar Production from Wet Microalgae Residual after Biodiesel Production Assisted by Radio Frequency Heating. Renew. Energy. 2020, 155, 827–836. [Google Scholar] [CrossRef]
  48. van der Wal, H.; Sperber, B.L.; Houweling-Tan, B.; Bakker, R.R.; Brandenburg, W.; Lopez-Contreras, A.M. Production of acetone, butanol, and ethanol from biomass of the green seaweed Ulva lactuca. Bioresour. Technol. 2013, 128, 431–437. [Google Scholar] [CrossRef]
  49. Ellis, J.T.; Hengge, N.N.; Sims, R.C.; Miller, C.D. Acetone, butanol, and ethanol production from wastewater algae. Bioresour. Technol. 2012, 111, 491–495. [Google Scholar] [CrossRef] [PubMed]
  50. Efremenko, E.N.; Nikolskaya, A.B.; Lyagin, I.V.; Senko, O.V.; Makhlis, T.A.; Stepanov, N.A.; Maslova, O.V.; Mamedova, F.; Varfolomeev, S.D. Production of biofuels from pretreated microalgae biomass by anaerobic fermentation with immobilized Clostridium acetobutylicum cells. Bioresour. Technol. 2012, 114, 342–348. [Google Scholar] [CrossRef] [PubMed]
  51. Ezeji, T.C.; Qureshi, N.; Blaschek, H.P. Production of acetone butanol (AB) from liquefied corn starch, a commercial substrate, using Clostridium beijerinckii coupled with product recovery by gas stripping. J. Ind. Microbiol. Biotechnol. 2007, 34, 771–777. [Google Scholar] [CrossRef]
Figure 1. Biochemical composition of freeze-dried, oven-dried, and wet microalgal biomasses.
Fermentation 09 00284 g001
Figure 2. Glucose yields of freeze-dried, oven-dried, and wet microalgal biomasses obtained by acidic pretreatment followed by enzymatic hydrolysis: (A) yields of glucose released to hydrolysates after pretreatment by different concentrations of acid; the * indicate the significant differences (p < 0.05) of freeze-dried and oven-dried samples compared to wet sample; (B) yields of glucose released after residue hydrolysis by amy (α-amylase and amyloglucosidase) and cellulase; the * indicate the significant differences (p < 0.05) of freeze-dried and oven-dried samples compared to wet sample; (C) total glucose yields with a combination of pretreated and enzymatic hydrolysates; the ** indicate the significant differences (p < 0.01) of samples pretreated by 0.5% sulfuric acid compared to that pretreated by water and other acid concentrations.
Fermentation 09 00284 g002
Figure 3. Enzymatic hydrolysis of pure starch, freeze-dried, oven-dried, and wet microalgal biomasses: (A) with the amy enzyme mixture (α-amylase and amyloglucosidase); the * indicates the significant differences (p < 0.05) of the oven-dried sample compared to the freeze-dried and wet samples; (B) with the addition of different dosages of cellulase in the amy enzyme mixture; the * indicates the significant differences (p < 0.05) of the samples hydrolyzed with cellulase compared to those without cellulase; (C) with Na–citrate buffer system; Cel, cellulase; amy, α-amylase, and amyloglucosidase mixture; Cel and amy, mixture of cellulase and amy; the * indicates the significant differences (p < 0.05) of the oven-dried sample compared to the freeze-dried and wet samples; (D) with water system; Cel, cellulase; amy, α-amylase, and amyloglucosidase mixture; Cel+Amy, mixture of cellulase and amy; the * indicates the significant differences (p < 0.05) of the oven-dried sample compared to the freeze-dried and wet samples.
Fermentation 09 00284 g003
Figure 4. SEM analysis of freeze-dried (a), oven-dried (b), and wet (c) microalgal cells.
Fermentation 09 00284 g004
Figure 5. Acetone–butanol–ethanol (ABE) fermentation of enzymatic hydrolysate from fresh microalgal biomass: (A) glucose concentration of fresh biomass with addition of different dry matter, the ** indicates the significant differences (p < 0.01) of the 10% and 20% dry matter loading compared to 2% and 6%; (B) dynamics of solvent concentrations during fermentation.
Fermentation 09 00284 g005
Table 1. Detailed information on the enzymes used in this study.
EnzymesSourceActivityOptimum Temperature (°C)Optimum pH
α-amylaseAspergillus oryzae40,000 µ/g55–1005.2–6.0
AmyloglucosidaseAspergillus niger100,000 µ/mL58–624.2–4.5
CellulaseA blend of aggressive cellulases, high level of β-glucosidases and hemicellulase176 FPU/mL45–504.5–5.0
Table 2. Glucose yields of algae biomasses obtained by chemical hydrolysis.
MicroalgaeSubstratesPretreatment/Hydrolysis MethodsGlucose Yields (%)References
Chlorella vulgaris FSP-ELyophilized 1% (v/v) H2SO4 at 120 °C for 20 min93.6[5]
Chlorella sp. TIB-A01Dried at 60 °C 2% HCl and 2.5% MgCl2 at 180 °C for 10 min64.21[21]
Scenedesmus obliquusOven-dried
at 80 °C
2 N H2SO4
at 120 °C for 30 min
95.6[23]
Chlorella vulgarisDried in a sunbath for 24 h1 M HCl at 120 °C for 60 min23[37]
Chlorococcum infusionumOven dried at 60 °C overnight and milled0.75% (w/v) NaOH at 120 °C for 30 min350 mg/g
Biomass
[38]
Hindakia tetrachotoma ME03Lyophilized1M HCl at 121 °C for 30 min90.3[39]
Scenedesmus obliquus CNW-NWet2% (v/v) H2SO4 at 120 °C for 20 min96–98[40]
Chlorella sorokiniana UTEX 1230Wet2% (w/v) H2SO4 at 120 °C for 60 min88.5This study
Table 3. Glucose yields from algal biomasses obtained by enzymatic hydrolysis.
Microalgae SubstratesPretreatmentsEnzymes Glucose Yields (%)References
Chlorella vulgaris FSP-ELyophilized Sonication and autoclave Endoglucanase, β-glucosidase and amylase90.4[5]
Chlorella sorokiniana UTEX 1663Freeze-dried
Wet
MillingCellulase and amylase80.14
11.56
[11]
Chlorella Vulgaris UTEX 26Freeze-
dried
Autoclave, sonication, and millingPectinase79[22]
Chlorella vulgarisDriedMilledAmylases, cellulase/hemicellulase, and pectinases92[43]
Scenedesmus raciborskii ZKMTFreeze-
dried
Ground and sieving Cellulase, α-amylase and
amyloglucosidase
91.47[44]
Chlorella variabilis NC64A WetVirus infectionα-amylase and amyloglucosidase43.4[45]
Chlorellasorokiniana UTEX 1230WetAutoclaveα-amylase and
amyloglucosidase
83.4This study
Chlorella sorokiniana UTEX 1230Wet Noα-amylase and
amyloglucosidase
78.7This study
Table 4. The glucose concentrations in the hydrolysates derived from different dry matter loading.
Dry Matter Loading (%) Glucose Concentrations (g/L)
28.0 ± 0.7
623.0 ± 1.4
1016.5 ± 1.9
2028.6 ± 1.2
Disclaimer/Publisher’s Note: The statements, opinions and data contained in all publications are solely those of the individual author(s) and contributor(s) and not of MDPI and/or the editor(s). MDPI and/or the editor(s) disclaim responsibility for any injury to people or property resulting from any ideas, methods, instructions or products referred to in the content.

