Article

A Human and Animal Based Study Reveals That a Traditionally Fermented Rice Beverage Alters Gut Microbiota and Fecal Metabolites for Better Gut Health

1
Molecular Biology and Microbial Biotechnology Laboratory, Institute of Advanced Study in Science and Technology, Guwahati 781035, Assam, India
2
Department of Bioengineering and Technology, Gauhati University, Guwahati 781014, Assam, India
3
Department of Molecular Biology and Biotechnology, Cotton University, Guwahati 781003, Assam, India
*
Author to whom correspondence should be addressed.
Fermentation 2023, 9(2), 126; https://doi.org/10.3390/fermentation9020126
Submission received: 22 December 2022 / Revised: 13 January 2023 / Accepted: 13 January 2023 / Published: 28 January 2023

Abstract

:
Fermented rice beverages are consumed globally, especially in Southeast Asia. In India, such beverages are consumed by a substantial population of ethnic communities. In this study, the gut bacterial diversity of rice beverage drinkers from Assam, India (n = 27) was compared with that of nondrinkers (n = 21) with the next-generation sequencing (NGS) of fecal metagenomic 16S rDNA, which indicated changes in 20 bacterial genera. Further, mice (n = 6, per treatment group) were gavaged daily for 30 days with different fractions of the beverage, which included rice beverage (RB), soluble (SF), and insoluble fractions (IF) to determine the effects of different components of the beverage. A comparison of gut bacteria at two time points, 0 and 30 days of treatments, suggested changes in 48 bacterial genera across the different treatment groups in mice. Major bacterial changes were suggestive of functional components associated with gut health, as observed in both humans and mice. Next, the Gas Chromatography–Mass Spectrometry (GC–MS) of mice stool after 30 days of treatments showed a total of 68 metabolites, of which hexadecanoic acid, a flavor component of this beverage, was present in the feces of all mouse treatment groups except controls. These metabolites showed treatmentwise clustering in groups in a partial least-squares discriminant analysis (PLS–DA) plot. Blood endotoxin levels were lower in all treatment groups in the mice compared to those of the controls. The findings of the study are suggestive of the gut modulatory effects of the beverage on the basis of the observed features of the bacterial changes.

Graphical Abstract

1. Introduction

Microbes residing in the intestine, collectively called the ‘gut microbiota’, influence the health and well being of the host. Some important functions of the gut microbiota include metabolic functions and energy salvage, the production of short-chain fatty acids (SCFAs) and vitamins, strengthening the immune system, and preventing colonization from pathogens [1]. Microbes colonize the host gradually after birth through a complex process of host–microbe interactions [2]. The disturbance of microbiota composition leads to a condition called dysbiosis that implicates diseased conditions such as allergies, inflammatory bowel disease, obesity, diabetes, and cancer [3]. Various factors, such as diet, genetics, ethnicity, and environmental conditions, affect the microbiota and its functions, of which diet plays the dominant role [4]. In recent years, extensive studies have unveiled an understanding of the relationships between the gut microbiota and diet [5]. There are studies reporting the modulation of the human gut microbiota and immunity via dietary interventions that included fermented foods [6]. Interestingly, fermented foods and beverages are gaining global popularity not only because of their organoleptic properties, but also for their health benefits. These foods confer several benefits to human health and modulate the composition of the host’s gut microbiota [7]. Derrien and van Hylckama (2015) described three possible mechanisms by which the health-beneficial microbes, when ingested, affect the host: (1) trophic interactions (e.g., production of SCFA), (2) the direct inhibition of pathogens (by producing bacteriocins, lowering the pH, etc.), and (3) indirectly, via the production of host-derived molecules (IgA, mucins, etc.) [8]. The preparation and consumption of different fermented foods are practised as a culinary art by many ethnic communities of Northeast India [9]. Tiwa is an eminent community of Northeast India residing mainly in the Morigaon, Kamrup, and Karbi Anglong districts of Assam. The diet of Tiwas mostly includes rice, along with several indigenous herbs and meat products. The edible plants and wild vegetation are often utilised for the preparation of several food products, and preserved by drying or fermentation. The preparation of the rice beverage by the Tiwa community utilises their traditional knowledge of the use of medicinal plants and the fermentation process. The fermentation process is carried out using a traditional starter cake that is prepared using different plants and serves as an inoculum. The starter consists of amylolytic and alcohol-fermenting microbes, and lactic acid bacteria that act synchronously upon the rice substrate, resulting in an alcoholic beverage. During the fermentation process, rice starch is broken down into sugars that are further converted into alcohol, acids, and other metabolites through the action of different microbes. Biochemical analyses of the beverage detected the presence of microbe-originated organic acids such as lactic acid, amino acids, and prebiotic sugars such as raffinose and trehalose [10]. Antimicrobial activities against common pathogens and antioxidant properties based on free radical scavenging were also studied by different groups [11,12]. Besides regular consumption, it is traditionally acclaimed for having health-modulating effects for insomnia, headaches, body aches, inflammation, diarrhea, and urinary problems [13]. Previously, we had reported the presence of lactic acid bacteria and prebiotics in this beverage [14,15]. A very recent review summarised the microbial diversity of the beverage, including probiotics along with metabolites conferring prebiotic attributes. The beverage has been reported as “symbiotic” along with its immunity-enhancing properties [16]. The present study was conducted to understand the effect of the beverage consumed by the Tiwa community on the gut microbes of humans, followed by a study of other parameters such as metabolites and intestinal morphology in mice using the high-throughput NGS technique and GC–MS analyses. The use of the mouse model allowed for controlled interventions that were difficult in humans because of confounding factors. It was hypothesised that the consumption of the rice beverage might be associated with changes in the gut microbiota and other health parameters. Accordingly, gut bacteria in humans were compared between drinker and nondrinker volunteers of the Tiwa community. Mice were treated with different fractions of the rice beverage to determine the distinct effects. To the best of our knowledge, the present study is the first to report on effects of the traditionally fermented rice beverage of Northeast India on the gut microbiota through studies on human and mouse models.

2. Materials and Methods

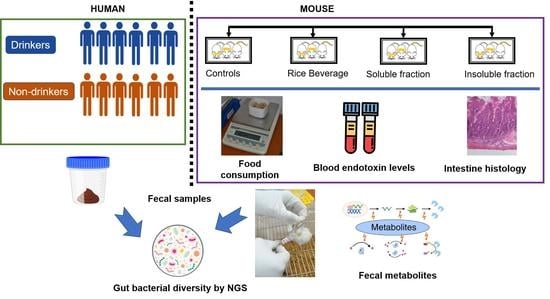
2.1. Recruitment of Human Subjects and Collection of Samples

Before the study, a survey was conducted in villages where the Tiwa community is dominant and for their willingness to participate in the study. The volunteers were recruited using written informed consent and a bilingual (English and Assamese) questionnaire, from the Morigaon district of Assam, India. Inclusion criteria for the study were ethnicity, age (18–60 years), and the consumption of the beverage; those taking antibiotics or other drugs were excluded. A total of 48 participants, both males and females, belonging to the Tiwa community were selected on the basis of their rice beverage drinking habits and classified as drinkers or nondrinkers. Height, weight, pulse rate, blood group, and blood pressure were determined during their visit to the sample collection site. The stool samples were collected in sterile containers with a spoon attachment (HIMEDIA, Mumbai, India). Then, 3 mL of blood was withdrawn in vacutainer collection tubes (BD, New Jersey, USA). The samples were brought to the laboratory in frozen conditions. The biochemical parameters of blood, namely, gamma-glutamyltransferase GGT), albumin, globulin, total protein, and blood sugar, were determined using standard kits (Tulip Diagnostics, India) following the manufacturer’s instructions. The human study was approved by the institutional ethics committee (approval no. IEC(HS)/IASST/1082/2014-15/6).

2.2. Rice Fermentation

Rice was fermented following the traditional knowledge of the Tiwa community of Assam, India. The starter cake was prepared in the laboratory as described in the patent filed earlier [17]. One kg of rice was boiled to cook and allowed to cool-down to room temperature. A 30 g of the starter cake was crushed to produce a homogeneous powder, mixed with the rice, and kept for fermentation at 30 C. After fermentation, the mass was filtered, and the liquid (RB) was harvested and centrifuged at 5000 rpm for 10 min to separate the supernatant containing the soluble fraction (SF); the pellet was resuspended in sterile water to the initial volume, denoted as the insoluble fraction (IF). The biochemical parameters of the beverage were discussed in our earlier report [14].

2.3. Mouse Experiment

Five-week-old male Swiss albino mice (n = 6 per group) were used for this study. The animals were housed in polypropylene cages (cat. no. 041000 Tarsons, India), and a standard rodent chow diet, drinking water, and a 12 h day/night cycle were maintained throughout the experiment. Dietary intakes per cage and body weight per animal were monitored during the experimental period. After a 7-day acclimatization period, the animals were divided randomly into four treatments: control (CT), rice beverage (RB), insoluble fraction (IF), and soluble fraction (SF). A total of 200–230 μ L of RB, IF, and SF were administered, whereas the controls (CT) received sterile water using gavage. The dosage was equivalent to the reported human intake of the beverage based on their body weight to produce a consistent gavage volume [10]. The treatments were performed once daily in the morning. fecal samples of individual animals were collected on the 0th and 30th days of treatments, and immediately stored at −80 C. On the 30th day, animals from each group were sacrificed, and the intestines were collected for histology. All experiments were conducted following the guidelines of the Committee for the Purpose of Control and Supervision of Experiments on Animals (CPCSEA), Ministry of the Environment, Forests, and Climate Change, Government of India, and approved by the institutional animal ethics committee (approval no. IASST/IAEC/2016-17/07).

2.4. Isolation of Fecal Metagenomic DNA and Next-Generation Sequencing (NGS) Analyses

Metagenomic DNA was extracted from the fecal samples of humans and three animals from each treatment group using a QIAGEN DNA Stool Mini-Kit (QIAGEN, Hilden, Germany) following the instructions, and subjected to NGS analysis with sequencing service provider Macrogen Inc. (Seoul, Republic of Korea). The PCR amplification of metagenomic DNA was performed using 341F-805R primer pairs spanning the V3–V4 (Bakt 341F, CCTACGGGNGGCWGCAG Bakt 805R, GACTACHVGGGTATCTAATCC ) region of the 16S rDNA gene. The NGS library was prepared using the Nextera XT library preparation kit according to the Illumina MiSeq protocol (Illumina Inc., California, USA, 2017). Sequencing was carried out on an Illumina MiSeq machine (MiSEq 2500) following 2 × 300 bp paired-end chemistry with the multiplexed pooled samples. The NGS data were analysed using the phyloseq (version 1.30.0) package in RStudio with R (version 3.6.3). Analyses of read quality, the filtering and trimming of sequences, the calculation of error rates, sample inference, and the merging and removal of chimera were performed with reference-free divisive amplicon denoising algorithm 2 (Dada2, version 1.16.0) [18]. Sequences having a minimal Phred score of 25 were considered for analysis, and forward and reverse sequences were truncated at 280 and 250 bp, respectively, for a proper merging. A distinct ASV table was constructed, and bacterial taxonomy was assigned from the Silva database (release 138) at 99% homology [19]. The diversity of the bacterial communities was established and statistical analyses were performed using the vegan package (2.6-2); results were visualised using the ggplot2 (version 3.3.0) and ggpubr (version 0.4.0) packages [20,21]. Alpha diversity, a measure of species richness and evenness within a single sample, was used to compare the taxon diversity between the fecal samples. Beta diversity was estimated to measure changes in the compositions of the bacterial communities. Jaccard and Bray–Curtis beta diversity indices were used for qualitative and quantitative measurements, respectively, of community differences.

2.5. Nontargeted Fecal Metabolite Profiling of Mice Feces via Gas Chromatography–Mass Spectrometry (GC–MS)

Fecal sample preparations and the GC–MS run program were followed as per the protocol described elsewhere, with slight modifications [22]. Briefly, 10 mg of fecal sample from each animal was extracted with 50 μ L of 3:2:2 isopropanol:acetonitrile:water and centrifuged at 14,000 rpm for 5 min. A 25 μ L of methoxyamine hydrochloride, dissolved in pyridine (15 mg/mL), was added to the extract and incubated at 60 C for 45 min. A 50 μ L of N-methyl-N-trimethylsilyltrifluoroacetamide with 1% trimethylchlorosilane was added, and samples were further incubated at 60 C for 30 min, centrifuged at 3000 rpm for 5 min, and brought to room temperature before injecting. Analysis was carried out on a Shimadzu GC 2010 Plus-triple Quadrupole (TP-8030) GC–MS/MS system fitted with an EB-5MS column (length 30 m, thickness 0.25 μ m and ID, 0.25 mm). The programme consisted of 80 C for 30 s, a ramp of 15 C/min to 330 C, and an 8 min hold. Masses in the range of 50–650 m/z were scanned at 5 scans/s after electron impact ionisation. The mass spectra were matched in the National Institute of Standards and Technology library, USA. Noisy peaks and column bleeds were removed before data analysis. Partial least-squares discriminant analysis of the fecal metabolites on the 30th day of treatment was performed using Metaboanalyst [23].

2.6. Assay of Plasma Endotoxin

Endotoxin concentration in the mouse plasma was determined with Pierce LAL Chromogenic Endotoxin Quantitation Kit (Thermo Fisher Scientific) following the manufacturer’s instructions. A standard linear graph was prepared using Escherichia coli endotoxin within the range of 0.1–1.0 EU/mL. A 100 μ L of the plasma sample was used for assay, and the endotoxin concentration is expressed as EU/mL.

2.7. Histology of Ileum

About 2–3 cm of the distal part of the ileum was isolated and fixed in Carnoy’s solution (60% ethanol, 30% chloroform, and 10% glacial acetic acid). After 2 h of fixation, tissues were dehydrated in graded alcohol (50–100%) and lastly cleared in xylene. The clear tissues were embedded in paraffin and cut into 3–5 μ m thickness using a microtome (Leica RM 2235, Wetzlar, Germany). The tissue sections were stained with haematoxylin and eosin (HE), the villus length was measured from the base to the top of the villus, and the crypt depth was measured between the crypt–villus junction and the base of the crypt [24]. The histological sections were examined using a light microscope (ZEISS Axio Lab.A1, Carl Zeiss Microscopy GmbH, Oberkochen Germany) and ZEISS Zen Microscopy software for imaging without knowledge of the origin of the tissue samples.

2.8. Statistical Analyses

The relative abundance data of the selected bacterial genera at 0th and 30th days of treatment were compared using the Mann–Whitney U test within SPSS (IBM SPSS 20, SPSS Inc., Chicago, IL, USA). The Kruskal–Wallis H test was performed to determine the differences in diversity indices. One-way ANOVA was performed to determine the differences in plasma endotoxin levels within SigmaPlot (Systat Software Inc., San Jose, CA, USA).

3. Results

3.1. Dietary and Anthropometric Features of the Study Subjects

A total of 48 human volunteers belonging to the Tiwa ethnic community of Assam participated in the study. All of them followed a nonvegetarian diet. In total, 27 participants consumed the beverage, referred to as drinkers (D), and 21 did not consume it, referred to as nondrinkers (ND). The details of health and blood parameters are listed in Supplementary Table S1. In mice, the intake of different fractions of the rice beverage during the treatment period did not interfere with the diet consumption. Therefore, no significant changes were observed in food consumption (Supplementary Figure S1).

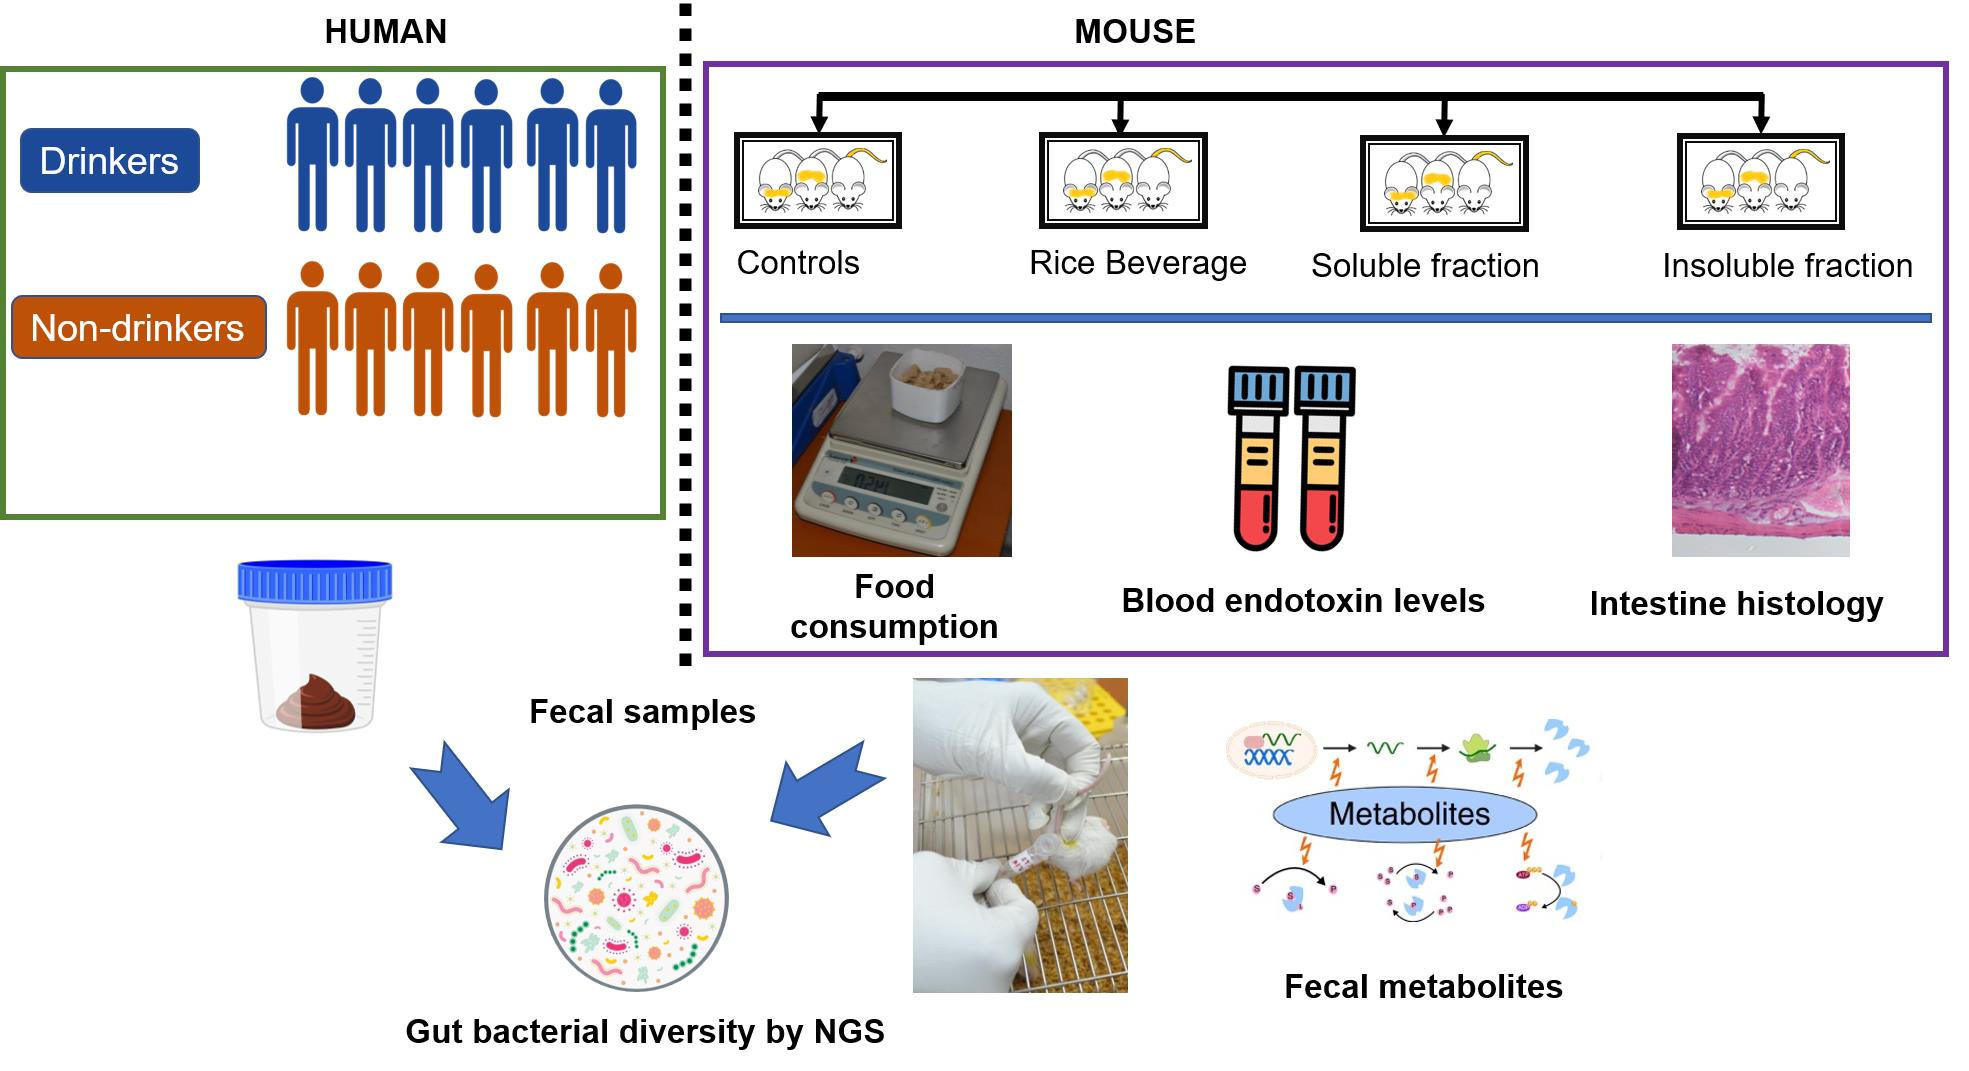
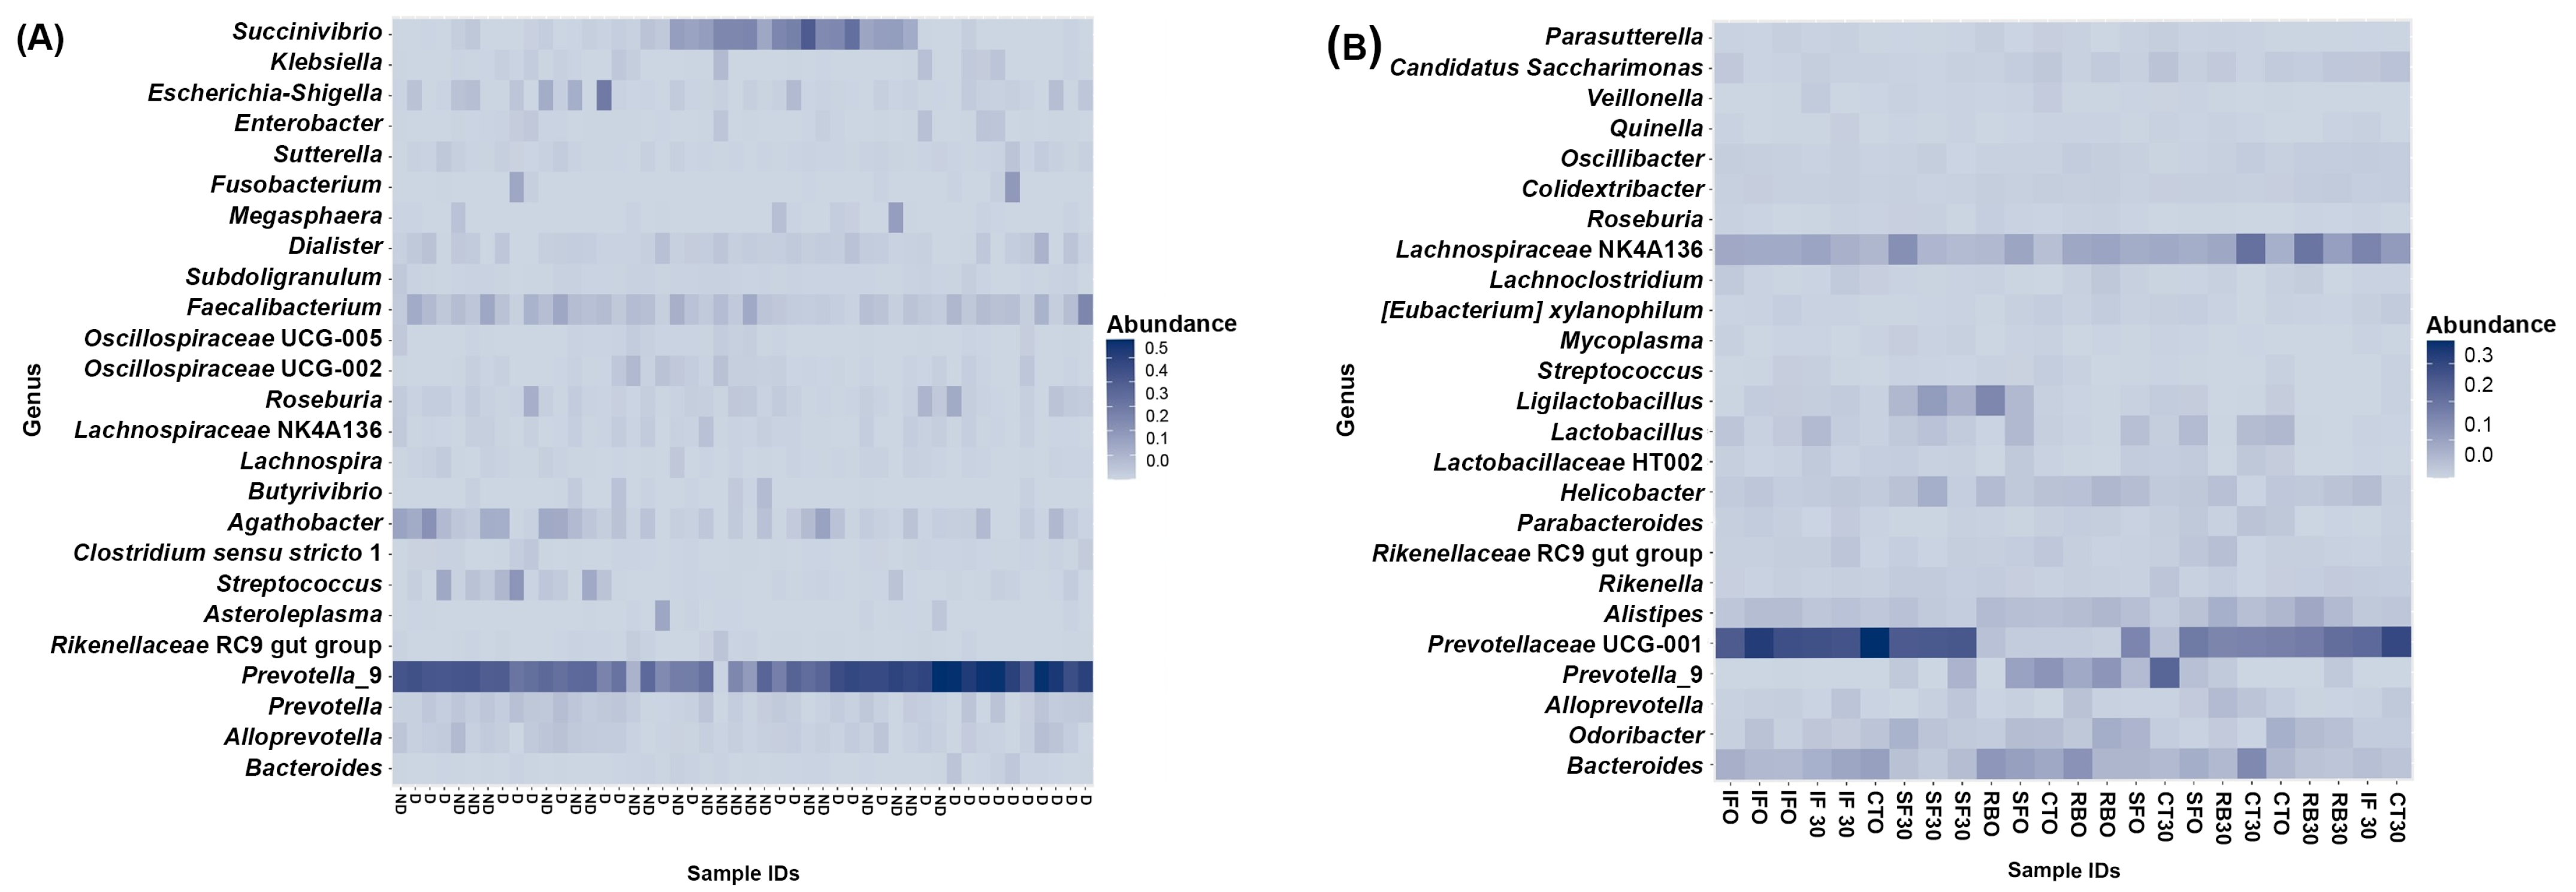
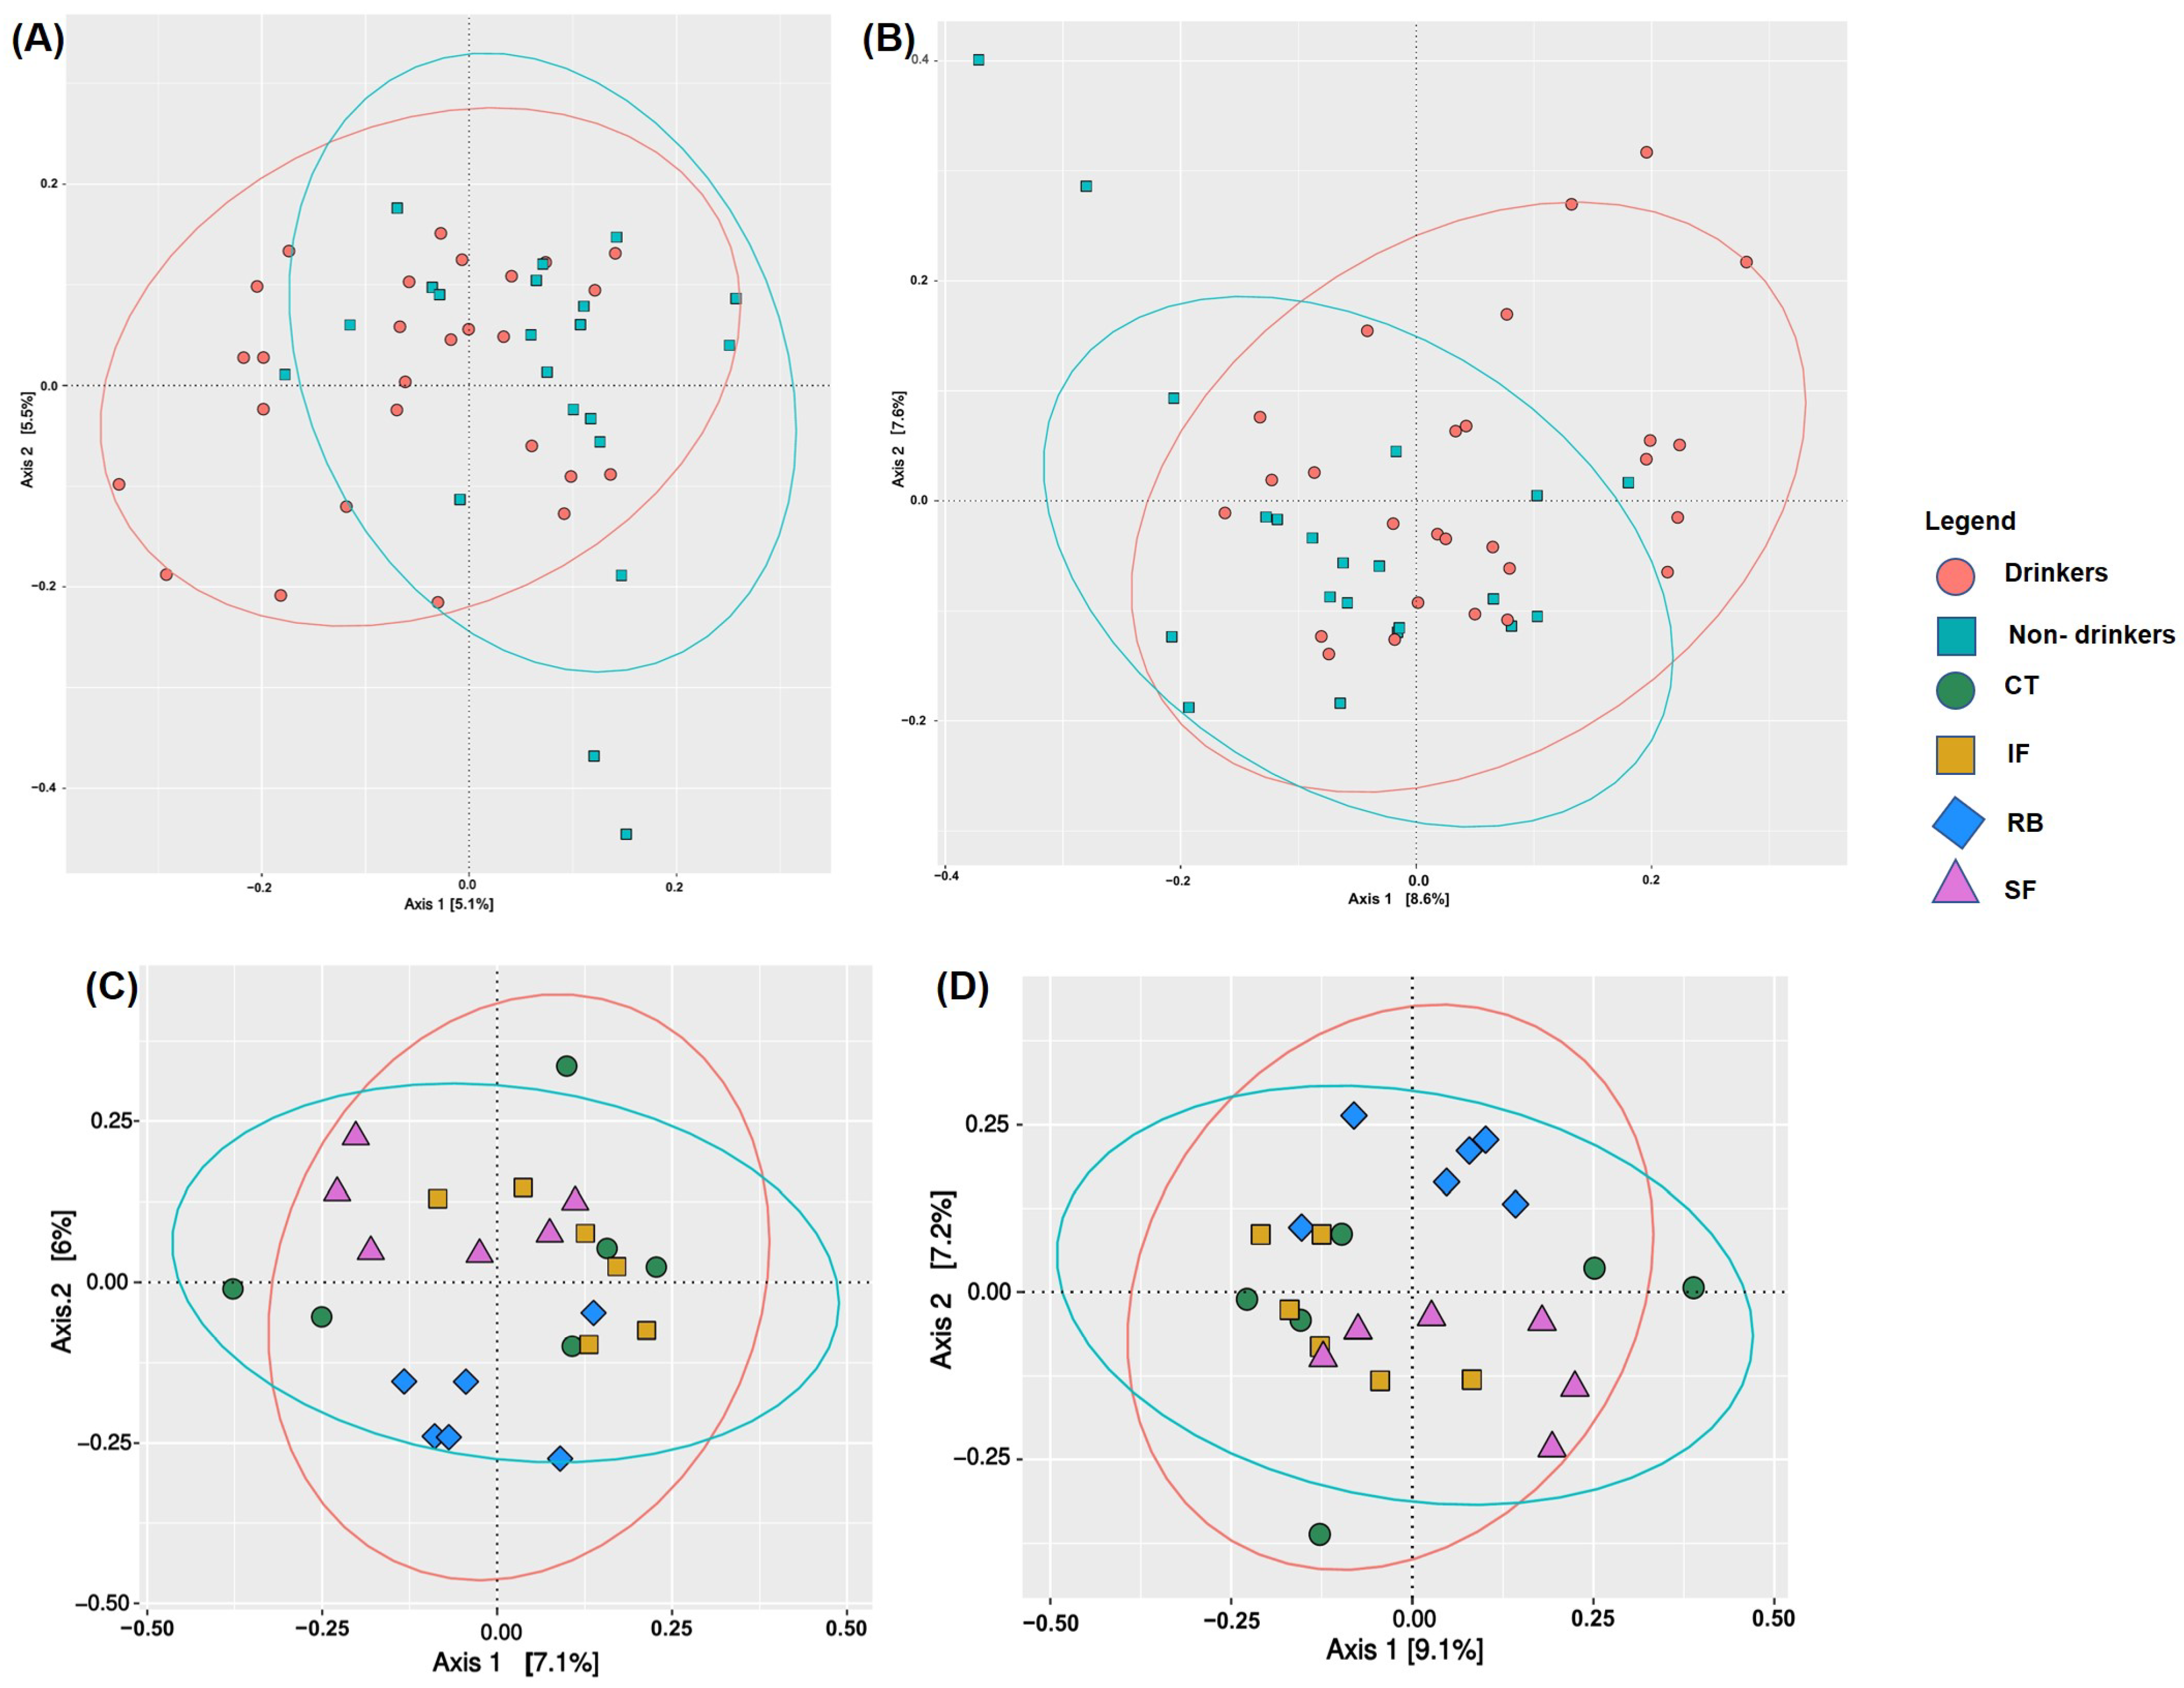
3.2. Gut Bacterial Diversity of Humans and Mice via NGS

A total of 234 and 239 individual amplicon sequence variants (ASVs) were observed depicting the bacterial communities at different taxonomic levels in human and mouse samples, respectively (Supplementary Figure S2). In both subject groups, Prevotella was an abundant genus (Figure 1). The Shannon and Simpson indices of alpha diversity showed significant differences (p ≤ 0.05) on the 0th and 30th days of treatment (Figure 2). However, no significant differences were observed in human (Supplementary Figure S3) and mouse samples (Supplementary Figure S4), compared on the basis of treatments. For the human samples, principal coordinates analysis on the beta diversity indices showed subtle dissimilarities based on drinking habit with a variance of 5.1% (Axix 1) and 5.2% (Axis 2), for Jaccard, and 8.6% (Axix 1) and 7.6% (Axis 2) Bray–Curtis. Similarly, in mouse samples, the distance matrices showed a variance of 7.1% (Axix 1) and 7.6% (Axis 2), for Jaccard, and 9.1% (Axix 1) and 7.2% (Axis 2) Bray–Curtis (Figure 3).
A comparison between drinkers and nondrinkers revealed changes in 20 bacterial genera in humans (Table 1). An increased abundance of bacterial genera: Odoribacter, Coprococcus, Defluviitaleaceae UCG-011, Oscillospiraceae UCG-005, Rikenellaceae RC9, Succinivibrio, Eubacterium siraeum, Oscillospiraceae UCG-002, Ruminococcus, Lachnospiraceae NK4A136, Lachnospiraceae NC2004, Butyrivibrio, Butyricimonas, Bilophila, Senegalimassilia and Anaerovoracaceae. Family XIII UCG-001 increased, whereas a decrease in Christensenellaceae R-7, Aeromonas, Lachnoclostridium and Rothia was observed.
In mice, a maximal shift was observed in the abundance of 16 and 15 bacterial genera in the RB and SF groups, followed by 12 in the CT group, and IF showed a significant difference in 4 bacterial genera between the 0th and 30th days of treatments with different fractions of the beverage, as determined with the Mann–Whitney U test (p ≤ 0.05) (Table 2). In CT, 3 bacterial genera, namely, Eubacterium ventriosum, Ruminococcus and Lachnospiraceae NK4A136 increased, whereas others including Lachnospiraceae A2, Cuneatibacter, Leptotrichia, Negativibacillus, Mesocricetibacter, Rodentibacter, Candidatus Arthromitus, Intestinimonas and Odoribacter decreased significantly. In RB, Eubacterium siraeum, Ruminococcaceae UBA1819, Acetatifactor, and Prevotellaceae UCG-001 increased significantly, whereas a decrease in Anaerovoracaceae Family XIII UCG-001, Eubacterium nodatum, Lachnospiraceae ASF356, Rodentibacter, Anaerovoracaceae Family XIII AD3011, Streptococcus, Negativibacillus, Roseburia, Acetatifactor, Bacteroides, Ligilactobacillus, Anaerotruncus, Erysipelatoclostridium, was observed. In the IF group, an increase in 2 genera, namely, Lachnospiraceae ASF356, and Paludicola and a decrease in Anaerovoracaceae Family XIII AD3011 and Parasporobacterium, were observed. Next, in the SF, Wautersiella, Ruminococcaceae ASF356, Rikenella, Desulfovibrio, Intestinimonas, Ligilactobacillus, Ruminococcus increased, and Leptotrichia, Candidatus Stoquefichus, Lachnospiraceae UCG-004, Lactobacillaceae HT002, Bacteroides, Lactobacillus and Eubacterium xylanophilum decreased significantly after 30 days of treatment (p ≤ 0.05).
Considering the microbes that changed exclusively due to RB and its two fractions, IF and SF, Lachnospiraceae genus ASF356 was common in all the treatment groups except the controls. The abundance of this genus increased in RB, but decreased in IF and SF. In a similar trend, two other genera showed such differences in RB and SF treatments. Ligilactobacillus decreased in RB and increased in SF, and Prevotellaceae UCG-001 increased in RB and decreased in SF. We speculate that these variations might have arisen due to complex microbial interactions or other factors. Interestingly, the abundances of Anaerovoracaceae Family XIII AD3011 decreased in RB and IF, whereas Bacteroides decreased in the RB and SF treatments. Further, comparing the RB treatment with humans, Eubacterium siraeum was increased. Another genus, Anaerovoracaceae Family XIII UCG-001, was common, but showed a varied difference. Ruminococcus, on the other hand, was commonly increased in drinkers and in the SF treatment in mice.

3.3. Fecal Metabolites after 30 Days of Rice Beverage Treatment

A total of 68 compounds were detected with a peak area greater than 0.1%. Of these, 25 compounds were majorly categorised as organic acids, 8 sugar alcohols, 7 amino acids, and 6 short-chain fatty acids. Others included inorganic compounds and acids sugars, and amino acid derivatives (Table 3). Multivariate statistical analysis was performed for the fecal metabolites using partial least-squares discriminant analysis among the treatment groups. The PLS-DA plot indicates the clustering of the treatment groups on the basis of the metabolite profiles (Figure 4).

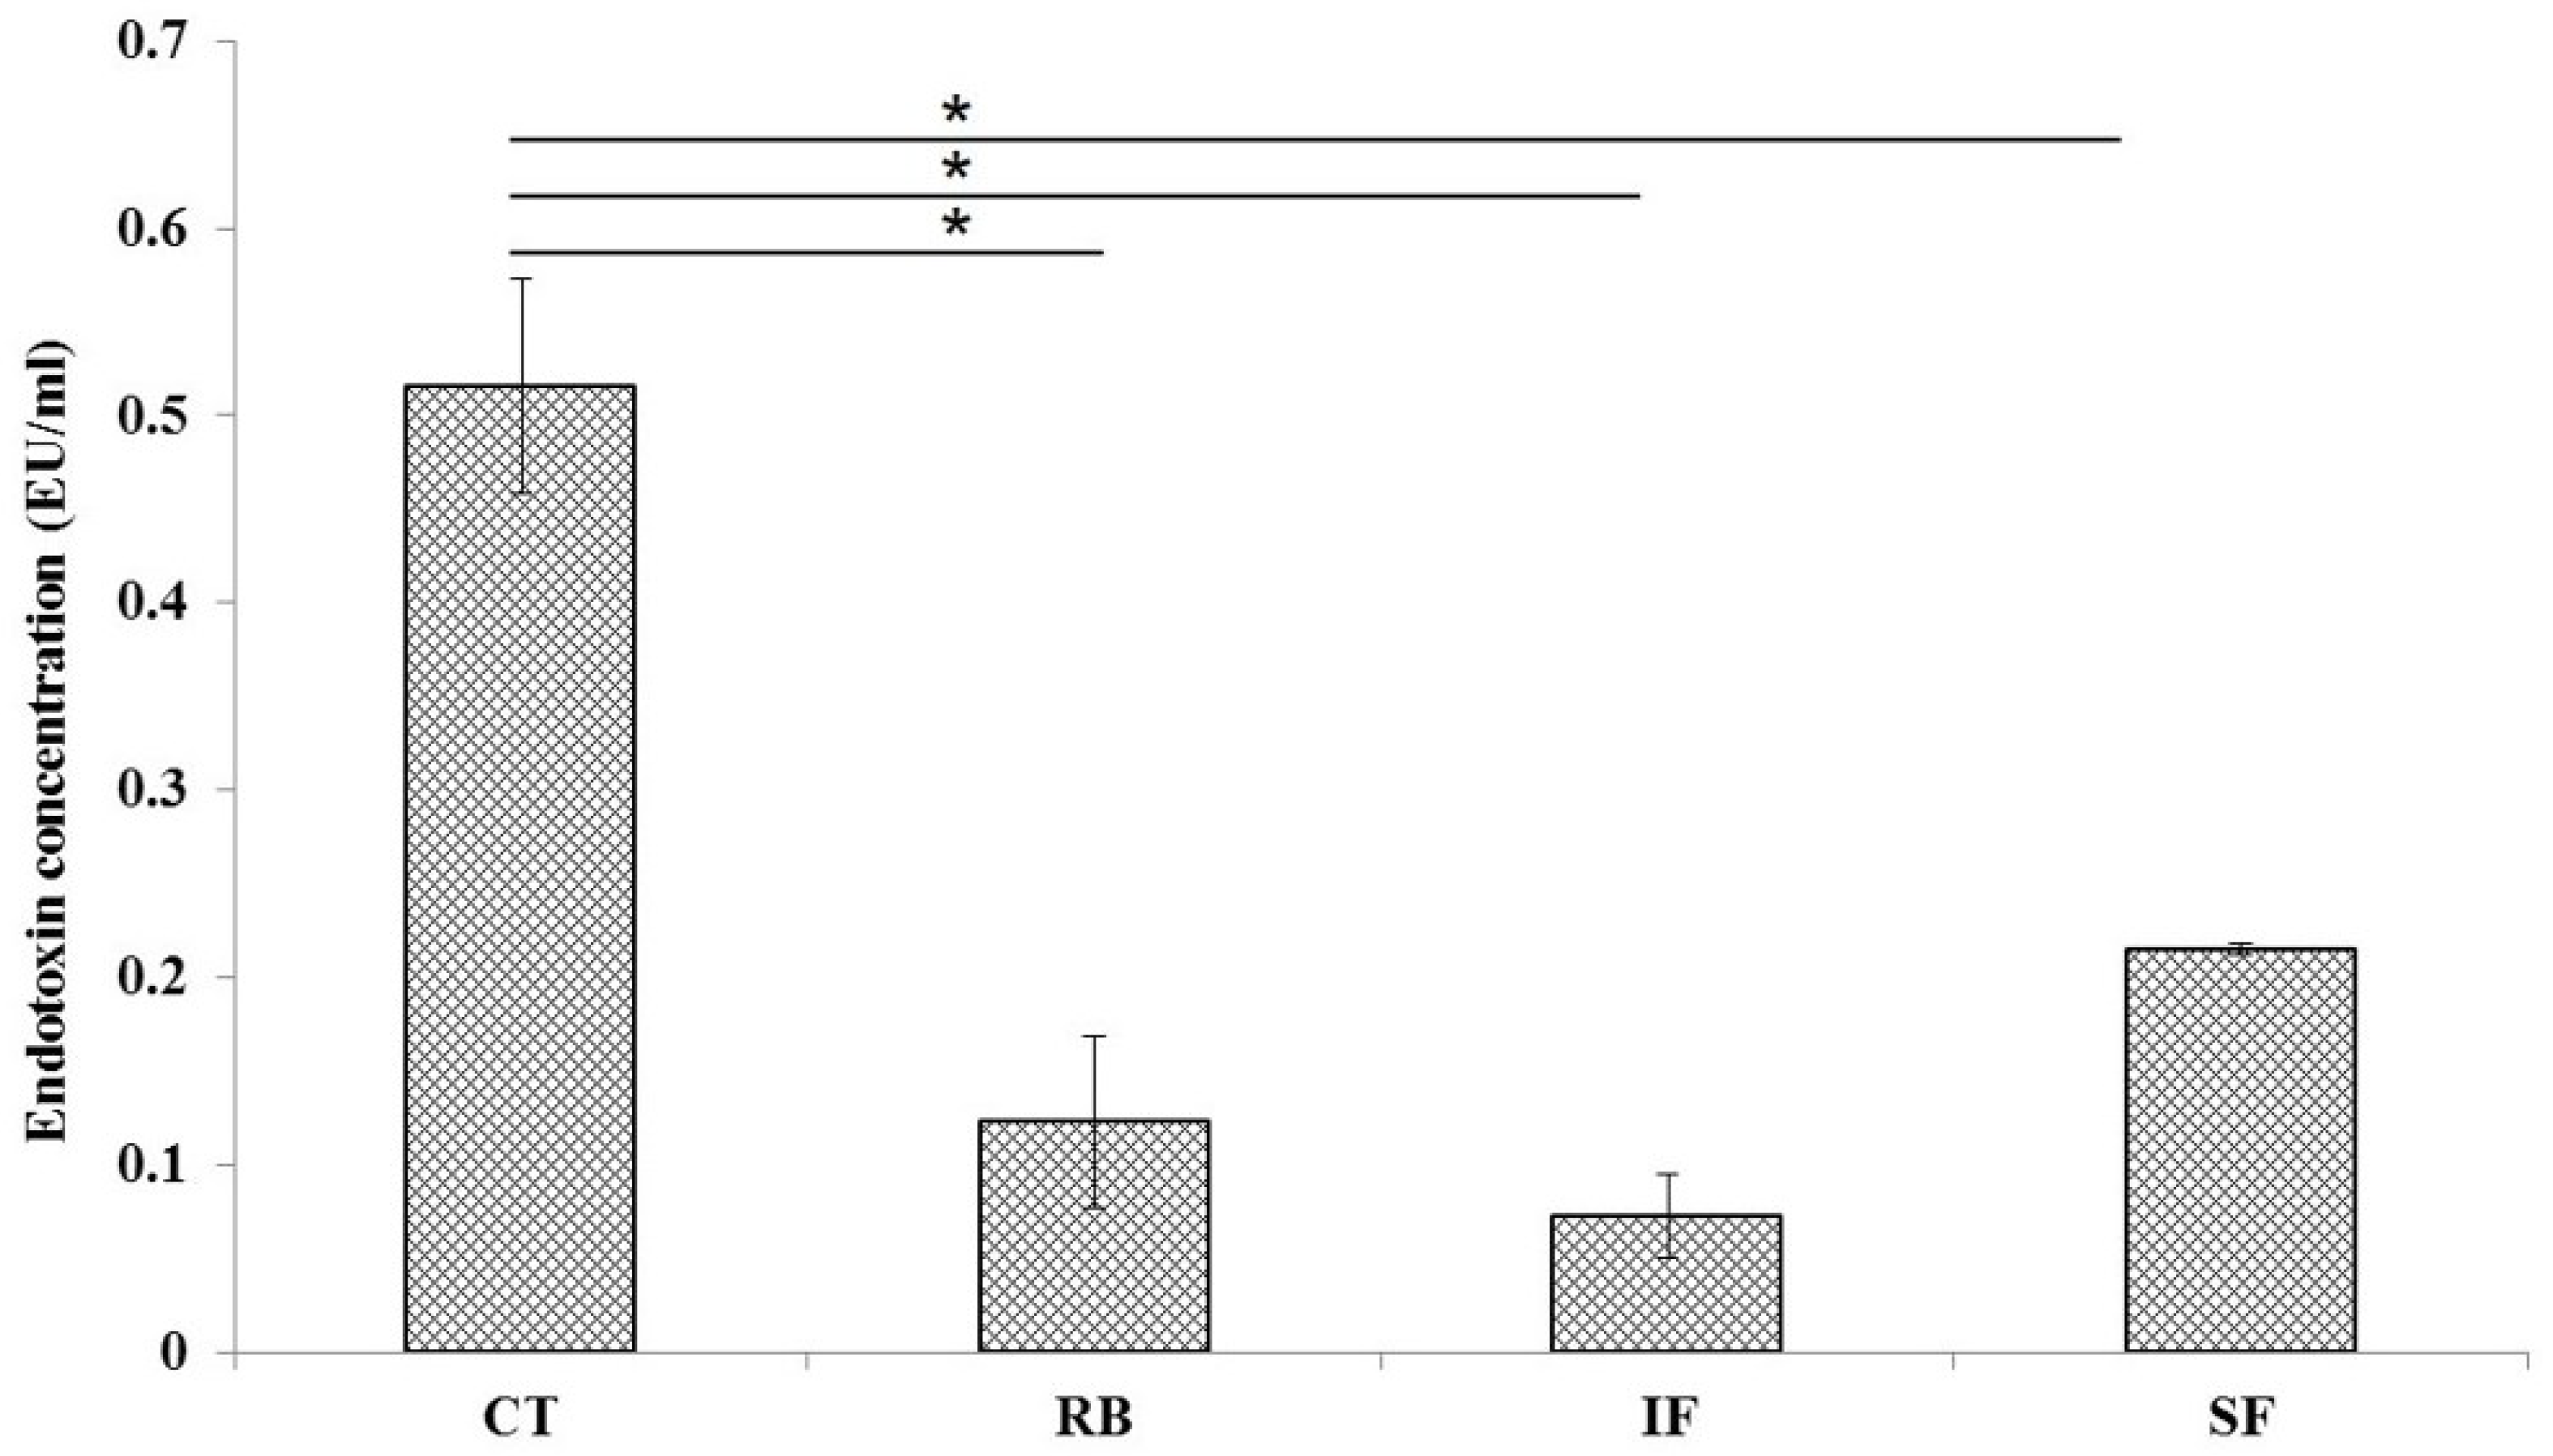
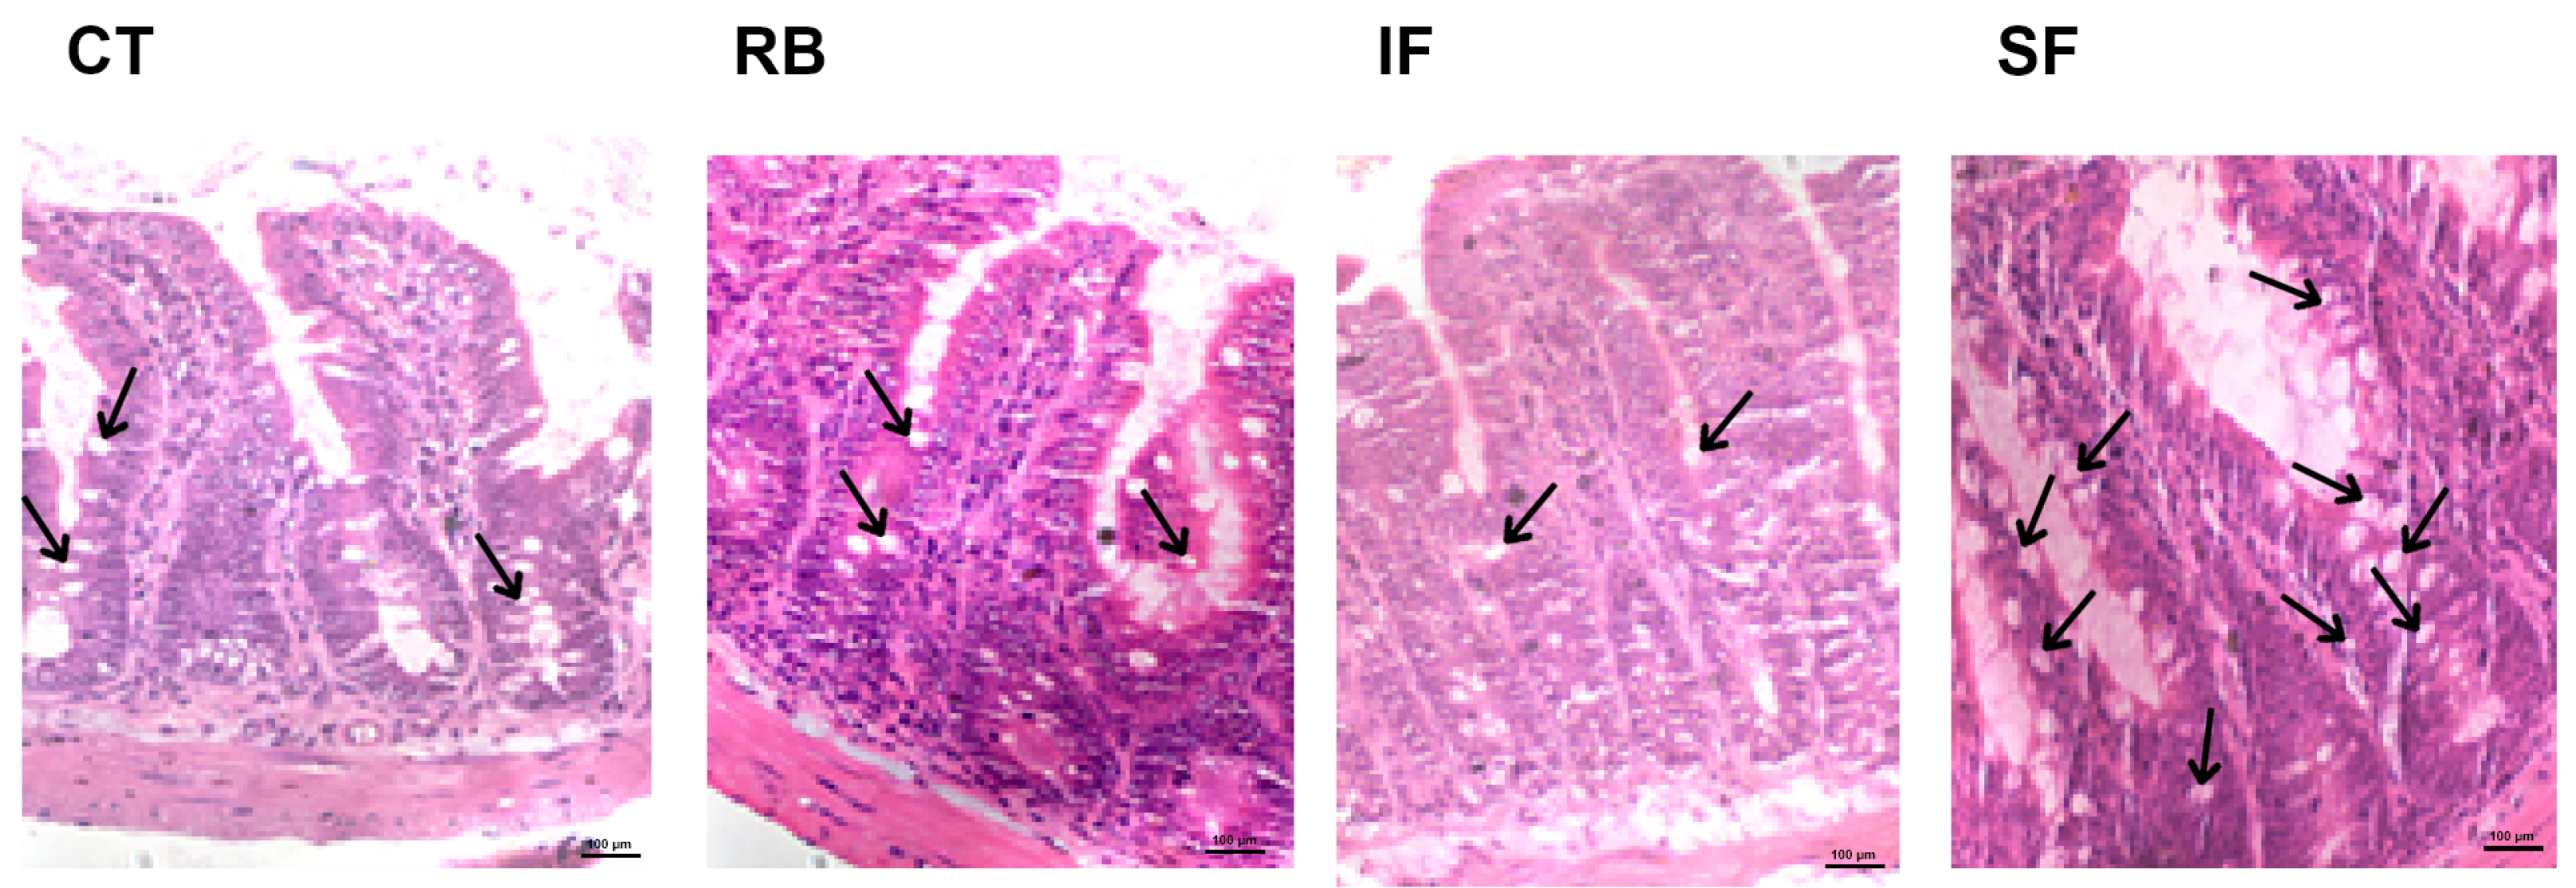
3.4. Plasma Endotoxin and Histological Study of Ileum

The level of endotoxin in the CT group (0.515 EU/mL) was higher than those in the RB (0.123 EU/mL), IF (0.073 EU/mL) and SF (0.215 EU/mL) groups (p ≤ 0.05) (Figure 5). HE-stained ileum revealed changes in enterocytes, villus length and crypt depth, lymphocytic infiltration, and goblet cell distribution of the ileum in the treatment groups. Villus length was 169.85 μ m in the CT group with intact epithelia. The length was reduced to 155.89 and 151.84 μ m in the IF and RB-treated groups, respectively, and increased in the SF-treated group (176.91 μ m). The length of the villus in all the treatment groups differed significantly compared to that of the controls. Crypt depth in the CT group (84.02 μ m) had no significant difference from other treatment groups. The width of the lamina propia and the depth of the submucosal layer were not altered among the treatment groups (Table 4). A width of lamina propria with much more lymphocytic infiltration was also observed in the RB-treated group, followed by the SF-treated group. The number of goblet cells was comparatively higher in the SF-treated group (Figure 6).

4. Discussion

The gut microbiota regulates the health and diseases of the host. Various factors that shape the population and composition of gut microbiota include the diet, genetics, mode of delivery, age, and geography. Notably, diet remains the most important factor influencing the gut microbiota. Further, dietary components such as carbohydrates, proteins, fats, and other micronutrients play distinct roles [5]. Fermented foods contain nutrients, metabolites, bioactive peptides, and several components produced by microbial action that affect the gut microbiota. Very often, microbes participating in the fermentation process directly pass the intestinal barrier, colonise the gastrointestinal tract of the host, and exert health benefits. Hence, the multiple food components and microbes, and their interactions differently influence the microbiota. A recent review by Precup and Vodner (2019) demonstrated the role of Prevotella in the gut in both human and rodents, and suggested it as a “possible biomarker of diet” [25]. Further, a comparative study on the gut microbiota of urban and traditional rural diets suggested an association of this bacterium with the rural diets [26]. Another study, in a similar line, suggested a reduced abundance of Prevotella in humans consuming a Western diet [27]. In addition, Dehingia et al. (2015) showed Prevotella as a major bacterium in different tribes of Northeast India. Collectively, these findings support our observation of the dominance of Prevotalla in the human gut. Moreover, in this study, alpha diversity demonstrating the richness of bacterial communities remained unchanged in the human cohorts, in line with earlier findings with different ethnic communities of Northeast India [4]. Succinovibrio is yet another bacterium associated with Western and non-Western diets that was found to be abundant in our findings, associated with humans drinking the beverage [27].
The IF was devoid of alcohol, and contained microbes and nutrients present in the fermented residues, whereas the SF was devoid of microbes, but soluble constituents were present. The overall changes in bacteria observed in the treatment groups suggest the effect of different components of the beverage. For example, alcohol consumption changes microbial diversity in both rodents and humans [28]. In SF, the change in Bacteroides as a result of alcohol is in line with earlier reports [28,29]. Alcohol-induced reduction in LAB, as reported earlier, was also evident in our findings [30]. However, in RB, Ligilactobacillus was reported to have increased antiobesity and anti-inflammatory effects in mice [31,32]. This bacterium, often considered as an immunobiotic, has exhibited synergistic effects with wine prebiotics against colitis in mice [33,34]. Prevotellaceae UCG-001 is a Gram-negative bacillus that ferments carbohydrates to generate SCFAs that exert anti-inflammatory effects, inhibiting pathogens [35,36]. An increased abundance of this bacterium in mice was associated earlier with prebiotic and other functional components [37,38]. In our findings, the increase in this bacterium in the RB and SF treatments indicated such components, in line with our earlier report [14].
Varied differences in unclassified bacteria belonging to the Lachnospiraceae family were observed in different treatments in both mouse and human samples. For instance, Lachnospiraceae NK4A136 is an anaerobic, spore-forming bacterium that ferments plant polysaccharides into SCFAs [39]. It was associated with bile acid metabolism and cadaverine leading to an improvement in insulin levels [40]. The abundance of this bacterium was higher among drinkers in the human subjects, similar to a study on alcohol-induced changes in the microbiota of Rhesus macaques [41]. Further, a decreased abundance of Christensenellaceae among drinkers is also supported by this study.
Interestingly, another study reported increased abundances of Lachnospiraceae and Bacteroides in stressed mice compared with in the normal group, whereas these two contrarily decreased significantly in the RB and SF treatments [42]. However, in the IF treatment, we observed an increase in Lachnospiraceae, though Bacteriodes did not change. These variations in the observations might have resulted due to the complex interactions between different bacteria and the differences in the treatments. In the SF group, Paludicola increased, which had earlier been reported to increase by treating with an antioxidant component of fermented rice [43,44]. Ruminococcus was previously reported to (i) enhance immunity by promoting the gut barrier function, (ii) produce butyrate in the gut, and (iii) be associated inversely with intestinal permeability [45,46]. An increase in Ruminococcaceae due to prebiotic treatment was also reported [47]. Interestingly, in human samples, SCFA producers Coprococcus, Oscillospiraceae UCG-005, Butyrivibrio, and Butyricimonas were increased in drinkers [48,49,50,51].
Dietary differences have been associated with changes in the morphology of the small intestine, leading to functional alterations in its structure. The goblet cells present in the intestinal epithelium produce several factors, including trefoil factors, and different mucins that form the mucus layer. Mucin 2 is the most abundant mucin and is associated with the organisation of the intestinal mucus layers at the epithelial surface. This layer serves as a barrier to pathogens, restricting their entry towards epithelial cells [52]. An increased goblet cell number and hyperplasia in the SF-treated group could have been an indication of escalated mucin production due to the impact of alcohol, as supported by an earlier study [53]. The absorption and depletion of fatty acids and carbohydrates take place during the transition through the small intestine; hence, bacteria residing in the colon are sustained by the fermentation of the complex sugars [54]. The SF treatment contained alcohol along with soluble sugars that could elevate the triglyceride levels [55]. This might have increased the villus length in the SF treatment. Undigested fibres serve as the energy source for the gut bacteria, leading to the production of SCFAs that contribute to anti-inflammatory effects. We had earlier reported the presence of hexadecanoic acid, a long-chain fatty acid, in a rice-based beverage that was fermented using a similar method in this study [14]. It is one of the flavour components and is abundant in rice wine from China [56]. Interestingly, it was present in the feces of all treatments, and absent in the control, depicting its origin to be from the components of the beverage. There have been reports suggesting the endotoxin-reducing activity of fermented foods [57]. As expected, plasma endotoxins were lowest in the IF, followed by the RB and SF treatments, compared to the controls. Contrarily, the inflammation-inducing effects, as observed in the histology of SF-treated mouse intestine, also had a higher endotoxin level. The IF treatment, having no alcohol, showed the lowest endotoxin levels and an RB having a combination of IF and SF had intermediate endotoxin levels in the blood, but less than that in the controls.

5. Conclusions

Fermented foods and beverages produced traditionally with indigenous practices have gained popularity due to the associated health benefits. These foods have a long history of consumption, and are strongly associated with the culture and traditions of many ethnic communities. There are traditional claims from these communities of these foods having health modulatory effects. However, due to a lack of scientific justification to these claims, these foods often remain confined to local markets. Rice beverage, a popular fermented drink, is prepared by different tribes of Northeast India and traditionally believed to have several health benefits. This study, in an attempt to validate the claims, was conducted using human and mouse subjects. Overall, our associative findings in humans and mice collectively pave the way to understanding the changes in the microbiota due to the consumption of this beverage. Altogether, the observed bacterial changes due to the consumption of the beverage in both subject groups may have resulted due to the functional components of the beverage. Changes in SCFA-producing bacteria and those affected by prebiotics indicated the gut health modulatory aspects of the beverage. A low level of endotoxin in the treatments compared to that in the controls further strengthens this attribute. In connection with the emergent reports on the health benefits of moderate alcohol consumption, this study further opens new dimensions for studying other aspects of the rice beverage [58,59].

Supplementary Materials

The following supporting information can be downloaded at: https://www.mdpi.com/article/10.3390/fermentation9020126/s1, Figure S1: Daily diet intake of animals during the experimental period; Figure S2: Overall diversity of bacterial genera observed in the fecal samples of (A) human, and (B) mouse fecal microbiota; Figure S3: Treatment wise comparison of alpha diversity indices (A) Shannon, and (B) Simpson in human fecal samples; Figure S4: Treatment wise comparison of alpha diversity indices (A) Shannon, and (B) Simpson in mice fecal samples; Table S1: Details of human participants, recruited for the study and their anthropometric and clinical parameters. (M—Males, F—Females, NV—Non-vegetarian, D—Drinker, ND—Non-drinker, BMI—body mass index, GGT—Gamma-glutamyltransferase, RBS—Random blood sugar).

Author Contributions

B.B. and M.R.K. conceptualised and designed the study. B.B. and A.A. performed the animal experiments. A.B., B.B. and S.D. analysed the NGS data. The manuscript was written by B.B. and revised by M.R.K. All authors have read and agreed to the published version of the manuscript.

Funding

This study was supported by (i) the core fund of IASST, (ii) the Department of Biotechnology (DBT, Govt. of India)-funded unit of excellence project (BT/550/NE/U-EXCEL/2014), and, (iii) the Department of Science and Technology (DST)-funded ST/SC community development program in IASST (SEED/TITE/2019/103). The research was carried out at the Institutional-Level Biotech Hub of IASST (DBT funded).

Institutional Review Board Statement

The human study was approved by the institutional ethics committee, approval no. IEC(HS)/IASST/1082/2014-15/6). Mouse experiments were conducted following the guidelines of the Committee for the Purpose of Control and Supervision of Experiments on Animals (CPCSEA), the Ministry of the Environment, Forests, and Climate Change, Government of India, and approved by the institutional animal ethics committee (approval no. IASST/IAEC/2016-17/07).

Informed Consent Statement

Informed consent was obtained from human subjects involved in the study using a bilingual (English and Assamese) written informed consent form.

Data Availability Statement

Sequences used in the study were deposited to the Sequence Read Archive (SRA) of the National Center for Biotechnology Information (NCBI) database with BioProject ID: PRJNA908300.

Acknowledgments

The authors are thankful to Anima Baishya and her family members for sharing traditional knowledge on the preparation of the beverage and for coordinating the collection of human samples. We also thank Gwhm Basumatary and Abinash Nath for their assistance in animal rearing and care.

Conflicts of Interest

The authors declare no conflict of interest.

Abbreviations

The following abbreviations are used in this manuscript:
ASVamplicon sequence variant
GC-MSGas chromatography–mass spectrometry
NGSNext-generation sequencing
PLS–DAPartial least squares discriminant analysis
SCFAShort-chain fatty acids
DADA2Divisive amplicon denoising algorithm 2
PCoAPrincipal coordinate analysis

References

  1. Guarner, F.; Malagelada, J.R. Gut flora in health and disease. Lancet 2003, 361, 512–519. [Google Scholar] [CrossRef] [PubMed]
  2. Foster, K.R.; Schluter, J.; Coyte, K.Z.; Rakoff-Nahoum, S. The evolution of the host microbiome as an ecosystem on a leash. Nature 2017, 548, 43–51. [Google Scholar] [CrossRef] [Green Version]
  3. Clemente, J.C.; Ursell, L.K.; Parfrey, L.W.; Knight, R. The impact of the gut microbiota on human health: An integrative view. Cell 2012, 148, 1258–1270. [Google Scholar] [CrossRef] [Green Version]
  4. Dehingia, M.; Talukdar, N.C.; Talukdar, R.; Reddy, N.; Mande, S.S.; Deka, M.; Khan, M.R. Gut bacterial diversity of the tribes of India and comparison with the worldwide data. Sci. Rep. 2015, 5, 18563. [Google Scholar] [CrossRef] [Green Version]
  5. Ramos, S.; Martín, M.Á. Impact of diet on gut microbiota. Curr. Opin. Food Sci. 2021, 37, 83–90. [Google Scholar] [CrossRef]
  6. Wastyk, H.C.; Fragiadakis, G.K.; Perelman, D.; Dahan, D.; Merrill, B.D.; Feiqiao, B.Y.; Topf, M.; Gonzalez, C.G.; Van Treuren, W.; Han, S.; et al. Gut-microbiota-targeted diets modulate human immune status. Cell 2021, 184, 4137–4153. [Google Scholar] [CrossRef] [PubMed]
  7. Marco, M.L.; Heeney, D.; Binda, S.; Cifelli, C.J.; Cotter, P.D.; Foligné, B.; Gänzle, M.; Kort, R.; Pasin, G.; Pihlanto, A.; et al. Health benefits of fermented foods: Microbiota and beyond. Curr. Opin. Biotechnol. 2017, 44, 94–102. [Google Scholar] [CrossRef]
  8. Derrien, M.; van Hylckama Vlieg, J.E. Fate, activity, and impact of ingested bacteria within the human gut microbiota. Trends Microbiol. 2015, 23, 354–366. [Google Scholar] [CrossRef] [Green Version]
  9. Tamang, J.P. “Ethno-microbiology” of ethnic Indian fermented foods and alcoholic beverages. J. Appl. Microbiol. 2021, 133, 145–161. [Google Scholar] [CrossRef]
  10. Das, A.J.; Khawas, P.; Miyaji, T.; Deka, S.C. HPLC and GC-MS analyses of organic acids, carbohydrates, amino acids and volatile aromatic compounds in some varieties of rice beer from northeast India. J. Inst. Brew. 2014, 120, 244–252. [Google Scholar] [CrossRef]
  11. Roy, A.; Khanra, K.; Mishra, A.; Bhattacharyya, N. General analysis and antioxidant study of traditional fermented drink Handia, its concentrate and volatiles. Adv. Life Sci. Its Appl. 2012, 1, 54–57. [Google Scholar]
  12. Ghosh, K.; Ray, M.; Adak, A.; Dey, P.; Halder, S.K.; Das, A.; Jana, A.; Parua, S.; Mohapatra, P.K.D.; Pati, B.R.; et al. Microbial, saccharifying and antioxidant properties of an Indian rice based fermented beverage. Food Chem. 2015, 168, 196–202. [Google Scholar] [CrossRef] [PubMed]
  13. Das, A.; Deka, S.; Miyaji, T. Methodology of rice beer preparation and various plant materials used in starter culture preparation by some tribal communities of North-East India: A survey. Int. Food Res. J. 2012, 19, 101. [Google Scholar]
  14. Bhaskar, B.; Adak, A.; Khan, M.R. Fractions of traditionally brewed rice beverage relieve anxiety and improve spatial memory in mice. J. Ethn. Foods 2021, 8, 1–9. [Google Scholar] [CrossRef]
  15. Das, S.; Deb, D.; Adak, A.; Khan, M.R. Exploring the microbiota and metabolites of traditional rice beer varieties of Assam and their functionalities. 3Biotech 2019, 9, 1–10. [Google Scholar] [CrossRef] [PubMed]
  16. Fuloria, S.; Mehta, J.; Talukdar, M.P.; Sekar, M.; Gan, S.H.; Subramaniyan, V.; Rani, N.N.I.M.; Begum, M.Y.; Chidambaram, K.; Nordin, R.; et al. Synbiotic Effects of Fermented Rice on Human Health and Wellness: A Natural Beverage That Boosts Immunity. Front. Microbiol. 2022, 13, 1–20. [Google Scholar] [CrossRef]
  17. Khan, M.R.; Bhaskar, B.; Adak, A.; Talukdar, N.C. Rice based beverage with high alcohol content and method therefore. Pat. Off. J. India 2017, 11, 6850. [Google Scholar]
  18. Callahan, B.J.; McMurdie, P.J.; Rosen, M.J.; Han, A.W.; Johnson, A.J.A.; Holmes, S.P. DADA2: High-resolution sample inference from Illumina amplicon data. Nat. Methods 2016, 13, 581–583. [Google Scholar] [CrossRef] [Green Version]
  19. Quast, C.; Pruesse, E.; Yilmaz, P.; Gerken, J.; Schweer, T.; Yarza, P.; Peplies, J.; Glöckner, F.O. The SILVA ribosomal RNA gene database project: Improved data processing and web-based tools. Nucleic Acids Res. 2012, 41, D590–D596. [Google Scholar] [CrossRef]
  20. Wickham, H.; Chang, W.; Wickham, M.H. Package ‘ggplot2’. In Create Elegant Data Visualisations Using the Grammar of Graphics. Version; 2016; Volume 2, pp. 1–189. Available online: https://cran.microsoft.com/snapshot/2015-01-06/web/packages/ggplot2/ggplot2.pdf (accessed on 1 January 2023).
  21. Kassambara, A.; Kassambara, M.A. Package ‘ggpubr’. R Package Version 0.1. 2020. Available online: https://cran.microsoft.com/snapshot/2017-02-26/web/packages/ggpubr/ggpubr.pdf (accessed on 1 January 2023).
  22. Weir, T.L.; Manter, D.K.; Sheflin, A.M.; Barnett, B.A.; Heuberger, A.L.; Ryan, E.P. Stool microbiome and metabolome differences between colorectal cancer patients and healthy adults. PLoS ONE 2013, 8, e70803. [Google Scholar] [CrossRef] [Green Version]
  23. Chong, J.; Wishart, D.S.; Xia, J. Using MetaboAnalyst 4.0 for comprehensive and integrative metabolomics data analysis. Curr. Protoc. Bioinform. 2019, 68, e86. [Google Scholar] [CrossRef]
  24. Zhou, Q.Q.; Yang, D.Z.; Luo, Y.J.; Li, S.Z.; Liu, F.Y.; Wang, G.S. Over-starvation aggravates intestinal injury and promotes bacterial and endotoxin translocation under high-altitude hypoxic environment. World J. Gastroenterol. WJG 2011, 17, 1584. [Google Scholar] [CrossRef] [PubMed]
  25. Precup, G.; Vodnar, D.C. Gut Prevotella as a possible biomarker of diet and its eubiotic versus dysbiotic roles: A comprehensive literature review. Br. J. Nutr. 2019, 122, 131–140. [Google Scholar] [CrossRef] [PubMed]
  26. De Filippo, C.; Cavalieri, D.; Di Paola, M.; Ramazzotti, M.; Poullet, J.B.; Massart, S.; Collini, S.; Pieraccini, G.; Lionetti, P. Impact of diet in shaping gut microbiota revealed by a comparative study in children from Europe and rural Africa. Proc. Natl. Acad. Sci. USA 2010, 107, 14691–14696. [Google Scholar] [CrossRef] [Green Version]
  27. Amato, K.R.; Yeoman, C.J.; Cerda, G.; A Schmitt, C.; Cramer, J.D.; Miller, M.E.B.; Gomez, A.; R Turner, T.; Wilson, B.A.; Stumpf, R.M.; et al. Variable responses of human and non-human primate gut microbiomes to a Western diet. Microbiome 2015, 3, 1–9. [Google Scholar] [CrossRef] [PubMed] [Green Version]
  28. Engen, P.A.; Green, S.J.; Voigt, R.M.; Forsyth, C.B.; Keshavarzian, A. The gastrointestinal microbiome: Alcohol effects on the composition of intestinal microbiota. Alcohol Res. Curr. Rev. 2015, 37, 223. [Google Scholar]
  29. Dolara, P.; Luceri, C.; De Filippo, C.; Femia, A.P.; Giovannelli, L.; Caderni, G.; Cecchini, C.; Silvi, S.; Orpianesi, C.; Cresci, A. Red wine polyphenols influence carcinogenesis, intestinal microflora, oxidative damage and gene expression profiles of colonic mucosa in F344 rats. Mutat. Res./Fundam. Mol. Mech. Mutagen. 2005, 591, 237–246. [Google Scholar] [CrossRef]
  30. Kuprys, P.V.; Cannon, A.R.; Shieh, J.; Iftekhar, N.; Park, S.K.; Eberhardt, J.M.; Ding, X.; Choudhry, M.A. Alcohol decreases intestinal ratio of Lactobacillus to Enterobacteriaceae and induces hepatic immune tolerance in a murine model of DSS-colitis. Gut Microbes 2020, 12, 1838236. [Google Scholar] [CrossRef]
  31. Liang, C.; Zhou, X.H.; Jiao, Y.H.; Guo, M.J.; Meng, L.; Gong, P.M.; Lyu, L.Z.; Niu, H.Y.; Wu, Y.F.; Chen, S.W.; et al. Ligilactobacillus Salivarius LCK11 Prevents Obesity by Promoting PYY Secretion to Inhibit Appetite and Regulating Gut Microbiota in C57BL/6J Mice. Mol. Nutr. Food Res. 2021, 65, 2100136. [Google Scholar] [CrossRef]
  32. Yao, M.; Lu, Y.; Zhang, T.; Xie, J.; Han, S.; Zhang, S.; Fei, Y.; Ling, Z.; Wu, J.; Hu, Y.; et al. Improved functionality of Ligilactobacillus salivarius Li01 in alleviating colonic inflammation by layer-by-layer microencapsulation. NPJ Biofilms Microbiomes 2021, 7, 1–10. [Google Scholar] [CrossRef]
  33. Fei, Y.; Zhang, S.; Han, S.; Qiu, B.; Lu, Y.; Huang, W.; Li, F.; Chen, D.; Berglund, B.; Xiao, H.; et al. The Role of Dihydroresveratrol in Enhancing the Synergistic Effect of Ligilactobacillus salivarius Li01 and Resveratrol in Ameliorating Colitis in Mice. Research 2022, 2022, 1–16. [Google Scholar] [CrossRef] [PubMed]
  34. Zhou, B.; Albarracin, L.; Indo, Y.; Arce, L.; Masumizu, Y.; Tomokiyo, M.; Islam, M.A.; Garcia-Castillo, V.; Ikeda-Ohtsubo, W.; Nochi, T.; et al. Selection of Immunobiotic Ligilactobacillus salivarius strains from the intestinal tract of wakame-fed pigs: Functional and genomic studies. Microorganisms 2020, 8, 1659. [Google Scholar] [CrossRef] [PubMed]
  35. Zou, J.; Shen, Y.; Chen, M.; Zhang, Z.; Xiao, S.; Liu, C.; Wan, Y.; Yang, L.; Jiang, S.; Shang, E.; et al. Lizhong decoction ameliorates ulcerative colitis in mice via modulating gut microbiota and its metabolites. Appl. Microbiol. Biotechnol. 2020, 104, 5999–6012. [Google Scholar] [CrossRef] [PubMed]
  36. Li, Q.; Liu, W.; Feng, Y.; Hou, H.; Zhang, Z.; Yu, Q.; Zhou, Y.; Luo, Q.; Luo, Y.; Ouyang, H.; et al. Radix Puerariae thomsonii polysaccharide (RPP) improves inflammation and lipid peroxidation in alcohol and high-fat diet mice by regulating gut microbiota. Int. J. Biol. Macromol. 2022, 209, 858–870. [Google Scholar] [CrossRef]
  37. Song, X.; Zhong, L.; Lyu, N.; Liu, F.; Li, B.; Hao, Y.; Xue, Y.; Li, J.; Feng, Y.; Ma, Y.; et al. Inulin can alleviate metabolism disorders in ob/ob mice by partially restoring leptin-related pathways mediated by gut microbiota. Genom. Proteom. Bioinform. 2019, 17, 64–75. [Google Scholar] [CrossRef]
  38. Surono, I.S.; Wardana, A.A.; Waspodo, P.; Saksono, B.; Verhoeven, J.; Venema, K. Effect of functional food ingredients on gut microbiota in a rodent diabetes model. Nutr. Metab. 2020, 17, 1–9. [Google Scholar] [CrossRef]
  39. Wu, M.R.; Chou, T.S.; Huang, C.Y.; Hsiao, J.K. A Potential Probiotic-Lachnospiraceae NK4A136 Group: Evidence from the Restoration of the Dietary Pattern from a High-Fat Diet; Research Square: Tsukuba, Japan, 2020. [Google Scholar]
  40. Galié, S.; García-Gavilán, J.; Camacho-Barcía, L.; Atzeni, A.; Muralidharan, J.; Papandreou, C.; Arcelin, P.; Palau-Galindo, A.; Garcia, D.; Basora, J.; et al. Effects of the mediterranean diet or nut consumption on gut microbiota composition and fecal metabolites and their relationship with cardiometabolic risk factors. Mol. Nutr. Food Res. 2021, 65, 2000982. [Google Scholar] [CrossRef]
  41. Zhang, X.; Yasuda, K.; Gilmore, R.A.; Westmoreland, S.V.; Platt, D.M.; Miller, G.M.; Vallender, E.J. Alcohol-induced changes in the gut microbiome and metabolome of rhesus macaques. Psychopharmacology 2019, 236, 1531–1544. [Google Scholar] [CrossRef]
  42. Li, S.; Wang, Z.; Yang, Y.; Yang, S.; Yao, C.; Liu, K.; Cui, S.; Zou, Q.; Sun, H.; Guo, G. Lachnospiraceae shift in the microbial community of mice fecal sample effects on water immersion restraint stress. Amb Express 2017, 7, 1–11. [Google Scholar] [CrossRef] [Green Version]
  43. Liu, Y.; Lin, Q.; Huang, X.; Jiang, G.; Li, C.; Zhang, X.; Liu, S.; He, L.; Liu, Y.; Dai, Q.; et al. Effects of dietary ferulic acid on the intestinal microbiota and the associated changes on the growth performance, serum cytokine profile, and intestinal morphology in ducks. Front. Microbiol. 2021, 12, 1–13. [Google Scholar] [CrossRef] [PubMed]
  44. Todokoro, T.; Negoro, H.; Kotaka, A.; Hata, Y.; Ishida, H. Aspergillus oryzae FaeA is responsible for the release of ferulic acid, a precursor of off-odor 4-vinylguaiacol in sake brewing. J. Biosci. Bioeng. 2022, 133, 140–145. [Google Scholar] [CrossRef] [PubMed]
  45. Madsen, K.; Cornish, A.; Soper, P.; McKaigney, C.; Jijon, H.; Yachimec, C.; Doyle, J.; Jewell, L.; De Simone, C. Probiotic bacteria enhance murine and human intestinal epithelial barrier function. Gastroenterology 2001, 121, 580–591. [Google Scholar] [CrossRef] [Green Version]
  46. Leclercq, S.; Matamoros, S.; Cani, P.D.; Neyrinck, A.M.; Jamar, F.; Stärkel, P.; Windey, K.; Tremaroli, V.; Bäckhed, F.; Verbeke, K.; et al. Intestinal permeability, gut-bacterial dysbiosis, and behavioral markers of alcohol-dependence severity. Proc. Natl. Acad. Sci. USA 2014, 111, E4485–E4493. [Google Scholar] [CrossRef] [PubMed] [Green Version]
  47. Shang, Q.; Shan, X.; Cai, C.; Hao, J.; Li, G.; Yu, G. Dietary fucoidan modulates the gut microbiota in mice by increasing the abundance of Lactobacillus and Ruminococcaceae. Food Funct. 2016, 7, 3224–3232. [Google Scholar] [CrossRef] [PubMed]
  48. Vijay, A.; Astbury, S.; Le Roy, C.; Spector, T.D.; Valdes, A.M. The prebiotic effects of omega-3 fatty acid supplementation: A six-week randomised intervention trial. Gut Microbes 2021, 13, 1863133. [Google Scholar] [CrossRef]
  49. Yan, X.; Zhang, H.; Lin, A.; Su, Y. Antagonization of Ghrelin Suppresses Muscle Protein Deposition by Altering Gut Microbiota and Serum Amino Acid Composition in a Pig Model. Biology 2022, 11, 840. [Google Scholar] [CrossRef]
  50. Balamurugan, R.; Chittaranjan, S.P.; Chandragunasekaran, A.M.; Ramakrishna, B.S. Molecular detection of the ruminal bacterium, Butyrivibrio fibrisolvens, in feces from rural residents of southern India. Microb. Ecol. Health Dis. 2009, 21, 38–43. [Google Scholar]
  51. Pane, K.; Boccella, S.; Guida, F.; Franzese, M.; Maione, S.; Salvatore, M. Role of gut microbiota in neuropathy and neuropathic pain states: A systematic preclinical review. Neurobiol. Dis. 2022, 170, 1–14. [Google Scholar] [CrossRef]
  52. Van der Sluis, M.; De Koning, B.A.; De Bruijn, A.C.; Velcich, A.; Meijerink, J.P.; Van Goudoever, J.B.; Büller, H.A.; Dekker, J.; Van Seuningen, I.; Renes, I.B.; et al. Muc2-deficient mice spontaneously develop colitis, indicating that MUC2 is critical for colonic protection. Gastroenterology 2006, 131, 117–129. [Google Scholar] [CrossRef]
  53. Rocco, A.; Compare, D.; Angrisani, D.; Zamparelli, M.S.; Nardone, G. Alcoholic disease: Liver and beyond. World J. Gastroenterol. WJG 2014, 20, 14652. [Google Scholar] [CrossRef]
  54. Donaldson, G.P.; Lee, S.M.; Mazmanian, S.K. Gut biogeography of the bacterial microbiota. Nat. Rev. Microbiol. 2016, 14, 20–32. [Google Scholar] [CrossRef] [Green Version]
  55. Van de Wiel, A. The effect of alcohol on postprandial and fasting triglycerides. Int. J. Vasc. Med. 2012, 2012, 1–4. [Google Scholar] [CrossRef] [PubMed] [Green Version]
  56. Yan, S.; Xiangsong, C.; Xiang, X. Improvement of the aroma of lily rice wine by using aroma-producing yeast strain Wickerhamomyces anomalus HN006. AMB Express 2019, 9, 1–14. [Google Scholar] [CrossRef] [PubMed]
  57. Ahola, A.J.; Lassenius, M.I.; Forsblom, C.; Harjutsalo, V.; Lehto, M.; Groop, P.H. Dietary patterns reflecting healthy food choices are associated with lower serum LPS activity. Sci. Rep. 2017, 7, 6511. [Google Scholar] [CrossRef] [Green Version]
  58. Caslin, B.; Maguire, C.; Karmakar, A.; Mohler, K.; Wylie, D.; Melamed, E. Alcohol shifts gut microbial networks and ameliorates a murine model of neuroinflammation in a sex-specific pattern. Proc. Natl. Acad. Sci. USA 2019, 116, 25808–25815. [Google Scholar] [CrossRef]
  59. Le Roy, C.I.; Wells, P.M.; Si, J.; Raes, J.; Bell, J.T.; Spector, T.D. Red wine consumption associated with increased gut microbiota α-diversity in 3 independent cohorts. Gastroenterology 2020, 158, 270–272. [Google Scholar] [CrossRef] [PubMed]
Figure 1. Heat map showing the abundance of 25 bacterial genera in (A) human and (B) mouse fecal samples. Dark and light blue gradients represent high and low abundances of bacteria, respectively (CT = control, RB = rice beverage, IF = insoluble fraction, SF = soluble fraction, D = drinkers and ND = nondrinkers. Digits (0 and 30) suffixed at the end of mouse samples denote days of treatment).
Fermentation 09 00126 g001
Figure 2. Daywise comparison of alpha diversity indices. (A) Shannon and (B) Simpson indices based on the gut microbiota of mice on 0th and 30th days of different treatments.
Fermentation 09 00126 g002
Figure 3. Principal coordinate analyses (PCoA) based on beta diversity indices. (A,C) Jaccard and (B,D) Bray–Curtis distances demonstrating the microbial communities in human and mice fecal samples, respectively.
Fermentation 09 00126 g003
Figure 4. Partial least-squares discriminant analysis (PLS – DA) plot based on the metabolites detected in the feces of different treatment groups (CT = control, RB = rice beverage, IF = insoluble fraction and SF = soluble fraction).
Fermentation 09 00126 g004
Figure 5. Endotoxin level in the blood plasma of the different groups after 30 days of treatment with different fractions of rice beverage. * significant difference (p ≤ 0.05). (CT = control, RB = rice beverage, IF = insoluble fraction, and SF = soluble fraction).
Fermentation 09 00126 g005
Figure 6. Light microscopic images (40× magnification) of HE-stained ileum of mice in the treatment groups (CT = control, RB = rice beverage, IF = insoluble fraction, and SF = soluble fraction. Arrows indicate goblet cells).
Fermentation 09 00126 g006
Table 1. Comparison between gut bacteria in drinkers and nondrinkers of the rice beverage in the Tiwa community. Upward arrows indicate an increase in drinkers vs. nondrinkers and vice versa.
GenusInferencep Values
Odoribacter0.001
Christensenellaceae R-70.001
Coprococcus0.002
Defluviitaleaceae UCG-0110.004
Oscillospiraceae UCG-0050.004
Rikenellaceae RC90.006
Succinivibrio0.007
Aeromonas0.007
[Eubacterium] siraeum0.01
Oscillospiraceae UCG-0020.013
Ruminococcus0.016
Lachnospiraceae NK4A1360.017
Lachnospiraceae NC20040.042
Butyrivibrio0.023
Butyricimonas0.027
Lachnoclostridium0.03
Bilophila0.038
Rothia0.04
Senegalimassilia0.045
Anaerovoracaceae Family XIII UCG-0010.047
Table 2. Changes in gut bacteria in mice after 30 days of treatment with different fractions of the beverage. Upward arrows indicate increase after 30 days of treatment and vice versa.
TreatmentBacteriaInferencep Values
CTEubacterium ventriosum0.037
Lachnospiraceae A20.037
Cuneatibacter0.037
Leptotrichia0.046
Negativibacillus0.046
Mesocricetibacter0.046
Rodentibacter0.046
Ruminococcus0.046
Candidatus Arthromitus0.050
Intestinimonas0.050
Lachnospiraceae NK4A1360.050
Odoribacter0.050
RBEubacterium siraeum0.037
Anaerovoracaceae Family XIII UCG-0010.037
Ruminococcaceae UBA18190.037
Eubacterium nodatum0.046
Lachnospiraceae ASF3560.046
Rodentibacter0.046
Anaerovoracaceae Family XIII AD30110.046
Streptococcus0.046
Negativibacillus0.046
Roseburia0.050
Acetatifactor0.050
Bacteroides0.050
Ligilactobacillus0.050
Anaerotruncus0.050
Erysipelatoclostridium0.050
Prevotellaceae UCG-0010.050
IFLachnospiraceae ASF3560.000
Paludicola0.000
Anaerovoracaceae Family XIII AD30110.001
Parasporobacterium0.001
SFWautersiella0.037
Leptotrichia0.046
Candidatus Stoquefichus0.046
Lachnospiraceae UCG-0040.050
Lachnospiraceae ASF3560.050
Rikenella0.050
Desulfovibrio0.050
Lactobacillaceae HT0020.050
Intestinimonas0.050
Bacteroides0.050
Lactobacillus0.050
Ligilactobacillus0.050
Eubacterium xylanophilum0.050
Prevotellaceae UCG-0010.050
Ruminococcus0.050
Table 3. List of mouse fecal metabolites (peak area percentage) after 30 days of treatment with different fractions of the beverage.(CT = control, RB = rice beverage, IF = insoluble fraction, and SF = soluble fraction).
MetabolitesCTRBIFSF
alpha Linolenic acid2.540.9550.5050.13
17-Octadecynoic acid00.07500
1-Monolinoleoylglycerol0.752.590.2053.075
1-O-Heptadecylglycerol0000.03
1-O-hexadecylglycerol00.20.2550.595
2-alpha -Mannobiose00.1300
2-Desoxy-pentos-3-ulose0.0450.110.0950.175
2-Pyrrolidone-5-carboxylic acid0.5250.070.430.455
3-Hydroxydodecanedioic acid0.17000
4-Hydroxyphenylbutyric acid00.1550.2350
4-Nitrophenyl-.beta.-D-galacturonide00.06500
5-Methyluridine000.2750
9,12,15-Octadecatrienoic acid000.10
9-Octadecenoic acid02.12.6451.485
Acetic acid0.140.440.110.215
alpha-L-Mannopyranose00.02500
Arachidonic acid0000.32
Benzenepropanoic acid0.1600.110
Benzoic acid0000.17
Butanedioic acid1.910.7251.073.045
Butanoic acid001.2250.11
Cinnamate00.02500.03
D-(-)-Erythrose00.01500
D-(-)-Rhamnose01.041.9052.625
D-(-)-Tagatose00.110.3450.195
D-(+)-Cellobiose00.8850.760.595
D-(+)-Glucuronic acid00.070.0750
D-(+)-Xylose8.4155.389.365.79
D-Arabinonic acid0000.02
D-Galactose16.9612.0411.1113.67
D-Glucitol0001.315
D-Glucose016.400
D-Lactose02.01500
D-Mannose0.340.21500.895
Dodecanedioic acid00.120.2850
D-Xylose0000.05
Eicosanoic acid0000.095
Erythro-Pentonic acid00.040.210.05
Ethanedioic acid0.400.9550.845
Ethanol0000.01
Glycerol4.414.844.315.295
Glycine0000.035
Hexadecanoic acid07.4956.2255.85
L-(-)-Sorbose0000.02
L-Asparagine0000.155
L-Isoleucine0.070.030.1250.35
L-Threonine000.250.79
L-Valine0.1350.10.20.355
Maltose00.15500
Monoamidoethylmalonic acid000.010
N-Acetyl-D-galactosaminitol0001.07
N-Acetyl-D-glucosamine2.9551.4154.5254.78
n-Pentadecanoic acid0000.27
N-phthalimide1.4151.35502.44
Octadecanoic acid04.400
Oleic acid7.625.1254.194.84
Pentanedioic acid0.04500.0150.015
Pentanoic acid0001.22
Phenyl alanine0000.045
Phosphoric acid000.040
Propanedioic acid0000.12
Propanetriol00.0150.030.04
Propanoic acid9.897.066.07513.01
Ribitol2.380.0300
Serine0.10.040.190.265
Tetracosanoic acid00.180.280.42
Tetradecanoic acid0.06500.3950.2
Uridine000.1050.04
Table 4. Morphological features of ileum tissues ( mean of 5 replicates ± standard error, CT = control, RB = rice beverage, IF = insoluble fraction, and SF = soluble fraction).
CTRBIFSF
Villus length ( μ m)169.852 ± 5.92151.848 ± 3.59155.89 ± 10.73176.914 ± 9.92
Crypt depth ( μ m)84.022 ± 1.9682.892 ± 2.9874.65 ± 2.2193.246 ± 2.39
Width of lamina propria ( μ m)26.94 ± 2.6427.236 ± 1.8030.108 ± 2.8631.902 ± 1.33
Depth of submucosa ( μ m)22.51 ± 1.4425.376 ± 3.0021.23 ± 1.6429.43 ± 2.35
Disclaimer/Publisher’s Note: The statements, opinions and data contained in all publications are solely those of the individual author(s) and contributor(s) and not of MDPI and/or the editor(s). MDPI and/or the editor(s) disclaim responsibility for any injury to people or property resulting from any ideas, methods, instructions or products referred to in the content.

