1. Introduction
Filamentous fungi biotechnological processes have enabled the industrial exploitation of their capability to produce profitable enzymes, due to their easy propagation and high production of extracellular enzymes with particular properties such as stability in wide ranges of temperature and pH [
1,
2,
3]. The genus
Mucor belonging, to the class Zygomycetes, shows a variety of bioactivities such as multi-metal remediation by
M. hiemalis [
4]; production of biosurfactants [
5], fungal chitosan [
6] and bio-oil by
M. circinelloides [
7,
8]; the yielding of ethanol by
M. indicus [
9] along with the potential to produce extracellular hydrolytic enzymes on various agro-industrial wastes that can be harnessed in diverse applications in industry [
10]. These enzymes include milk-clotting proteases [
11], malic enzyme [
12] and polygalacturonase by
M. circinelloides [
13], ferulic acid esterase from
M. hiemalis [
14], lipase by
M. geophillus [
15], amylase [
16], xylanase by
M. indicus and
M. hiemalis [
17], and endoglucanase by
M. racemosus [
18].
The increasing expansion of agricultural-waste activity has led to the accumulation of a large quantity of lignocellulosic residues across the world [
19]. Lignocellulosic plant biomass is mainly constituted of hemicellulose, cellulose, and lignin [
20]. Cellulases are a group of synergetic enzymes that catalyze the degradation of cellulose into fermentable sugars and can be divided into three major components, namely, endoglucanase, exoglucanase and β-glucosidase. Furthermore, endoglucanase is considered the most economical type to create free end groups on the cellulose, thereby producing starting points for the other cellulase synergetic components [
21,
22]. Fungi have the capability to produce higher quantities of cellulases as compared to other organisms. Cellulase has been included in a wide range of industrial applications for alcohol fermentation, biofuel and starch production, juices extraction, animal-feed processing, and textile and paper manufacturing [
23].
Pectinase is involved in the hydrolysis of pectin present in the middle lamella and primary cell wall of vegetables and fruits into D-galacturonic acid by breaking down α-1-4 chains [
24]. Pectic compounds are copious in the plant biomass composition; their levels are between 4 and 30% in the pulp of beet and the peel of citrus fruits [
25]. Pectinase has a broad domain of implementations and plays critical roles in the food industry, such as the clarification of fruit juice, oil squeezing, the beverage industry, waste management, tea fermentation, the paper and pulp industry, and softening plant-based fibers [
26]. Genera of Zygomycetes and Ascomycetes could be a preferred source of pectinase, as 50% of total pectinases are obtained from fungi, because of their easy growth, high productivity rate, being cost effective and having a short life span [
18].
The amount of fungal-enzyme manufacturing relies on the conditions of the fermentation process, along with the necessity to optimize these conditions in order to reduce enzyme-production cost [
27]. Fungal-enzyme manufacturing is prevalently implemented by submerged or solid-state fermentations [
28]. Submerged fermentation, reported in 90% of the industrial enzymes production, occurs in the presence of excess water, thus offering easy handling and better monitoring [
29,
30]. Concerning the accumulation of vast bulks of agro-industrial by-products around the world, this study aimed to evaluate the production of high-value, partially purified pectinase and cellulase by
Mucor circinelloides and
M. hiemalis strains, using agro-industrial by-products as a cheap substrate in submerged-fermentation conditions. The optimization of cellulase and pectinase production and characterization of partially purified enzymes were investigated.
4. Discussion
Fungi are an excellent source for the production of various beneficial enzymes. The lignin present in the polymer matrix in plant cell walls form a hydrophobic network which inhibits the access of microbial enzymes to degrade cell-wall components [
40,
41]. Therefore, the lowest content of lignin in the citrus peels could enhance microbial-enzyme production due to their tissue structure flexibility, allowing the access of the microorganism to the cellulose, pectin and hemicellulose [
18]. In this research,
M. circinelloides and
M. hiemalis were investigated as potential sources for producing cellulase and pectinase on tangerine peel by submerged fermentation. The type of substrate and the presence of growth factors affect the fungal growth and the biosynthesis of enzymes. Therefore, there is an urgent need to enhance the biosynthesis of the enzymes by optimizing fungal production.
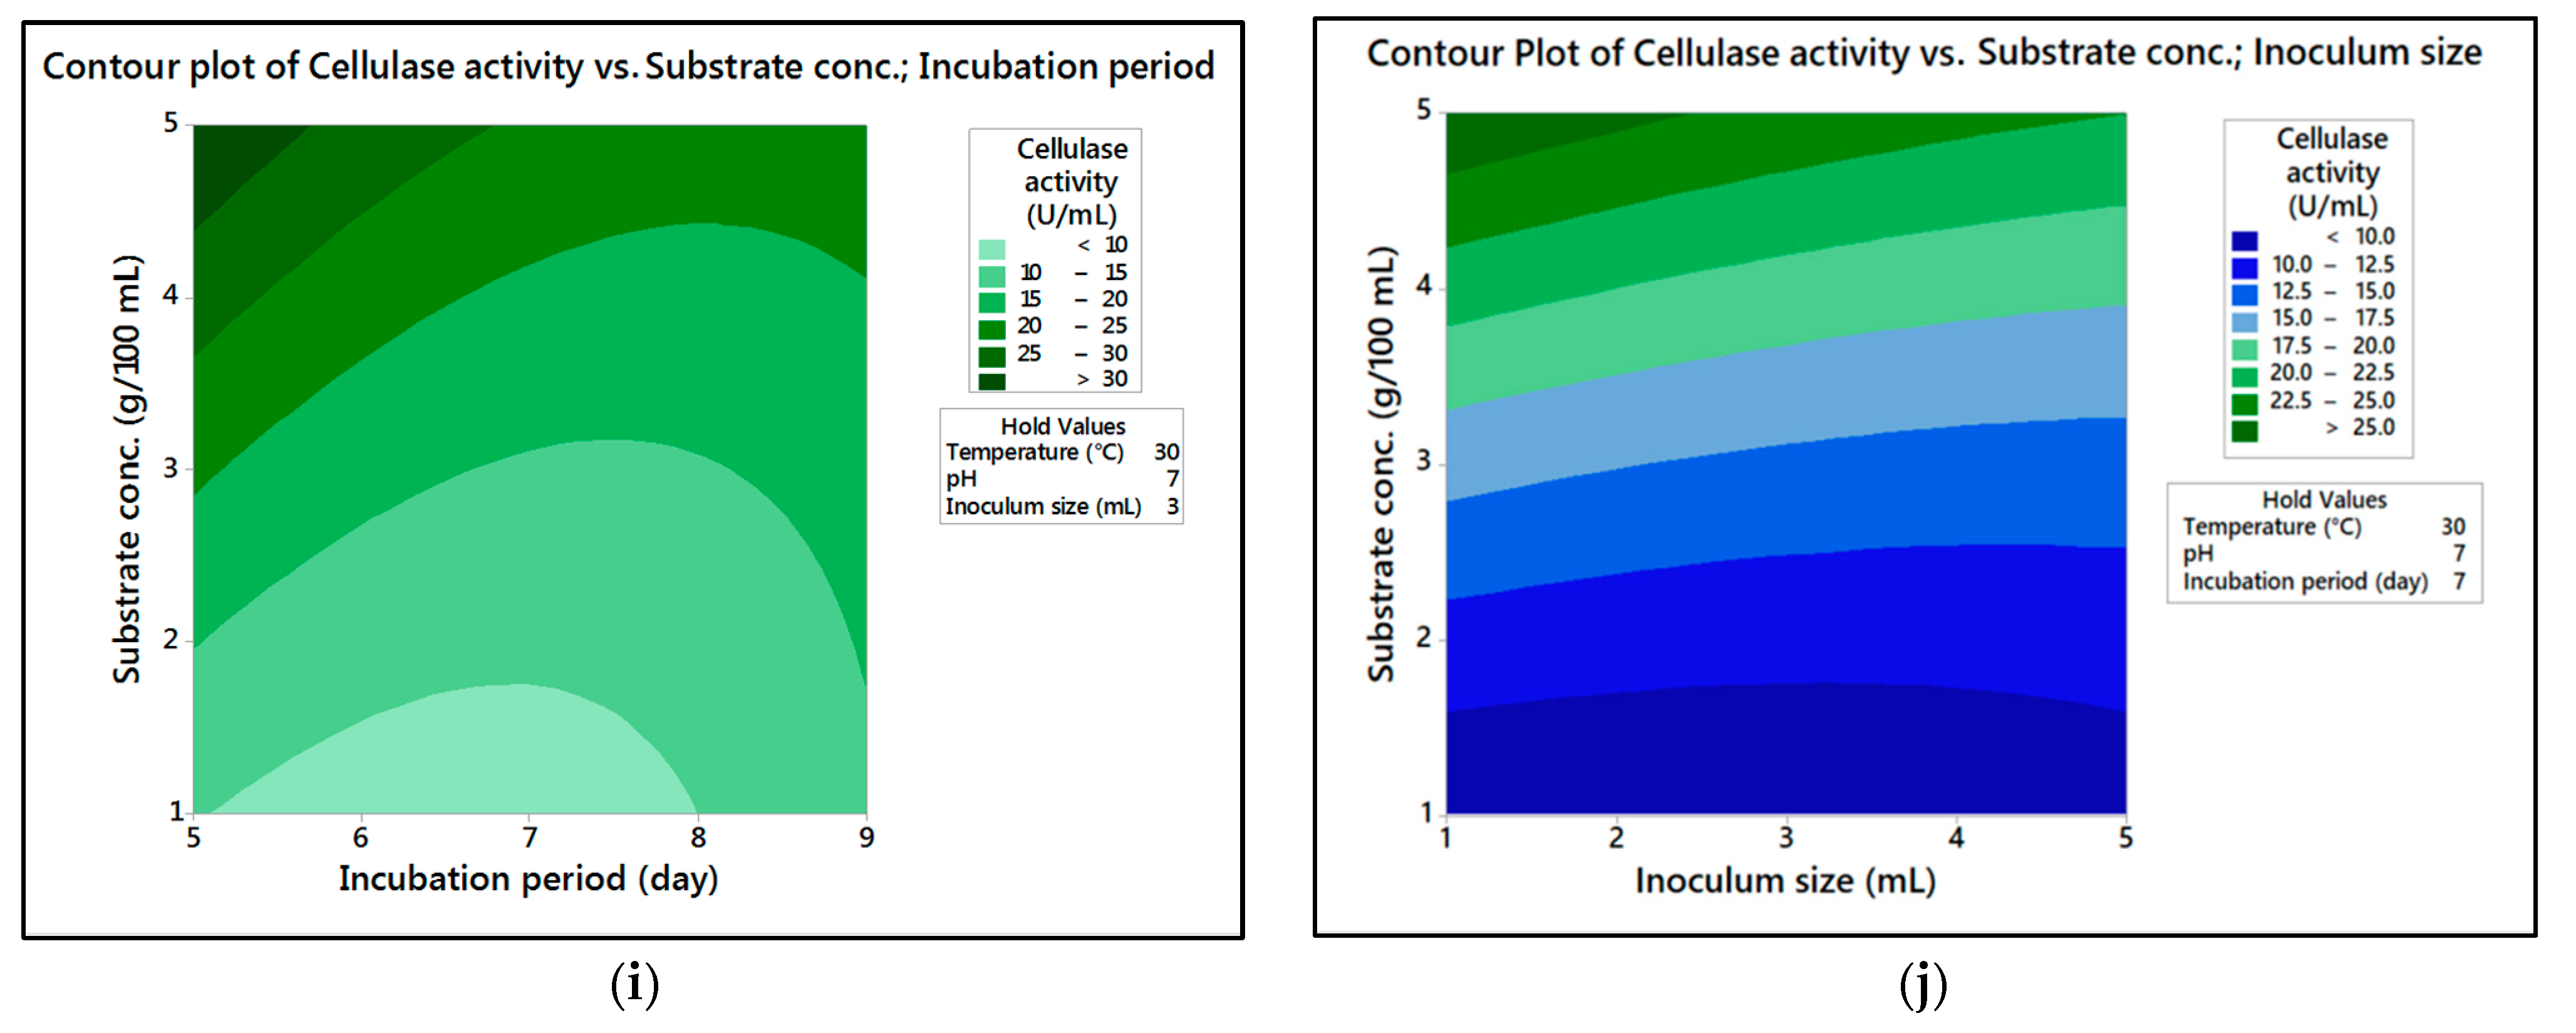
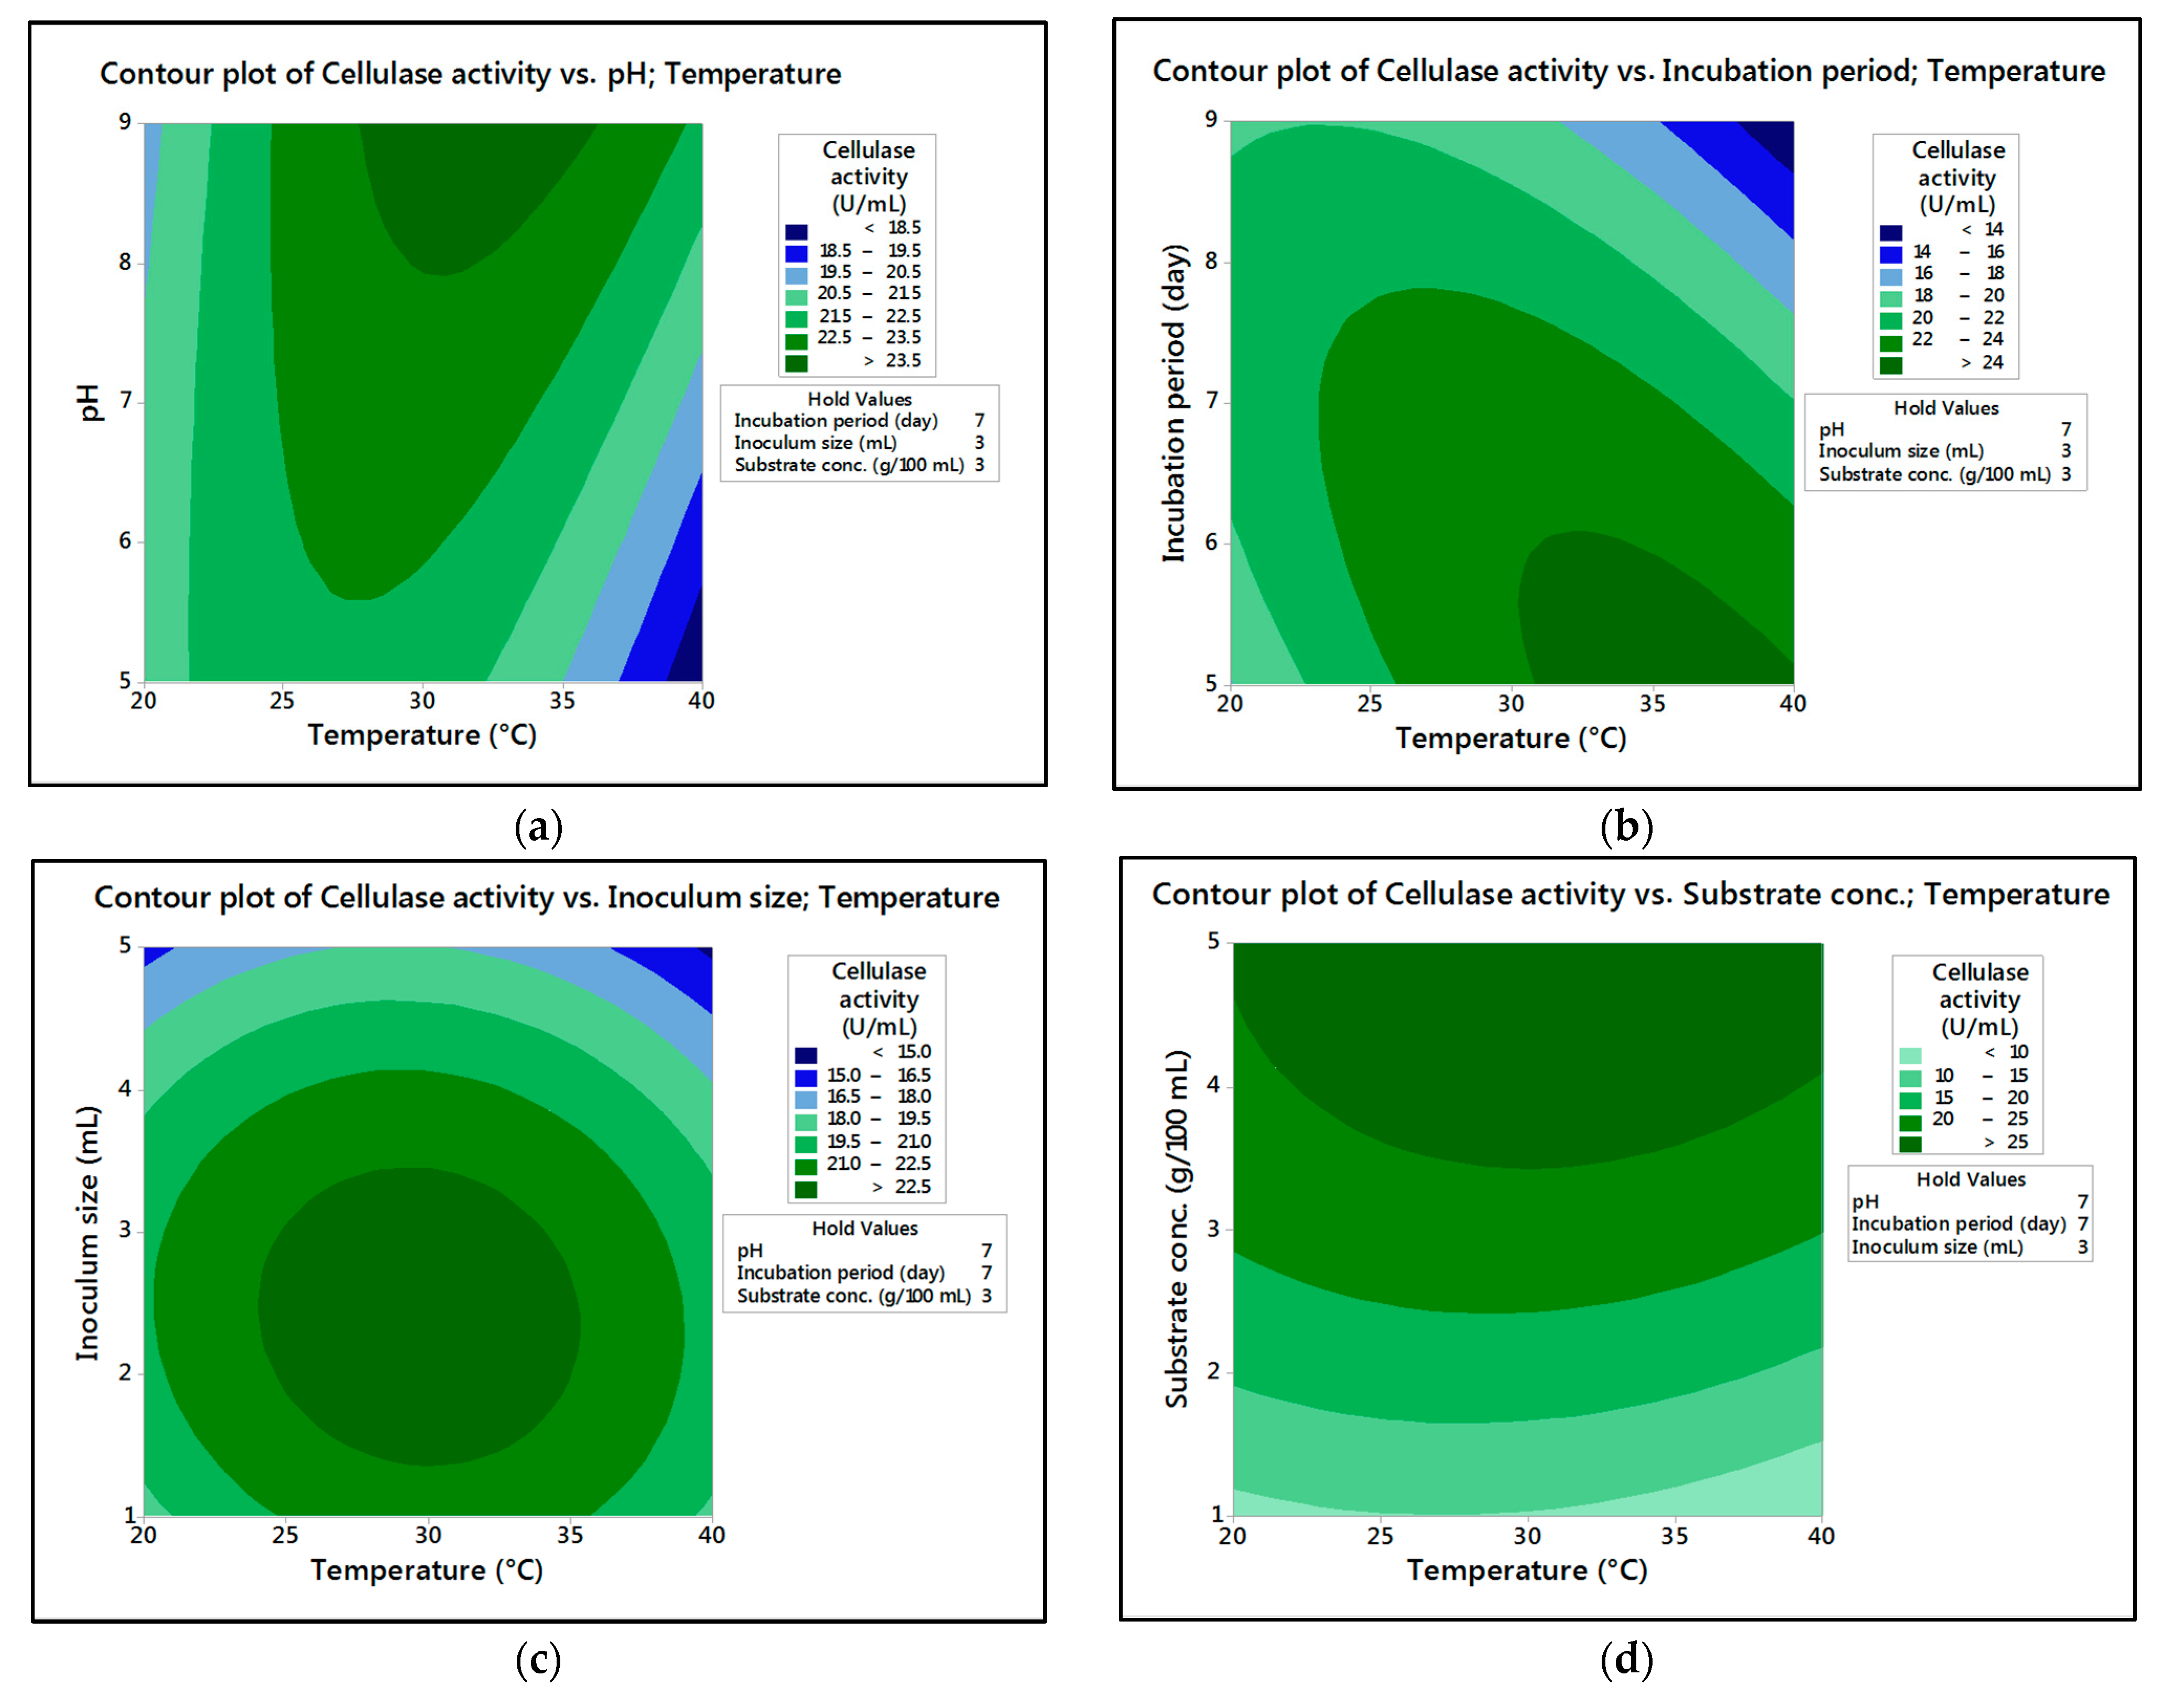
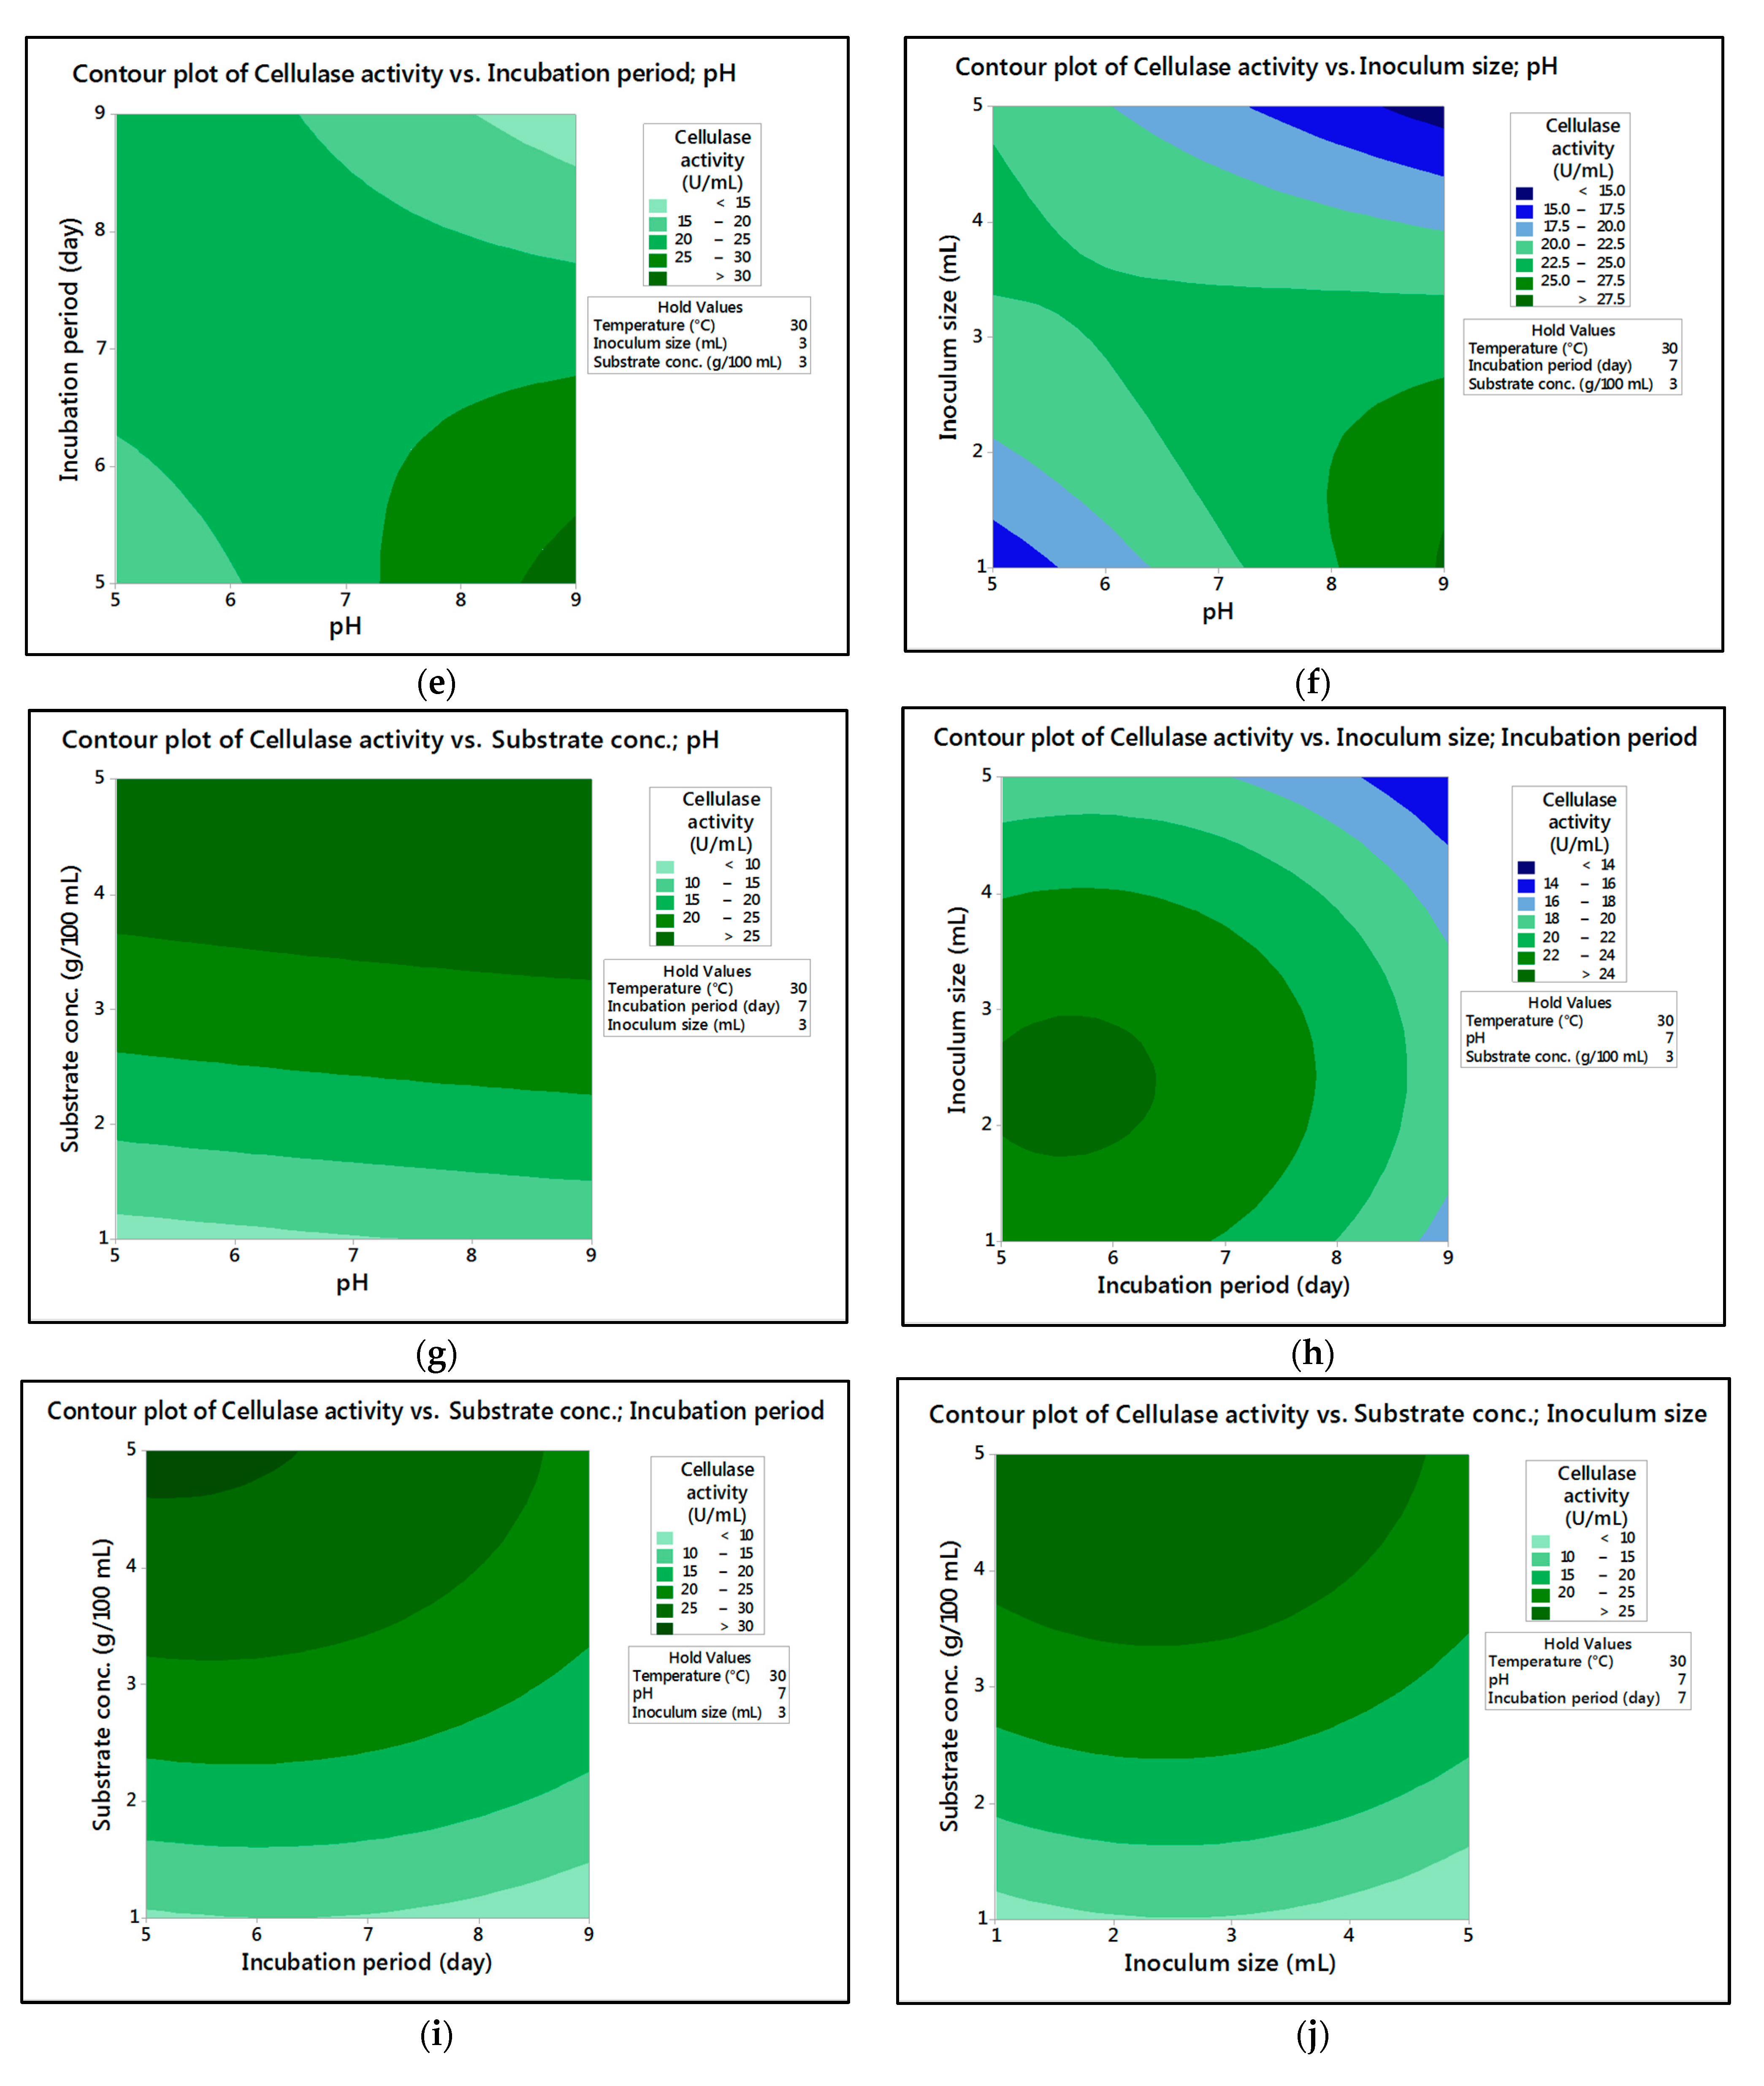
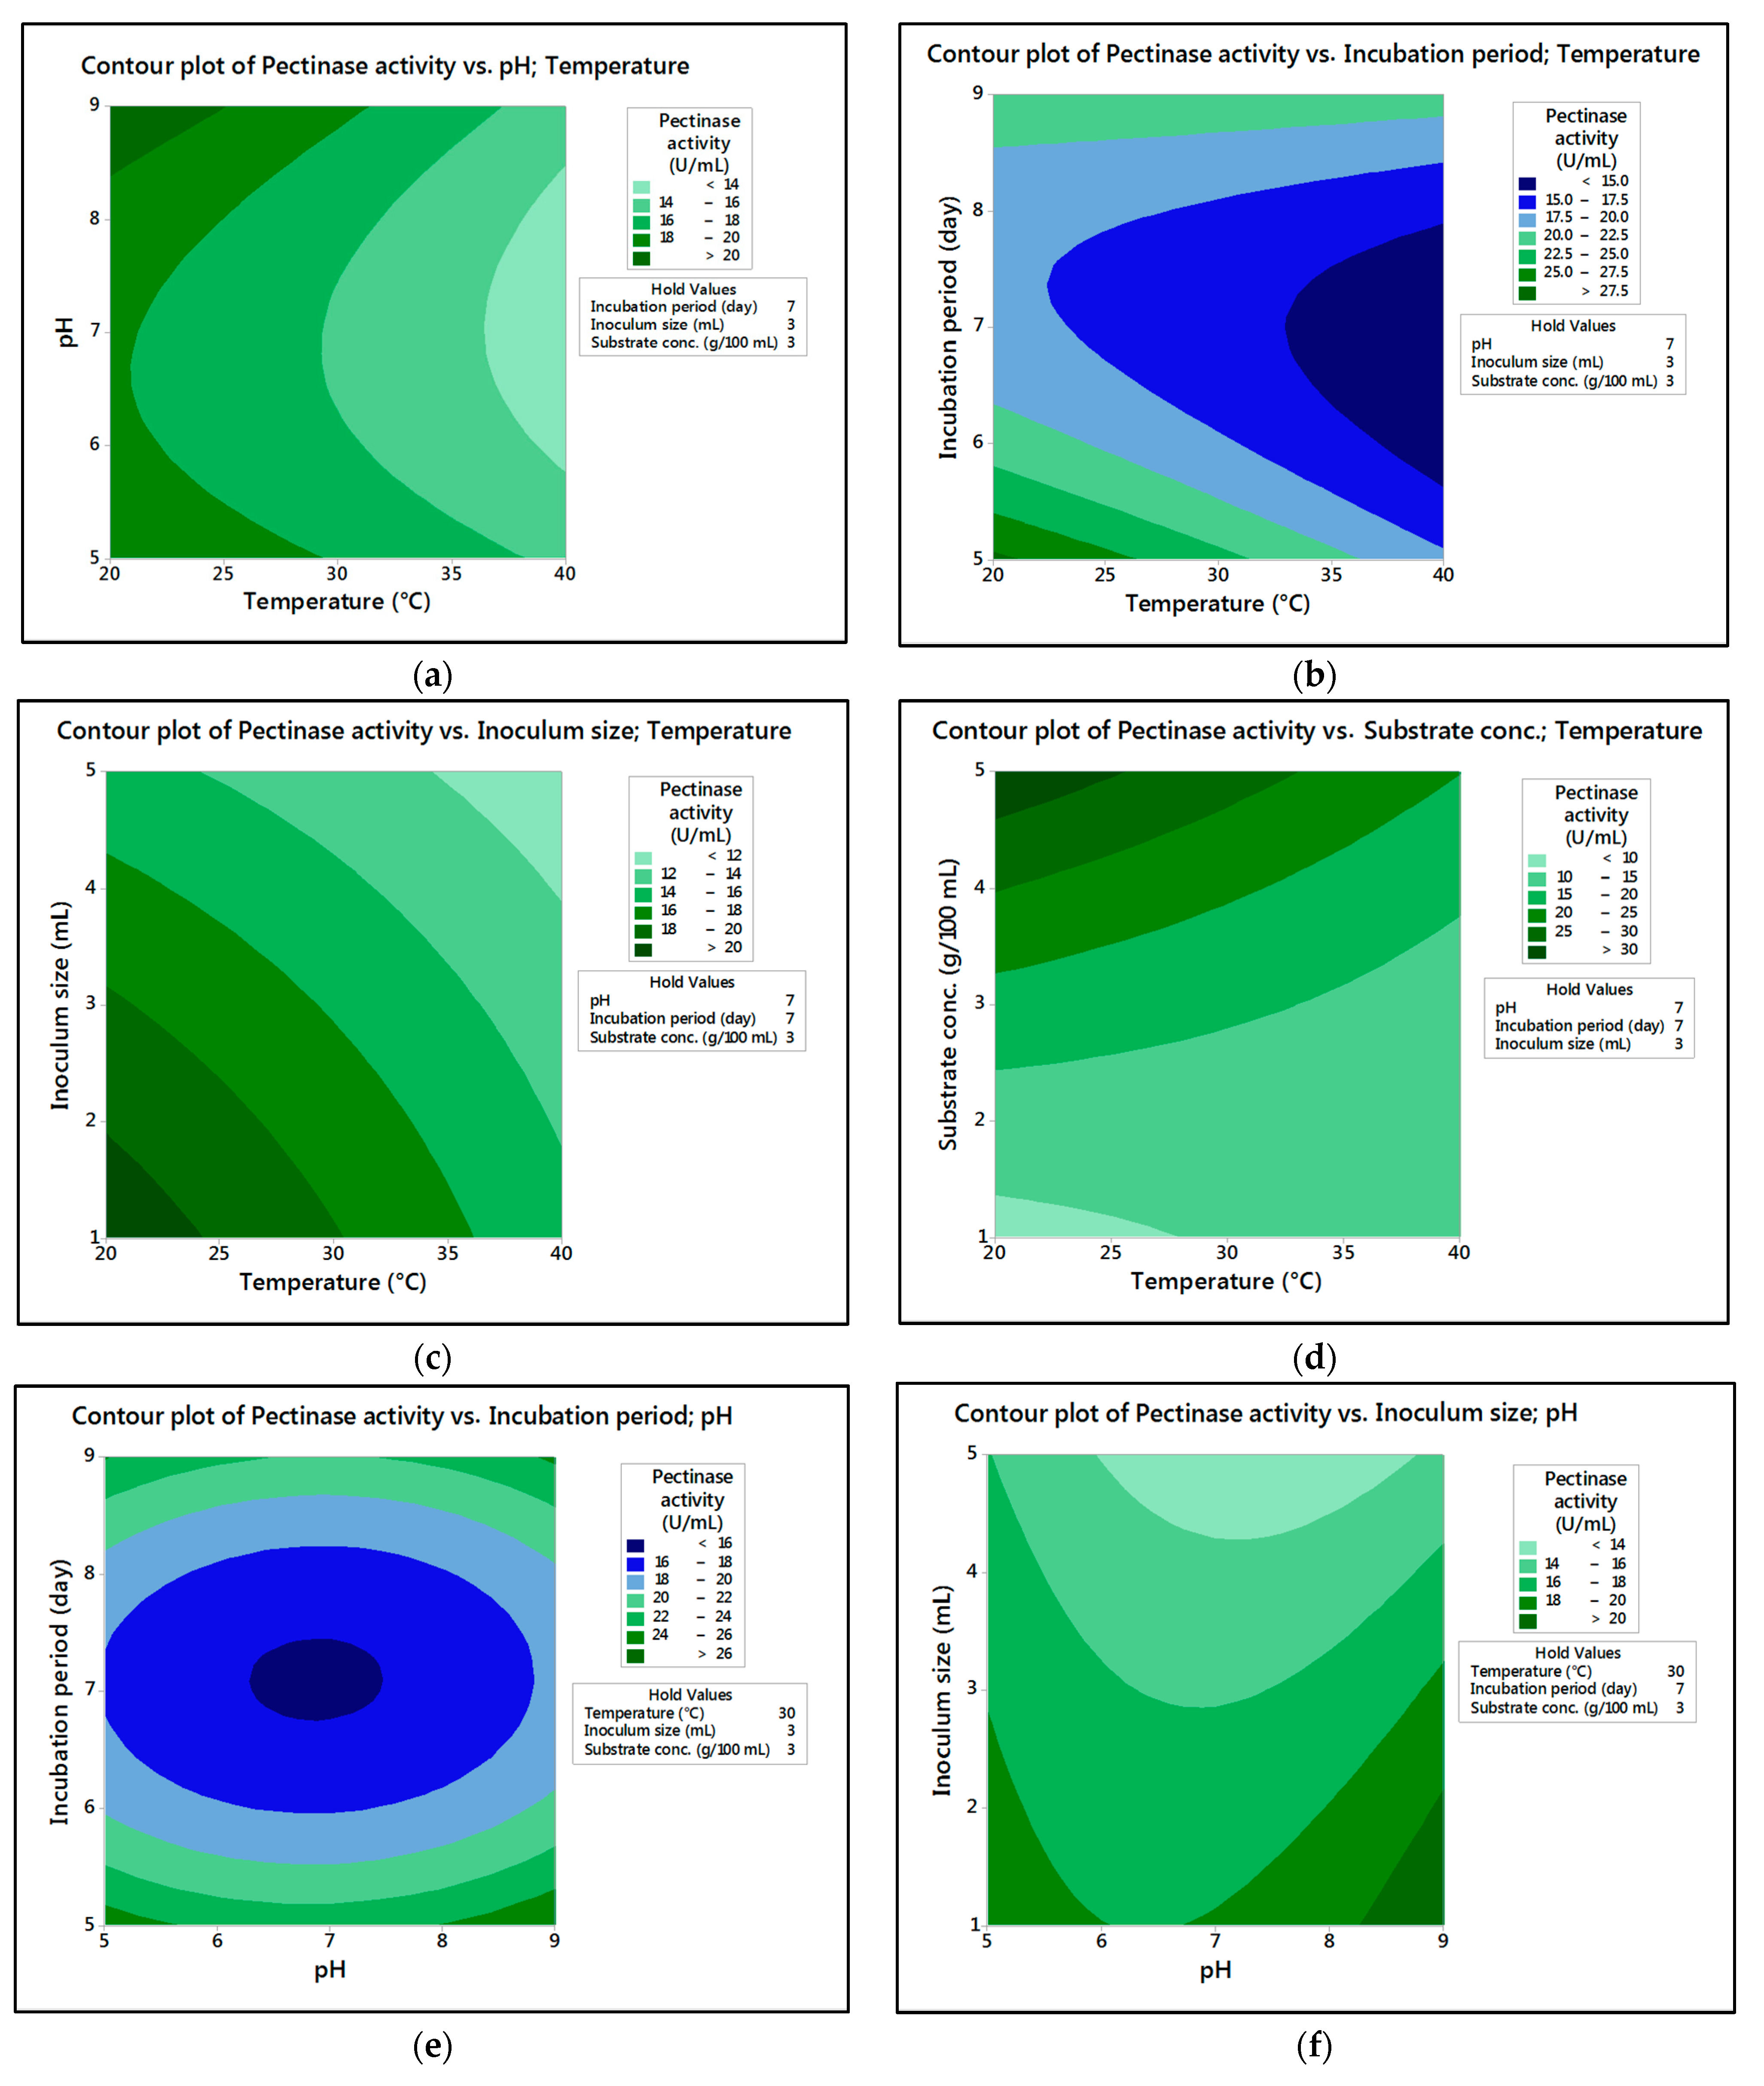
In the current research,
M. circinelloides and
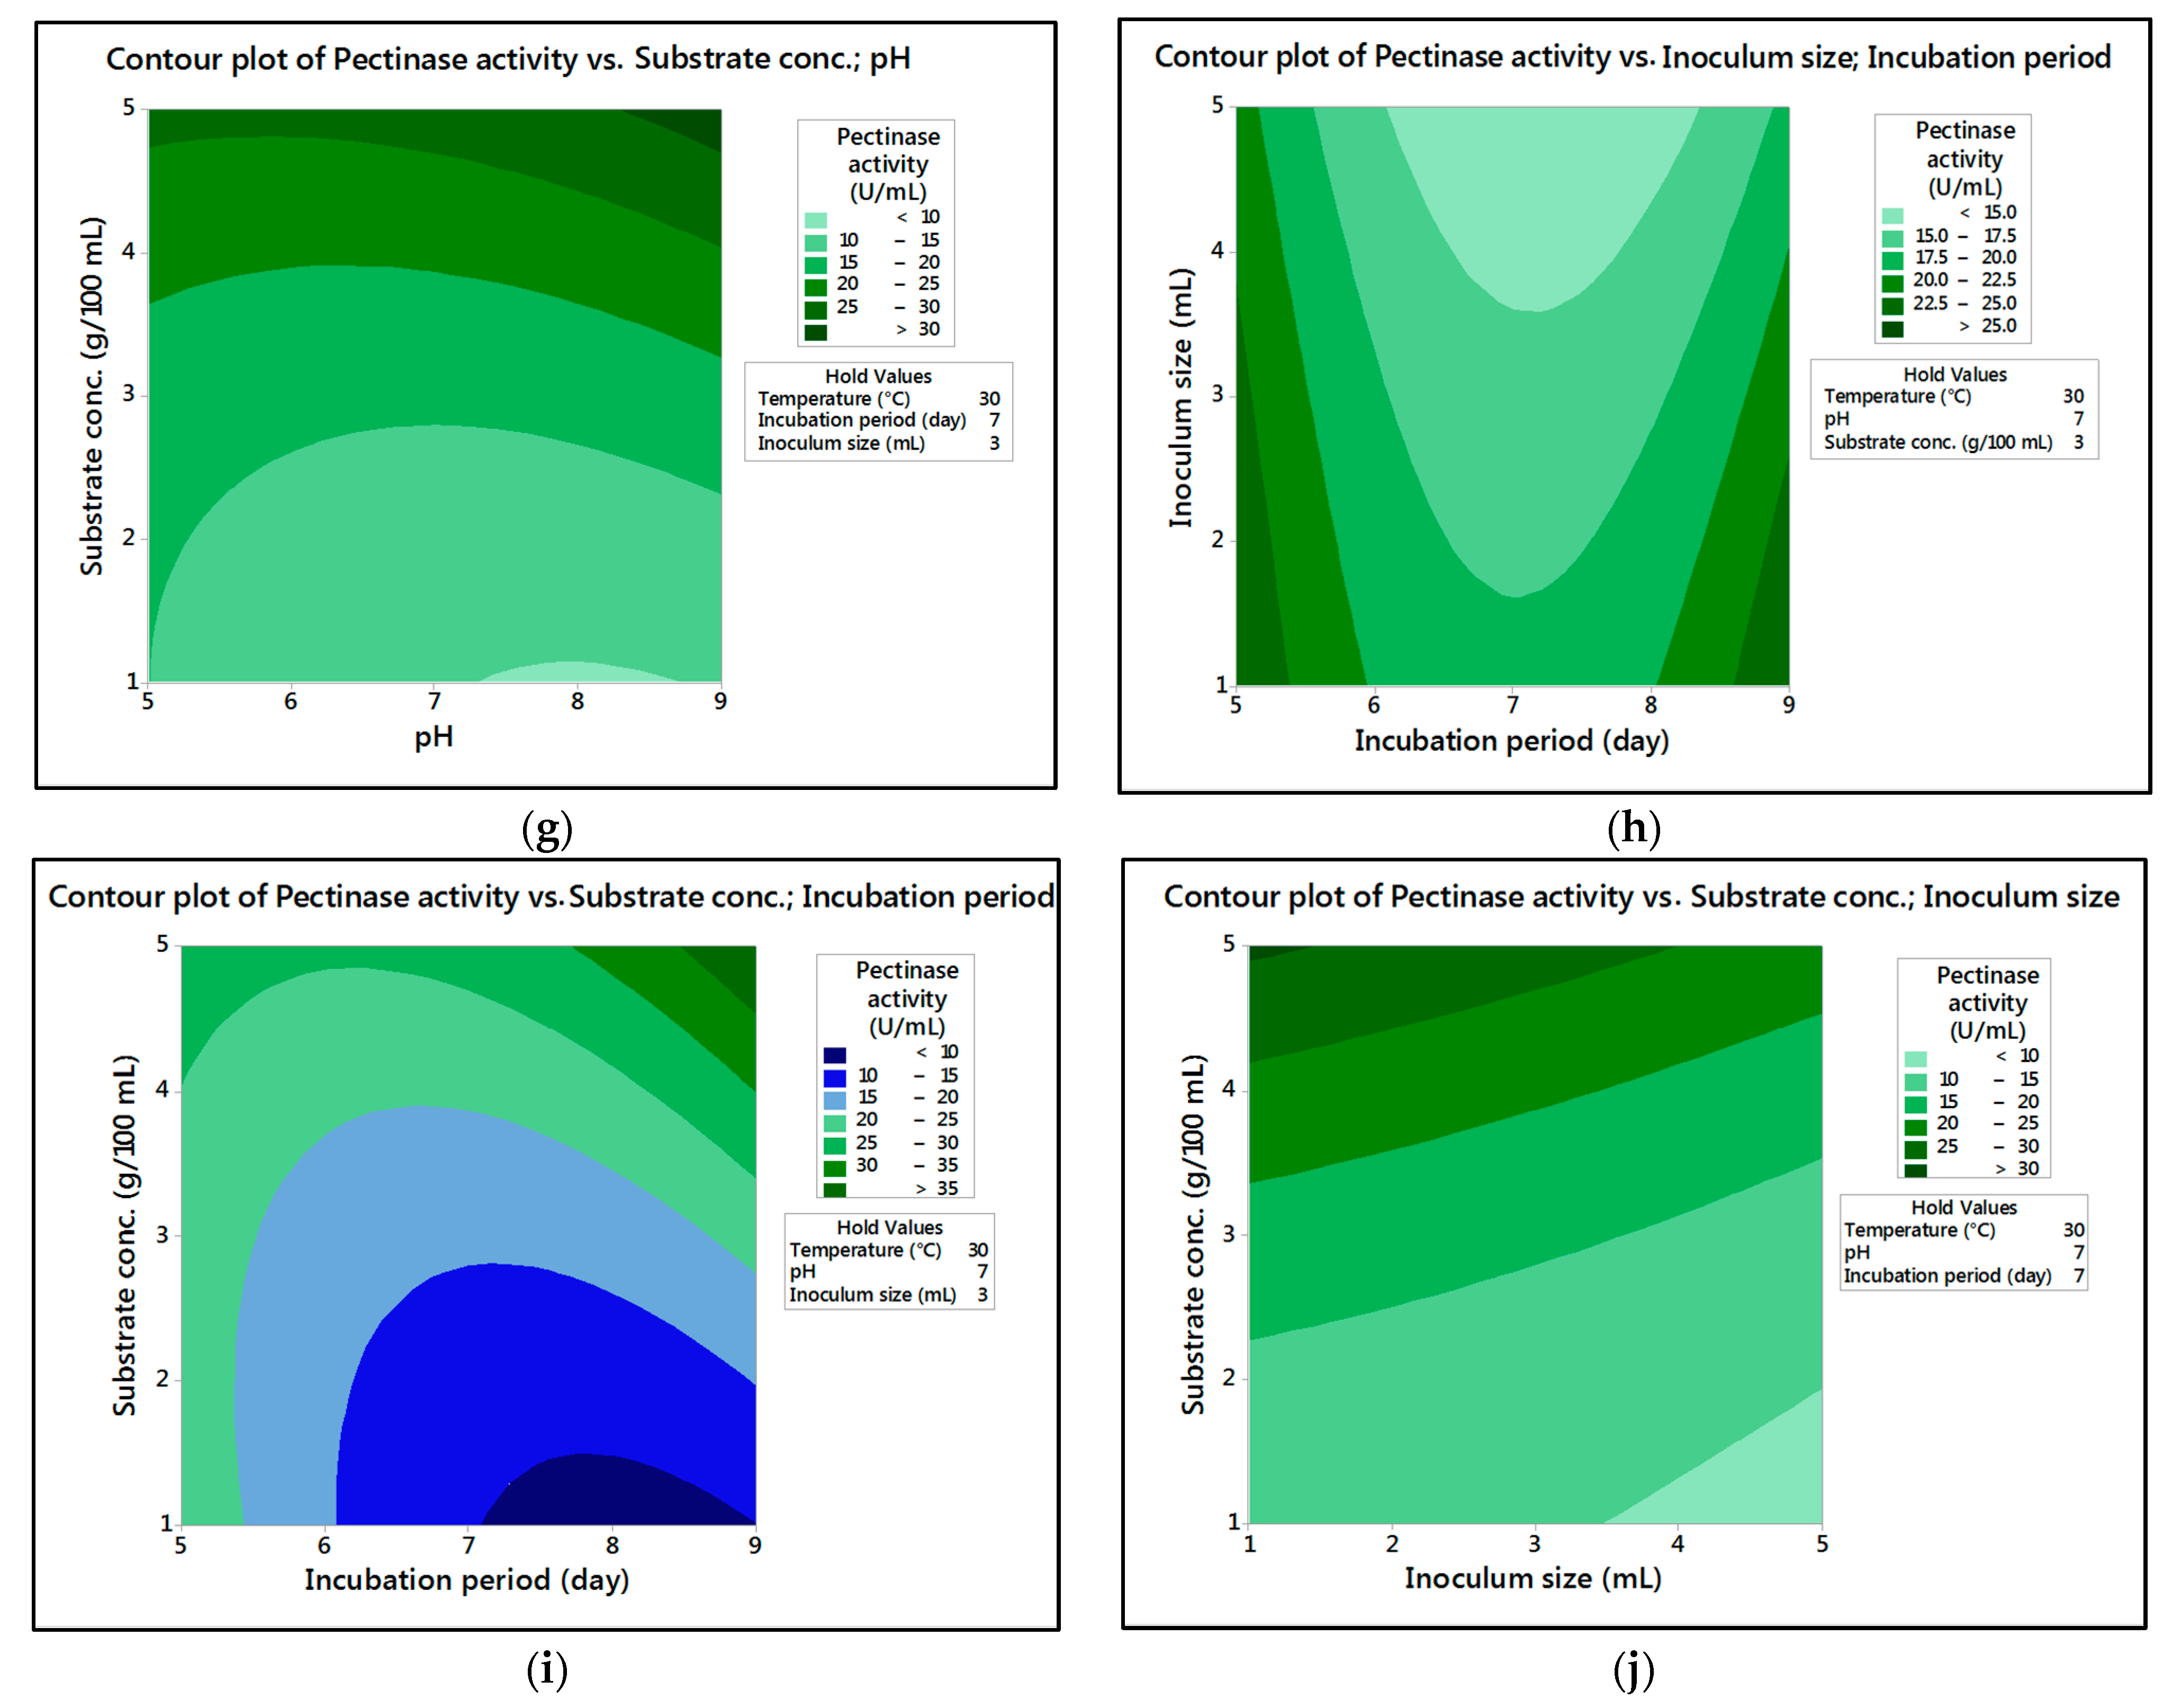
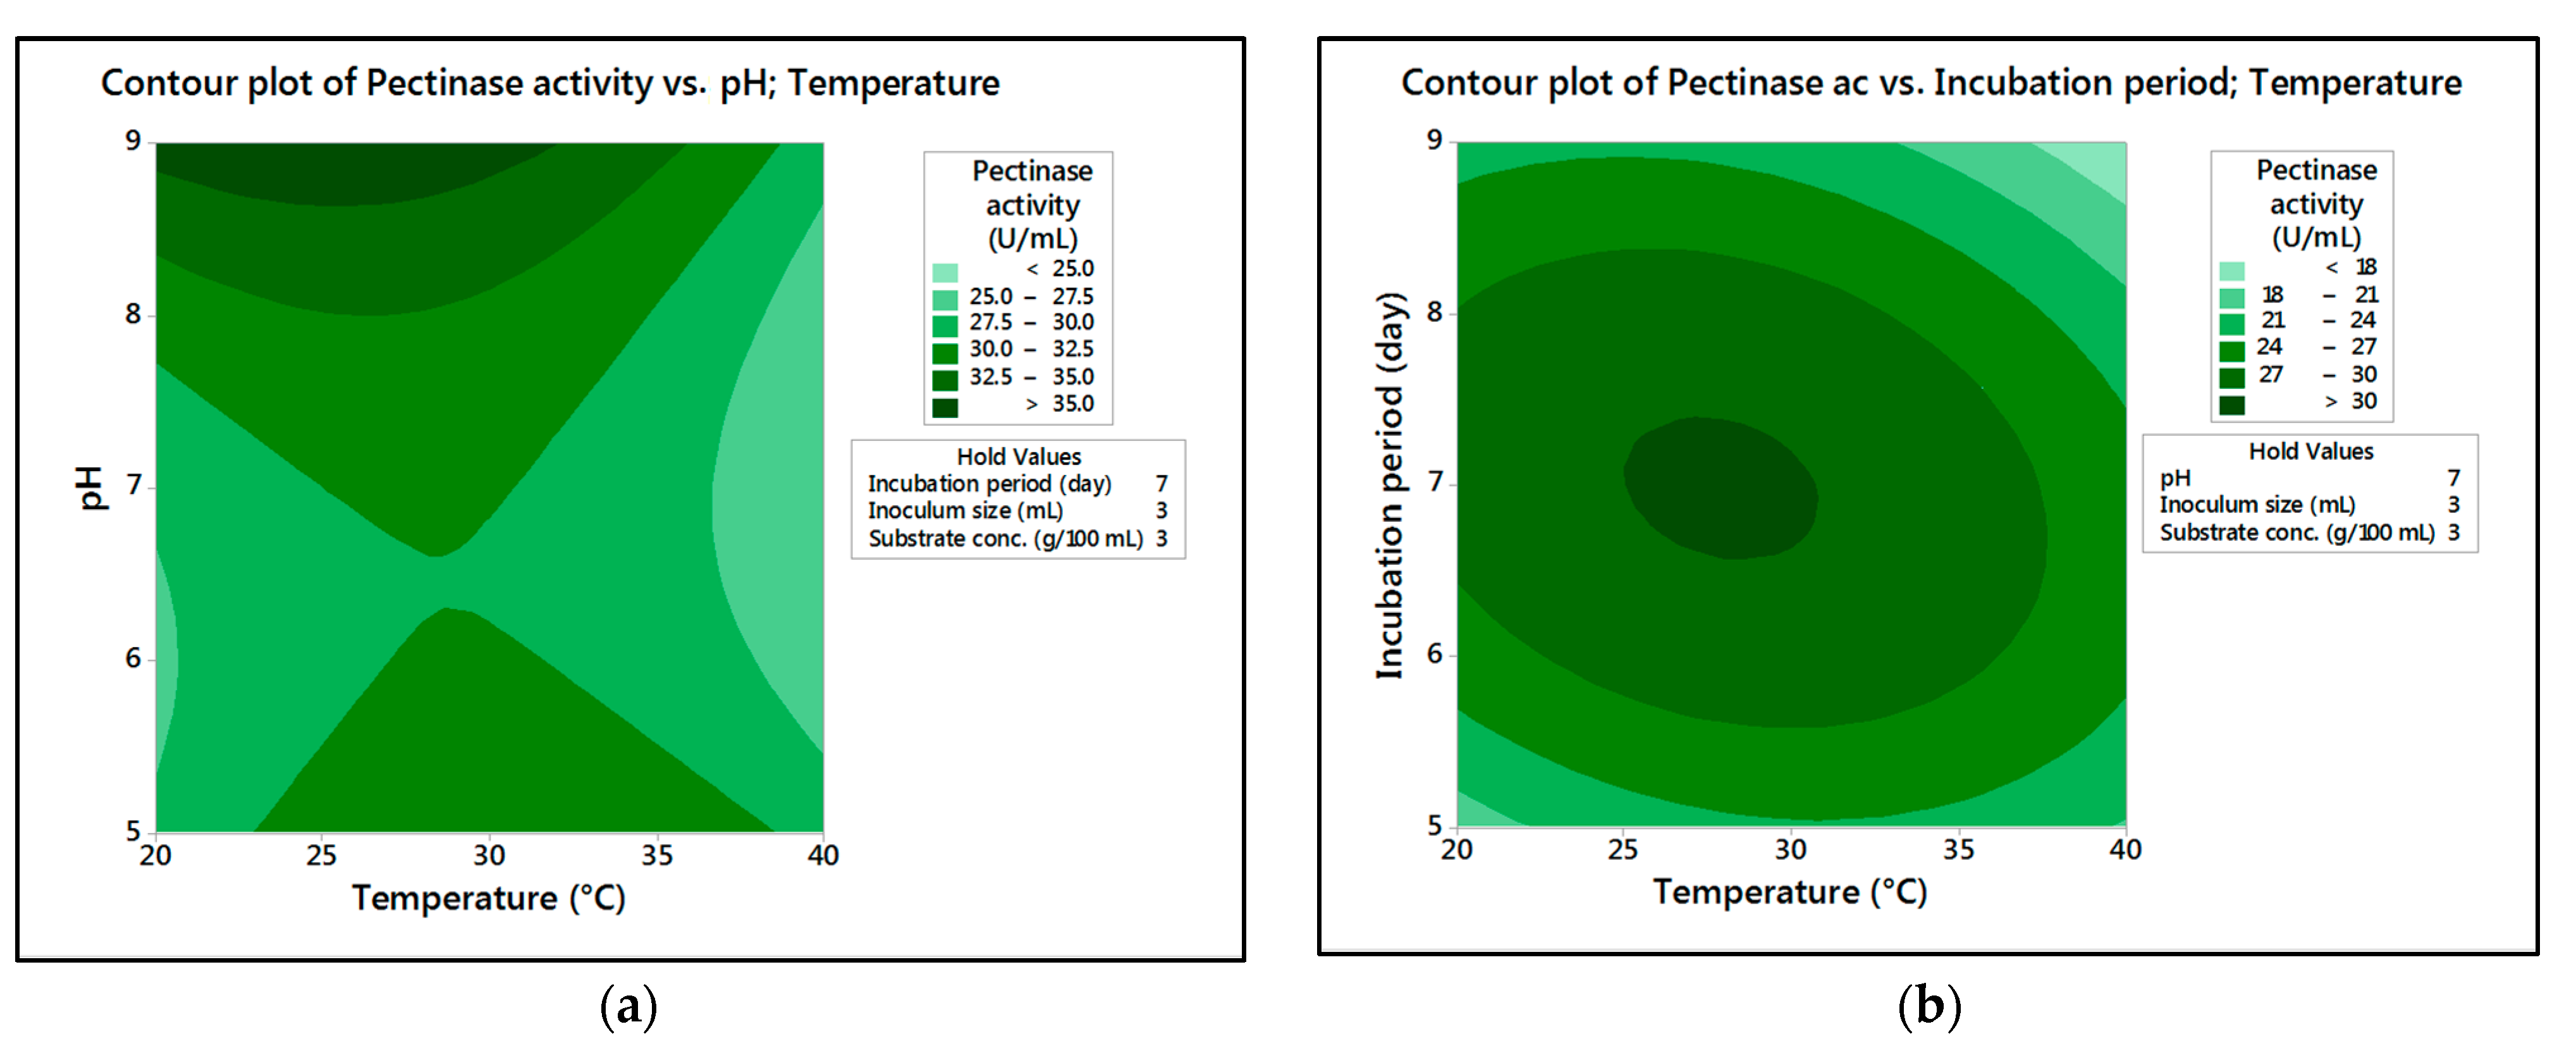
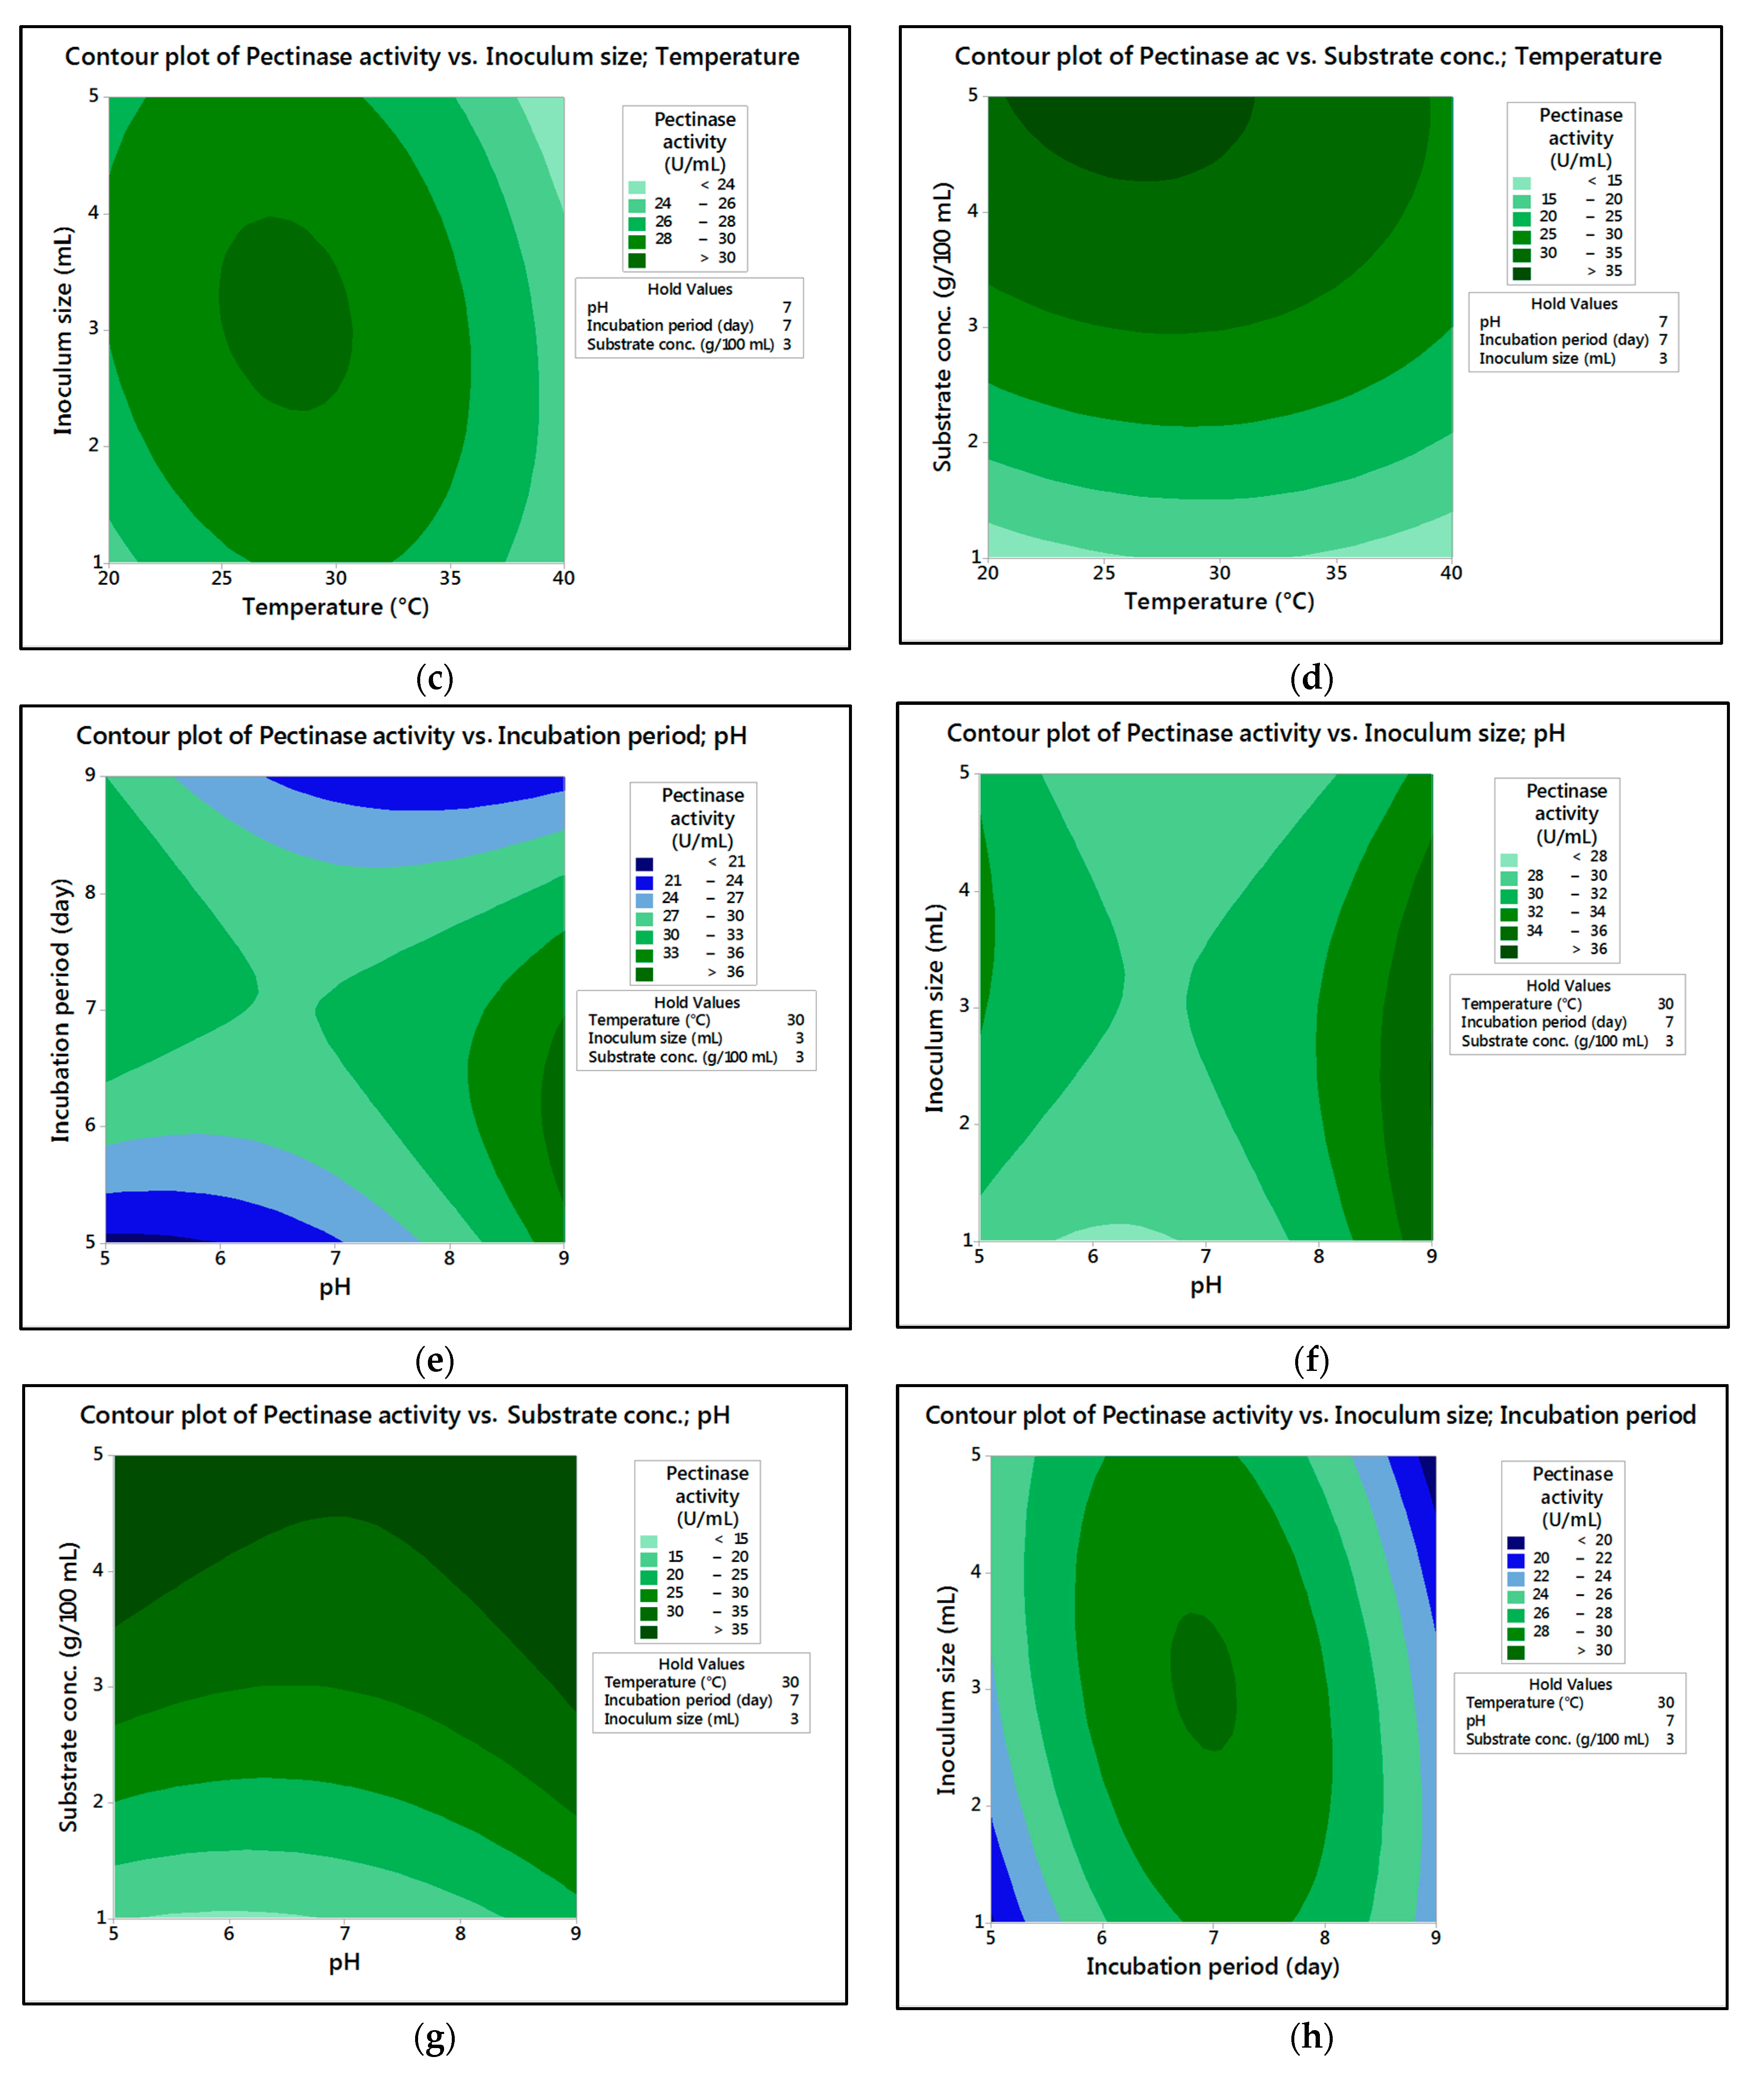
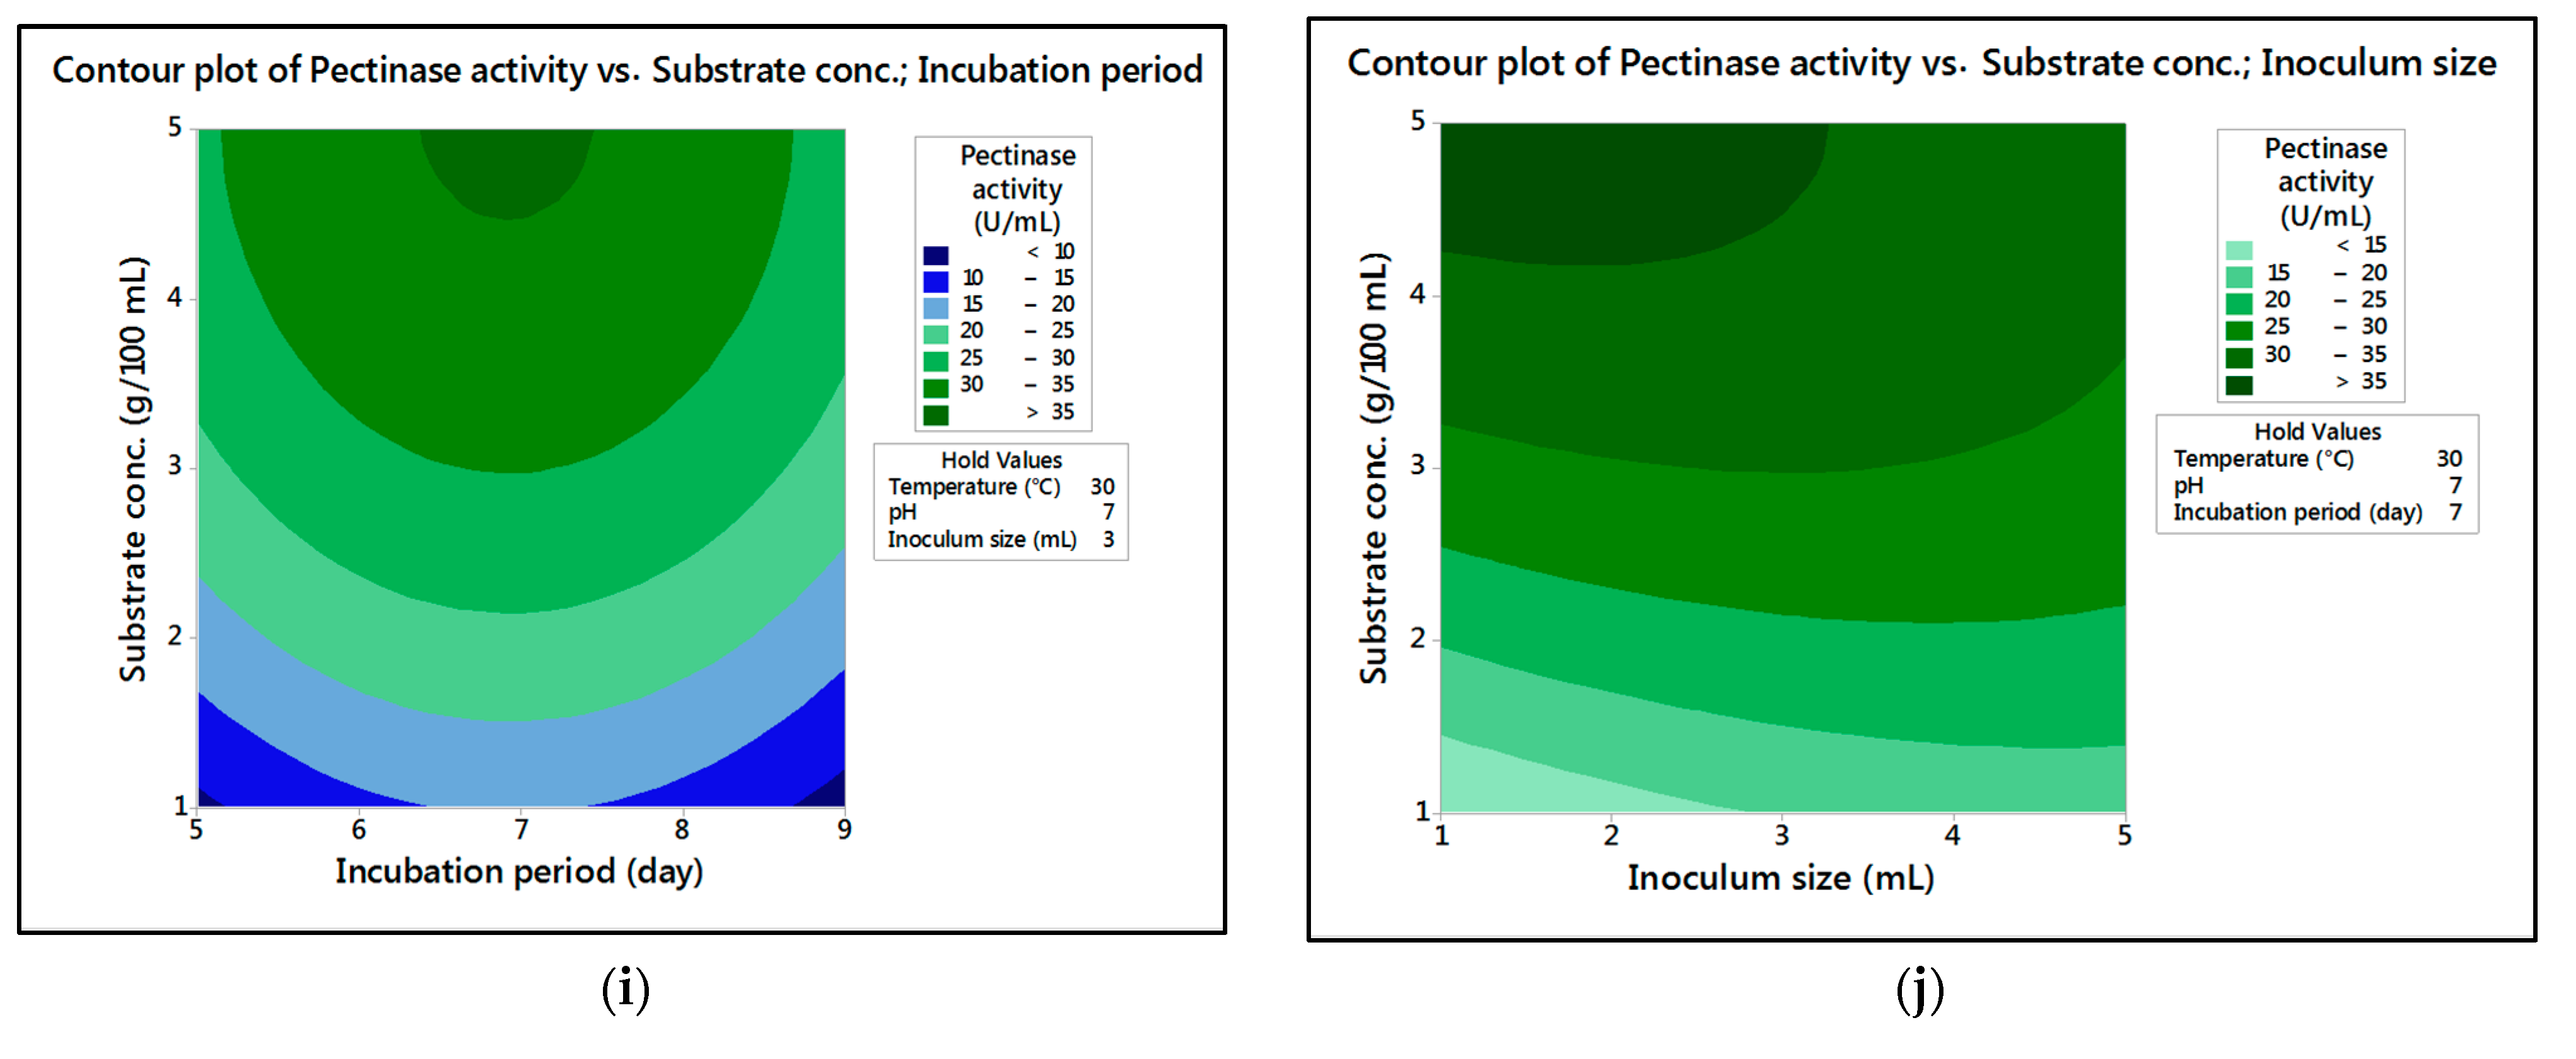
M. hiemalis afforded high cellulase production (37.20 U/mL and 33.82 U/mL, respectively) and pectinase (38.02 U/mL and 39.76 U/mL, respectively) at the optimum parameters, which consisted of, respectively, incubation temperature 30 and 30 °C, pH value 7 and 9, incubation period 5 and 5 days, inoculum size 3 and 3 mL, and substrate concentration 5 and 3 g/100 mL; while, for pectinase, optimum conditions included incubation temperature 30 and 30 °C, pH value 7 and 5, incubation period 9 and 7 days, inoculum size 3 and 3 mL, and substrate concentration 5 and 5 g/100 mL, respectively, for
M. circinelloides and
M. hiemalis. The multiple correlation coefficient R
2 = 0.9535 for
M. circinelloides and R
2 = 0.9782 for
M. hiemalis cellulase and R
2 = 0.9748 for
M. circinelloides and R
2 = 0.9861 for
M. hiemalis pectinase, nigh to one, indicated that experimental and predicted values are well-correlated and predicted values elucidated the model accuracy with upgrade response. The low
p values, which are attained by the F test, and high R
2 values indicated that the employed model attained a high significance, and its sufficiency was confirmed [
42]. Similarly,
Aspergillus niger-ATCC 1640 achieved 0.6045 μmol/mL pectinase production using
Citrus macroptera peel (8.4 g/L) in solid-state fermentation. RSM results indicated that the experimental response for pectinase production was convenient with fitted data (R
2 = 0.9836) [
43]. The highest cellulase activity (5.60 IU/mL) was obtained after incubation for 4 days and 5% substrate concentration with pH 5.0 at 30 °C using RSM of
Trichoderma viride in SmF of the seed pods of the silk cotton tree [
44].
Rhizopus delemar F2 optimal variable values for the maximum production of cellulase (10.40 U/gds) and of pectinase (31.20 U/gds) using solid state fermentation on apple pomace substrate included a moisture ratio of 1:3:5 for 7 days at 30 °C [
45].
Conversely, statistical design for the maximum production of pectinase (179.83 U/g in SSF and 1.64 U/mL in SmF) and cellulase (10.81 U/g in SSF and 0.36 U/mL in SmF) by
Aspergillus niger NCIM 548 was achieved at optimum conditions in SmF consisting of carbon source concentration 65 g/L, pH 4.6, and time 126 h; while in SSF, moisture content was 65% and pH 4.80 for 156 h [
46]. On the other hand, the optimum condition for
A. oryzae producing the maximal pectinase (139.56 U/gds) and cellulase (6.01 U/gds) was 67% of moisture content with pH 5.9 at 33 °C, and for 71.8 h of fermentation on soybean residue [
47]. Optimum cellulase activity (124.94 U/g) was attained at 1.5%
w/
v rice straw with pH 7 at 30 °C for 8 days by
Aspergillus terreus RS2 [
48]. Ramos-Ibarra et al. [
18] utilized RSM for a high production of cellulase (1.0 U/g after 24 h) and pectinase (12.3 U/g after 120 h) using
Mucor racemosus N9C1 on orange peels by SSF in humidity 70% at 30 °C. They anticipated that increased enzymatic activity reaching its maximum and decreasing at the end of the fermentation period may be attributed to enzyme hydrolysis by proteases.
In the present investigation,
M. circinelloides and
M. hiemalis partially purified cellulase and pectinase showed 6.37 and 8.10 U/mL and 7.23 and 5.50 U/mL activities, respectively, and cellulase 1.73- and 2.03-fold purification, 31.12 and 32.02% cellulase recovery with specific activity of 199.41 and 163.43 U/mg; while 1.74- and 1.99-fold purification, 31.26 and 31.51% recovery with specific activity of 216.83 and 215.36 U/mg, respectively, were obtained. Our results were in agreement with Almowallad et al. [
25], who utilized
Aspergillus niger AUMC 4156,
Penicillium oxalicum AUMC 4153, and
Paecilomyces variotii AUMC 4149 on orange peel (3%
w/
v) by SmF and obtained pectinase activity in static (52.22, 14.06 and 49.26%) and shaken cultures (48.89, 2.94, 50.00%), respectively. Orange peel as a sole carbon source afforded the highest protein content in filtrates with all tested fungal strains in stirred (2.57, 3.75, and 3.40 mg/mL) and static cultures (4.74, 4.45, and 4.98 mg/mL), respectively. Statistical-derived optimum conditions for crude cellulase produced by the SmF of
A. niger using
A. hypogaea shells as a carbon source involved 120 h incubation with pH 4 at 40 °C, along with of 13 × 10
5 CFU/mL inoculum size, while purified cellulase resulted in a 68.12-fold purification with yield 3.87% and specific activity of 484.3 U/mg [
23].
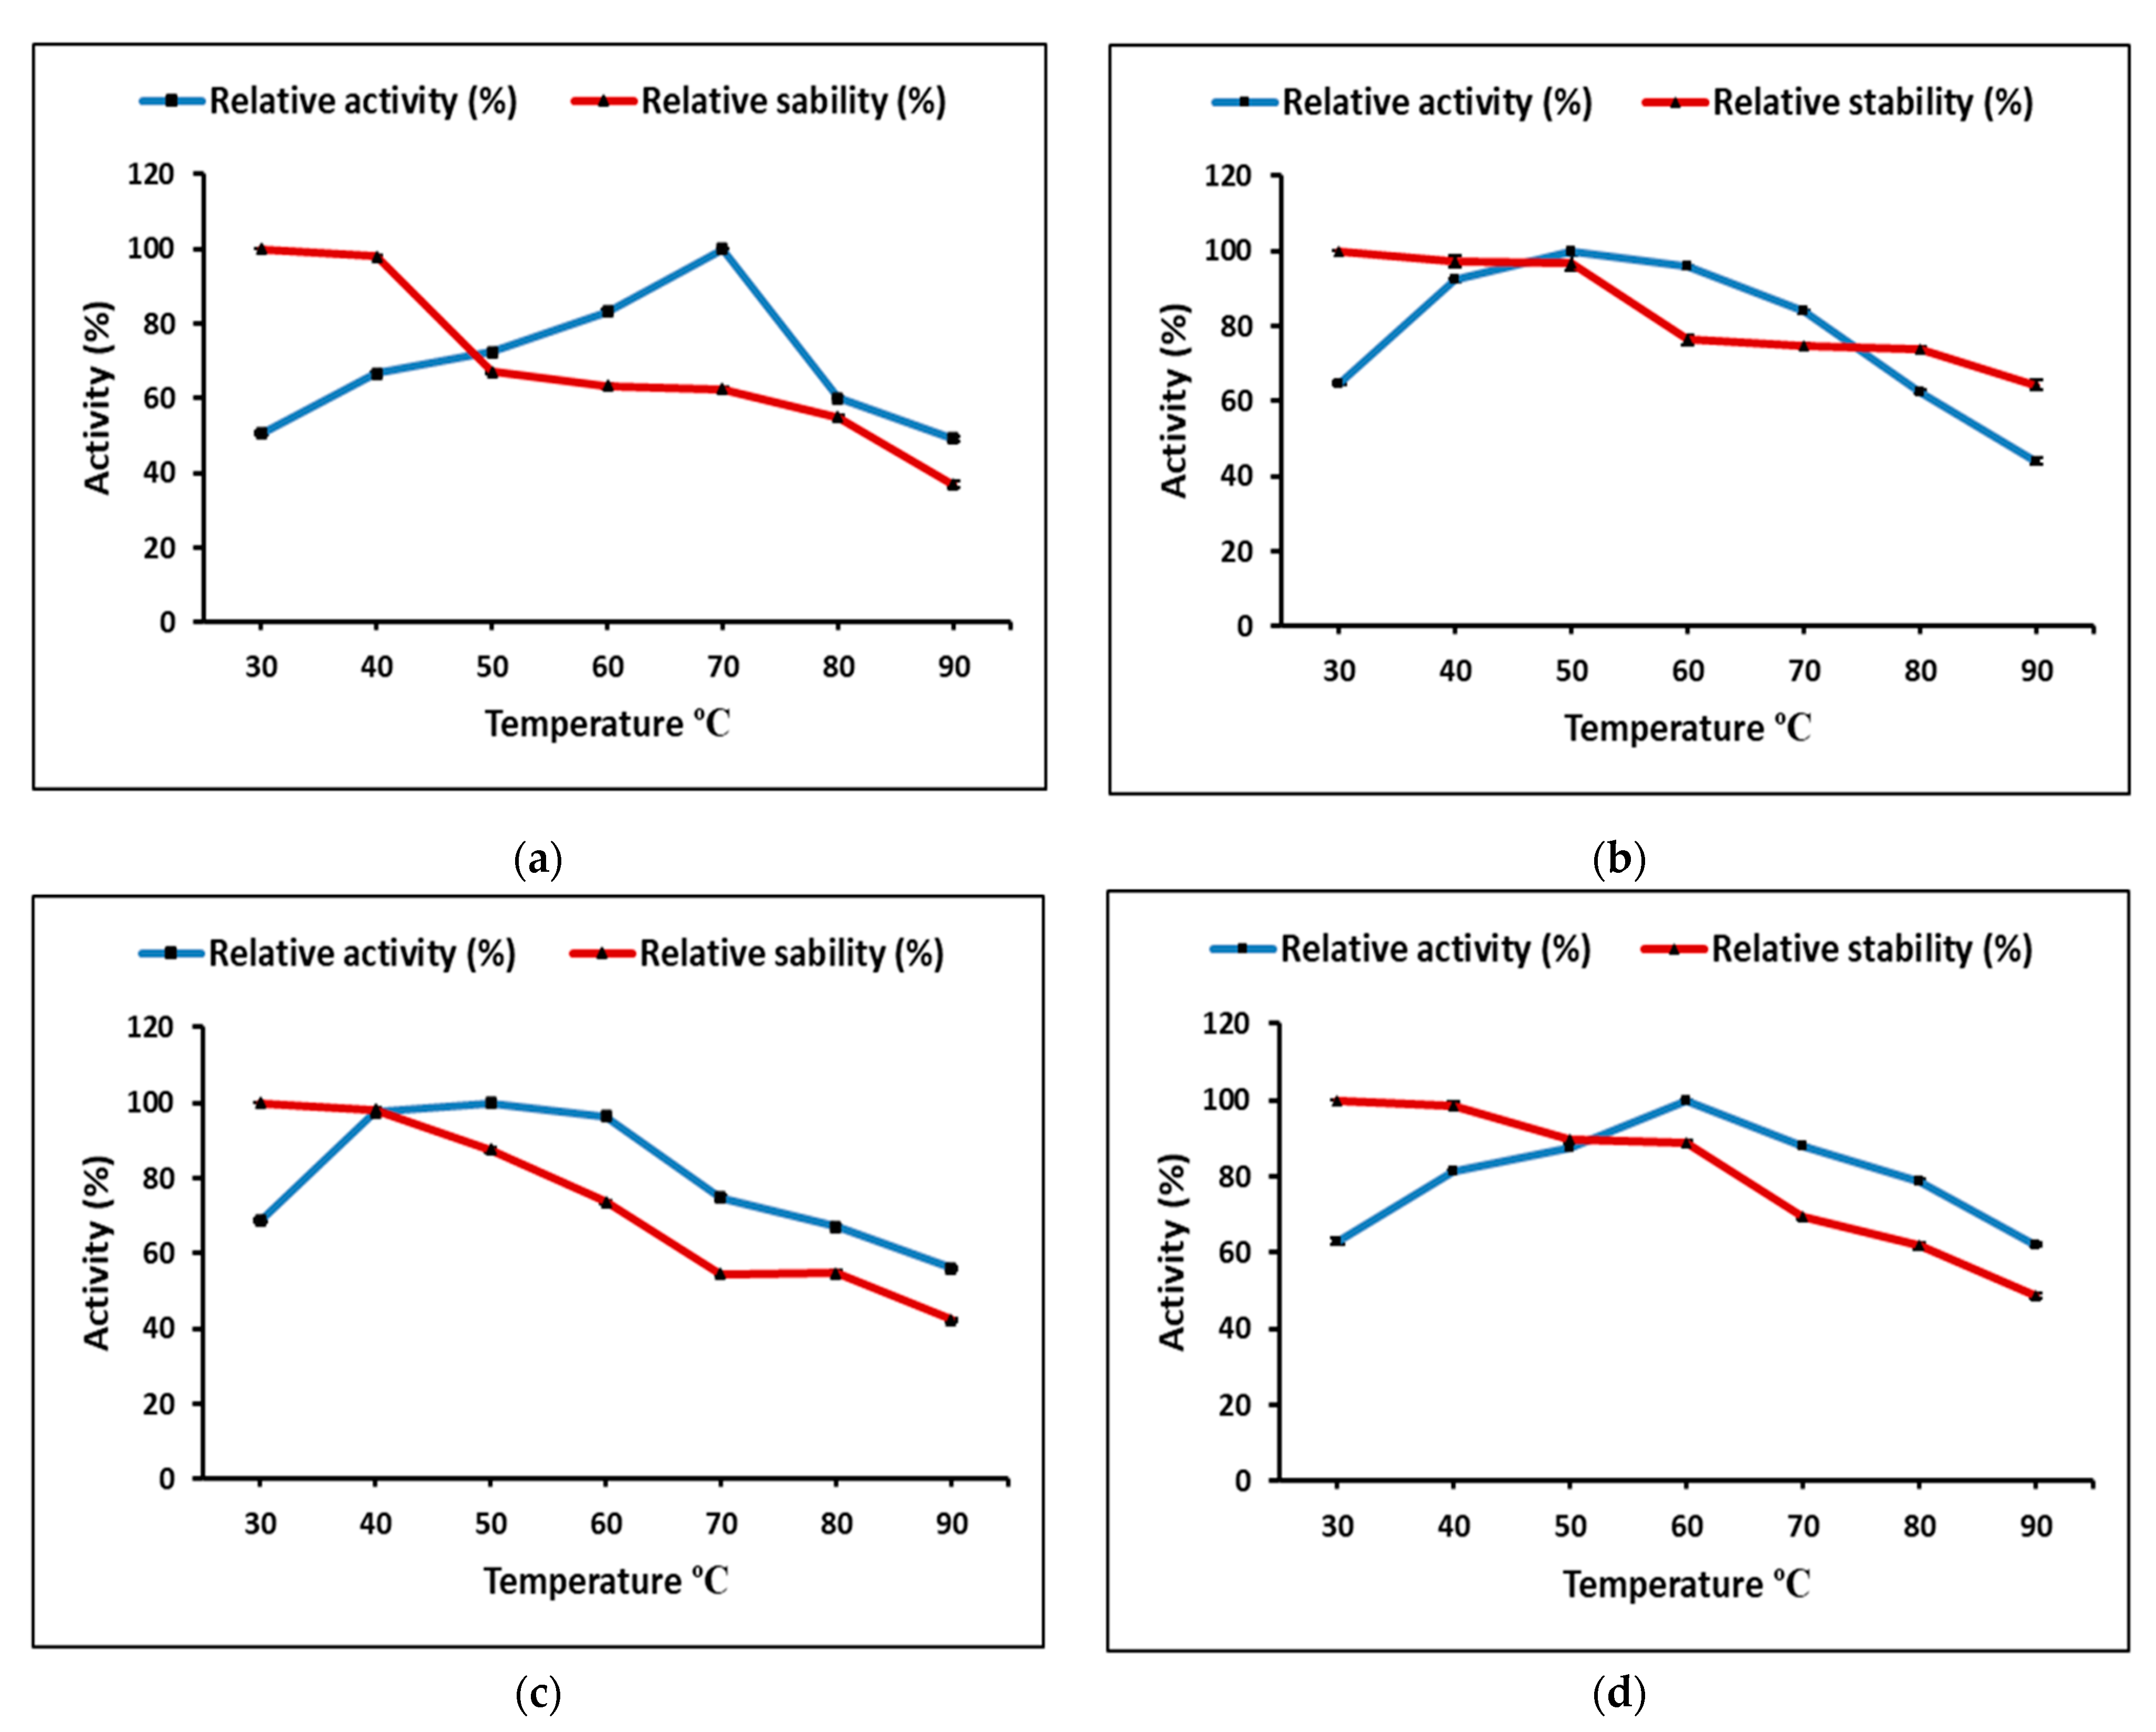
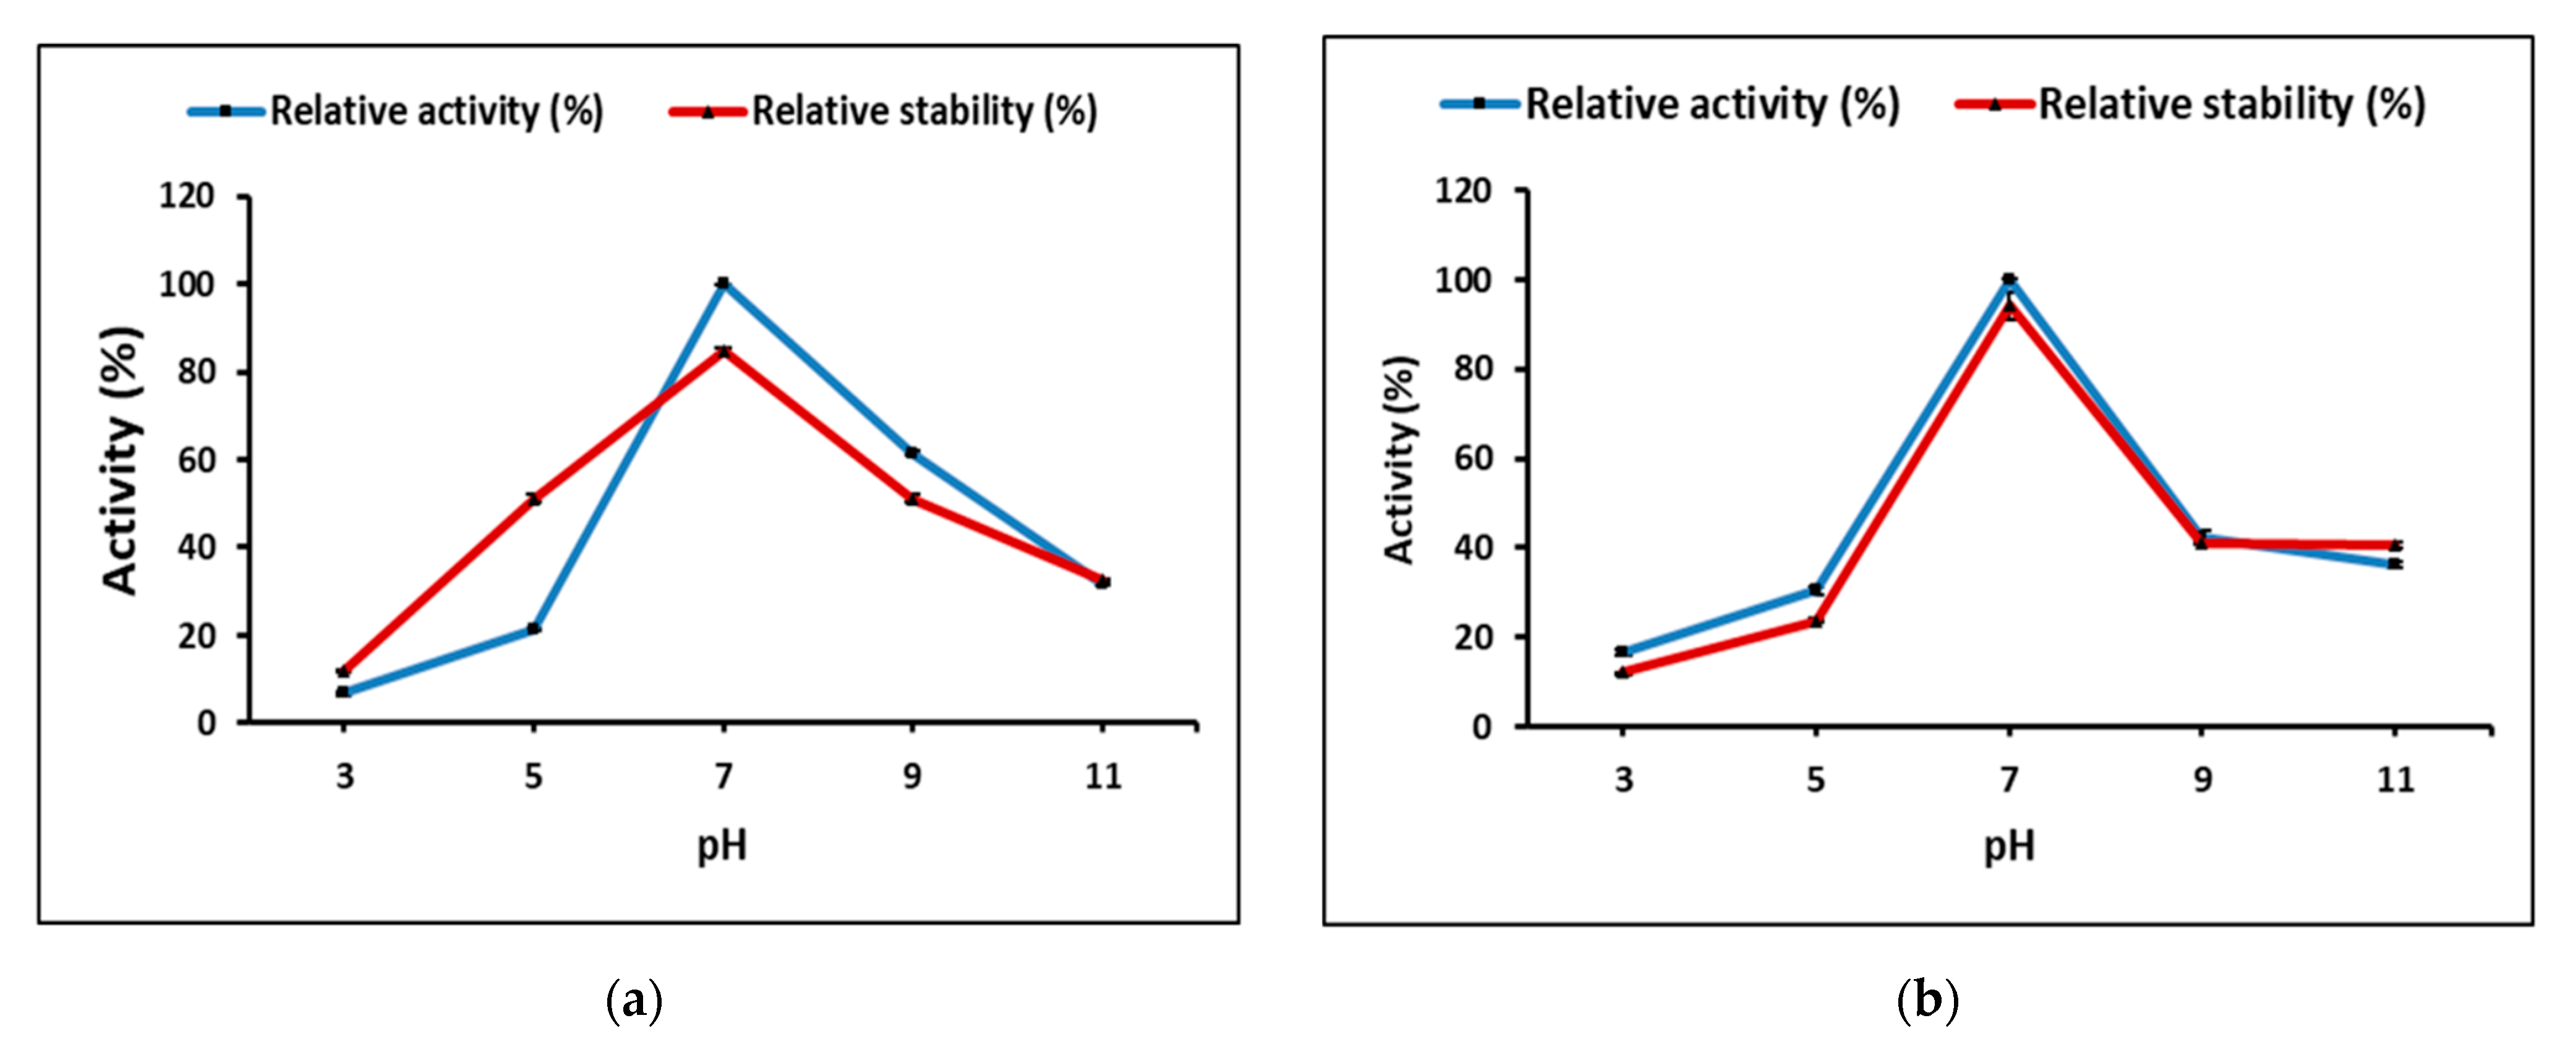
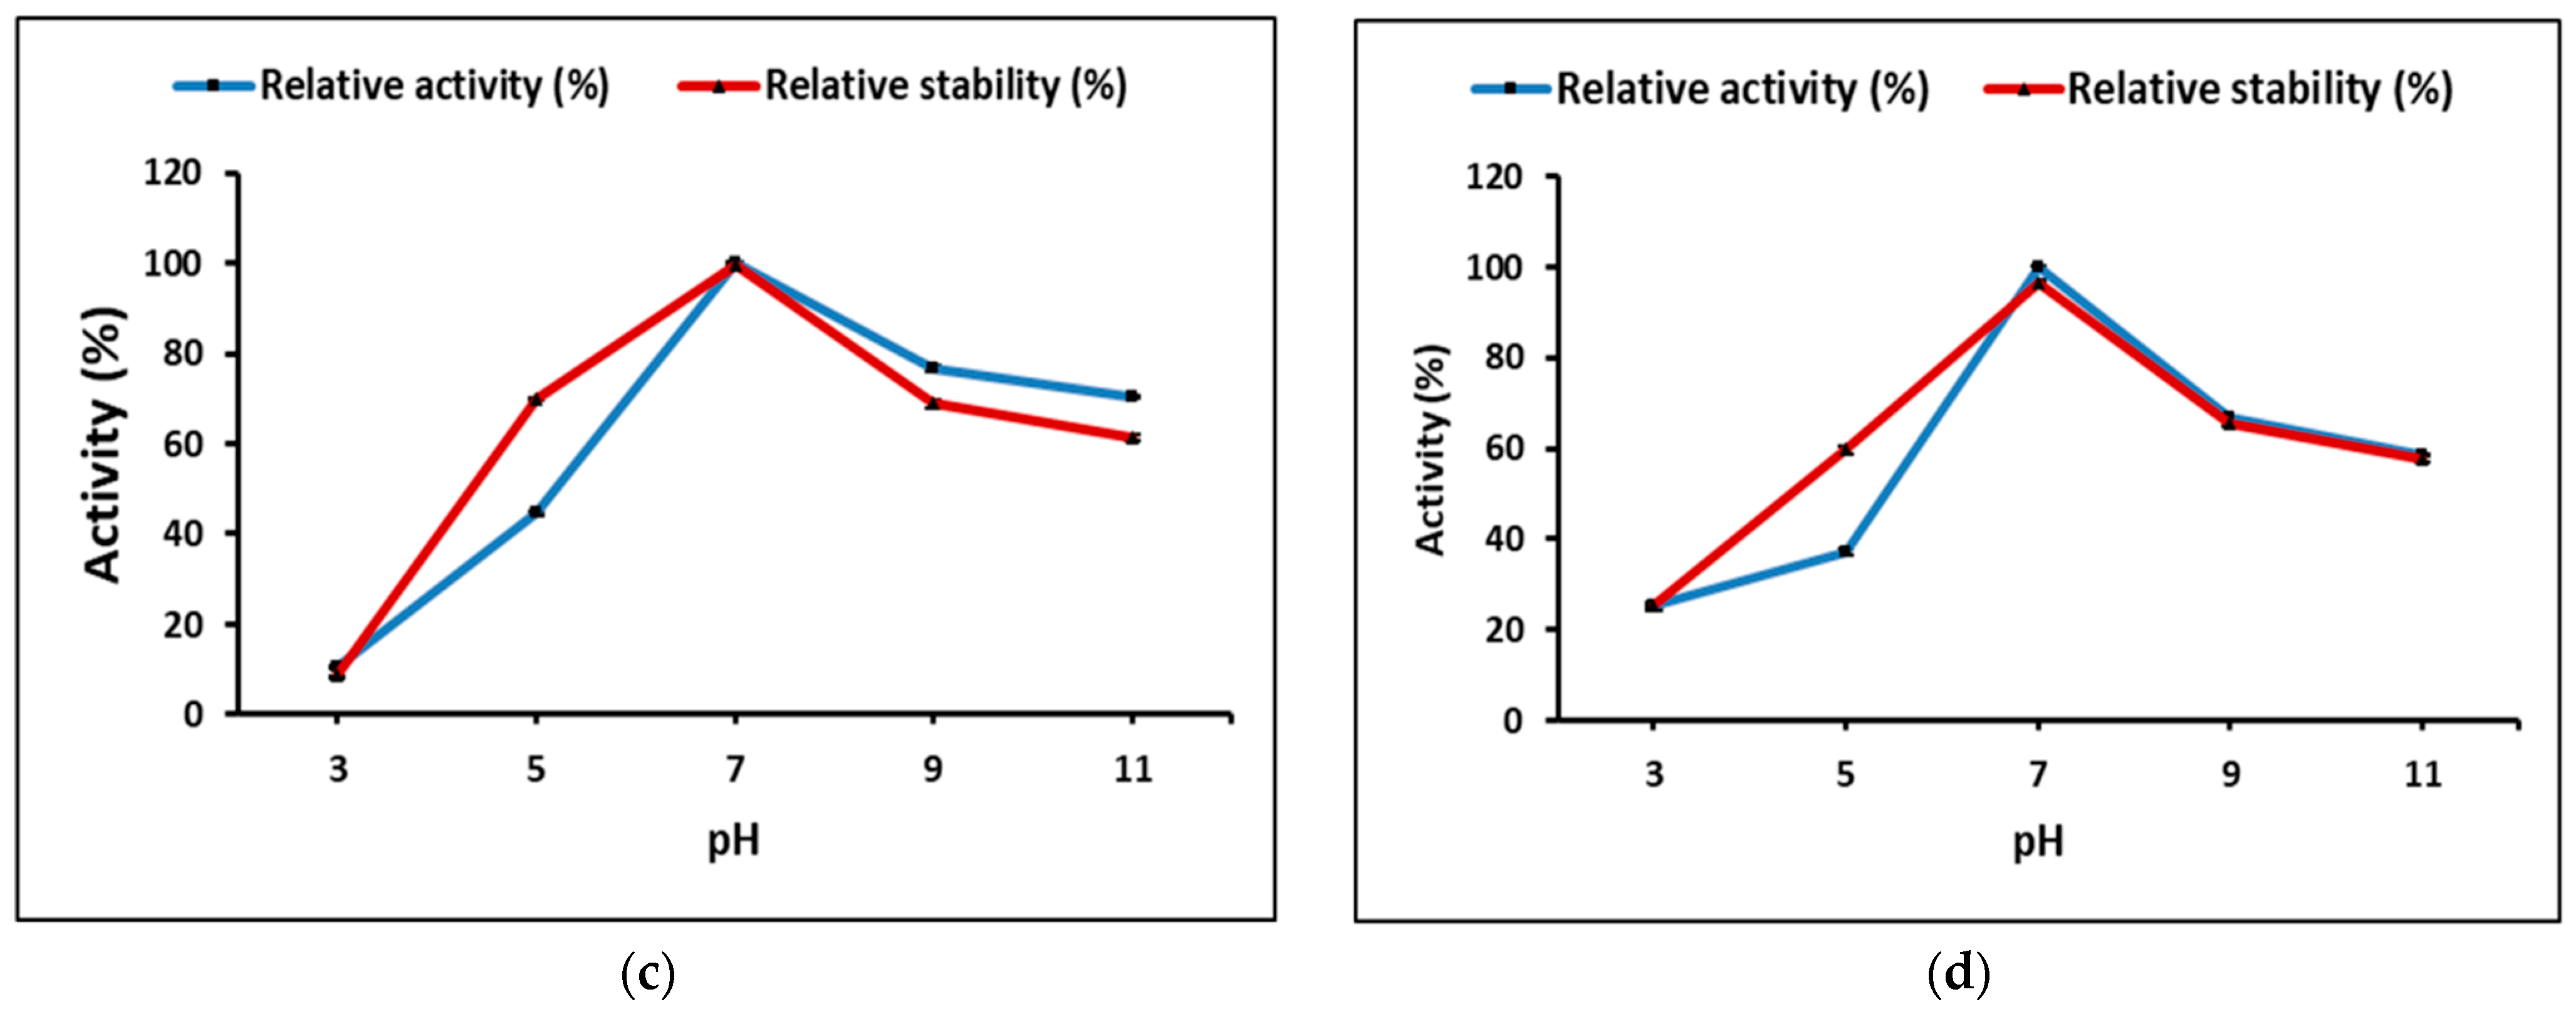
Partially purified cellulase and pectinase from
M. circinelloides and
M. hiemalis demonstrated the highest activity at neutral pH, and 70 and 50 °C, for cellulase and 50 and 60 °C, for pectinase, respectively. Thakur et al. [
13] highlighted that each enzymatic application requires unique properties with respect to specificity, stability, temperature, and pH dependence. High temperature increases the solubility of reactants and products by decreasing viscosities, resulting in faster hydrolysis [
49], and longer active life under high temperatures would make enzymes favorable for efficient biomass conversion. Therefore, thermo-stability is the most significant property for the enzyme used under extreme bioprocessing conditions to be efficient [
50]. Optimally, purified pectinase from
Rhizomucor pusillus was active at 55 °C and pH 5.0, and showed stability up to 50 °C and a pH range between 4.0 and 5.0 for 120 min incubation, while the stability decreased rapidly over pH 5.0 and 60 °C [
51].
Aspergillus sp. Gm showed the highest pectinase production by SmF using 1% pectin at 30 °C for 48 h; meanwhile, the purified pectinase activity optimum temperature was 30 °C, 75.4 U/mL; pH was 5.8, 72.3 U/mL; and substrate concentration 0.5%, 112.0 U/mL, and enzyme thermo-stability decreased 50% within 10 min incubation at 60 °C [
52].
Our results revealed a decrease in partially purified pectinase activity of both strains after incubation with 10 mM K
+, Mg
2+, Ba
2+, and Ni
2+, while 10 mM K
+ increased
M. circinelloides pectinase activity by 16.38%. In contrast, notable pectinase stability increased with Mg
2+ and Ni
2+ for
M. circinelloides enzyme, and with Ba
2+, and Ni
2+ for
M. hiemalis enzyme. Thakur et al. [
13] tested phenolic acids (0.05 mM), metal ions (Mn
2+, Co
2+, Mg
2+, Fe
3+, Al
3+, Hg
2+, and Cu
2+), and thiols, and found that they exerted an inhibitory impact on the polygalacturonase from
Mucor circinelloides ITCC 6025. They suggested that the enzyme did not need any metal ions for its activity expression.
5. Conclusions
The present investigation utilized the response-surface methodology via the Box–Behnken design to improve cellulase and pectinase production by M. circinelloides and M. hiemalis strains. The experimental results are consistent with predicted responses. The produced enzymes were partially purified and characterized. The optimum parameters for cellulase production by M. circinelloides were incubation temperature 30 °C, pH value 7, incubation period 5 days, inoculum size 3 mL, and substrate concentration 5 g/100 mL, and for pectinase production were incubation temperature 30 °C, pH value 7, incubation period 9 days, inoculum size 3 mL, and substrate concentration 5 g/100 mL. For M. hiemalis, the optimum parameters for cellulase production were incubation temperature 30 °C, pH value 9, incubation period 5 days, inoculum size 3 mL, and substrate concentration 3 g/100 mL, and for pectinase production were incubation temperature 30 °C, pH value 5, incubation period 7 days, inoculum size 3 mL, and substrate concentration 5 g/100 mL. The influence of single, interaction and quadratic factors on cellulase and pectinase production was investigated using non-linear regression equations with significant R2 and p values. The partial purification of M. circinelloides and M. hiemalis cellulase produced 1.73- and 2.03-fold purification with 31.12 and 32.02% recovery, respectively. Meanwhile, 1.74- and 1.99-fold purification with 31.26 and 31.51% recovery were obtained from M. circinelloides and M. hiemalis pectinase, respectively. A significant increase and decrease in the activity and stability of M. circinelloides and M. hiemalis partially purified enzymes was reported after incubation with different concentrations of metal ions and detergents. The response-surface methodology was effective and satisfactory, and investigated many factors simultaneously. More research is needed to scale up enzymes production for a wide range of applications.


 ,
, 


