Article

Evaluation of Lignocellulosic Wastewater Valorization with the Oleaginous Yeasts R. kratochvilovae EXF7516 and C. oleaginosum ATCC 20509

1
Faculty of Applied Engineering, BioWAVE, Universiteit Antwerpen, Groenenborgerlaan 171, 2020 Antwerpen, Belgium
2
Department of Bioscience Engineering, Sustainable Energy, Air and Water Technology, Universiteit Antwerpen, Groenenborgerlaan 171, 2020 Antwerpen, Belgium
3
Department of Biology, Biotechnical Faculty, University of Ljubljana, Jamnikarjeva 101, SI-1000 Ljubljana, Slovenia
4
Gembloux Agro-Bio Tech, Université Liège, Passage des Déportés 2, 5030 Gembloux, Belgium
*
Author to whom correspondence should be addressed.
Fermentation 2022, 8(5), 204; https://doi.org/10.3390/fermentation8050204
Submission received: 31 March 2022 / Revised: 24 April 2022 / Accepted: 28 April 2022 / Published: 30 April 2022
(This article belongs to the Special Issue Recent Trends in Biogenic Gas, Waste and Wastewater Fermentation)

Abstract

:
During the conversion of lignocellulose, phenolic wastewaters are generated. Therefore, researchers have investigated wastewater valorization processes in which these pollutants are converted to chemicals, i.e., lipids. However, wastewaters are lean feedstocks, so these valorization processes in research typically require the addition of large quantities of sugars and sterilization, which increase costs. This paper investigates a repeated batch fermentation strategy with Rhodotorula kratochvilovae EXF7516 and Cutaneotrichosporon oleaginosum ATCC 20509, without these requirements. The pollutant removal and its conversion to microbial oil were evaluated. Because of the presence of non-monomeric substrates, the ligninolytic enzyme activity was also investigated. The repeated batch fermentation strategy was successful, as more lipids accumulated every cycle, up to a total of 5.4 g/L (23% cell dry weight). In addition, the yeasts consumed up to 87% of monomeric substrates, i.e., sugars, aromatics, and organics acids, and up to 23% of non-monomeric substrates, i.e., partially degraded xylan, lignin, cellulose. Interestingly, lipid production was only observed during the harvest phase of each cycle, as the cells experienced stress, possibly due to oxygen limitation. This work presents the first results on the feasibility of valorizing non-sterilized lignocellulosic wastewater with R. kratochvilovae and C. oleaginosum using a cost-effective repeated batch strategy.

1. Introduction

Currently, fossil resources are widely used to produce chemicals, with over 98 million barrels of crude oil used every day in 2019 [1]. However, due to the environmental impact of their extraction and application, alternatives have been researched. One of the most promising is lignocellulosic biomass, e.g., woody material, which is composed of three main components, i.e., cellulose, hemicellulose, and lignin. Cellulose is composed of glucose monomers. Hemicellulose is a heteropolymer of the sugars, xylose, glucose, mannose, arabinose, and galactose [2]. In hardwood, e.g., poplar wood as used in this study, hemicellulose mainly comprises xylose subunits with acetate moieties [3]. In contrast to cellulose and hemicellulose, lignin consists of a network of p-coumaryl alcohol, coniferyl alcohol, and sinapyl alcohol monomers cross-linked by predominantly beta-aryl ether bonds. In the plant cell wall, lignin provides rigidity to the plant by acting as a glue between cellulose and hemicellulose. In addition, it protects the plant against attack by pathogens and insects [3,4].
Both cellulose and hemicellulose can be converted to their respective monomers, glucose and xylose, by either acid or enzymatic hydrolysis. The obtained glucose and xylose molecules can be biochemically converted to an extensive array of compounds, ranging from chemical building blocks to solvents and biofuels (e.g., acetone, butanol, and ethanol) [4].
However, lignocellulosic biomass is recalcitrant against the enzymatic hydrolysis, resulting in low sugar recoveries. For example, when untreated poplar wood is enzymatically hydrolyzed using cellulases, only 7% to 18% of the theoretical reducing-sugars yield is reached [5]. Several chemical factors contribute to the recalcitrance, i.e., hemicellulose and its acetyl groups hinder cellulose access and, consequently, enzymatic hydrolysis. Lignin also restricts cellulose accessibility and is reported to attach to cellulase enzymes, thereby inhibiting them. Next to chemical factors, several physical factors also affect enzymatic hydrolysis. Cellulose is partially crystalline; the crystalline regions are densely packed, hindering the enzymatic conversion. In addition, the accessible surface area and enzyme-accessible volume of the lignocellulosic biomass are known to affect hydrolysis [6].
To increase sugar yields, pretreatment technologies have been developed that efficiently remove hemicellulose and lignin or reduce cellulose crystallinity, or both. Examples of pretreatment technologies include steam explosion, organosolv lignin extraction, and dilute sulphuric acid pretreatment, among others. However, the lignin, cellulose, and hemicellulose that are removed, and their degradation products, i.e., phenolics, organic acids, and furan-based compounds, end up in the wastewater. As a result, complex, low-value, diluted wastewater is generated during the pretreatment [7]. Current approaches to valorize such wastewaters consist of anaerobic digestion or physical treatment by evaporation with subsequent combustion of the concentrate. While these technologies provide excellent removal efficiencies for up to 99% of the soluble chemical oxygen demand (COD), the removed compounds from the wastewater are converted to low-value products, i.e., biogas and CO2. For example, Tobin et al. calculated that anaerobic and physical treatment of the wastewater has an annual cost of, respectively, USD 3,182,000 and USD 2,353,000 for a 2000-ton lignocellulose-to-ethanol biorefinery [8]. Similarly, Scott et al. found that wastewater treatment contributes 15% to the minimum selling price of lignocellulosic ethanol [9]. Hence, there is a need for economically and environmentally viable technologies to valorize such waste streams into high-value compounds.
Several researchers have investigated novel processes for valorizing lignocellulosic wastewaters. Especially biochemical conversion to microbial oil has been researched [7,10,11,12,13,14]. Microbial oil, also called single cell oil, consists primarily of glycerolipids and has a similar composition to vegetable oils. Both microbial and vegetable oils are valuable products, with prices of USD 2190 and 1648/metric ton for, respectively, rapeseed and soybean oil at the time of writing (March 2022) [15,16]. Vegetable oils can have applications in, among others, lubricants, soaps, building blocks in the polymer industry, and biodiesel. Microbial oil is currently mainly produced for application as nutritional lipids (e.g., arachidonic acid [17] and docosahexaenoic acid [18,19]) by specialized fungi and algae, e.g., Mortiella alpina. Microbial oils can have the same applications as vegetable oils if the production costs are equal or lower. Especially for non-food applications (e.g., biodiesel), waste stream-derived microbial oils are preferred, as they do not induce indirect land-use change (ILUC) or compete with food production [20]. In the light of this, Europe decided to phase out the use of high ILUC-risk feedstocks (e.g., palm oil) for biofuel production by 2030 [21]. This makes the need for waste stream-derived microbial lipids even more urgent.
The production costs of microbial oil are strongly defined by the substrate, as its cost can contribute up to 38% of the total production cost for microbial-derived biodiesel [22]. Therefore, the use of a low-cost waste stream can significantly improve the economic viability of bulk microbial oil-derived bulk products, such as biodiesel.
The ideal yeast for the simultaneous lignocellulosic wastewater treatment and lipid production has to possess several characteristics:
  • High lipid production rate, yield, and titer, as these are the key process indicators [23];
  • Selective production of lipids without any chemical side products [24];
  • A broad substrate range to metabolize all compounds present in the wastewater, i.e., organic acids, aromatics, xylan, glucan, and lignin;
  • A high tolerance to the inhibiting compounds, i.e., aromatics found in the wastewater. This ability limits contamination by unwanted microorganisms and avoids the use of energy-intensive sterilization methods, e.g., autoclaving [24].
Although lipid production from lignocellulosic wastewater has been researched previously, the abovementioned yeast requirements were not always investigated. The most important literature is presented here.
Some microorganisms have been shown to accumulate lipids up to 70% of their cell dry weight when grown on lignocellulosic wastewater-derived compounds, i.e., aromatics [25,26], sugars [27,28], acids [29,30], pulp and paper mill effluent [10,12], olive mill wastewater [11,13], and lignin-like textile dyes [31]. Most notable microorganisms for lipid production from lignocellulosic or related wastewaters are bacteria from the genus Rhodococcus and yeasts from the genera Cutaneotrichosporon, Trichosporon, Lypomyces, and Rhodotorula [13,32].
Several researchers have used Rhodococci for the conversion of lignocellulosic effluents to microbial oil. They found that the bacteria consume mostly low molecular weight compounds and can partially degrade lignin [7,33]. However, it is known that R. opacus does not consume the alternative plant sugars xylose, which is typically present in lignocellulosic effluents. The latter makes the bacterium less favorable for the valorization of lignocellulosic effluent.
Yaguchi et al. studied 36 oleaginous yeasts for their growth on lignin-derived aromatics. Yeasts of the genera Cutaneotrichosporon, Trichosporon, and Rhodotorula, grew especially well on aromatic compounds, with Cutaneotrichosporon yeasts being the best suited to metabolize a broad spectrum of aromatics [32]. Cutaneotrichosporon oleaginosum accumulated intracellular lipids up to 69% of its cell dry weight (CDW) on various lignocellulose-related compounds, including xylose, glucose, cellobiose, acetate, and aromatics, indicating a broad substrate spectrum [25,27,29]. Furthermore, Xenopoulos et al. found that the C. oleaginosum could accumulate 8.4 g/L in lipids (40.2% CDW) in three-times diluted olive mill wastewater (OMW) supplemented with 100 g/L xylose [34]. The yeast decolorized the OMW and removed phenolics by 25 and 28%, respectively. This demonstrates that C. oleaginosum can use lignocellulose-derived wastewaters as a substrate. Lignin, cellulose, or xylan removal was not investigated. Due to the abovementioned favorable characteristics of C. oleaginosum, it was selected for use in this study.
From the Rhodotorula genus, several strains have been evaluated for growth and lipid production on lignocellulosic wastewaters due to their ability to break down phenol [26]. Rhodotorula spp. can accumulate lipids from lignocellulose-derived substrates such as xylose, glucose [35], and acetate [30]. Furthermore, the yeast strains from this genus have been found to remove low-molecular weight pollutants from lignocellulosic wastewater, and to accumulate lipids when grown on sugar supplemented lignocellulosic wastewater [10,11,12,14,36]. Furthermore, Rhodotorula kratochvilovae has been found to remove lignin and suspended solids from pulp and paper mill effluent supplemented with glucose. Only Patel et al. [12] investigated lignin removal from lignocellulosic wastewater by Rhodotorula, and cellulose or xylan removal was not investigated by any of the studies above. For application in this study, Rhodotorula kratochvilovae was selected due to its high lignin breakdown, phenol tolerance, and significant lipid accumulation from lignocellulosic effluent.
Although the literature on lipid production from lignocellulosic wastewaters is scarce, it can be concluded that high oil accumulation and inhibitor removal can be obtained when the wastewater is supplemented with sugars. However, sugars are high-value substrates of USD 432 per metric ton at the time of writing (March 2022) [37]. Therefore, adding sugars to the wastewater should be avoided. However, as lignocellulosic wastewaters are diluted substrates, the production of lipids from lignocellulosic wastewaters alone poses a significant challenge, for which a repeated batch fermentation strategy could be the solution. Additionally, in all the studies mentioned above, the wastewater was autoclaved before fermentation, which increases the energy costs. A large part of the carbon in lignocellulosic wastewaters is partially degraded cellulose, xylan, and lignin. Yang et al. isolated C. oleaginosum and Rhodotorula strains from wastewater. Both strains showed manganese peroxidase activity, an enzyme that catalyzes lignin breakdown [38]. In addition, some Rhodotorula strains were reported to also possess xylanase [39] and cellulase activity [40,41]. Despite the presence of ligninolytic and polysaccharide-degrading enzymes, literature on the conversion of xylan, cellulose, and lignin to lipids by the oleaginous yeasts R. kratochvilovae and C. oleaginosum is, to our best knowledge, lacking.
The scope of the current study was to investigate a repeated batch strategy as an economically and ecologically feasible process for the valorization of lignocellulosic wastewater to microbial oil. In this strategy, cells are harvested after each batch and reused in the subsequent batch. We hypothesized that the repeated addition of the lignocellulosic wastewater to the cells will result in significant lipid production. The wastewater was not autoclaved to reduce the energy demand and improve the process economics. To better understand the non-monomeric pollutant removal, the ligninolytic enzyme activity, lignin, xylan, and cellulose degradation during the repeated batch process were investigated.

2. Materials and Methods

First, the steam explosion effluent from poplar wood, a phenolic waste stream (PWS), was characterized. Hereafter, a repeated batch fermentation was carried out on the steam explosion effluent without prior autoclaving. The cells were centrifuged and resuspended in new steam explosion effluent when the aromatic compounds were consumed. Four cycles were performed, in which the substrate consumption, biomass production, and lipid production were determined. In addition, the activity of the ligninolytic enzymes laccase, lignin peroxidase, and manganese peroxidase was investigated in each cycle.

2.1. Steam Explosion

Sawmill Caluwaerts (Holsbeek, Belgium) kindly donated the poplar sawdust. The poplar sawdust was stored in bags at room temperature (18 ± 1 °C). The particle size distribution was obtained using sieving, and 97 ± 11% w/w of the particles was collected between the 2 mm and 0.075 mm screens (Figure S1). Steam explosion assays were performed on a 50 L-pilot scale equipment. Practically, one liter of deionized water was added to 1 kg of sawdust (48 ± 1% moisture content). The wood was heated for approximately 3 min at a constant pressure of 24 ± 1 bar, prior to a sudden atmospheric pressure release. The severity factor, calculated according to Jacquet et al., was 3.9 ± 0.05 [42]. After the explosion, the slurry was filter centrifuged, and the supernatant, the PWS, was stored at −20 °C. The PWS still contained solids, making measuring the optical density and cell dry weight problematic. Therefore, the PWS was centrifuged at 3894× g for 30 min before use. The PWS had a pH of 4.5. Consequently, the pH was increased with solid sodium hydroxide (Chemlab, Zedelgem, Belgium) to obtain a pH of 5.5.

2.2. Strains

Cutaneotrichosporon oleaginosum ATCC20509 was obtained from the American Type Culture Collection. Rhodotorula kratochvilovae EXF 7516 was obtained from the Microbial Culture Collection Ex, part of the IC Mycosmo at the Biotechnical Faculty, University of Ljubljana. To preserve the yeasts, they were grown in yeast peptone dextrose (20 g/L soy peptone (Merck, Kenilworth, NJ, USA), 20 g/L glucose (Merck), 10 g/L yeast extract (Merck)) until the end of the exponential phase. Hereafter, 0.5 mL of the cell suspension was added to 0.5 mL sterile 30 v/v% glycerol in a 1.5 mL cryotube. The tubes were stored at 80 °C in the BioWAVE cell bank.

2.3. Substrate Measurement

2.3.1. Aromatics

The concentrations of 5-hydroxymethylfurfural, 2-furfural, 3,4-dihydroxybenzaldehyde, 4-hydroxybenzoic acid, 4-hydroxybenzaldehyde, vanillic acid, syringic acid, vanillin, and syringaldehyde were determined by HPLC-UV (1290 infinity II LC system, Agilent, and Agilent 1290 1290 infinity II diode array detector) with a Phenomenex Aqua 5 µm C18 125 Å column. The mobile phase was 2 v/v% acetic acid (Chem-Lab) and methanol (Chem-Lab) at a 0.4 mL/min flow rate. The following gradient elution was used: 0–3 min 10% methanol, 3–8 min a gradient to 19.3% methanol, 8–23 min a gradient to 33.6% methanol, 23–35 min a gradient to 55% methanol, 35–45 min a gradient to 100% methanol, 45–60 min 100% methanol, 60–60.01 min a gradient to 10% methanol, and 60.01–75 min 10% methanol. All samples were filtered over a 0.2 µm polyethersulfone syringe filter (BGB Analytik, Harderwijk, The Netherlands).

2.3.2. Sugars and Organic Acids

The method for the determination of sugars and organic acids in the fermentation broth is based on the application note by Transgenomic®, Omaha, NE, USA, on fermentation broth analysis [43]. The glucose, xylose, acetic acid, and formic acid contents were determined by HPLC-RI (1290 infinity II LC, Agilent and 1290 Infinity II refractive index detector, Agilent, Santa Clara, CA, USA) with a Concise separations Coregel ORH 801 column. Isocratic elution with 8 mM H2SO4 at a 0.6 mL/min flow rate was used. Before analysis, samples were filtered over a 0.2-µm polyethersulfone syringe filter (BGB Analytik).

2.3.3. Total Dissolved Organic Carbon

The total dissolved organic carbon was determined after centrifugation for (3600× g, 10 min). The DOC of the supernatants was determined as described by De Vleeschauwer et al. [43]. Briefly, the DOC was determined using a Sievers InnovOx® (Suez, Trevose, PA, USA). The samples were pre-filtered over a glass microfiber filter (VWR®, Radnor, PA, USA), with particle retention of 1.2 µm.

2.3.4. Lignin, Xylan, and Glucan

The lignin, xylan, and glucan fractions were determined according to Wittner et al. after lyophilization of the PWS [5]. Briefly, approximately 180 mg lyophilized sample was subjected to two-stage dilute acid hydrolysis with sulfuric acid, according to the NREL protocol (NREL/TP-510-42618) [44]. Acid insoluble lignin was determined gravimetrically, while acid soluble lignin was determined by measuring the absorbance of the hydrolysate at 240 nm (ε240nm = 25 L/(g·cm)). After neutralization of the hydrolysate with calcium carbonate (Acros, Geel, Belgium), the released xylose and glucose were determined as described in Section 2.3.2. The xylan and glucan contents were calculated from the released sugars. The dry weight of the PWS was determined by drying at 105 °C, which was multiplied with the lignin, xylan, and glucan fractions to obtain their respective concentrations.

2.4. Characterization of the Phenolic Waste Stream

The concentrations of ten common lignocellulosic aromatic inhibitors, sugars, organic acids, lignin, xylan, glucan, and the DOC concentration, were determined as described in the analytical techniques section before.
The lignocellulosic aromatic inhibitor, sugar, and organic acid concentrations were converted to an equivalent organic carbon (OC) concentration based on their structure.
The nitrogen content of the PWS was determined by the chronotropic acid method with a HANNA® instruments, Smithfield, VA, USA, total nitrogen high range kit (HI-94767B-50) and the HI-83224-02 photometer (HANNA® instruments).

2.5. Repeated Batch Fermentation

2.5.1. Inoculum

For each microorganism, a 2000-mL Erlenmeyer with 400-mL double-concentrated yeast peptone dextrose (40 g/L glucose (Merck), 40 g/L peptone from soymeal (Merck), and 20 g/L yeast extract (Merck)) was inoculated with 400 µL of stock culture. The Erlenmeyers were incubated at 30 °C and 150 rpm in a Sanyo Orbi-safe incubator.

2.5.2. Fermentation

The inoculums were washed once (3600 g, 10 min) with PWS (pH 5.5) and resuspended in PWS to start the fermentations. The initial cell concentration was 18.6 ± 0.2 g/L, and 16.3 ± 0.4 g/L for C. oleaginosum and R. kratochvilovae, respectively. The fermentations were performed in 1000-mL Erlenmeyers with 150 mL medium volume at 150 rpm and 30 °C in a New Brunswick™ Innova® 44 incubator (Eppendorf, Hamburg Germany). When the phenolic compounds were consumed, the fermentation was stopped by centrifuging the cells (3600× g 10 min) and replacing the supernatant with an equal volume of fresh PWS. Then, the cells were resuspended, and the fermentation was continued. The PWS was replaced three times.
Consequently, four fermentation cycles were performed. Aromatic compounds, sugars, and organic acids were determined at least three times during each fermentation cycle, according to the methods described in the analytical techniques section. In addition, the pH was measured after each cycle with a Hanna Edge pH meter.

2.5.3. Growth

The growth was monitored by measuring the cell dry weight (CDW) and the colony-forming unit concentration. The cell dry weight was determined by adding 2 mL of sample to a pre-dried 2-mL Eppendorf tube and centrifuging at 21,500× g for 3 min. The supernatant was used to determine lignocellulosic aromatic inhibitor, sugar, and organic acid concentrations by HPLC as described earlier. Next, the cell pellet was washed with demineralized water, followed by one more centrifugation and washing step. The washed cell pellets were dried at 105 °C for at least 20 h, whereafter the CDW was determined. The cell dry weight analysis was performed in triplicate. The colony-forming units (CFU) were determined by plating 50 µL of 100, 10−3, 10−4, and 10−5 on yeast peptone dextrose 2% agar plates. The CFU determination was conducted in duplicate. These plates were also used to assess if contamination occurred.

2.5.4. Lipids

The lipid content and lipid titer were determined by gel permeation chromatography (GPC) after Folch extraction. First, 1 mL of sample was centrifuged and washed thrice with demineralized water. Hereafter, the cell pellet was lyophilized for at least 48 h. The dried cell pellet was transferred to a tared 10-mL extraction vial, and the cells were homogenized with a stirring rod. The mass of the dried homogenized cells in the vial was recorded. To the vial, 0.25 g of 2-mm beads were added to facilitate the extraction. One milliliter of a 2:1 (by volume) chloroform–methanol was added to the vial to extract the lipids. The extraction was performed on a Yellow line RS orbital shaker at 210 rpm at 50 °C for 20 h. The extract was quantitatively transferred to an evaporation flask, and the solvents were removed by rota-evaporation. The resulting residue was dissolved in 1 mL tetrahydrofuran (THF) and analyzed by GPC as described by Bauwelinck et al. [45]. The obtained triglyceride, diglyceride, monoglyceride, and free fatty acid concentrations in THF were converted to the total lipid content by Equation (1).
Total   lipid   content   ( % ) = ( concentration   in   THF i ( mg mL   THF ) ) · 1   mL   THF Mass   in   extraction   vial   ( mg ) · 100 %  
Similarly, the lipid content of the individual lipid species, i.e., triacylglycerides (TAGs), diacylglycerides (DAGs), monoacylglycerides (MAGs), and free fatty acids (FFAs), were calculated. The relative abundance of the lipid species was calculated as the ratio of the lipid content of the individual lipid species and the total lipid content.
The total lipid titer was calculated by Equation (2) using the total lipid content and the cell dry weight, determined according to the procedure described earlier. The lipid determination was performed in triplicate.
Total   lipid   titer   ( g / L ) = Total   lipid   content   ( % ) 100 %   · cell   dry   weight   ( g L )  
For all repeated measurements, the average with standard deviation was reported.
The composition of the lipids was determined according to Yaguchi et al. with minor modifications [25]. Briefly, 1 mL of fermentation broth was centrifuged at 21,500× g. The pellet was washed three times with demineralized water, whereafter it was lyophilized for 48 h. To the lyophilized cells, 100 μL of glyceryl triheptadecanoate at a concentration of 2 mg/mL methanol was added. The lipids were transesterified to their methyl ester by an addition of 500 µL of 0.5 N sodium methoxide (Acros organics), followed by 30 min of vortexing at 2000 rpm. Hereafter, 40 µL of concentrated sulfuric acid was added to neutralize the solution. The fatty acid methyl-esters were extracted with 850 µL of hexane, while vortexing for 20 min at 2000 rpm. Next, the mixture was centrifuged at 8000 rpm, and the organic layer was pipetted off and filtered over a 0.2-µm PTFE filter. The sample was injected into the GC-FID system described by Bauwelinck et al. [45].

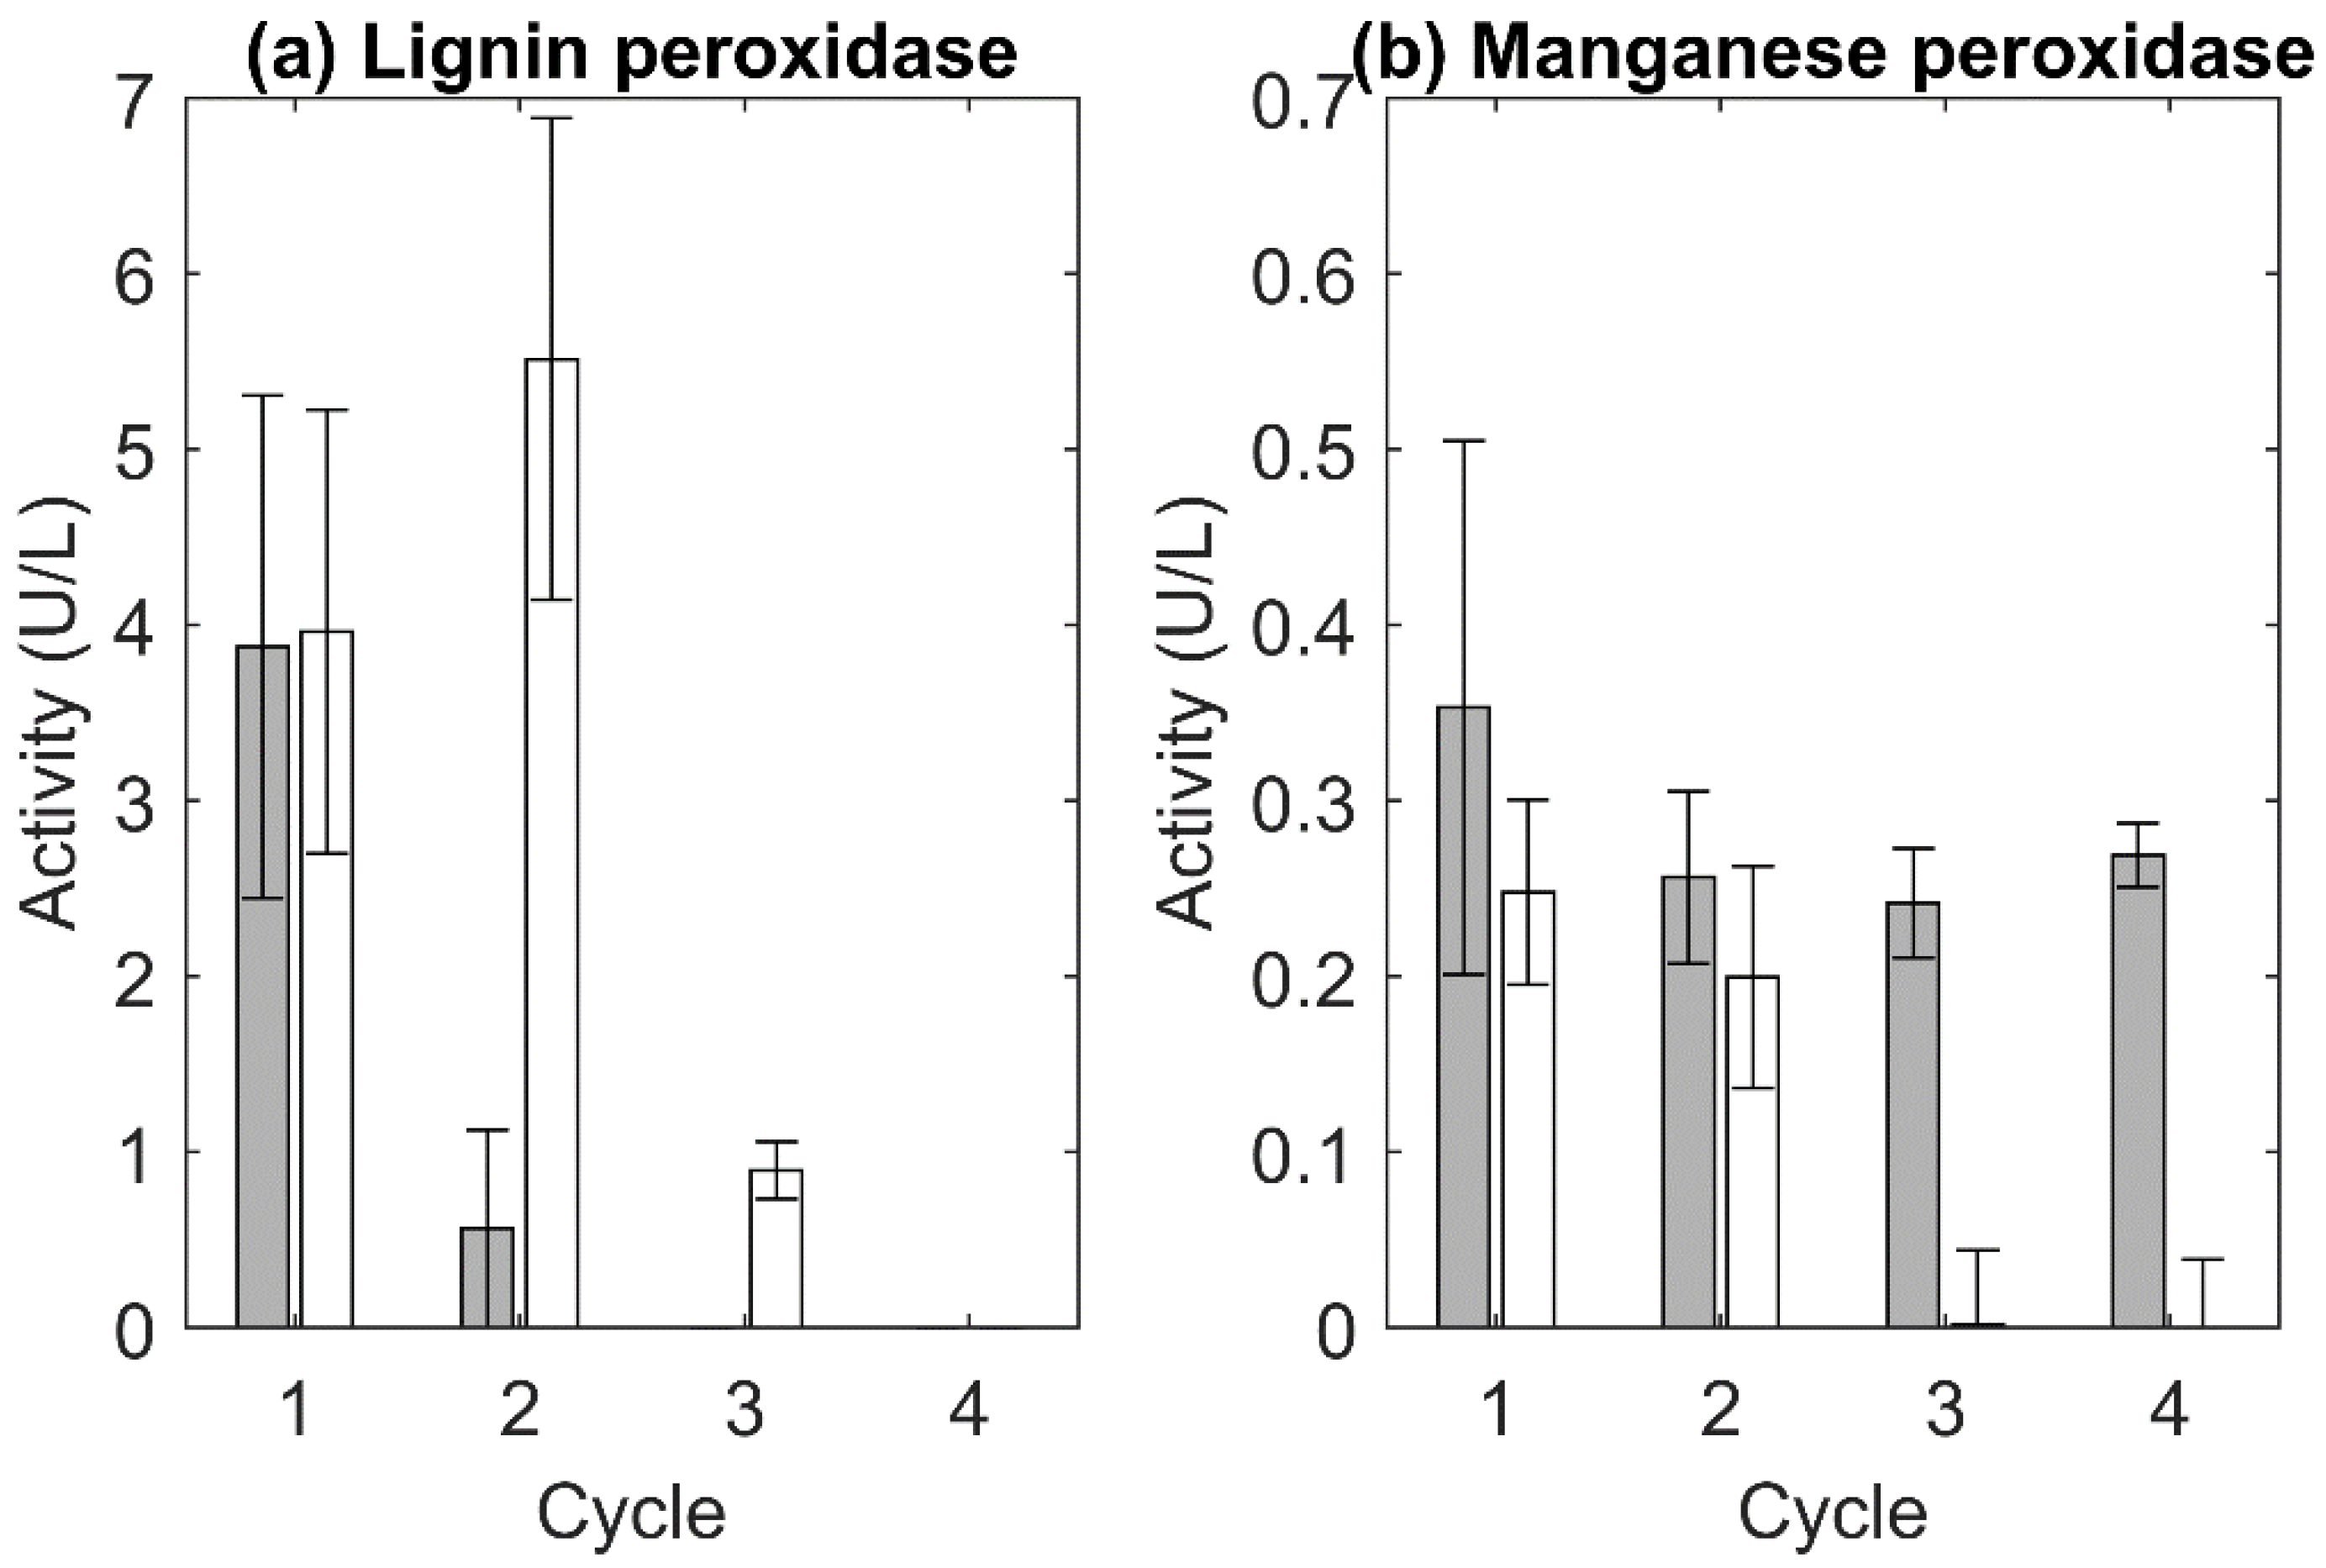
2.5.5. Laccase, Lignin Peroxidase, and Manganese Peroxidase Activity Measurement

Lignin peroxidase activity was measured according to Wittner et al. [5] using Azure B. Due to the low enzyme activity, the assay duration was lengthened to 30 min. The slope of the linear part of the absorbance vs. time curve was used for the enzyme activity calculation. Manganese peroxidase activity was measured by monitoring the oxidation of phenol red [46,47]. Phenol red assay was performed in semi-micro UV-cuvets at 30 °C, and 1 mL of reaction medium contained 0.5 mL crude enzyme extract, 0.05 mL phenol red, 0.2 mL 0.5 w/v% bovine albumin, 0.05 mL 2 mM MnSO4, and 0.1 mL 250 mM sodium lactate buffer (pH = 4.5). The enzymatic reaction was started by adding 50 µL of 2 mM H2O2 in 200 mM of sodium succinate buffer (pH = 4.5). After fifteen minutes, the reaction was stopped by adding 40 µL of 2 M NaOH. After termination, the absorbance was measured against demineralized water at 610 nm. By the addition of the stopping reagent (2 M NaOH) before the starting reagent (hydrogen peroxide), the 0 min measurement was obtained. The effect of the matrix on phenol red degradation was considered by repeating the analysis on a denatured sample. Denaturation was performed by boiling the sample for 15 min in a screw cap tube, whereafter it was centrifuged (21,500× g). The supernatant was used as the denatured sample. The enzyme activity (EA), expressed as units per mL, was calculated with Equation (3) below, with ∆A6105min and ∆A6100min the difference in absorbance after, respectively, 5 min and 0 min, between the sample and the denatured sample.
EA ( U mL ) = Δ A 610 5 min Δ A 610 0 min 55
Laccase activity was measured according to Elisashvili et al. [48]. The activity was determined by monitoring the oxidation of 2,2′-azino-bis-[3-ethylbenzothiazoline-6-sulfonic acid] (ABTS) performed at room temperature (22–25 °C) in a quartz cuvette. The reaction mixture contained 50 µL of sample, 850 µL of 1 mM ABTS in 50 mM sodium acetate buffer (pH 5), and 57 µL of catalase (1000 units). The absorbance at 420 nm was measured for 20 min in 5-s intervals. One unit of laccase activity was defined as the amount of enzyme that oxidizes 1 µmol of ABTS in 1 min.
The measured laccase and lignin peroxidase activities were corrected for matrix effects by subtracting the enzyme activity of a denatured sample. Denaturation of the sample was performed as described above.

3. Results and Discussion

3.1. Composition of the Phenolic Waste Stream

Before researching the process, the substrate, i.e., lignocellulose-derived wastewater, had to be characterized. In Table 1, the composition of this PWS is presented.
The PWS contained both non-monomeric substrates and monomeric substrates, here defined as all phenolics, furans, acetic acid, formic acid, xylose, and glucose. The non-monomeric substrates are polymers and oligomers originating from the partial degradation of lignin, cellulose, and hemicellulose.
From Table 1, it can be observed that 4-hydroxybenzoic acid accounted for 84% of the total phenolic carbon concentration. Together with acetic acid and xylose, they were the most abundant monomeric carbon sources, contributing to 77% of the monomeric total organic carbon. The most toxic pollutants were lignin-derived phenolics and furfural, which can be harmful to health and the environment, even at low concentrations [49,50].
The non-monomeric substrates contributed five times more to the total organic carbon (OC) concentration than the monomeric substrates. Their abundance makes that, despite their recalcitrance, they formed an interesting additional carbon source for lipid production. Xylan and lignin were the most abundant non-monomeric carbon sources, contributing, respectively, 79% and 18% to the total organic carbon. Nevertheless, the OC substrate concentration of 7.0 g/L was limited compared to traditional sugar-rich media for lipid production in batch. In addition, only the monomeric substrates (1.09 g/L OC) were readily accessible to the yeasts. The low readily accessible substrate concentration makes lipid production from PWS challenging and requires a novel fermentation strategy, e.g., repeated batch. Furthermore, it was observed that the repeated addition of resorcinol in a fed-batch can lead to increased lipid production, compared to batch fermentation [25]. Therefore, a repeated batch strategy where cells are repeatedly brought into a new fermentation broth is advantageous.

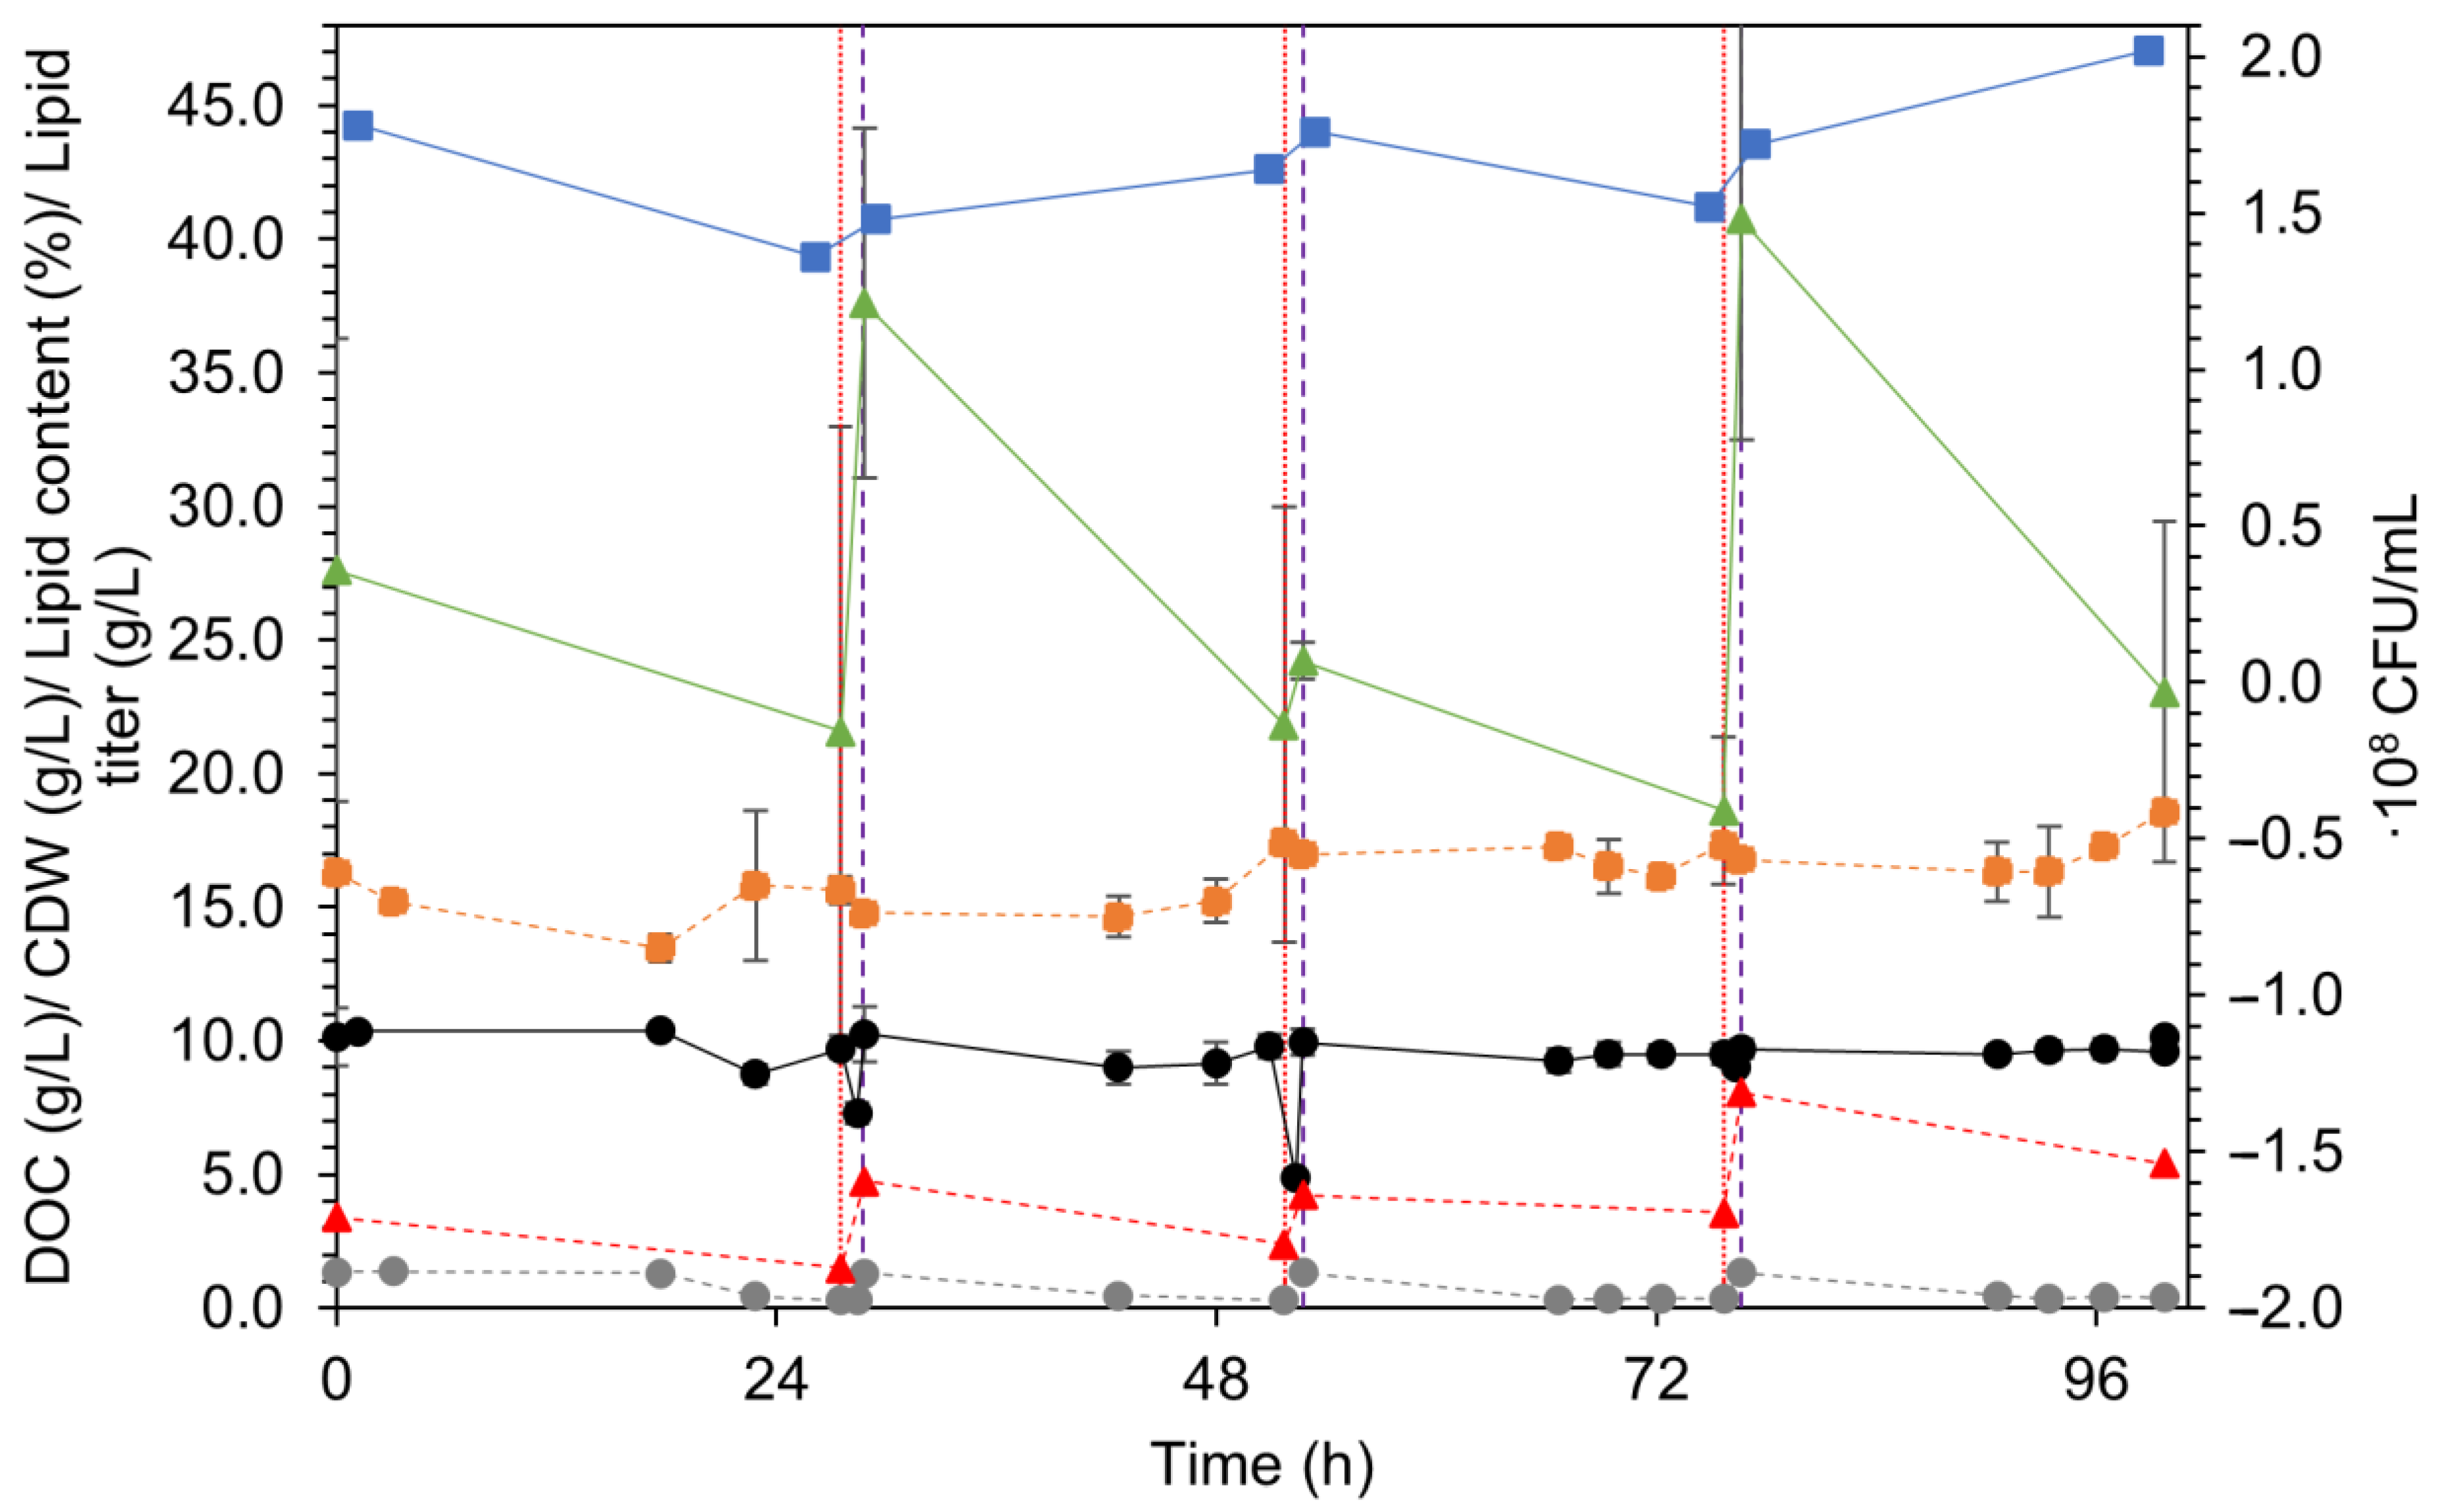
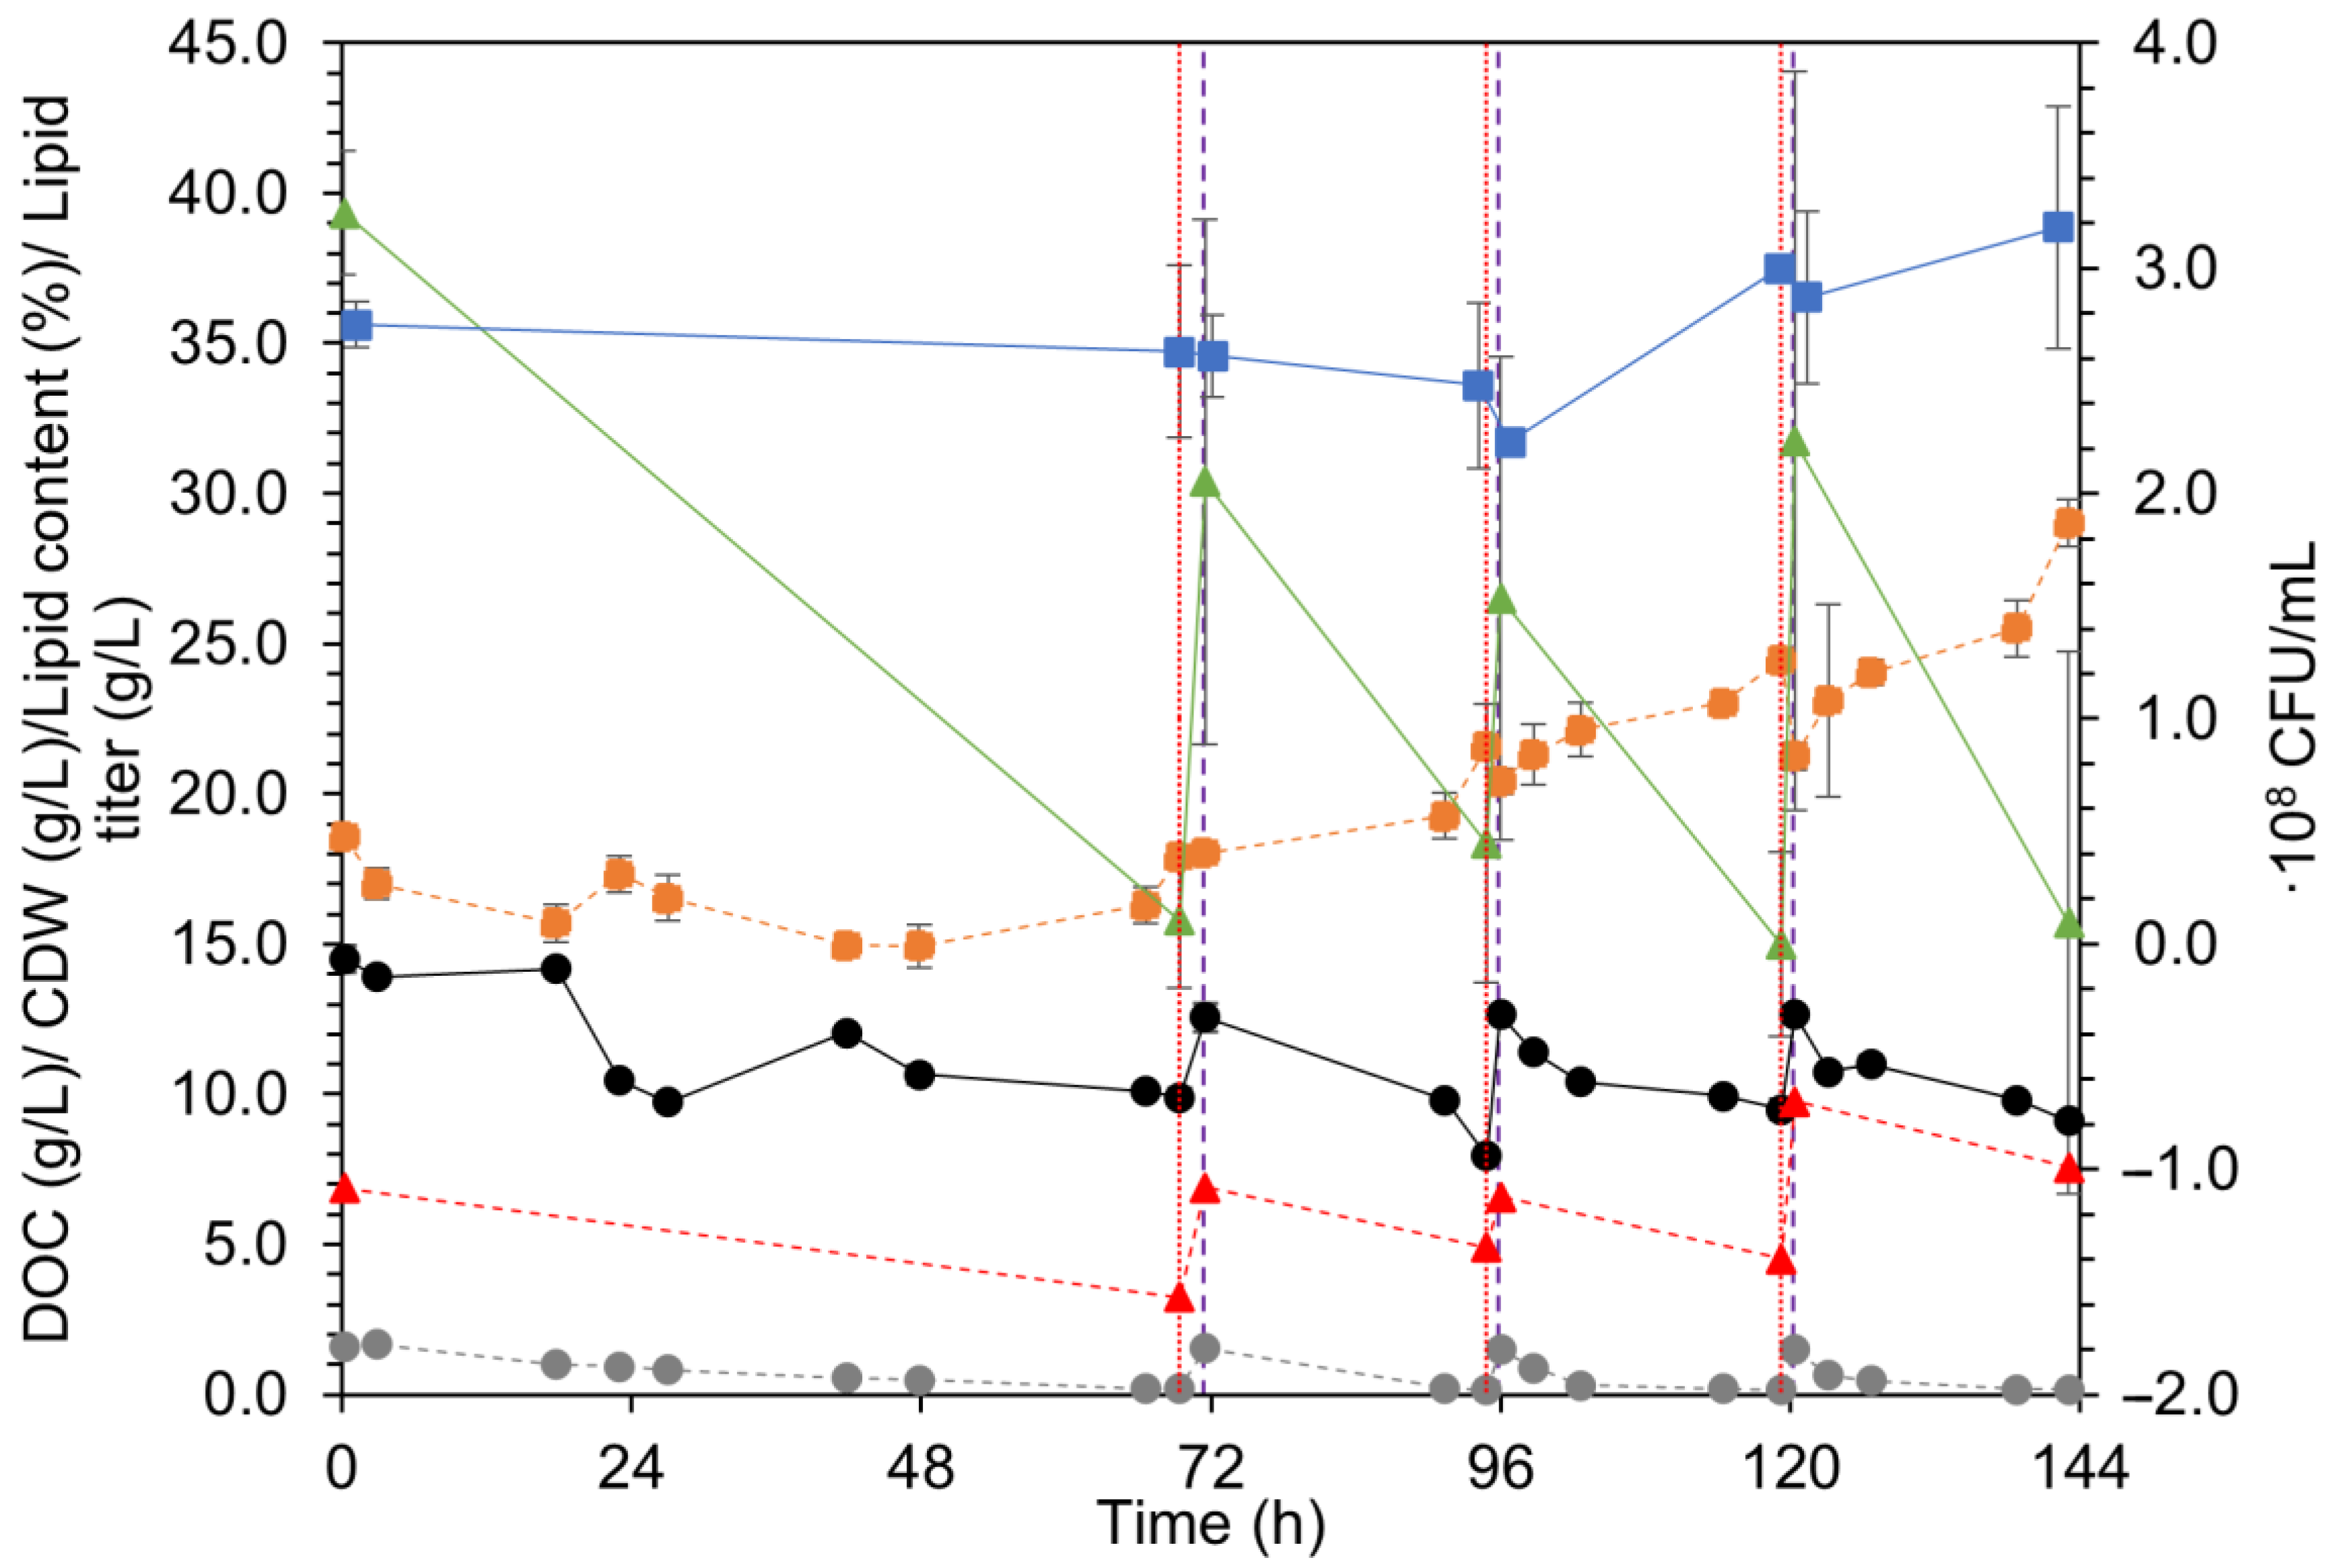
3.2. Repeated Batch: Overview

C. oleaginosum and R. kratochvilovae EXF7516 were precultured and brought in the phenolic waste stream (PWS) with a pH of 5.5. When the monomeric substrates were depleted, the cells were harvested and resuspended in fresh PWS. Harvesting and resuspension after consumption was repeated three more times.

3.2.1. R. kratochvilovae

Figure 1 shows the growth and substrate removal for R. kratochvilovae. The cell dry weight initially decreased in the first cycle, and no substrate was consumed. After 18 h, the monomeric dissolved organic carbon (DOC) concentration decreased, indicating that the cells had adapted to the PWS and were beginning to consume it. In the following cycles, monomeric DOC consumption started immediately, as the cells adapted to the PWS in the first cycle.
During the harvesting of the cells after the first and the second cycle, the total DOC abruptly decreased. At this moment, the monomeric DOC, as measured by HPLC, was largely consumed. Due to the low concentration of the soluble substrates, the microorganisms might have started to break down the non-monomeric substrates.

3.2.2. C. oleaginosum

Figure 2 shows the biomass concentration, lipid accumulation, and substrate removal as the total DOC and monomeric DOC calculated from the HPLC measurements.
As was observed with R. kratochvilovae, for C. oleaginosum, the total DOC consumption was higher than the monomeric DOC consumption, indicating that non-monomeric substrates, i.e., lignin, xylan, or cellulose, were consumed.
The fermentations were performed without prior sterilization of the PWS. Nevertheless, no contamination was found on the YPD agar plates used to determine the CFU. The lack of contamination can be attributed to the toxicity of the PWS, creating a niche for microbial growth and the relatively high cell densities [51]. Lipid production from non-sterilized PWS seems to be possible.

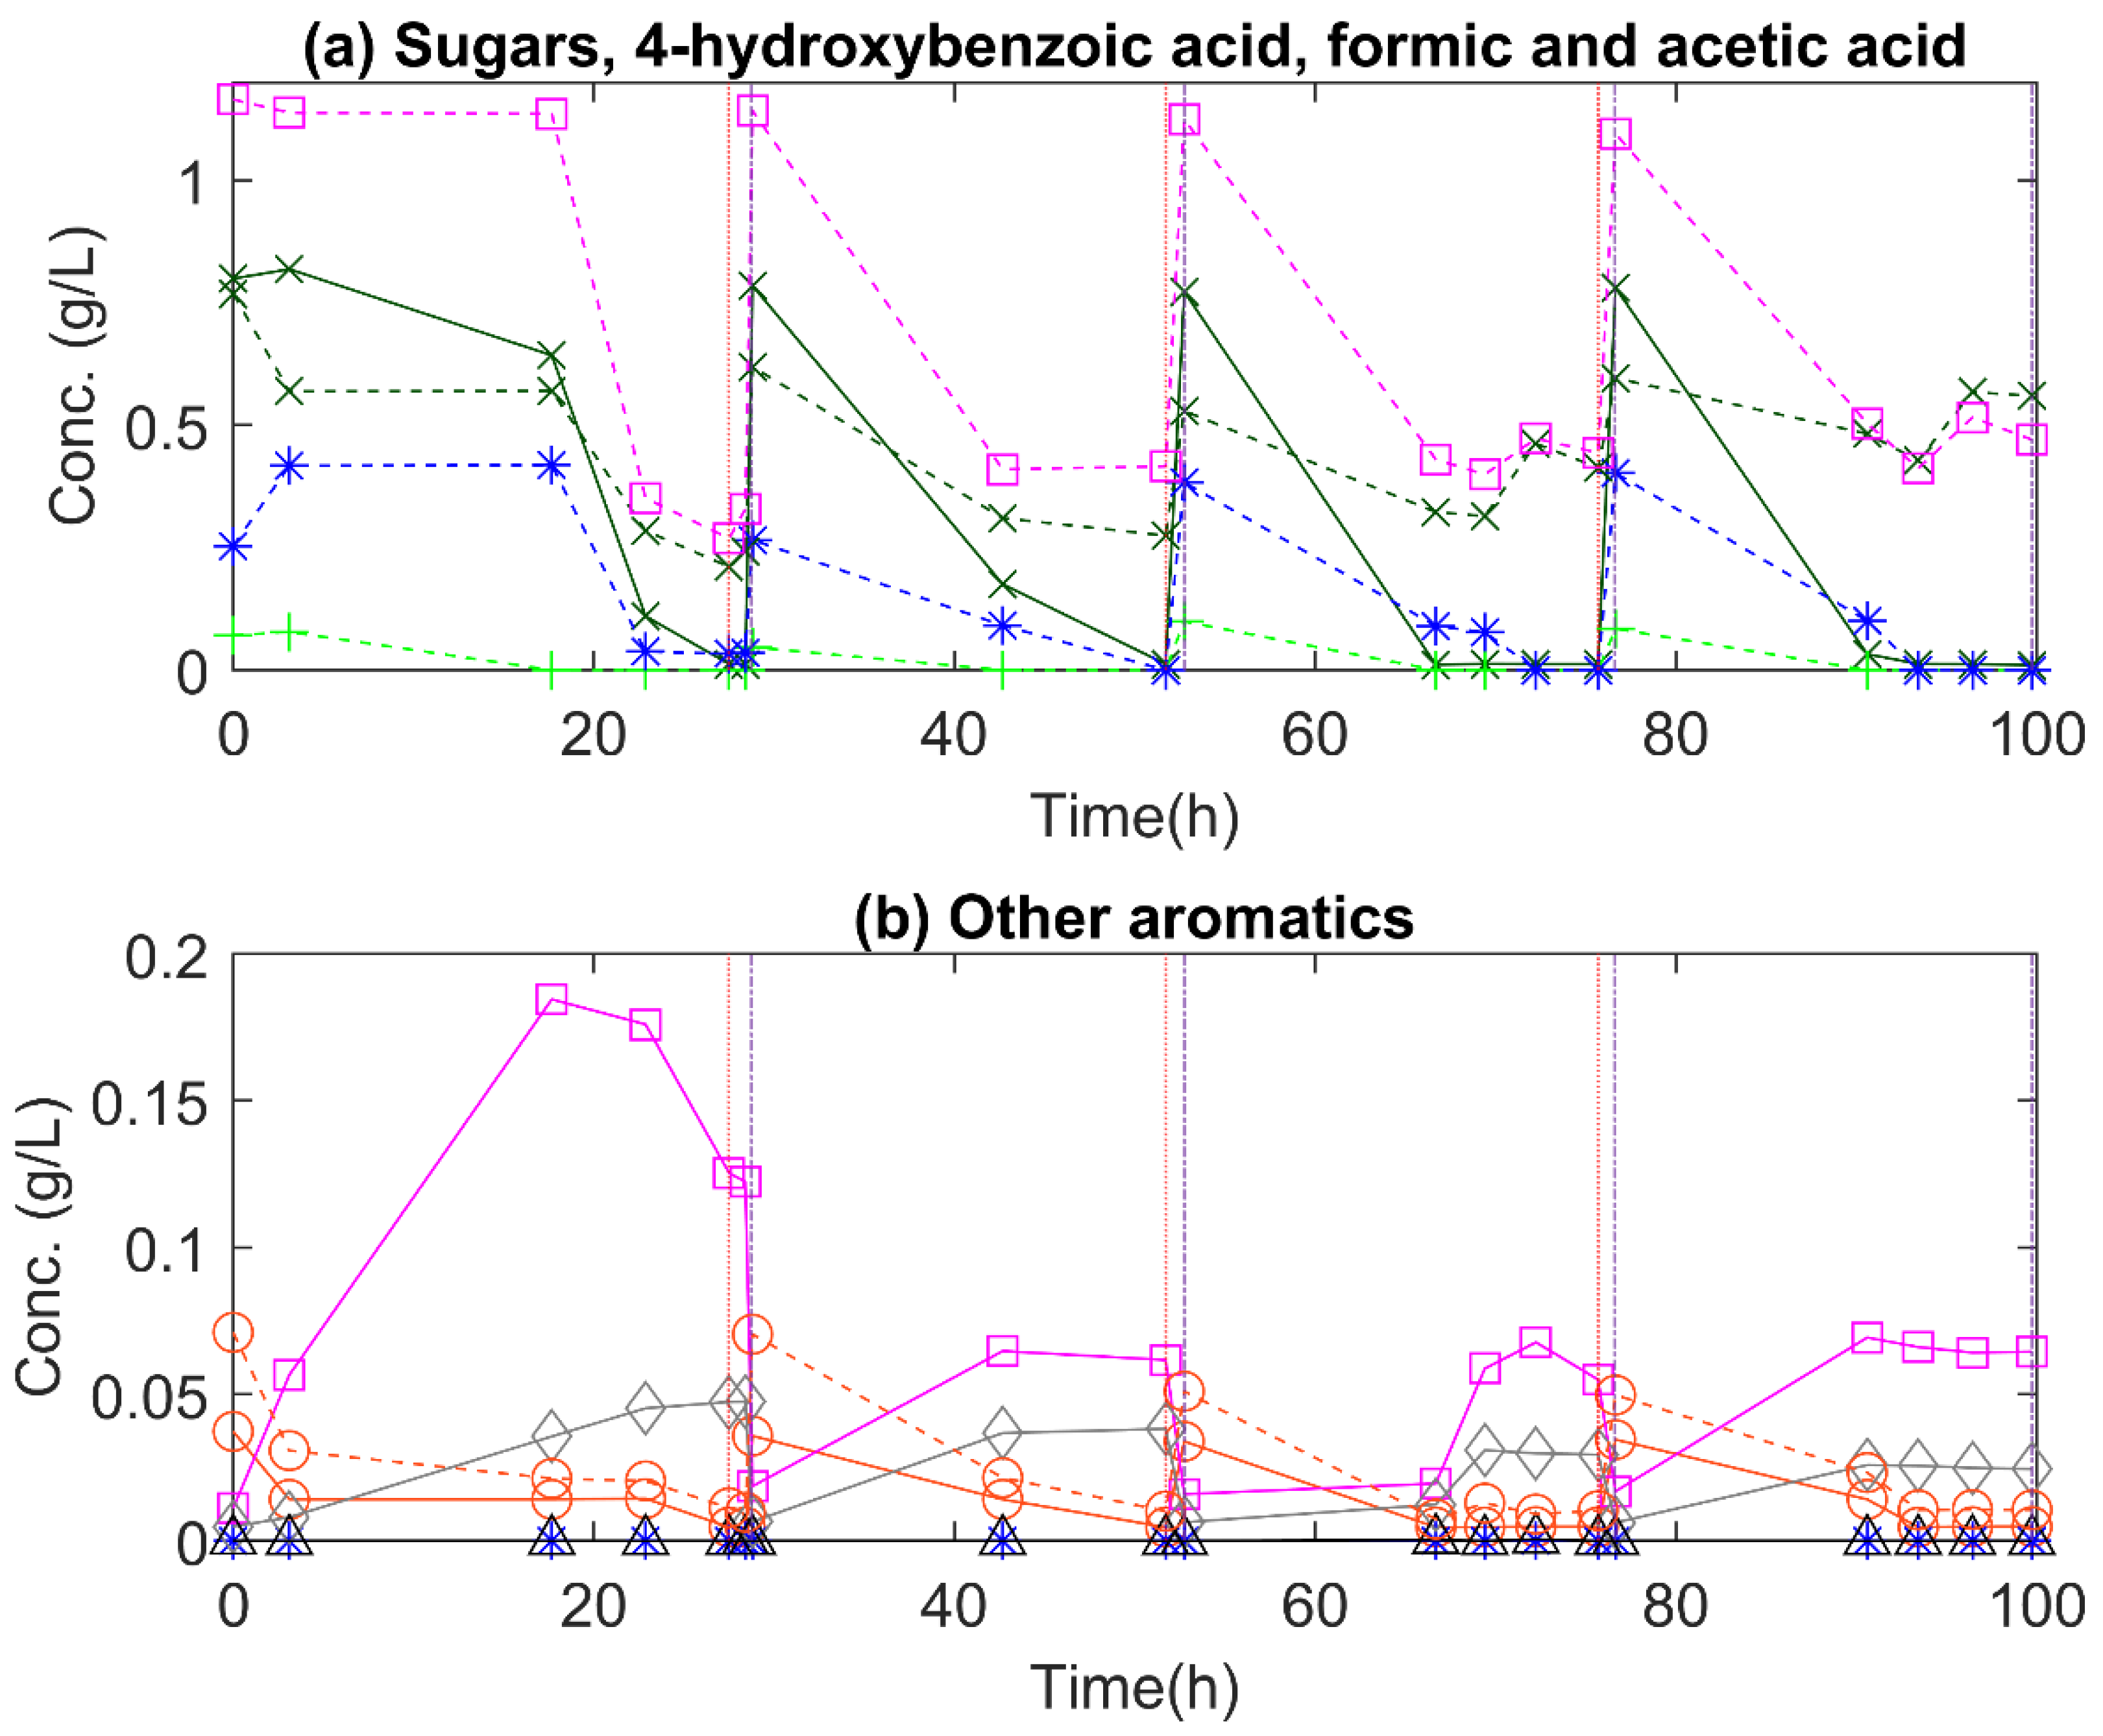
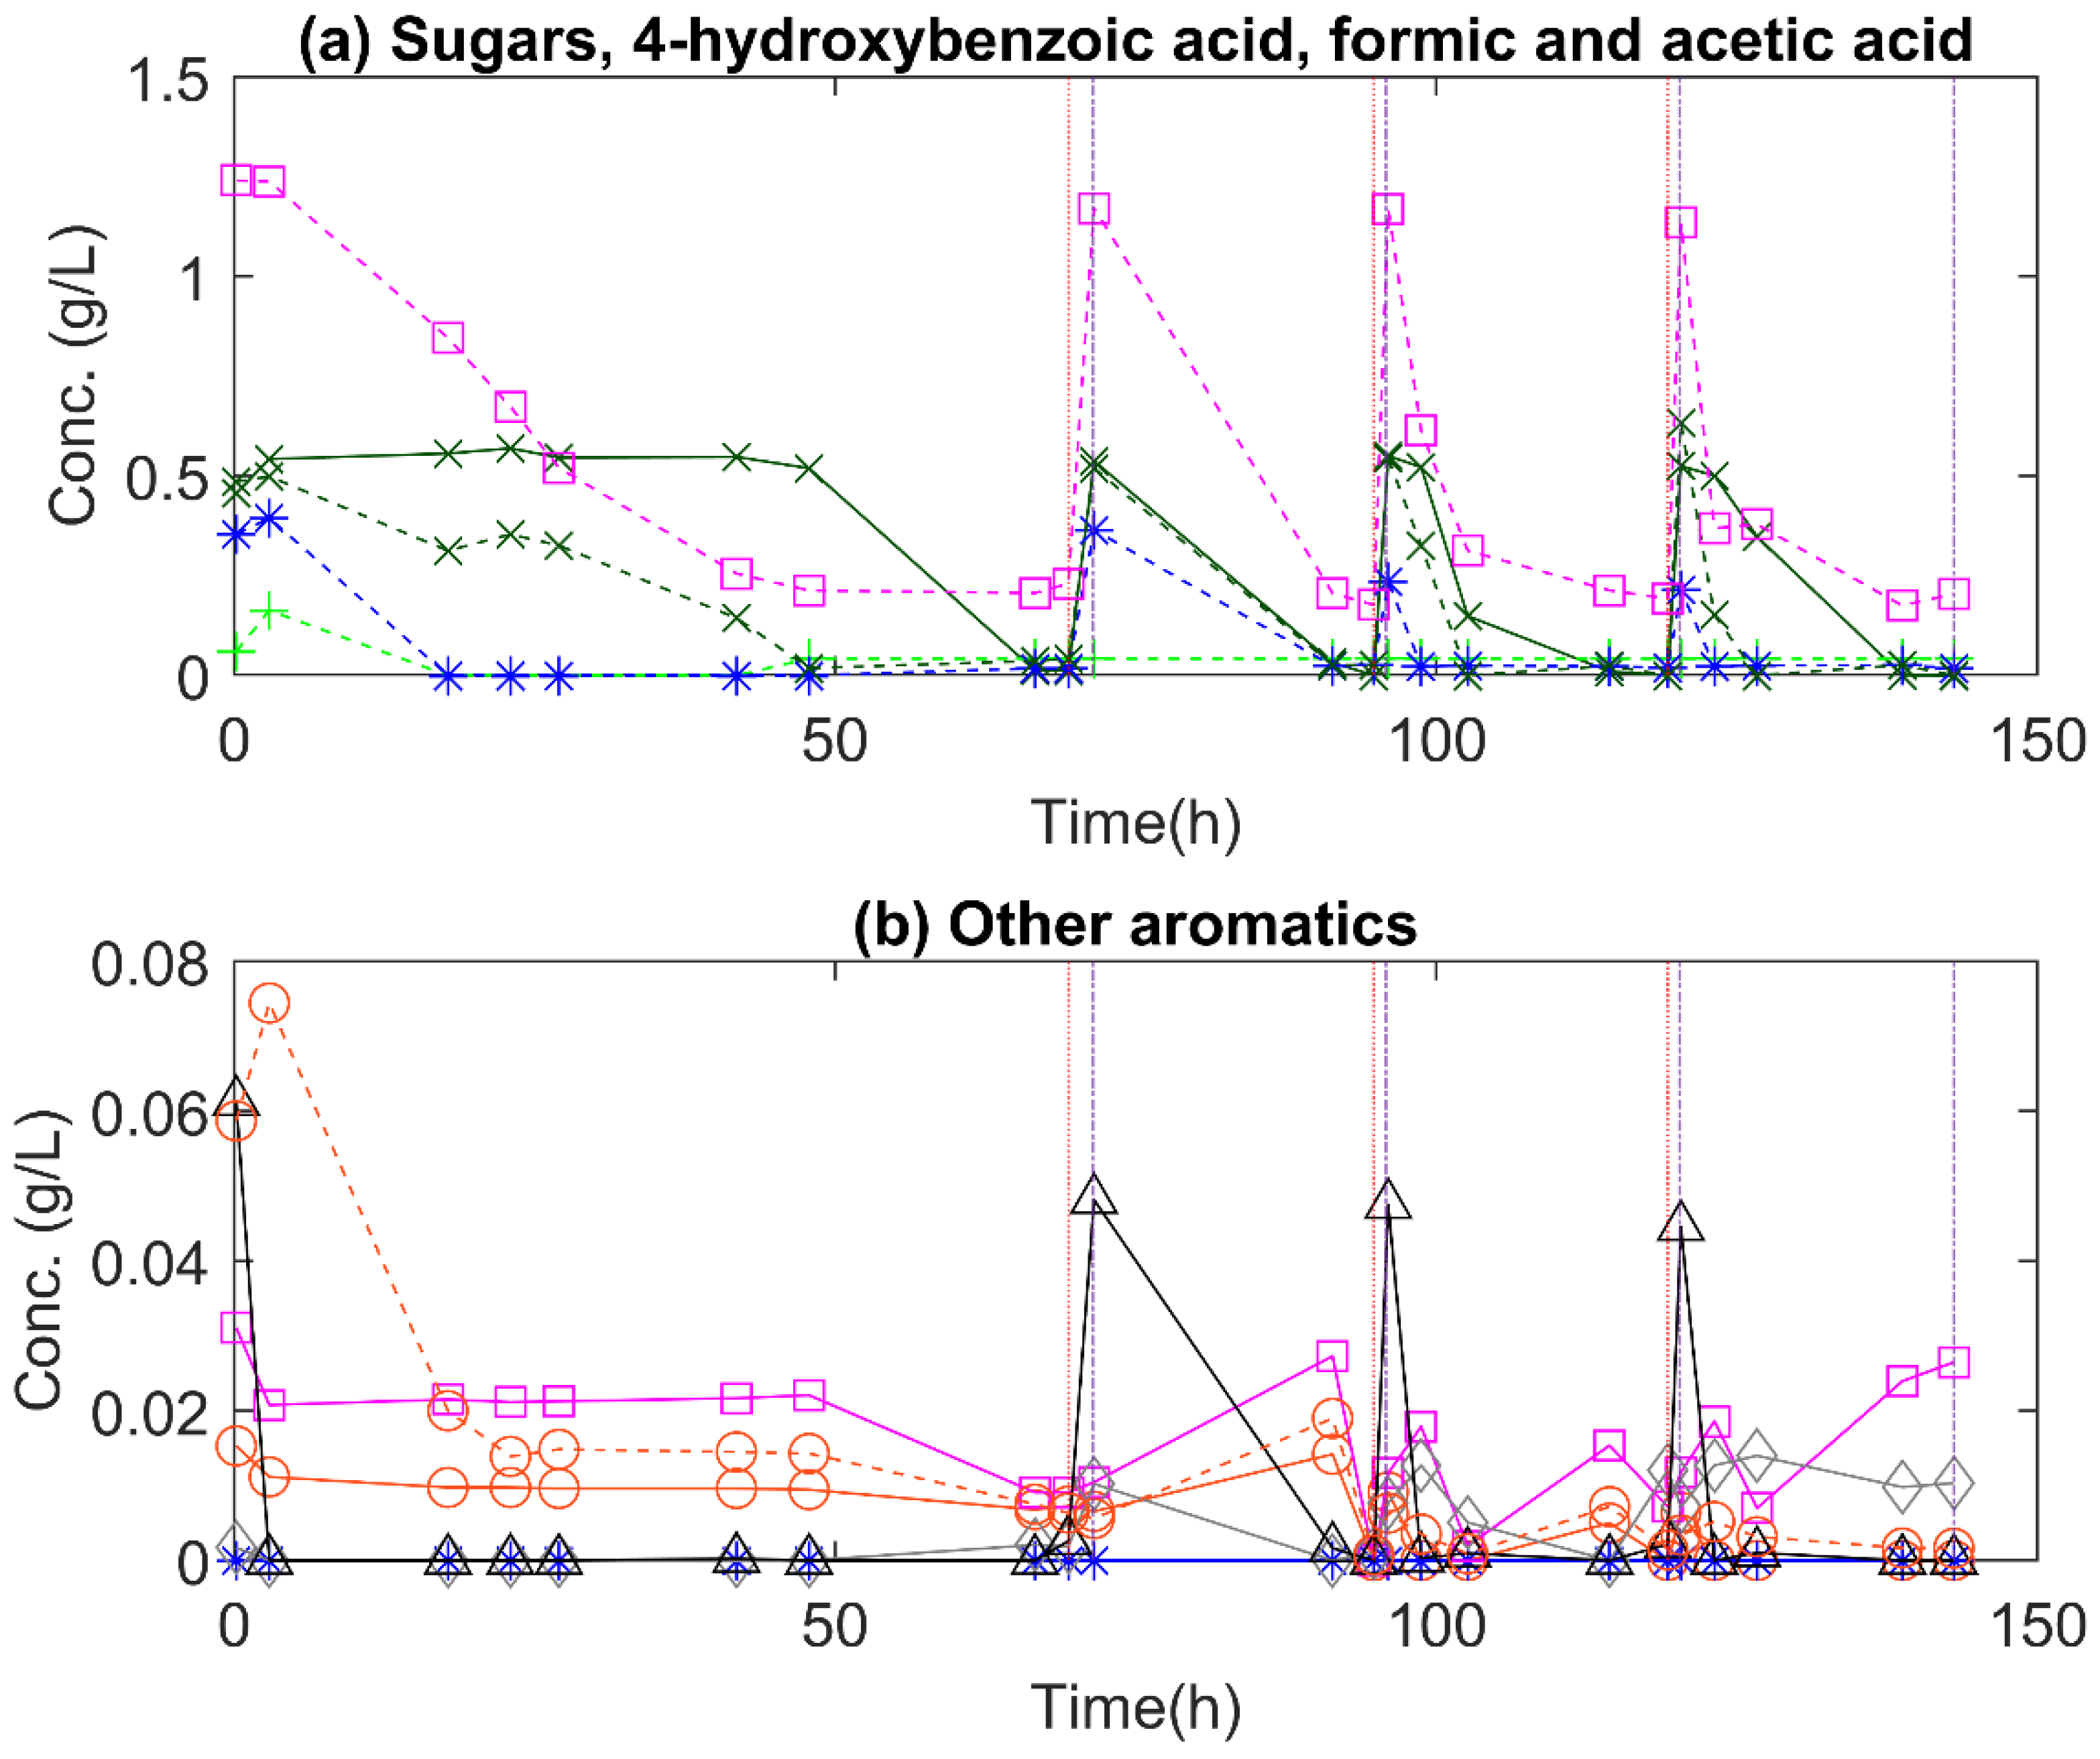
3.3. Monomeric Substrates

3.3.1. R. kratochvilovae

Figure 3 shows the substrate concentrations measured on HPLC to further investigate the substrate preference of R. kratochvilovae.
In the first cycle, the cells initially slowly consumed the organic acids and 4-hydroxybenzoic acid, and did not consume xylose, while after 20 h, the consumption rates increased significantly. In the subsequent cycles, the microorganism immediately consumed these substrates at a high rate. The increased consumption rates were most likely due to the adaptation of the microorganism to the PWS. Interestingly, vanillic acid (Figure 3b) was formed in each cycle. Vanillic acid might be an intermediate in the breakdown of the phenolic compounds or (oligo)lignin [52].
It can be observed that the acetic acid and formic acid (Figure 3a) concentrations did not lower anymore towards the end of each cycle. The consumption of the organic acids resulted in an increased pH that was measured at the end of the cycle and reached a value of 8–9 [53]. A pH of four units above the pKa (4.76) of acetic acid will significantly reduce the amount of non-dissociated acid in the medium. Acetic acid entered the cell in its non-dissociated form [54]; therefore, its consumption might have stopped. For formic acid (pKa = 3.75), the same reason might have caused decreased consumption at the end of the cycle [55]. However, considering the complex nature of the PWS and the low concentrations of acetic acid and formic acid, it cannot be excluded that the effect was an analytical error caused by another compound eluting at the same time from the HPLC column.

3.3.2. C. oleaginosum

A clear substrate preference could be noticed in the first cycle (Figure 4), where firstly acetic acid, formic acid, and xylose were consumed, followed by 4-hydroxybenzoic acid. The substrate preference could not be observed in subsequent cycles, as C. oleaginosum was adapted to the phenolic stream. The increased consumption rate can also be explained by the adaptation of C. oleaginosum to the PWS. The adaptation of the yeast to the PWS was also observed for R. kratochvilovae.
Similar to R. kratochvilovae, the acetic acid consumption by C. oleaginosum stopped at the end of each cycle, when a pH of 8–9 was reached. In contrast to R. kratochvilovae, C. oleaginosum almost completely consumed formic acid; the reason for this difference in consumption is unclear.

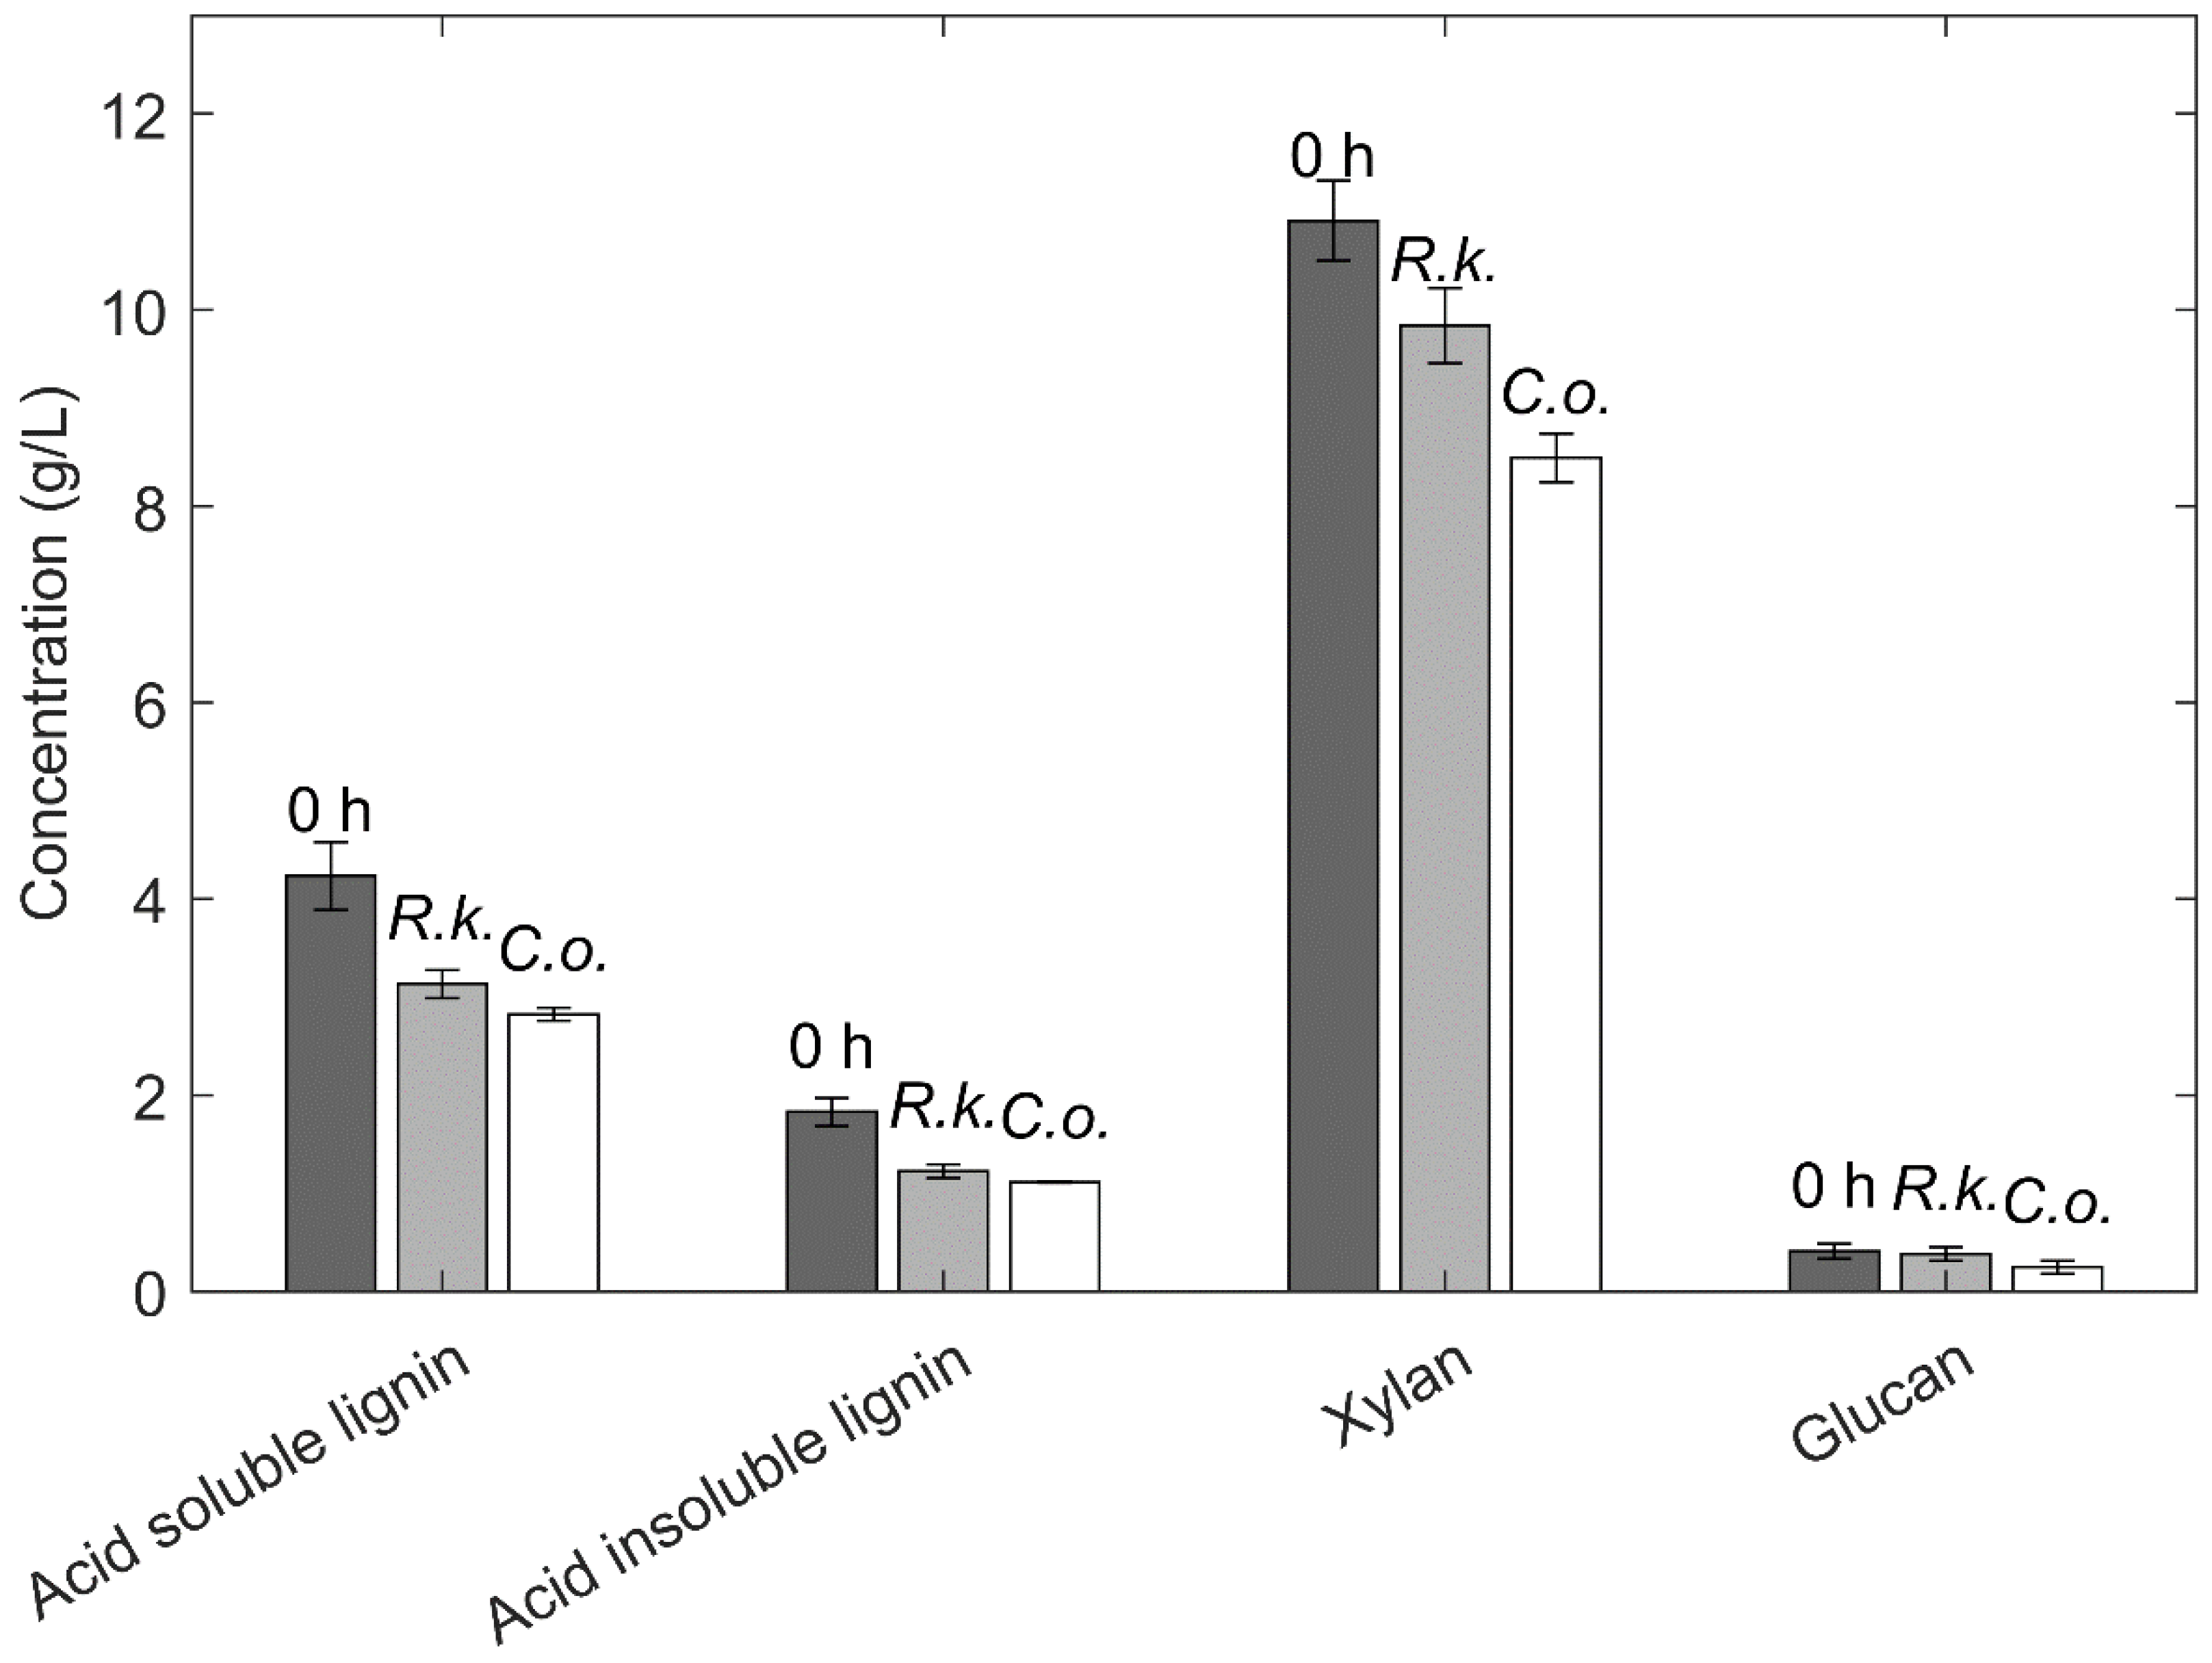
3.4. Non-Monomeric Substrates
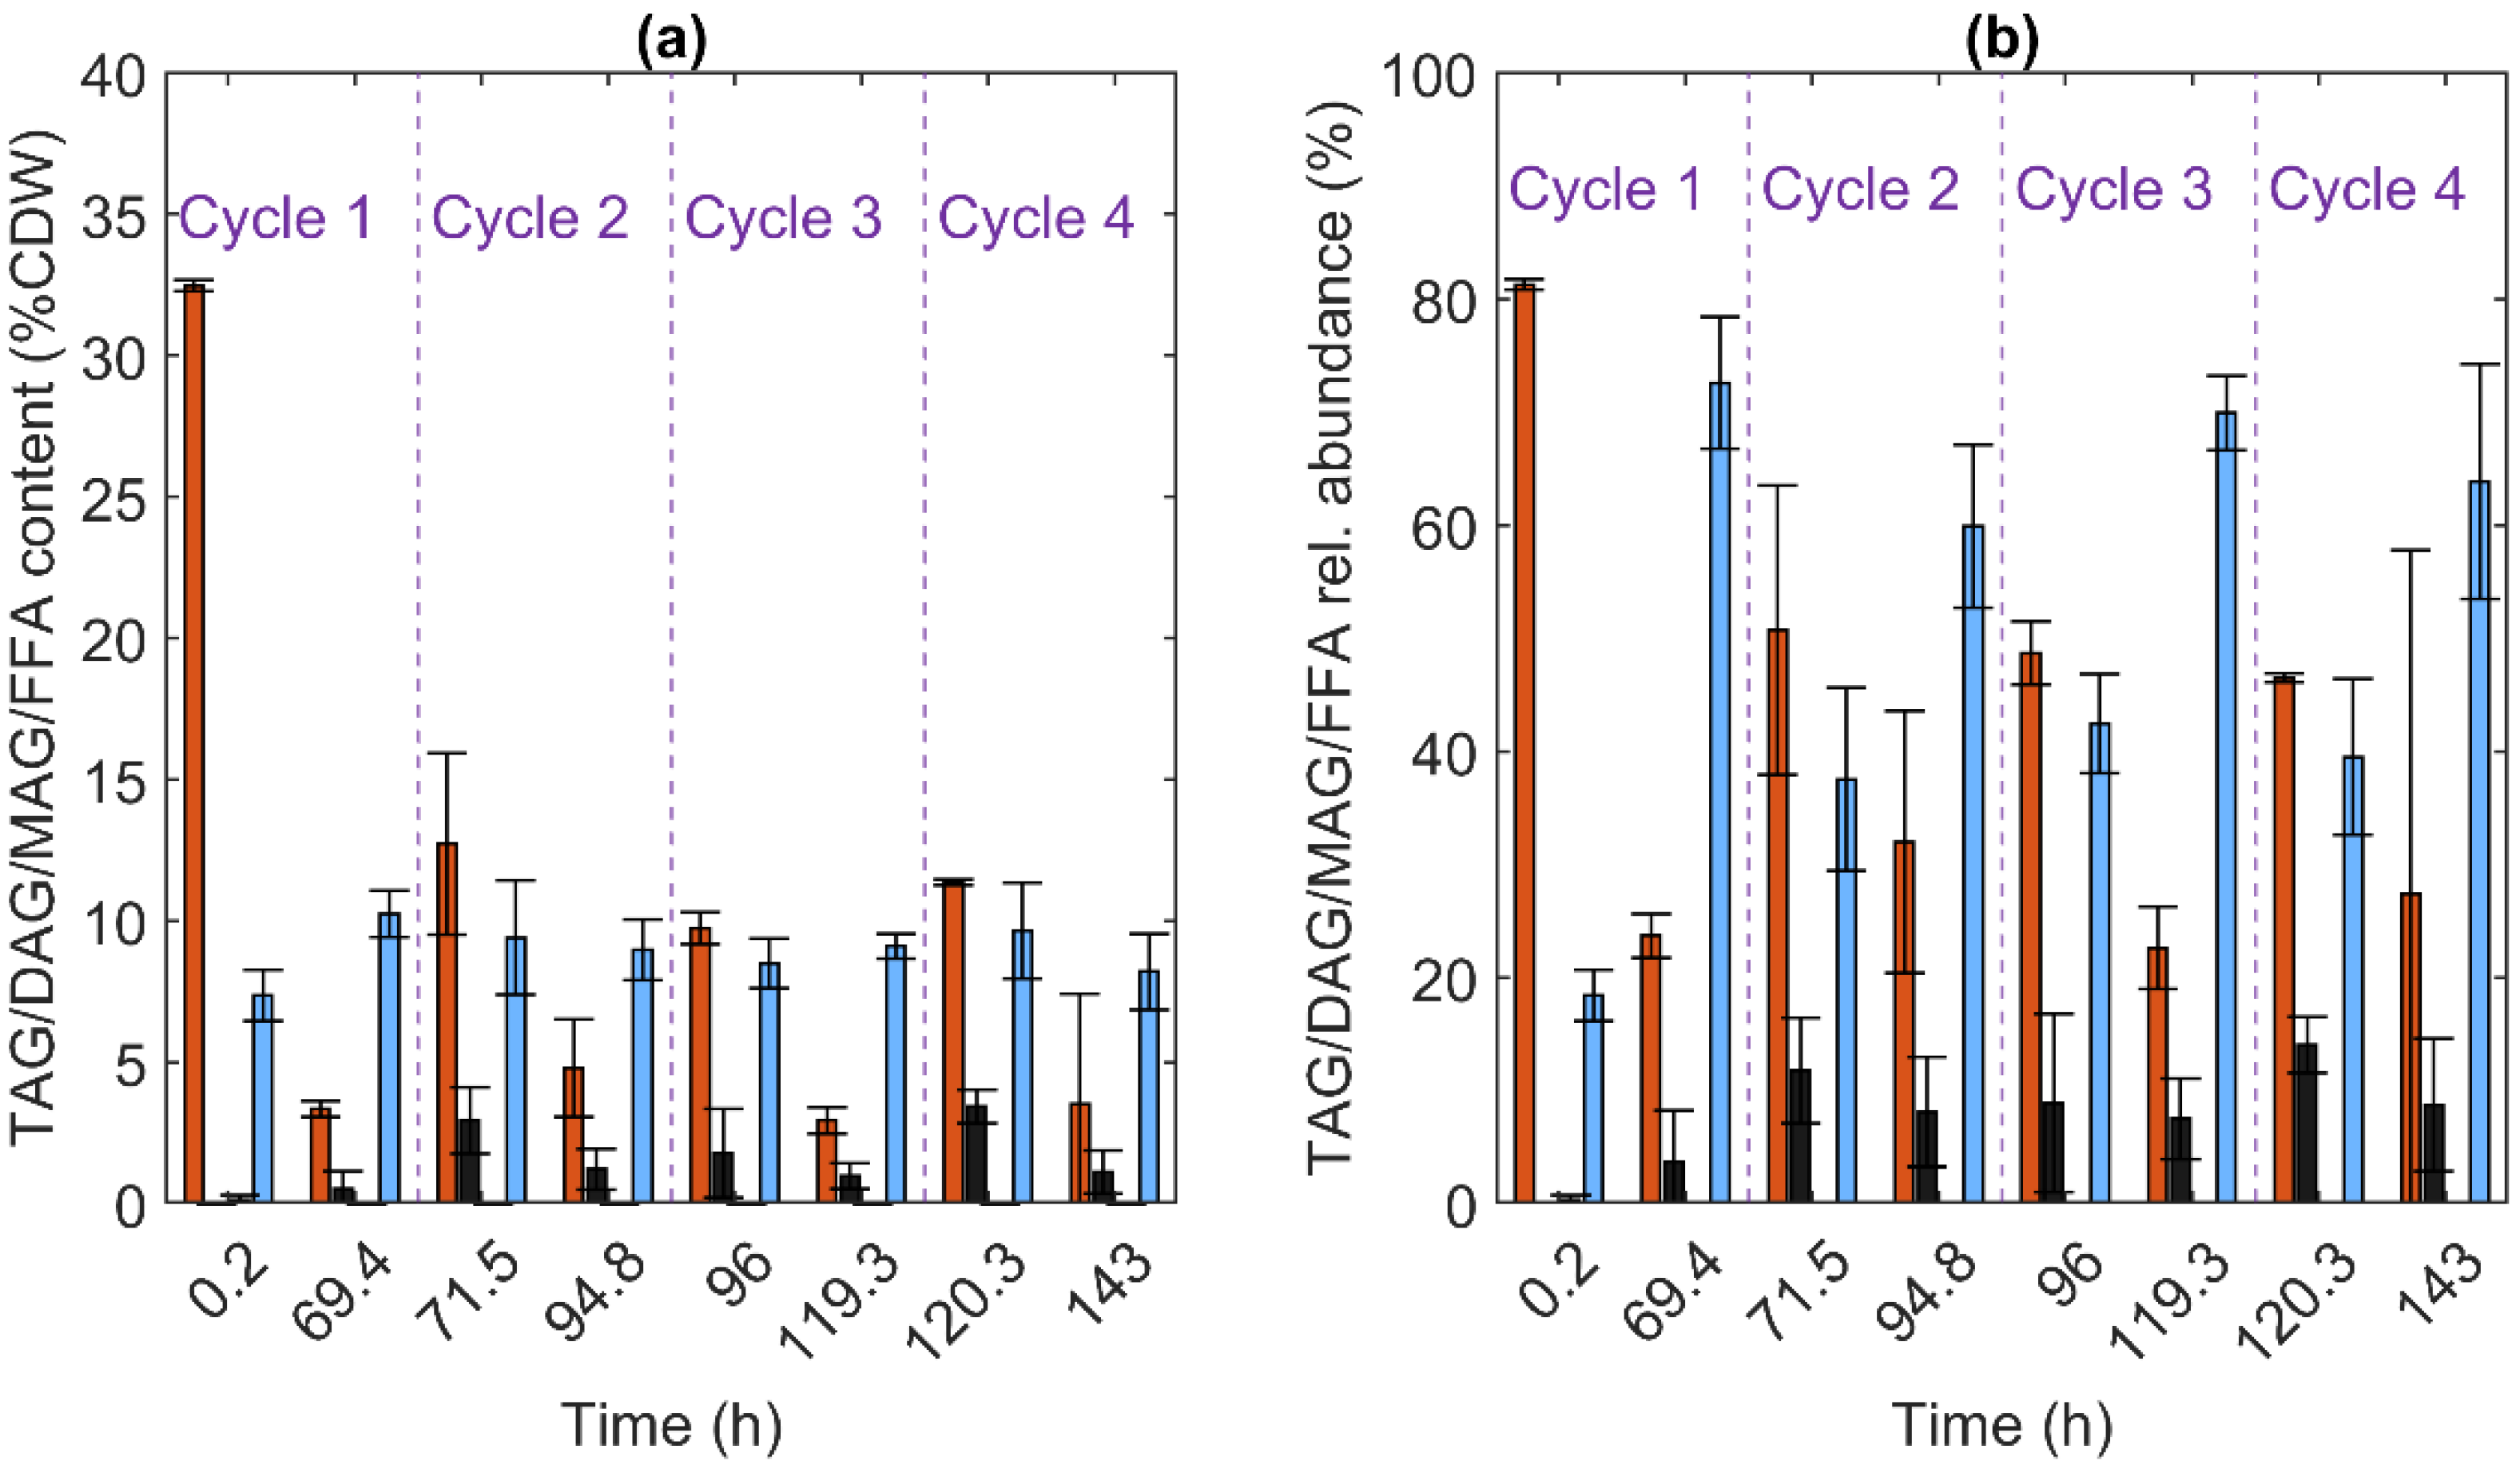
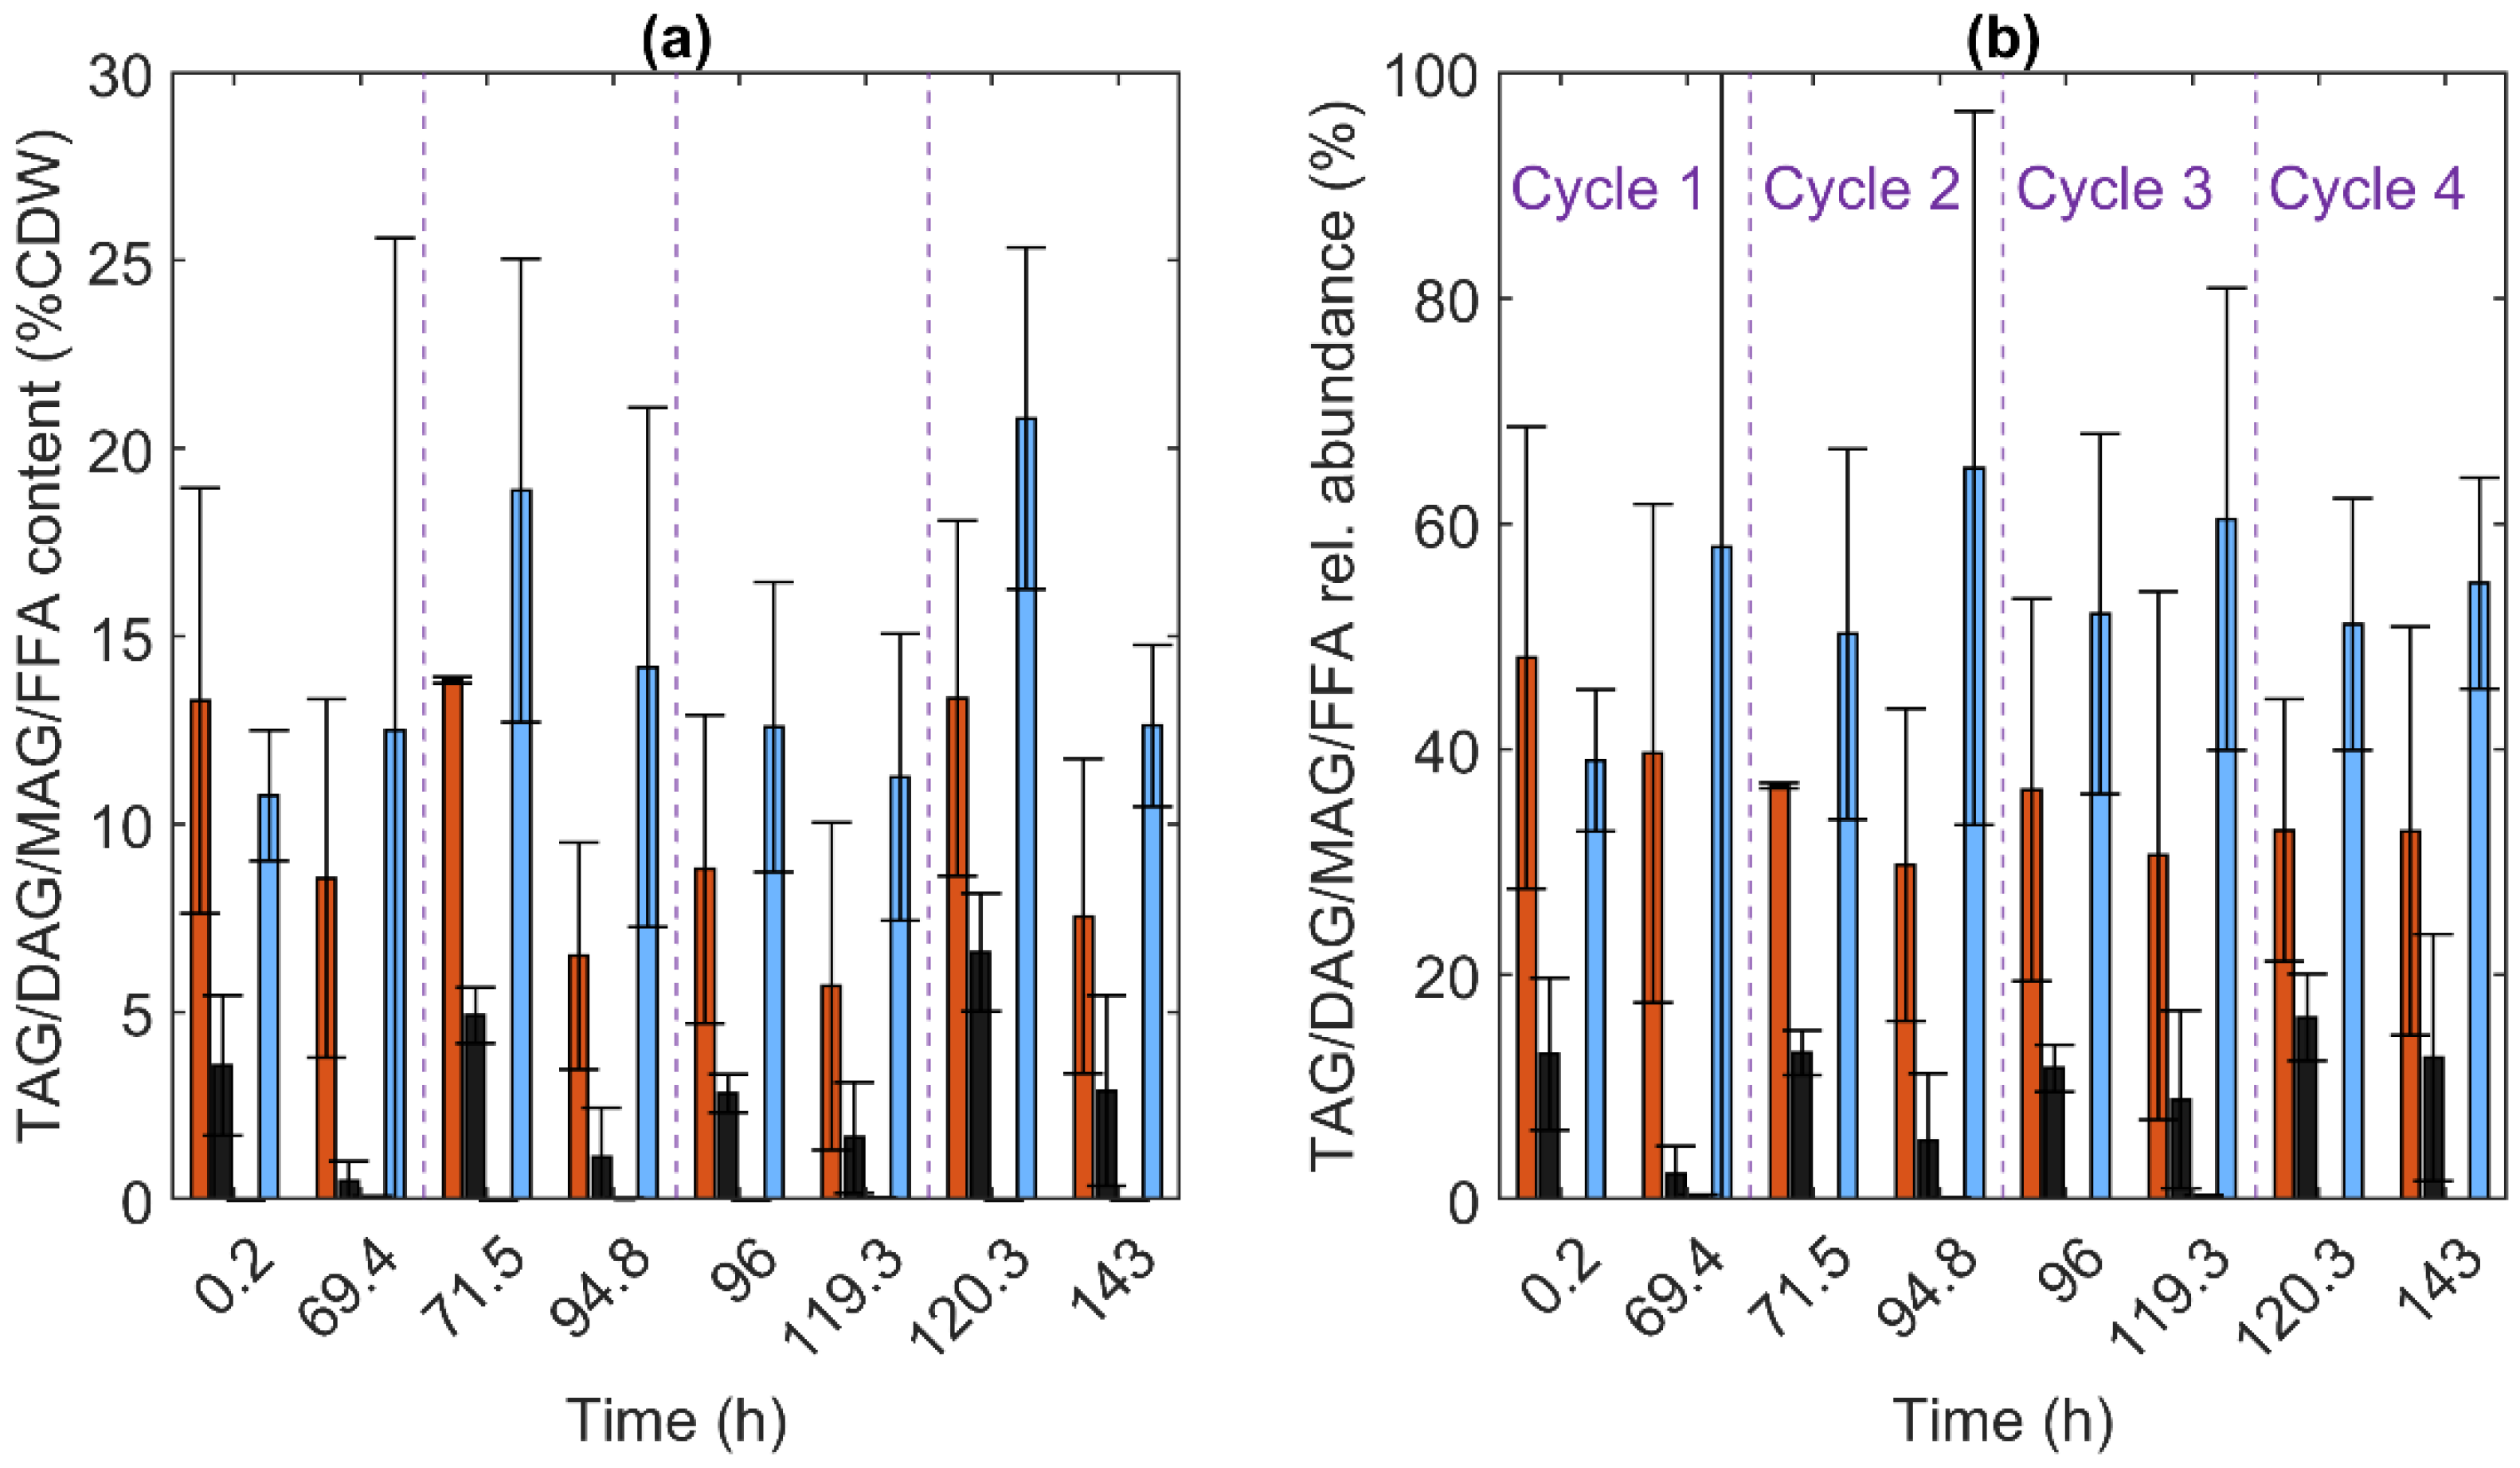
To further characterize the non-monomeric substrate consumption of both strains, the lignin, xylan, and cellulose concentration were measured before fermentation and at the end of the first cycle, as shown in Figure 5.
Tukey’s honestly significant difference procedure, as implemented in the multcompare function of Matlab 2021a, was used to evaluate whether the means (n = 2) of the initial concentration, the concentration at the end of the first cycle of R. kratochvilovae, and of C. oleaginosum differed significantly (p < 0.05). It was found that the means of R. kratochvilovae and C. oleaginosum at the end of the first cycle differed significantly from the initial concentration for all complex substrates. The yeasts thus consumed the complex substrates. However, the UV absorbances of the phenols and furans present in the wastewater caused a positive error in the measured acid-soluble lignin concentration. Therefore, the measured consumption of acid-soluble lignin might originate from the consumption of phenolics in the wastewater. As shown in Figure 5, C. oleaginosum consumed more non-monomeric substrates than R. kratochvilovae for three reasons. Partially, this was due to the experimental set-up in which it was aimed to reach a complete conversion of the monomeric substrates before the harvesting and recycling of the cells. This resulted in a duration of this first cycle, i.e., 69.4 h for C. oleaginosum instead of 28.4 h for R. kratochvilovae, which could lead to a higher consumption of non-monomeric substrates by the former. Additionally, C. oleaginosum consumed monomeric and non-monomeric substrates in parallel (see Figure 2), while, for R. kratochvilovae, the total DOC concentration decreased sharply at the end of the cycle after the monomeric compounds were mostly consumed (see Figure 1). This indicated sequential consumption of the non-monomeric and monomeric substrates by R. kratochvilovae, with a preference for the monomeric substrates. Therefore, it can be expected that the parallel consumption by C. oleaginosum is faster than the sequential consumption of monomeric and non-monomeric substrates by R. kratochvilovae. Lastly, due to the lower growth of R. kratochvilovae than C. oleaginosum during inoculum preparation in the same culture conditions, the starting cell concentration in the sequential batch of the former was 1.780 ± 0.009 × 10⁸ CFU/mL. This was significantly lower than for C. oleaginosum, which started at 2.820 ± 0.005 × 10⁸ CFU/mL. Higher viable cell concentrations generally result in faster consumption. For xylan, the difference in concentration at the end of the first cycle between R. kratochvilovae and C. oleaginosum could be proven to be statistically significant (p < 0.05), but not for acid-soluble lignin and glucan.
Based on the lignin breakdown in the first cycle, as shown in Figure 5, ligninolytic enzyme activity was expected. The ligninolytic enzyme activities (lignin peroxidase, manganese peroxidase, and laccase) were measured in the medium at the end of each cycle. Laccase activity was not detected for either yeast. As shown in Figure 6, lignin peroxidase and manganese peroxidase activity were found. The activities decreased after each cycle, except for the manganese peroxidase activity (Figure 6b) of R. kratochvilovae, which was low but stayed almost constant. In general, the measured manganese peroxidase activities (Figure 6b) were ten times lower than the initial lignin peroxidase (Figure 6a) activities, making its contribution to lignin degradation limited.
The decreasing ligninolytic enzyme activity (Figure 6) correlated with the lack of total DOC decrease observed in the last two cycles for R. kratochvilovae in Figure 1. The explanation might be that the enzymes responsible for the breakdown, i.e., lignin peroxidase, manganese peroxidase, laccase, cellulase, and xylanase, are typically released in the extracellular medium [56]. This means that, after every cycle, the enzymes were removed with the supernatant and should be resynthesized. The PWS contained only 25 mg/L of elemental nitrogen, and no additional nitrogen source was added. Therefore, it was hypothesized that the cells will use nitrogen from non-essential proteins to synthesize the hydrolytic enzymes. In Rhodotorula toruloides, the enzymes responsible for vacuolar protein degradation were upregulated under nitrogen limitation [57]. Similarly, Kourist et al. found that under nitrogen limitation, six proteases were upregulated in C. oleaginosum while six others were downregulated. They concluded that the degradation of non-essential proteins is an important strategy to cope with nitrogen limitation [58]. This confirms the aforementioned hypothesis. However, the use of non-essential proteins for extracellular enzyme synthesis makes the nitrogen supply finite, and part of it will be removed in every cycle. In contrast to R. kratochvilovae, C. oleaginosum (Figure 2) consumed a significant amount of total DOC in every cycle. The higher DOC consumption of C. oleaginosum in the second and third cycle (Figure 2) can be related to the higher lignin peroxidase activity (Figure 6a) compared to R. kratochvilovae. Why a high DOC consumption in the fourth cycle of the fermentation with C. oleaginosum was observed, although neither lignin peroxidase nor manganese peroxidase enzyme activity was present, remains unclear.

3.5. Lipids

At the beginning of the first cycle (Figure 1 and Figure 2), a significant lipid content was observed, although the inoculum medium was yeast peptone dextrose, which is a typical growth medium. However, a double concentrated medium was applied to produce a large amount of biomass, which might have led to oxygen limitation, thus also leading to lipid accumulation. For R. kratochvilovae and especially for C. oleaginosum, the lipid content after the repeated batch process was lower than the initial lipid content. Nevertheless, overall, the lipid concentration rose. In addition, it can be observed in Figure 1 and Figure 2 that the CDW increased during the repeated batch process. As the lipid content is the ratio of the lipid titer to the CDW, the reduction in lipid content was caused by the increase in CDW; thus, both lipid accumulation and biomass production occurred. Overall, a lipid production of 2.0 g/L and 0.7 g/L was obtained for R. kratochvilovae and C. oleaginosum, respectively. The most important hypothesis, i.e., the repeated addition of diluted carbon source (i.e., PWS) causes lipid accumulation, was confirmed but not in the way it was expected. Interestingly, the lipid content decreased during the cultivation phase but rose abruptly during each harvesting step. The abrupt lipid content increases coincided with the harvesting of the biomass after each cycle (Figure 1). During harvesting in the first and second cycles, for R. kratochvilovae, the increase in lipid concentration coincided with the consumption of total DOC. However, in the subsequent cycles, the lipid increase was not accompanied by a strong total DOC decrease. For C. oleaginosum, the sudden increase in lipids was not accompanied by a sudden decrease in total DOC. Therefore, the abrupt increase in lipid concentrations should result from the conversion of compounds other than the DOC in the medium.
The harvesting of the cells was performed by centrifugation, whereafter the supernatant was decanted, and an equal volume of fresh PWS was added. Samples were taken right before harvesting and immediately after resuspension of the cells in fresh PWS, and they were stored at −20 °C. For R. kratochvilovae, an additional sample of the supernatant right after centrifugation was analyzed. During the harvesting process, the fermentation broth was not aerated. This might have caused a drop in dissolved oxygen (DO), limiting the oxygen supply to the cells. A low DO concentration (25–30% of saturation) has been observed to increase lipid production from a glucose-rich nitrogen-limited medium for the oleaginous yeasts Yarrowia lipolytica [59] and Rhodotorula glutinis [60]. The lowered DO concentration decreases the beta-oxidation of the storage lipids, as oxygen is a crucial substrate in beta-oxidation [61]. Furthermore, Kavšček et al. found, for Yarrowia lipolytica, that growth was reduced at oxygen uptake rates below 11 mmol/(g·h), while lipid accumulation was only reduced at oxygen uptake rates below 6 mmol/(g·h) [62]. Thus, both lipid degradation and growth are inhibited under oxygen limitation, while lipid accumulation remains unaffected. This means that the cells can only perform lipid accumulation during the oxygen-limited harvesting step.
However, these findings do not explain why lipids are consumed during each cycle. It is known that nitrogen limitation (C/N = 556 g/g) with a high DO concentration has also been found to induce lipid accumulation [59,60]. For Rhodotorula toruloides, the genes responsible for lipid degradation, i.e., lipolysis, beta-oxidation, and the glyoxylate shunt, were upregulated under nitrogen limitation in the glucose-rich medium [57]. However, in fungi, perilipin-like proteins that surround the lipid droplets normally protect the lipids against degradation [63]. In Rhodotorula toruloides, these perilipin-like proteins are upregulated in a glucose-rich nitrogen-limited medium. However, perilipin loses its protective function during starvation, as it is phosphorylated by protein kinase A [63]. The lipid consumption can thus be explained by the limited availability of carbon, as only 1.09 g of carbon/L is available as a monomeric, easily degradable substrate. Moreover, the presence of toxic phenolics and furans increases the energy needed for maintenance [64]. Therefore, the cells experience starvation and will use their stored lipids as additional carbon and energy sources. Currently, there is no evidence in the literature that confirms or opposes the proposed mechanism for the abrupt lipid accumulation by C. oleaginosum.
The hypothesis that lipids are degraded during each cycle but synthesized during harvesting was further confirmed for C. oleaginosum by the %CDW of triacylglycerides (TAGs), diacylglycerides (DAGs), monoacylglycerides (MAGs), and free fatty acids (FFAs) in Figure 7.
During each of the four cycles, the TAGs per cell dry weight (Figure 8a) appeared to decrease as expected due to the carbon limitation. The difference between the TAGs in the %CDW at the beginning and the end of each cycle was further investigated using Tukey’s honestly significant difference procedure. The difference in TAGs in the %CDW was statistically significant (p < 0.05) for the first, second, and fourth cycles. Prior to Tukey’s honestly significant difference procedure, outliers were removed. Outliers were detected using the isoutlier function in Matlab 2021a, where it is defined as a point that is three scaled median absolute deviations away from the median of its group.
When comparing the end of each cycle with the beginning of the next cycle in Figure 7, it can be observed that the %CDW and relative abundance of TAGs increased again. Using the same procedure as described above, the increase in TAGs (%CDW) between the end of a cycle and the beginning of the next cycle was found to be significant (p < 0.05) between cycles one and two and between three and four. The increase in the relative abundance of TAGs could not be proven to be statistically significant. The increased %CDW TAGs indicate that the cells shifted their metabolism to TAGs synthesis during the harvesting between cycles.
Nevertheless, further research is necessary to fully grasp the lipid accumulation process that occurred in the repeated batch fermentation.
Throughout the whole process, five to ten percent of the CDW was present as fatty acids (Figure 8a), with a significant increase by the end of each cycle, where fatty acids make up to 70% of the total lipid content (Figure 8b). This 70% relative abundance of fatty acids is a large percentage, compared to the less than one percent of fatty acids in C. oleaginosum ATCC 20509, under nitrogen-limited conditions in a glucose-rich medium [65]. The reason for the large fatty acids content of 10% is most likely carbon limitation, which results in the breakdown of the TAGs. Another reason for the high FFAs content might be the high pH (8–9) at the end of each cycle. The cells might increase in fatty acid content by their de novo synthesis or by TAGs degradation in order to compensate for the increased pH in the medium. Similarly, for Candida tropicalis, a high pH stimulates the production of long-chain dicarboxylic acids [66,67]. Furthermore, high pH has been observed to increase intracellular lipase production in some yeasts [68]. The high fatty acid content in our research might be caused by TAGs hydrolysis to compensate for the high pH.
For R. kratochvilovae, a similar lipid profile can be observed in Figure 8. Again the %CDW and relative abundance of TAGs appear to decrease in each cycle and increase between cycles, i.e., during harvest. However, these effects could not be proven statistically. Neither the FFA content nor the FFA abundance appeared to follow any significant trend. Currently, literature about the TAG, DAG, MAG, and FFA distribution in R. kratochvilovae is lacking.
For C. oleaginosum, the accumulated lipids at the end of the fourth cycle consisted primarily of C18:1 (44 wt%), followed by C16:0 (23 wt%), C18:2 (19 wt%), C18:0 (12 wt%), and C16:1 (1 wt%). The lipid composition is similar to the composition obtained by Yaguchi et al. when C. oleaginosum was grown with aromatics as a sole carbon source [32]. Although, in the current study, more C16:0, and less C16:1 were obtained. For R. kratochvilovae, the lipids consisted primarily of C18:0 (72 wt%), followed by C18:1 (10 wt%), C16:1 (14 wt%), C18:2 (2 wt%), and C16:0 (2 wt%). For R. kratochvilovae, literature on the lipid composition when lipids are accumulated with aromatics as a sole carbon source is lacking.

4. Conclusions

In the research presented here, we evaluated a repeated batch strategy as a new strategy to accumulate lipids from dilute streams, i.e., wastewater. Furthermore, we investigated the suitability of Cutaneotrichosporon oleaginosum ATCC20508 and Rhodotorula kratochvilovae EXF7516 for the simultaneous lipid accumulation and treatment of lignocellulosic wastewaters.
Both yeasts showed their potential for application in lignocellulosic wastewater valorization, as they both removed all investigated compounds, and the PWS only slightly inhibited their growth.
It was hypothesized that the repeated batch strategy would allow for significant lipid accumulation from a dilute stream through the repeated addition of the dilute stream while recycling the cells. We found that the lipid concentration rose in every cycle of the repeated batch, confirming the above hypothesis. As in previous research, dilute streams were supplemented with a high-value carbon source, i.e., glucose, to achieve significant lipid production. Secondly, we showed that, in the investigated repeated batch process, the nitrogen limitation that is necessary for lipid accumulation limited the ligninolytic enzyme production and thus limited the use of non-monomeric substrates. As a result, the amount of nitrogen added to the medium will have to be chosen carefully to achieve maximal lipid accumulation and non-monomeric substrate consumption. Furthermore, we uncovered that the stress conditions during harvesting, probably oxygen limitation, were necessary for lipid production under carbon limiting conditions. However, further research is needed to confirm the proposed mechanism of oxygen limitation.
In the repeated batch process, C. oleaginosum and R. kratochvilovae produced 0.7 g/L and 2 g/L in lipids, respectively. This is significantly less than the lipid production obtained when lignocellulosic wastewaters are supplemented with high-value carbon sources, where lipid productions of up to 8.56 g/L are reached [12]. However, there are two reasons for the limited lipid production. Firstly, it must be taken into account that the phenolic waste stream contains only 1.5 g C/L of monomeric carbon and 8–12.5 g C/L of non-monomeric carbon. Secondly, it must be considered that lipids were consumed during a large part of every cycle. Therefore, the repeated batch process must be further optimized to increase lipid production. Furthermore, to investigate the influence of oxygen on lipid accumulation, in future research, an oxygen limitation-based repeated batch fermentation strategy should be developed that achieves the high lipid productivity, as was observed in the harvest phases, throughout the whole fermentation.

Supplementary Materials

The following supporting information can be downloaded at: https://www.mdpi.com/article/10.3390/fermentation8050204/s1, Figure S1: cumulative percentage of wood passing through the sieves.

Author Contributions

Conceptualization, W.B., I.C., J.D. and S.E.V.; methodology, W.B., I.C., N.W. and J.G.; formal analysis, W.B.; investigation, W.B. and I.C.; resources, N.G.-C. and A.R.; data curation, W.B.; writing—original draft preparation, W.B.; writing—review and editing, I.C., J.D., A.R. and N.G.-C.; visualization, W.B.; supervision, I.C., J.D. and S.E.V.; project administration, I.C. and W.B.; funding acquisition, W.B. and I.C. All authors have read and agreed to the published version of the manuscript.

Funding

This research was funded by the strategic basic research grant of the Research Foundation-Flanders, file number 68591 and the University of Antwerp BOF project DARLignin FFB190122. The APC was funded by the strategic basic research grant of the Research Foundation-Flanders, file number 68591.

Institutional Review Board Statement

Not applicable.

Informed Consent Statement

Not applicable.

Data Availability Statement

The data is contained within the article and the Supplementary Material.

Acknowledgments

The authors wish to express their gratitude towards, the COST action CA22719 Yeast4Bio who supported this work.

Conflicts of Interest

The authors declare no conflict of interest. The sponsors had no role in the design, execution, interpretation, or writing of the study.

References

  1. Statista. Oil Consumption Worldwide from 1998 to 2019. Available online: https://www.statista.com/statistics/265239/global-oil-consumption-in-barrels-per-day/ (accessed on 15 April 2021).
  2. Scheller, H.V.; Ulvskov, P. Hemicelluloses. Annu. Rev. Plant Biol. 2010, 61, 263–289. [Google Scholar] [CrossRef] [PubMed]
  3. Sannigrahi, P.; Ragauskas, A.J.; Tuskan, G.A. Poplar as a feedstock for biofuels: A review of compositional characteristics. Biofuels Bioprod. Biorefin. 2010, 4, 209–226. [Google Scholar] [CrossRef]
  4. Isikgor, F.H.; Becer, C.R. Lignocellulosic biomass: A sustainable platform for the production of bio-based chemicals and polymers. Polym. Chem. 2015, 6, 4497–4559. [Google Scholar] [CrossRef] [Green Version]
  5. Wittner, N.; Broos, W.; Bauwelinck, J.; Slezsák, J.; Vlaeminck, S.E.; Cornet, I. Enhanced fungal delignification and enzymatic digestibility of poplar wood by combined CuSO4 and MnSO4 supplementation. Process Biochem. 2021, 108, 129–137. [Google Scholar] [CrossRef]
  6. Zoghlami, A.; Paës, G. Lignocellulosic Biomass: Understanding Recalcitrance and Predicting Hydrolysis. Front. Chem. 2019, 7, 874. [Google Scholar] [CrossRef] [Green Version]
  7. Wells, T.; Wei, Z.; Ragauskas, A. Bioconversion of lignocellulosic pretreatment effluent via oleaginous Rhodococcus opacus DSM 1069. Biomass Bioenergy 2015, 72, 200–205. [Google Scholar] [CrossRef] [Green Version]
  8. Tobin, T.; Gustafson, R.; Bura, R.; Gough, H.L. Integration of wastewater treatment into process design of lignocellulosic biorefineries for improved economic viability. Biotechnol. Biofuels 2020, 13, 24. [Google Scholar] [CrossRef]
  9. Scott, F.; Quintero, J.; Morales, M.; Conejeros, R.; Cardona, C.; Aroca, G. Process design and sustainability in the production of bioethanol from lignocellulosic materials. Electron. J. Biotechnol. 2013, 16, 13. [Google Scholar] [CrossRef]
  10. Amirsadeghi, M.; Shields-Menard, S.; French, T.; Hernandez, R. Lipid Production by Rhodotorula glutinis from Pulp and Paper Wastewater for Biodiesel Production. J. Sustain. Bioenergy Syst. 2015, 5, 114–125. [Google Scholar] [CrossRef] [Green Version]
  11. Jarboui, R.; Baati, H.; Fetoui, F.; Gargouri, A.; Gharsallah, N.; Ammar, E. Yeast performance in wastewater treatment: Case study ofRhodotorula mucilaginosa. Environ. Technol. 2012, 33, 951–960. [Google Scholar] [CrossRef]
  12. Patel, A.; Arora, N.; Pruthi, V.; Pruthi, P.A. Biological treatment of pulp and paper industry effluent by oleaginous yeast integrated with production of biodiesel as sustainable transportation fuel. J. Clean. Prod. 2017, 142, 2858–2864. [Google Scholar] [CrossRef]
  13. Yousuf, A.; Sannino, F.; Addorisio, V.; Pirozzi, D. Microbial Conversion of Olive Oil Mill Wastewaters into Lipids Suitable for Biodiesel Production. J. Agric. Food Chem. 2010, 58, 8630–8635. [Google Scholar] [CrossRef] [PubMed]
  14. Zhang, X.; Liu, M.; Zhang, X.; Tan, T. Microbial lipid production and organic matters removal from cellulosic ethanol wastewater through coupling oleaginous yeasts and activated sludge biological method. Bioresour. Technol. 2018, 267, 395–400. [Google Scholar] [CrossRef] [PubMed]
  15. Neste. Palm and Oil Seed Prices|Neste. Available online: https://www.neste.com/investors/market-data/palm-and-rapeseed-oil-prices (accessed on 27 March 2022).
  16. IndexMundi. Soybean Oil Monthly Price—US Dollars per Metric Ton. Available online: https://www.indexmundi.com/commodities/?commodity=soybean-oil (accessed on 27 March 2022).
  17. Cargill. Arachidonic Acid. Available online: https://www.cargill.com/food-bev/emea/arachidonic-acid (accessed on 24 October 2021).
  18. Ratledge, C. Microbial oils: An introductory overview of current status and future prospects. OCL 2013, 20, D602. [Google Scholar] [CrossRef]
  19. DSM. Infant Nutrition. Available online: https://www.dsm.com/human-nutrition/en/events/eln-campaign.html (accessed on 24 October 2021).
  20. Ochsenreither, K.; Glück, C.; Stressler, T.; Fischer, L.; Syldatk, C. Production Strategies and Applications of Microbial Single Cell Oils. Front. Microbiol. 2016, 7, 1539. [Google Scholar] [CrossRef] [Green Version]
  21. Dusser, P. The European Energy Policy for 2020–2030 RED II: What future for vegetable oil as a source of bioenergy? OCL 2019, 26, 51. [Google Scholar] [CrossRef] [Green Version]
  22. Koutinas, A.A.; Chatzifragkou, A.; Kopsahelis, N.; Papanikolaou, S.; Kookos, I.K. Design and techno-economic evaluation of microbial oil production as a renewable resource for biodiesel and oleochemical production. Fuel 2014, 116, 566–577. [Google Scholar] [CrossRef]
  23. Van Winden, W.; Noorman, H. Zero Concepts in Bioprocessing. In Proceedings of the European Forum for Industrial Biotechnology, Online, 9 October 2020. [Google Scholar]
  24. Straathof, A.J.J.; Wahl, S.A.; Benjamin, K.R.; Takors, R.; Wierckx, N.; Noorman, H.J. Grand Research Challenges for Sustainable Industrial Biotechnology. Trends Biotechnol. 2019, 37, 1042–1050. [Google Scholar] [CrossRef]
  25. Yaguchi, A.; Robinson, A.; Mihealsick, E.; Blenner, M. Metabolism of aromatics by Trichosporon oleaginosus while remaining oleaginous. Microb. Cell Factories 2017, 16, 206. [Google Scholar] [CrossRef] [Green Version]
  26. Patel, A.; Sartaj, K.; Arora, N.; Pruthi, V.; Pruthi, P.A. Biodegradation of phenol via meta cleavage pathway triggers de novo TAG biosynthesis pathway in oleaginous yeast. J. Hazard. Mater. 2017, 340, 47–56. [Google Scholar] [CrossRef]
  27. Yu, X.; Zheng, Y.; Xiong, X.; Chen, S. Co-utilization of glucose, xylose and cellobiose by the oleaginous yeast Cryptococcus curvatus. Biomass Bioenergy 2014, 71, 340–349. [Google Scholar] [CrossRef]
  28. Jiru, T.M.; Groenewald, M.; Pohl, C.; Steyn, L.; Kiggundu, N.; Abate, D. Optimization of cultivation conditions for biotechnological production of lipid by Rhodotorula kratochvilovae (syn, Rhodosporidium kratochvilovae) SY89 for biodiesel preparation. 3 Biotech 2017, 7, 145. [Google Scholar] [CrossRef] [PubMed] [Green Version]
  29. Gong, Z.; Shen, H.; Zhou, W.; Wang, Y.; Yang, X.; Zhao, Z.K. Efficient conversion of acetate into lipids by the oleaginous yeast Cryptococcus curvatus. Biotechnol. Biofuels 2015, 8, 189. [Google Scholar] [CrossRef] [PubMed]
  30. Gong, G.; Zhang, X.; Tan, T. Simultaneously enhanced intracellular lipogenesis and β-carotene biosynthesis of Rhodotorula glutinis by light exposure with sodium acetate as the substrate. Bioresour. Technol. 2020, 295, 122274. [Google Scholar] [CrossRef]
  31. Ali, S.S.; Al-Tohamy, R.; Koutra, E.; El-Naggar, A.H.; Kornaros, M.; Sun, J.Z. Valorizing lignin-like dyes and textile dyeing wastewater by a newly constructed lipid-producing and lignin modifying oleaginous yeast consortium valued for biodiesel and bioremediation. J. Hazard. Mater. 2021, 403, 123575. [Google Scholar] [CrossRef]
  32. Yaguchi, A.; Franaszek, N.; O’Neill, K.; Lee, S.; Sitepu, I.; Boundy-Mills, K.; Blenner, M. Identification of oleaginous yeasts that metabolize aromatic compounds. J. Ind. Microbiol. Biotechnol. 2020, 47, 801–813. [Google Scholar] [CrossRef]
  33. Kosa, M.; Ragauskas, A.J. Lignin to lipid bioconversion by oleaginous Rhodococci. Green Chem. 2013, 15, 2070–2074. [Google Scholar] [CrossRef]
  34. Xenopoulos, E.; Giannikakis, I.; Chatzifragkou, A.; Koutinas, A.; Papanikolaou, S. Lipid Production by Yeasts Growing on Commercial Xylose in Submerged Cultures with Process Water Being Partially Replaced by Olive Mill Wastewaters. Processes 2020, 8, 819. [Google Scholar] [CrossRef]
  35. Mathew, L.; Salustra, U.; Cheryl, S.; Bonnee, R. The Oleaginous Red Yeast Rhodotorula/Rhodosporidium: A Factory for Industrial Bioproducts. In Yeasts in Biotechnology; InTech Open: London, UK, 2019. [Google Scholar] [CrossRef] [Green Version]
  36. Ribeiro, J.E.S.; Sant’Ana, A.M.D.S.; Martini, M.; Sorce, C.; Andreucci, A.; de Melo, D.J.N.; da Silva, F.L.H. Rhodotorula glutinis cultivation on cassava wastewater for carotenoids and fatty acids generation. Biocatal. Agric. Biotechnol. 2019, 22, 101419. [Google Scholar] [CrossRef]
  37. IndexMundi. Sugar Monthly Price—US Dollars per Kilogram. Available online: https://www.indexmundi.com/commodities/?commodity=sugar (accessed on 27 March 2022).
  38. Yang, Q.; Zhang, H.; Li, X.; Wang, Z.; Xu, Y.; Ren, S.; Chen, X.; Xu, Y.; Hao, H.; Wang, H. Extracellular enzyme production and phylogenetic distribution of yeasts in wastewater treatment systems. Bioresour. Technol. 2012, 129, 264–273. [Google Scholar] [CrossRef]
  39. Duarte, A.W.F.; Dayo-Owoyemi, I.; Nobre, F.S.; Pagnocca, F.C.; Chaud, L.C.S.; Pessoa, A.; Felipe, M.D.G.A.; Sette, L.D. Taxonomic assessment and enzymes production by yeasts isolated from marine and terrestrial Antarctic samples. Extremophiles 2013, 17, 1023–1035. [Google Scholar] [CrossRef] [PubMed]
  40. Oikawa, T.; Tsukagawa, Y.; Chino, M.; Soda, K. Increased Transglycosylation Activity of Rhodotorula glutinis Endo-β-Glucanase in Media Containing Organic Solvent. Biosci. Biotechnol. Biochem. 2001, 65, 1889–1892. [Google Scholar] [CrossRef] [PubMed]
  41. Hof, H. Rhodotorula spp. in the gut—Foe or friend? GMS Infect. Dis. 2019, 7, Doc02. [Google Scholar] [CrossRef] [PubMed]
  42. Jacquet, N.; Vanderghem, C.; Blecker, C.; Paquot, M. La steam explosion: Application en tant que prétraitement de la matière cellulosique. Biotechnol. Agron. Soc. Environ. 2010, 14, 561–566. [Google Scholar]
  43. Transgenomic. Chromatography Products. p. 25. Available online: https://www.obrnutafaza.hr/transgenomic/Transgenomic-Overview.pdf (accessed on 23 April 2022).
  44. Sluiter, A.; Hames, B.; Ruiz, R.; Scarlata, C.; Sluiter, J.; Templeton, D.; Crocker, D. Determination of structural carbohydrates and lignin in biomass. In Laboratory Analytical Procedure (LAP); National Renewable Energy Laboratory: Golden, CO, USA, 2008. Available online: https://nrel-primo.hosted.exlibrisgroup.com/primo-explore/fulldisplay?docid=NREL_ALMA5148083920003216&context=L&vid=Pubs&lang=en_US&search_scope=PUBS&adaptor=Local%20Search%20Engine&tab=default_tab&query=any,contains,Determination%20of%20structural%20carbohydrates%20and%20lignin%20in%20biomass&offset=0 (accessed on 23 April 2022).
  45. Bauwelinck, J.; Caluwé, M.; Wijnants, M.; Wittner, N.; Broos, W.; Dries, J.; Akkermans, V.; Tavernier, S.; Cornet, I. Chocolate industry side streams as a valuable feedstock for microbial long-chain dicarboxylic acid production. Biochem. Eng. J. 2020, 167, 107888. [Google Scholar] [CrossRef]
  46. Glenn, J.K.; Gold, M.H. Purification and characterization of an extracellular Mn(II)-dependent peroxidase from the lignin-degrading basidiomycete, Phanerochaete chrysosporium. Arch. Biochem. Biophys. 1985, 242, 329–341. [Google Scholar] [CrossRef]
  47. Vares, T.; Kalsi, M.; Hatakka, A. Lignin Peroxidases, Manganese Peroxidases, and Other Ligninolytic Enzymes Produced by Phlebia radiata during Solid-State Fermentation of Wheat Straw. Appl. Environ. Microbiol. 1995, 61, 3515–3520. [Google Scholar] [CrossRef] [Green Version]
  48. Elisashvili, V.; Kachlishvili, E.; Tsiklauri, N.; Metreveli, E.; Khardziani, T.; Agathos, S.N. Lignocellulose-degrading enzyme production by white-rot Basidiomycetes isolated from the forests of Georgia. World J. Microbiol. Biotechnol. 2009, 25, 331–339. [Google Scholar] [CrossRef]
  49. Singh, A.K.; Bilal, M.; Iqbal, H.M.N.; Meyer, A.S.; Raj, A. Bioremediation of lignin derivatives and phenolics in wastewater with lignin modifying enzymes: Status, opportunities and challenges. Sci. Total Environ. 2021, 777, 145988. [Google Scholar] [CrossRef]
  50. Reed, N.R.; Kwok, E.S.C. Furfural. In Encyclopedia of Toxicology, 3rd ed.; Wexler, P., Ed.; Academic Press: Oxford, UK, 2014; pp. 685–688. [Google Scholar] [CrossRef]
  51. Abdel-Rahman, M.A.; Tashiro, Y.; Sonomoto, K. Recent advances in lactic acid production by microbial fermentation processes. Biotechnol. Adv. 2013, 31, 877–902. [Google Scholar] [CrossRef]
  52. Ravi, K.; García-Hidalgo, J.; Gorwa-Grauslund, M.F.; Liden, G. Conversion of lignin model compounds by Pseudomonas putida KT2440 and isolates from compost. Appl. Microbiol. Biotechnol. 2017, 101, 5059–5070. [Google Scholar] [CrossRef] [PubMed] [Green Version]
  53. Watcharawipas, A.; Watanabe, D.; Takagi, H. Sodium Acetate Responses in Saccharomyces cerevisiae and the Ubiquitin Ligase Rsp5. Front. Microbiol. 2018, 9, 2495. [Google Scholar] [CrossRef] [PubMed]
  54. Mollapour, M.; Piper, P.W. Hog1 Mitogen-Activated Protein Kinase Phosphorylation Targets the Yeast Fps1 Aquaglyceroporin for Endocytosis, Thereby Rendering Cells Resistant to Acetic Acid. Mol. Cell. Biol. 2007, 27, 6446–6456. [Google Scholar] [CrossRef] [PubMed] [Green Version]
  55. Van Der Pol, E.C.; Bakker, R.R.; Baets, P.; Eggink, G. By-products resulting from lignocellulose pretreatment and their inhibitory effect on fermentations for (bio)chemicals and fuels. Appl. Microbiol. Biotechnol. 2014, 98, 9579–9593. [Google Scholar] [CrossRef]
  56. Falade, A.O.; Nwodo, U.U.; Iweriebor, B.C.; Green, E.; Mabinya, L.V.; Okoh, A. Lignin peroxidase functionalities and prospective applications. MicrobiologyOpen 2016, 6, e00394. [Google Scholar] [CrossRef] [PubMed] [Green Version]
  57. Zhu, Z.; Zhang, S.; Liu, H.; Shen, H.; Lin, X.; Yang, F.; Zhou, Y.; Jin, G.; Ye, M.; Zou, H.; et al. A multi-omic map of the lipid-producing yeast Rhodosporidium toruloides. Nat. Commun. 2012, 3, 1112. [Google Scholar] [CrossRef] [PubMed] [Green Version]
  58. Kourist, R.; Bracharz, F.; Lorenzen, J.; Kracht, O.N.; Chovatia, M.; Daum, C.; Deshpande, S.; Lipzen, A.; Nolan, M.; Ohm, R.A.; et al. Genomics and Transcriptomics Analyses of the Oil-Accumulating Basidiomycete Yeast Trichosporon oleaginosus: Insights into Substrate Utilization and Alternative Evolutionary Trajectories of Fungal Mating Systems. mBio 2015, 6, e00918-15. [Google Scholar] [CrossRef] [Green Version]
  59. Magdouli, S.; Brar, S.K.; Blais, J.F. Morphology and rheological behaviour of Yarrowia lipolytica: Impact of dissolved oxygen level on cell growth and lipid composition. Process Biochem. 2018, 65, 1–10. [Google Scholar] [CrossRef]
  60. Yen, H.-W.; Zhang, Z. Effects of dissolved oxygen level on cell growth and total lipid accumulation in the cultivation of Rhodotorula glutinis. J. Biosci. Bioeng. 2011, 112, 71–74. [Google Scholar] [CrossRef]
  61. Talley, J.; Mohiuddin, S. Fatty Acid Oxidation. Available online: https://www.ncbi.nlm.nih.gov/books/NBK556002/ (accessed on 27 March 2021).
  62. Kavšček, M.; Bhutada, G.; Madl, T.; Natter, K. Optimization of lipid production with a genome-scale model of Yarrowia lipolytica. BMC Syst. Biol. 2015, 9, 72. [Google Scholar] [CrossRef] [Green Version]
  63. Wang, C.; St. Leger, R.J. The Metarhizium anisopliae Perilipin Homolog MPL1 Regulates Lipid Metabolism, Appressorial Turgor Pressure, and Virulence. J. Biol. Chem. 2007, 282, 21110–21115. [Google Scholar] [CrossRef] [PubMed] [Green Version]
  64. Caspeta, L.; Castillo, T.; Nielsen, J. Modifying Yeast Tolerance to Inhibitory Conditions of Ethanol Production Processes. Front. Bioeng. Biotechnol. 2015, 3, 184. [Google Scholar] [CrossRef] [PubMed] [Green Version]
  65. Capusoni, C.; Rodighiero, V.; Cucchetti, D.; Galafassi, S.; Bianchi, D.; Franzosi, G.; Compagno, C. Characterization of lipid accumulation and lipidome analysis in the oleaginous yeasts Rhodosporidium azoricum and Trichosporon oleaginosus. Bioresour. Technol. 2017, 238, 281–289. [Google Scholar] [CrossRef] [PubMed]
  66. Liu, S.; Li, C.; Xie, L.; Cao, Z. Intracellular pH and metabolic activity of long-chain dicar☐ylic acid-producing yeastCandida tropicalis. J. Biosci. Bioeng. 2003, 96, 349–353. [Google Scholar] [CrossRef]
  67. Liu, S.; Li, C.; Fang, X.; Cao, Z. Optimal pH control strategy for high-level production of long-chain α,ω-dicarboxylic acid by Candida tropicalis. Enzym. Microb. Technol. 2004, 34, 73–77. [Google Scholar] [CrossRef]
  68. Iftikhar, T.; Niaz, M.; Zia, M.A.; Haq, I.U. Production of extracellular lipases by Rhizopus oligosporus in a stirred fermentor. Braz. J. Microbiol. 2010, 41, 1124–1132. [Google Scholar] [CrossRef] [Green Version]
Figure 1. (--■--) Cell dry weight (CDW), (-●-) total dissolved organic carbon DOC, (--●--) monomeric DOC as measured by HPLC, (--▲--) lipid titer, (-▲-) lipid content, and (-■-) CFU for the repeated batch experiment with R. kratochvilovae. Vertical lines (···) indicate the start of the harvest of the cells. Vertical lines (- - -) indicate the end of the harvest and the start of the second, third, and fourth cycle. Error bars represent the standard deviation of three analytical repeats, except for the CFU, where only two analytical repeats were performed. The monomeric substrate concentrations were measured once.
Fermentation 08 00204 g001
Figure 2. (--■--) CDW, (-●-) total DOC, (--●--) monomeric DOC as measured by HPLC, (--▲--) lipid titer, (-▲-) lipid content, and (-■-) CFU for the repeated batch experiment with C. oleaginosum. Vertical lines (···) indicate the start of the harvest of the cells. Vertical lines (- - -) indicate the end of the harvest and the start of the second, third, and fourth cycle. Error bars represent the standard deviation of three analytical repeats, except for the CFU, where only two analytical repeats were performed. The monomeric substrate concentrations were measured once.
Fermentation 08 00204 g002
Figure 3. Substrate consumption by R. kratochvilovae as measured by HPLC, with (a) presenting the concentration of (-x-) 4-hydroxybenzoic acid, (- -+- -) glucose, (- -*- -) xylose, (- -x- -) formic acid, (--□--) acetic acid, and (b) presenting the concentration of (-○-) 5-HMF, (-*-) 3,4-dihydroxybenzaldehyde, (-□-) vanillic acid, (-♢-) syringic acid, (-△-) vanillin, and (- -○- -) syringaldehyde. Vertical dotted lines (···) indicate the start of the harvest phase, while vertical dash-dotted lines (-·-·) indicate the start of the second, third, and fourth cycles. The concentrations presented are the result of one measurement.
Fermentation 08 00204 g003
Figure 4. Substrate consumption by C. oleaginosum as measured by HPLC, with (a) presenting the concentration of (-x-) 4-hydroxybenzoic acid, (- -+- -) glucose, (- -*- -) xylose, (- -x- -) formic acid, (--□--) acetic acid, and (b) presenting the concentration of (-○-) 5-HMF, (-*-) 3,4-dihydroxybenzaldehyde, (-□-) vanillic acid, (-♢-) syringic acid, (-△-) vanillin, and (- -○- -) syringaldehyde. Vertical dotted lines (···) indicate the start of the harvest phase, while vertical dash-dotted lines (-·-·) indicate the start of the second, third, and fourth cycle. The concentrations presented are the result of one measurement.
Fermentation 08 00204 g004
Figure 5. Concentrations of the non-monomeric substrates, i.e., acid-soluble lignin, acid-insoluble lignin, xylan, and glucan () before fermentation and () at the end of the first cycle for R. kratochvilovae (R.k.) and (□) C. oleaginosum (C.o.). Due to the presence of phenolics and furans in the waste stream, the acid-soluble lignin was overestimated. The concentrations are the average of three analytical repeats, and the error bars present the standard deviation.
Fermentation 08 00204 g005
Figure 6. Ligninolytic enzyme activity for (a) lignin peroxidase and (b) manganese peroxidase in each cycle for R. kratochvilovae () and C. oleaginosum (□). The activities are the average of three analytical repeats, the error bars present the standard deviation.
Fermentation 08 00204 g006
Figure 7. Evolution of (a) the %CDW of lipids and (b) the relative abundance of lipids, with () triacylglycerides (TAGs), () diacylglycerides (DAGs), (□) monoacylglycerides (MAGs), and () free fatty acids (FFAs) for C. oleaginosum during the fermentation. Vertical dashed lines (--) indicate the end of each cycle. The %CDW and relative abundance are the averages of three analytical repeats, the error bars present the standard deviation. Outliers, points that were three scaled median absolute deviations away from the median of its group, were removed.
Fermentation 08 00204 g007
Figure 8. Evolution of (a) the %CDW of lipids and (b) the relative abundance of lipids, with () triacylglycerides (TAGs), () diacylglycerides (DAGs), (□) monoacylglycerides (MAGs), and () free fatty acids (FFAs) for R. kratochvilovae during the fermentation. Vertical dashed lines (--) indicate the end of each cycle. The %CDW and relative abundance are the averages of three analytical repeats, the error bars present the standard deviation. Outliers, points that were three scaled median absolute deviations away from the median of its group, were removed.
Fermentation 08 00204 g008
Table 1. Composition of the investigated PWS derived from steam explosion of poplar wood.
CompoundConcentration 1 (mg/L)OC 2 Concentration 1 (mg C/L)
MONOMERIC
Furans
5-HMF19.8 ± 0.111.131 ± 0.06
Furfural29.7 ± 0.118.6 ± 0.06
Phenolics
3,4-Dihydroxybenzaldehyde7 ± 04.13 ± 0
4-Hydroxybenzoic acid365 ± 2222 ± 1
4-Hydroxybenzaldehyde6.1 ± 0.24.2 ± 0.1
Vanillic acid10.8 ± 0.162.0 ± 0.05
Syringic acid2.78 ± 0.031.52 ± 0.02
Vanillin6.6 ± 0.84.2 ± 0.5
Syringaldehyde36.9 ± 0. 421.9 ± 0.2
Sugars
Glucose77.97 ± 0.0531.19 ± 0.02
Xylose419 ± 2168 ± 1
Organic acids
Formic acid546 ± 40142 ± 10
Acetic acid1134 ± 6454 ± 2
NON-MONOMERIC
Lignin 36064 ± 3721058 ± 762
Acid soluble lignin 44234 ± 343NA
Acid Insoluble lignin1830 ± 144NA
Xylan10,853 ± 8624934 ± 392
Glucan390 ± 4175 ± 17
TOTAL OC (MEASURED) 7255 ± 653
Monomeric OC 1089 ± 11
Non-monomeric OC 5 6166 ± 653
TOTAL NITROGEN IN mg N/L25 ± 3
C/N RATIO IN g/g290 ± 44
1 = Concentration ± standard deviation. For monomeric substrates, the standard deviations were calculated from their respective calibration curves. The standard deviation of the concentration of non-monomeric substrates and total nitrogen was calculated from the two analytical repeats that were performed. For the total organic carbon, the standard deviation was calculated from three analytical repeats. 2 = Organic carbon is abbreviated as OC. 3 = The exact elemental composition of lignin in the poplar wood used in this study is unknown. Therefore, the lignin’s OC concentration was calculated as the non-monomeric OC concentration, minus the xylan OC and glucan OC concentration. 4 = The phenolics and furans in the waste stream interfered with the insoluble lignin determination, resulting in an overestimation of the acid-soluble lignin. 5 = The non-monomeric organic carbon concentration cannot be measured directly. Therefore, it was calculated as the difference between the monomeric organic carbon and the total organic carbon. NA = not available. The organic carbon concentration of the acid soluble lignin and acid insoluble lignin was not measured.
Publisher’s Note: MDPI stays neutral with regard to jurisdictional claims in published maps and institutional affiliations.

