Article

Recombinant Protein Production in E. coli Using the phoA Expression System

Research Group Integrated Bioprocess Development, Institute of Chemical, Environmental and Bioscience Engineering, TU Wien, Gumpendorferstraße 1a, 1060 Vienna, Austria
*
Author to whom correspondence should be addressed.
These authors contributed equally to this work.
Fermentation 2022, 8(4), 181; https://doi.org/10.3390/fermentation8040181
Submission received: 11 March 2022 / Revised: 28 March 2022 / Accepted: 6 April 2022 / Published: 11 April 2022
(This article belongs to the Section Fermentation Process Design)

Abstract

:
Auto-inducible promoter systems have been reported to increase soluble product formation in the periplasm of E. coli compared to inducer-dependent systems. In this study, we investigated the phosphate (PO4)-sensitive phoA expression system (pAT) for the production of a recombinant model antigen-binding fragment (Fab) in the periplasm of E. coli in detail. We explored the impact of non-limiting and limiting PO4 conditions on strain physiology as well as Fab productivity. We compared different methods for extracellular PO4 detection, identifying automated colorimetric measurement to be most suitable for at-line PO4 monitoring. We showed that PO4 limitation boosts phoA-based gene expression, however, the product was already formed at non-limiting PO4 conditions, indicating leaky expression. Furthermore, cultivation under PO4 limitation caused physiological changes ultimately resulting in a metabolic breakdown at PO4 starvation. Finally, we give recommendations for process optimization with the phoA expression system. In summary, our study provides very detailed information on the E. coli phoA expression system, thus extending the existing knowledge of this system, and underlines its high potential for the successful production of periplasmic products in E. coli.

1. Introduction

Besides mammalian cells, the bacterium Escherichia coli represents the most commonly used production host for biopharmaceuticals, especially antigen binding fragments (Fabs, [1,2,3]). E. coli provides several benefits, as simple genetic manipulation, high cell densities and productivities, as well as cultivation on inexpensive media [4]. The production of functional Fabs in E. coli, however, requires secretion into the periplasmic space as only the oxidizing conditions present there enable the correct formation of disulfide bonds [5]. Periplasmic translocation is directed by addition of an N-terminal leader peptide, which typically originates from a natively translocated protein [6], such as phoA [7], ompA [7], pelB [8] or stII [3,9]. Successful production of functional Fabs by periplasmic expression in E. coli was first reported by Skerra et al. [7] and Better et al. in the 1990s [10]. Skerra produced a Fab under the control of the lac promoter, whereas Better expressed a Fab under the control of the araB promoter. In both cases, however, the obtained product yields did not exceed 2 mg/L. Other promoter systems used for Fab production were the phoA promoter [3,9] and the tac promoter [8,11,12]. Since then, several studies have dealt with the commonly observed low expression levels of Fabs [13], which are mainly attributed to toxicity effects, protein degradation, inclusion body (IB) formation and translocation inefficiencies [14,15]. In this regard, different cultivation conditions, vector elements [4,16,17], medium compositions and aeration strategies [8,18] have been investigated to boost productivity. Furthermore, the impact of co-expressed chaperones and application of protease deficient strains [11] as well as the influence of gene order (heavy and light chain), temperature and DNA sequence [13,19,20] on soluble Fab expression have been investigated.
Based on these studies, the product yield could be pushed to nearly 5 g/L for certain Fabs [9,11,21,22]. However, in most cases obtained yields are still quite low (<200 mg/L) even in high cell density cultivations (OD > 100) [12,23]. Several working groups have attributed these low yields to an uncontrolled loss of product into the culture medium, due to leakiness of the E. coli outer cell membrane [8,10,13]. Furthermore, intracellular protein loss in the form of IBs is a common phenomenon for E. coli. This undesired IB formation can be attributed to several reasons: (1) overexpression imposes metabolic burden on the biosynthetic machinery of the cell [24]; (2) non-optimal cultivation conditions affect soluble protein production [25,26] and (3) the use of strong promoters and high inducer concentrations leads to increased expression rates overcoming the capacity of the native translocation system [27,28]. Based on that, the application of strong expression systems, such as the well-established and widely used T7lac system, might not be suitable for soluble Fab production in the E. coli periplasm. However, the T7 system is still used for the production of Fabs both in academia and industry (e.g., [29,30,31]).
In a recent study, Luo et al. used the alkaline phosphatase (phoA) promoter (pAT system) and the stII leader peptide to successfully produce five different Fabs extracellularly in E. coli BL21DE3 [3]. They also demonstrated the superiority of the phoA-based pAT system over the commonly used T7-based pET system. Based on these interesting findings, we (1) directly compared the production of a recombinant Fab under the control of the E. coli phoA expression system (hereafter called pAT) and the T7lac expression system (hereafter called pET) under different cultivation conditions and (2) investigated in more detail the impact of extracellular PO4 concentration on strain physiology and product formation during cultivation starting at high PO4 content (30 mM) until PO4 starvation (<0.1 mM). Since appropriate PO4 analysis is essential for bioprocess control, we also analyzed and compared different methods for determination of extracellular PO4 in the culture broth. Finally, we give recommendations for process intensification using the phoA expression system. In summary, this study extends current knowledge on the phoA expression system.

2. Materials and Methods

2.1. Strains and Product

The gene encoding the model Fab (50 kD, pI 7.4, 5 S-S bonds) was codon-optimized for E. coli and obtained from GenScript. The antibody chains coding for light chain and heavy chain were placed under the control of the promoter (order: 1. Promoter—2. light chain—3. heavy chain). Furthermore, both antibody chains were preceded by the E. coli enterotoxin II (stII) signal sequence to allow translocation to the E. coli periplasm, as shown before for five different Fabs [3]. For pET cultivations, E. coli BL21(DE3) (NEB, Ipswich, MA, USA) transformed with a pET26(+) vector carrying the gene coding for the Fab—placed between the restriction sites XhoI and XbaI—under the transcriptional control of the T7lac promoter was used (T7lac strain). For pAT cultivations, E. coli W3110 (DSMZ, Braunschweig, Germany) transformed with a modified pAT153 vector (AmpR gene was removed) carrying the gene coding for the Fab—placed between the restriction sites NotI and EcoRI—under the transcriptional control of the E. coli phoA promoter was used (phoA strain).

2.2. Bioreactor Cultivations

2.2.1. Strain Characterization

Cultivations for characterization of both the T7lac strain and the phoA strain were carried out in a DASGIP® Parallel Bioreactor System (Eppendorf, Hamburg, Germany) with a working volume of 2 L. The CO2 and O2 in the off-gas were analyzed by a DASGIP® GA gas analyzer (Eppendorf, Hamburg, Germany), pH by a pH-sensor EasyFerm Plus (Hamilton, Reno, NV, USA) and dissolved oxygen (dO2) by a Visiferm DO 225 electrode (Hamilton, Reno, NV, USA). The dO2 was kept above 20% oxygen saturation throughout the whole cultivation by supplying 2 vvm of a mixture of pressurized air and pure oxygen. The pH was kept at 7.2 by supplying 12.5% NH4OH and 10% HCl and stirring speed was set to maximum (2000 rpm) to reduce the required pure oxygen consumption. Fed-batch cultivations were performed using a soft-sensor controlled feeding strategy. The applied soft-sensor, using online measurement of CO2 in the off-gas for estimation of biomass concentration, was described in detail by Wechselberger et al. [32]. Calculated feed-flowrates were adjusted with the DASbox® MP8 Multi Pump Module. All process parameters were logged and controlled by the DASware® control.

T7lac-Based Expression (pET Cultivations)

In total, 500 mL sterile DeLisa pre-culture medium [33] supplemented with 0.05 g/L kanamycin and 8 g/L glucose was aseptically inoculated from frozen stocks (T7lac strain, 3 mL, −80 °C). Pre-cultures were grown in two 500-mL high-yield shake flasks in an Infors HR Multitronshaker (Infors, Bottmingen, Switzerland) at 37 °C and 230 rpm overnight (15 h). For batch cultivation, 900 mL DeLisa batch medium [33] supplemented with 20 g/L glucose was inoculated with 100 mL of pre-culture and temperature was set to 35 °C. After sugar depletion (indicated by a drop of CO2 in the off-gas signal), a non-induced fed-batch phase using a feed with 400 g/L glucose was carried out. The temperature was kept at 35 °C and the feed flow rate was adjusted to correspond to a specific growth rate (µ) of 0.1 h−1. At a biomass concentration of around 30 g/L dry cell weight (DCW), induction was performed by addition of 0.1 mM Isopropyl-β-D-thiogalactopyranoside (IPTG). Temperature and feed rate (corresponding to µ) for the different cultivations were set as following: pET 1: µ = 0.1 h−1, 35 °C; pET 2: µ = 0.1 h−1, 30 °C; pET 3: µ = 0.05 h−1, 35 °C; pET 4: µ = 0.05 h−1, 30 °C. Each culture was induced for 8 h. Applied feed flow rates ranged from 8 mL/h (start fed-batch) to 80 mL/h (end fed-batch).

phoA-Based Expression (pAT Cultivations)

A total of 500 mL sterile DeLisa pre-culture medium [33] supplemented with 0.01 g/L tetracycline and 8 g/L glucose was aseptically inoculated from frozen stocks (phoA strain, 3 mL, −80 °C). Pre-cultures were grown as described above. For batch cultivation, 900 mL DeLisa batch medium [33] containing only 1.09 g/L KH2PO4 and 6.04 g/L (NH4)2HPO4 as P-source was used. These amounts account for approx. 50 g/L DCW based on the elemental biomass composition of E. coli W3110, and were supplemented with 20 g/L glucose. Batch was inoculated with 100 mL of pre-culture and temperature was set to 35 °C. After sugar depletion, a fed-batch phase using a glucose feed with 400 g/L glucose was carried out. Temperature and feed rate (corresponding to µ) for the different cultivations were set as following: pAT 1: µ = 0.1 h−1, 35 °C; pAT 2: µ = 0.1 h−1, 30 °C; pAT 3: µ = 0.05 h−1, 35 °C; pAT 4: µ = 0.05 h−1, 30 °C. The fed-batch was terminated at PO4 starvation, indicated by a stagnation of CO2 in the off-gas signal. Applied feed flow rates ranged from 8 mL/h (start fed-batch) to 80 mL/h (end fed-batch).

Sampling

For evaluation of pET cultivations, samples were taken at the beginning and end of batch and non-induced fed-batch, and after 4 h and 8 h of induction. For evaluation of pAT cultivations, samples were taken at the beginning and end of the batch phase, during the fed-batch phase at a PO4 concentration of >1 mM (before PO4 limitation) and at PO4 starvation. Determination of biomass DCW was completed gravimetrically in triplicates [6]. Optical density at 600 nm (OD600) was determined photometrically in triplicates (Photometer Genesys 20; Thermo Fisher, Waltham, MA, USA). Glucose and acetate were measured in cell-free culture broth HPLC [34]. The inorganic PO4 concentration in the cell-free culture broth was determined colorimetrically using the Cedex Bio HT analyzer (Roche, Basel, Switzerland) applying the Phosphate Bio HT test kit (Ref 06990088001). Based on the measured PO4 concentrations, the respective biomass concentrations and the time intervals between sampling points, the respective specific PO4 uptake rate (mmol/g/h) was calculated.

2.2.2. Characterization of the pAT System

Cultivations were carried out in a Cplus Biostat Bioreactor System (Sartorius, Göttingen, Germany) with a total volume of 15 L and a working volume of 10 L. CO2 and O2 in the off-gas were analyzed by an off-gas analysis system (Dr. Marino Müller Systems, Esslingen, Switzerland), pH was monitored by a pH-sensor 405-DPAS-SC-K8S/120 (Mettler Toledo, Columbus, OH, USA), and dissolved oxygen (dO2) by an InPro 6860i nA electrode (Mettler Toledo, Columbus, OH, USA). The dO2 was kept above 20% oxygen saturation throughout the whole cultivation by supplying 2 vvm of a mixture of pressurized air and pure oxygen. The pH was kept at 7.2 by supplying 12.5% NH4OH and 10% HCl and stirring speed was set to 1200 rpm (the commonly applied stirrer speed for E. coli cultivation in our lab). All process parameters were logged and controlled by the Process Information Management System Lucullus (Securecell, Urdorf, Switzerland).
Pre-culture was grown in 2500-mL high-yield shake flasks in an Infors HR Multitronshaker (Infors, Bottmingen, Switzerland) at 37 °C and 230 rpm overnight (15 h). A total of 550 mL of sterile DeLisa pre-culture medium [35] supplemented with 0.01 g/L tetracycline and 8 g/L glucose was aseptically inoculated from frozen stocks (phoA strain, 3 mL, −80 °C). For batch cultivation, 4500 mL of DeLisa batch medium [35] containing 1.09 g/L KH2PO4 and 6.04 g/L (NH4)2HPO4 as P-source, accounting for approx. 50 g/L DCW, and supplemented with 20 g/L glucose was inoculated with 500 mL of pre-culture and temperature was set to 35 °C. After sugar depletion (indicated by a drop of the CO2 off-gas signal), a fed-batch phase using a glucose feed with 400 g/L glucose was carried out. Temperature and feed rate (corresponding to µ) were set to 30 °C and µ = 0.05 h−1. Fed-batch cultivations were performed using a feed-forward strategy (exponential feed rate as well as initial feed rate were based on Equations (1) and (2)). The cultivations were performed in triplicates.
Equation (1). Formula for feed rate Ft
F t = F 0 × e µ t
  • Ft feed rate [g/h];
  • F0 initial feed rate [g/h];
  • µ specific growth rate [1/h];
  • t cultivation time [h].
Equation (2). Formula for initial feed rate F0
F 0 = µ × x 0 × V 0 c s ,   F e e d × Y X / S × ρ F e e d
  • F0 initial feed rate at time point 0 [g/h];
  • µ specific growth rate [1/h];
  • x0 biomass conc. at time point 0 [g/L];
  • V0 culture volume at time point 0 [L];
  • cs,Feed glucose conc. in feed medium [g/L];
  • YX/S biomass yield on glucose [g/g].
The feed-flowrate was adjusted with a Preciflow peristaltic pump (Lambda, Baar, Switzerland). Cultivations were performed until PO4 starvation (indicated by stagnation of the CO2 off-gas signal). Applied feed flow rate ranged from 18 mL/h (start fed-batch) to 125 mL/h (end fed-batch). For evaluation, samples were taken in a 2 h interval starting at a PO4 concentration of 35 mM until PO4 starvation. Determination of biomass DCW was completed gravimetrically [14]. Optical density at 600 nm (OD600) was determined photometrically (Photometer Genesys 20; Thermo Fisher, Waltham, MA, USA). Glucose and acetate were measured in fermentation supernatant and quantified via HPLC [36]. The inorganic PO4 concentration in the cell-free culture broth was determined colorimetrically using the Cedex Bio HT analyzer (Roche, Basel, Switzerland) applying the Phosphate Bio HT test kit (Ref 06990088001).

2.3. Analytics

2.3.1. Sample Preparation for Product Analysis

Cell pellets of 50 mL cultivation broth were resuspended (20 mM NaH2PO4, 100 mM NaCl, pH 7.0) to 100 g/L DCW and homogenized at 1000 bar for 10 passages (Panda 2000 Plus, GEA, Düsseldorf, Germany). After centrifugation (20 min, 14,000 rcf, 4 °C), the obtained supernatant was analyzed for soluble product, whereas the solid pellet (cell debris) was used for IB quantification.

2.3.2. Soluble Product Quantification by Affinity HPLC

Crude cell lysates were pre-treated with a de-lipidation step prior to analysis [37] Fab quantification was carried out by HPLC analysis (UltiMate 3000; Thermo Fisher, Waltham, MA, USA) using a Protein L-based affinity chromatography column (POROS Capture Select LC Kappa, Applied Biosystems, Foster City, CA, USA) [37]. The product was quantified using purified Fab as standard. The standard deviation was quantified with 9.69% by performing triplicates of Fab standards (no technical triplicates of the single samples from the bioreactor cultivations were performed).

2.3.3. Product IB Quantification by Size Exclusion HPLC

The cell debris was washed twice with deionized water and aliquoted (200 mg DCW/tube). Washed aliquots were solubilized in 2 mL of a solution containing 1 part Tris-buffer (50 mM Tris, pH 8.0) and 1 part solubilization buffer (50 mM Tris, 8 M guanidine hydrochloride (GnHCl), pH 8.0) and incubated on a shaker at room temperature for 2 h. Centrifugation (30 min, 14,000 rcf) was performed to remove particles prior to analysis. Product quantification was carried out by HPLC analysis (UltiMate 3000; Thermo Fisher, Waltham, MA, USA) using a size exclusion column (BioBasic SEC 300, Thermo Fisher, Waltham, MA, USA). A total of 50 mM BisTris, pH 6.8, supplemented with 4 M GnHCl and 150 mM NaCl, was used as mobile phase with a constant flow of 0.2 mL/min and the system was run isocratically at 25 °C. The product was quantified with an UV detector (Thermo Fisher, Waltham, MA, USA) at 280 nm using purified Fab as standard. The standard deviation was quantified with 1.04% by performing triplicates of all the samples.

2.3.4. Investigation of PO4 Quantification Methods

Phosphate/phosphorus was measured in cell-free culture broth (centrifugation at 14,000 rcf 4 °C and 2 min) by (1) Inductively Coupled Plasma—Optical Emission Spectroscopy (ICP-OES); (2) Ion exchange—Ion Chromatography (IC); (3) a Phosphate (PO4) Colorimetric Assay Kit and (4) a Cedex Bio HT analyzer. Depending on the analytical method, samples were diluted in deionized water to give results within the detection range.

ICP-OES

The phosphorus concentration was determined by ICP-OES using an iCAP 6000 ICP-OES instrument. Measurements and calibration, as well as standard and sample preparation, were conducted as described by Kamravamanesh et al. [33].

IC

The inorganic PO4 concentration was determined by IC analysis (Dionex ICS 5000+ chromatography including a Dionex AERS 500 conductivity suppressor, Thermo Fisher, Waltham, MA, USA) using an anion exchange column (Dionex IonPac AS11, Thermo Fisher, Waltham, MA, USA). A guard column (Dionex IonPac AG11, Thermo Fisher, Waltham, MA, USA) was connected upstream for protection of the analytical column and the system was saturated with N2 to prevent dissolution of atmospheric CO2 forming undesired carbonates. A total of 12 mM NaOH was used as mobile phase with a constant flow of 1.2 mL/min and the system was run isocratically at 25 °C. Remaining trace anion contaminants in the hydroxide eluent were removed using an anion trap column (Dionex ASTC 500, Thermo Fisher, Waltham, MA, USA). PO4 was quantified with a conductivity detector (Thermo Fisher, Waltham, MA, USA) using dilutions of NaH2PO4 as standards [34].

Colorimetric Assay Kit

The inorganic PO4 concentration was determined colorimetrically using a colorimetric assay kit [37]. Measurements and the calibration curve were conducted according to the product manual [37]. Two hundred µL samples (or diluted samples) were mixed with 30 µL PO4 reagent on a 96-well plate. After 30 min incubation at room temperature, absorbance at 650 nm was measured for PO4 quantification.

Cedex Bio HT Analyzer

The inorganic PO4 concentration was determined colorimetrically using the Cedex Bio HT analyzer (Roche, Basel, Switzerland) applying the Phosphate Bio HT test kit (Ref 06990088001).

3. Results

In this study we directly compared the production of a recombinant model Fab in E. coli using the T7lac (pET) and the phoA (pAT) expression system under equal cultivation conditions. We analyzed and compared cell physiology as well as soluble and IB product formation.

3.1. Characterization of T7lac-Based Fab Production (pET)

In all pET cultivations we performed a non-induced fed-batch (µ = 0.1 h−1, 35 °C) to a biomass concentration of 30 g/L DCW, followed by an IPTG induction phase at different µ (0.1 h−1 and 0.05 h−1) and cultivation temperatures (35 °C and 30 °C). Induction was completed by commonly performed one-point addition of IPTG to a final concentration of 0.1 mM [35,36]. Strain physiology and product-related data were evaluated after 4 h and 8 h of induction which was comparable to reported induction times in literature [12,38].

3.1.1. Strain Physiology

The most important strain physiological parameters are summarized in Table 1 and extended data are given in Supplementary Table S1. Obtained YX/S (biomass/substrate yield) and YCO2/S (CO2/substrate yield) of the strain cultivated under different conditions were comparable, however, at the higher μ = 0.1 h−1 glucose accumulated over time indicating cellular stress. This was also underlined by calculating the real μ of the cultures, which were only half of the set values at the end of cultivation (Supplementary Table S1). Although the YCO2/S changed over time, indicating a metabolic shift [39], even the soft-sensor was not able to react properly to these physiological changes, leading to overfeeding of the cells and consequent glucose accumulation. At μ = 0.1 h−1 and 35 °C we also observed cell lysis (indicated by foam formation and an increase in extracellular DNA content) (Supplementary Table S5). In contrast, in cultivations completed at a lower μ = 0.05 h−1 the calculated μ corresponded well to the set values. Recoveries of total carbon in all cultivations were similar, resulting in C-balances of 0.78–0.85 (Table 1). We attribute minor cell lysis to be the reason for non-closing C-balances [40,41]. As also shown before [42], we demonstrated that even a relatively low µ = 0.1 h−1 during induction of a pET system negatively impacts cell physiology and leads to cell lysis.

3.1.2. Fab Productivity

Most of the recombinant Fab was found as IBs in all pET cultivations independent from the cultivation conditions and induction time (Table 2)—in fact 5–10 times more IBs than soluble product was formed (Supplementary Table S2). We confirmed that a higher temperature during induction favored IB formation [43,44]. However, we could still find soluble Fab. At 30 °C we obtained specific titers of up to 2.89 mg/g DCW resulting in a volumetric titer of nearly 120 mg Fab/L cultivation broth. We confirmed that a lower temperature during induction of a pET system favored the formation of soluble product [26,45]. In contrast to the temperature, µ had no considerable impact on specific Fab titers—neither soluble nor IBs. As expected, extended induction times led to a shift from the production of soluble Fab towards IB formation (Table 2) which can be addressed to an extended exposure to metabolic stress [24]. Possibilities to overcome this problem could be a reduction of applied inducer concentration or the continuous addition of IPTG in a specific ratio to the biomass during induction [35,46]. Summarizing, the highest specific soluble Fab titer was achieved at 30 °C after 4 h induction independent from μ. This result is comparable to data published previously [12].

3.2. Characterization of phoA-Based Fab Production (pAT)

The main goal of the study was to investigate Fab production under the control of the E. coli phoA system in detail. In contrast to the T7lac promoter, the phoA promoter is recognized by the E. coli RNA polymerase and is regulated under PO4-limiting conditions [3,24,47]. Successful Fab production under control of the phoA promoter has been reported before (e.g., [3,9,48]). In this study we performed a batch cultivation at 35 °C followed by a single-phase fed-batch until PO4 starvation (indicated by stagnation of the CO2 off-gas signal) at different µ and temperatures. Required PO4 in the cultivation medium for generation of 50 g/L DCW was calculated based on the elemental biomass composition of E. coli W3110 and provided in the batch medium considering the PO4 carry-over from the pre-culture. Physiology and productivity were evaluated at PO4 starvation, but also before PO4 limitation was reached (>1 mM PO4) since the shake flask screening experiments indicated product formation already at non-limiting PO4 conditions (data not shown).

3.2.1. Impact of Cultivation Conditions on the Overall Cultivation Time

In contrast to pET cultivations, which were all induced for 8 h, the end of pAT cultivations was determined by the time point of PO4 starvation, indicated by the stagnation of CO2 in the off-gas signal. Obviously, the overall cultivation time strongly depended on set cultivation conditions (Table 3).
Interestingly, at μ = 0.05 h−1 we observed an impact of the cultivation temperature on the time needed until PO4 starvation: at 35 °C the cultivation took significantly longer than at 30 °C (Table 3). Since the specific PO4 uptake rates (qPO4) in cultivations pAT 3 and pAT 4 were similar (Table 4), we believe that the increased temperature in combination with the low μ = 0.05 h−1 caused partial cell lysis, thus the release of intracellular PO4 into the broth. This hypothesis was underlined by the higher PO4 concentration (Table 3; pAT 3) as well as significant lower YX/S and biomass concentration at the end of the cultivation (Table 4).

3.2.2. Strain Physiology

The most important strain physiological parameters are summarized in Table 4 and extended data are shown in Supplementary Table S3. Physiological yields obtained under non-limiting conditions (>1 mM PO4) were similarly independent from cultivation conditions, except for cultivation pAT 3. It seems that for the strain harboring the phoA system, a combination of low µ and high temperature (pAT 3) implies increased metabolic burden leading to cell lysis (indicated by foam formation and an increased extracellular DNA content; Supplementary Table S5). Despite this, we observed a shift towards decreased YX/S and increased YCO2/S during the phase of PO4 starvation in all cultivations, indicating metabolic change [49]. At 35 °C, C-balances were between 0.8 and 0.9, whereas at 30 °C C-balances were close to 1. Determined qPO4 correlated with the applied μ at >1 mM PO4, giving a two-fold higher qPO4 at µ = 0.1 h−1. Although hardly any PO4 uptake was determined during the PO4 limitation phase (Table 4), surprisingly the biomass concentration still increased. We hypothesized a metabolic shift from uptake of extracellular towards utilization of intracellular, stored PO4 to be the reason [50,51]. The calculated μ correlated well with the set μ (except for cultivation pAT 3) underlining the stability of these cultivations as well as the applicability of the soft-sensor-based feeding control. Overall, strain physiological parameters of pAT cultivations showed that 35 °C negatively affects physiology and viability, especially at a low μ = 0.05 h−1.

3.2.3. Fab Productivity

Independent of cultivation conditions, we observed soluble Fab production already at non-limiting PO4 conditions (>1 mM PO4), indicating incomplete promoter repression (Table 5 and Supplementary Table S4). Although the phoA promoter is usually tightly controlled, protein expression at increased PO4 concentrations has been reported before [24]. Since the phoA promoter also controls chromosomal alkaline phosphatase, it is hypothesized that competition between chromosomal and plasmid DNA for the repressors involved in regulation of phoA-based gene expression might be the reason for leaky expression [24,52].
In all pAT cultivations, soluble Fab was produced with specific titers ranging from 2.28–6.09 mg/g DCW. Interestingly, only during PO4 starvation of cultivations at μ = 0.05 h−1 IB formation was observed, indicating a high metabolic burden under these conditions—probably due to increased recombinant expression [53]. Cultivation of pAT 4 at μ = 0.05 h−1 and 30 °C delivered the highest soluble Fab titer yielding 6.09 mg/g DCW and 321 mg/L cultivation broth. However, due to the long cultivation time the space-time yield (STY) was only 6.77 mg/L/h. Summarizing, phoA-based Fab production is favored at low temperatures as well as low µ, which leads to long cultivation times, but results in high titers of soluble Fab.

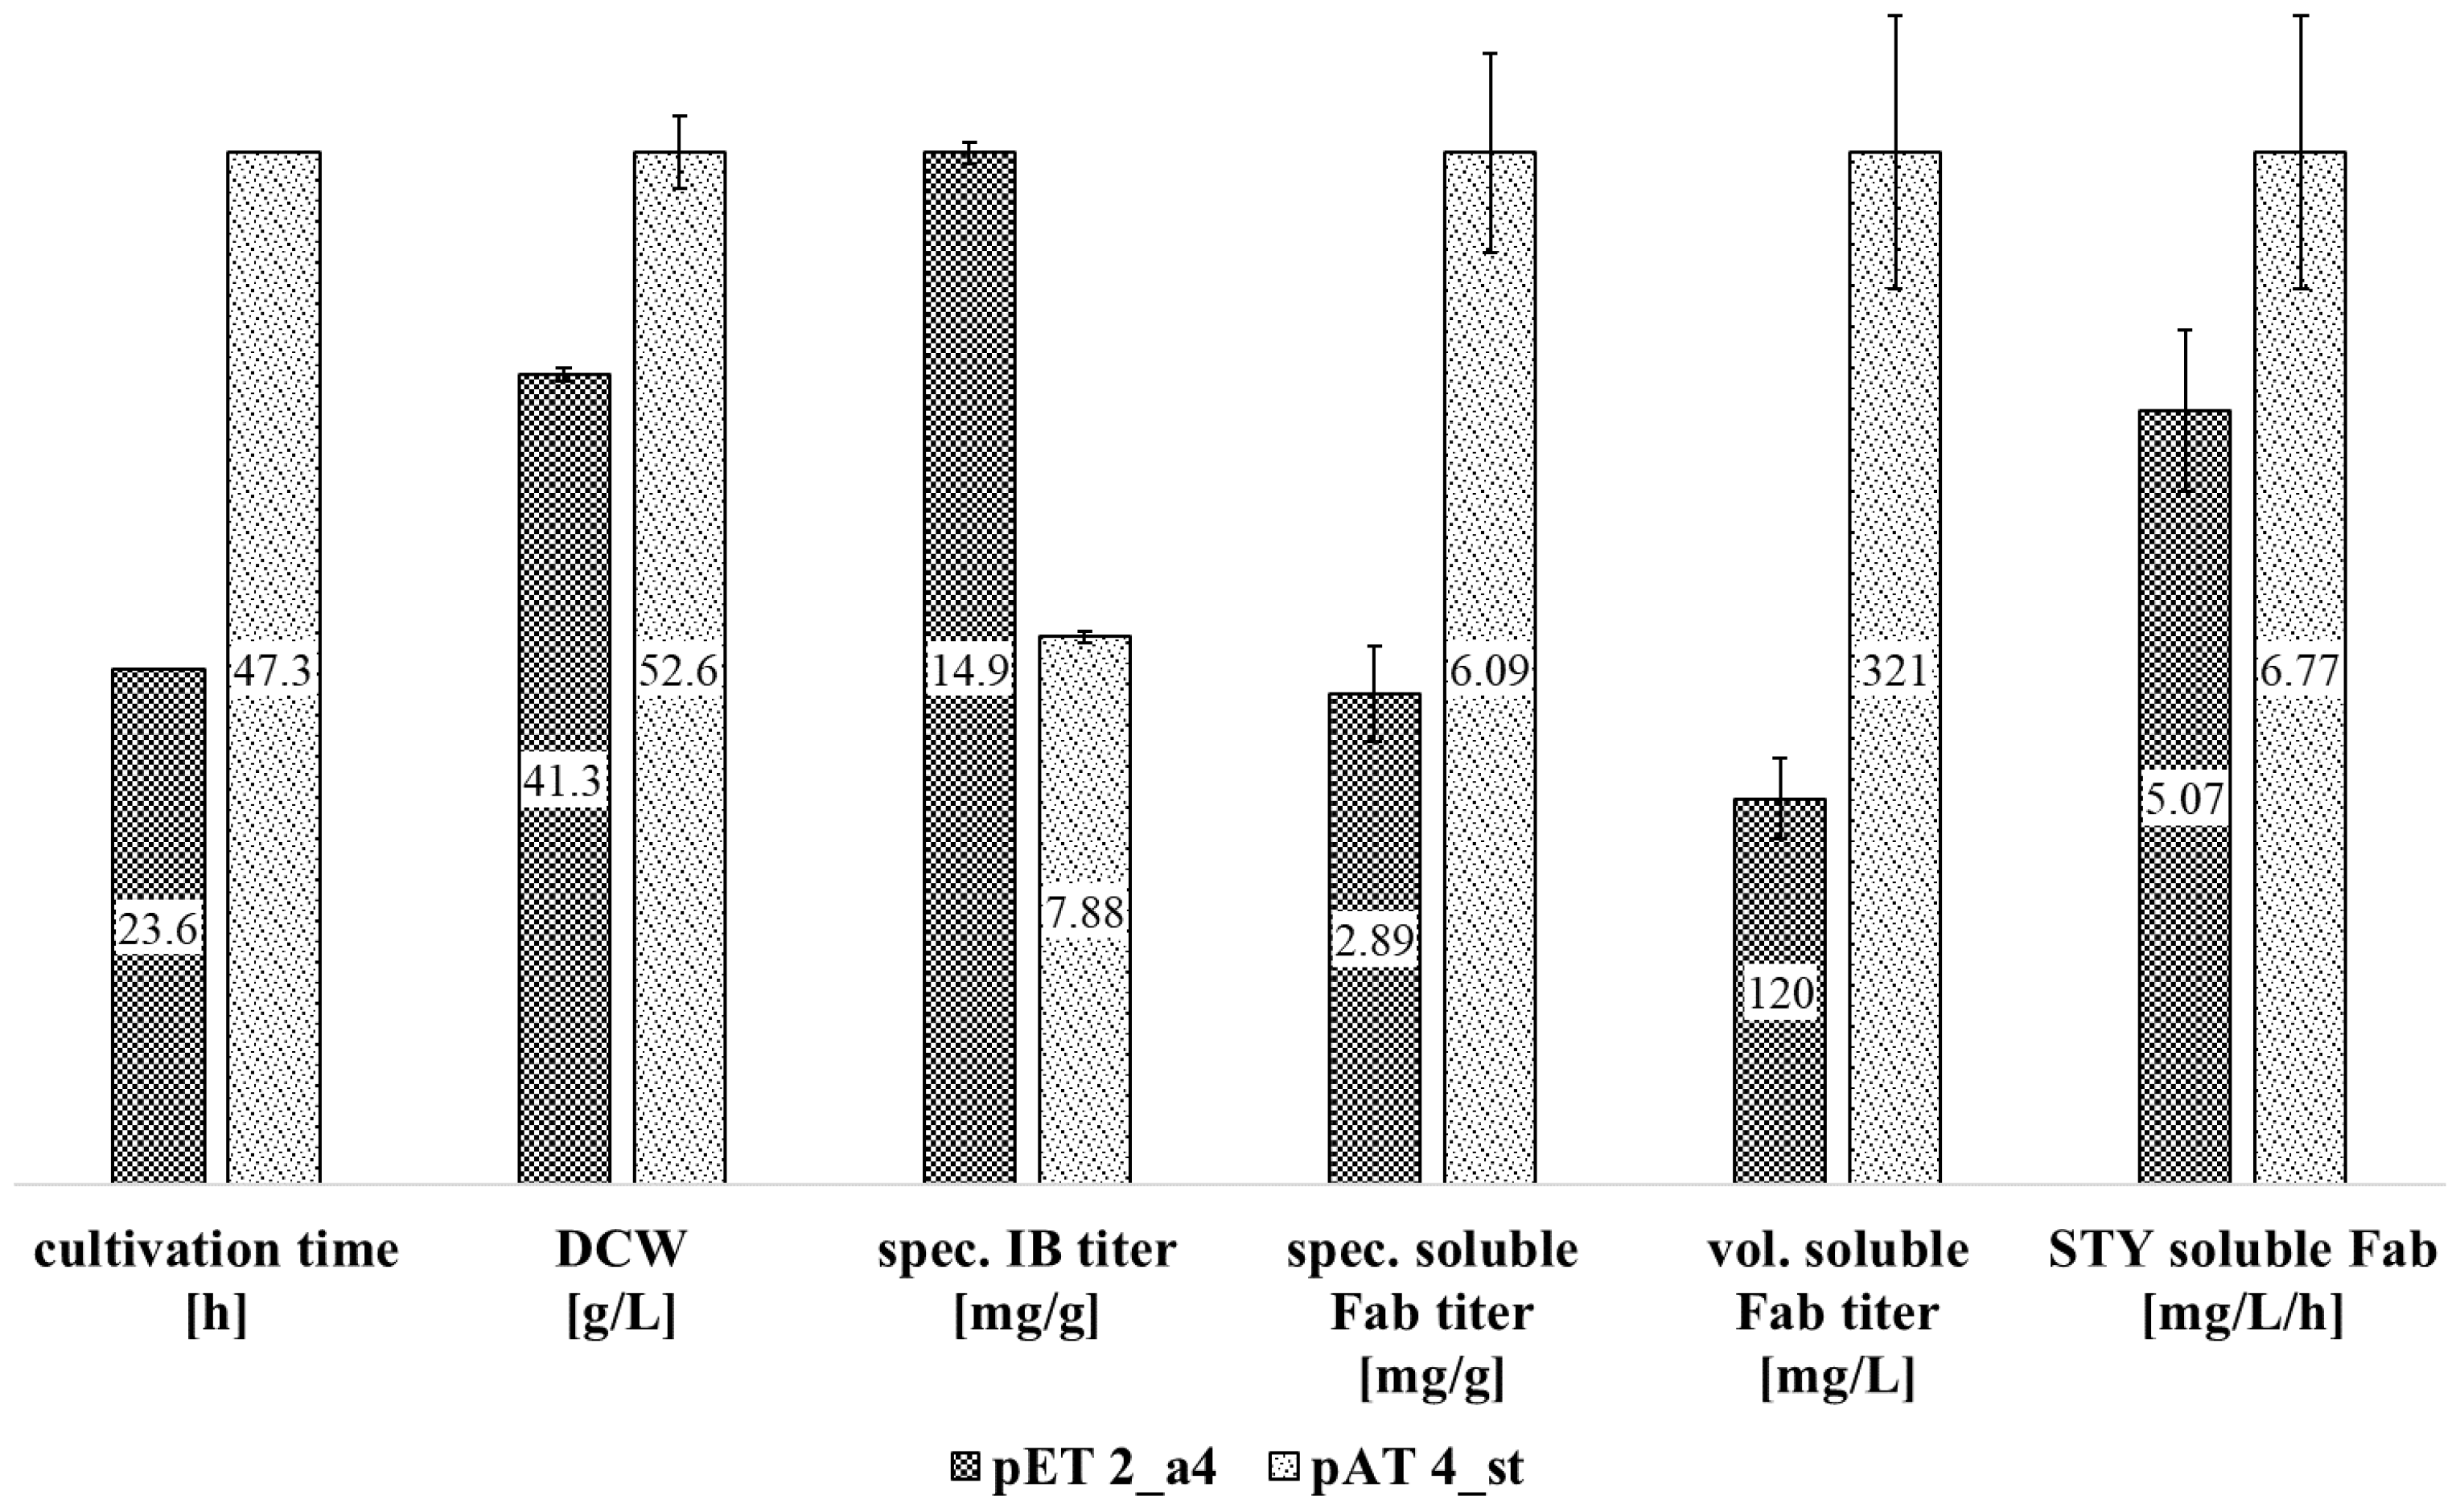
3.3. Direct Comparison of T7lac- and phoA-Based Fab Production

Important criteria for industrial production processes are volumetric product titer as well as STY, whereas the latter is more important regarding economic feasibility by incorporation of process time [54]. In Figure 1 we compare the pET and the pAT system under the conditions giving the highest productivity of soluble Fab, namely cultivation pET 2 after 4 h induction time (called pET 2_a4; Table 2) as well as cultivation pAT 4 at PO4 starvation (called pAT 4_st; Table 5). Under these conditions, Fab expression under the control of the T7lac promoter led to five-fold higher formation of IBs compared to soluble Fab, whereas phoA-based expression gave comparable amounts of IBs and soluble Fab. Cultivation pAT 4_st resulted in a three times higher volumetric soluble Fab titer compared to the pET cultivation and, despite the long cultivation time, the final STY was 1.3-fold higher. Thus, we underline the great potential of the easy-to-use pAT system as an interesting alternative to the well-known pET system for the production of periplasmic products, as also reported before [3].

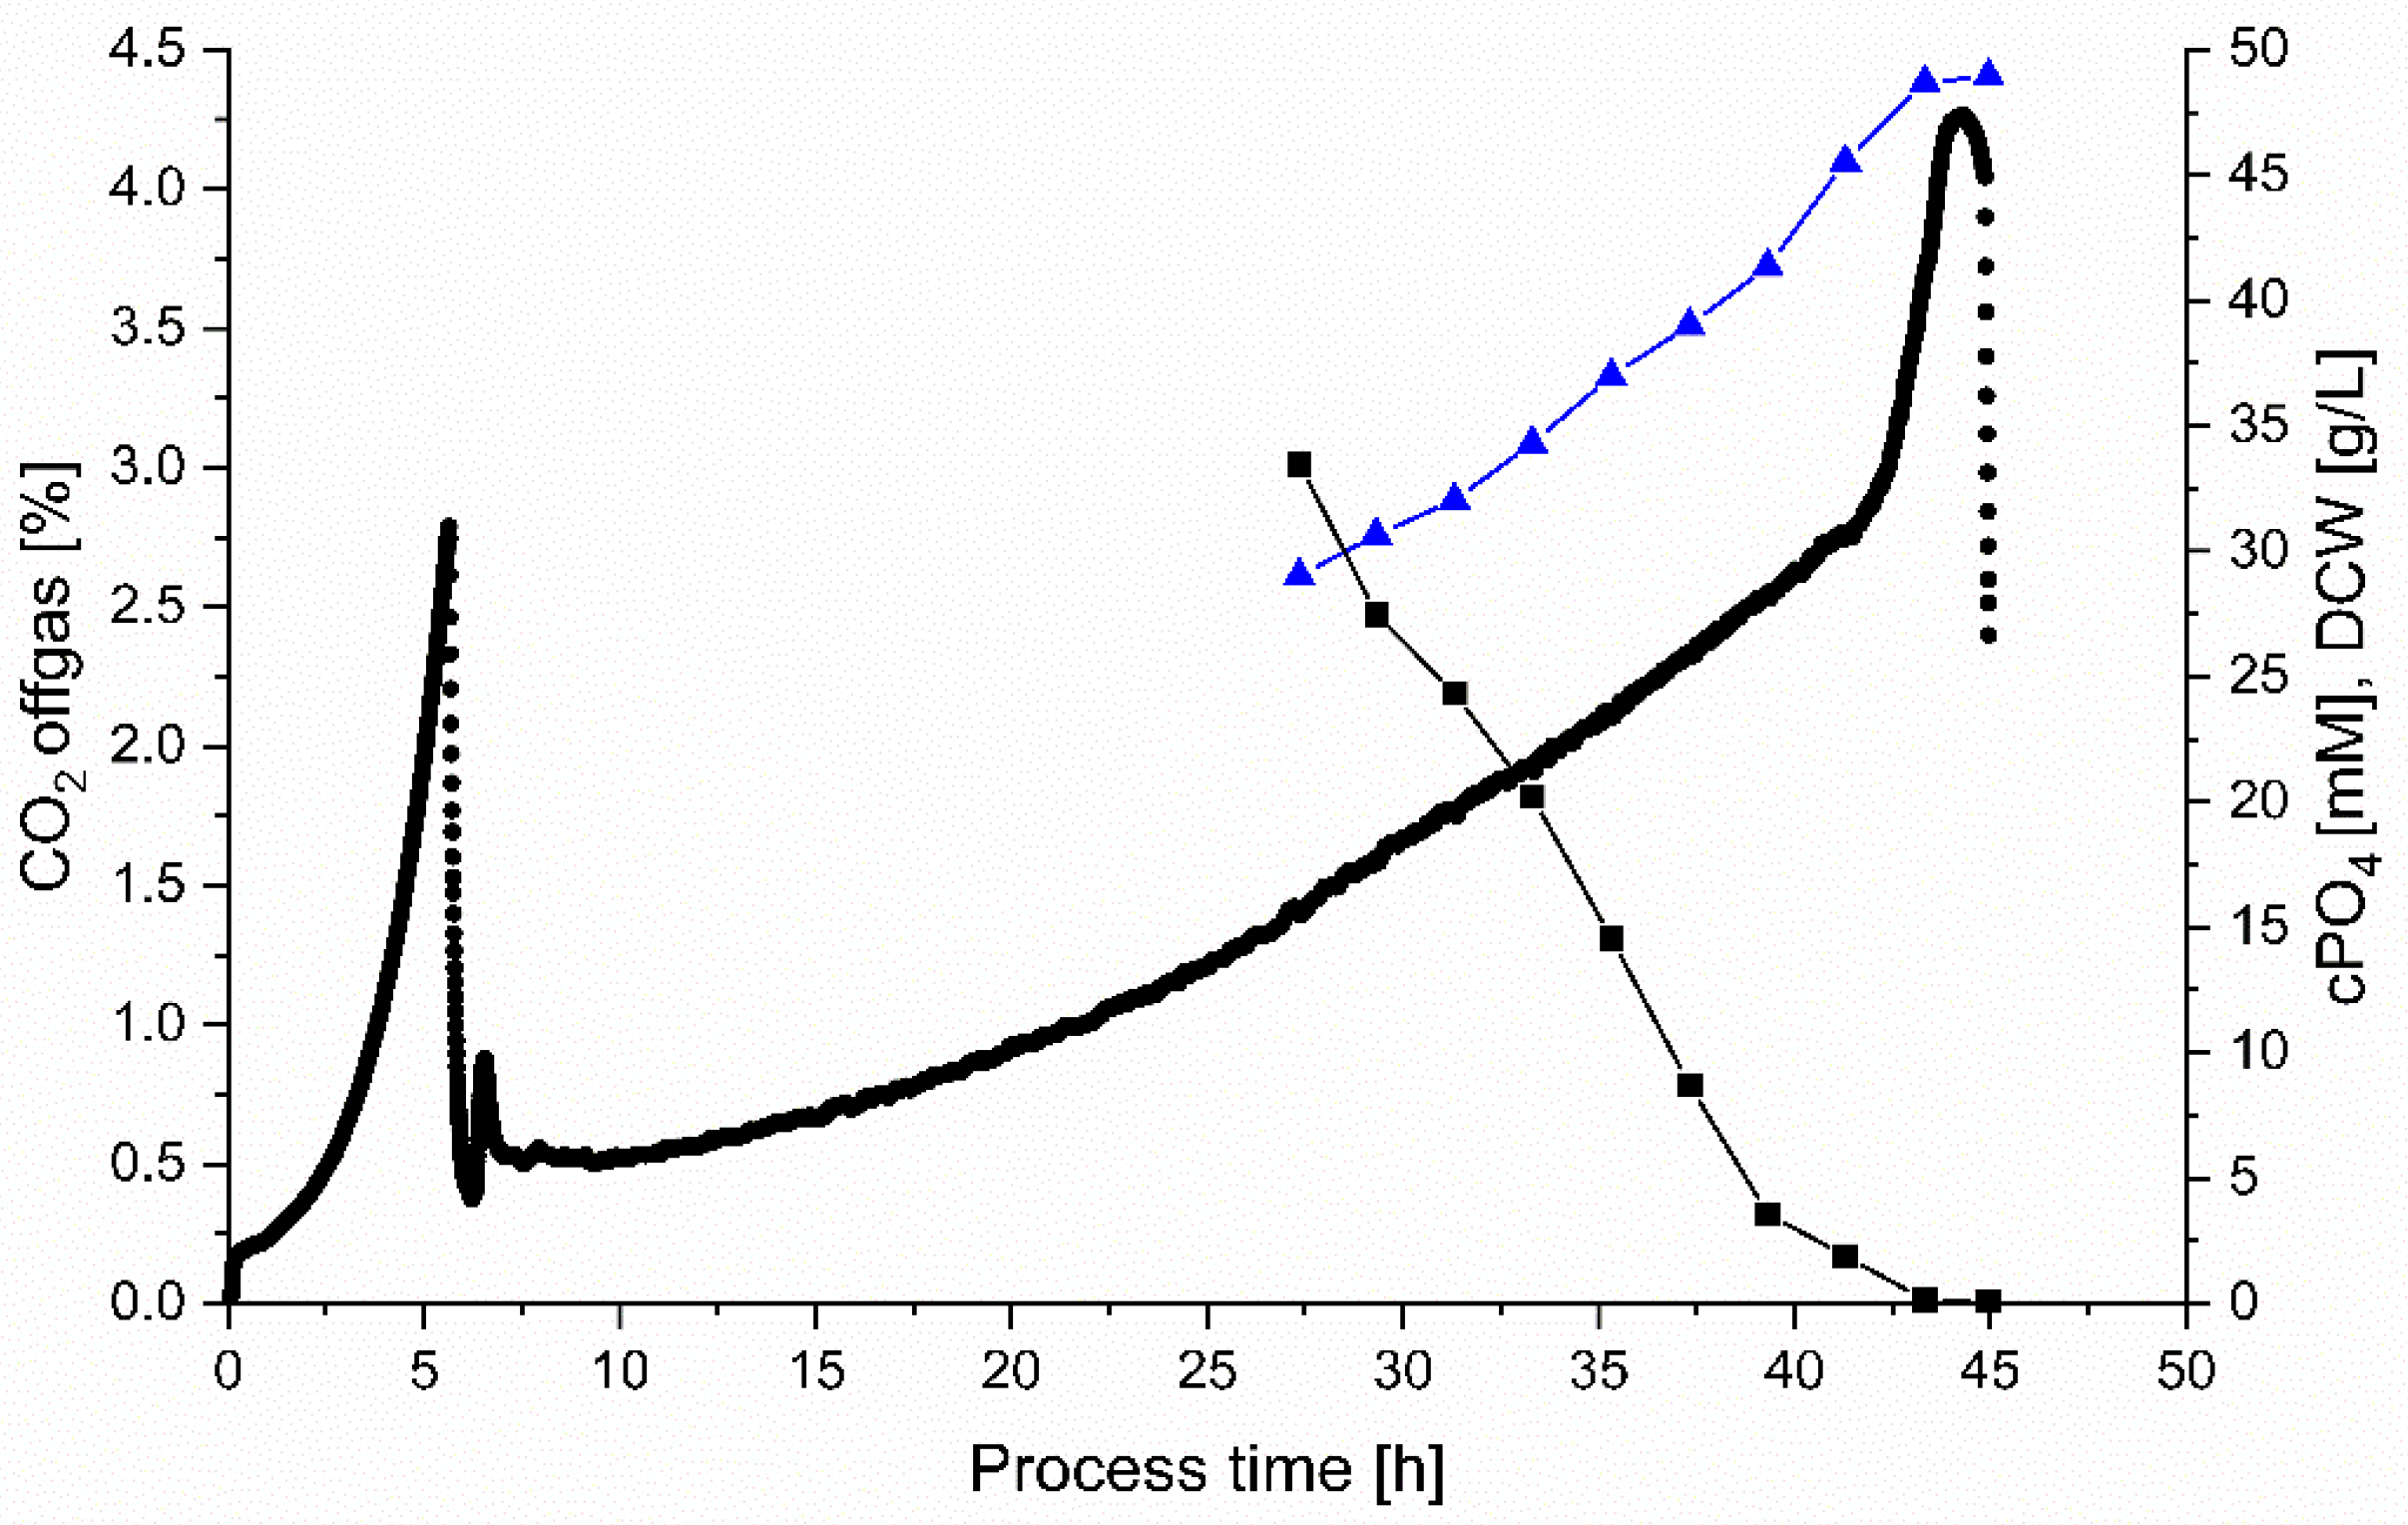
3.4. Detailed Characterization of the pAT System

3.4.1. PO4 Monitoring

In this study we explored the impact of extracellular PO4 concentration on strain physiology and product formation of the pAT system in more detail, to extend knowledge about this valuable system. In this respect, we also investigated and compared different methods for determination of extracellular PO4 in the culture broth for their suitability as an at-line PO4 monitoring tool. An overview of the evaluated methods is given in Table 6.

ICP-OES

In contrast to the other investigated methods, ICP-OES determines elemental phosphorus (P) instead of inorganic PO4. In case PO4 describes the only P source of the sample, obtained P contents correlated well with PO4 concentrations (data not shown). However, contamination of the sample with other P sources, e.g., organophosphates from complex media or polyphosphates, nucleic acids and membrane lipids from cells [25,27], complicate a valid correlation with PO4. In this regard, missing selectivity for PO4 describes a major drawback of this method. In addition, the limit of quantification (LOQ) of 65 µM is also rather high compared to other methods (Table 6). ICP-OES also requires costly equipment as well as an argon supply for measurement. Furthermore, the method needs expertise and routine by the analyst, and is time consuming concerning sample preparation (HCl treatment) and manual dilution, which hampers the usage for at-line monitoring.

IC

IC allows direct quantification of inorganic PO4 with a very low LOQ of 4 µM. However, PO4 detection is highly affected by contaminating anions in the eluent, which have to be either removed (anion trap column) or their formation prevented (saturation with N2). Furthermore, the impact of the sample matrix (E. coli culture broth) on the detection performance (peak fronting and peak maxima shifts) describes a major drawback of this method (data not shown). Acquisition costs for equipment (IC system and chromatography columns) are considerable as well as the requirement for continuous N2 supply. Performance of IC is usually quite simple; however, the required sample treatment and manual dilution describe potential error risks. Finally, the overall procedure, comprising sample preparation and IC sequence (30 min), may take up more than 60 min, which makes IC-based PO4 detection not suitable for at-line monitoring.

Phosphate Colorimetric Assay Kit

Performance of a PO4 colorimetric assay (PCA) allows quantification of inorganic PO4. The method is based on the reaction of PO4 with a chromogenic complex that results in a colorimetric product. The PCA provides a low LOQ (5 µM; Table 6) and only requires a plate reader or simple photometer. The PCA is intended for measurement of low PO4 concentrations (blood or wastewater) [37], which explains the very low linear detection range (5–25 µM). However, high sample dilutions are necessary, which requires tedious pipetting work. Therefore, the overall procedure (sample preparation, incubation time and measurement) can take up 1–1.5 h.

Cedex Bio HT

The Cedex Bio HT analyzer is a completely automated instrument that allows simultaneous measurement of up to 90 samples. Furthermore, up to 32 test kits can be loaded at the same time [39]. Application of the Phosphate Bio HT kit [40] allows the quantitative determination of inorganic PO4. The LOQ is rather high (100 µM; Table 6), which describes the major drawback of this method. Furthermore, acquisition costs for the analyzer and the test kits are significantly higher compared to PCA. However, PO4 measurement using the Cedex Bio HT provides several advantages as sample preparation is quite simple and samples are diluted automatically. Therefore, measurement results can be obtained within 15 min, which is essential for at-line based PO4 monitoring.
Summarizing, investigation of described PO4/P detection methods revealed the Cedex Bio HT system to be most suitable for required at-line PO4 monitoring. Therefore, this method was chosen to be used for the detailed investigation of the pAT system.

3.4.2. Impact of PO4 Conditions on Strain Physiology

To analyze the pAT system in more detail, we performed batch cultivations at 35 °C, followed by a single-phase fed-batch until PO4 starvation at µ = 0.05 h−1 and 30 °C. The main strain physiological parameters are summarized in Table 7 and extended data are shown in Supplementary Table S6. The bioreactor cultivation was performed in triplicates. The standard deviations for all calculated rates and yields were below 10%. The required process time (45 h) and obtained biomass concentration at cultivation end (49 g/L DCW) were comparable to the respective small-scale experiment in the 2 L scale. The CO2 off-gas signal was monitored for process evaluation and determination of cultivation end (Figure 2).
Under non-limiting PO4 conditions (>1 mM), the CO2 signal showed the expected trend for an exponential feeding regime. However, during PO4 limitation we observed a fast increase in the CO2 signal indicating a metabolic shift of the E. coli cells. This assumption was confirmed by evaluation of physiological yields, which were quite constant under non-limiting PO4 conditions, but shifted towards increased YCO2/S and decreased YX/S during PO4 limitation (Supplementary Table S6). Our results confirm that PO4 limitation triggers metabolic burden and physiological changes [55]. However, no considerable cell lysis was observed, which was supported by obtained C-balances between 0.9 and 1.1, even under PO4 limitation (Table 7). Although hardly any PO4 was taken up during PO4 limitation, interestingly the biomass concentration still slightly increased (Supplementary Table S6). We assume a metabolic shift from uptake of extracellular towards consumption of intracellular, stored PO4 to be the reason [50,51]. Therefore, we investigated the intracellular phosphorus (P) content during cultivation under non-limiting and limiting PO4 conditions (Supplementary Figure S1). The intracellular P content (initial value of 2.3%; [56]) started to decrease already at a PO4 concentration of around 5 mM. At this PO4 concentration also qPO4 strongly decreased (Table 7). These results confirmed our hypothesis that E. coli accumulates polyphosphate as PO4 reservoir that is reused, when needed [57,58]. At PO4 starvation, cell metabolism started to break down, indicated by the stagnation of the CO2 off-gas signal and glucose accumulation in the culture broth (data not shown). In conclusion, limiting PO4 conditions highly affect cell physiology and PO4 starvation, ultimately results in collapsing cell metabolism (data not shown).

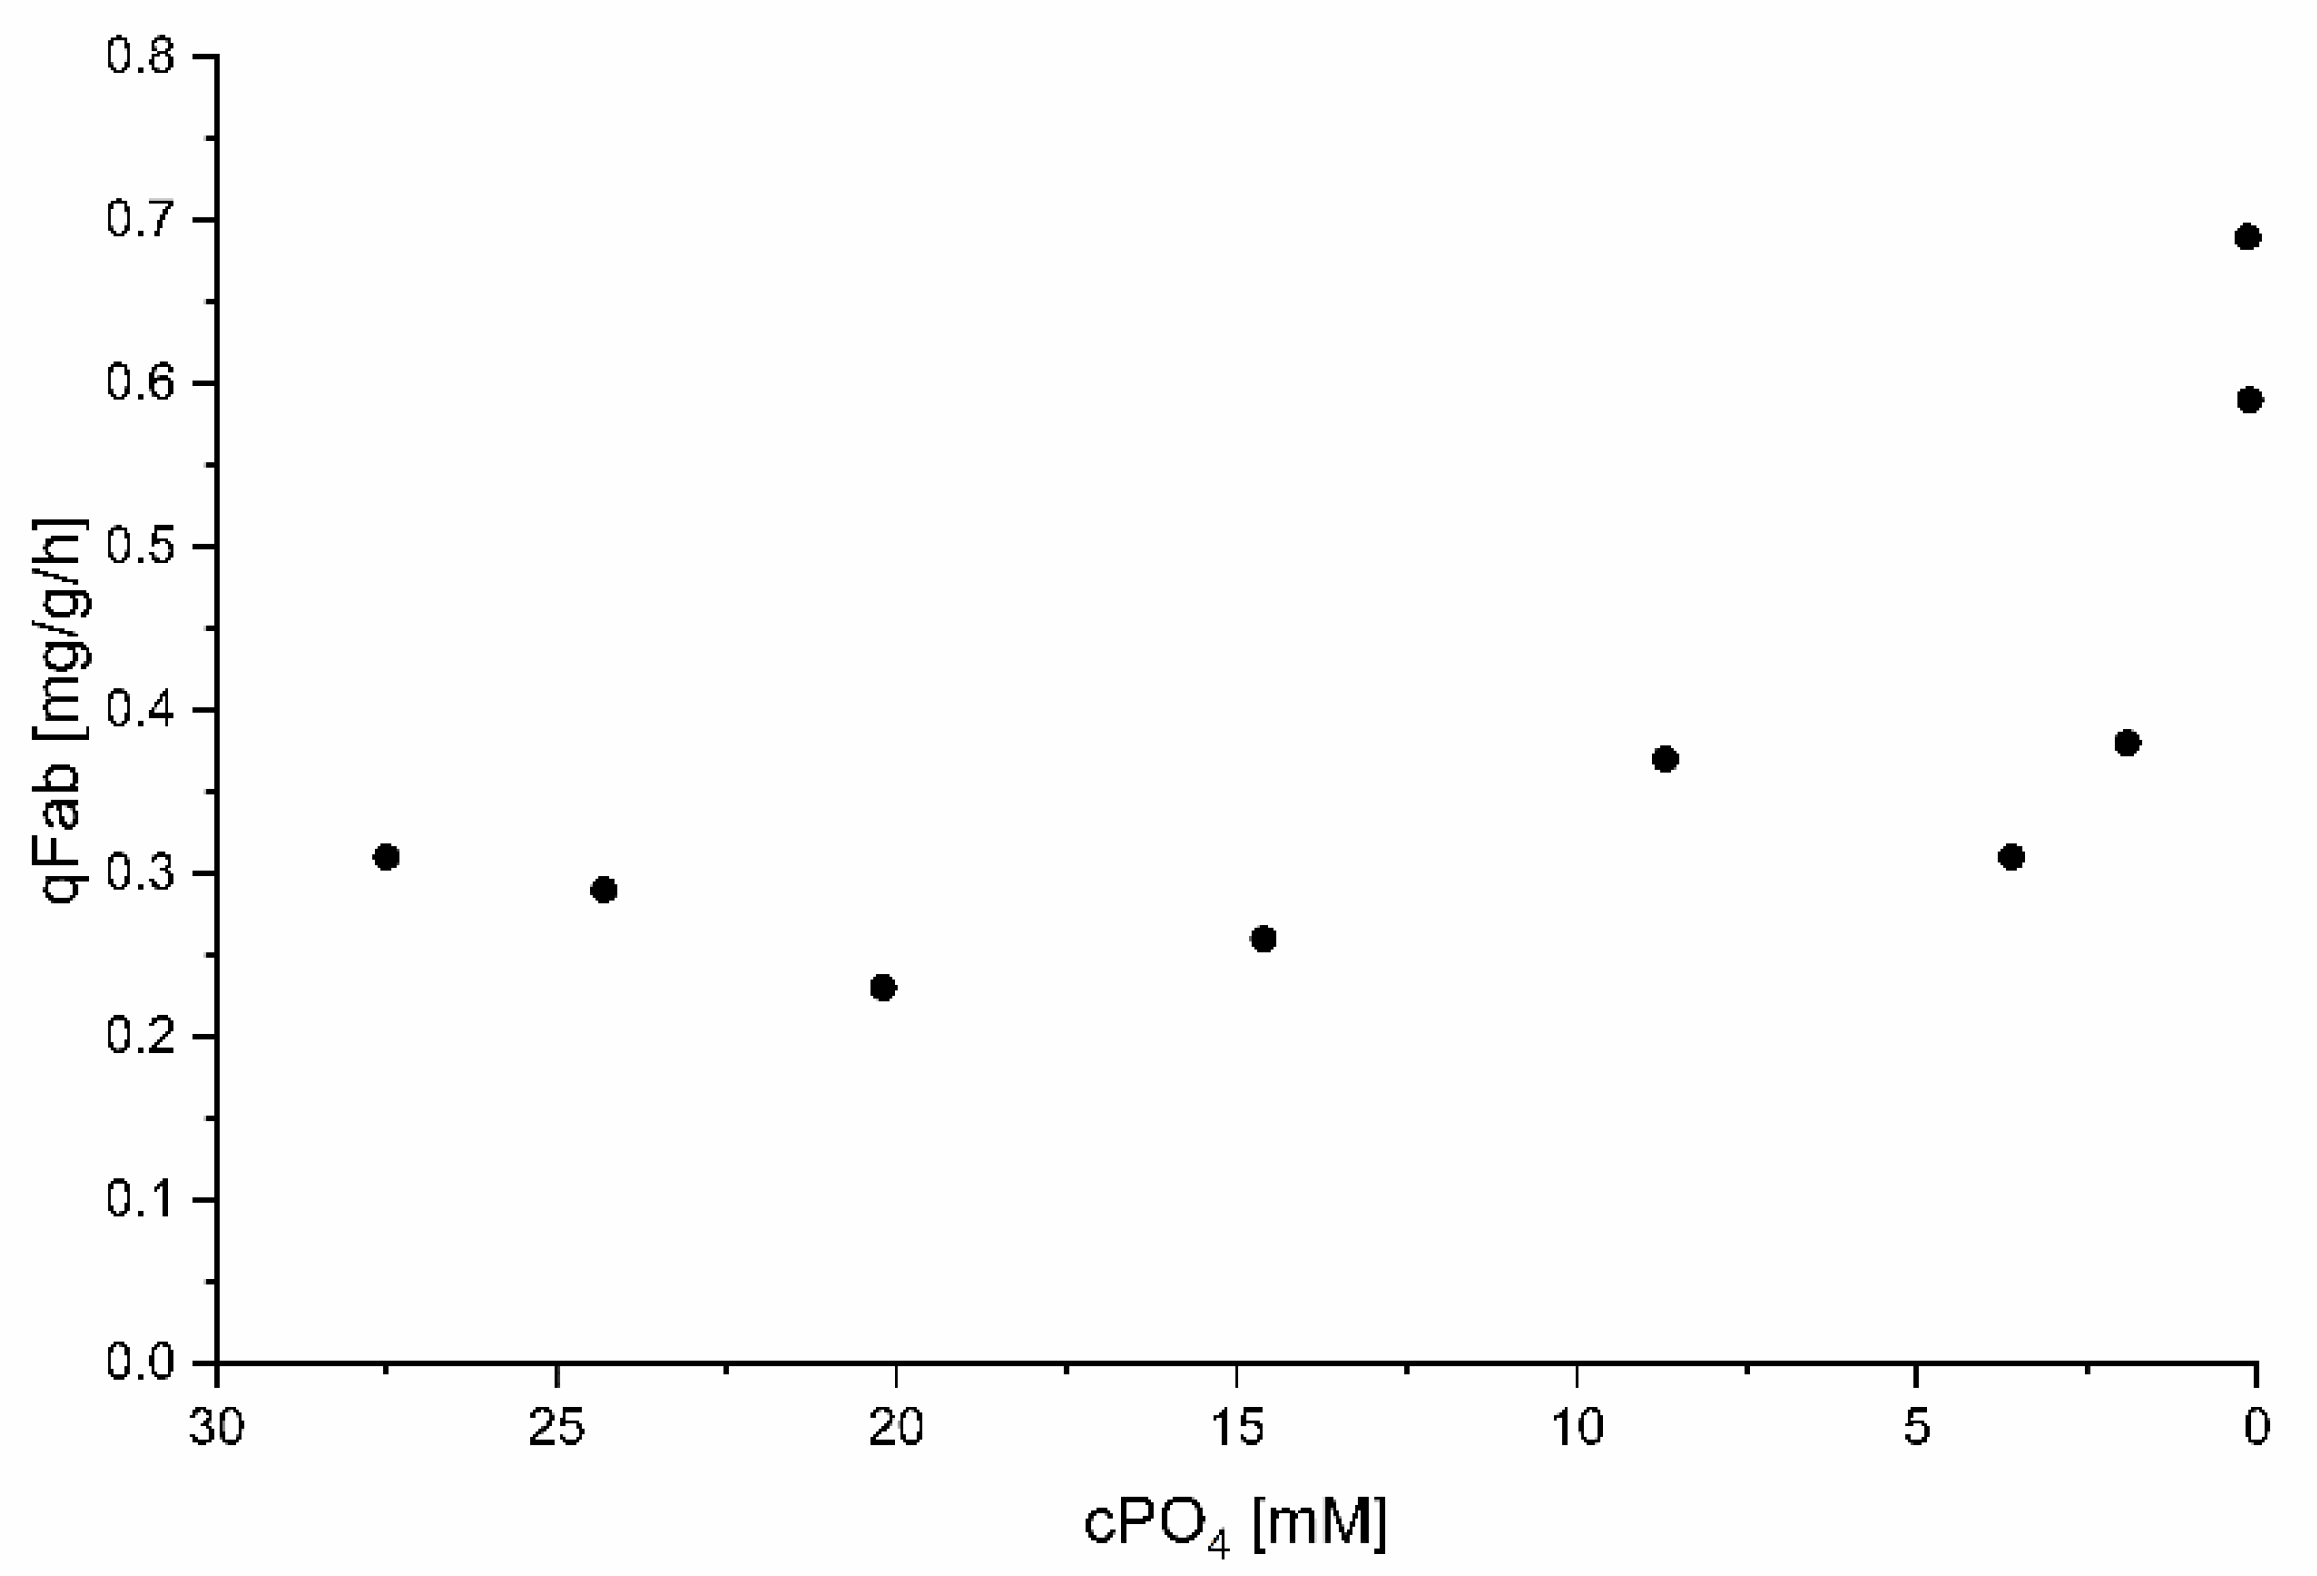
3.4.3. Impact of PO4 Conditions on Fab Productivity

Recombinant Fab production was already observed at non-limiting PO4 conditions indicating incomplete repression of the phoA promoter (Table 8). Although the phoA promoter system is usually tightly controlled, protein expression at increased PO4 concentrations has been reported before [24,59]: competition of plasmid and chromosomal DNA for the repressors involved in regulation of phoA-controlled gene expression have been reported to be the reason for leaky expression [24,52,59]. However, we clearly see a boost in qFab at PO4 concentrations of <1 mM (Table 8; Figure 3). Finally, a maximum specific and volumetric Fab titer of 7.2 mg/g DCW and 350 mg/L cultivation broth, respectively, was obtained at the end of cultivation.

4. Discussion

In a recent study, Luo et al. showed the high potential of the pAT system for the extracellular production of a series of Fabs [3]. The pAT system allows auto-induction regulated by limitation of phosphate (PO4) in the cultivation broth. In contrast to the established pET system, it does not require the addition of expensive/toxic inducers and allows simple process regimes. However, detailed information regarding performance under different cultivation conditions, especially PO4 concentrations, is scarce.
In this study we directly compared the commonly used T7-based pET expression system and the pAT system for the recombinant production of a model Fab in E. coli under equal cultivation conditions and then investigated the pAT system in detail. For directly comparing the pET and the pAT system we chose cultivation conditions which (1) have been reported in literature for these systems before (e.g., [60,61,62,63]), and (2) can be also implemented on an industrial scale. Even though literature also discusses much lower cultivation temperatures below 30 °C especially for the T7 expression system (e.g., [64,65,66,67,68]), we chose 30 °C and 35 °C as these temperatures are feasible and can be controlled at large scales [69]. Even though we believe that lower temperatures during induction boost the formation of soluble product, we considered potential limitations in cooling capacities at large scales for our experimental design. Besides, we aimed for a direct comparison of the two-expression systems pET and pAT under equal cultivation conditions and thus chose conditions which have been reported for both systems before [3]. We also neglected the use of an autoinduction medium based on lactose for the T7 system (e.g., [68,70,71]) in the current study, as this type of medium is not widely accepted in the biopharmaceutical industry. For T7-based pET expression systems induction by IPTG is still the state-of-the-art. Since the DE3 system is not required for phoA-based recombinant protein production, we used an E. coli W3110 chassis strain for investigating the pAT system. This E. coli strain has been used for such purposes before [50,72]. The cultivations for strain characterization of the pET and the pAT system were performed only once—however, closing C-balances confirm the accuracy of the data.
In our study, we underline the recent findings of Luo et al. [3] of the superiority of the pAT system compared to the T7-based pET system. Under comparable cultivation conditions, the pET system resulted in a five-fold higher formation of Fab IBs compared to soluble Fab, whereas the pAT system gave comparable amounts of IBs and soluble Fab. To get better understanding and extend the current knowledge of the valuable pAT system we characterized this system in more detail. The phoA-based recombinant protein production in E. coli is typically executed until PO4 starvation (<0.1 mM; [3,9,24,73]. However, in this study we showed that cultivation until PO4 starvation induces drastic physiological changes (Table 7), ultimately resulting in collapsing cell metabolism and potential product loss. As extracellular PO4 already depletes several hours before PO4 starvation it is tricky to identify the optimal time point of harvest in a typical fed-batch cultivation. Based on our findings that qFab is already quite high at PO4 concentrations >0.1 mM (Table 8), we recommend to use the CEDEX Bio HT device to monitor the fed-batch until a PO4 concentration close to 0.1 mM is reached. Then we suggest to add PO4 to the feed medium to allow extended cultivation at this PO4 concentration in the bioreactor and thus obtain a boosted STY. Summarizing, our study extends the knowledge on the E. coli phoA expression system and demonstrates its high potential for the successful production of periplasmic products in E. coli.

Supplementary Materials

The following supporting information can be downloaded at: https://www.mdpi.com/article/10.3390/fermentation8040181/s1, Figure S1: Time courses of extracellular PO4 concentration in the culture broth (black circles) and intracellular P content of the E. coli W3110 biomass (blue squares) during fed-batch cultivation until PO4 starvation; Table S1: Extended strain physiological parameters for pET cultivations; Table S2: Extended Fab production data for pET cultivations; Table S3: Extended strain physiological parameters for pAT cultivations.; Table S4: Extended Fab production data for pAT cultivations.; Table S5: Extracellular DNA contents of pET and pAT cultivations; Table S6: Extended overview of strain physiological parameters of E. coli W3110 harboring the phoA expression system at different extracellular PO4 concentrations.

Author Contributions

All authors contributed substantially to this work, in the form of: Conceptualization, O.S.; Methodology, O.S., S.K. (Stefan Kittler), T.G.; Formal Analysis, S.K. (Stefan Kittler), T.G., J.K.; Investigation, S.K. (Stefan Kittler), T.G., S.K. (Sabine Kubicek); Writing—Original Draft Preparation, S.K. (Stefan Kittler), T.G.; Writing—Review & Editing, J.K., O.S.; Visualization, S.K. (Stefan Kittler), T.G., S.K. (Sabine Kubicek); Supervision, J.K., O.S.; Project Administration, O.S. All authors have read and agreed to the published version of the manuscript.

Funding

This research was funded by the Austrian Research Promotion Agency (FFG), project number 874206. The authors acknowledge TU Wien Bibliothek for financial support through its Open Access Funding by TU Wien.

Institutional Review Board Statement

Not applicable.

Informed Consent Statement

Not applicable.

Data Availability Statement

Not applicable.

Acknowledgments

Andreas Limbeck (TU Wien) is gratefully acknowledged for ICP-OES analyses. Mag. Johannes Theiner from University of Vienna (Microanalytical Laboratory) is gratefully acknowledged for determination of elemental biomass composition (intracellular phosphorus content). Peter Flotz assisted in the lab work. Alfred Gruber GmbH is gratefully thanked for supporting the research and being a project partner.

Conflicts of Interest

The authors declare no conflict of interest.

References

  1. Holt, L.J.; Herring, C.; Jespers, L.S.; Woolven, B.P.; Tomlinson, I.M. Domain antibodies: Proteins for therapy. Trends Biotechnol. 2003, 21, 484–490. [Google Scholar] [CrossRef] [PubMed]
  2. Rodrigo, G.; Gruvegard, M.; Van Alstine, J.M. Antibody Fragments and Their Purification by Protein L Affinity Chromatography. Antibodies 2015, 4, 259–277. [Google Scholar] [CrossRef] [Green Version]
  3. Luo, M.; Zhao, M.; Cagliero, C.; Jiang, H.; Xie, Y.; Zhu, J.; Yang, H.; Zhang, M.; Zheng, Y.; Yuan, Y.; et al. A general platform for efficient extracellular expression and purification of Fab from Escherichia coli. Appl. Microbiol. Biotechnol. 2019, 103, 3341–3353. [Google Scholar] [CrossRef] [PubMed]
  4. Rosano, G.L.; Ceccarelli, E.A. Recombinant protein expression in Escherichia coli: Advances and challenges. Front. Microbiol. 2014, 5, 172. [Google Scholar] [CrossRef] [PubMed] [Green Version]
  5. Kadokura, H.; Katzen, F.; Beckwith, J. Protein disulfide bond formation in prokaryotes. Annu. Rev. Biochem. 2003, 72, 111–135. [Google Scholar] [CrossRef] [PubMed]
  6. Gundinger, T.; Spadiut, O. A comparative approach to recombinantly produce the plant enzyme horseradish peroxidase in Escherichia coli. J. Biotechnol. 2017, 248, 15–24. [Google Scholar] [CrossRef]
  7. Skerra, A.; Pluckthun, A. Assembly of a functional immunoglobulin Fv fragment in Escherichia coli. Science 1988, 240, 1038–1041. [Google Scholar] [CrossRef]
  8. Ukkonen, K.; Veijola, J.; Vasala, A.; Neubauer, P. Effect of culture medium, host strain and oxygen transfer on recombinant Fab antibody fragment yield and leakage to medium in shaken E. coli cultures. Microb. Cell Fact. 2013, 12, 73. [Google Scholar] [CrossRef] [Green Version]
  9. Carter, P.; Kelley, R.F.; Rodrigues, M.L.; Snedecor, B.; Covarrubias, M.; Velligan, M.D.; Wong, W.L.; Rowland, A.M.; Kotts, C.E.; Carver, M.E.; et al. High level Escherichia coli expression and production of a bivalent humanized antibody fragment. Biotechnology 1992, 10, 163–167. [Google Scholar] [CrossRef]
  10. Better, M.; Chang, C.P.; Robinson, R.R.; Horwitz, A.H. Escherichia coli secretion of an active chimeric antibody fragment. Science 1988, 240, 1041–1043. [Google Scholar] [CrossRef]
  11. Ellis, M.; Patel, P.; Edon, M.; Ramage, W.; Dickinson, R.; Humphreys, D.P. Development of a high yielding E. coli periplasmic expression system for the production of humanized Fab’ fragments. Biotechnol. Prog. 2017, 33, 212–220. [Google Scholar] [CrossRef]
  12. Shibui, T.; Munakata, K.; Matsumoto, R.; Ohta, K.; Matsushima, R.; Morimoto, Y.; Nagahari, K. High-level production and secretion of a mouse-human chimeric Fab fragment with specificity to human carcino embryonic antigen in Escherichia coli. Appl. Microbiol. Biotechnol. 1993, 38, 770–775. [Google Scholar] [CrossRef] [PubMed]
  13. Kulmala, A.; Huovinen, T.; Lamminmaki, U. Effect of DNA sequence of Fab fragment on yield characteristics and cell growth of E. coli. Sci. Rep. 2017, 7, 3796. [Google Scholar] [CrossRef] [PubMed]
  14. Levy, R.; Ahluwalia, K.; Bohmann, D.J.; Giang, H.M.; Schwimmer, L.J.; Issafras, H.; Reddy, N.B.; Chan, C.; Horwitz, A.H.; Takeuchi, T. Enhancement of antibody fragment secretion into the Escherichia coli periplasm by co-expression with the peptidyl prolyl isomerase, FkpA, in the cytoplasm. J. Immunol. Methods 2013, 394, 10–21. [Google Scholar] [CrossRef] [PubMed] [Green Version]
  15. Lin, B.; Renshaw, M.W.; Autote, K.; Smith, L.M.; Calveley, P.; Bowdish, K.S.; Frederickson, S. A step-wise approach significantly enhances protein yield of a rationally-designed agonist antibody fragment in E. coli. Protein Expr. Purif. 2008, 59, 55–63. [Google Scholar] [CrossRef]
  16. Frenzel, A.; Hust, M.; Schirrmann, T. Expression of recombinant antibodies. Front. Immunol. 2013, 4, 217. [Google Scholar] [CrossRef] [Green Version]
  17. Rosano, G.A.-O.; Morales, E.S.; Ceccarelli, E.A.-O. New tools for recombinant protein production in Escherichia coli: A 5-year update. Protein Sci. 2019, 28, 1412–1422. [Google Scholar] [CrossRef]
  18. Ukkonen, K.; Vasala, A.; Ojamo, H.; Neubauer, P. High-yield production of biologically active recombinant protein in shake flask culture by combination of enzyme-based glucose delivery and increased oxygen transfer. Microb. Cell Fact. 2011, 10, 107. [Google Scholar] [CrossRef] [Green Version]
  19. Nadkarni, A.; Kelley, L.L.; Momany, C. Optimization of a mouse recombinant antibody fragment for efficient production from Escherichia coli. Protein Expr. Purif. 2007, 52, 219–229. [Google Scholar] [CrossRef]
  20. Friedrich, L.; Stangl, S.; Hahne, H.; Kuster, B.; Kohler, P.; Multhoff, G.; Skerra, A. Bacterial production and functional characterization of the Fab fragment of the murine IgG1/lambda monoclonal antibody cmHsp70.1, a reagent for tumour diagnostics. Protein Eng. Des. Sel. PEDS 2010, 23, 161–168. [Google Scholar] [CrossRef]
  21. Gupta, S.K.; Shukla, P. Microbial platform technology for recombinant antibody fragment production: A review. Crit. Rev. Microbiol. 2017, 43, 31–42. [Google Scholar] [CrossRef]
  22. De Palma, A. Advances in protein expression. Genet. Eng. Biotechnol. News 2014, 34, 24–25, 27. [Google Scholar] [CrossRef]
  23. Pack, P.; Kujau, M.; Schroeckh, V.; Knupfer, U.; Wenderoth, R.; Riesenberg, D.; Pluckthun, A. Improved bivalent miniantibodies, with identical avidity as whole antibodies, produced by high cell density fermentation of Escherichia coli. Biotechnology 1993, 11, 1271–1277. [Google Scholar] [CrossRef]
  24. Shin, P.K.; Seo, J.H. Analysis of E. coli phoA-lacZ fusion gene expression inserted into a multicopy plasmid and host cell’s chromosome. Biotechnol. Bioeng. 1990, 36, 1097–1104. [Google Scholar] [CrossRef] [PubMed]
  25. Takagi, H.; Morinaga, Y.; Tsuchiya, M.; Ikemura, H.; Inouyea, M. Control of Folding of Proteins Secreted by a High Expression Secretion Vector, pIN-III-ompA: 16-Fold Increase in Production of Active Subtilisin E in Escherichia coli. Biotechnology 1988, 6, 948. [Google Scholar] [CrossRef]
  26. Harrison, J.S.; Keshavarz-Moore, E. Production of antibody fragments in Escherichia coli. Ann. N. Y. Acad. Sci. 1996, 782, 143–158. [Google Scholar] [CrossRef] [PubMed]
  27. Baneyx, F. Recombinant protein expression in Escherichia coli. Curr. Opin. Biotechnol. 1999, 10, 411–421. [Google Scholar] [CrossRef]
  28. Mergulhao, F.J.; Monteiro, G.A. Secretion capacity limitations of the Sec pathway in Escherichia coli. J. Microb. Biotechnol. 2004, 14, 128–133. [Google Scholar]
  29. Zhang, L.; Cao, Y.; Liu, M.; Chen, X.; Xiang, Q.; Tian, J. Functional recombinant single-chain variable fragment antibody against Agkistrodon acutus venom. Exp. Med 2019, 17, 3768–3774. [Google Scholar] [CrossRef] [Green Version]
  30. Ge, S.; Xu, L.; Li, B.; Zhong, F.; Liu, X.; Zhang, X. Canine Parvovirus is diagnosed and neutralized by chicken IgY-scFv generated against the virus capsid protein. Vet. Res. 2020, 51, 110. [Google Scholar] [CrossRef]
  31. Sharma, S.K.; Suresh, M.R.; Wuest, F.R. Improved soluble expression of a single-chain antibody fragment in E. coli for targeting CA125 in epithelial ovarian cancer. Protein Expr. Purif. 2014, 102, 27–37. [Google Scholar] [CrossRef] [PubMed]
  32. Wechselberger, P.; Sagmeister, P.; Herwig, C. Real-time estimation of biomass and specific growth rate in physiologically variable recombinant fed-batch processes. Bioprocess Biosyst. Eng. 2013, 36, 1205–1218. [Google Scholar] [CrossRef] [PubMed] [Green Version]
  33. DeLisa, M.P.; Li, J.; Rao, G.; Weigand, W.A.; Bentley, W.E. Monitoring GFP-operon fusion protein expression during high cell density cultivation of Escherichia coli using an on-line optical sensor. Biotechnol. Bioeng. 1999, 65, 54–64. [Google Scholar] [CrossRef]
  34. Wurm, D.J.; Veiter, L.; Ulonska, S.; Eggenreich, B.; Herwig, C.; Spadiut, O. The E. coli pET expression system revisited-mechanistic correlation between glucose and lactose uptake. Appl. Microbiol. Biotechnol. 2016, 100, 8721–8729. [Google Scholar] [CrossRef] [Green Version]
  35. Marschall, L.; Sagmeister, P.; Herwig, C. Tunable recombinant protein expression in E. coli: Enabler for continuous processing? Appl. Microbiol. Biotechnol. 2016, 100, 5719–5728. [Google Scholar] [CrossRef] [Green Version]
  36. Larentis, A.L.; Nicolau, J.F.M.Q.; dos Santos Esteves, G.; Vareschini, D.T.; de Almeida, F.V.R.; dos Reis, M.G.; Galler, R.; Medeiros, M.A. Evaluation of pre-induction temperature, cell growth at induction and IPTG concentration on the expression of a leptospiral protein in E. coli using shaking flasks and microbioreactor. BMC Res. Notes 2014, 7, 671. [Google Scholar] [CrossRef] [Green Version]
  37. Gundinger, T.; Pansy, A.; Spadiut, O. A sensitive and robust HPLC method to quantify recombinant antibody fragments in E. coli crude cell lysate. J. Chromatogr. B Anal. Technol. Biomed. Life Sci. 2018, 1083, 242–248. [Google Scholar] [CrossRef]
  38. Wurm, D.J.; Quehenberger, J.; Mildner, J.; Eggenreich, B.; Slouka, C.; Schwaighofer, A.; Wieland, K.; Lendl, B.; Rajamanickam, V.; Herwig, C.; et al. Teaching an old pET new tricks: Tuning of inclusion body formation and properties by a mixed feed system in E. coli. Appl. Microbiol. Biotechnol. 2018, 102, 667–676. [Google Scholar] [CrossRef] [Green Version]
  39. Marisch, K.; Bayer, K.; Cserjan-Puschmann, M.; Luchner, M.; Striedner, G. Evaluation of three industrial Escherichia coli strains in fed-batch cultivations during high-level SOD protein production. Microb. Cell Fact. 2013, 12, 58. [Google Scholar] [CrossRef] [Green Version]
  40. Rajamanickam, V.; Wurm, D.; Slouka, C.; Herwig, C.; Spadiut, O. A novel toolbox for E. coli lysis monitoring. Anal. Bioanal. Chem. 2017, 409, 667–671. [Google Scholar] [CrossRef] [Green Version]
  41. Wurm, D.J.; Marschall, L.; Sagmeister, P.; Herwig, C.; Spadiut, O. Simple monitoring of cell leakiness and viability in Escherichia coli bioprocesses—A case study. Eng. Life Sci. 2017, 17, 598–604. [Google Scholar] [CrossRef] [PubMed] [Green Version]
  42. Kopp, J.; Slouka, C.; Ulonska, S.; Kager, J.; Fricke, J.; Spadiut, O.; Herwig, C. Impact of Glycerol as Carbon Source onto Specific Sugar and Inducer Uptake Rates and Inclusion Body Productivity in E. coli BL21(DE3). Bioengineering 2017, 5, 1. [Google Scholar] [CrossRef] [PubMed] [Green Version]
  43. Klumpp, S.; Zhang, Z.; Hwa, T. Growth rate-dependent global effects on gene expression in bacteria. Cell 2009, 139, 1366–1375. [Google Scholar] [CrossRef] [PubMed] [Green Version]
  44. Terpe, K. Overview of bacterial expression systems for heterologous protein production: From molecular and biochemical fundamentals to commercial systems. Appl. Microbiol. Biotechnol. 2006, 72, 211. [Google Scholar] [CrossRef] [PubMed]
  45. Takkinen, K.; Laukkanen, M.L.; Sizmann, D.; Alfthan, K.; Immonen, T.; Vanne, L.; Kaartinen, M.; Knowles, J.K.; Teeri, T.T. An active single-chain antibody containing a cellulase linker domain is secreted by Escherichia coli. Protein Eng. 1991, 4, 837–841. [Google Scholar] [CrossRef]
  46. Striedner, G.; Cserjan-Puschmann, M.; Pötschacher, F.; Bayer, K. Tuning the Transcription Rate of Recombinant Protein in Strong Escherichiacoli Expression Systems through Repressor Titration. Biotechnol. Prog. 2003, 19, 1427–1432. [Google Scholar] [CrossRef]
  47. Kikuchi, Y.; Yoda, K.; Yamasaki, M.; Tamura, G. The nucleotide sequence of the promoter and the amino-terminal region of alkaline phosphatase structural gene (phoA) of Escherichia coli. Nucleic Acids Res. 1981, 9, 5671–5678. [Google Scholar] [CrossRef]
  48. Wang, Z.; Gao, Y.; Luo, M.; Cagliero, C.; Jiang, H.; Xie, Y.; Zhu, J.; Lu, H. A PhoA-STII Based Method for Efficient Extracellular Secretion and Purification of Fab from Escherichia coli. Bio-Protocol 2019, 9, e3370. [Google Scholar] [CrossRef]
  49. Schuhmacher, T.; Löffler, M.; Hurler, T.; Takors, R. Phosphate limited fed-batch processes: Impact on carbon usage and energy metabolism in Escherichia coli. J. Biotechnol. 2014, 190, 96–104. [Google Scholar] [CrossRef]
  50. Rao, N.N.; Liu, S.; Kornberg, A. Inorganic polyphosphate in Escherichia coli: The phosphate regulon and the stringent response. J. Bacteriol. 1998, 180, 2186–2193. [Google Scholar] [CrossRef] [Green Version]
  51. Wanner, B.L. Phosphorus assimilation and control of the phosphate regulon. In Escherichia coli and Salmonella: Cellular and Molecular Biology, 2nd ed.; ASM Press: Washington, DC, USA, 1996; Volume 41, pp. 1357–1381. [Google Scholar]
  52. Wanner, B. Phosphate regulation of gene expression in E. coli. In Escherichia coli and Salmonella typhimurium: Cellular and Molecular Biology; ASM Press: Washington, DC, USA, 1987; Volume 2, pp. 1326–1333. [Google Scholar]
  53. Marzan, L.W.; Shimizu, K. Metabolic regulation of Escherichia coli and its phoB and phoR genes knockout mutants under phosphate and nitrogen limitations as well as at acidic condition. Microb. Cell Fact. 2011, 10, 39. [Google Scholar] [CrossRef] [PubMed] [Green Version]
  54. Baca, M.; Wells, J.A. Anti-VEGF Antibodies. US Patent 6,884,879, 26 April 2005. [Google Scholar]
  55. Romano, S.; Schulz-Vogt, H.N.; González, J.M.; Bondarev, V. Phosphate limitation induces drastic physiological changes, virulence-related gene expression, and secondary metabolite production in Pseudovibrio sp. strain FO-BEG1. Appl. Environ. Microbiol. 2015, 81, 3518–3528. [Google Scholar] [CrossRef] [PubMed] [Green Version]
  56. Doran, P.M. Bioprocess Engineering Principles, 2nd ed.; Elsevier: Amsterdam, The Netherlands, 2012. [Google Scholar]
  57. Santos-Beneit, F. The Pho regulon: A huge regulatory network in bacteria. Front. Microbiol. 2015, 6, 402. [Google Scholar] [CrossRef] [Green Version]
  58. Ghorbel, S.; Smirnov, A.; Chouayekh, H.; Sperandio, B.; Esnault, C.; Kormanec, J.; Virolle, M.J. Regulation of ppk expression and in vivo function of Ppk in Streptomyces lividans TK24. J. Bacteriol. 2006, 188, 6269–6276. [Google Scholar] [CrossRef] [PubMed] [Green Version]
  59. Wanner, B.L. Signal transduction in the control of phosphate-regulated genes of Escherichia coli. Kidney Int. 1996, 49, 964–967. [Google Scholar] [CrossRef] [Green Version]
  60. Muller, J.M.; Wetzel, D.; Flaschel, E.; Friehs, K.; Risse, J.M. Constitutive production and efficient secretion of soluble full-length streptavidin by an Escherichia coli “leaky mutant”. J. Biotechnol. 2016, 221, 91–100. [Google Scholar] [CrossRef]
  61. Morowvat, M.H.; Babaeipour, V.; Rajabi-Memari, H.; Vahidi, H.; Maghsoudi, N. Overexpression of Recombinant Human Beta Interferon (rhINF-beta) in Periplasmic Space of Escherichia coli. Iran. J. Pharm. Res. 2014, 13, 151–160. [Google Scholar]
  62. Song, H.; Jiang, J.; Wang, X.; Zhang, J. High purity recombinant human growth hormone (rhGH) expression in Escherichia coli under phoA promoter. Bioengineered 2017, 8, 147–153. [Google Scholar] [CrossRef] [Green Version]
  63. Agbogbo, F.K.; Ramsey, P.; George, R.; Joy, J.; Srivastava, S.; Huang, M.; McCool, J. Upstream development of Escherichia coli fermentation process with PhoA promoter using design of experiments (DoE). J. Ind. Microbiol. Biotechnol. 2020, 47, 789–799. [Google Scholar] [CrossRef]
  64. Sohoni, S.V.; Nelapati, D.; Sathe, S.; Javadekar-Subhedar, V.; Gaikaiwari, R.P.; Wangikar, P.P. Optimization of high cell density fermentation process for recombinant nitrilase production in E. coli. Bioresour. Technol. 2015, 188, 202–208. [Google Scholar] [CrossRef]
  65. Maldonado, L.M.; Hernandez, V.E.; Rivero, E.M.; Barba de la Rosa, A.P.; Flores, J.L.; Acevedo, L.G.; De Leon Rodriguez, A. Optimization of culture conditions for a synthetic gene expression in Escherichia coli using response surface methodology: The case of human interferon beta. Biomol. Eng. 2007, 24, 217–222. [Google Scholar] [CrossRef] [PubMed]
  66. Saida, F. Overview on the expression of toxic gene products in Escherichia coli. Curr. Protoc. Protein Sci. 2007. [Google Scholar] [CrossRef]
  67. Grunberg, S.; Wolf, E.J.; Jin, J.; Ganatra, M.B.; Becker, K.; Ruse, C.; Taron, C.H.; Correa, I.R., Jr.; Yigit, E. Enhanced expression and purification of nucleotide-specific ribonucleases MC1 and Cusativin. Protein Expr. Purif. 2022, 190, 105987. [Google Scholar] [CrossRef] [PubMed]
  68. Fathi-Roudsari, M.; Maghsoudi, N.; Maghsoudi, A.; Niazi, S.; Soleiman, M. Auto-induction for high level production of biologically active reteplase in Escherichia coli. Protein Expr. Purif. 2018, 151, 18–22. [Google Scholar] [CrossRef] [PubMed]
  69. Cardoso, V.M.; Campani, G.; Santos, M.P.; Silva, G.G.; Pires, M.C.; Goncalves, V.M.; de Giordano, C.R.; Sargo, C.R.; Horta, A.C.L.; Zangirolami, T.C. Cost analysis based on bioreactor cultivation conditions: Production of a soluble recombinant protein using Escherichia coli BL21(DE3). Biotechnol. Rep. 2020, 26, e00441. [Google Scholar] [CrossRef]
  70. Tahara, N.; Tachibana, I.; Takeo, K.; Yamashita, S.; Shimada, A.; Hashimoto, M.; Ohno, S.; Yokogawa, T.; Nakagawa, T.; Suzuki, F.; et al. Boosting Auto-Induction of Recombinant Proteins in Escherichia coli with Glucose and Lactose Additives. Protein Pept. Lett. 2020, 28, 1180–1190. [Google Scholar] [CrossRef]
  71. Studier, F.W. Use of T7 RNA polymerase to direct expression of cloned genes. Methods Enzymol. 1990, 185, 60–89. [Google Scholar]
  72. Rao, N.N.; Wang, E.; Yashphe, J.; Torriani, A. Nucleotide pool in pho regulon mutants and alkaline phosphatase synthesis in Escherichia coli. J. Bacteriol. 1986, 166, 205–211. [Google Scholar] [CrossRef] [Green Version]
  73. Wang, Y.; Ding, H.; Du, P.; Gan, R.; Ye, Q. Production of phoA promoter-controlled human epidermal growth factor in fed-batch cultures of Escherichia coli YK537 (pAET-8). Process Biochem. 2005, 40, 3068–3074. [Google Scholar] [CrossRef]
Figure 1. Comparison of cultivation times, biomass concentrations and Fab production of the T7lac (pET 2_a4) and the phoA expression system (pAT 4_st) under conditions resulting in the highest space-time yield (STY) of soluble Fab. Fab production using the pET system gave highest productivity in cultivation at µ = 0.1 h−1 and 30 °C after 4 h induction time (pET 2_a4). The pAT system gave highest productivity in cultivation at µ = 0.05 h−1 and 30 °C until PO4 starvation (pAT 4_st). Presented standard deviations result from analytical measurements which were performed in triplicates.
Fermentation 08 00181 g001
Figure 2. Time courses of CO2 off-gas signal (black dots); extracellular PO4 concentration (cPO4; black squares) and E. coli dry cell weight (DCW; blue triangles) during fed-batch cultivation until PO4 starvation (indicated by a stagnation of the CO2 off-gas signal at around 43 h). The sudden drop of the CO2 off-gas signal at the end of cultivation (45 h) resulted from stopping the feed pump (C-source limitation) prior to cultivation end.
Fermentation 08 00181 g002
Figure 3. Specific product formation rate (qFab) as a function of the extracellular PO4 concentration (cPO4) during fed-batch cultivation until PO4 starvation. The average standard deviation was quantified with 9.69%.
Fermentation 08 00181 g003
Table 1. Strain physiological parameters for pET cultivations.
CultivationµTemp.InductionDCWGlucoseAcetateYX/SYCO2/SC-Balance
(h−1)(°C)(h)(g/L)(g/L)(g/L)(C-mol/C-mol)(C-mol/C-mol)
pET 10.1354 h40.11.5200.330.470.80
8 h40.3 +93.10.42n.d. *n.d. *n.d. *
pET 20.1304 h41.30.930.870.360.470.85
8 h42.621.700.250.610.84
pET 30.05354 h33.900.330.330.520.85
8 h36.9000.270.560.83
pET 40.05304 h36.400.520.370.480.85
8 h40.400.590.270.510.78
+ biomass concentration was calculated from OD600 due to unreliable values obtained from gravimetrical determination resulting from cell lysis (OD600/DCW correlation: DCW = 0.3077 × OD600; R2 = 1). * not determined due to cell lysis. Abbr.: YX/S, biomass/substrate yield; YCO2/S, CO2/substrate yield.
Table 2. Fab productivity for pET cultivations.
Fab Insoluble (IBs)Fab Soluble
Cult.µTemp.Ind.Spec. TiterVol. TiterSTYSpec. TiterVol. TiterSTYRatio
(h−1)(°C)(h)(mg/g)(mg/L)(mg/L/h)(mg/g)(mg/L)(mg/L/h)IB:SP *
pET 10.1354 h19.5782.633.42.2289.03.798.8
8 h22.2896.632.21.8976.52.7511.8
pET 20.1304 h14.9613.026.02.89119.55.075.1
8 h22.1942.433.92.42102.93.719.1
pET 30.05354 h20.4693.629.32.3880.63.418.6
8 h24.6907.733.52.2082.02.9911.2
pET 40.05304 h12.0436.518.32.81102.94.324.2
8 h20.9841.030.42.50101.53.678.3
* ratio of insoluble (IB) Fab titer compared to soluble (SP) Fab titer. Abbr.: STY, space-time yield.
Table 3. Impact of cultivation conditions on cultivation times for pAT cultivations.
CultivationµTemp.SamplePO4 Conc.Cultivation Time
(h−1)(°C)(-)(mM)(h)
pAT 10.135>1 mM PO42.3722.3
PO4 starvation0.1627.3
pAT 20.130>1 mM PO42.8222.4
PO4 starvation<0.1025.2
pAT 30.0535>1 mM PO44.5743.2
PO4 starvation0.39 *54.8
pAT 40.0530>1 mM PO44.4637.1
PO4 starvation0.1047.3
* higher due to potential cell lysis.
Table 4. Strain physiological parameters for pAT cultivations.
Cult.µTemp.SampleDCWqPO4GlucoseAcetateYX/SYCO2/SC-Balance
(h−1)(°C)(-)(g/L)(mmol/g/h)(g/L)(g/L)(C-mol/C-mol)(C-mol/C-mol)(-)
pAT 10.135>1 mM PO442.80.11200.280.450.420.87
PO4 starvation53.20.0081.700.990.300.490.80
pAT 20.130>1 mM PO447.60.09700.460.440.520.96
PO4 starvation52.00.01800.690.270.851.13
pAT 30.0535>1 mM PO431.80.0520-0.200.650.85
PO4 starvation47.10.00800.340.320.570.89
pAT 40.0530>1 mM PO443.00.05500.280.470.490.97
PO4 starvation52.60.00800.580.290.700.99
Abbr.: qPO4, specific phosphate uptake rate; YX/S, biomass/substrate yield; YCO2/S, CO2/substrate yield.
Table 5. Fab productivity for pAT cultivations.
Fab Insoluble (IBs)Fab Soluble
Cult.µTemp.SampleSpec. TiterVol. TiterSTYSpec. TiterVol. TiterSTYRatio
h−1)(°C)(-)(mg/g)(mg/L)(mg/L/h)(mg/g)(mg/L)(mg/L/h)IB:SP *
pAT 10.135>1 mM PO40002.2897.304.36n.a.
PO4 starvation0003.21170.96.24n.a.
pAT 20.130>1 mM PO40002.95140.46.27n.a.
PO4 starvation0002.91150.15.98n.a.
pAT 30.0535>1 mM PO40002.5380.621.86n.a.
PO4 starvation8.16385.07.022.54119.52.183.2
pAT 40.0530>1 mM PO40004.63198.85.37n.a.
PO4 starvation7.88414.28.766.09321.16.771.3
* ratio of insoluble (IB) Fab titer compared to soluble (SP) Fab titer. n.a., not applicable. Abbr.: STY, space-time yield.
Table 6. Overview of investigated analytical methods for PO4 monitoring.
ICP-OESICColorimetric KitCedex Bio HT
AnalytePPO4PO4PO4
Limit of Quantification65 µmol/L4 µmol/L5 µmol/L100 µmol/L
Equipment costs+
Sample preparation+
Operator’s impact~~+
Time>>30 min>>30 min>>30 min15 min
Automation+
At-line measurement+
Features are evaluated to be (1) advantageous (+); (2) disadvantageous (−) or (3) intermediate (~). Abbr.: ICP-OES, inductively coupled plasma-optical emission spectroscopy; IC, ion chromatography; P, phosphorus; PO4, phosphate.
Table 7. Strain physiological parameters of E. coli W3110 harboring the phoA expression system at different extracellular PO4 concentrations.
Process TimeDCWµcPO4qPO4YCO2/SYX/SC-Balance
(h)(g/L)(h−1)(mM)(mmol/g/h)(C-mol/C-mol)(C-mol/C-mol)(-)
27.429.0n.a.33.5n.a.0.540.551.09
29.330.70.04027.50.0900.580.380.98
31.332.00.03624.30.0590.590.320.89
33.334.30.04920.20.0530.580.420.99
35.337.00.05414.60.0700.570.451.01
37.339.00.0458.70.0710.560.360.91
39.341.40.0493.60.0610.560.380.93
41.345.50.0701.90.0180.540.541.07
43.348.70.0570.130.0180.560.430.99
45.0 *48.90.021<0.100.00030.820.190.99
n.a. not applicable, since this is the initial sample for characterization and calculation of specific rates. * time point of harvest. Abbr.: DCW, dry cell weight; µ, specific growth rate; cPO4, extracellular phosphate concentration; qPO4, specific PO4 uptake rate; YCO2/S, CO2/substrate yield; YX/S, biomass/substrate yield.
Table 8. Fab productivity of E. coli W3110 harboring the pAT expression system at different PO4 concentrations.
Process TimecPO4qPO4Spec. Fab TiterVol. Fab TiterqFabFab STY
(h)(mM)(mmol/g/h)(mg/g)(mg/L)(mg/g/h)(mg/L/h)
27.433.5n.a.5.26153n.a.n.a.
29.327.50.0905.461670.319.4
31.324.30.0595.651810.299.2
33.320.20.0535.561910.237.6
35.314.60.0705.492030.269.3
37.38.70.0715.722230.3714.0
39.33.60.0615.772390.3112.4
41.31.90.0185.732610.3816.6
43.30.130.0186.433130.6932.5
45.0 *<0.100.00037.153500.5928.6
n.a. not applicable, since this is the initial sample for characterization and calculation of specific rates. * time point of harvest. Abbr.: qFab, specific product formation rate; Fab STY, Fab space-time yield.
Publisher’s Note: MDPI stays neutral with regard to jurisdictional claims in published maps and institutional affiliations.

