Article

Using Machine Learning Methods to Predict the ß-Poly (L-Malic Acid) Production by Different Substrates Addition and Secondary Indexes in Strain Aureobasidium melanogenum

1
Key Laboratory of Industrial Fermentation Microbiology, Ministry of Education, Tianjin University of Science and Technology, Tianjin 300457, China
2
Tianjin Engineering Research Center of Microbial Metabolism and Fermentation Process Control, College of Biotechnology, Tianjin University of Science and Technology, Tianjin 300457, China
3
Tianjin Huizhi Biotrans Bioengineering Co., Ltd., Tianjin 300457, China
4
School of Bioengineering, Tianjin Modern Vocational Technology College, Tianjin 300350, China
*
Authors to whom correspondence should be addressed.
Fermentation 2022, 8(12), 729; https://doi.org/10.3390/fermentation8120729
Submission received: 2 November 2022 / Revised: 7 December 2022 / Accepted: 9 December 2022 / Published: 12 December 2022
(This article belongs to the Section Industrial Fermentation)

Abstract

:
ß-poly (L-malic acid) (PMLA) is a polyester ligated by malate subunits. It has a wide prospective application as an anti-cancer drug carrier, and its malate subunits have a great application in the food industry. The strain Aureoabsidium melanogenum could produce a high amount of PMLA during fermentation, and different substrates addition could influence the production. In this study, we directly added potassium acetate, corn steep liquor, MgSO4, MnSO4, vitamin B1, vitamin B2, and nicotinamide as the fermentation substrate to the basic fermentation medium based on a generated random matrix that represented the added value. The PMLA production and four secondary indexes, pH, biomass, osmotic pressure, and viscosity were measured after 144 h fermentation. Finally, a total of 212 samples were collected as the dataset, by which the machine learning methods were deployed to predict the PMLA production by different substrates’ concentrations and the secondary indexes. The results indicated that PMLA production was negatively correlated with corn steep liquor and betaine and positively correlated with potassium acetate. The PMLA production could be predicted using all different substrates’ concentrations with a Mean Absolute Error (MAE) of 4.164 g/L and with an MAE of 6.556 g/L by different secondary indexes. Finally, the convolutional neural network (CNN) was applied to predict the PMLA production by fermentation medium images, in which the collected images were categorized into three groups, 0–20 g/L, 21–40 g/L, and >41 g/L, based on the PMLA production. The CNN model could predict the production with high accuracy. The methods and results presented in this study provided new insight into evaluating different substrates concentration on PMLA production and demonstrating the possibility of using the convolutional neural network model in the PMLA fermentation industry.

1. Introduction

ß-poly (L-malic acid) (PMLA) is a polyester ligated by malate subunits [1]. Each malate subunit contains a free carboxyl group that could interact with other activating groups and chelates with the metal ions [2], which has great application potential [3]. Zhou [4] invented a dual pH-sensitive charge-reversal PMLA-based nano complex to deliver an anti-cancer drug. José [5] evaluated the ability of partially methylated PMLA as a novel protein delivery carrier. Furthermore, after the hydrolysis of PMLA, it releases its malate subunit, which has a great application in the food industry [6].
PMLA was first found to be produced by strain Physarum polycephalum, which could obtain a 2.7 g/L PMLA production [7,8,9]. Recently, PMLA was produced by strain A. melanogenum with a high amount of PMLA during fermentation, ranging from 10 g/L to 120 g/L, depending on different fermentation methods [6]. PMLA produced by microorganisms possesses eco-friendly and bio-degradable [10] characteristics compared to direct synthesis by chemical reaction [11]. The biosynthesis mechanism of PMLA [12,13,14] is mainly involved in the TCA cycle, glyoxylate pathway, and CO2 fixation pathway, and these pathways were related to the malate precursor. Several optimization methods were applied for Aureobasidium species fermentation. Ma [15] found that under 14% glucose concentration in a fermentation medium could increase PMLA production. Cao [16,17] adjusted pH and the stirring speed during fermentation to obtain a high PMLA production, and Tu [18] found that the addition of Tween 80 could benefit PMLA production.
The machine learning methods could be categorized into supervised and unsupervised learning [19]. Supervised learning often deals with regression and classification problems, which contain a label character in the dataset [20]. Today, many machine learning methods are used to analyze data, especially in medical data and images [21,22], but not much is used in the fermentation industry. However, the concentration of different substrates, fermentation indexes, and the fermentation images could be used as the dataset for machine learning analysis to predict the metabolites of interest.
In this study, we added potassium acetate, corn steep liquor (CSL), MgSO4, MnSO4, Vitamin B1, Vitamin B2, and nicotinamide as the fermentation substrates to the basic fermentation medium to ferment A. melanogenum and evaluated the effects of these substrates on PMLA production. Meanwhile, different substrates addition; secondary indexes, such as pH, osmotic pressure, biomass, and viscosity; and fermentation medium images were used to predict the PMLA production using different machine learning methods. Using secondary indexes and fermentation medium images to predict PMLA production can overcome the defect of the time-consuming traditional PMLA measurement and increase the PMLA fermentation efficiency.

2. Materials and Methods

2.1. Microorganism and Medium

A. melanogenum CGMCC18996 was isolated from soil and preserved in the China General Microbiological Culture Collection Center (Beijing, China No. CGMCC18996). The seed medium contained 60 g/L sucrose, 3 g/L yeast extract, 2 g/L succinic acid, 1 g/L (NH4)2SO4, 0.4 g/L K2CO3, 0.1 g/L KH2PO4, 0.1 g/L MgSO4, 0.05 g/L ZnSO4, and 0.1% corn steep liquor (CSL, V/V). The basic fermentation medium contained 180 g/L sucrose, 35 g/L peptone, and 0.1 g/L KH2PO4. Both seed and fermentation media were sterilized at 121 °C for 20 min before use.

2.2. Fermentation Medium with Different Adding Substrates

The added substrates were prepared in the water solution. Among them, the potassium acetate was prepared in 25 g/mL; betaine and MgSO4 in 5 g/mL; and MgSO4, MnSO4, Vitamin B1, Vitamin B2, and nicotinamide in 0.5 g/mL based on the experiment conducted formerly in our lab. The solution was then added to a 100 mL shake-flask containing 20 mL basic fermentation medium in the volume of 40 to 360 μL with a 40 μL interval.
The substrates addition matrix was generated by the Python NumPy package [23], which normalized the 40 to 360 μL addition value into numbers 0 to 9 to generate a random matrix. The generated matrix with the corresponding indexes is shown in the Supplementary File (Fermentation_matrix.xsl).

2.3. Fermentation Conditions

The primary seed culture of A. melanogenum CGMCC18996 was prepared by inoculating cells grown on a solid medium into 500 mL flasks that contained 300 mL seed culture medium, and then the medium was cultured at 25 °C for approximately 40 h in a rotary shaker. The fermentation experiment was conducted in the 500 mL flasks containing 100 mL fermentation medium for 144 h at 25 °C with 200 rpm/min.

2.4. Assay of PMLA Production and Fermentation Parameters

Fermentation broth (5 mL) was collected at a 24 h interval and centrifuged at 15,000 r/min. The resulting supernatant (2 mL) was mixed with 2 mL 2 M H2SO4 and then hydrolyzed at 110 °C for 11 h. After the hydrolyzation process, the sample was analyzed by HPLC (LC-20AT, Shimadzu Ltd., Kyoto, Japan) using a PrevailC18 organic acid column at 25 °C eluted with 25 mM KH2PO4 at a rate of 1.0 mL/min. The PMLA concentration was determined by comparing the difference between L-malate concentrations before and after hydrolysis.
The biomass was determined via the method of dry cell weight (DCW). Before measurement, the extra CaCO3 was eliminated using 3 M HCL. Then, the fermentation broth (2 mL) was centrifuged at 5000 rpm for 10 min, and the resulting precipitate was washed twice with phosphate buffer saline (PBS). After recentrifugation, the precipitates were dried overnight at 80 °C and then weighed.

2.5. Machine Learning Analysis

Four commonly used machine learning analysis methods, decision tree, random forest, bp neuron network, and support vector machine, were deployed using SPSSPRO (Scientific Platform Serving for Statistics Professional 2021. SPSSPRO. (Version 1.0.11) [Online Application Software]. Retrieved from https://www.spsspro.com, accessed on 1 October 2022). Among them, 70% of the data was selected as the training set and 30% of the data was selected as the test set, and the data were selected randomly. The convolutional neural network was deployed with 3 convolutional layers, 3 flatten layers, and a dense layer (with 128 neuron, relu activation function, and adam optimizer) with the Tensorflow package following the user guide (https://www.tensorflow.org/tutorials/, accessed on 1 November 2022) for image recognition. The images were taken after 144 h fermentation in the shake-flask, and the pictures were directly shot at the top of the flask in relatively the same environment (same place and same light).

3. Results and Discussion

3.1. Overall Data Analysis

The different concentrations of potassium acetate, CSL, MgSO4, MnSO4, Vitamin B1, Vitamin B2, and nicotinamide were added to the basic fermentation medium. After 144 h fermentation, the final PMLA production, pH, viscosity, biomass, and osmotic pressure were measured, and finally, a total of 212 fermentation samples were collected and prepared for analysis. The overall description is shown in Table 1. The results indicated that the S-W test of all characters was significant, suggesting that all characters were not following the standard distribution. Among them, the substrates were added based on a random matrix. Therefore, the middle and average were alike in the substrate characters. We used the medium [minimal, maximal] value to represent each character’s range. Therefore, after 144 h fermentation, the samples were in a situation with a pH of 6.08 [5.13, 6.95], osmotic pressure at 0.23 [0.12, 0.57] Pa, biomass at 53.5 [20.50, 94.50] g/L, viscosity at 36.25 [9.00, 100.50] mPas, and PMLA production at 34.96 [6.17, 61.87] g/L.
The research found that adding mixed sugars, bagasse hydrolysates, and CSL could significantly increase PMLA production [24,25,26]. In this study, we collected different substrates that may influence PMLA production, such as potassium acetate, which could increase PMLA yield [unpublished paper]. The added value of the substrates followed a generated random matrix to randomize the addition values and therefore randomize the secondary indexes and PMLA production. With a large number of fermentation samples, this method could relatively eliminate errors in the analysis.

3.2. The Correlation Analysis of Different Substrates Concentration and Different Secondary Indexes on PMLA Production

After collecting 212 samples, the correlations between the concentration of different substrates on pH, biomass concentration, final osmotic pressure, viscosity, and final PMLA production were evaluated, and the results are shown in Table 2. Among them, PMLA production was extremely negatively correlated with CSL, betaine, Vitamin B1, and nicotinamide, in which the CSL and betaine showed a higher negative coefficient compared to the others. The biomass showed an extremely negative correlation with MnSO4, and the osmatic pressure was extremely positively correlated with potassium acetate and negatively correlated with CSL and betaine. The viscosity was extremely negatively correlated with CSL and betaine. Therefore, the results indicated that all the substrates except vitamin B6 had a certain degree of effect on PMLA fermentation parameters.
Production and biomass are two critical indicators during fermentation, and Table 2 showed that potassium acetate and biomass had a positively correlated coefficient on final PMLA production and CSL. Therefore, this result illustrates that adding potassium acetate and CSL would benefit PMLA production and biomass. CSL is an inexpensive substrate for efficient target metabolite production due to its large amounts of amino acids [27,28]. Therefore, it would benefit the biomass of A. melanogenum. The potassium acetate contains acetate, which could be converted to acetyl-CoA by acetyl-CoA synthetase [29], benefiting the TCA cycle, which could produce PMLA’s precursor malate.
Four secondary indexes, pH, osmotic pressure, viscosity, and biomass, were collected and measured at the end of the fermentation. Table 3 shows the correlation matrix between each index on final PMLA production, in which the pH showed a negatively correlated effect, and viscosity showed a positively correlated effect. This result suggested that the secondary indexes could correlate with final PMLA production and could be used as the input parameters to predict PMLA production using the machine learning method.
Due to the time-consuming process of PMLA measurement, usually taking 2 d for hydrolysis and HPLC analysis, we would like to explore the possibility of using easily measured indexes to predict the PMLA production and therefore could monitor the PMLA production in time to decide whether the PMLA production reaches the requirement in a fermenter or shake-flask.

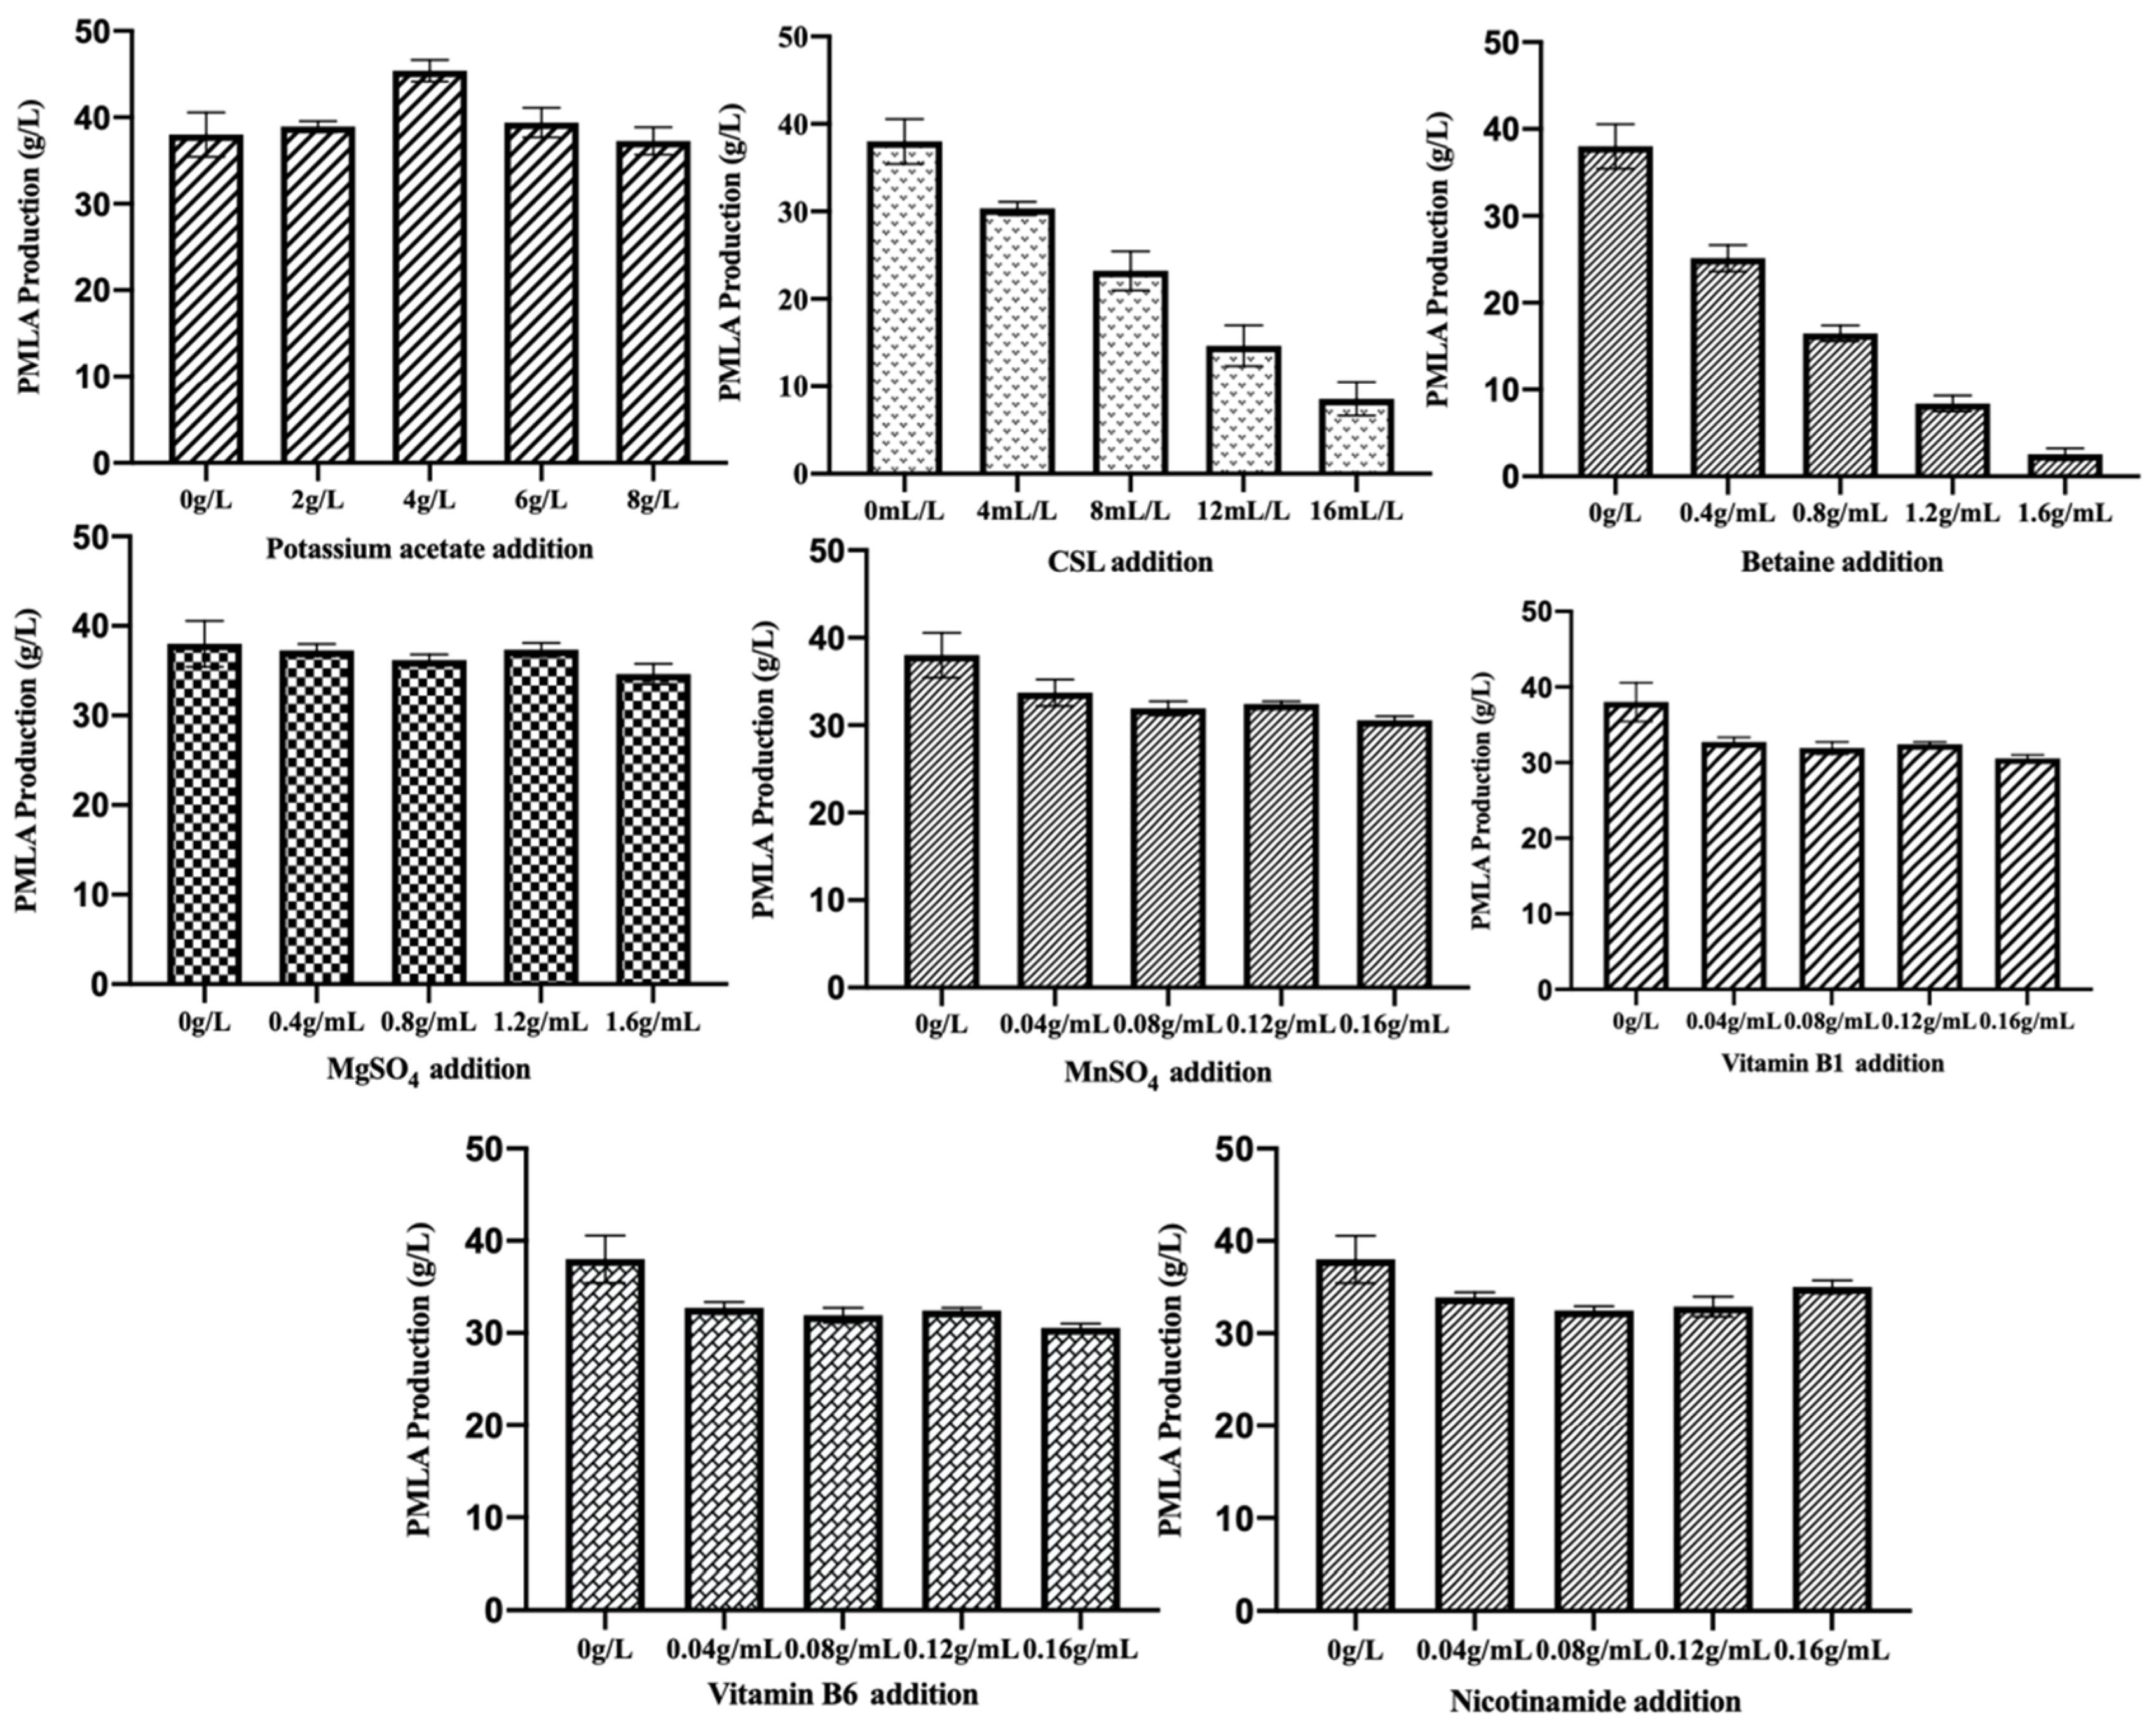
3.3. Evaluation of Single Substrates Addition on PMLA

The basic fermentation medium with single substrate addition was evaluated, and the results were shown in Figure 1, which indicated that PMLA production slightly increased with acetate potassium addition and decreased with the addition of CSL and betaine. However, PMLA production slightly decreased after MnSO4, Vitamin B1, Vitamin B6, and nicotinamide addition, and the MgSO4 addition suggested a non-influence effect on PMLA production.
The correlation matrix between final PMLA production and different substrates addition showed that final PMLA production had a great negative correlation with CSL and betaine, and a slightly negative correlation with other substrates except for acetate potassium, which showed a slightly positive correlation with final PMLA production. The results in Figure 1 showed consistency with the correlation matrix shown in Table 1, demonstrating that adding different substrates in the basic fermentation medium spontaneously had the same results as adding these substrates separately.

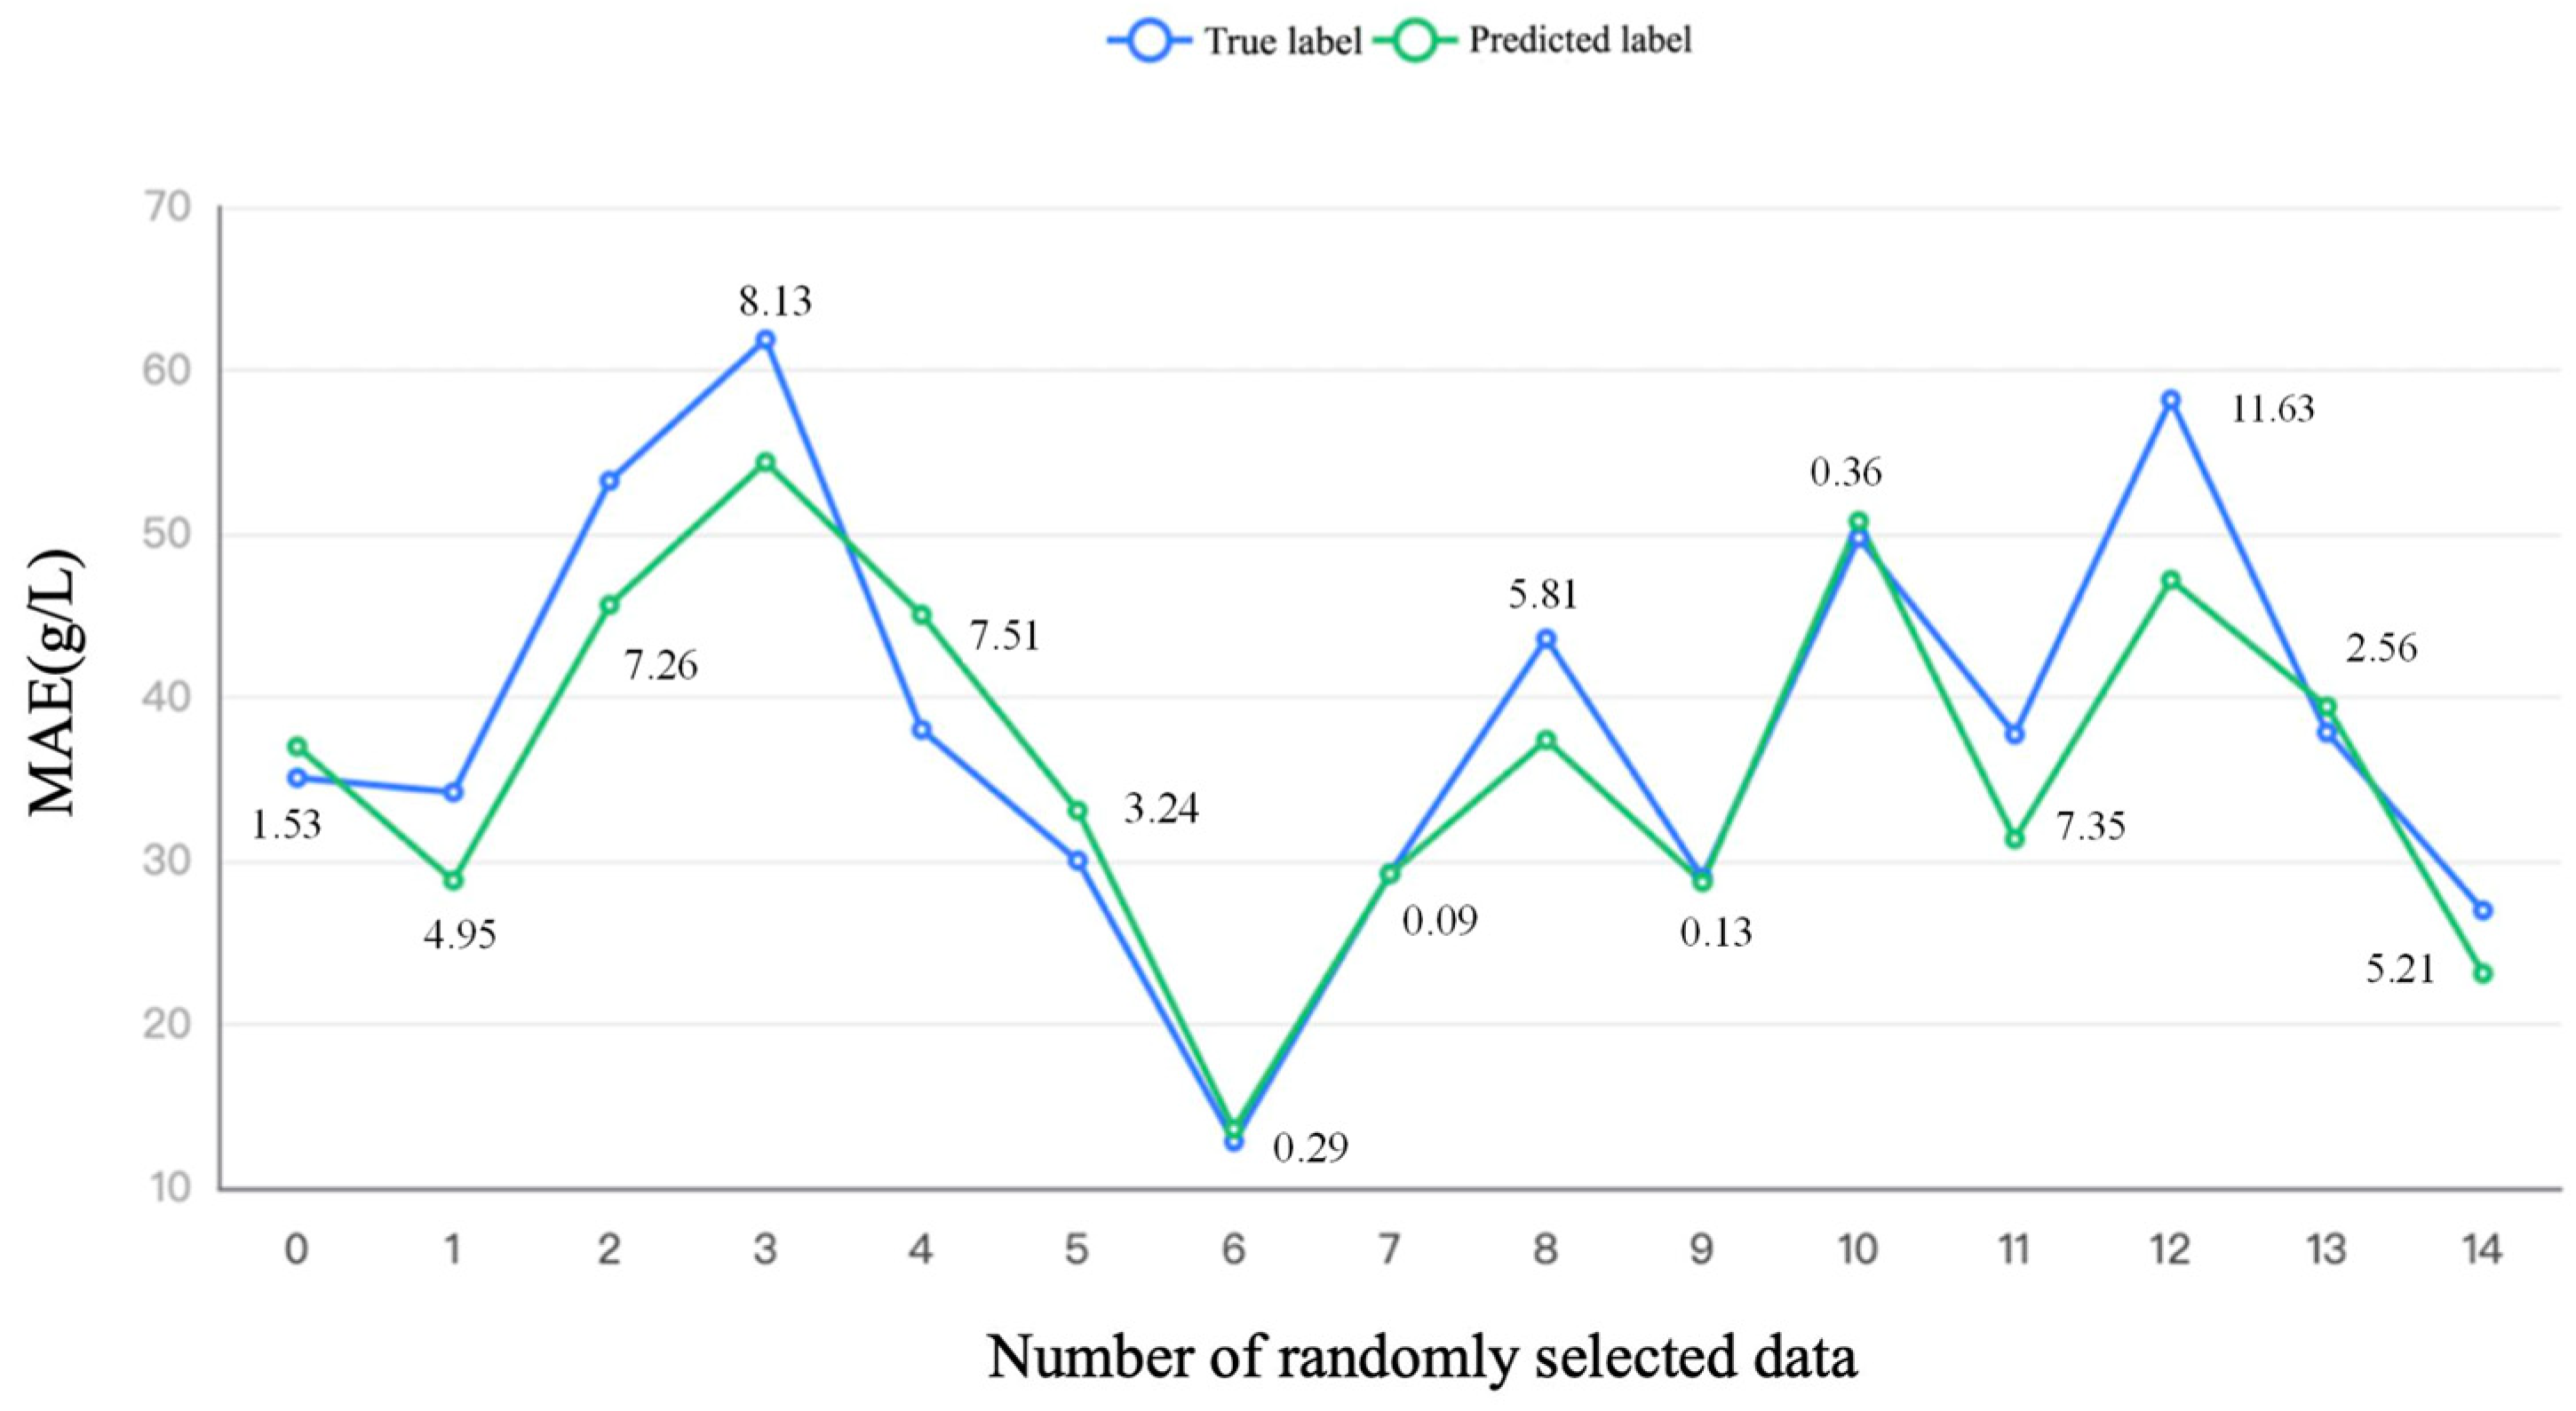
3.4. Prediction of Final PMLA Production Based on Different Substrates

Four common machine learning methods [30], decision tree, random forest, Bp neuron network, and support vector machine, were used to predict the final PMLA production by different substrates and secondary indexes. The results are shown in Table 4, in which the mean absolute error (MAE) was used to determine whether a proper machine learning method was deployed. The training set was composed of 70% data to train the model, and the test set was composed of another 30% to validate the model, where the smaller MAE represented the better model. Finally, the results indicated that the decision tree obtained 1.475 g/L MAE in the training set and 7.369 g/L in the test set, random forest obtained 2.21 g/L MAE in the training set and 5.53 g/L MAE in the test set, bp neuron network obtained 4.215 g/L MAE in the training set and 4.164 g/L MAE in the test set, and support vector machine obtained 4.367 g/L MAE in the training set and 4.506 g/L MAE in the test set. Therefore, the bp neuron network method obtained the smallest MAE in the test set. The difference between the training set and test set was also the smallest among other methods, indicating no over-fit happened during the training process.
The difference between the model-predicted and true labels is shown in Figure 2, in which 15 data were randomly selected and the absolute difference was calculated. The small difference between the true and predicted labels indicated that data training by the bp neuron method model can predict the PMLA production based on the different substrates and could make a proper prediction.

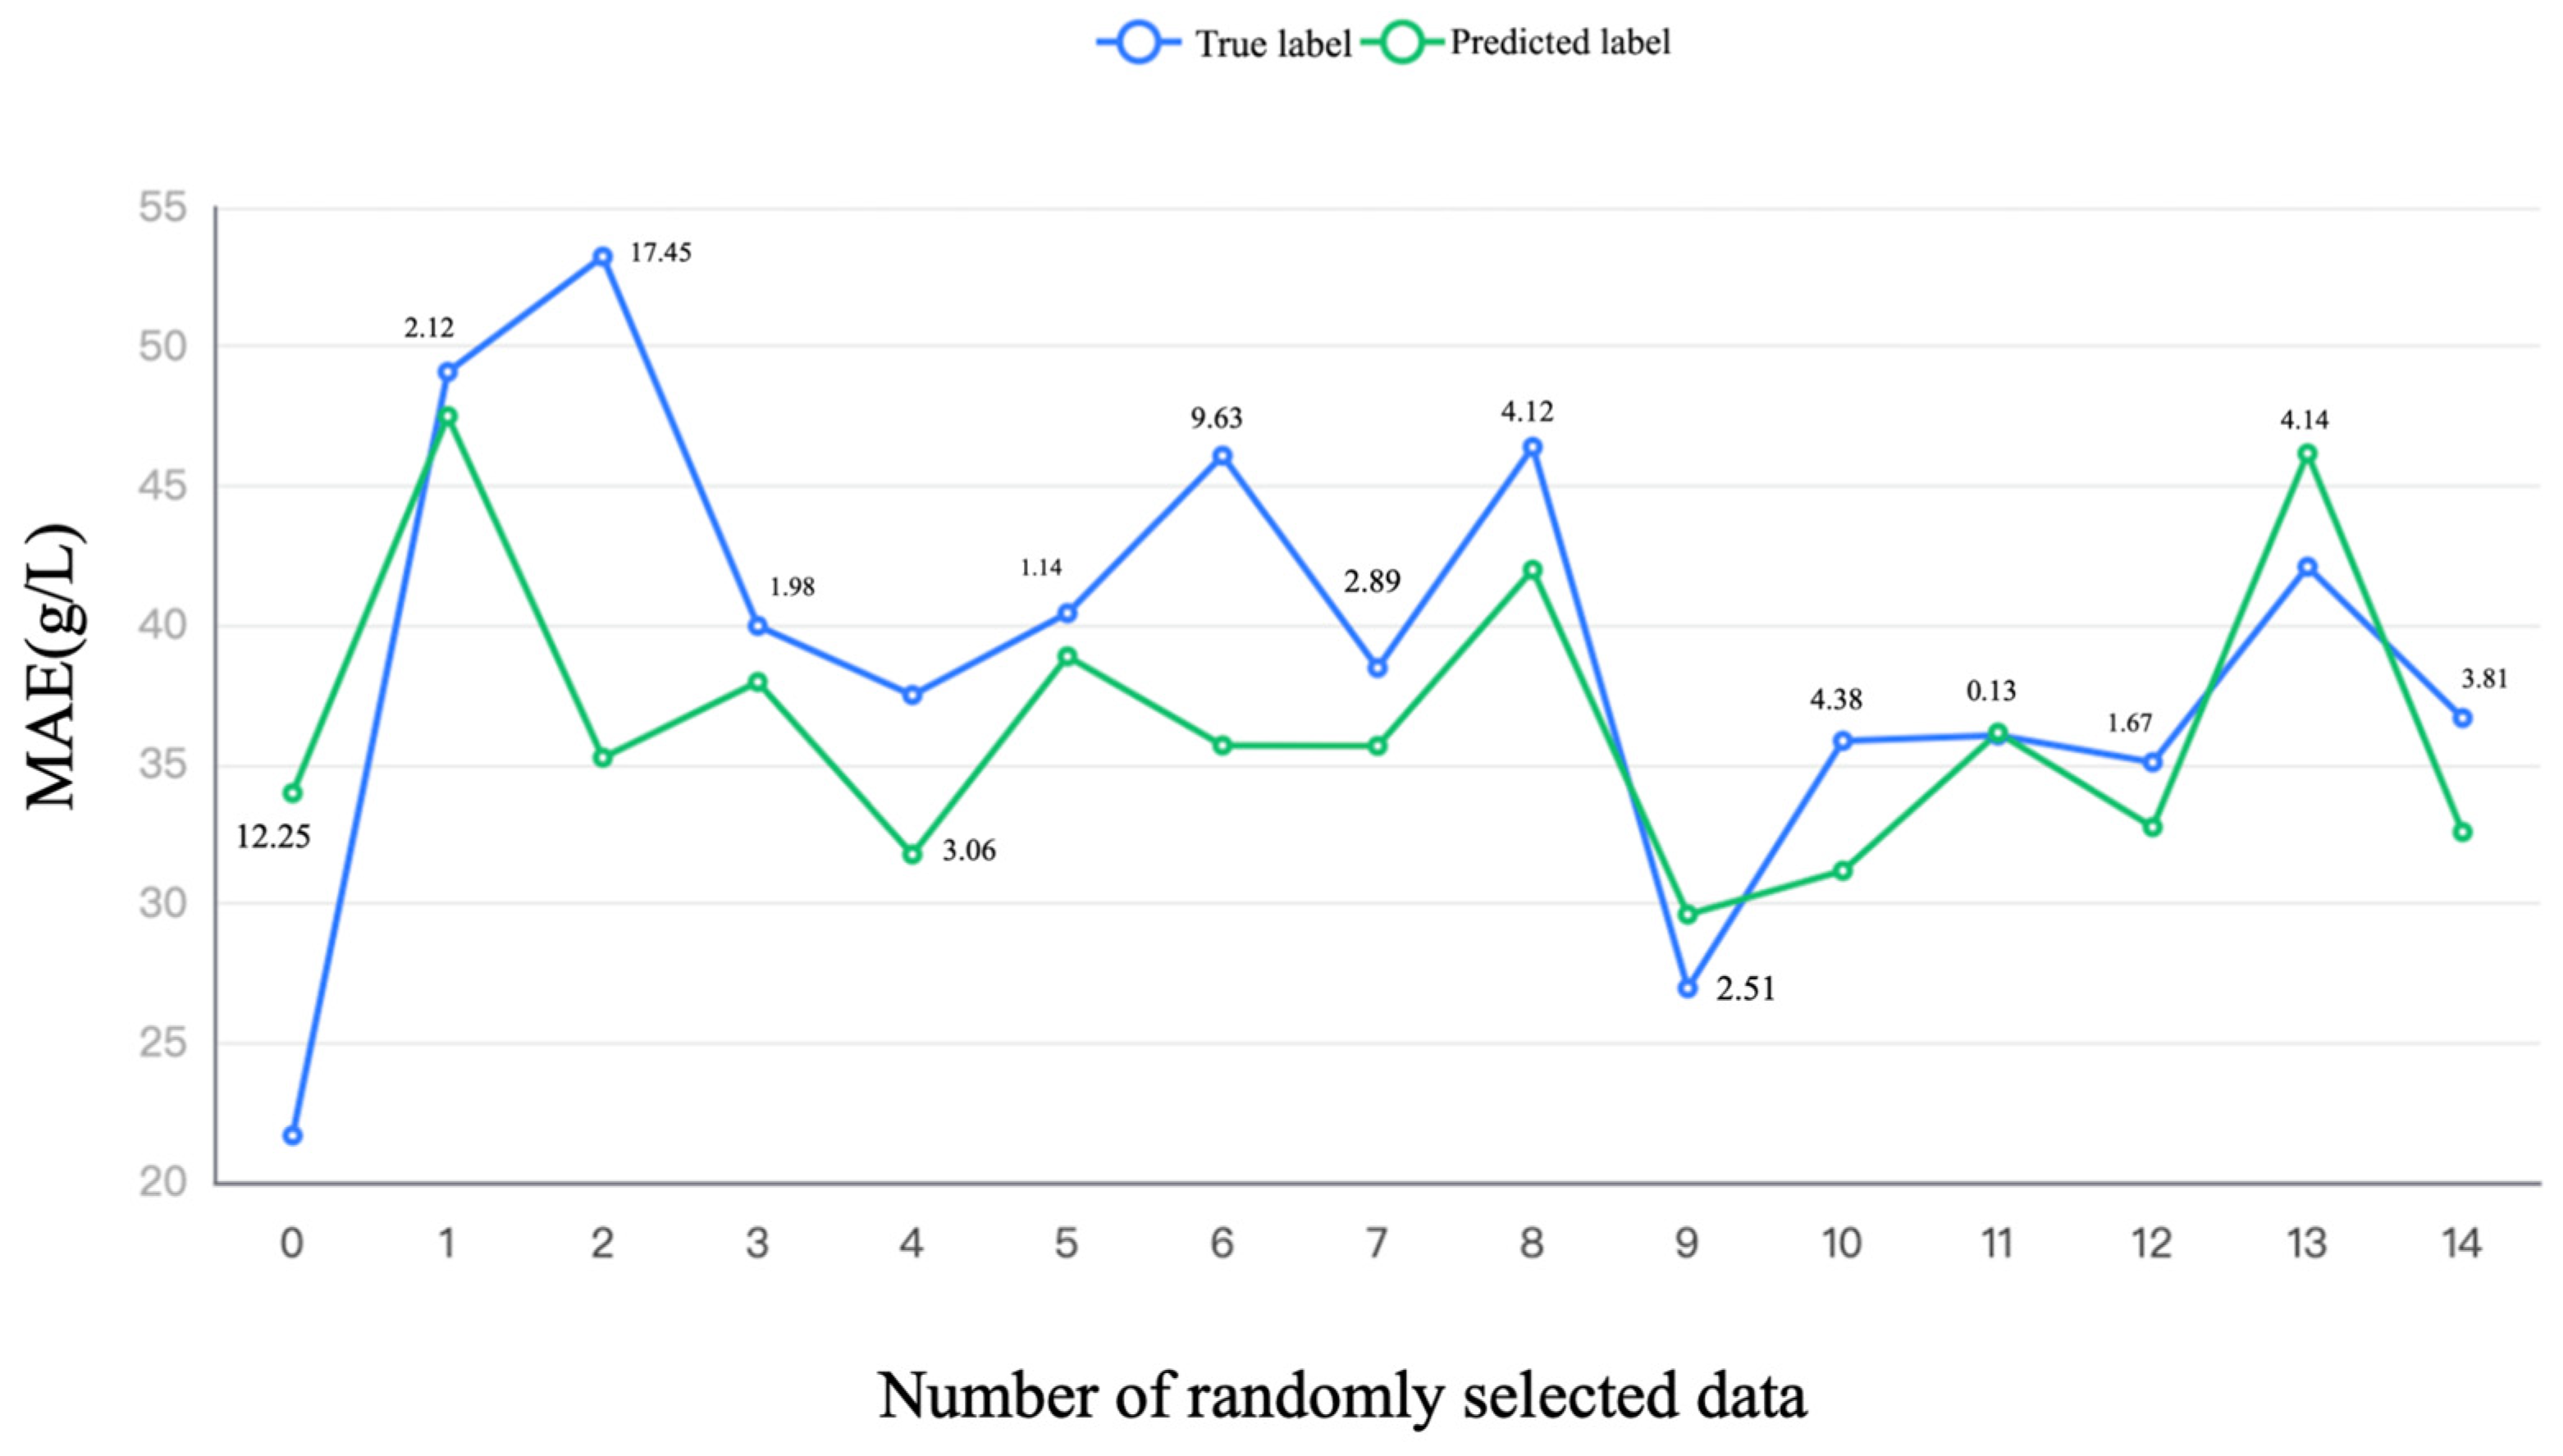
3.5. Prediction of PMLA Production Based on Secondary Indexes

The results of PMLA production predicted by the secondary indexes are shown in Table 5, and the same machine learning algorithms in Section 3.4 were used to train the model. The results indicated that the decision tree obtained 2.596 g/L MAE in the training set and 9.634 g/L in the test set, random forest obtained 3.517 g/L MAE in the training set and 6.556 g/L MAE in the test set, bp neuron network obtained 8.575 g/L MAE in the training set and 7.414 g/L MAE in the test set, and support vector machine obtained 9.416 g/L MAE in the training set and 8.572 g/L MAE in the test set, among which the random forest is the best model due to the smallest MAE compared with other machine learning methods.
The predicted label and its comparison with the true label are shown in Figure 3, in which 15 data were randomly selected and the absolute difference was calculated. Even though the comparison results of the secondary indexes (smallest MAE of 6.556 g/L in Table 5) are worse than directly using the substrates (smallest MAE of 4.164 g/L in Table 4), this result demonstrated that the easily measured secondary indexes could be used directly to predict PMLA production. Using these easily measured secondary indexes (pH, Biomass concentration, viscosity, and osmotic pressure), we can quickly evaluate the PMLA production, increasing the measurement efficiency.

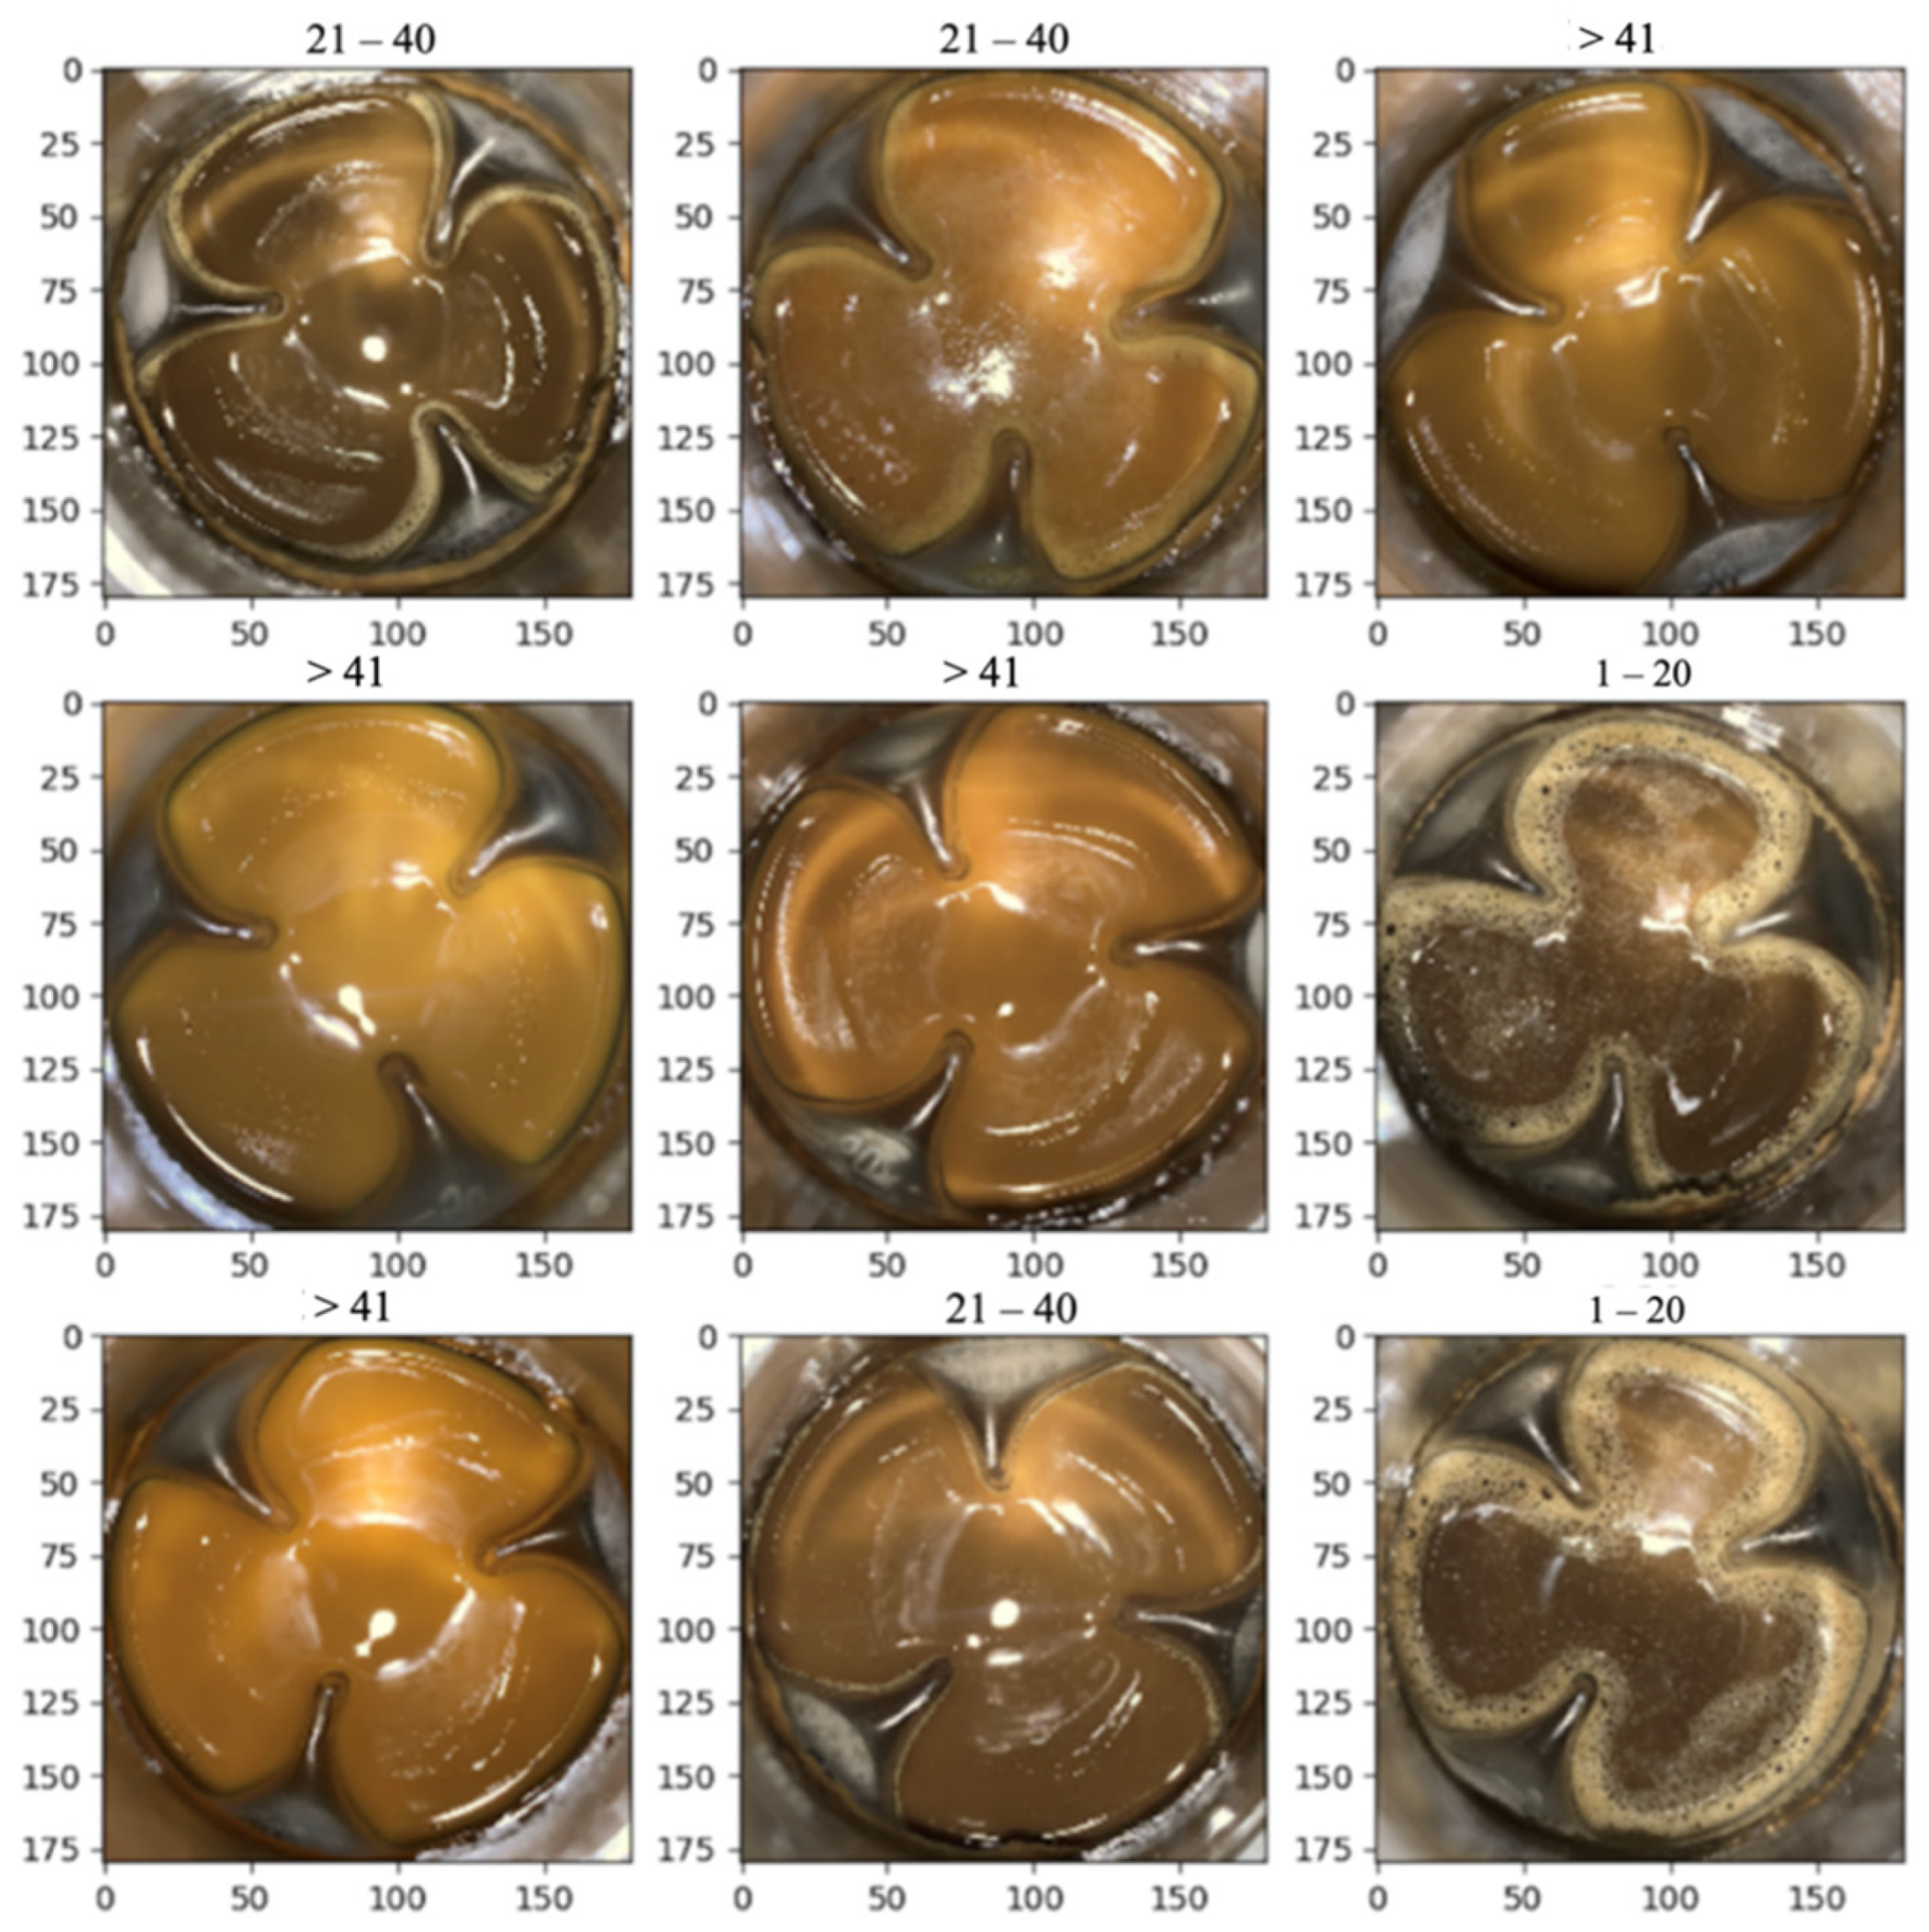
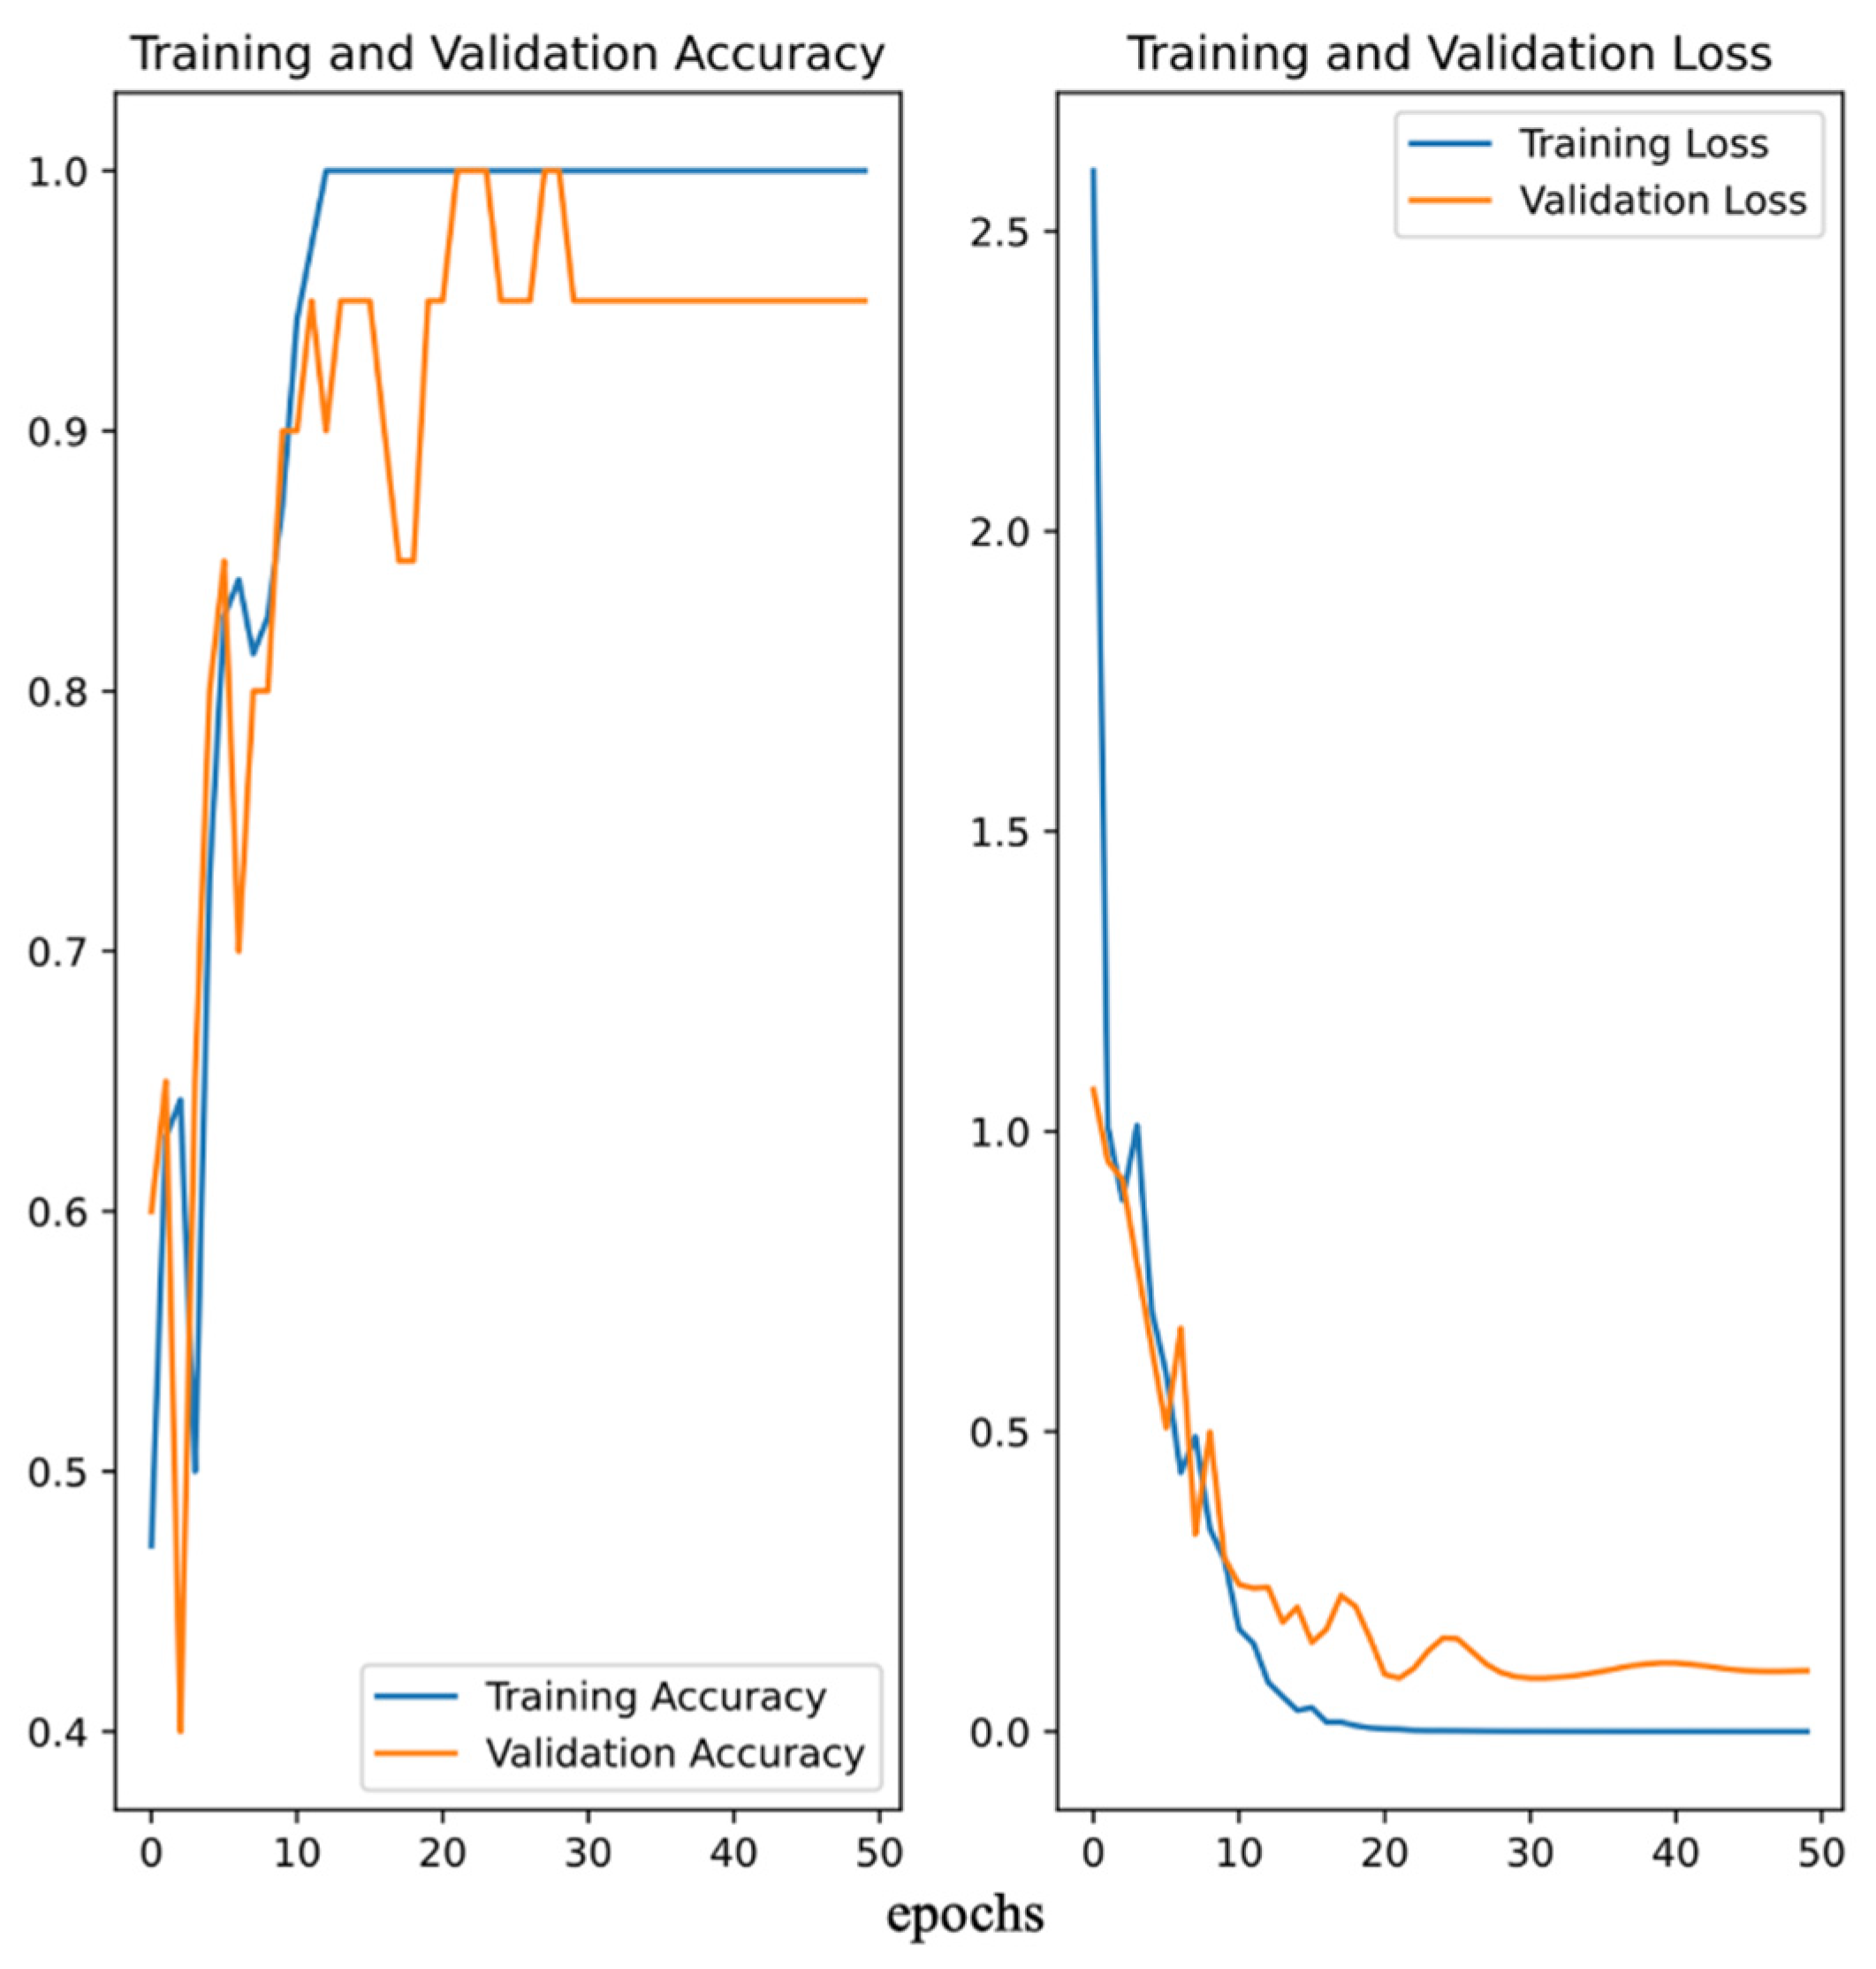
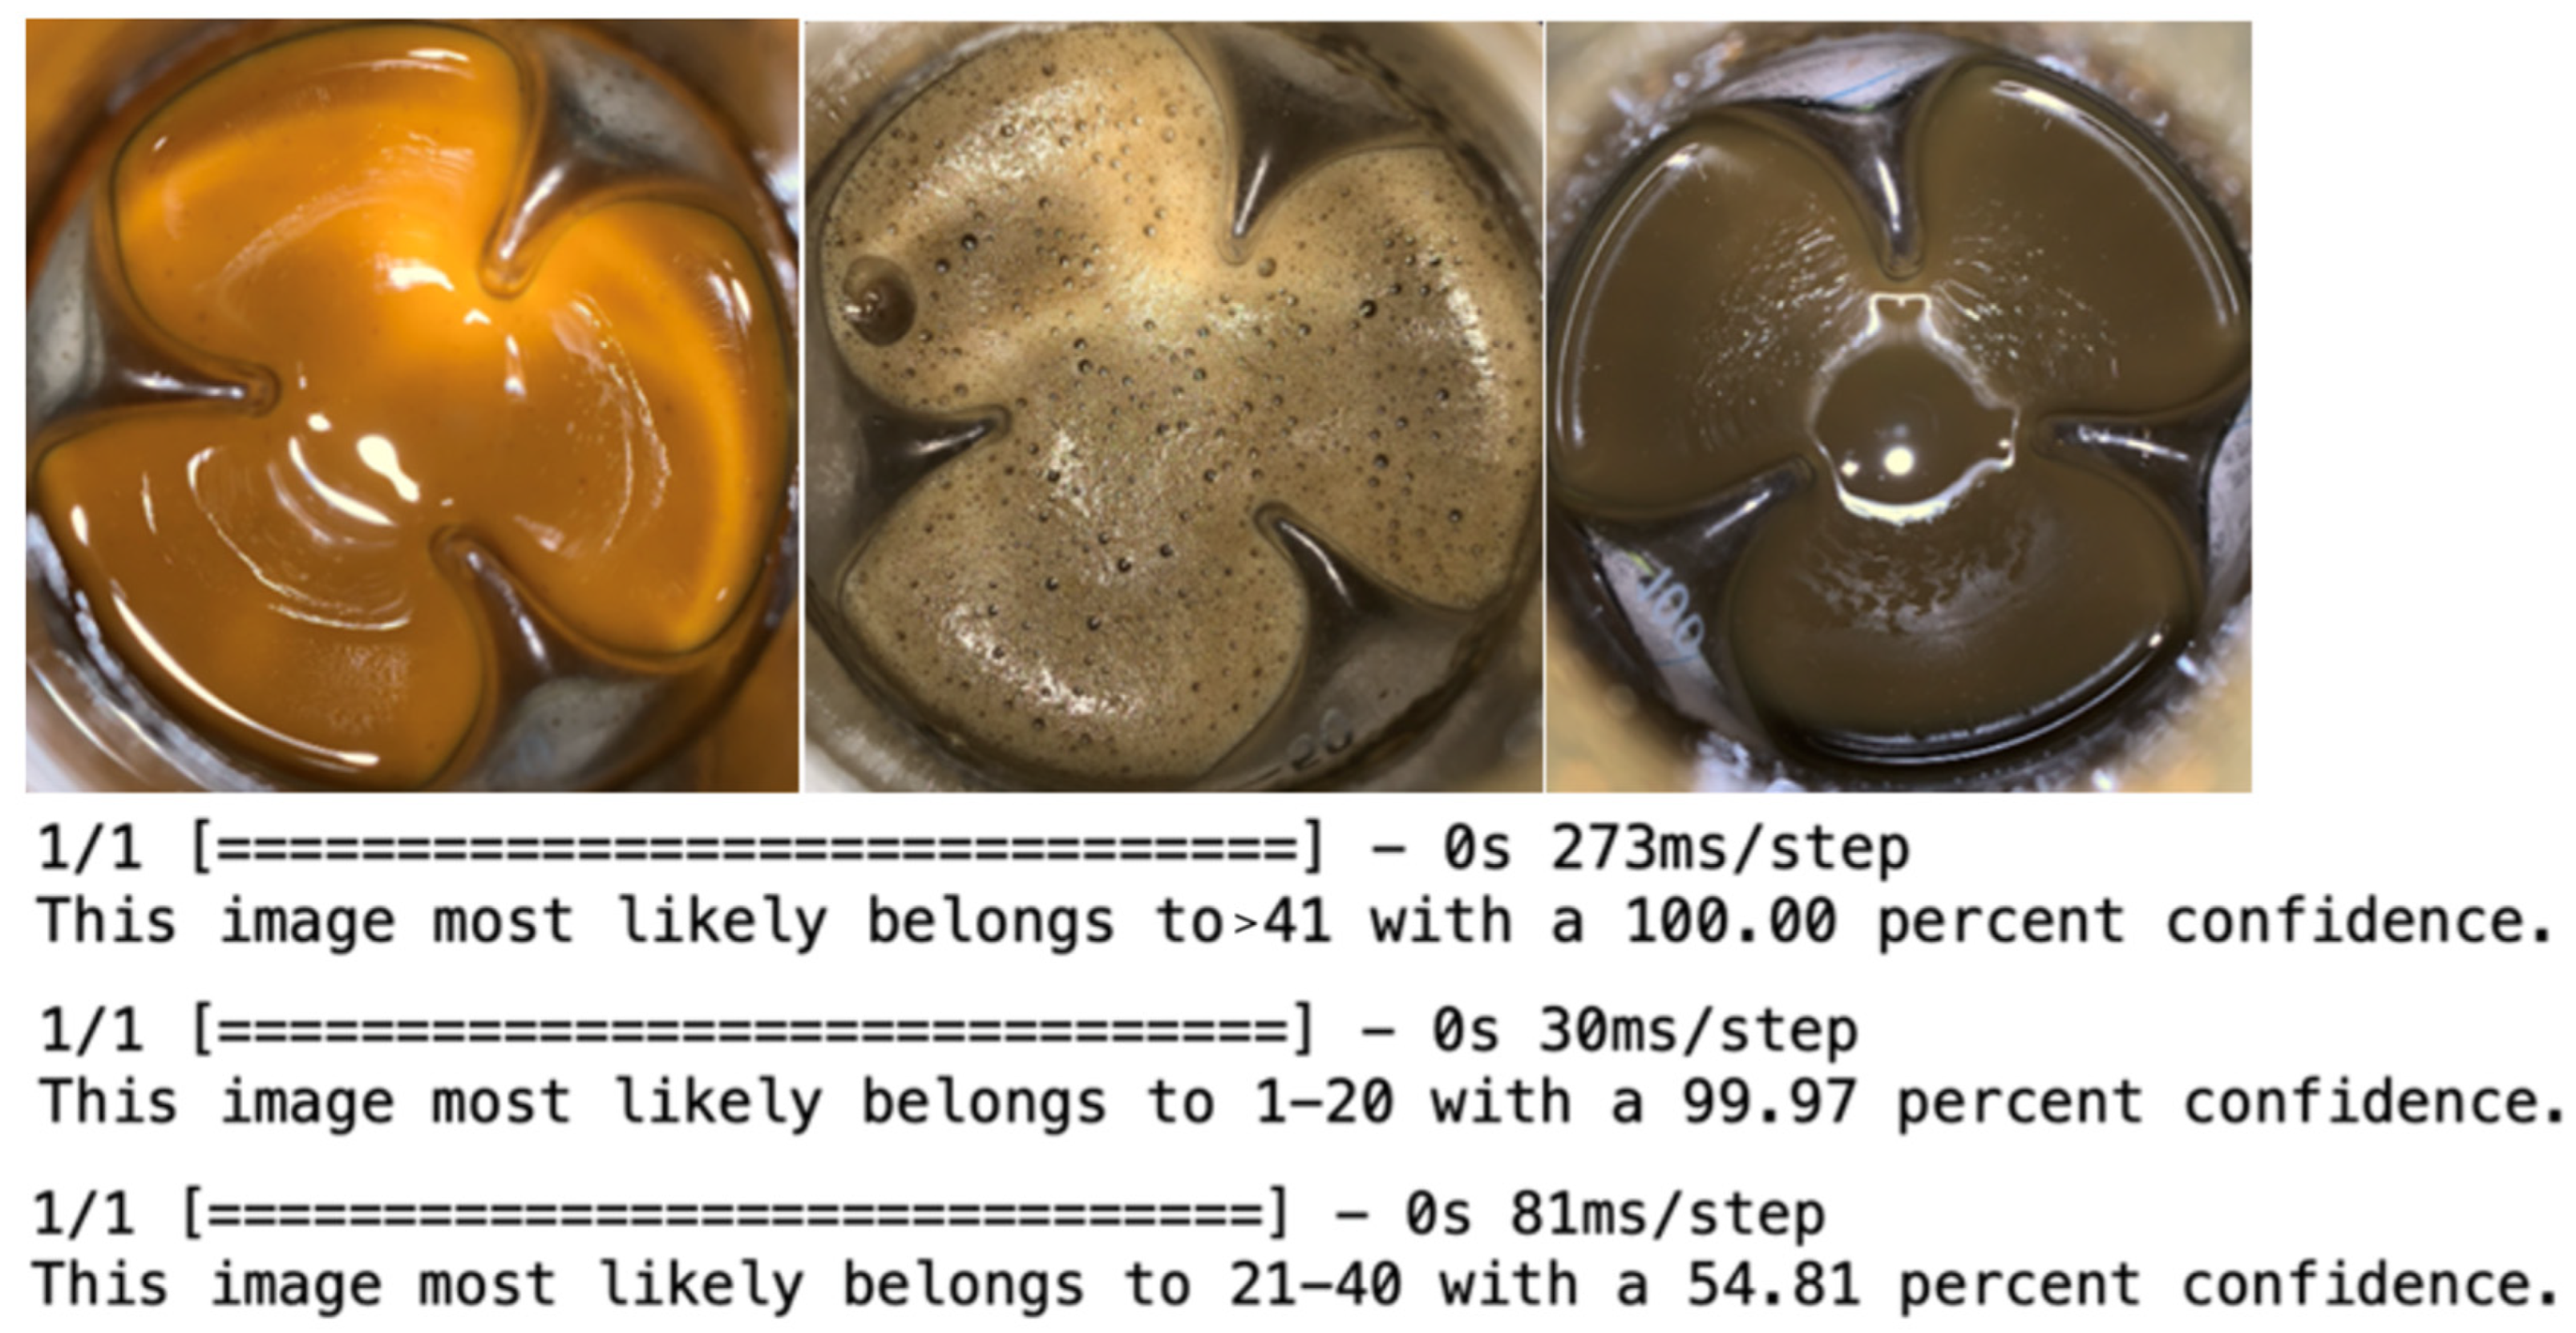
3.6. PMLA Fermentation Medium Image Identification Based on Convolutional Neuron Network

After 144 h fermentation, the fermentation mediums with different PMLA production were collected and the pictures were taken. Eventually, a total of 100 images were collected. Due to the large PMLA production span, the datasets were categorized into three groups for better classification, 1–20 g/L, 21–40 g/L, and >41 g/L. The pictures were divided into the training set, which comprised about 70% of the data, and the validation set, which comprised another 30%. Figure 4 shows a demo of different groups and their corresponding images. Then, the convolutional neural network was deployed to train the dataset and predict the PMLA production. Figure 5 showed that, after 50 iterations (epoch = 50), the validation set obtained about 90% accuracy, which illustrated that the model could accurately predict PMLA production by the fermentation medium’s images.
New images out of the dataset were then predicted using the model training above, and the results are shown in Figure 6, among which the model predicted that the first image most likely belongs to the >41 group, the second belongs to the 1–20 group, and the third belongs to the 21–40 group.
The results demonstrated that the model could accurately predict PMLA production by fermentation medium images after 144 h fermentation. The model was very suitable for the shake-flask experiments to determine whether a substrate had an influence on PMLA production quickly. However, the images were collected at the end of fermentation. Thus, the model could not predict the images at early-stage fermentation. This method was first applied in the PMLA production, and more images at different fermentation times and with different PMLA production should be taken to make a more precise prediction in the following study.

4. Conclusions

This study evaluated the influence of different substrates on PMLA production, which was then predicted by the substrate addition value and secondary indexes. The results indicated that PMLA production was dramatically decreased after the addition of CSL and betaine. The machine learning methods could predict PMLA production based on the secondary indexes, improving the PMLA measurement efficiency. Then, the convolutional neural network method was applied to predict the PMLA production based on the fermentation medium images, which obtained about 90% accuracy.

Supplementary Materials

The following supporting information can be downloaded at: https://www.mdpi.com/article/10.3390/fermentation8120729/s1, Matrix: fermentation_matrix.xsl.

Author Contributions

Conceptualization, G.W. and C.Q.; methodology, G.W. and J.L.; software, G.W.; validation, L.Z., Y.L., S.W. and S.C.; investigation, G.W.; resources, H.Y.; writing—original draft preparation, G.W. and T.Z.; writing—review and editing, G.W., J.L. and Y.L.; supervision, C.Q. and S.J. All authors have read and agreed to the published version of the manuscript.

Funding

This research was funded by the Key R & D program of Ningxia Hui Autonomous Region (2021BEG03011, 2022BEG02006), Tianjin Science and Technology planning project (20YFZCSN00130, 21YDTPJC00140).

Informed Consent Statement

Not applicable.

Conflicts of Interest

The authors declare no conflict of interest.

References

  1. Holler, E.; Angerer, B.; Achhammer, G.; Miller, S.; Windisch, C. Biological and biosynthetic properties of poly-L-malate. FEMS Microbiol. Rev. 1992, 9, 109–118. [Google Scholar] [CrossRef]
  2. Chi, Z.; Liu, G.L.; Liu, C.G.; Chi, Z.M. Poly(β-L-malic acid) (PMLA) from Aureobasidium spp. and its current proceedings. Appl. Microbiol. Biotechnol. 2016, 100, 3841–3851. [Google Scholar] [CrossRef] [PubMed]
  3. Loyer, P.; Cammas-Marion, S. Natural and synthetic poly(malic acid)-based derivates: A family of versatile biopolymers for the design of drug nanocarriers. J. Drug Target. 2014, 22, 556–575. [Google Scholar] [CrossRef] [PubMed]
  4. Zhou, Q.; Hou, Y.; Zhang, L.; Wang, J.; Qiao, Y.; Guo, S.; Fan, L.; Yang, T.; Zhu, L.; Wu, H. Dual-pH Sensitive Charge-reversal Nanocomplex for Tumor-targeted Drug Delivery with Enhanced Anticancer Activity. Theranostics 2017, 7, 1806–1819. [Google Scholar] [CrossRef] [Green Version]
  5. Portilla-Arias, J.A.; García-Alvarez, M.; Galbis, J.A.; Muñoz-Guerra, S. Biodegradable Nanoparticles of Partially Methylated Fungal Poly(β-L-malic acid) as a Novel Protein Delivery Carrier. Macromol. Biosci. 2008, 8, 551–559. [Google Scholar] [CrossRef]
  6. Zou, X.; Zhou, Y.; Yang, S.T. Production of polymalic acid and malic acid by Aureobasidium pullulans fermentation and acid hydrolysis. Biotechnol. Bioeng. 2013, 110, 2105–2113. [Google Scholar] [CrossRef]
  7. Zou, X.; Cheng, C.; Feng, J.; Song, X.; Lin, M.; Yang, S.T. Biosynthesis of polymalic acid in fermentation: Advances and prospects for industrial application. Crit. Rev. Biotechnol. 2019, 39, 408–421. [Google Scholar] [CrossRef]
  8. Vert, M. Chemical routes to poly (β-malic acid) and potential applications of this water-soluble bioresorbable poly (β-hydroxy alkanoate). Polym. Degrad. Stab. 1998, 59, 169–175. [Google Scholar] [CrossRef]
  9. Kajiyama, T.; Kobayashi, H.; Taguchi, T.; Saito, H.; Kamatsu, Y.; Kataoka, K.; Tanaka, J. Synthesis of activated poly(α,β-malic acid) using N-hydroxysuccinimide and its gelation with collagen as biomaterials. Mater. Sci. Eng. C 2004, 24, 815–819. [Google Scholar] [CrossRef]
  10. Portilla-Arias, J.A.; García-Alvarez, M.; de Ilarduya, A.M.; Holler, E.; Galbis, J.A.; Muñoz-Guerra, S. Synthesis, Degradability, and Drug Releasing Properties of Methyl Esters of Fungal Poly(β, L-malic acid). Macromol. Biosci. 2008, 8, 540–550. [Google Scholar] [CrossRef]
  11. Li, Y.; Chi, Z.; Wang, G.-Y.; Wang, Z.-P.; Liu, G.-L.; Lee, C.-F.; Ma, Z.-C.; Chi, Z.-M. Taxonomy of Aureobasidium spp. and biosynthesis and regulation of their extracellular polymers. Crit. Rev. Microbiol. 2015, 41, 228–237. [Google Scholar] [CrossRef] [PubMed]
  12. Wang, G.; Yin, H.; Zhao, T.; Yang, D.; Jia, S.; Qiao, C. De novo transcriptome assembly of Aureobasidium melanogenum CGMCC18996 to analyze the β-poly (L-malic acid) biosynthesis pathway under the CaCO3 addition. Food Sci. Hum. Wellness 2023, 12, 1248–1256. [Google Scholar] [CrossRef]
  13. Wang, Y.; Song, X.; Zhang, Y.; Wang, B.; Zou, X. Effects of nitrogen availability on polymalic acid biosynthesis in the yeast-like fungus Aureobasidium pullulans. Microb. Cell Factories 2016, 15, 146. [Google Scholar] [CrossRef] [PubMed] [Green Version]
  14. Yu, H.; Liu, B.; Luo, J.; Cao, W.; Qiao, C.; Wan, Y. Toward understanding the key enzymes involved in β-poly (L-malic acid) biosynthesis by Aureobasidium pullulans ipe-1. Eng. Life Sci. 2018, 18, 379–386. [Google Scholar] [CrossRef] [PubMed] [Green Version]
  15. Ma, Y.; Wang, G.Y.; Liu, G.L.; Wang, Z.P.; Chi, Z.M. Overproduction of poly (β-malic acid)(PMA) from glucose by a novel Aureobasidium sp. P6 strain isolated from mangrove system. Appl. Microbiol. Biotechnol. 2013, 97, 8931–8939. [Google Scholar] [CrossRef]
  16. Cao, W.; Luo, J.; Zhao, J.; Qiao, C.; Ding, L.; Qi, B.; Su, Y.; Wan, Y. Intensification of β-poly(L-malic acid) production by Aureobasidium pullulans ipe-1 in the late exponential growth phase. J. Ind. Microbiol. Biotechnol. 2012, 39, 1073–1080. [Google Scholar] [CrossRef]
  17. Cao, W.; Qi, B.; Zhao, J.; Qiao, C.; Su, Y.; Wan, Y. Control strategy of pH, dissolved oxygen concentration and stirring speed for enhancing β-poly (malic acid) production by Aureobasidium pullulans ipe-1. J. Chem. Technol. Biotechnol. 2013, 88, 808–817. [Google Scholar] [CrossRef]
  18. Tu, G.; Wang, Y.; Ji, Y.; Zou, X. The effect of Tween 80 on the polymalic acid and pullulan production by Aureobasidium pullulans CCTCC M2012223. World J. Microbiol. Biotechnol. 2015, 31, 219–226. [Google Scholar] [CrossRef]
  19. Alsheikh, M.A.; Lin, S.; Niyato, D.; Tan, H.P. Machine Learning in Wireless Sensor Networks: Algorithms, Strategies, and Applications. IEEE Commun. Surv. Tutor. 2014, 16, 1996–2018. [Google Scholar] [CrossRef] [Green Version]
  20. Chen, X.; Gupta, A. Webly Supervised Learning of Convolutional Networks. In Proceedings of the IEEE International Conference on Computer Vision, Santiago, Chile, 7–15 December 2015; pp. 1431–1439. [Google Scholar]
  21. Dhruv, P.; Naskar, S. Image Classification Using Convolutional Neural Network (CNN) and Recurrent Neural Network (RNN): A Review. In Machine Learning and Information Processing; Swain, D., Pattnaik, P.K., Gupta, P.K., Eds.; Springer: New York, NY, USA, 2020. [Google Scholar]
  22. Feizi, A.; Zhang, Y.; Greenbaum, A.; Guziak, A.; Luong, M.; Chan, R.Y.L.; Berg, B.; Ozkan, H.; Luo, W.; Wu, M.; et al. Yeast viability and concentration analysis using lens-free computational microscopy and machine learning. In Optics and Biophotonics in Low-Resource Settings III; Levitz, D., Ozcan, A., Erickson, D., Eds.; SPIE-International Society for Optics and Photonics: Washington, DC, USA, 2017; pp. 32–38. [Google Scholar]
  23. Van Der Walt, S.; Colbert, S.C.; Varoquaux, G. The NumPy array: A structure for efficient numerical computation. Comput. Sci. Eng. 2011, 13, 22–30. [Google Scholar] [CrossRef]
  24. Cao, W.; Luo, J.; Qi, B.; Zhao, J.; Qiao, C.; Ding, L.; Su, Y.; Wan, Y. β-poly (l-malic acid) production by fed-batch culture of Aureobasidium pullulans ipe-1 with mixed sugars. Eng. Life Sci. 2014, 14, 180–189. [Google Scholar] [CrossRef]
  25. Cao, W.; Cao, W.; Shen, F.; Luo, J.; Yin, J.; Qiao, C.; Wan, Y. Membrane-assisted β-poly (L-malic acid) production from bagasse hydrolysates by Aureobasidium pullulans ipe-1. Bioresour. Technol. 2020, 295, 122260. [Google Scholar] [CrossRef] [PubMed]
  26. Wang, G.; Shi, B.; Zhang, P.; Zhao, T.; Yin, H.; Qiao, C. Effects of corn steep liquor on β-poly(l-malic acid) production in Aureobasidium melanogenum. AMB Express 2020, 10, 211. [Google Scholar] [CrossRef] [PubMed]
  27. Kang, C.K.; Jeong, S.W.; Yang, J.E.; Choi, Y.J. High-Yield Production of Lycopene from Corn Steep Liquor and Glycerol Using the Metabolically Engineered Deinococcus radiodurans R1 Strain. J. Agric. Food Chem. 2020, 68, 5147–5153. [Google Scholar] [CrossRef]
  28. Zhou, K.; Yu, J.; Ma, Y.; Cai, L.; Zheng, L.; Gong, W.; Liu, Q.A. Corn Steep Liquor: Green Biological Resources for Bioindustry. Appl. Biochem. Biotechnol. 2022, 194, 3280–3295. [Google Scholar] [CrossRef]
  29. Fujino, T.; Kondo, J.; Ishikawa, M.; Morikawa, K.; Yamamoto, T.T. Acetyl-CoA synthetase 2, a mitochondrial matrix enzyme involved in the oxidation of acetate. J. Biol. Chem. 2001, 276, 11420–11426. [Google Scholar] [CrossRef] [Green Version]
  30. Goyal, M.; Khanna, D.; Rana, P.S.; Khaibullin, T.; Martynova, E.; Rizvanov, A.A.; Khaiboullina, S.F.; Baranwal, M. Computational Intelligence Technique for Prediction of Multiple Sclerosis Based on Serum Cytokines. Front. Neurol. 2019, 10, 781. [Google Scholar] [CrossRef]
Figure 1. The evaluation of single substrates addition on PMLA production.
Fermentation 08 00729 g001
Figure 2. The prediction result of the bp neuron network of different substrates on PMLA production.
Fermentation 08 00729 g002
Figure 3. The prediction result of the random forest of different secondary indexes on PMLA production.
Fermentation 08 00729 g003
Figure 4. A demo of different classifications, 1–20, 21–40, and >41 representing 1–20, 21–40, and >41 g/L PMLA production, with their corresponding pictures.
Fermentation 08 00729 g004
Figure 5. The accuracy and loss of training and validation of the convolutional neuron network image recognition.
Fermentation 08 00729 g005
Figure 6. The fermentation medium images that did not belong to the dataset; the upper, middle, and lower images represented the predicted PMLA production of the pictures from left to right. Among them, 1–20, 21–40, and >41 represented the range of PMLA production (g/L).
Fermentation 08 00729 g006
Table 1. The overall description of 212 collected samples of different substrates, secondary indexes, and PMLA production.
SubstrateMedium [Minimal, Maximal]AverageS-W Test
Potassium acetate4.00 [0.00, 9.00]4.420.941 (0.000 ***)
Corn steep liquor (CSL)5.00 [0.00, 9.00]4.790.925 (0.000 ***)
betaine4.00 [0.00, 9.00]4.490.929 (0.000 ***)
MnSO45.00 [0.00, 9.00]4.510.938 (0.000 ***)
MgSO45.00 [0.00, 9.00]4.500.939 (0.000 ***)
Vitamin B15.00 [0.00, 9.00]4.470.933 (0.000 ***)
Vitamin B65.00 [0.00, 9.00]4.930.933 (0.000 ***)
Nicotinamide5.00 [0.00, 9.00]4.740.927 (0.000 ***)
pH6.08 [5.13, 6.95]6.040.797 (0.000 ***)
Osmotic pressure (Pa)0.23 [0.12, 0.57]0.250.506 (0.000 ***)
Biomass (g/L)53.5 [20.50, 94.50]57.000.553 (0.000 ***)
Viscosity (mPa·s)36.25 [9.00, 100.50]40.390.897 (0.000 ***)
Final PMLA production (g/L)34.96 [6.17, 61.87]35.610.987 (0.055 *)
* Represented significant, and *** represented extremely significant.
Table 2. The correlation matrix of different substrates with final PMLA production, biomass concentration, osmotic pressure, and viscosity.
SubstrateFinal PMLA ProductionBiomassOsmotic PressureViscosity
Potassium acetate0.045 (0.513)−0.042 (0.543)0.230 (0.001 ***)0.006 (0.932)
Corn steep liquor−0.624 (0.000 ***)0.055 (0.425)−0.175 (0.011 **)−0.406 (0.000 ***)
Glycine betaine−0.572 (0.000 ***)−0.036 (0.606)−0.198 (0.004 ***)−0.171 (0.013 **)
MnSO4−0.124 (0.072 *)0.262 (0.000 ***)−0.028 (0.690)−0.089 (0.197)
MgSO4−0.049 (0.477)−0.031 (0.658)−0.096 (0.163)−0.112 (0.102)
Vitamin B1−0.293 (0.000 ***)−0.065 (0.343)−0.024 (0.733)0.107 (0.121)
Vitamin B6−0.111 (0.108)−0.001 (0.985)0.062 (0.372)−0.052 (0.454)
Nicotinamide−0.241 (0.000 ***)0.034 (0.617)0.067 (0.328)−0.101 (0.142)
The number outside the bracket represents the correlation coefficient, and the number in the bracket represents the p-value, in which * represented significant, and ** and *** represented extremely significant.
Table 3. The correlation matrix of PMLA production and secondary indexes, pH, osmotic pressure, biomass, and viscosity.
Secondary IndexesPMLA Production
pH0.370 (0.000 ***)
Osmotic pressure0.102 (0.139)
Biomass−0.067 (0.333)
Viscosity0.346 (0.000 ***)
The number outside the bracket represents the correlation coefficient, and the number in the bracket represents the p-value, *** represented extremely significant.
Table 4. The mean absolute error (MAE) of using different substrate addition values to predict final PMLA production by four machine learning methods.
Decision TreeRandom ForestBp Neuron NetworkSupport Vector Machine
Training set MAE (g/L)1.4752.214.2154.367
Test set MAE (g/L)7.3695.534.1644.506
Table 5. The mean absolute error (MAE) of using secondary indexes value to predict PMLA production by four machine learning methods.
Decision TreeRandom ForestBp Neuron NetworkSupport Vector Machine
Training set MAE (g/L)2.5963.5178.5759.416
Test set MAE (g/L)9.6346.5567.4148.572
Publisher’s Note: MDPI stays neutral with regard to jurisdictional claims in published maps and institutional affiliations.

