Article

Galactitol Transport Factor GatA Relieves ATP Supply Restriction to Enhance Acid Tolerance of Escherichia coli in the Two-Stage Fermentation Production of D-Lactate

1
Key Laboratory of Industrial Biotechnology, Ministry of Education, School of Biotechnology, Jiangnan University, Wuxi 214122, China
2
Science Center for Future Foods, Jiangnan University, Wuxi 214122, China
*
Authors to whom correspondence should be addressed.
Fermentation 2022, 8(12), 665; https://doi.org/10.3390/fermentation8120665
Submission received: 1 October 2022 / Revised: 13 November 2022 / Accepted: 16 November 2022 / Published: 23 November 2022
(This article belongs to the Special Issue Applied Microorganisms and Industrial/Food Enzymes)

Abstract

:
Escherichia coli is a major contributor to the industrial production of organic acids, but its production capacity and cost are limited by its acid sensitivity. Enhancing acid resistance in E. coli is essential for improving cell performance and production value. Here, we propose a feasible strategy for improving cellular acid tolerance by reducing ATP supply restriction. Transcriptome assays of acid-tolerant evolved strains revealed that the galactitol phosphotransferase system transporter protein GatA is an acid-tolerance factor that assists E. coli in improving its resistance to a variety of organic acids. Enhanced GatA expression increased cell survival under conditions of lethal stress due to D-lactic acid, itaconic acid and succinic acid by 101.8-fold, 29.4-fold and 41.6-fold, respectively. In addition, fermentation patterns for aerobic growth and oxygen-limited production of D-lactic acid were identified, and suitable transition and induction stages were evaluated. GatA effectively compensated for the lack of cellular energy during oxygen limitation and enabled the D-lactic acid producing strain to exhibit more sustainable productivity in acidic fermentation environments with a 55.7% increase in D-lactic acid titer from 9.5 g·L−1 to 14.8 g·L−1 and reduced generation of by-product. Thus, this study developed a method to improve the acid resistance of E. coli cells by compensating for the energy gap without affecting normal cell metabolism while reducing the cost of organic acid production.

1. Introduction

Well-defined genetic backgrounds and the ease with which genetic manipulation can be accomplished, coupled with the rapidity of transitions between production runs, have made Escherichia coli a desirable host with broad applicability to fermentation [1,2]. For example, engineered E. coli has become an important platform for organic acid production [3]. The global market for lactic acid, one of the three major organic acids, is expected to reach USD 5.02 billion by 2028 [3]. D-lactic acid (D-LA) is an important monomer feedstock for industrial syntheses, including that of the thermoplastic polyester polylactic acid Poly(D-, L-lactic acid) synthesized with L-lactic acid in a specific ratio is optimal in many aspects [4,5]. D-LA fermented by E. coli can maximize the titer and purity required for the synthesis of polymers to meet industrial production requirements [6,7,8,9]. However, the accumulation of acidic metabolites leads to a rapid shift in environmental pH away from neutral, limiting the productivity and production of E. coli which is acid-sensitive.
Decreased pH or high proton concentrations can interfere with ATP production [10]. Cells initiate response mechanisms to defend against an adverse acidic environment and devote more energy to regulating the expression of factors that act to counter the effects of the acid [11,12,13]. An insufficient ATP supply greatly affects the fermentation capacity of the cells. To maintain fermentation stability and improve productivity, exogenous neutralizers (e.g., KOH, NH4OH and Ca(OH)2) are commonly used to maintain the pH in a dynamic and stable neutral environment [14,15]. However, fermentation is prone to the accumulation of microsoluble by-products such as salts that increase osmotic stress, potentially influencing cell growth and metabolism [16]. In addition, the recovery cost is increased by the dissociation of the acid product at higher pH [17,18], and strict maintenance of a neutral fermentation environment increases the production costs [3,11]. Therefore, improving the tolerance of E. coli to organic acids to increase production is urgently required.
Various strategies have been used to improve the acid tolerance of cells to acidic metabolites. Adaptive evolution, or even genomic shuffling, have been the predominant strategies [19,20,21]. The combined strategy of mutagenesis using atmospheric and room temperature plasma (ARTP) and adaptive laboratory evolution increased the growth of E. coli cells by 3.12-fold and the yield of succinate under anaerobic conditions up to 0.69 g·g−1 glucose [22]. Multiple E. coli strains show improved 3-hydroxypropionic acid tolerance and production performance following mutation or deletion of the transcription factor yieP [23]. Glutamic acid decarboxylase gadBC as an anti-acid factor in the E. coli acid-resistant system (AR2), assists in the production of higher succinic acid titers in E. coli at low pH conditions [24]. Although some success has been reported, it is impossible to generalize and fully predict strain responses. In addition, the applicability of anti-acid factors remains a challenge, as overexpression may disrupt or compete with metabolic pathways that are already enhanced in the producing strains.
The aim of this study was to develop an effective strategy that promotes tolerance to a wide range of organic acids in E. coli, and increases the ability to produce organic acids without affecting normal cellular metabolism. In a previous study, we used an adaptive evolutionary strategy to obtain an evolved strain of E. coli DLA3, with an increased tolerance to D-LA from 3.4 g·L−1 to 4.2 g·L−1 [25]. We compared the differences in transcript levels between DLA3 and the parental strain E. coli MG1655 before and after D-LA lethal stress, and found that the transporter factor GatA, which acts in the transmembrane transport metabolic pathway of galactitol has potential as a universal anti-acid component. Overexpression of GatA compensated for the stress of limited cellular ATP production at low pH and greatly improved the ability of E. coli to survive the lethal threat of multiple organic acids. By comparing the effects of different fermentation patterns on yield, a two stage fermentation strategy was determined to improve the productivity of D-LA by E. coli, and the fermentation conditions during the transition period and period of induced cell growth were investigated. Overexpression of GatA relieved restrictions on ATP supply at low pH in the strain engineered for D-LA production and noticeably improved productivity and glucose utilization. This study provides a reference for improving the acid tolerance of strains for organic acid production and reducing the cost of production.

2. Material and Methods

2.1. Strains, Plasmids, and Culture Conditions

E. coli MG1655 was used as the parent strain. The MG1655-derived strain was obtained by knocking out the genes pflB, adhE and frdA using the λRed recombinant system tool [6], and named LBBE317. LBBE317 produced more D-LA without changing growth rate and biomass accumulation [26]. All the strains and plasmids used in this study are listed in Table S1. Using E. coli MG1655 genomic DNA was used as a template to amplify the gene linearized fragment gatA with homology arms of 18 and 22 bp by PCR. The linearized fragment was ligated with the linearized vector pTrc99a (One-step Cloning Kit, Vazyme Biotech, Nanjing, China) to form a recombinant plasmid, which was then transformed into E. coli. DNA purification, gel extraction and plasmid preparation were performed using kits from Sangon Biotech Co. Ltd. (Shanghai, China). E. coli cells were cultured in Luria–Bertani (LB) medium at 37 °C with shaking at 220 rpm. The inoculation rate is usually 2%. When appropriate, LB medium was supplemented with 100 µg·mL−1 ampicillin. Overexpression of the recombinant plasmid was induced at an OD600 of between 0.5–0.6 by the addition of 200 μM isopropyl β-D-1-thiogalactopyranoside (IPTG).

2.2. Growth Curve Assays

Overnight seed cultures were transferred to 500 mL shake flasks containing 50 mL of fresh LB medium with a 2% inoculum, and 2 mL samples were taken every 2 h. Cell suspensions diluted to the appropriate concentration (OD600 less than 0.8) were measured using a spectrophotometer (723N, Shanghai Precision Scientific Instruments Co., Ltd., Shanghai, China), and the cell density was marked by an value OD600 of [26]. The growth curves of the cells were plotted with the sampling time as the horizontal coordinate and absorbance value as the vertical coordinate. The experiment was repeated three times, and the results were averaged.

2.3. Stress-Tolerance Assays

Cells were cultivated in 10 mL LB medium in a 100 mL shake flask and collected during the exponential phase. The collected cells were washed twice with 100 mM PBS solution (pH 7.2). The mixture was centrifuged (6000× g) for 3 min, and the supernatant was discarded. The cells were resuspended in an equal volume of lethal stress LB medium (with adjustment of organic acids), and the stress time was started. The appropriate pH of lethal stress was considered as one that would permit the culture to reach a cell survival rate of 10−4% after 4 h of incubation [27]. In this experiment, the pH of the lethal stress LB medium for D-LA, succinic acid and itaconic acid was 4.0, 4.3 and 4.2, respectively. Samples were withdrawn at 0, 1, 2, 3, and 4 h, washed twice by the same procedure, and resuspended in an equal volume of 100 mM PBS. Cell suspensions (10 μL of a serial gradient dilution) were dropped onto agar LB plates and incubated for 24 h at 37 °C. Plates containing 30–300 colony-forming units (CFU) were counted. Each sample was analyzed in triplicate. Stress tolerance is shown as the survival rate, and the transmission of errors was calculated according to Equations (1) and (2). The experiment was repeated three times, and the results were averaged.
C = A n A 0 ÷ B n B 0 × 100 %
Δ C = C × Δ A A 2 + Δ B B 2
A: Number of viable bacteria after stress of the engineered strain (A0, number of viable bacteria at 0 h; An, number of viable bacteria at 1, 2, 3, or 4 h); ∆A, error in the number of viable bacteria after stress of the engineered strain; B: number of viable bacteria after stress of the control strain (B0, number of viable bacteria withdrawn at 0 h; Bn, number of viable bacteria withdrawn at 1, 2, 3, or 4 h); ∆B: error of viable bacteria after stress of the control strain; C: survival rate (%); ∆C: error of survival rate (%).

2.4. Intracellular ATP Detection

Cell cultures were sampled at 2 mL per hour under incubation conditions of D-LA lethal stress (D-LA concentration, pH and sampling time settings were the same as for stress-tolerance assays), and rapidly transferred to liquid nitrogen to prevent metabolism (5 min). Frozen cells were placed on ice to thaw and collected by centrifugation (8000× g, 4 °C) for 10 min. Intracellular ATP content was determined using an ATP assay kit (Beyotime, Biotechnology, Shanghai, China). Whilst keeping the ice surface manipulated, cells were gently ejected and added to the specific lysis cytosol reagent in the kit without additional disruption/lysis of cells. After lysis, cells were centrifuged (12,000× g, 4 °C) for 5 min and 1 mL of supernatant was used for subsequent assays, of which 0.5 mL was used to determine intracellular ATP concentration and the remaining 0.5 mL was used to detect intracellular protein concentration using the Protein Concentration Assay Kit (Beyotime Biotechnology, Shanghai, China). ATP content was expressed as nmol·mg−1 of intracellular protein.

2.5. Intracellular pH Detection

Intracellular pH was measured fluorescently using 2′,7′-bis(2-carboxyethyl)-5(and 6)-carboxyfluorescein acetoxymethyl ester (BCECF AM, Beyotime Biotechnology, Shanghai, China) as a fluorescent probe. Three mL of cells cultured under different conditions were harvested by centrifugation at 7000× g for 3 min and washed three times with 50 mM HEPES-K (Sigma-Aldrich, Shanghai, China) buffer (pH 8.0) [25]. The cell precipitate was resuspended in 3 mL of the same buffer and 1 μL of BCECF AM was added and mixed in a water bath at 30 °C for 20 min. Cells were washed three times with 50 mM potassium phosphate buffer (pH 7.0) and resuspended. The fluorescence intensity of bacterial suspension (S) and filtrate (F) was measured by fluorescence spectrophotometer with excitation spectra of 490 nm (pH sensitive) and 440 nm (pH insensitive). The luminescence was measured at 525 nm. The width of the excitation and emission slits was set to 5 nm. The ratio of the emission intensity was calculated according to Guan et al. [28]. The extracellular pH (pHex) was used as the data of the medium measured by the pH meter.

2.6. Fermentation Analysis

Cells were precultured as described above and transferred to 150 mL of fresh LB medium (1000 mL flasks). Seed cultures were incubated for 9 h at 37 °C with shaking at 220 rpm. Seed cultures were inoculated into a 5 L bioreactor (T&J—Atype; Parallel -Bioreactor. Co, Shanghai, China) with an initial OD600 of 0.08 containing 3 L of AM2 medium [6], the inoculation rate was approximately 5%. Subsequently, single-phase or two-phasefermentation was performed, as shown in Table S2. Fermentation was stopped when glucose utilization was below 0.2 g·L−1·h−1. The pH was controlled with 15% (w·v−1) ammonia and the temperature was maintained at 37 °C. IPTG (200 μM) was used to induce fermentation of the recombinant strains.

2.7. Metabolite Detection

Samples from the cultures were centrifuged (12,000× g) for 3 min. The concentrations of D-LA, acetic acid, and succinic acid in the sample supernatant were analyzed by HPLC (1260 Infinity LC, Agilent, Santa Clara, CA, USA) using an Aminex HPX-87H ion-exclusion chromatography column (300 × 7.8 mm). 5.0 mM H2SO4 solution was used as the mobile phase (0.5 mL min−1) at column temperature 40 °C, and using a 210 nm photodiode array detector.

2.8. Statistical Analysis

Statistical analysis was performed using GraphPad Prism 6 (GraphPad Software, San Diego, California, U.S.A). Statistical significance was set at p-values < 0.05 and is indicated with an asterisk: *, p < 0.05; **, p < 0.01; ***, p < 0.005 and ****, p < 0.001.

3. Results and Discussion

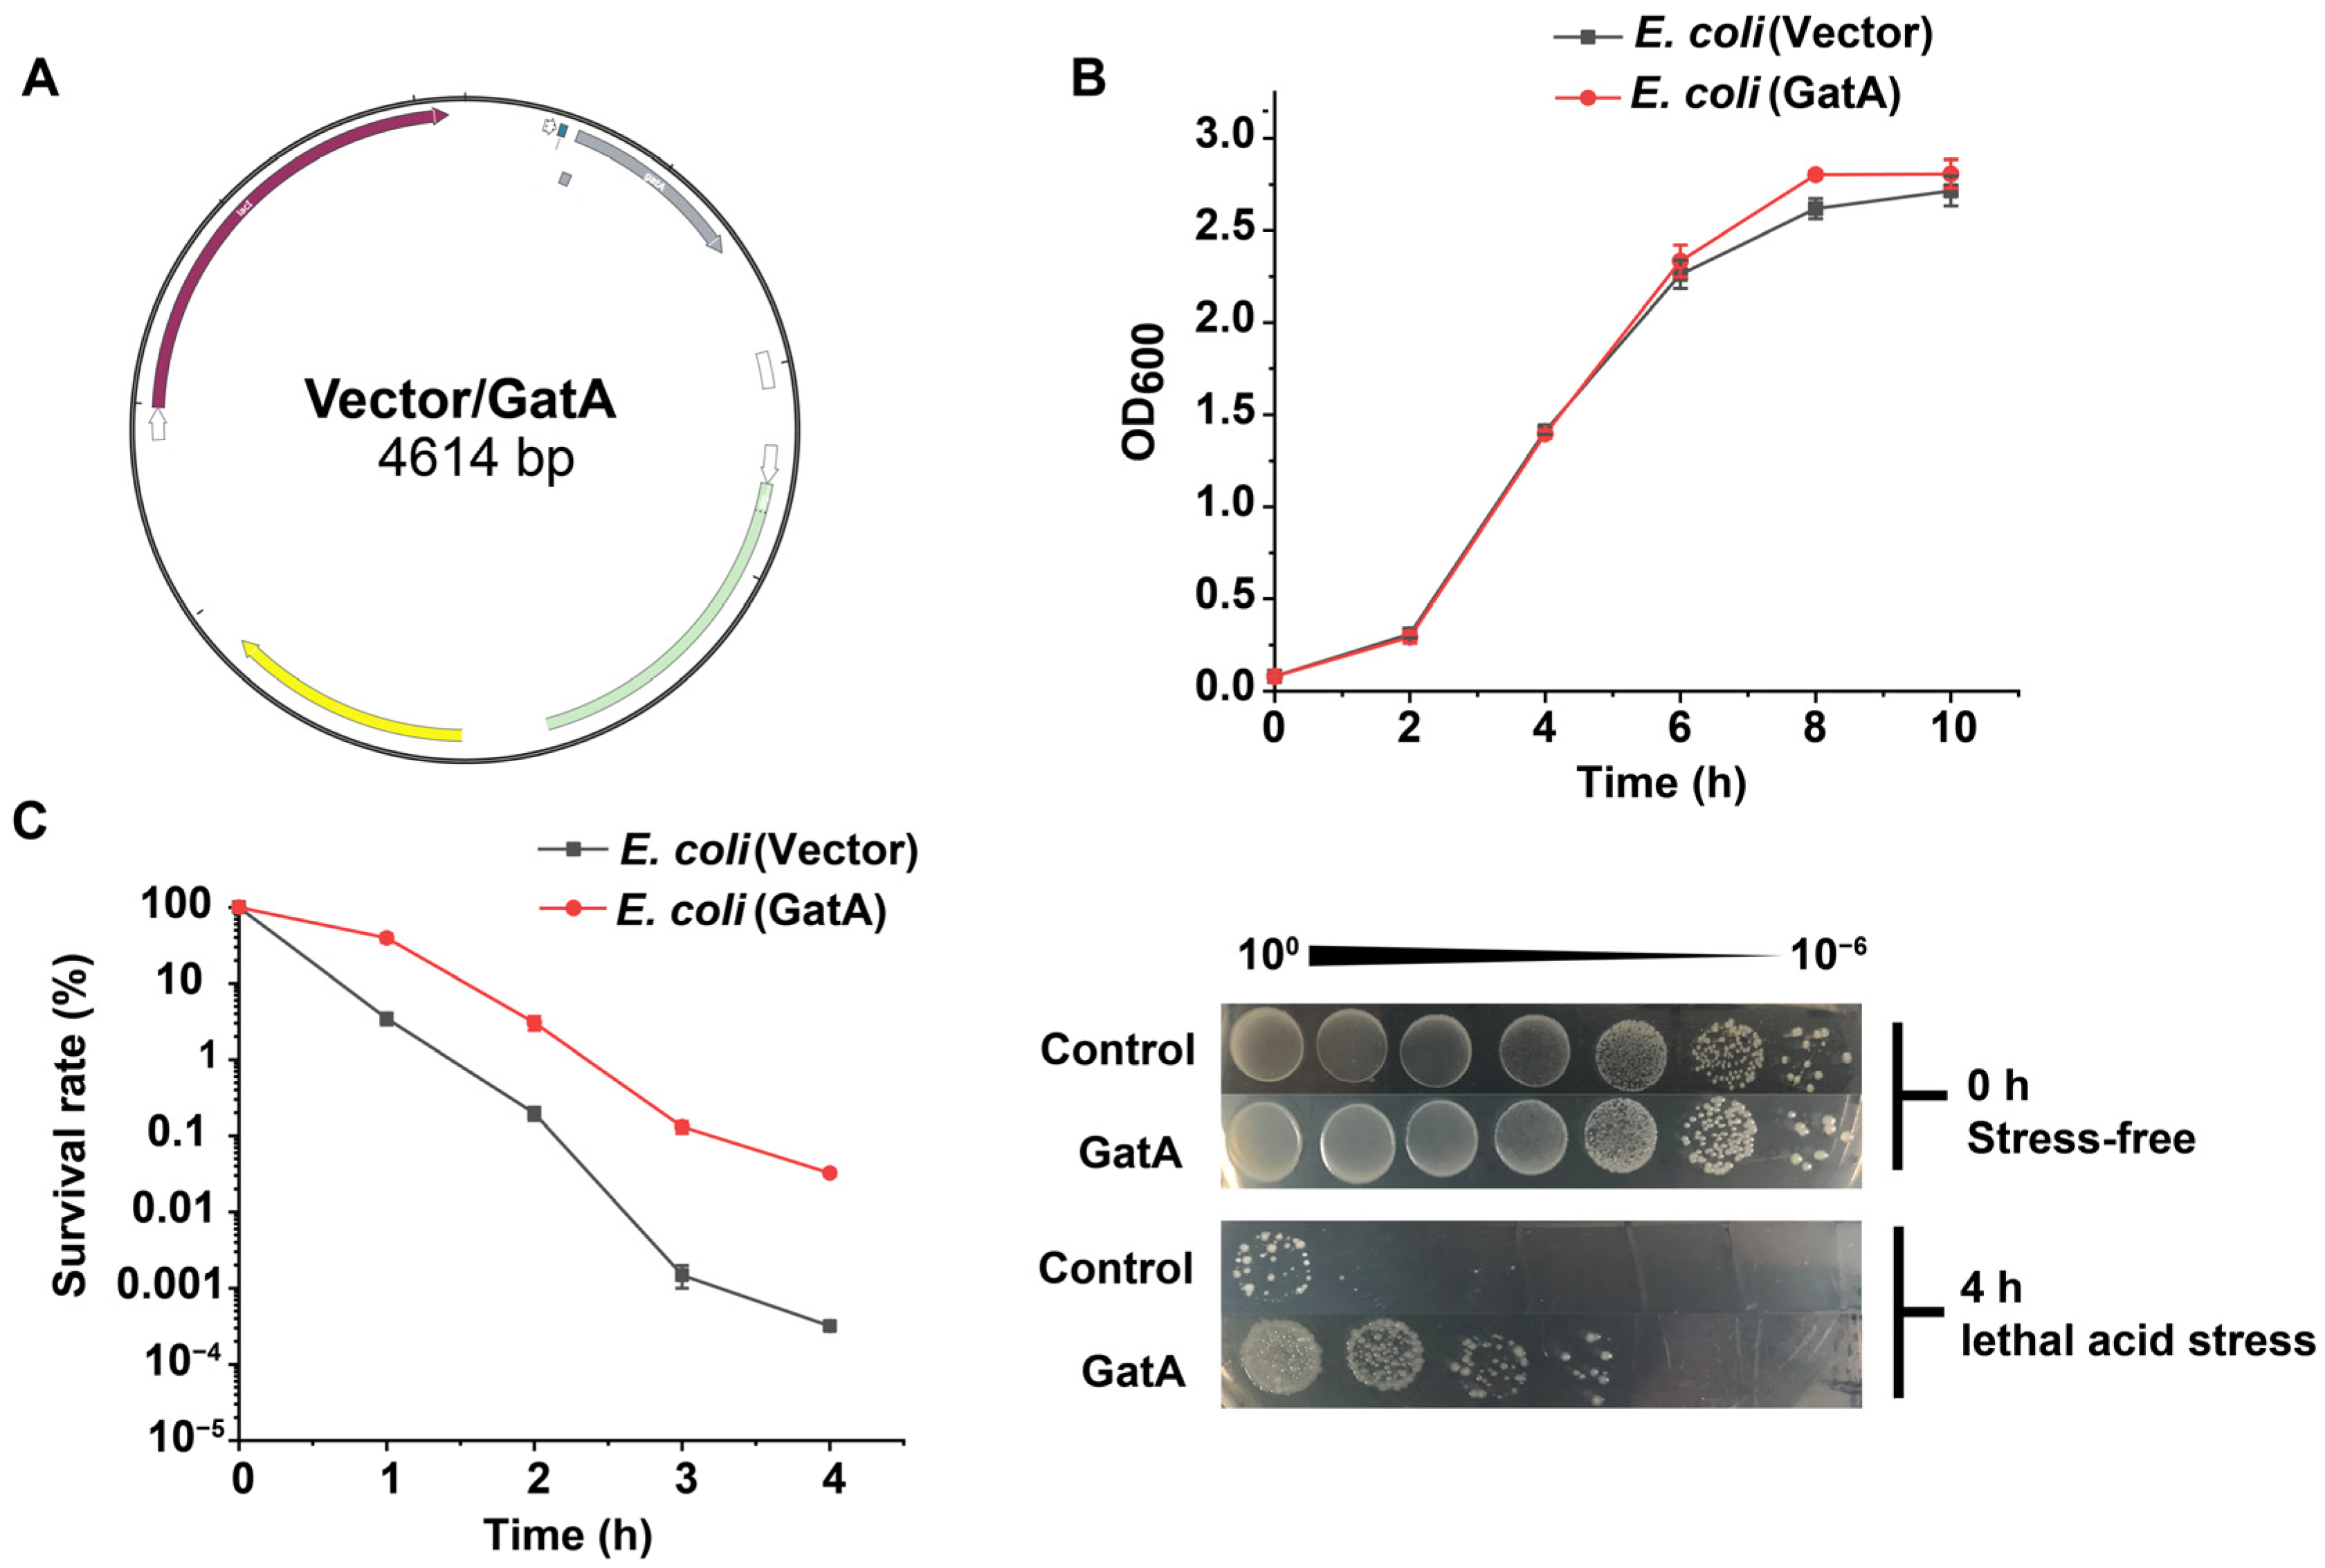
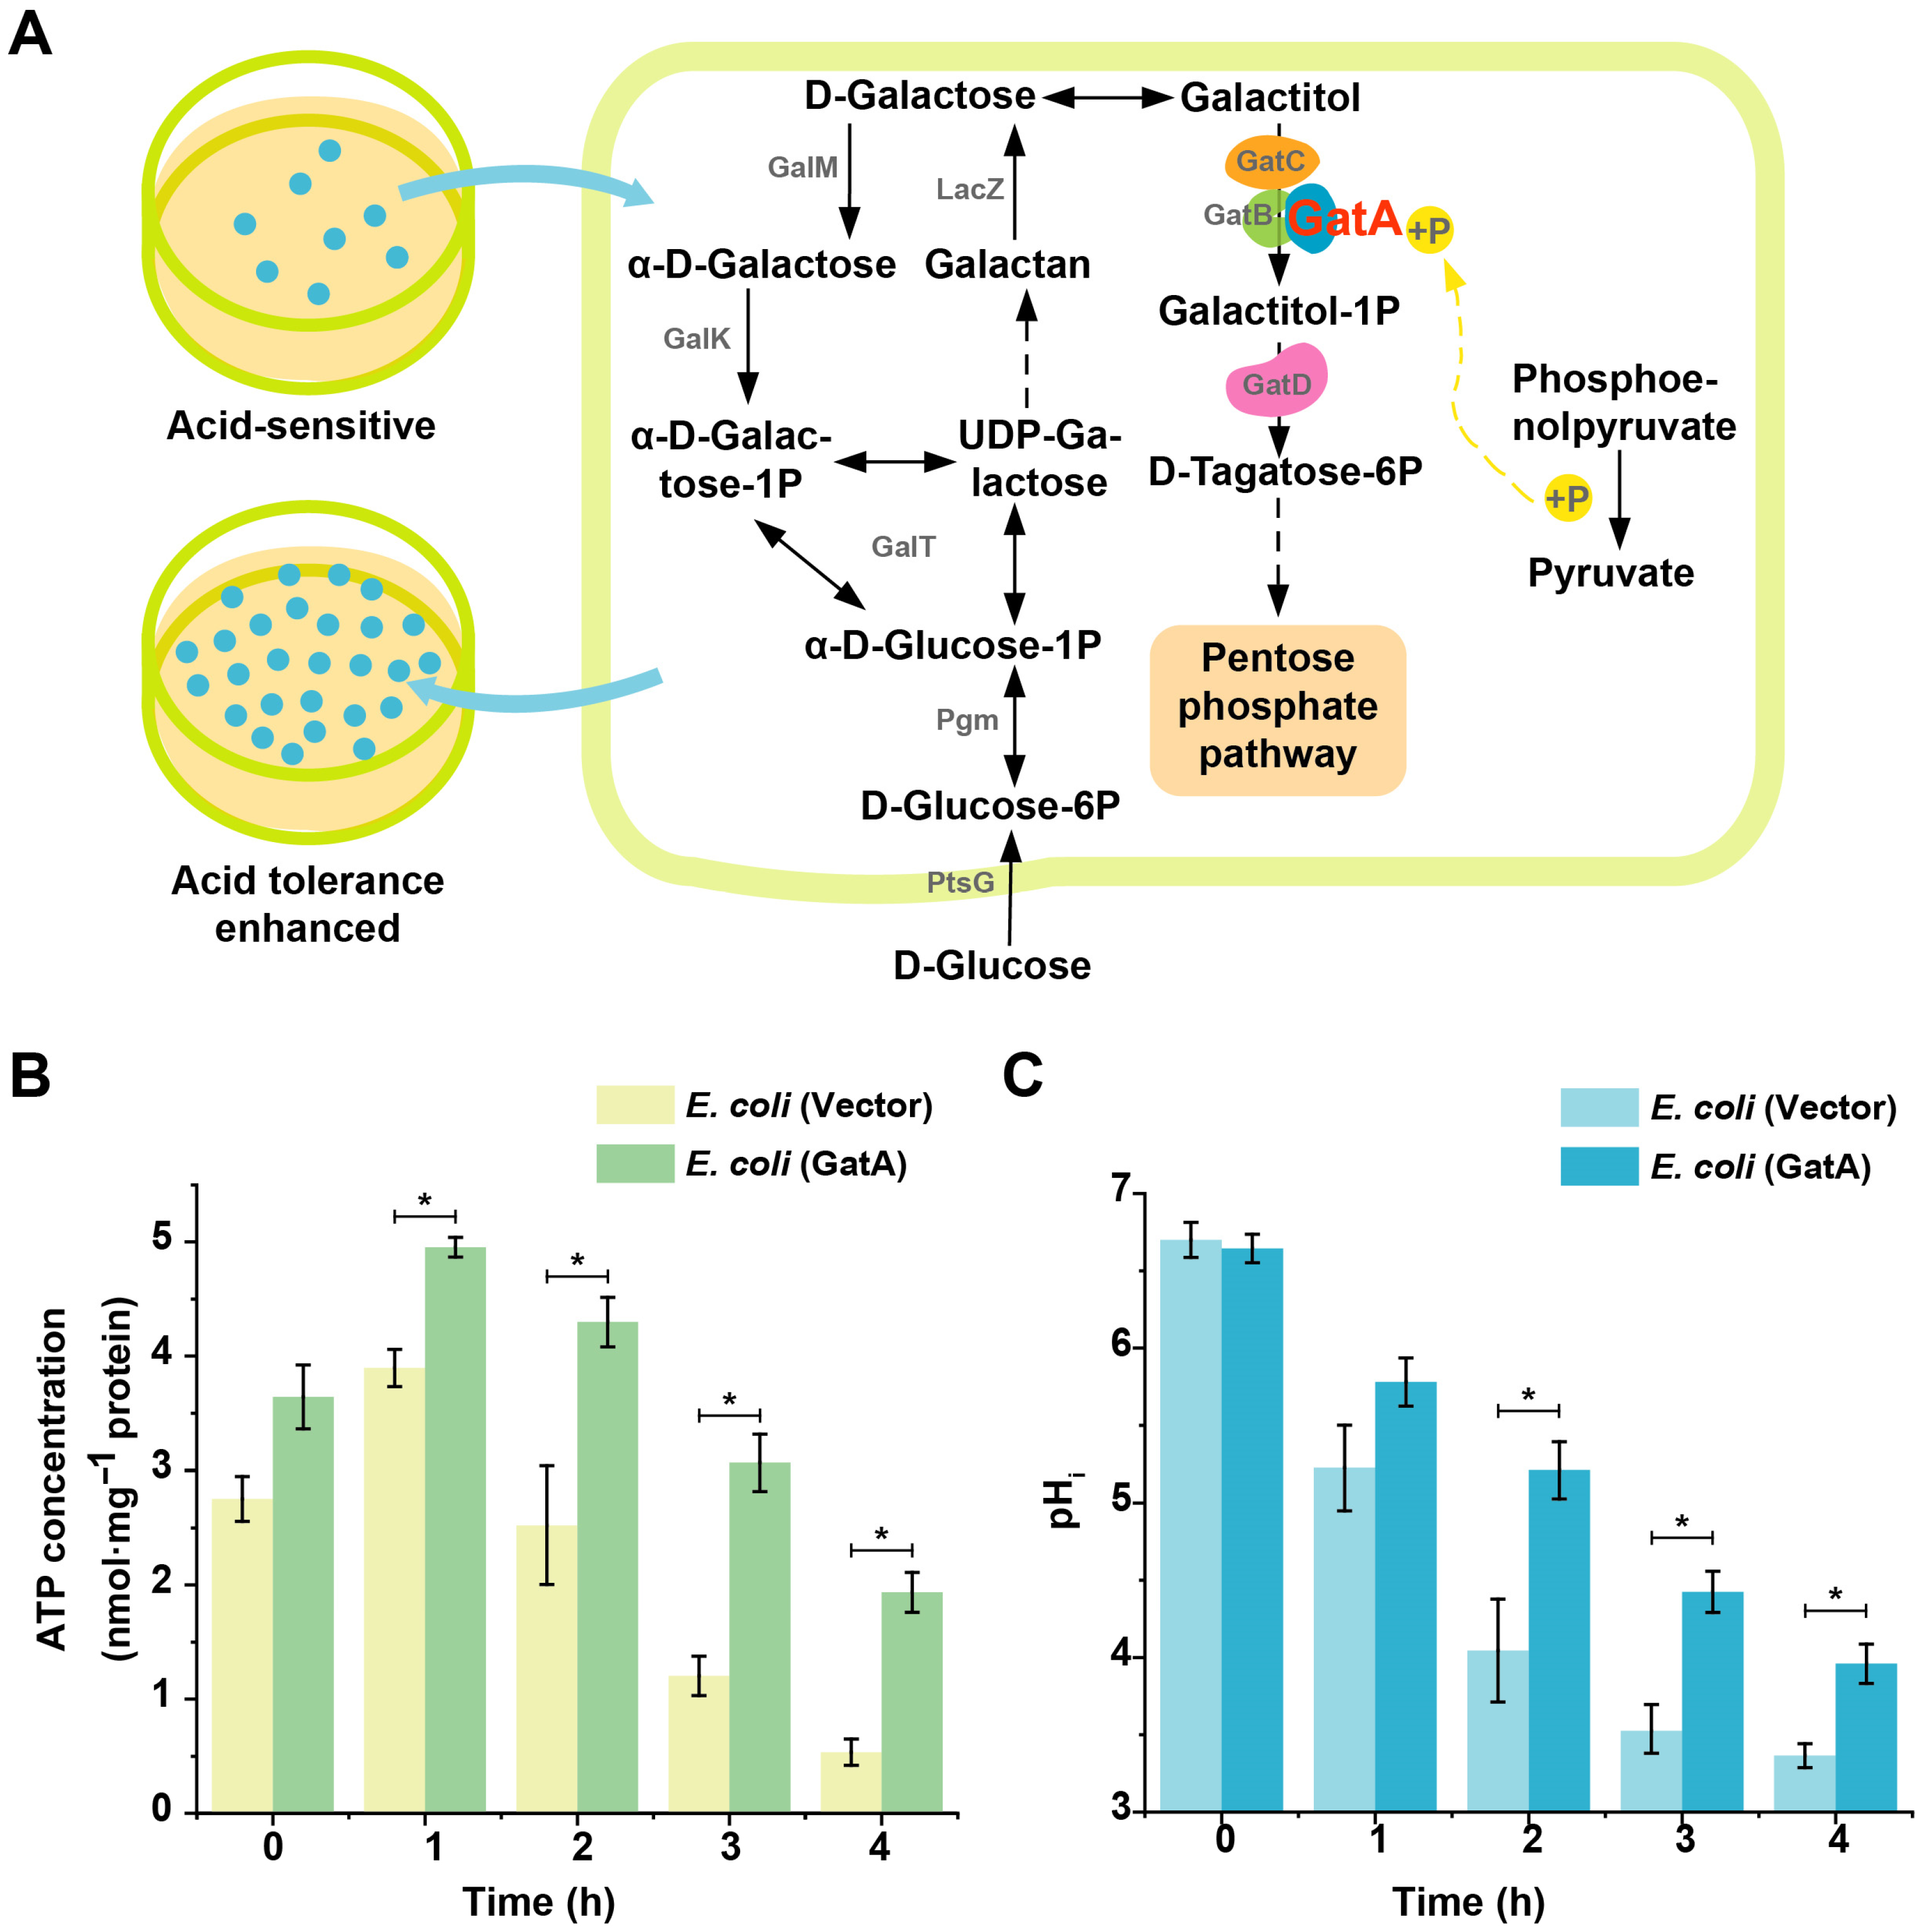
3.1. Identification and Functional Verification of GatA

Candidate proteins with the potential to enhance lactic acid tolerance in E. coli were identified by comparing transcriptomic data before and after evolution under D-LA lethal stress [25]. From this analysis, gatA was regarded as a candidate acid-tolerant functional factor that enhances E. coli lactate tolerance. Its expression was significantly upregulated by 2.62- and 2.09-fold, respectively, under conditions of before and after evolution under D-LA lethal stress. The RNA-seq raw reads were submitted to NCBI under BioProject number PRJNA675154.
An overexpression recombinant strain of E. coli (GatA) was constructed based on the gene gatA sequence (Figure 1A). Expression of GatA was induced to turn on at a pre-log growth OD600 of 0.5–0.6 (Incubation for 2.5 h). This recombinant strain grew normally in LB medium without acid stress, and the cell density at the stabilization phase was not obviously different from that of the control strain (Figure 1B), indicating that the overexpression of GatA did not affect the physiological metabolism of the cells; therefore, the difference in survival performance of the cells under lethal stress culture conditions could be assessed at the same growth level. After 4 h of incubation, the pH value that decreases the cell viability by 6 orders of magnitude (from 106 to 100) could obviously reflect the variability of cells [27,29]. In this study, we follow the previous pH setup value 4.0 of D-LA lethal stress medium [25,26]. When cells at mid-log growth were reacquired and transferred to D-LA lethal stress medium (pH 4.0), the number of viable cells decreased rapidly. The difference in survival between the recombinant strain E. coli (GatA) and the control strain E. coli (Vector) gradually increased with culture time, and when cultured for 4 h, the survival of E. coli (GatA) increased 101.8-fold (Figure 1C).
gatA encodes the small hydrophilic peptide GatA, which plays an important role in the transport and phosphorylation of the phosphotransferase system (PTS) [30]. PTS is dependent on phosphoenolpyruvate (PEP), which mainly phosphorylates various sugars and their derivatives and transports them intracellularly through a cascade of phosphorylation reactions [31]. Of the three cellular transport mechanisms, PTS belongs to the group translocation category, which means that substrates are metabolized simultaneously during transport [32]. Polypeptide chain GatA (EII A) and GatB (EII B) equipped with transmembrane protein GatC (EII C), are a specific transporter protein complexes of galactitol [32]. Previously, GatC was shown to eliminate ATP limitation and replace the original ATP-dependent transporter protein to transport xylose [33]. As is well-known, ATP is used as an energy source by cells, and cells consume energy to maintain their growth and metabolism, while withstanding adverse factors in the extracellular environment. Therefore, we hypothesized that the anti-acid factor GatA enhances cell survival under conditions of organic acid stress, with the beneficial effects due to a globalized ATP repletion mechanism (Figure 2A).
We then monitored the intracellular ATP concentration under the same LB medium condition of D-LA stress (pH 4.0), and the same time of induction of GatA expression with Figure 1C condition. Intracellular ATP content accumulated with cell growth, so that a higher ATP content of approximately 1.06 nmol·mg−1 protein accumulated in the cells of the recombinant strain E. coli (GatA) when it was first transferred to a lethal stress culture environment (0 h stress). Cells appear to initiate ATP repletion mechanism during the initial phase of acid-stress stimulation. The intracellular ATP concentrations of E. coli (GatA) and E. coli (Vector) peaked at 4.95 and 3.89 nmol·mg−1 protein at 1 h of lethal stress incubation, and then decreased to 1.93 and 0.56 nmol·mg−1 protein after 4 h of lethal stress incubation (Figure 2B). ATP concentration peaked at 1 h of stress and then decreased. This may be due to the rapid accumulation of ATP to resist stress when cells in the exponential phase are forced to leave a neutral environment and are placed in a lethal acidic culture environment that severely exceeds cellular tolerance. However, the physiological activity of cells is inevitably weakened and may even undergo apoptosis. The recombinant strain E. coli (GatA) maintained a high ATP content throughout the stressful environment culture, indicating that the intervention with gatA helped the cells accumulate ATP to counteract the organic acid stress. The H+-ATPase involved in proton transfer is essential for maintaining intracellular pH (pHi) [34], so it can be speculated that the higher energy status in the overexpressing GatA recombinant strain provides more energy for the catalytic action of H+-ATPase to pump the accumulated protons out of the cell to maintain intracellular pH homeostasis and relieve acid stress [35,36]. When the cells were first exposed to D-LA lethal stress, there was no significant difference in pHi between strains. The pHi decreased sharply with increasing stress time, but the pHi of E. coli (GatA) decreased less rapidly than that of E. coli (Vector). After 4 h of stress, the pHi of E. coli (GatA) was higher than that of E. coli (Vector) by 0.6. This indicated that the recombinant strain had a higher ability to maintain pHi under acidic stress environment to alleviate acid stress (Figure 2C). Acid-tolerant production strains can metabolize more products [23,26]. The candidate acid-tolerant factor GatA showed the potential to increase D-LA yield by promoting acid tolerance in D-LA-producing strains.

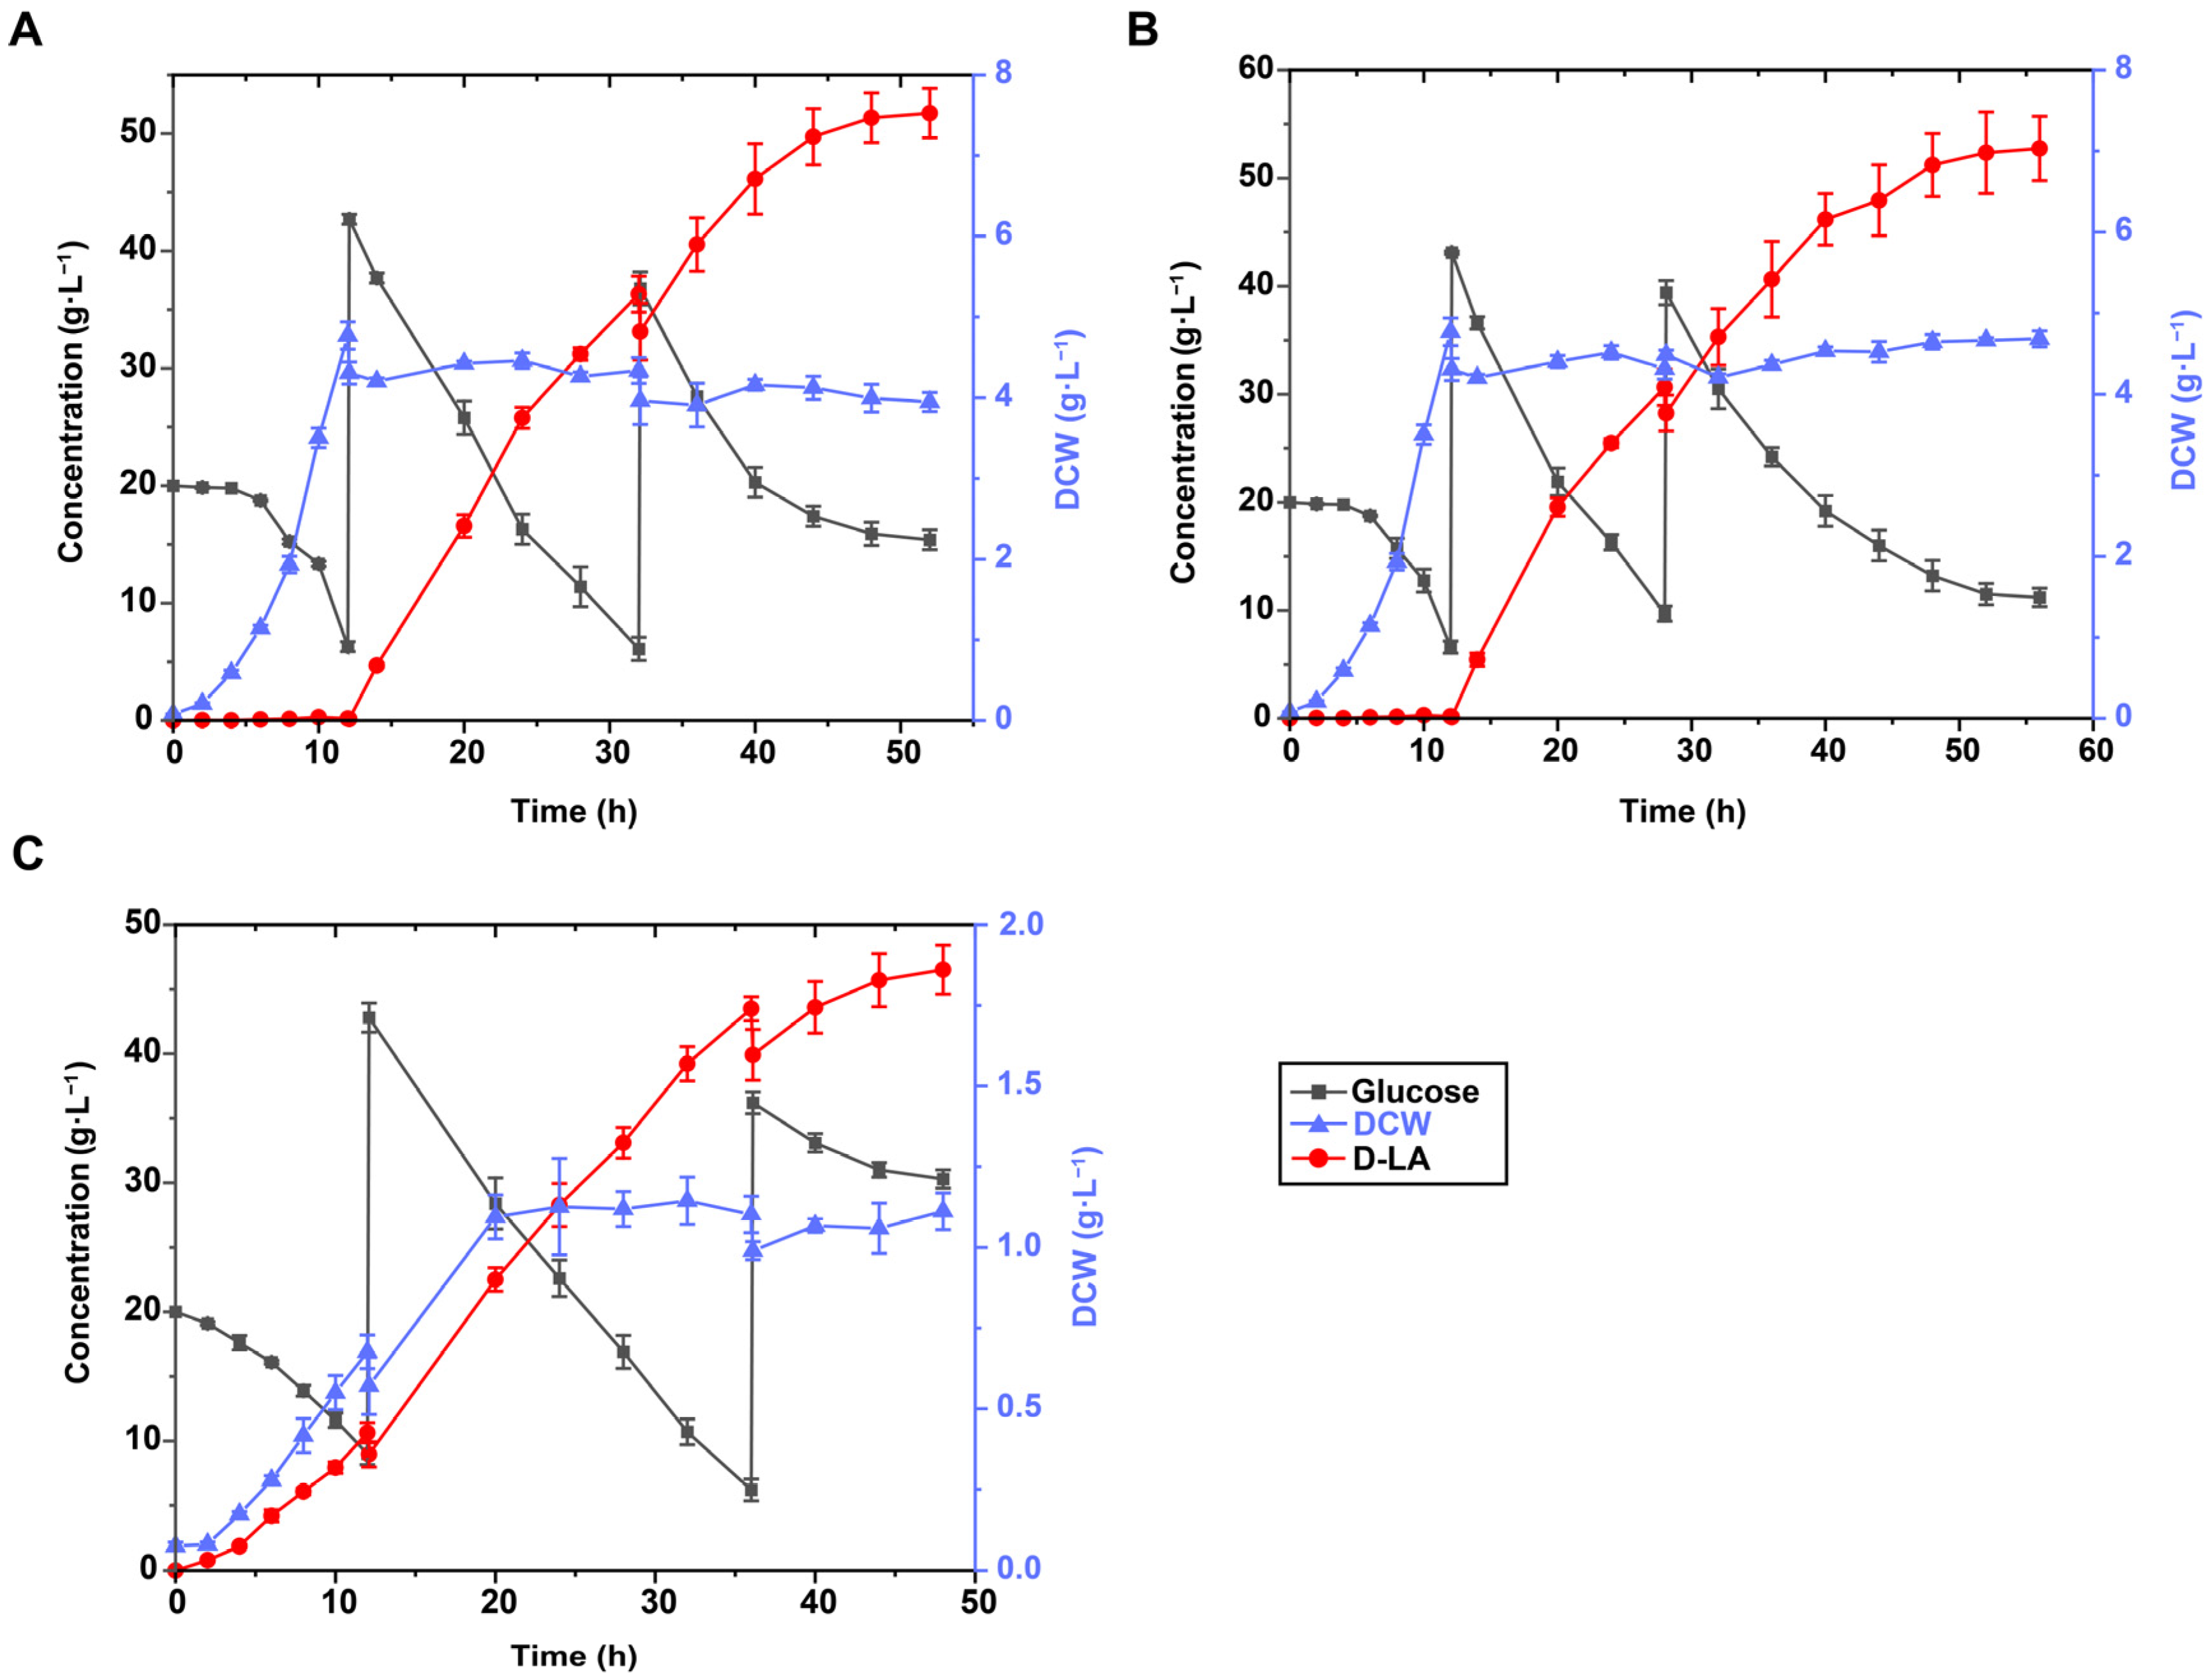
3.2. Aerobic Growth and Oxygen-Limited Fermentation Pattern Facilitate D-LA Production

Lactic acid is one of the main metabolites associated with biological growth processes [37]. Our initial findings suggest that GatA can act as a functional factor conferring acid resistance. However, before confirming whether this gene, which helps improve survival of strains under conditions of exogenous organic acid stress, can be applied in actual production experiments, it is necessary to select the optimal fermentation pattern in D-LA-producing strains to characterize the usefulness of this effect. The strong link between cell growth and acid production promotes the production of D-LA fermentation. Three main types of fermentation patterns have been reported for D-LA: single-phase fermentation (SPF, low-speed stirring 100 rpm for full process oxygen limitation incubation) [6,7], two-phase fermentation I (TPF I, growth phase with oxygen supply and high-speed agitation 400–600 rpm, switching to restricted oxygen supply and low-speed stirring 100 rpm at transition to acid production phase but no aeration) [8] and two-phase fermentation II (TPF II, same growth phase as TPF I, transition to microaerobic state with 1 L·min−1 aeration and 200 rpm agitation) [9]. In this study, we used each of these three patterns for the D-LA producing strain LBBE317 to determine the optimal fermentation pattern in a 5 L bioreactor.
In this study, the D-LA titer was preferred as the screen for optimal fermentational standard under normal pH condition value 7.0. Pattern TPF accumulated biomass rapidly during the 12 h of aerobic growth, and metabolized higher D-LA 51.7–53.8 g·L−1 in the 40 h acid production phase with low-speed stirring (Figure 3A), but a 0.19 g·g−1 lower yield of TPF2 was accompanied by the accumulation of cell density (Figure 3B). Pattern SPF accumulated D-LA 46.4 g·L−1 and was not selected, although full-scale SPF demonstrated a higher productivity of 1.03 g·L−1 h−1 and yield of 0.89 g·g−1 glucose in the whole 48 h process (Figure 3C), which was not beneficial for the accumulation of cell mass, resulting in lower productivity later in the fermentation. Therefore, two-phase fermentation TPFI with aerobic growth and oxygen-limited fermentation is recommended as the fermentation process.

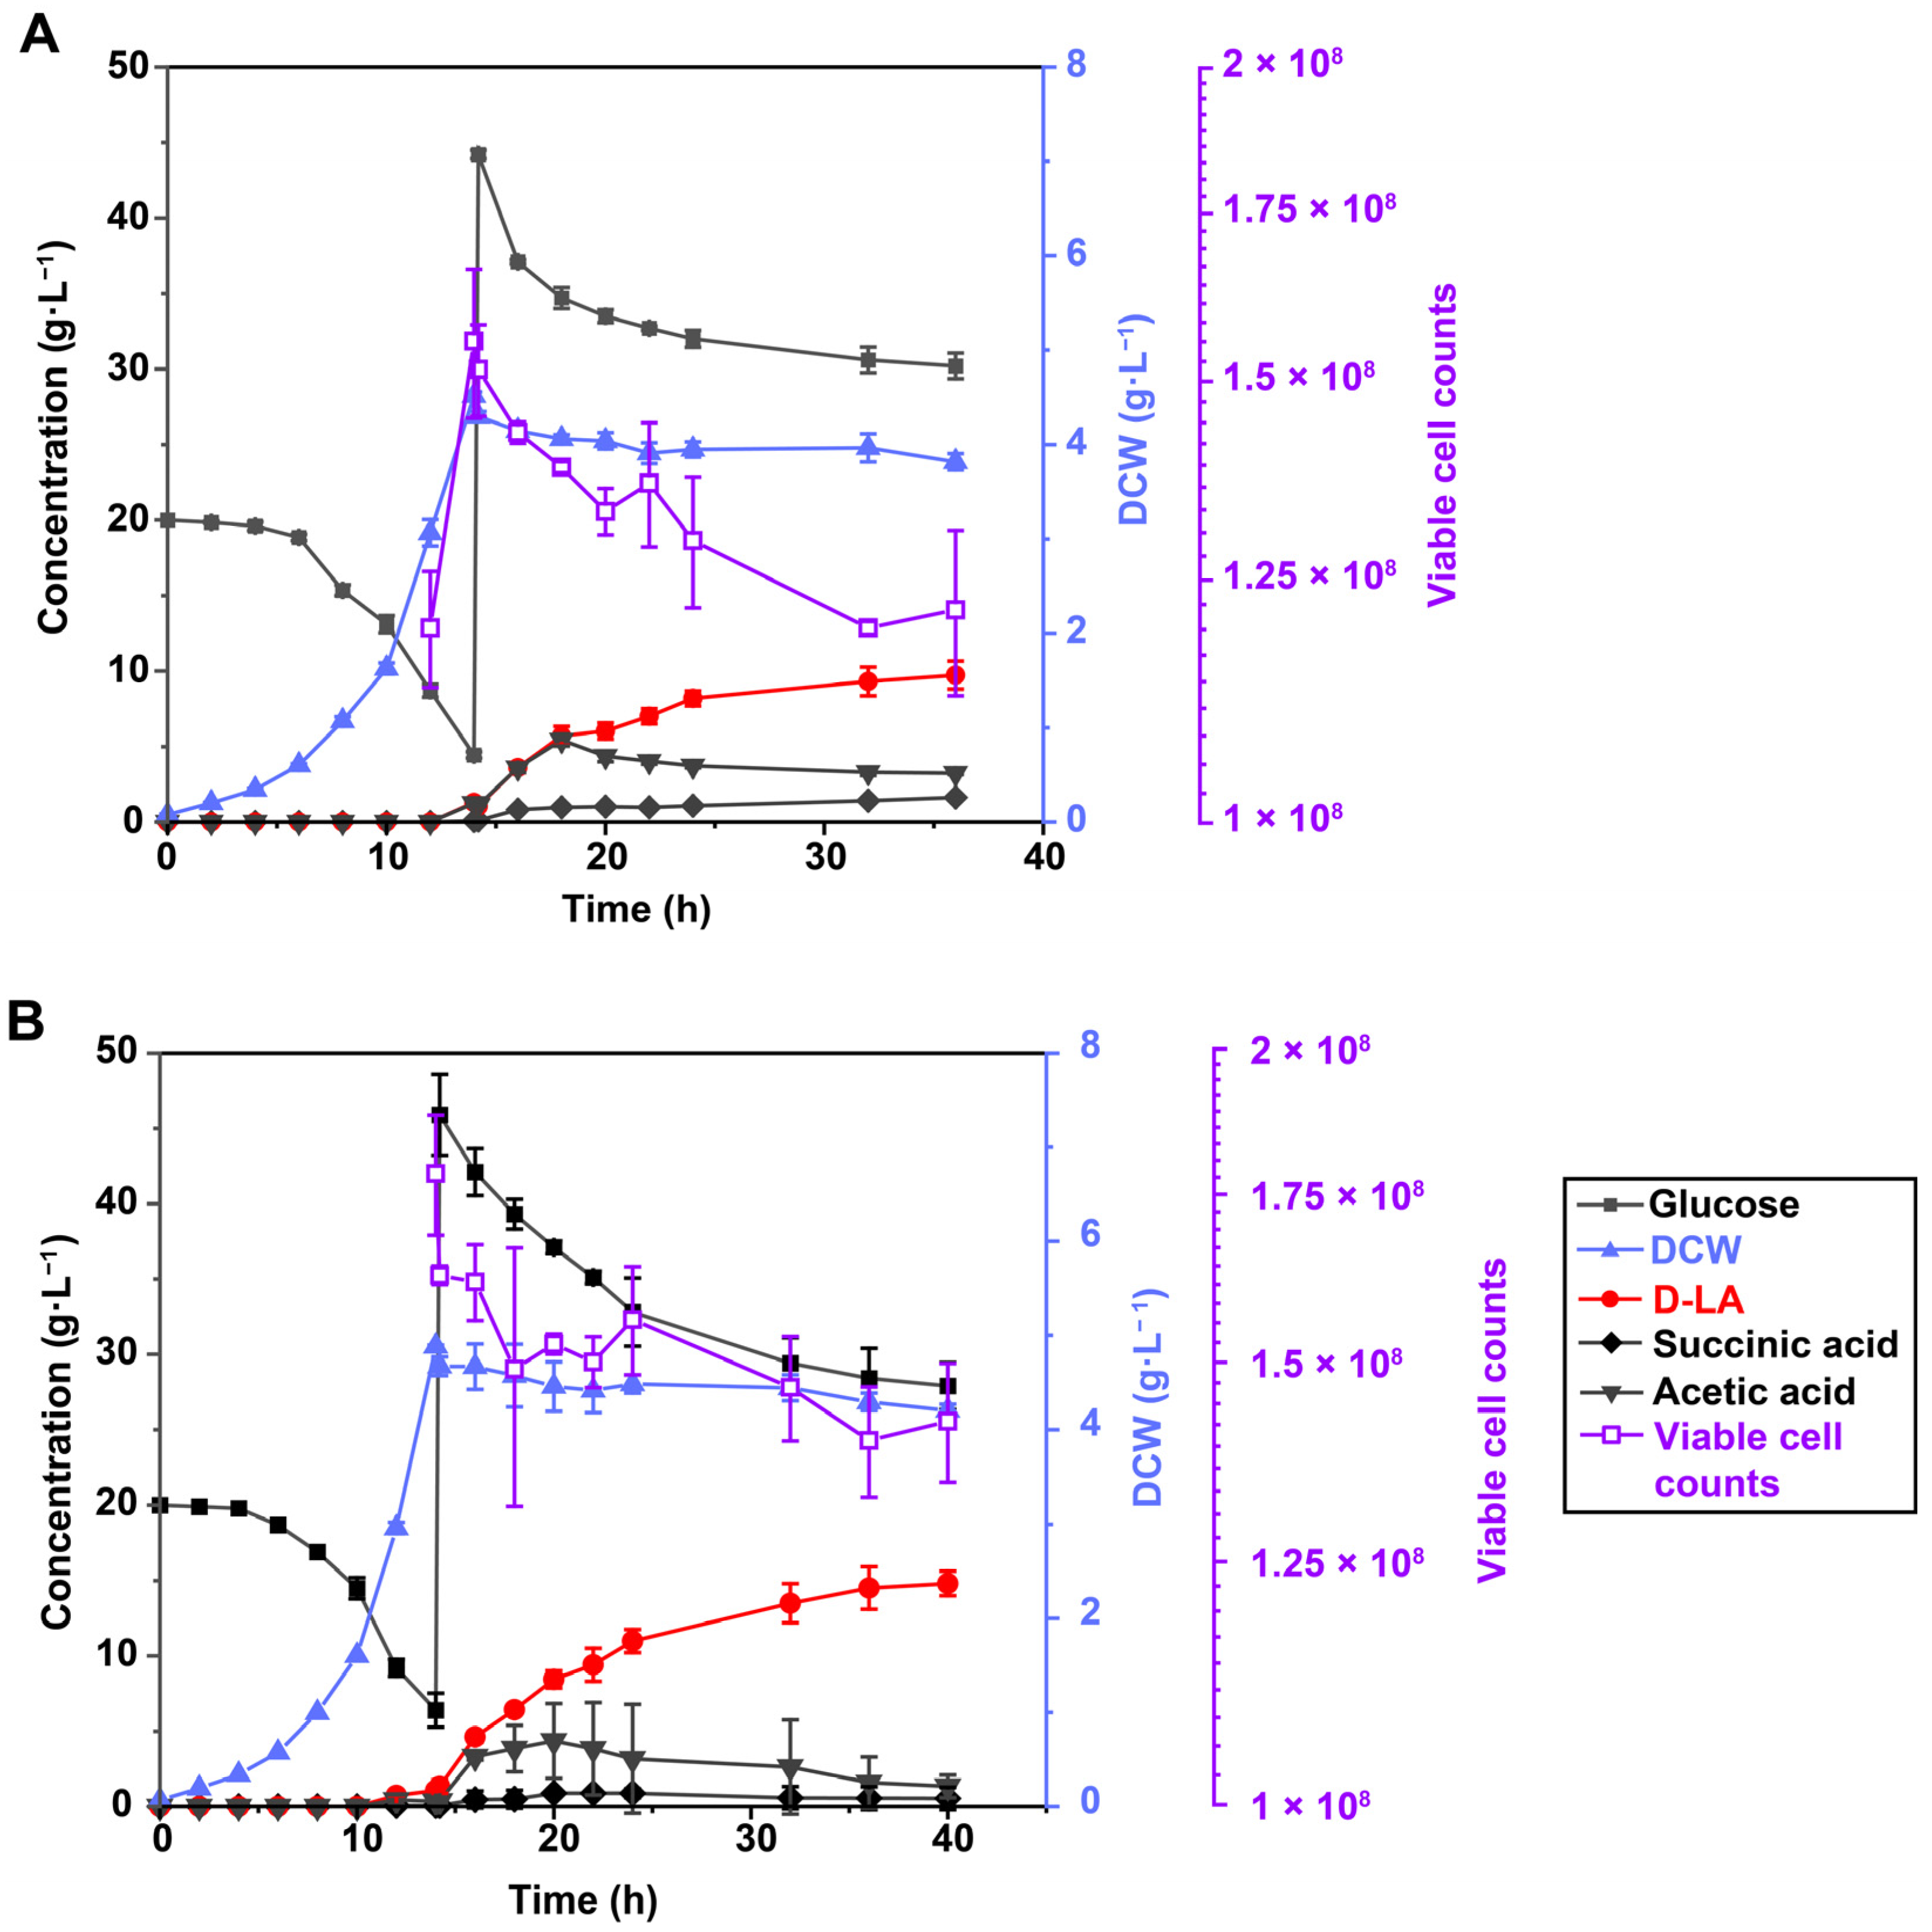
3.3. Effect of Biomass at the Transition Point between Growth and Acid Production Stages

During the transition to the acid-producing stage, cellular activity is dominated by acid accumulation. The biomass content during the aerobic phase of growth influences the flow of glucose metabolism to lactate [9]. Therefore, biomass at the transition point between the aerobic growth and acid-producing stages may be correlated with the rate of D-LA production. The two-stage fermentation pattern was found to be optimal, and recombinant plasmid-induced expression of the acid-resistance factor GatA was turned on at the aerobic growth stage, consistent with the settings for inducing expression during the growth stage when acid tolerance was analyzed. Strain LBBE317, which contained an empty plasmid, was constructed for further examination of fermentation points.
Different transition points have a noticeable effect on the accumulation of D-LA under normal pH condition value 7.0. When the biomass accumulated to about 50% (OD600 ~8.6) of the maximum biomass (OD600~17) at the transition to the acid-producing stage (Figure S1), both D-LA production 33.4 g·L−1 and productivity 0.56 g·L−1 h−1 were affected and the fermentation cycle was prolonged. This inefficiency may have been caused by the low activity of key enzymes in the cellular D-LA production pathway. D-LA titer could reach 45.6–48.7 g·L−1 when the biomass accumulated to approximately 70% (OD600~12) or 90% (OD600~15.5) of the maximum biomass for the transition. However, 90% biomass accumulation results in a 12.5% longer fermentation cycle, which is a negative factor for rapid equipment turnaround. In conclusion, a biomass accumulation of 70% of the maximum biomass was the optimal condition used for subsequent studies.

3.4. Inductional Effect on D-LA Synthesis at Different Growth Stages

Conditions under which a culture is at its highest growth rate is considered the optimal time to induce expression in a strain [38]. IPTG enables control of the lac promoter to regulate recombinant protein manufacturing in E. coli, but inappropriate induction times affect cell proliferation [39] and thus product accumulation. Therefore, after determining the optimal transition point for D-LA production, the effect of adding inducers during three different growth periods on D-LA synthesis was evaluated: late lag phase (LLP, OD600~3.0), pre exponential phase (PEP, OD600~4.5) and mid-pre exponential phase (MPEP, OD600~6.0).
When IPTG is added at low cell densities, the metabolism of the target protein is assumed to harm normal bacterial growth under normal pH condition value 7.0, leading to a decrease in OD600 [40,41]. Similarly, in this study, when 200 mM IPTG was added during LLP, the recombinant plasmid was activated prematurely and cell growth was retarded thereby negatively affecting D-LA biosynthesis, and the concentration of D-LA was reduced to 36.4 g·L−1 (Figure 4A). In contrast, the growth rate and biomass accumulation of cells in the exponential phase were not significantly affected by addition of the inducer. When the cells were induced with PEP, the D-LA titer reached a maximum of 48.9 g·L−1 (Figure 4B), which was higher than that of 46.6 g·L−1 when the inducer was added at MPEP (Figure 4C). Shorter fermentation cycle and outstanding productivity were more favorable for D-LA production. Theses results suggest that the addition of IPTG at the pre-exponential phase is suitable for the synthesis of D-LA, allowing the acid-resistant effect of the functional element to be observed more clearly.

3.5. LBBE317PGA Enhanced D-LA Production under Low pH Incubation

When oxygen is abundant, E. coli can use one molecule of glucose to produce 36–38 ATP molecules. However, D-LA synthesis occurs during anaerobic metabolism, and under these conditions, only two ATP molecules accumulate after one molecule of glucose produces two molecules of D-LA. Although a moderately low rate of oxygen supply to the medium can promote consumption of the carbon source [42], suprathreshold oxygen tension may affect D-LA production and productivity [16], and the synthesis of by-products is also not conducive to efficient isolation of the downstream product. Previously, it has been suggested that deletion of the ATP-dependent transporter protein within the D-LA-producing engineered strain CL3 leads to an improvement in cell growth rate, indicating an increase in theoretical ATP production [6]. Subsequently, Utrilla et al. confirmed that a mutation in GatC (GatCS184L) was responsible for increased xylose consumption by whole-genome sequencing, but the mechanism was not clear [33]. In this study, we clarified that the overexpression of GatA, another necessary component of the galactitol transport complex, effectively replenishes the ATP content of cellular metabolic processes and relieves ATP supply restriction. This suggests that GatA may bring about cellular tolerance to D-LA while maintaining metabolic production.
Stress caused by the accumulation of acidic products threatens the productivity of cells. To maximize the effectiveness of the application of anti-acid components, it is necessary to determine the pH at which the strain is most affected by acid stress. Based on the pKa of lactate (3.86), the pH values of the acid-producing phase medium settings (6.69, 5.47, 4.53 and 3.53) [11] were considered in a previous study, we found that with increasing concentrations of D-LA, the stress to cells by acid stress peaked when the pH was maintained at pH 5.5 [26]. Overexpression of GatA showed greatly enhanced survival under D-LA stress and was therefore transferred into LBBE317 as LBBE317PGA. During the aerobic growth stage, LBBE317PGA exhibiteda higher growth rate of 0.26 h−1. When transitioning to the lactic acid production stage, the acid production rate of LBBE317PGA was not visibly inhibited compared with that of the control strain LBBE317P, indicating that the enhanced expression of GatA did not affect the cellular activity of metabolizing D-LA. When the environmental pH dropped to 5.5, the ammonia pump was turned on to maintain the pH. The D-LA production of the control strain LBBE317P was approximately 9.5 g·L−1 (Figure 5A), while LBBE317PGA produced approximately 14.8 g·L−1 D-LA, which represents an increase of 55.7%, and maintained a higher cell density (Figure 5B). The titers of succinic and acetic acids were reduced by 67.2% and 58.5%, respectively. These results confirmed that the overexpression of the galactitol transport factor GatA markedly enhanced the metabolic activity of E. coli under acid stress. With the assistance of the transporter protein GatA, the limitation of ATP supplementation was effectively compensated for while simultaneously ensuring the metabolism of D-LA and normal physiological activities.
To further validate the tolerance brought about by overexpression of GatA, we examined the effects of GatA on exogenous organic acids with different numbers of carbons and not limited to three-carbon D-LA. We tested the survival rate under stress with four-carbon succinic acid and five-carbon itaconic acid. Cell survival was calculated in the same way as for the validation of D-LA stress. After 4 h of itaconic acid lethal stress (pH 4.2, itaconic acid adjusted), the survival rate of the recombinant strain was 29.4 times higher than that of the control (Figure 6A). It is possible that E. coli has a weaker baseline tolerance to succinic acid, and the strain survived for a shorter time. After 3 h of succinic acid lethal stress (pH 4.3, succinic acid adjusted), the survival rate of the recombinant strain was 41.6-fold higher than that of the control strain (Figure 6B).
The trends of ATP concentration under itaconic acid and succinic acid lethal stress conditions were similar to the trends under D-LA lethal stress conditions, both exhibiting an increasing trend followed by a decreasing trend. Under itaconic acid lethal stress conditions, the intracellular ATP concentrations of E. coli (GatA) and E. coli (Vector) peaked at 4.18 and 3.72 nmol·mg−1 protein at 1 h incubation, and then decreased to 1.16 and 0.45 nmol·mg−1 protein after 4 h stress incubation. The pHi also decreased sharply with increasing stress time. After 4 h stress incubation, the pHi of E. coli (GatA) was higher than that of E. coli (Vector) by 0.44 (Figure S2A). Under succinic acid lethal stress conditions, the intracellular ATP concentrations of E. coli (GatA) and E. coli (Vector) peaked at 3.56 and 3.34 nmol·mg−1 protein at 1 h incubation, and then decreased to 0.76 and 0.56 nmol·mg−1 protein after 4 h incubation. After 4 h stress incubation, the pHi of E. coli (GatA) was higher than that of E. coli (Vector) by 0.12 (Figure S2B).
These results suggest that GatA is an effective anti-acid factor with wide applications in enhancing organic acid tolerance in E. coli.

4. Conclusions

In this study, overexpression of the galactitol-specific PTS enzyme IIA component GatA improved the tolerance of E. coli at low pH to D-LA, itaconic acid and succinic acid at low pH. Furthermore, regulated overexpression of GatA regulation allowed E. coli to ferment D-LA at lower pH environments, increasing the titer by 55.7%. To the best of our knowledge, this is the first report showing that the galactitol transporter GatA can enhance the stress tolerance of E. coli to a variety of organic acids. Based on the commonality of PTS, we believe that this anti-acid element may also have applications in improving the production efficiency of other organic acids.

Supplementary Materials

The following supporting information can be downloaded at: https://www.mdpi.com/article/10.3390/fermentation8120665/s1, Figure S1: Effect of different biomass during the transition from the growth phase to the acid production phase; Figure S2 Intracellular ATP concentration and pH under itaconic and succinic acid lethal stress; Table S1 Strains and plasmids used in this study; Table S2 Bioreactor experimental fermentation conditions.

Author Contributions

Conceptualization, J.Z. and G.D.; formal analysis, J.Y.; investigation, J.Y.; methodology, G.D.; resources, J.Z.; supervision, J.Z. and G.D.; validation, X.J.; writing—original draft, J.Y.; writing—review and editing, Z.P. The final manuscript read and approved by all authors. All authors have read and agreed to the published version of the manuscript.

Funding

This research was funded by the National Key Research and Development Program of China (2019YFC1605800), the Independent Research Project of State Key Laboratory of Food Science and Technology (SKLF-ZZB-202015).

Institutional Review Board Statement

Not applicable.

Informed Consent Statement

Not applicable.

Data Availability Statement

The original RNA-seq reads have been submitted to NCBI under the number PRJNA675154.

Conflicts of Interest

The authors declare no competing financial interest.

References

  1. Shi, Y.H.; Sun, H.Y.; Lu, D.M.; Le, Q.; Chen, D.; Zhou, Y. Separation of glycolic acid from glycolonitrile hydrolysate by reactive extraction with tri-n-octylamine. Sep. Purif. Technol. 2006, 49, 20–26. [Google Scholar]
  2. Ahn, J.H.; Jang, Y.S.; Lee, S.Y. Production of succinic acid by metabolically engineered microorganisms. Curr. Opin. Biotechnol. 2016, 42, 54–66. [Google Scholar] [CrossRef] [PubMed]
  3. Yang, J.; Zhang, J.; Zhu, Z.; Du, G. The challenges and prospects of Escherichia coli as an organic acid production host under acid stress. Appl. Microbiol. Biot. 2021, 105, 8091–8107. [Google Scholar] [CrossRef]
  4. Datta, R.; Henry, M. Lactic acid: Recent advances in products, processes and technologies—A review. J. Chem. Technol. Biot. 2006, 81, 1119–1129. [Google Scholar] [CrossRef]
  5. Tsuji, F. Autocatalytic hydrolysis of amorphous-made polylactides: Effects of L-lactide content, tacticity, and enantiomeric polymer blending. Polymer 2002, 43, 1789–1796. [Google Scholar] [CrossRef]
  6. Utrilla, J.; Gosset, G.; Martinez, A. ATP limitation in a pyruvate formate lyase mutant of Escherichia coli MG1655 increases glycolytic flux to d-lactate. J. Ind. Microbiol. Biot. 2009, 36, 1057–1062. [Google Scholar] [CrossRef]
  7. Liu, Y.; Gao, W.; Zhao, X.; Wang, J.H.; Garza, E.; Manow, R.; Zhou, S.D. Pilot scale demonstration of D-lactic acid fermentation facilitated by Ca(OH)(2) using a metabolically engineered Escherichia coli. Bioresour. Technol. 2014, 169, 559–565. [Google Scholar] [CrossRef]
  8. Zhou, L.; Zuo, Z.R.; Chen, X.Z.; Niu, D.D.; Tian, K.M.; Prior, B.A.; Shen, W.; Shi, G.Y.; Singh, S.; Wang, Z.X. Evaluation of Genetic Manipulation Strategies on d-Lactate Production by Escherichia coli. Curr. Microbiol. 2011, 62, 981–989. [Google Scholar] [CrossRef]
  9. Zhou, L.; Tian, K.M.; Niu, D.D.; Shen, W.; Shi, G.Y.; Singh, S.; Wang, Z.X. Improvement of d-lactate productivity in recombinant Escherichia coli by coupling production with growth. Biotechnol. Lett. 2012, 34, 1123–1130. [Google Scholar] [CrossRef]
  10. Olson, E.R. Influence of Ph on Bacterial Gene-Expression. Mol. Microbiol. 1993, 8, 5–14. [Google Scholar] [CrossRef]
  11. Zhong, W.; Yang, M.H.; Hao, X.M.; Sharshar, M.M.; Wang, Q.H.; Xing, J.M. Improvement of D-lactic acid production at low pH through expressing acid-resistant gene IoGAS1 in engineered Saccharomyces cerevisiae. J. Chem. Technol. Biot. 2021, 96, 732–742. [Google Scholar] [CrossRef]
  12. Valli, M.; Sauer, M.; Branduardi, P.; Borth, N.; Porro, D.; Mattanovich, D. Improvement of lactic acid production in Saccharomyces cerevisiae by cell sorting for high intracellular pH. Appl. Environ. Microb. 2006, 72, 5492–5499. [Google Scholar] [CrossRef] [PubMed] [Green Version]
  13. Piper, P.; Calderon, C.O.; Hatzixanthis, K.; Mollapour, M. Weak acid adaptation: The stress response that confers yeasts with resistance to organic acid food preservatives. Microbiology 2001, 147, 2635–2642. [Google Scholar] [CrossRef] [PubMed] [Green Version]
  14. Lu, P.L.; Ma, D.; Chen, Y.L.; Guo, Y.Y.; Chen, G.Q.; Deng, H.T.; Shi, Y.G. L-glutamine provides acid resistance for Escherichia coli through enzymatic release of ammonia. Cell Res. 2013, 23, 635–644. [Google Scholar] [CrossRef] [Green Version]
  15. Roe, A.J.; O’Byrne, C.; McLaggan, D.; Booth, I.R. Inhibition of Escherichia coli growth by acetic acid: A problem with methionine biosynthesis and homocysteine toxicity. Microbiology 2002, 148, 2215–2222. [Google Scholar] [CrossRef] [Green Version]
  16. Singhvi, M.; Zendo, T.; Sonomoto, K. Free lactic acid production under acidic conditions by lactic acid bacteria strains: Challenges and future prospects. Appl. Microbiol. Biot. 2018, 102, 5911–5924. [Google Scholar] [CrossRef]
  17. Fletcher, E.; Feizi, A.; Bisschops, M.M.M.; Hallstrom, B.M.; Khoomrung, S.; Siewers, V.; Nielsen, J. Evolutionary engineering reveals divergent paths when yeast is adapted to different acidic environments. Metab. Eng. 2017, 39, 19–28. [Google Scholar] [CrossRef]
  18. Fu, X.M.; Wang, Y.X.; Wang, J.H.; Garza, E.; Manow, R.; Zhou, S.D. Semi-industrial scale (30 m(3)) fed-batch fermentation for the production of D-lactate by Escherichia coli strain HBUT-D15. J. Ind. Microbiol. Biot. 2017, 44, 221–228. [Google Scholar] [CrossRef] [PubMed]
  19. Lee, J.K.; Kim, S.; Kim, W.; Kim, S.; Cha, S.; Moon, H.; Hur, D.H.; Kim, S.Y.; Na, J.G.; Lee, J.W.; et al. Efficient production of d-lactate from methane in a lactate-tolerant strain of Methylomonas sp. DH-1 generated by adaptive laboratory evolution. Biotechnol. Biofuels 2019, 12, 234. [Google Scholar] [CrossRef] [Green Version]
  20. Park, H.J.; Bae, J.H.; Ko, H.J.; Lee, S.H.; Sung, B.H.; Han, J.I.; Sohn, J.H. Low-pH production of d-lactic acid using newly isolated acid tolerant yeast Pichia kudriavzevii NG7. Biotechnol. Bioeng. 2018, 115, 2232–2242. [Google Scholar] [CrossRef]
  21. Zheng, H.; Gong, J.; Chen, T.; Chen, X.; Zhao, X. Strain improvement of Sporolactobacillus inulinus ATCC 15538 for acid tolerance and production of D-lactic acid by genome shuffling. Appl. Microbiol. Biotechnol. 2010, 85, 1541–1549. [Google Scholar] [CrossRef]
  22. Ma, J.F.; Wu, M.K.; Zhang, C.Q.; He, A.Y.; Kong, X.P.; Li, G.L.; Wei, C.; Jiang, M. Coupled ARTP and ALE strategy to improve anaerobic cell growth and succinic acid production by Escherichia coli. J. Chem. Technol. Biot. 2016, 91, 711–717. [Google Scholar] [CrossRef]
  23. Nguyen-Vo, T.P.; Liang, Y.; Sankaranarayanan, M.; Seol, E.; Chun, A.Y.; Ashok, S.; Chauhan, A.S.; Kim, J.R.; Park, S. Development of 3-hydroxypropionic-acid-tolerant strain of Escherichia coli W and role of minor global regulator yieP. Metab. Eng. 2019, 53, 48–58. [Google Scholar] [CrossRef] [PubMed]
  24. Wu, M.; Li, X.; Guo, S.; Lemma, W.D.; Zhang, W.; Ma, J.; Jia, H.; Wu, H.; Jiang, M.; Ouyang, P. Enhanced succinic acid production under acidic conditions by introduction of glutamate decarboxylase system in E. coli AFP111. Bioprocess Biosyst. Eng. 2017, 40, 549–557. [Google Scholar] [CrossRef] [PubMed]
  25. Yang, J.; Zhang, J.; Zhu, Z.; Jiang, X.; Zheng, T.; Du, G. Revealing novel synergistic defense and acid tolerant performance of Escherichia coli in response to organic acid stimulation. Appl. Microbiol. Biotechnol. 2022, 106, 1–18. [Google Scholar] [CrossRef] [PubMed]
  26. Yang, J.; Peng, Z.; Zhu, Q.; Zhang, J.; Du, G. [NiFe] Hydrogenase Accessory Proteins HypB-HypC Accelerate Proton Conversion to Enhance the Acid Resistance and d-Lactic Acid Production of Escherichia coli. ACS Synth. Biol. 2022, 11, 1521–1530. [Google Scholar] [CrossRef] [PubMed]
  27. Zhu, Z.M.; Yang, J.H.; Yang, P.S.; Wu, Z.M.; Zhang, J.; Du, G.C. Enhanced acid-stress tolerance in Lactococcus lactis NZ9000 by overexpression of ABC transporters. Microb. Cell Factories 2019, 18, 1–14. [Google Scholar] [CrossRef]
  28. Guan, N.Z.; Liu, L.; Shin, H.D.; Chen, R.R.; Zhang, J.; Li, J.H.; Du, G.C.; Shi, Z.P.; Chen, J. Systems-level understanding of how Propionibacterium acidipropionici respond to propionic acid stress at the microenvironment levels: Mechanism and application. J. Biotechnol. 2013, 167, 56–63. [Google Scholar] [CrossRef]
  29. Zhu, Z.; Ji, X.; Wu, Z.; Zhang, J.; Du, G. Improved acid-stress tolerance of Lactococcus lactis NZ9000 and Escherichia coli BL21 by overexpression of the anti-acid component recT. J. Ind. Microbiol. Biotechnol. 2018, 45, 1091–1101. [Google Scholar] [CrossRef]
  30. Nobelmann, B.; Lengeler, J.W. Molecular analysis of the gat genes from Escherichia coli and of their roles in galactitol transport and metabolism. J. Bacteriol. 1996, 178, 6790–6795. [Google Scholar] [CrossRef] [Green Version]
  31. Saier, M.H.; Hvorup, R.N.; Barabote, R.D. Evolution of the bacterial phosphotransferase system: From carriers and enzymes to group translocators. Biochem. Soc. Trans. 2005, 33, 220–224. [Google Scholar] [CrossRef] [PubMed]
  32. Volpon, L.; Young, C.R.; Matte, A.; Gehring, K. NMR structure of the enzyme GatB of the galactitol-specific phosphoenolpyruvate-dependent phosphotransferase system and its interaction with GatA. Protein Sci. 2006, 15, 2435–2441. [Google Scholar] [CrossRef] [PubMed] [Green Version]
  33. Utrilla, J.; Licona-Cassani, C.; Marcellin, E.; Gosset, G.; Nielsen, L.K.; Martinez, A. Engineering and adaptive evolution of Escherichia coli for D-lactate fermentation reveals GatC as a xylose transporter. Metab. Eng. 2012, 14, 469–476. [Google Scholar] [CrossRef] [PubMed]
  34. Cotter, P.D.; Hill, C. Surviving the acid test: Responses of gram-positive bacteria to low pH. Microbiol. Mol. Biol. R. 2003, 67, 429–453. [Google Scholar] [CrossRef] [Green Version]
  35. Baek, S.H.; Kwon, E.Y.; Kim, S.Y.; Hahn, J.S. GSF2 deletion increases lactic acid production by alleviating glucose repression in Saccharomyces cerevisiae. Sci. Rep. 2016, 6, 34812. [Google Scholar] [CrossRef] [Green Version]
  36. Guan, N.Z.; Shin, H.D.; Chen, R.R.; Li, J.H.; Liu, L.; Du, G.C.; Chen, J. Understanding of how Propionibacterium acidipropionici respond to propionic acid stress at the level of proteomics. Sci. Rep. 2014, 4, 6951. [Google Scholar] [CrossRef] [Green Version]
  37. Luedeking, R.; Piret, E.L. A kinetic study of the lactic acid fermentation. Batch process at controlled pH (Reprinted from Journal of Biochemical and Microbiological Technology and Engineering, vol 1, pg 393, 1959). Biotechnol. Bioeng. 2000, 67, 636–644. [Google Scholar] [CrossRef]
  38. Yao, P.; You, S.P.; Qi, W.; Su, R.X.; He, Z.M. Investigation of fermentation conditions of biodiesel by-products for high production of beta-farnesene by an engineered Escherichia coli. Environ. Sci. Pollut. R. 2020, 27, 22758–22769. [Google Scholar] [CrossRef]
  39. Lalwani, M.A.; Ip, S.S.; Carrasco-Lopez, C.; Day, C.; Zhao, E.M.; Kawabe, H.; Avalos, J.L. Optogenetic control of the lac operon for bacterial chemical and protein production. Nat. Chem. Biol. 2021, 17, 71–79. [Google Scholar] [CrossRef]
  40. Lopes, C.; dos Santos, N.V.; Dupont, J.; Pedrolli, D.B.; Valentini, S.R.; Santos-Ebinuma, V.D.; Pereira, J.F.B. Improving the cost effectiveness of enhanced green fluorescent protein production using recombinant Escherichia coli BL21 (DE3): Decreasing the expression inducer concentration. Biotechnol. Appl. Bioc. 2019, 66, 527–536. [Google Scholar] [CrossRef]
  41. Omoya, K.; Kato, Z.; Matsukuma, E.; Li, A.L.; Hashimoto, K.; Yamamoto, Y.; Ohnishi, H.; Kondo, N. Systematic optimization of active protein expression using GFP as a folding reporter. Protein Expr. Purif. 2004, 36, 327–332. [Google Scholar] [CrossRef] [PubMed]
  42. Fernandez-Sandoval, M.T.; Galindez-Mayer, J.; Moss-Acosta, C.L.; Gosset, G.; Martinez, A. Volumetric oxygen transfer coefficient as a means of improving volumetric ethanol productivity and a criterion for scaling up ethanol production with Escherichia coli. J. Chem. Technol. Biot. 2017, 92, 981–989. [Google Scholar] [CrossRef]
Figure 1. Construction and performance of recombinant strain E. coli (Vector) and E. coli (GatA). (A) The recombinant plasmid pTrc99a/GatA was constructed by inserting the galactitol transport factor gatA into plasmid pTrc99a. (B) Growth curve of recombinant strains in normal growth condition without acid stress. (C) Cell viability of recombinant strains under conditions of D-LA lethal stress.
Fermentation 08 00665 g001
Figure 2. Overexpression of galactitol transport factor GatA enhances cell survival under D-LA lethal stress (pH 4.0) through ATP supply. (A) GatA is involved in the galactitol PTS pathway, the overexpression of GatA enhances cell survival number under D-LA lethal stress. (B) Overexpression of GatA enhances intracellular ATP of the strain against D-LA lethal stress. (C) Overexpression of GatA maintains intracellular pH homeostasis in strains that were incubated under lethal stress conditions of D-LA. *, p < 0.05.
Fermentation 08 00665 g002
Figure 3. Effect of three different fermentation patterns on the synthesis of D-LA utilizing glucose by strain LBBE317. (A) Two-stage fermentation I (TPF1, growth stage with oxygen supply and high-speed agitation, switching to restricted oxygen supply and low low-speed stirring at transition to acid production stage). (B) Two-stage fermentation II (TPF2, same growth stage as TPFI, transition to microaerobic state with little aeration and low speed agitation). (C) Single-stage fermentation (SPF, low-speed stirring for full process oxygen limitation incubation).
Fermentation 08 00665 g003
Figure 4. Effect of IPTG addition on D-LA synthesis during growth to different growth stages. (A) Addition of IPTG at LLP (late lag phase) had a shorter fermentation cycle but lower D-LA synthesis. (B) Addition of IPTG at PEP (pre-exponential) had the maximal amount of D-LA synthesis. (C) Addition of IPTG at MPEP (mid pre-exponential period) had D-LA synthesis close to that at PEP period, but with slightly longer fermentation cycle.
Fermentation 08 00665 g004
Figure 5. DCW, viable cell counts, glucose, and product concentrations during fermentation process under pH 5.5 in 5 L bioreactor. (A) E. coli LBBE31P. (B) E. coli LBBE317PGA.
Fermentation 08 00665 g005
Figure 6. Cell viability of recombinant strains under different organic acid lethal stress conditions with incubation time. (A) Recombinant strains incubated under itaconic acid lethal stress. (B) Recombinant strain incubated in succinic acid lethal stress.
Fermentation 08 00665 g006
Publisher’s Note: MDPI stays neutral with regard to jurisdictional claims in published maps and institutional affiliations.

