Article

The Adsorption of 2,4-Dichlorobenzoic Acid on Carbon Nanofibers Produced by Catalytic Pyrolysis of Trichloroethylene and Acetonitrile

1
Boreskov Institute of Catalysis SB RAS, Lavrentieva Av. 5, 630090 Novosibirsk, Russia
2
Department of Natural Sciences, Novosibirsk State University, Pirogova Str. 2, 630090 Novosibirsk, Russia
3
Nikolaev Institute of Inorganic Chemistry SB RAS, Lavrentieva Av. 3, 630090 Novosibirsk, Russia
*
Authors to whom correspondence should be addressed.
Submission received: 14 July 2023 / Revised: 25 September 2023 / Accepted: 7 October 2023 / Published: 11 October 2023
(This article belongs to the Special Issue Adsorption on Carbon-Based Materials)

Abstract

:
In this study, carbon nanofibers were synthesized by the catalytic pyrolysis of trichloroethylene (CNF-Cl) and its mixture with acetonitrile (CNF-Cl-N). The addition of acetonitrile resulted in the incorporation of nitrogen in the CNF (0.33 at%), the removal of chlorine, an increase in oxygen-containing functional groups on the surface (from 1.6 to 3.6 at%), and an increase in the volume of mesopores (from 0.35 to 0.41 cm3·g−1) and macropores (from 0.115 to 0.393 cm3·g−1). The study of 2,4-DCBA adsorption on both CNFs revealed that the adsorption capacity showed dependence with a maximum on the 2,4-DCBA concentration in the solution, which was attributed to the electrostatic interactions of adsorbate with adsorbent at various pHs. The adsorption forces were effective over distances greater than the size of the 2,4-DCBA molecule, indicating volume pore filling. The maximum adsorption capacity occurred at 0.7–1.2 mM and a pH of 3.4 ± 0.1. CNF-Cl-N exhibited lower 2,4-DCBA adsorption than CNF-Cl-N due to its lower specific surface area, lower micropore volume, and higher concentration of oxygen-containing groups on the surface. However, these differences were not significant, suggesting that CNFs produced from both chlorine-containing wastes and their mixtures with nitrogen-containing compounds can be effectively used for water treatment to remove 2,4-DCBA.

1. Introduction

Chlorinated organic compounds (COCs) have a variety of uses in industry and agriculture, including as pesticides, solvents, refrigerants, plasticizers, and pharmaceuticals. However, these kinds of compounds pose a significant risk to human health and the environment due to their high toxicity, mutagenicity, and carcinogenicity [1]. At the moment, the disposal of COCs after use is a pressing issue. Approaches are preferred that provide the conversion of COCs to new products according to the resource-saving principle of “Green Chemistry”. One promising approach is catalytic pyrolysis of COCs, which results in the formation of carbon nanofibers (CNF). This method allows for the production of valuable carbon material from a mixture of chlorine-containing wastes [2]. Compared to traditional methods of organochlorine waste utilization (such as incineration or burial), catalytic pyrolysis has minimal environmental impact. The advantages of this approach also include a simple methodology that does not require expensive equipment, no dioxin and chlorine emissions, and obtaining a product that can recover the cost of disposal. These carbon nanomaterials are in high demand as adsorbents [3,4] and catalyst supports [5,6]. Several studies [3,7] have shown that CNF can effectively remove COCs from aqueous environments, where they or their degradation products accumulate due to their high stability, low solubility, and slow degradation [8,9,10]. Consequently, there is a high demand for research to improve purification technologies for removing these dangerous chemicals from liquid waste and wastewater.
However, the study of the catalytic decomposition of individual substrates is also an important task. Working with model substrates helps to understand the mechanism of CNF formation and find optimal conditions for the process. Beyond that, COCs often contain impurities from other compounds with different heteroatoms. Therefore, it is important to study how these impurities affect the adsorption properties of CNF formed during the catalytic pyrolysis of COCs. Previous research has demonstrated that CNFs obtained from the catalytic decomposition of 1,2-dichloroethane (DCE) and trichloroethylene (TCE), including in combination with acetonitrile (AN), exhibit high efficiency in adsorbing 1,2-dichlorobenzene (1,2-DCB) from aqueous solutions [11,12,13]. In this study, we focus on the removal of 2,4-dichlorobenzoic acid (2,4-DCBA) from water. This compound is a commodity chemical that finds use as an intermediate in the manufacture of dyes, fungicides, acaricides, insecticides, pharmaceuticals, and other organic chemicals. Its presence in natural environments is mainly due to its formation as one of the degradation products of polychlorinated bifenils [14,15], the organophosphorus compound chlorfenvinphos, an insecticide and acaricide [16], and the fungicide propiconazole [17]. It is a toxic compound with an LD50 value of 830 mg kg−1 in the median lethal dose test [18], which is lower than that of 1516 mg kg−1 of 1,2-DCB [19].
In addition, a significant proportion of emerging contaminants are ionizable, which highlights the importance of investigating the adsorption behavior of weakly acidic compounds such as benzoic acid and its functional derivatives [20,21]. The article [22] also observed that the adsorption of ionizable compounds such as 4-methylbenzoic acid, 2,4,6-thichlorophenol, 4-methylaniline, and quinoline is highly dependent on the pH of the system. This is due to the fact that the degree of ionization of the compound and the charge of the adsorbent surface change with pH, which affects their affinity. This becomes especially important for the efficient removal of highly toxic pollutants such as 2,4-DCBA from water environments, whose pH can vary depending on their composition. Therefore, considering the pH of the solution, it is possible to predict the degree of purification and determine the optimal amount of sorbent required to achieve it. However, a literature analysis has revealed a lack of specific studies investigating the adsorption behavior of 2,4-DCBA depending on pH.
This paper proposes a comprehensive method for the disposal of chlorinated organic multi-component wastes. At the first stage, TCE and TCE with AN selected as model aliphatic polychlorinated hydrocarbons were converted into a CNF material on a Ni catalyst. Then, the produced CNF samples were tested for their efficiency in adsorbing 2,4-DCBA from aqueous solutions under static conditions (model conditions). A systematic study was carried out to examine the impact of pH on the adsorption process and to determine the optimal conditions for achieving maximum adsorption efficiency.

2. Materials and Methods

The following commercial reagents were used as received: trichloroethylene, C2HCl3—chemically pure (>99.5 wt%, CAS 79-01-6, Component-Reactiv, Moscow, Russia); acetonitrile, CH3CN—chemically pure (99.7 wt%, CAS 75-05-8, Component-Reactiv, Moscow, Russia); 2,4-dichlorobenzoic acid, C7H4Cl2O2—pure (99 wt%, TU 6-09-13-660-78, Reakhim, Moscow, Russia); sodium hydroxide, NaOH—pure (99 wt%, GOST 4328-77, Reakhim, Moscow, Russia); hydrochloric acid, HCl—0.1 N (TU 2642-001-33813273-97, Baza No.1 Khimreactivov, Staraya Kupavna, Russia); sodium chloride, NaCl—0.1 N (TU 2642-002-62931140-2014, Lenreactiv, St. Petersburg, Russia). Microdispersed Ni-catalyst was synthesized as described elsewhere [23].

2.1. Synthesis of Functionalized CNFs

The synthesis of carbon nanofibers was performed in a flow-through horizontal quartz reactor. The composition of the reaction medium was varied. First, microdispersed Ni catalyst was loaded onto the quartz plate, after which it was placed in the reactor. The catalyst was heated to 600 °C in an argon flow, after which it was reduced in an atmosphere of H2. Then the reaction mixture was fed, which consisted in one case of C2HCl3/Ar/H2 and in the other of C2HCl3+CH3CN/Ar/H2. The duration of the experiments was 2 h. At the end of the test, the reactor was cooled in argon, and the obtained carbon material was removed and weighed. The product obtained by pyrolysis of C2HCl3/Ar/H2 was designated as “CNF-Cl” and the decomposition of C2HCl3+CH3CN/Ar/H2 as “CNF-Cl-N”.
To further study the adsorption properties of carbon nanofibers, the samples were treated with hydrochloric acid (12%). For this purpose, the samples were mixed with 300 mL of HCl and left for a day to dissolve the metal particles. After filtration, the samples were washed with distilled water to a neutral pH and dried at 100 °C.

2.2. Equilibrium Adsorption Study of 2,4-DCBA from Aqueous Solution

2.2.1. Adsorption Experiments

Adsorption studies were performed in model conditions. Adsorption experiments were carried out by placing 3 mg of carbon sample into a 60 mL solution of 2,4-DCBA at different concentrations (0.15–2.5 mM). They were prepared from a saturated solution of 2,4-DCBA by serial dilution. The concentration of saturated solution was determined before each experiment by titration with NaOH solution using the automatic titrator Akvilon ATP-02 (JSC Akvilon, Podolsk, Russia). pH was adjusted to 2, 3, 4, 5, and 9 using 0.1 mol/L HCl and NaOH solutions by titration. The mixtures were shaken for 24 h using a shaker LOIP LS-110 (RNPO RusPribor, Saint-Petersburg, Russia) at a speed of 200 rpm and a temperature of 25 ± 1 °C to ensure complete adsorption. Experiments were carried out in triplicate, and the differences between the experimental values were within ±3%. The concentration of 2,4-DCBA was analyzed with a Varian Cary 100 instrument (Agilent, Santa Clara, CA, USA) at a wavelength of 200 nm to 350 nm. To convert absorbance data to concentration, calibration curves were constructed for each pH value. The absorption band at 272 nm was used for calibration, and in the case of pH 2, the band at 281 nm was used.
The adsorption capacity was calculated as follows:
A = Δ C · V m ,
where A is the adsorption capacity, mmol·g−1; ΔC is the difference in 2,4-DCBA concentration before and after adsorption, mmol·L−1; V is the 2,4-DCBA solution volume, L; m is the loading of the adsorbent, g.
The pore filling (F) was determined as a ratio of the volume of 1,2-DCB in adsorbent pores to the total pore volume:
F = A · M r ρ · V Σ p o r e · 100 % ,
where A is the adsorption capacity, which was achieved by the adsorption of 2,4-DCBA from an aqueous solution, mmol·g−1; Mr is the molar mass of 2,4-DCBA (191 g·mol−1); ρ is the density of 2,4-DCBA (1.517 g·cm−3); VΣpore is the total pore volume of the adsorbent, cm3·g−1.

2.2.2. Adsorption Isotherm Modeling

The adsorption data was analyzed using Langmuir, Freundlich, and Dubinin–Astakhov isotherm models [24]. Nonlinear regression of the data was performed, with the dependent variable weighted to determine all model parameters. The suitability of the models was assessed by comparing their correlation coefficients, represented as R2 values.

Langmuir Isotherm

The Langmuir isotherm is a commonly used model for analyzing pollutant adsorption processes. It is applicable in cases where monolayer adsorption occurs on a surface with a limited number of identical sites that have uniform adsorption energies and where there is no transmigration of the adsorbate in the plane of the surface. The Langmuir isotherm is given by:
A = K L · A max · C e q 1 + K L · C e q ,
where A —amount of 2,4-DCBA adsorbed per gram, mol·g−1; A max —maximum adsorption capacity, mol·g−1; C e q —equilibrium 2,4-DCBA concentration, mol·L−1; K L —Langmuir constant, L·mol−1.

Freundlich Isotherm

The empirical Freundlich isotherm is used to describe non-ideal adsorption on heterogeneous surfaces as well as multi-layer sorption with interaction between molecules and is expressed by the following equation:
A = K F · C e q 1 / n ,
where A —amount of 2,4-DCBA adsorbed per gram, mol·g−1; K F —Freundlich constant, mol·g−1; C e q —equilibrium 2,4-DCBA concentration, mol·L−1; 1/n—measure of adsorption intensity or surface heterogeneity. The closer the value of 1/n is to zero, the more heterogeneous the surface.

Dubinin-Astakhov Isotherm

The Dubinin theory, which considers volume filling mechanism for vapor adsorption [25,26], has been shown to be applicable in studying the adsorption of organic compounds from their solutions [27]. The Dubinin–Astakhov equation is presented as follows:
A = A max exp [ [ R T · ln ( C max C e q ) E a d s e f f ] n ] ,
where A m a x is the maximum adsorption capacity, mol·g−1; C m a x is the highest concentration of 2,4-DCBA in water, mol·L−1; C e q is the equilibrium 2,4-DCBA concentration, mol·L−1; E a d s e f f is the characteristic energy of 2,4-DCBA adsorption, kJ·mol−1.
The maximum amount of 2,4-DCBA (Vmax) adsorbed per gram (or maximum adsorption capacity) was defined by the Dubinin–Astakhov isotherm model:
V max = A max · M r ρ ,
where Mr is the molar mass of 2,4-DCBA (191 g·mol−1); ρ is the density of 2,4-DCBA (1.517 g·cm−3).

2.3. Characterization of the Samples

The structure and morphology of the carbon nanomaterials were studied by scanning electron microscopy (SEM) on a JSM-6460 instrument (JEOL, Tokyo, Japan) at magnification factors ranging from 8 to 300,000.
The transmission electron microscopy (TEM) studies were conducted using a Hitachi HT7700 TEM (Hitachi, Tokyo, Japan) with an acceleration voltage of 100 kV and a W source. The TEM was also equipped with a STEM system and a Bruker Nano XFlash 6T/60 energy dispersive X-ray (EDX) spectrometer (Bruker Nano GmbH, Berlin, Germany).
The X-ray powder diffraction (XRD) analysis of the samples has been performed on a Shimadzu XRD-7000 diffractometer (CuKα radiation, graphite monochromator). The patterns were recorded in the step mode in the angular range 2θ = 20–100°, step 0.05°.
The specific surface area (SSA) and pore volume (VΣpore) were determined using the low-temperature nitrogen adsorption/desorption method. The samples were degassed at 150 °C for 16 h under an oil-free vacuum. The adsorption isotherms were measured at 77 K using an ASAP-2400 automated instrument (Micromeritics, Norcross, GA, USA). Free volume in the cells was measured by means of He displacement before the isotherm acquisition. The samples were additionally degassed at room temperature under an oil-free vacuum in situ at the measuring port between the free volume and the isotherm measurements. The steep increase in a low-pressure region indicates the presence of micropores, whose amount was calculated by means of the t-method using reference nitrogen adsorption for carbonaceous materials [28]. Taking in mind the possible presence of micropores, we applied the MA-BET technique [29] instead of traditional BET [30] to calculate the specific surface area of the materials.
The X-ray photoelectron spectroscopy (XPS) spectra were acquired using a SPECS photoelectron spectrometer (SPECS Surface Nano Analysis GmbH, Berlin, Germany), which employed a PHOIBOS-150-MCD-9 hemispheric analyzer and a FOCUS-500 monochromator (Al Kα, hν = 1486.74 eV, 150 W). The spectrometer’s binding energy (BE) scale was pre-calibrated using the Au 4f7/2 (84.0 eV) and Cu 2p3/2 (932.6 eV) core level peaks. The binding energies were determined with an accuracy of ±0.1 eV. The samples were applied to conducting Scotch tape and studied without pretreatment. By analyzing the individual spectra of the elements, their electronic structures were determined, and the atomic concentration ratios of elements on the sample surface were calculated, taking into account the element sensitivity coefficients [31].
The pH point of zero charge (pHPZC) of the carbon materials was determined as follows: 50 mg of the sample was mixed with 10 mL of a 0.01 M NaCl electrolyte solution at different initial pH values (ranging from 2 to 12), which were adjusted using 0.1 M NaOH and 0.1 M HCl solutions. The mixtures were then bubbled with argon and shaken for 24 h at room temperature. After filtration, the pH of the filtrates was measured. To determine the pHPZC, a plot of ΔpH versus pH0 was created, where pH0 is the initial pH and ΔpH is the pH change after 24 h. The pHPZC was determined as the point of intersection of the curve with the y = 0 axis. The results obtained are shown in Figure 1. The pHPZC was found to be 5.9 for CNF-Cl and 5.2 for CNF-Cl-N.

3. Results and Discussion

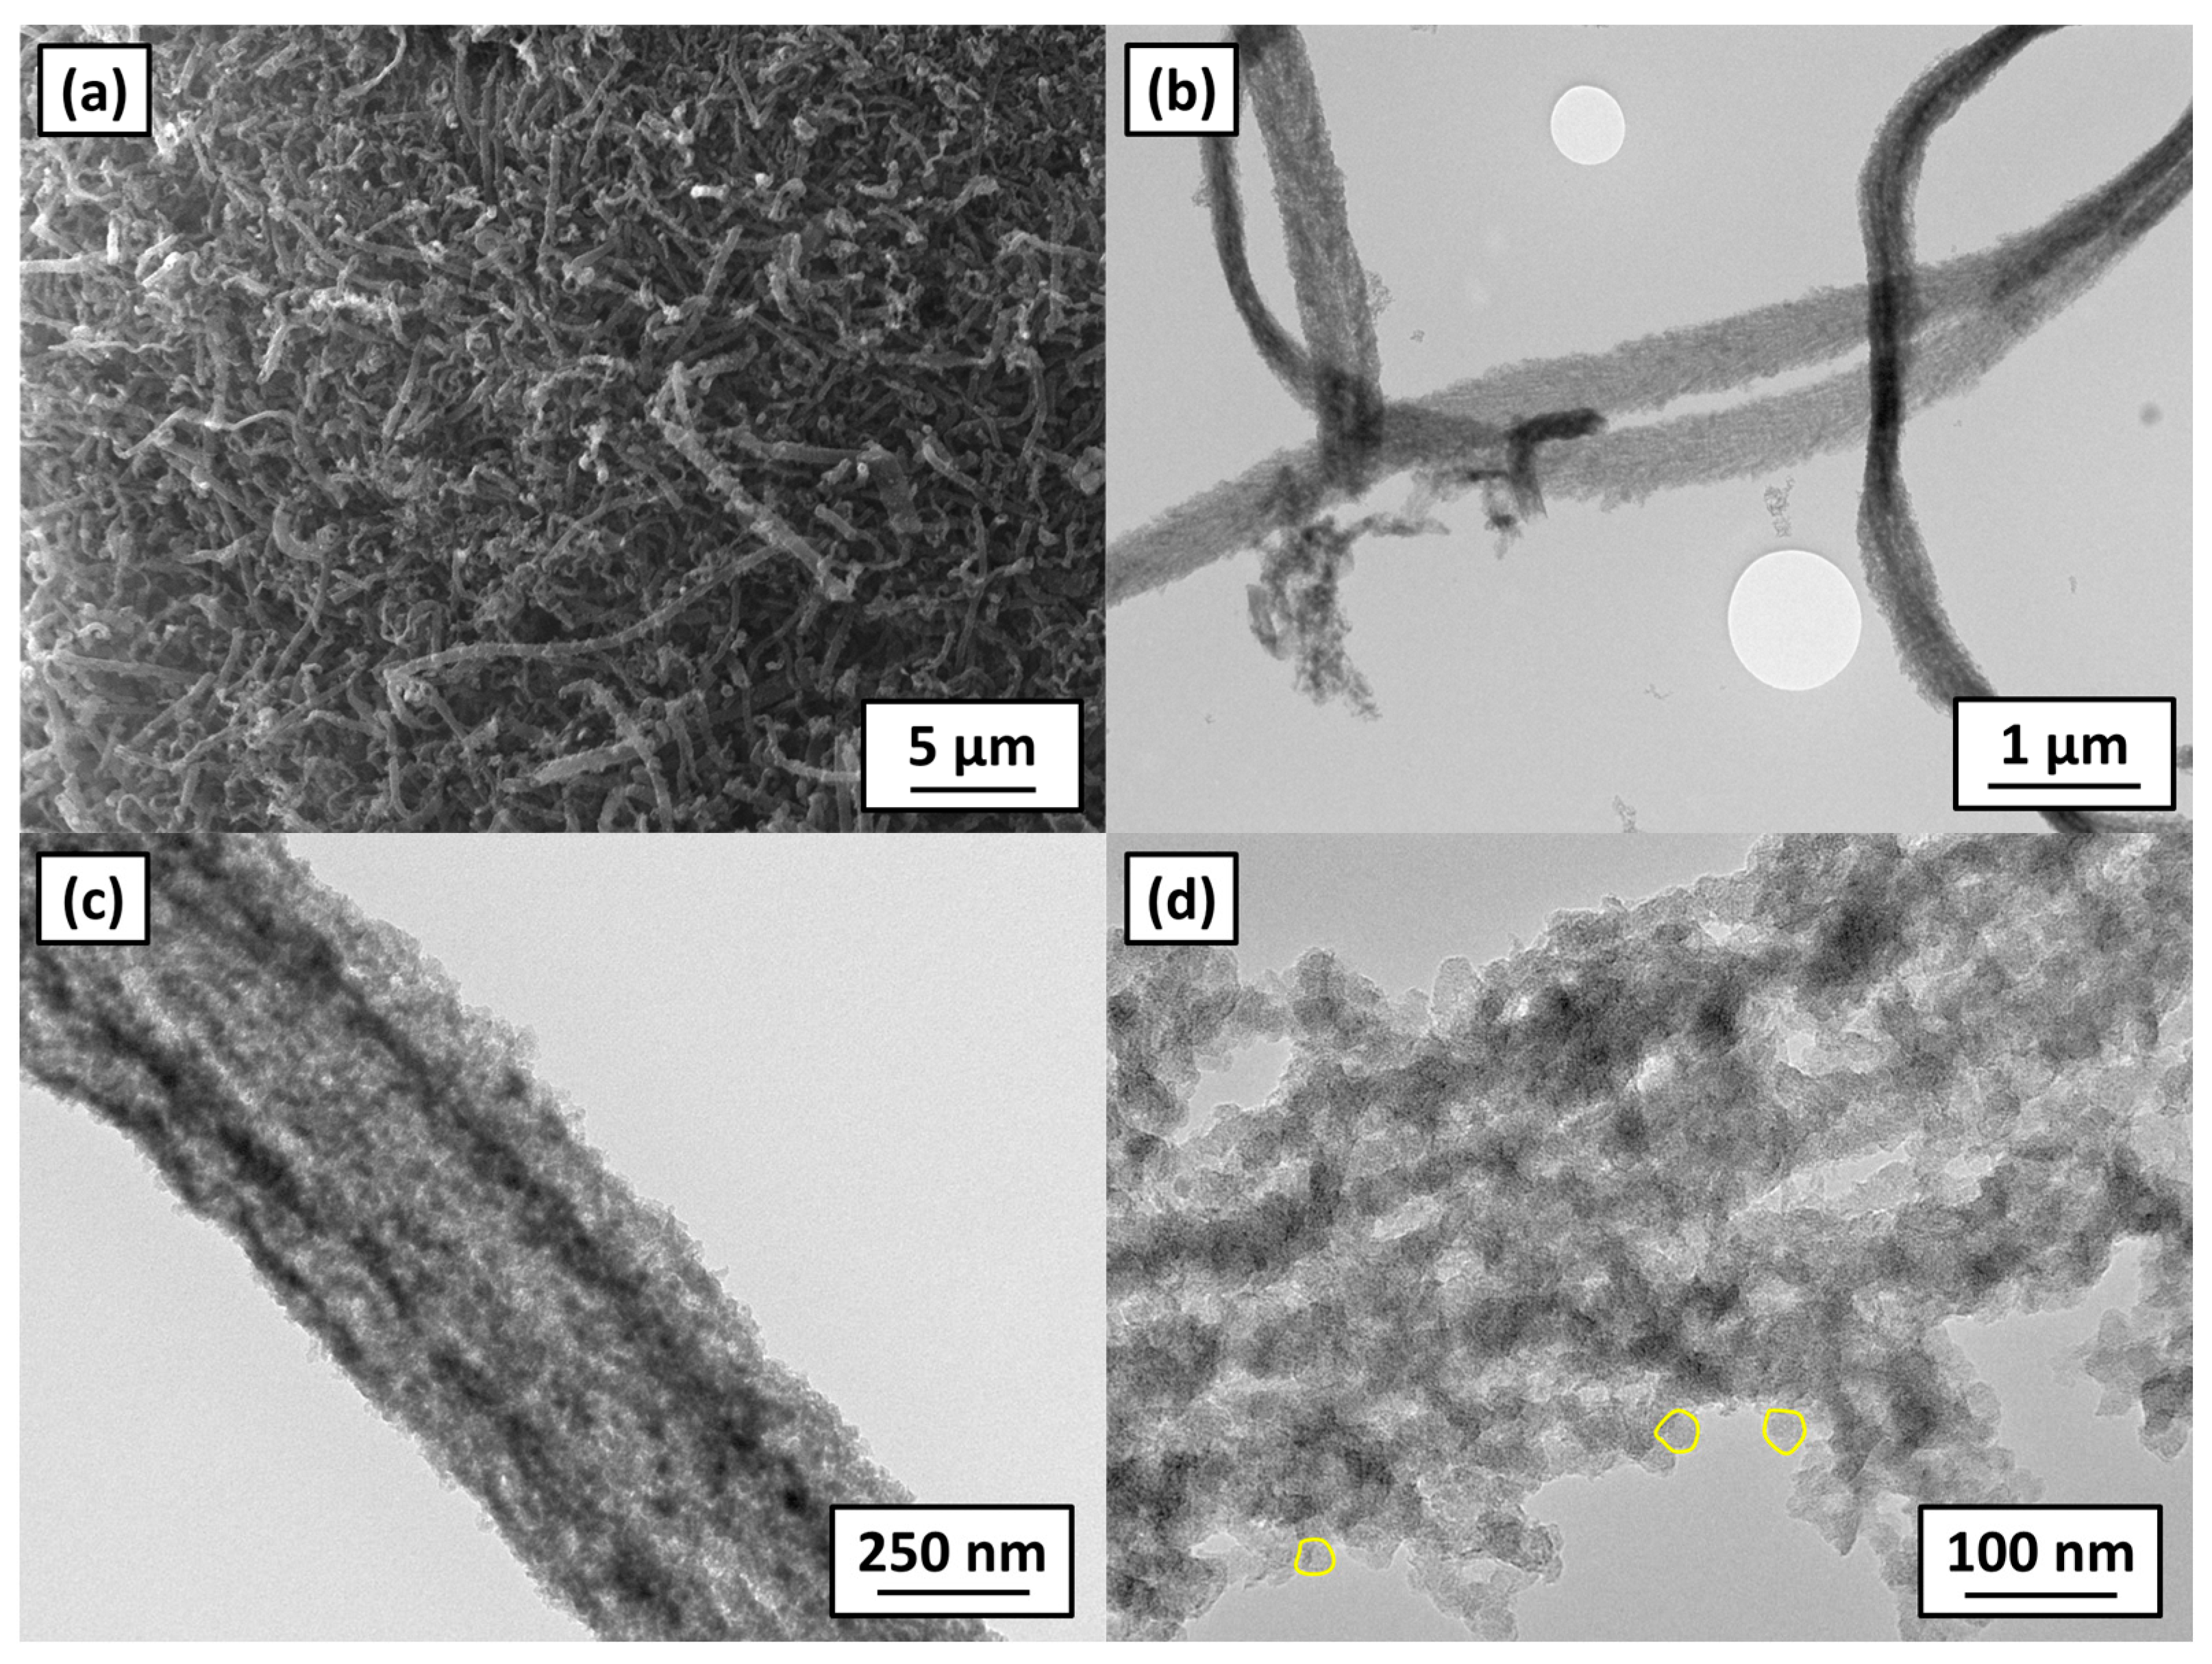
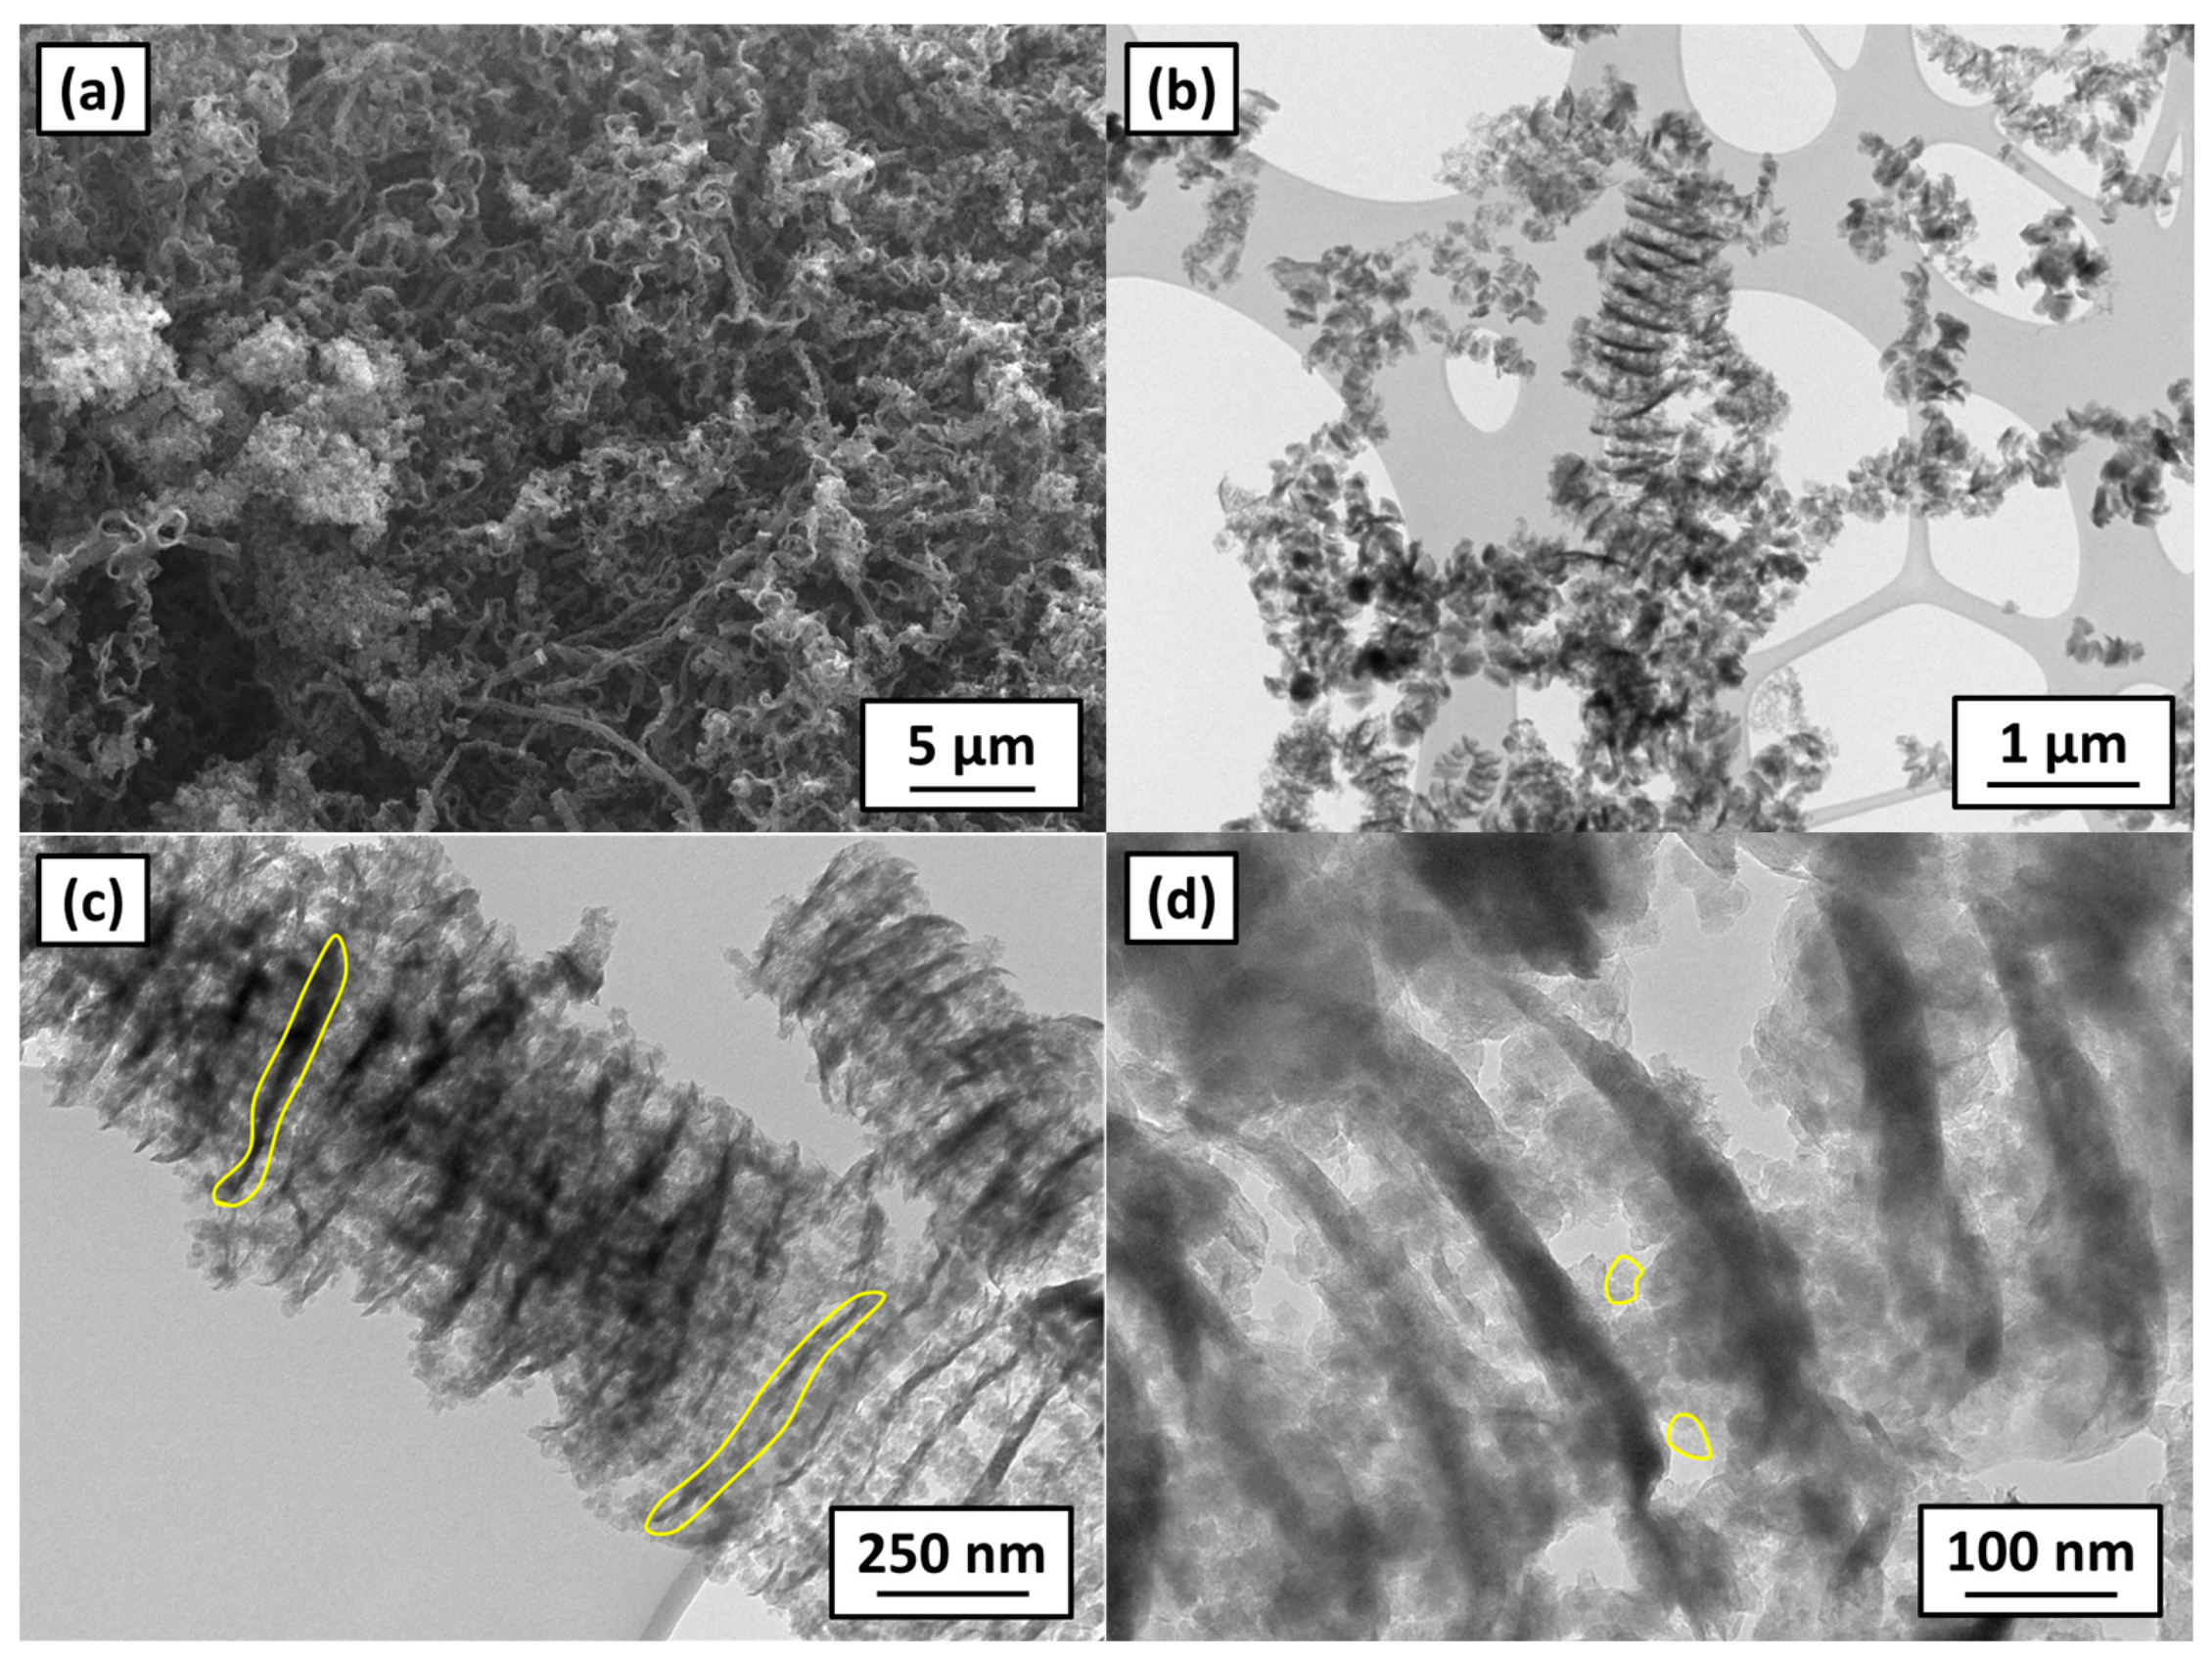
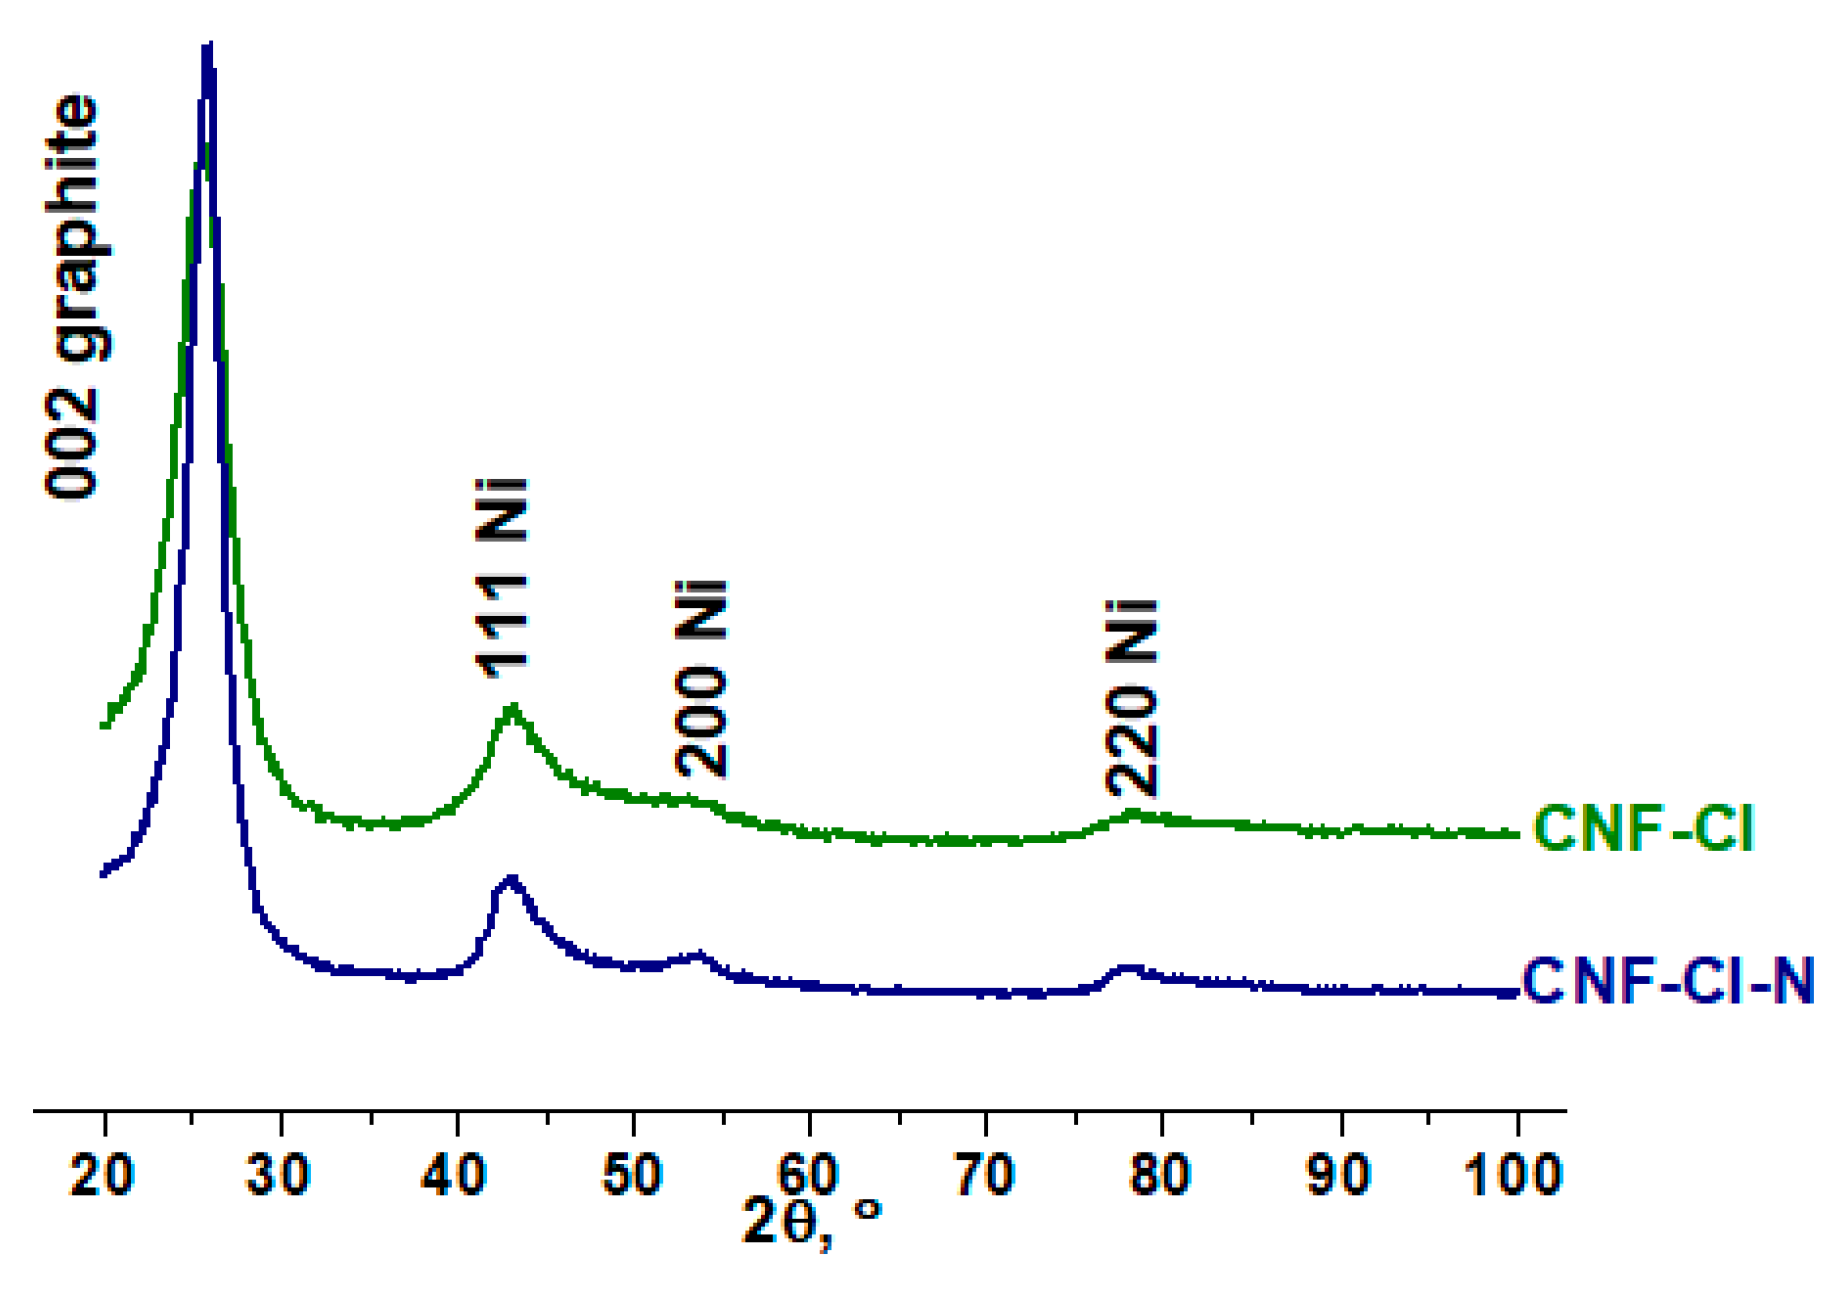
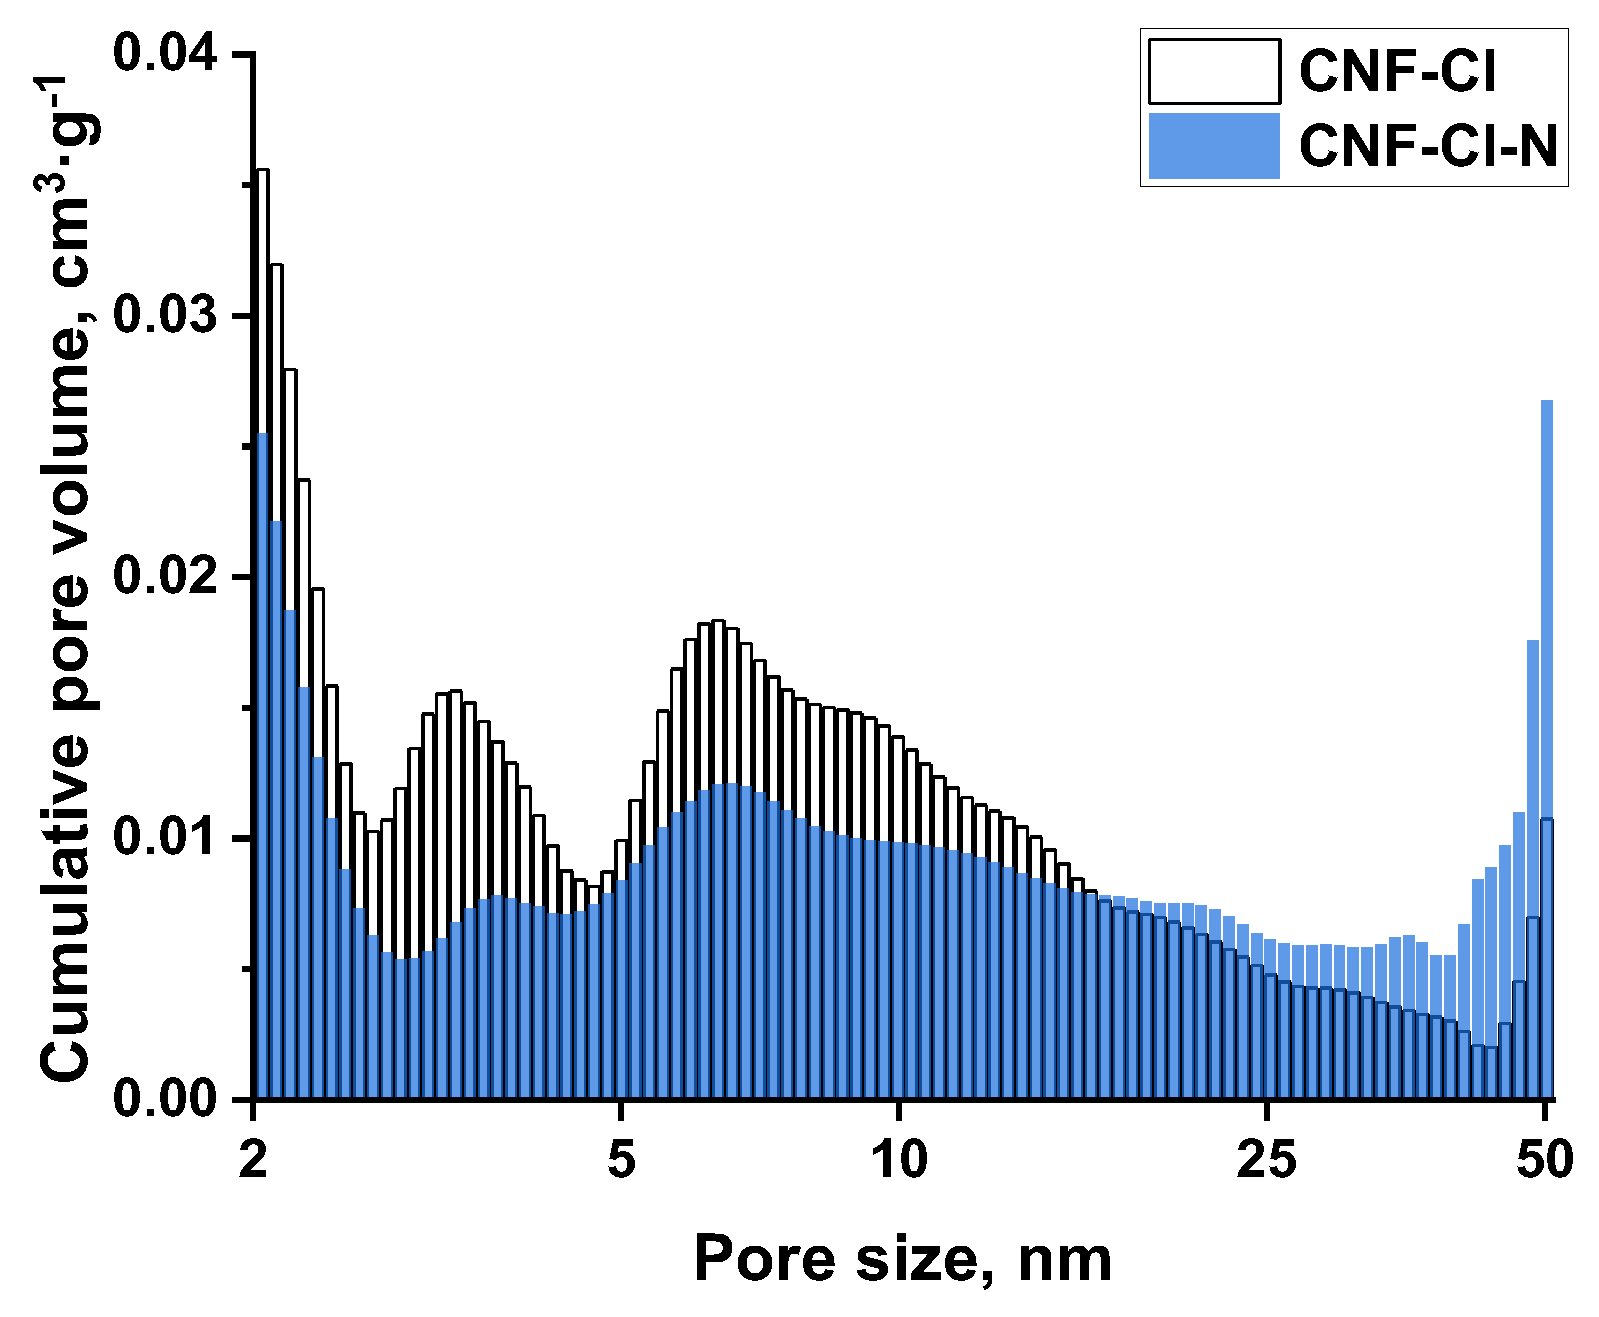
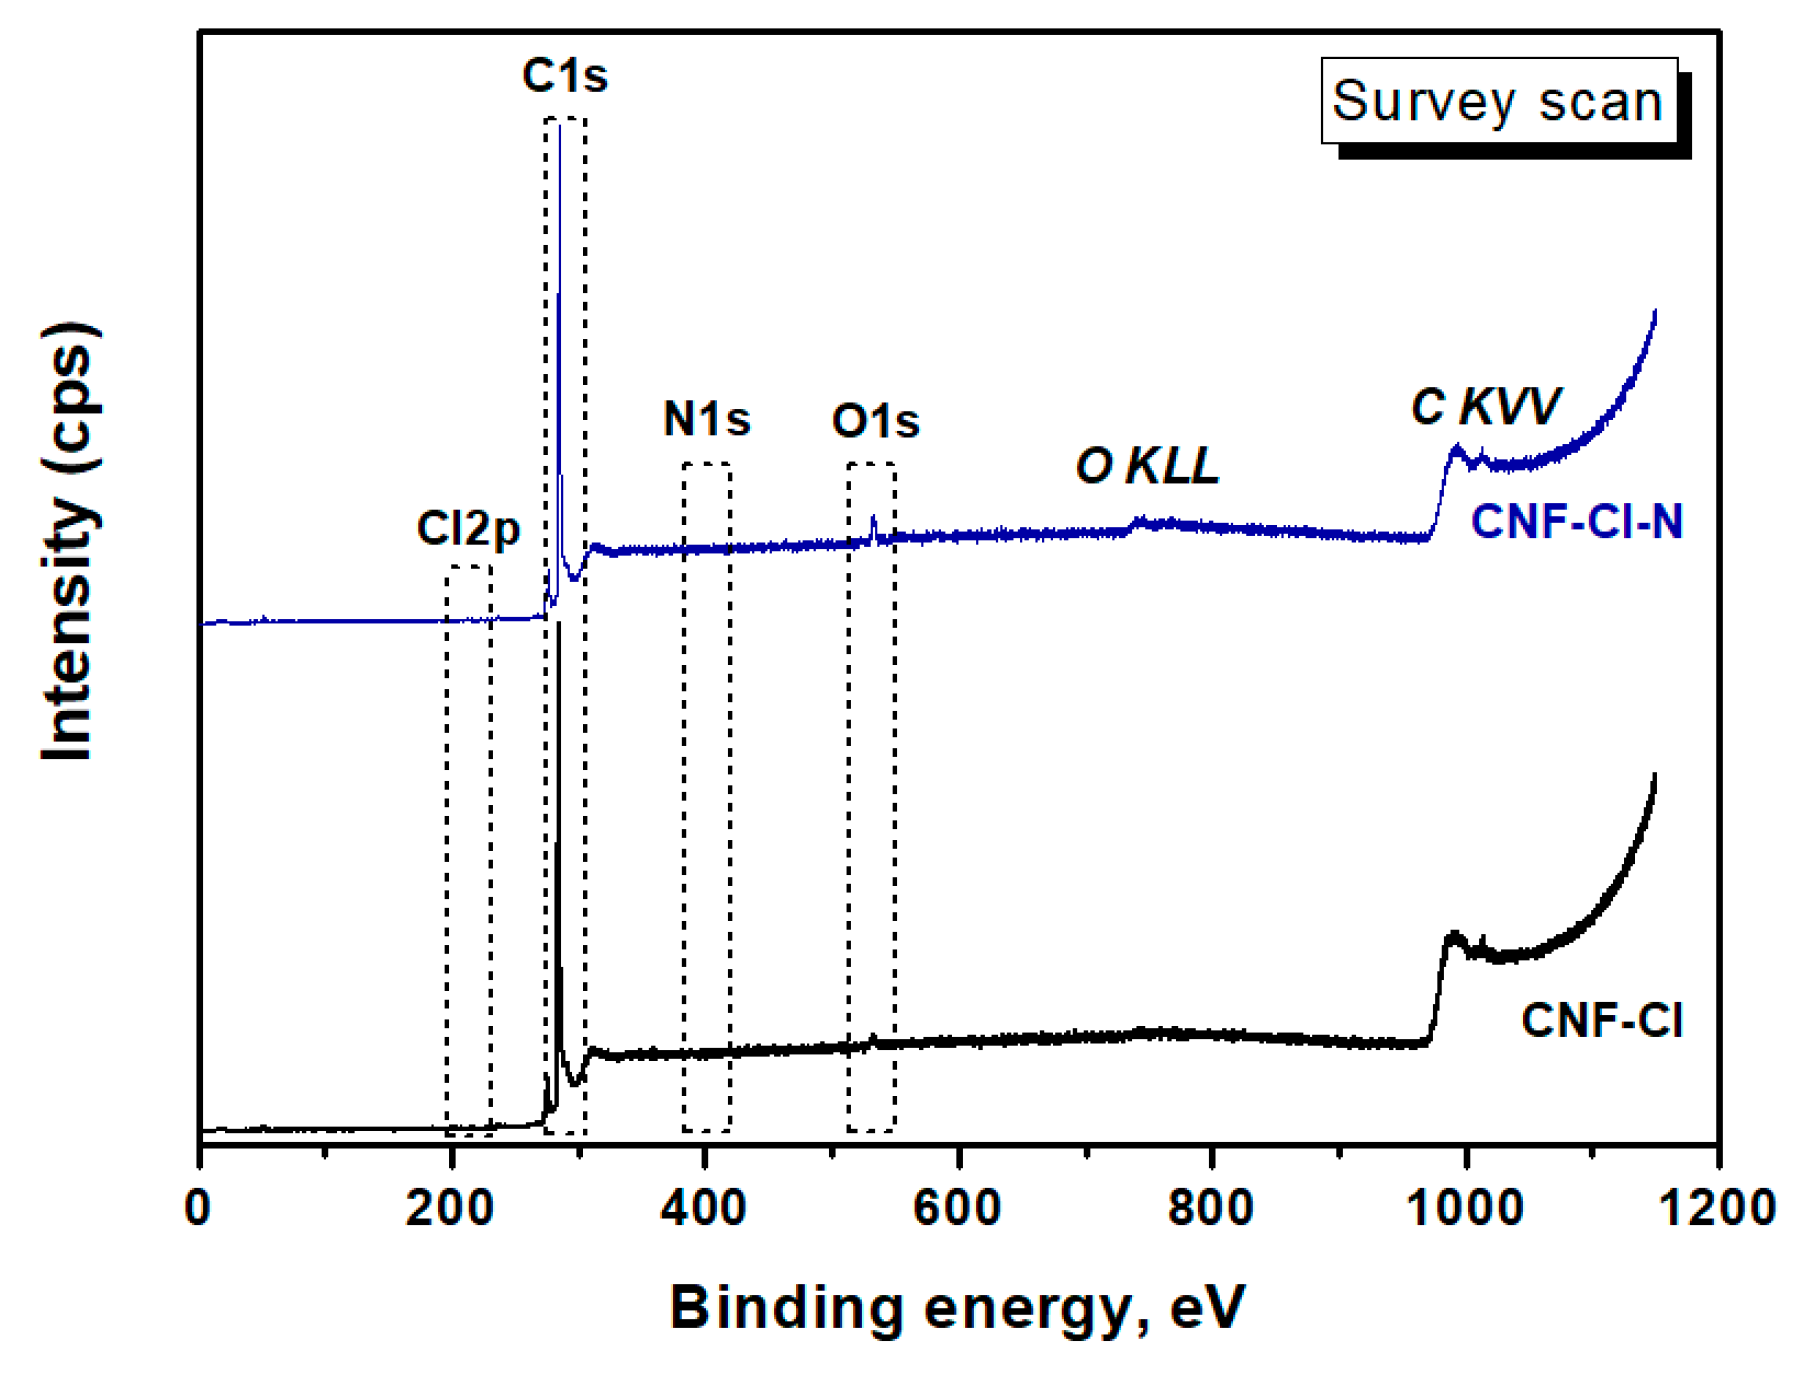
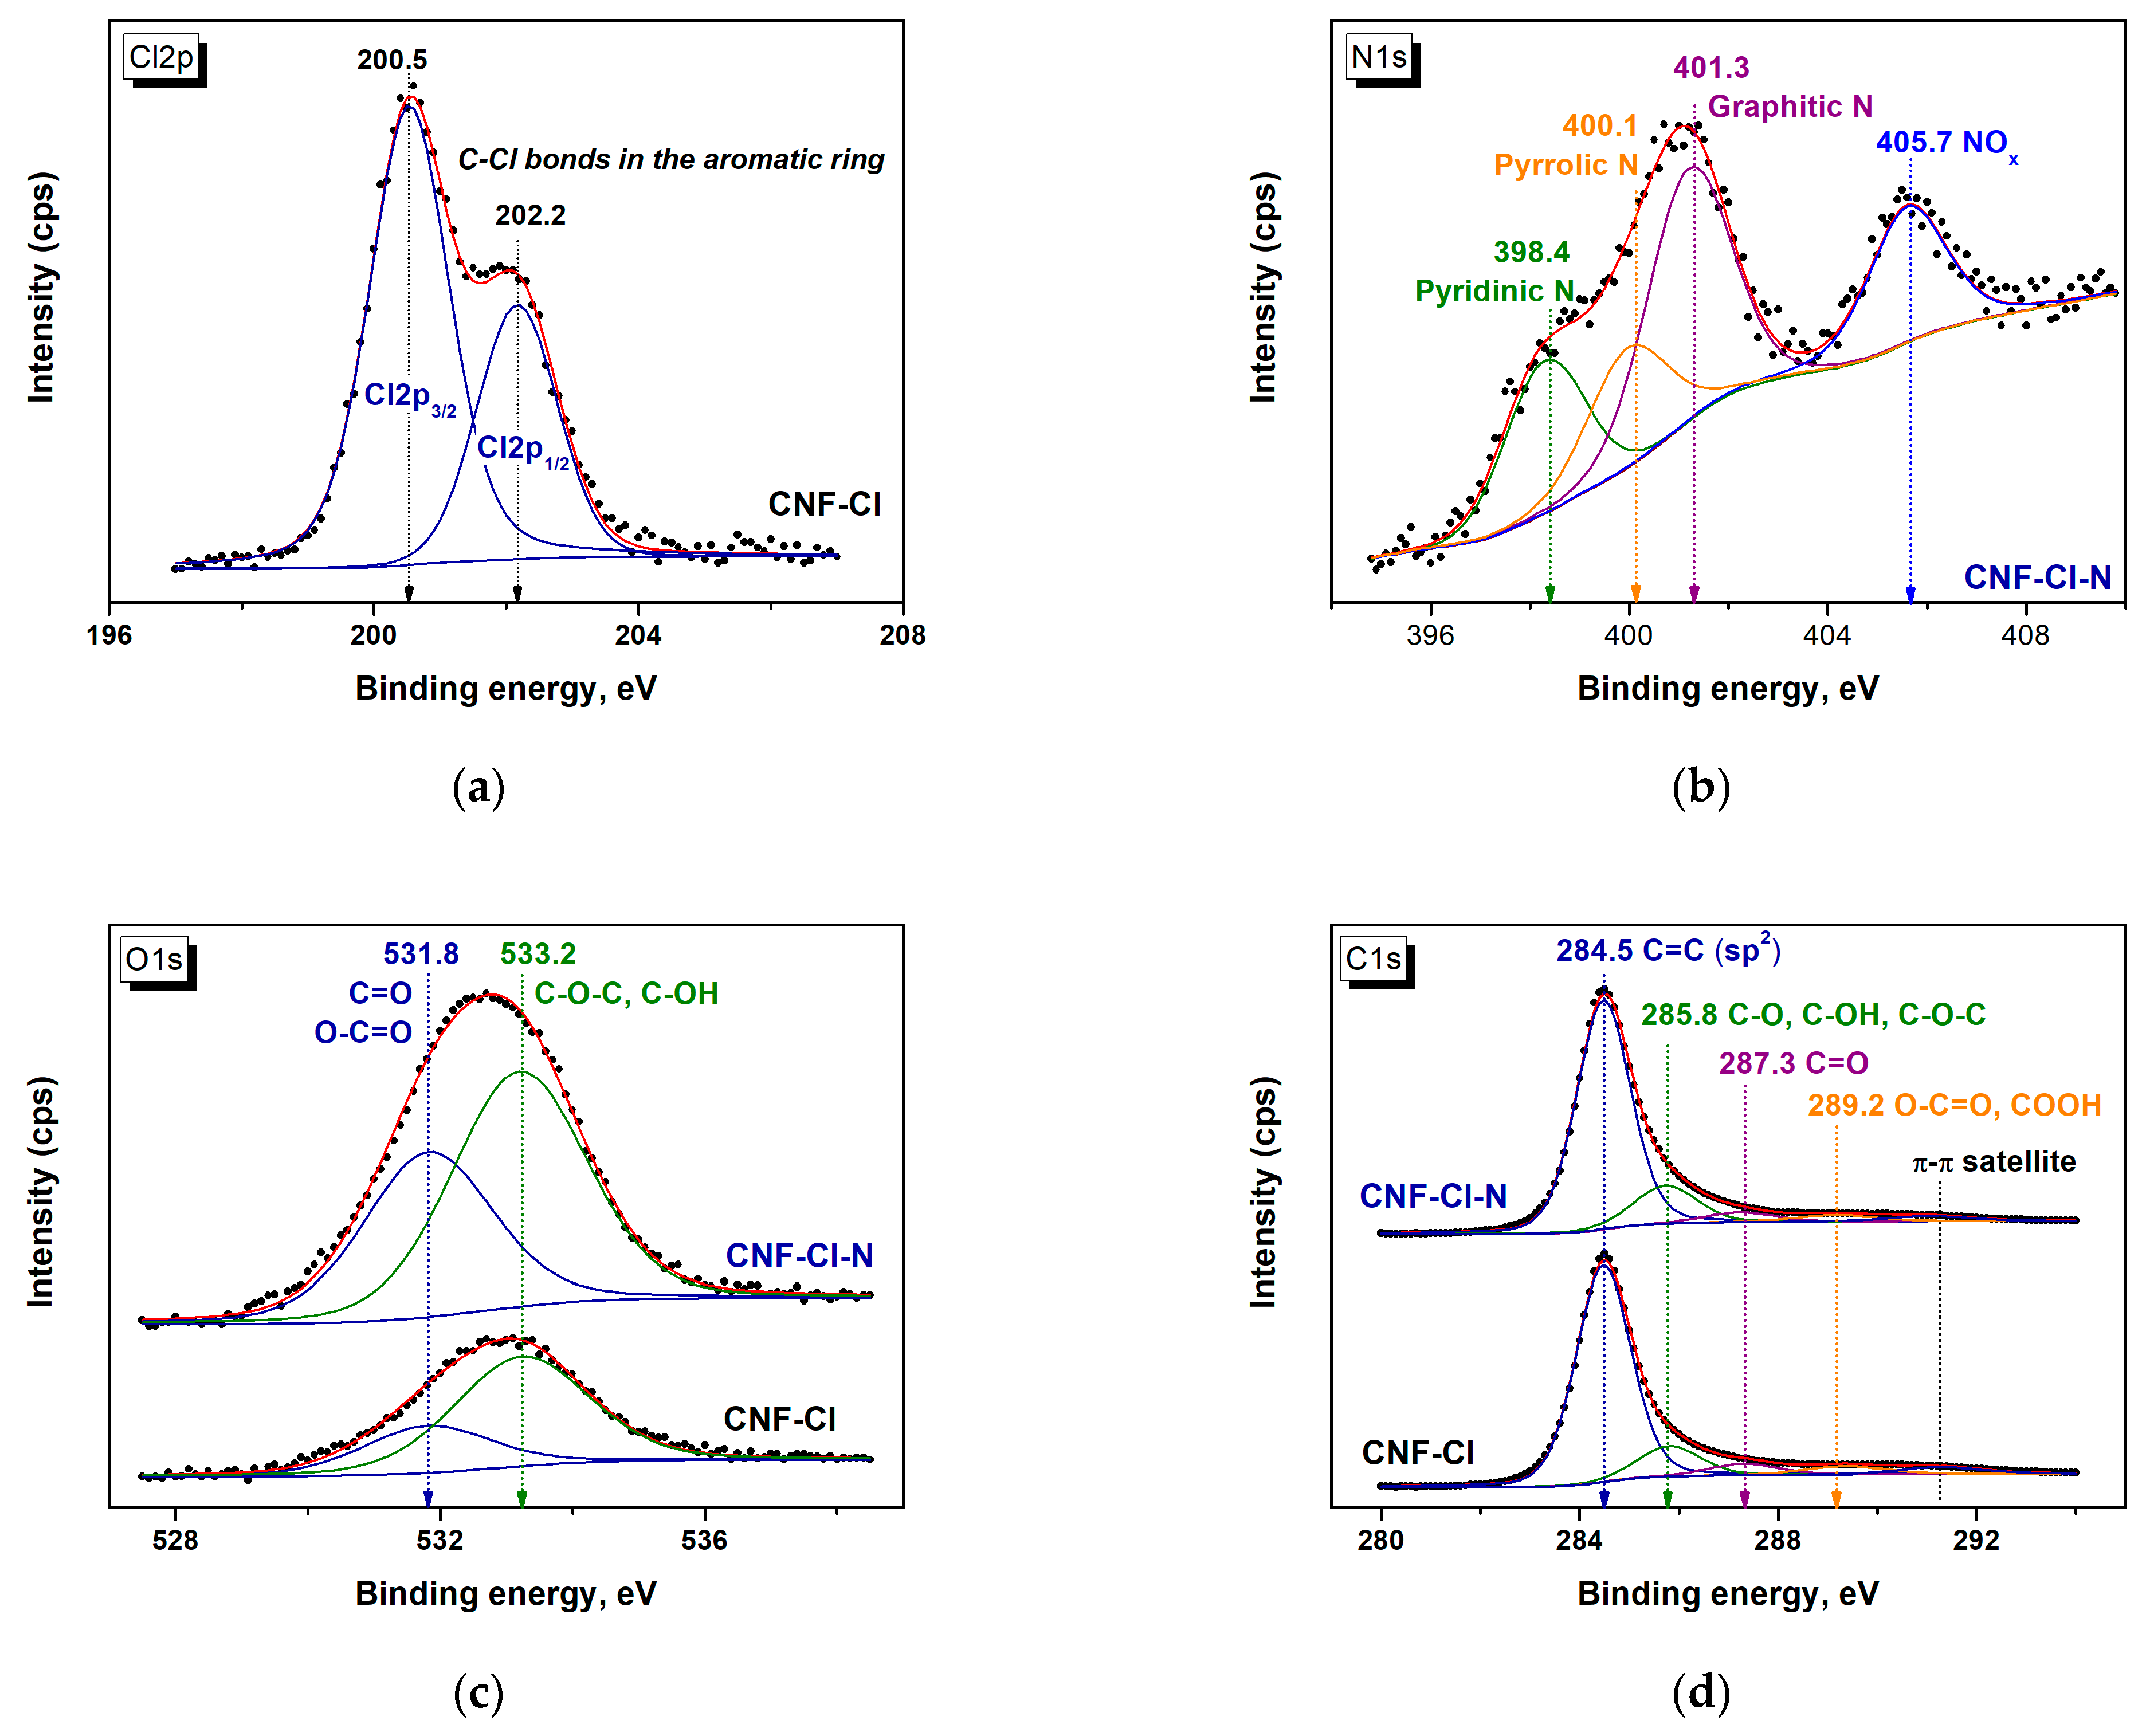
3.1. Synthesis and Characterization of CNF Samples

The CTF samples were synthesized by pyrolysis of TCE and TCE with AN. The morphology and structure of the synthesized carbon nanomaterial were studied by scanning and transmission electron microscopy. The data revealed that the material, synthesized by decomposing TCE, had a long tape-like filamentous structure (Figure 2a,b), with diameters ranging from 200 to 500 nm, which even varied within a single carbon filament. The fibers were chaotically tangled and twisted around each other. The secondary structure of the material is mosaic, consisting of individual “flakes” of graphite ranging in size from 10 to 30 nm (Figure 2d, circled in yellow). These constituent parts of the carbon nanofiber are not uniformly arranged, thus creating empty holes. They can also overlap each other, so it is not always possible to identify single “flakes”. It is important to note that such a loose fiber structure causes high specific surface area and porosity in the obtained material, which will be discussed below.
It is worth mentioning that the images were taken for the carbon material washed from the catalyst, so there are no active Ni catalytic particles in the images.
SEM and TEM images were also obtained to analyze the carbon product synthesized from the mixture of two substrates (TCE and AN). Figure 3a shows that the sample has the shape of submicron curved fibers (300–600 nm). Unlike the relatively long and straight CNF-Cl fibers, this material is mostly composed of short filaments with a clear segmental structure. The individual segments are closely spaced sheets of graphene, highlighted in yellow in Figure 3c, with loose, mosaic carbon in between. Additionally, small “flakes” in the gaps between the densely packed segments are highlighted in Figure 3d. Apparently, such segments are poorly interconnected, so the material is easily broken, and separately lying “fragments” of fibers can be seen on SEM images (Figure 3b). This structure was previously described and explained by the periodic chlorination-dechlorination process of the catalytic particle surface [32].
Figure 4 shows the XRD diffraction patterns of the CNF-Cl and CNF-Cl-N samples after acidic treatment. Both samples contain a graphite-like phase with an intense 002 reflex at a 2θ of 25.6° and 25.8°. The peak shape is asymmetric, with a gradually decreasing shoulder in the region of smaller angles, indicating that the interlayer distances, d002, were not constant. This shape of the peaks is in accordance with TEM data: in the CNF-Cl sample there is an irregular layering of graphite “flakes”, and in the CNF-Cl-N sample there is an alternation of dense segments with loose carbon. Also, peaks related to the Ni phase were detected, despite the fact that the samples were previously etched with HCl acid. This suggests the presence of blocked catalyst particles which are completely covered with carbon. They cannot affect the adsorption characteristics of the material, so their presence is not important.
The textural properties of the CNF samples have been characterized by the low-temperature nitrogen adsorption/desorption method. The experimental isotherms are shown in Figure S1. Table 1 shows that the specific surface area of CNF-Cl is 310 m2·g−1, while that of CNF-Cl-N is relatively lower at 250 m2·g−1.
The pore structure of the CNF samples is similar (Figure 5). However, the CNF-Cl sample has a 30% higher volume of micropores (0.025 cm3·g−1) compared to the CNF-Cl-N sample (0.017 cm3·g−1). CNF-Cl-N exhibits a higher total pore volume of 0.82 cm3·g−1, primarily due to a significant contribution from mesopores, whereas CNF-Cl has a total pore volume of 0.53 cm3·g−1. This results in CNF-Cl-N having an average pore diameter almost twice that of CNF-Cl, measuring 13.2 nm and 6.8 nm, respectively. The larger pore diameter is attributed to the presence of macropores between the segments of carbon fibers in CNF-Cl-N (Figure 3).
The surface chemistry of CNF-Cl and CNF-Cl-N samples was analyzed using the XPS method. The survey spectra presented in Figure 6 indicate that surfaces of carbon materials studied contain, along with carbon, oxygen, nitrogen, and chlorine. The atomic percentages of these elements were calculated and are shown in Table 2.
The XPS data revealed that the synthesized CNF samples mainly consist of carbon, with a small percentage of oxygen and trace amounts of chlorine and nitrogen (Table 2). To identify the functional groups, present on the surfaces of CNF-Cl and CNF-Cl-N, a detailed analysis of each element’s spectral lines was performed (Figure 7).
The Cl2p XPS spectrum of the CNF-Cl sample shows two Cl2p3/2 and Cl2p1/2 lines, with binding energies of 200.5 eV and 202.2 eV, respectively (Figure 7a). These values are almost identical to those observed for chlorinated graphene [33], indicating that all of the chlorine on the CNF-Cl surface is bound to carbon.
Table 2 shows that the addition of AN to the reaction mixture resulted in the formation of a carbon material without chlorine. However, this CNF-Cl-N sample contained some amounts of nitrogen (Table 2) in the form of pyridinic (398.4 eV), pyrrolic (400.1 eV), and graphitic (401.3 eV) nitrogen groups, as well as NOx-containing groups (Figure 7b) [34,35]. Moreover, this sample exhibited a higher surface oxygen content compared to CNF-Cl (Table 2). The O1s spectrum could be decomposed into two peaks with binding energies of 531.8 and 533.2 eV (Figure 7c). The first peak was attributed to C=O or O-C=O functional groups, where there is a double bond between the oxygen and carbon atoms. The second peak, with a higher binding energy, was attributed to C-OH or C-O-C functional groups with a single bond between the oxygen and carbon atoms [36]. Comparing the areas of these peaks (Figure 7c) revealed that phenol and ether functional groups were predominant on the CNF-Cl-N surface. Note that these group percentages are notably higher on the CNF-Cl surface (Table 3), despite containing two times less oxygen (Table 2).
The C1s line exhibits an asymmetric shape at high binding energies (Figure 7d), indicating the presence of oxygen-containing functional groups on the surface of the studied CNFs. Deconvolution of the C1s spectrum identified four carbon states with binding energies of 284.5, 285.8, 287.3, and 289.2 eV, corresponding to sp2 carbon, sp3 carbon bound to a single oxygen, sp2 carbon bound to oxygen, and sp2 carbon bound to two oxygens, respectively [37]. According to the data presented in Table 3, phenol and ether functional groups were predominant among oxygen-containing functional groups, which is consistent with the results of O1s spectrum deconvolution (Table 3, Figure 7c).
In summary, the CNF-Cl sample synthesized from TCE consists of loose carbon fibers that form agglomerates with ordered graphene layers. This sample has a specific surface area of 310 m2·g−1 and a porous structure mainly composed of mesopores. On the other hand, when AN is added to TCE, the resulting CNF-Cl-N sample has very loosely packed carbon fibers with randomly arranged segments. These segments are separated by large pores, resulting in a comparable volume of mesopores and macropores. The presence of a higher proportion of large pores leads to a lower specific surface area of 250 m2·g−1. Furthermore, CNF-Cl-N has twice as much oxygen on its surface compared to CNF-Cl, which can be attributed to the presence of phenol and ether functional groups.

3.2. Adsorption of 2,4-DCBA from Aqueous Solutions

The focus of the study was to investigate the adsorption properties of the synthesized CNFs with respect to 2,4-DCBA, which is an intermediate product in the degradation of chlorine-containing pesticides. 2,4-DCBA is a halogenated carboxylic acid that exists as a white to slightly yellowish crystalline solid. According to publicly available reference information, it has low solubility in water, approximately 2.5 mM at 25 °C, and exhibits hydrophobic characteristics with a logKow value of 2.82. This weak organic acid has a pKa of 2.68 at 25 °C. The distribution of 2,4-DCBA between its neutral and ionized forms at various pH levels is shown in Figure S2. At pH values below 2.68, the compound exists in a protonated, neutral form, which is more hydrophobic and less soluble in water. As the pH increases, the equilibrium shifts towards the deprotonated form of 2,4-DCBA, which is more hydrophilic and more soluble in water. Schematically, the shape of 2,4-DCBA in molecular and ionic forms with a Van der Waals surface is represented in Figure 8. It was built using the Avogadro program (Version 1.2.0, https://avogadro.cc, accessed on 20 June 2023). The ionic form exhibits greater polarity, reflected by the higher density of electrostatic charges compared to the molecule form. The cross-section area was estimated to be 0.82 nm2. The dipole moment, previously calculated in [38], was reported to be 4.43 ± 0.13 D.

3.2.1. Adsorption of 2,4-DCBA at Natural pH

The equilibrium adsorption of 2,4-DCBA onto the surface of synthesized carbon nanofibers was studied. Initially, the adsorption process was examined without pH control under the natural acidity of the solution. A distinctive feature of this research was the use of concentrated solutions of 2,4-DCBA up to saturation. This approach makes it possible to determine the maximum adsorption capacity of materials.
Figure 9 shows that the adsorption isotherms of 2,4-DCBA on both CNFs are almost identical and exhibit Lmx type, according to Giles classification [39]. At the initial part of the curve, the adsorption increases until the concentration of 2,4-DCBA reaches 1.13 mM. The maximum adsorption capacities are found to be 2.32 mmol·g−1 for CNF-Cl and 2.29 mmol·g−1 for CNF-Cl-N. However, as the concentration of 2,4-DCBA in the solution further increases, the extent of adsorption decreases. This dependence remains consistent even when the ionic strength of the solution varies (Figure S3). Thus, the presence of additional ions does not affect the adsorption properties of carbon materials for 2,4-DCBA.
It should be noted that this type of isotherm is not typical. To verify the experimental data obtained, we carried out several repetitive experiments with different adsorption times ranging from one to four days. The resulting adsorption curves exhibited negligible differences, with a maximum deviation of less than 3%. This confirms the high reproducibility of the data and the reliability of the research results. Furthermore, it indicates that equilibrium is reached within 24 h, as traditionally used in our experiments, and that external diffusion does not influence the adsorption process.
Literature suggests that such adsorption isotherms with a maximum are typically observed in aqueous solutions of substances prone to association, such as detergents. It is believed that as the concentration of the solution increases, a point is reached when the attraction between polar solute molecules becomes stronger than their interaction with the adsorbent. This leads to the desorption of some of the substance from the surface, which then forms solvated micelles [39,40].
Data on the self-association of 2,4-DCBA in aqueous solutions were not found in the literature. However, early researches have indicated that benzene [41], some substituted benzoic acids [42], pyridinic acids [43], and aliphatic carboxylic acids [44] can form a small number of dimers in an aqueous solution at concentrations near saturation. Nevertheless, it was later revealed that the formation of dimers and clusters of benzoic acid in diluted aqueous solutions is not energetically favorable [45]. In addition, no dimerization of 2,6-diftorobenzoic acid was observed in water, likely since the acid strongly dissociates in the solution [42]. The pKa values for 2,6-difluorobenzoic acid (2.85) and 2,4-dichlorobenzoic acid (2.68) are very close. It can therefore be assumed that the self-association effect of 2,4-DCBA in an aqueous solution is negligible and cannot explain the presence of a maximum on the adsorption isotherm.
Another possible reason for the decrease in adsorption could be the solvation of the 2,4-DCBA molecules. At high concentrations, the formation of a hydration shell around 2,4-DCBA molecules could hinder their adsorption in micropores due to the size effect. Nevertheless, it is important to note that the maximum amount of 2,4-DCBA that can be adsorbed in micropores is relatively low, at only 0.2 mmol·g−1 for CNF-Cl and 0.13 mmol·g−1 for CNF-Cl-N. Additionally, the decline in adsorption after reaching the maximum is significant, dropping from 2.32 mmol·g−1 to 0.76 mmol·g−1 for CNF-Cl and from 2.29 mmol·g−1 to 0.56 mmol·g−1 for CNF-Cl-N. These observations suggest that the majority of adsorption occurs in mesopores.
Moreover, this type of isotherm, known as the excess adsorption isotherm, is typically observed in the adsorption of binary mixtures of miscible liquids [39,46]. In our study, we investigated a one-component solution of 2,4-DCBA in water. However, as mentioned above, 2,4-DCBA is a weak acid that dissociates in an aqueous solution. Over the concentration range of 0.15–2.5 mM, pH and their dissociation degree change from 4.2 and 98% to 3.1 and 64%, respectively (Figure 9 and Figure S2). Therefore, at each point on Figure 9, there are both molecular and ionized forms of 2,4-DCBA present at different ratios. These different forms are likely to have different affinities for adsorption onto the synthesized CNF samples, which have a positively charged surface within the pH range under study (Figure 1) due to interaction with protons (Figure 10).
In the subsequent stage of the research, the adsorption of 2,4-DCBA was therefore studied at fixed pH values (2, 3, 4, 5, and 9) when the concentrations of the molecular and ionized forms of the acid were constant. This approach allowed for a more accurate determination of the effect of the 2,4-DCBA dissociation degree and surface recharging on the adsorption process.

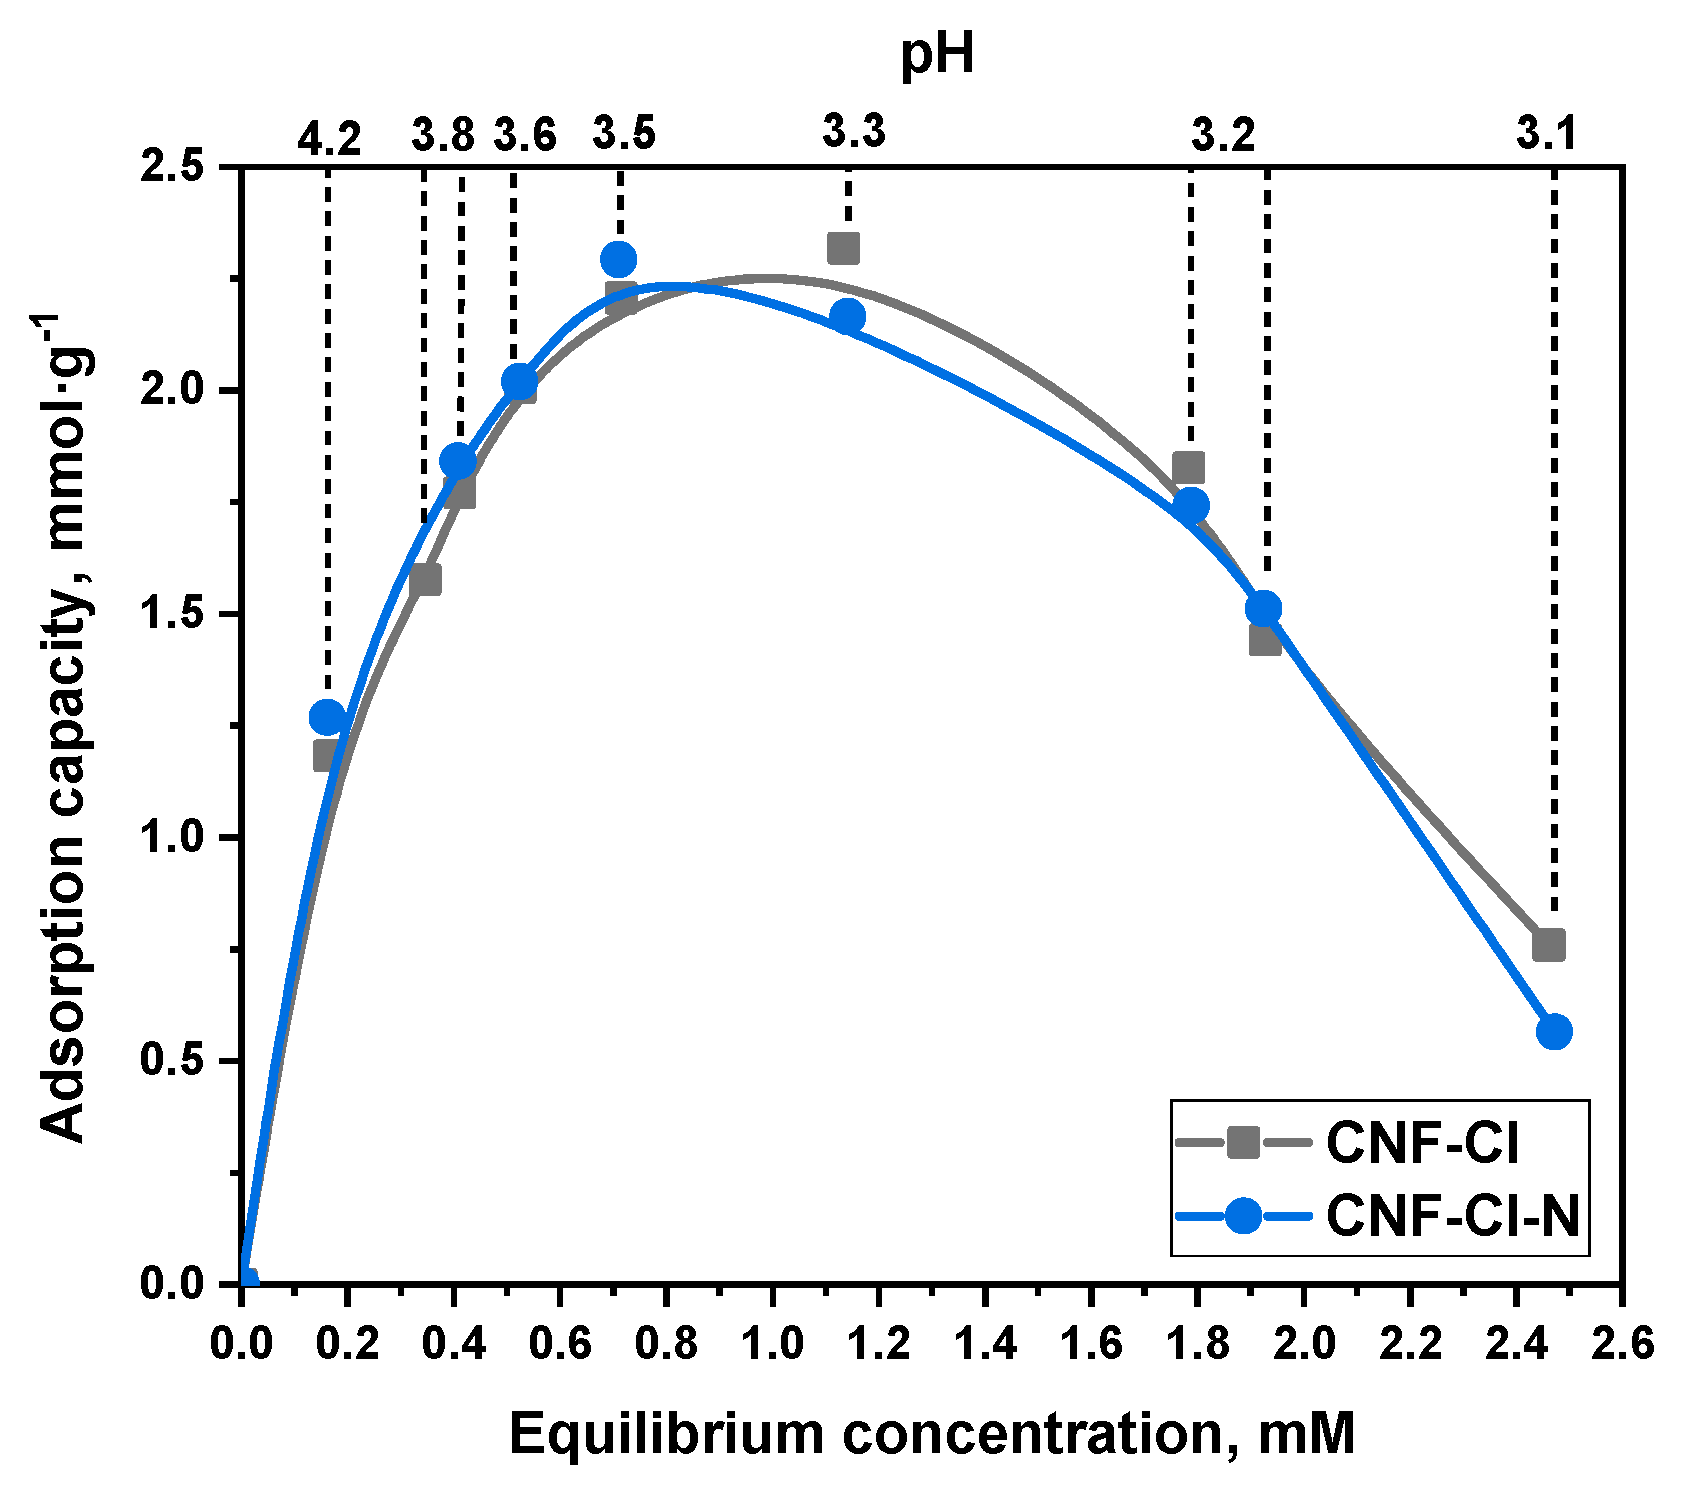
3.2.2. Adsorption of 2,4-DCBA at Different pH Values

Figure 11 shows the adsorption isotherms of 2,4-DCBA on CNF-Cl and CNF-Cl-N samples at different pH values. The corresponding 2,4-DCBA dissociation degrees at each pH are presented in Table 4. The adsorption isotherms were found to exhibit the L2 type, according to the Giles classification [39]. Notably, the maximum observed at adsorption at the natural pH of the 2,4-DCBA solution (Figure 7) is absent, which may be attributed to an increase in positive charge of the CNF surface with an increase in pH of the solution (Figure 10).
This observation supports the hypothesis that the dissociation degree of the acid has a greater influence on the adsorption behavior than its solvation and self-association. Recall that the L2 type isotherm is characterized by the absence of strong competition between solvent and adsorbate for adsorption sites on the adsorbent surface, and adsorption occurs due to relatively weak forces such as van der Waals. Moreover, this type of isotherm usually indicates that the adsorbate molecules are adsorbed flat on the surface [40].
The Langmuir, Freundlich, and Dubinin-Astakhov models were used to fit the isotherm parameters, and the results are presented in Tables S1 and S2. The Langmuir model was found to provide a sufficiently high determination coefficient (R2 > 0.9). However, using the Langmuir model is not entirely justified since it assumes monomolecular adsorption. Taking into account the specific surface area of the adsorbents (Table 1) and the molecular size of 2,4-DCBA (estimated as 0.82 nm2), the monolayer capacity (A0) was calculated as follows:
A 0 = S S A S 2 , 4 DCBA N A ,
where S S A is the specific surface area of the adsorbent, m2·g−1; S 2,4 DCBA is the cross-section area of 2,4-DCBA molecule, m2; N A is the Avogadro number (6.02 × 10²³ mol−1).
The calculated values of the monolayer capacity (A0) for CNF-Cl and CNF-Cl-N were found to be 0.63 mmol·g−1 and 0.5 mmol·g−1, respectively. These values are significantly lower than the adsorption capacities achieved for all pH values except pH 9 (Table 5). These adsorption capacities decrease with increasing pH, but this trend is not reflected in the calculated Langmuir constants (Tables S1 and S2). Based on these results, it can be concluded that the adsorption of 2,4-DCBA from an aqueous solution on CNF-Cl and CNF-Cl-N involves multilayer adsorption or volume filling of pores in the carbon nanofibers. This observation is consistent with the high accuracy of the approximation of experimental data with the Dubinin-Astachov equation with n = 1 (R2 > 0.947, Tables S1 and S2). The same determination coefficient value is also observed when experimental data is approximated using the Freundlich model (Tables S1 and S2). This indicates that the surface of CNF is heterogeneous, with the presence of centers exhibiting different adsorption forces for 2,4-DCBA. This observation is consistent with the presence of various oxygen-containing functional groups on the surfaces of CNF (Figure 7). Adsorption forces act at a distance, causing the concentration of adsorbate molecules in the pores of the carbon material. However, at different pH values, the ratio of ionized and molecular forms of CNF functional groups will vary, thereby affecting the adsorption of 2,4-DCBA. This is indirectly supported by the data obtained from the determination of the pHPZC for CNF-Cl and CNF-Cl-N samples (Figure 1).
Based on Figure 11, Table 5, Tables S1 and S2, it is evident that pH has a significant effect on the adsorption of 2,4-DCBA on the surface of the studied carbon nanofibers. Both CNF samples show a similar trend, with maximum adsorption observed at pH 2 and decreasing adsorption with increasing pH. The minimal adsorption capacities, which do not exceed the monolayer capacities, were obtained at pH 9 (Table 5). The reduced adsorption at alkaline pH can be attributed to electrostatic repulsion between the anions of completely dissociated 2,4-DCBA (pKa = 2.68) and the negatively charged carbon surfaces (Figure 10). CNF-Cl-N, which has more oxygen-containing functional groups, exhibits less effective adsorption of 2,4-DCBA from aqueous solutions.
At pH 5, although 2,4-DCBA is primarily in the dissociated form of the anion (Table 4), the surface charge of the CNF samples is close to neutral. Therefore, the electrostatic repulsion between the anions and the CNF surface is reduced, leading to a four-fold increase in the adsorption of 2,4-DCBA compared to that at pH 9. However, the obtained adsorption values slightly exceed monolayer capacities (Figure 12).
As the pH decreases below 5, the carbon surface becomes positively charged (Figure 1). This results in the electrostatic attraction of the 2,4-DCBA anions, which are still present in significant quantities in solution at pH 3 and 4, to the surface. This also leads to an increase in the adsorption of 2,4-DCBA on the surface of CNFs.
At pH 2, maximum saturation of the surface with protons is achieved [47] (Figure 1). This also promotes the adsorption of 2,4-DCBA from the water solution since even the non-dissociated molecular form of the acid has a dipole moment that is twice as high (4.43 D) as water (1.85 D). Additionally, the presence of hydrogen acceptor atoms (N and O) on the surface of the carbon nanofibers suggests the possibility of hydrogen bonding with the COOH group in 2,4-DCBA [48,49]. Therefore, despite the electroneutrality of the 2,4-DCBA molecule (83% in the non-dissociated form), these interactions are believed to be responsible for the enhanced adsorption of 2,4-DCBA on the carbon nanofiber surface at low pH values.
It is important to note that nitrogen-containing carbon nanofibers, CNF-Cl-N, exhibit lower adsorption capacity compared to the CNF-Cl sample across the entire range of pH values (Figure 11 and Figure 12 and Table 5). One possible reason for this observation is the 30% lower volume of micropores in CNF-Cl-N (Table 1), which are predominantly filled during adsorption. Another contributing factor may be the enrichment of the CNF-Cl-N surface with functional groups, which increases its hydrophilicity.
However, there are no significant differences in the concentrations of oxygen-containing groups (Table 2). Therefore, at the natural pH of the 2,4-DCBA solution, both CNF-Cl and CNF-Cl-N have similar adsorption capacities of 2.32 and 2.29 mmol·g−1, or 0.292 and 0.288 cm3·g−1, respectively. This means that during the adsorption process, the pore volume is filled by 55% for CNF-Cl and by 35% for CNF-Cl-N, even from a saturated solution (Table 5). The higher values could not be achieved due to the limited solubility of 2,4-DCBA in water. However, these adsorption capacities are higher than those obtained at fixed pHs (Table 5).
This study demonstrates the effectiveness of using carbon nanomaterials produced through catalytic pyrolysis of organochlorine wastes for water purification. Specifically, it focuses on the removal of 2,4-DCBA, which is an intermediate product resulting from the decomposition of highly toxic chlorinated pesticides. In this case, the inclusion of nitrogen in the CNF, which occurs as a result of the presence of acetonitrile in the reaction mixture during its synthesis, has a little effect on its adsorption capacity at the natural pH of the solution.
Achieving high adsorption capacities is crucial in the field of water purification as it enables more efficient removal of 2,4-DCBA from aqueous mediums. Significantly, the adsorption capacities obtained in this study exceed those reported in the scientific literature (Table S3), indicating a remarkable advancement in the field. For comparison, renowned materials such as Pd/carbon black, Pd/multi-walled carbon nanotubes, and Pd/granular activated carbon exhibit adsorption capacities of 0.26 mmol·g−1, 0.16 mmol·g−1, and 0.05 mmol·g−1, respectively [50]. An even lower adsorption capacity of 0.013 mmol·g−1 was observed for functionalized palladium/granular activated carbon with cetyltrime-thylammonium bromide [51].
These findings are of utmost importance as they demonstrate a substantial improvement over the current state-of-the-art adsorption materials. The enhanced adsorption capacities achieved in this study pave the way for more efficient and effective water purification adsorbents targeting the removal of toxic 2,4-DCBA. Furthermore, producing such adsorption materials through the utilization of chlorinated organic compounds not only offers benefits to the environment but also provides cost savings.

4. Conclusions

In this study, two samples of carbon nanofibers were synthesized using the pyrolysis method. The first sample, CNF-Cl, was synthesized from trichloroethylene, while the second sample, CNF-Cl-N, was synthesized from a mixture of trichloroethylene and acetonitrile. The objective of the study was to investigate the adsorption properties of these carbon materials towards 2,4-DCBA, which is an intermediate product in the decomposition of chlorinated pesticides.
It was found that during the pyrolysis of trichloroethylene, CNF-Cl was formed, with a specific surface area of 310 m2·g−1. The porous structure of CNF-Cl consists mainly of mesopores. The addition of acetonitrile to the reaction mixture leads to the fragmentation of the carbon filaments into separate segments, creating large pores between them. As a result, the amount of these large pores becomes predominant while the quantity of micropores is reduced. Consequently, the specific surface area decreases to 250 m2·g−1. Additionally, CNF-Cl-N has twice as much oxygen on its surface compared to CNF-Cl, which is attributed to the presence of phenol and ether functional groups.
The study investigated the adsorption of 2,4-DCBA on both CNFs without pH control under the natural acidity of the solution. It was observed that with an increase in the concentration of 2,4-DCBA in the solution, there is a dependence with a maximum on the adsorption capacity, which weakly depends on the ionic strength. The maximum adsorption capacity was found to be achieved within the concentration range of 0.7 to 1.2 mM, corresponding to a pH of 3.4 ± 0.1. At this pH, the equilibrium ratio between the ionized and molecular forms of 2,4-DCBA in the solution is 70:30, respectively. The carbon surfaces are positively charged due to the ionization of ketonic groups (pHPZC is 5.6 for CNF-Cl and 5.2 for CNF-Cl-N). Therefore, the increase in adsorption capacity to about 2.3 mmol·g−1 at pH 3.4 ± 0.1 is associated with the increase in concentration of 2,4-DCBA, which has a low dipole moment even in non-ionized form. However, a further decrease in adsorption capacity may be attributed to the decrease in the concentration of the ionized form of the acid in the solution, which is adsorbed on the surface of CNFs through electrostatic interactions.
The detailed study of the adsorption of 2,4-DCBA on CNFs at various pH levels (2, 3, 4, 5, and 9) shows that as the pH of the solution increases, the amount of adsorbed acid decreases. The highest amount of 2,4-DCBA remains in the solution at pH 9. Apparently, due to the interaction of alkali with acidic functional groups, the surface of CNFs acquires a negative charge, resulting in weak adsorption of the fully ionized form of the acid on both CNF-Cl-N and CNF-Cl surfaces.
It was observed that CNF-Cl-N exhibits a lower adsorption capacity of 2,4-DCBA compared to CNF-Cl. This can be attributed to the fact that the nitrogen-containing CNF-Cl-N sample has a lower specific surface area, a lower micropore volume, and a slightly higher concentration of oxygen-containing functional groups on the surface than CNF-Cl. However, these differences are not significant, indicating that both carbon materials can be effectively used for removing 2,4-DCBA from water environments. Additionally, the achieved adsorption capacities are eight times higher than those reported by other researchers.
These results demonstrate that effective adsorbents for water treatment, specifically for removing 2,4-DCBA, can be prepared by pyrolyzing chlorine-containing wastes as well as their mixtures with nitrogen-containing wastes.

Supplementary Materials

The following supporting information can be downloaded at: https://www.mdpi.com/article/10.3390/c9040098/s1, Figure S1: Nitrogen adsorption isotherm (77.4 K) for (a) CNF-Cl and (b) CNF-Cl-N; Figure S2: Species distribution of 2,4-DCBA as a function of solution pH; Figure S3: The influence of ionic strength on the adsorption of 2,4-DCBA on the carbon material. (a) Experimental adsorption isotherms of 2,4-DCBA obtained in water and 0.1 M NaCl solution at a natural pH. (b) Experimental adsorption isotherms of 2,4-DCBA at pH = 2 and different ionic strengths. Ionic strengths of 0.014 M and 0.044 M were obtained by using HCl with concentrations of 0.1 M and 2.45 M for adjusting the pH to 2; Table S1: Values of parameters calculated from the Langmuir, Freundlich, and Dubinin–Astakhov adsorption isotherms for 2,4-DCBA on the CNF-Cl sample at different pHs; Table S2: Values of parameters calculated from the Langmuir, Freundlich, and Dubinin–Astakhov adsorption isotherms for 2,4-DCBA on the CNF-Cl-N sample at different pHs; Table S3: Comparison of maximum adsorption capacities of various adsorbents for 2,4-DCBA.

Author Contributions

Conceptualization, O.V.N. and I.V.M.; methodology, E.S.T., I.L.L., Y.V.S. and I.P.P.; investigation, A.M.O., A.R.P., Y.I.B., I.P.P., E.S.T., I.L.L. and Y.V.S.; resources, Y.I.B.; writing—original draft preparation, A.M.O., A.R.P. and O.V.N.; writing—review and editing, O.V.N., I.V.M. and A.A.V.; visualization, A.R.P., O.V.N. and A.A.V.; supervision, A.A.V.; funding acquisition, I.V.M. All authors have read and agreed to the published version of the manuscript.

Funding

This work was financially supported by the Russian Science Foundation (project No. 22-13-00406, https://rscf.ru/en/project/22-13-00406 accessed on 1 October 2023, BIC SB RAS).

Institutional Review Board Statement

Not applicable.

Informed Consent Statement

Not applicable.

Data Availability Statement

Data is contained within the article.

Acknowledgments

Characterization of the samples was performed using the equipment of the Center of Collective Use “National Center of Catalysts Research”. TEM studies were performed in the Krasnoyarsk Regional Center of Research Equipment of the Federal Research Center “Krasnoyarsk Science Center SB RAS”. The authors are grateful to M.N. Volochaev for help in the electron microscopy studies, and to A.B. Ayupov for the low-temperature nitrogen adsorption/desorption analysis.

Conflicts of Interest

The authors declare no conflict of interest. The funders had no role in the design of the study; in the collection, analyses, or interpretation of data; in the writing of the manuscript; or in the decision to publish the results.

References

  1. Henschler, D. Toxicity of Chlorinated Organic Compounds: Effects of the Introduction of Chlorine in Organic Molecules. Angew. Chem. Int. Ed. Engl. 1994, 33, 1920–1935. [Google Scholar] [CrossRef]
  2. Mishakov, I.V.; Bauman, Y.I.; D’yachkova, S.G.; Potylitsyna, A.R.; Vedyagin, A.A. Integrated Approach to the Utilization of Organochlorine Compounds by the Example of Vinyl Chloride Production Waste. Dokl. Chem. 2023, 508, 62–69. [Google Scholar] [CrossRef]
  3. Sabzehmeidani, M.M.; Mahnaee, S.; Ghaedi, M.; Heidari, H.; Roy, V.A.L. Carbon Based Materials: A Review of Adsorbents for Inorganic and Organic Compounds. Mater. Adv. 2021, 2, 598–627. [Google Scholar] [CrossRef]
  4. Abbo, H.S.; Gupta, K.C.; Khaligh, N.G.; Titinchi, S.J.J. Carbon Nanomaterials for Wastewater Treatment. ChemBioEng Rev. 2021, 8, 463–489. [Google Scholar] [CrossRef]
  5. Din, I.U.; Shaharun, M.S.; Naeem, A.; Alotaibi, M.A.; Alharthi, A.I.; Bakht, M.A.; Nasir, Q. Carbon Nanofibers as Potential Materials for Catalysts Support, a Mini-Review on Recent Advances and Future Perspective. Ceram. Int. 2020, 46, 18446–18452. [Google Scholar] [CrossRef]
  6. Peera, S.G.; Koutavarapu, R.; Akula, S.; Asokan, A.; Moni, P.; Selvaraj, M.; Balamurugan, J.; Kim, S.O.; Liu, C.; Sahu, A.K. Carbon Nanofibers as Potential Catalyst Support for Fuel Cell Cathodes: A Review. Energy Fuels 2021, 35, 11761–11799. [Google Scholar] [CrossRef]
  7. des Ligneris, E.; Dumée, L.F.; Kong, L. Nanofiber-Based Materials for Persistent Organic Pollutants in Water Remediation by Adsorption. Appl. Sci. 2018, 8, 166. [Google Scholar] [CrossRef]
  8. Arman, N.Z.; Salmiati, S.; Aris, A.; Salim, M.R.; Nazifa, T.H.; Muhamad, M.S.; Marpongahtun, M. A Review on Emerging Pollutants in the Water Environment: Existences, Health Effects and Treatment Processes. Water 2021, 13, 3258. [Google Scholar] [CrossRef]
  9. Pirsaheb, M.; Hossini, H.; Asadi, F.; Janjani, H. A Systematic Review on Organochlorine and Organophosphorus Pesticides Content in Water Resources. Toxin Rev. 2017, 36, 210–221. [Google Scholar] [CrossRef]
  10. Somma, S.; Reverchon, E.; Baldino, L. Water Purification of Classical and Emerging Organic Pollutants: An Extensive Review. ChemEngineering 2021, 5, 47. [Google Scholar] [CrossRef]
  11. Mishakov, I.V.; Bauman, Y.I.; Brzhezinskaya, M.; Netskina, O.V.; Shubin, Y.V.; Kibis, L.S.; Stoyanovskii, V.O.; Larionov, K.B.; Serkova, A.N.; Vedyagin, A.A. Water Purification from Chlorobenzenes Using Heteroatom-Functionalized Carbon Nanofibers Produced on Self-Organizing Ni-Pd Catalyst. J. Environ. Chem. Eng. 2022, 10, 107873. [Google Scholar] [CrossRef]
  12. Ozerova, A.M.; Potylitsyna, A.R.; Bauman, Y.I.; Tayban, E.S.; Lipatnikova, I.L.; Nartova, A.V.; Vedyagin, A.A.; Mishakov, I.V.; Shubin, Y.V.; Netskina, O.V. Synthesis of Chlorine- and Nitrogen-Containing Carbon Nanofibers for Water Purification from Chloroaromatic Compounds. Materials 2022, 15, 8414. [Google Scholar] [CrossRef] [PubMed]
  13. Bauman, Y.I.; Netskina, O.V.; Mukha, S.A.; Mishakov, I.V.; Shubin, Y.V.; Stoyanovskii, V.O.; Nalivaiko, A.Y.; Vedyagin, A.A.; Gromov, A.A. Adsorption of 1,2-Dichlorobenzene on a Carbon Nanomaterial Prepared by Decomposition of 1,2-Dichloroethane on Nickel Alloys. Russ. J. Appl. Chem. 2020, 93, 1873–1882. [Google Scholar] [CrossRef]
  14. Vrana, B.; Dercová, K.; Baláž, Š.; Ševčíková, A. Effect of Chlorobenzoates on the Degradation of Polychlorinated Biphenyls (PCB) by Pseudomonas Stutzeri. World J. Microbiol. Biotechnol. 1996, 12, 323–326. [Google Scholar] [CrossRef]
  15. Stratford, J.; Wright, M.A.; Reineke, W.; Mokross, H.; Havel, J.; Knowles, C.J.; Robinson, G.K. Influence of Chlorobenzoates on the Utilisation of Chlorobiphenyls and Chlorobenzoate Mixtures by Chlorobiphenyl/Chlorobenzoate-Mineralising Hybrid Bacterial Strains. Arch. Microbiol. 1996, 165, 213–218. [Google Scholar] [CrossRef] [PubMed]
  16. Klamerth, N.; Gernjak, W.; Malato, S.; Agüera, A.; Lendl, B. Photo-Fenton Decomposition of Chlorfenvinphos: Determination of Reaction Pathway. Water Res. 2009, 43, 441–449. [Google Scholar] [CrossRef] [PubMed]
  17. United States Environment Protection Agency (USEPA). Prevention, Pesticides and Toxic Substances. In Reregistration Eligibility Decision (RED) for Propiconazole: Case No. 3125; EPA 738R-0; United States Environment Protection Agency (USEPA): Washington, DC, USA, 2006. [Google Scholar]
  18. (ThermoFisher-SDS-C7H4Cl2O2) ThermoFisher Scientific Safety Data Sheet. 2,4-Dichlorobenzoic Acid, CAS No.: 50-84-0. 2021. Available online: https://www.thermofisher.in/chemicals/en/search/results?keyword=50-84-0 (accessed on 20 June 2023).
  19. (ThermoFisher-SDS-C6H4Cl2) ThermoFisher Scientific Safety Data Sheet. o-Dichlorobenzene, CAS No.: 95-50-1. 2021. Available online: https://www.thermofisher.in/chemicals/en/search/results?keyword=95-50-1 (accessed on 20 June 2023).
  20. Li, H.; Cao, Y.; Zhang, D.; Pan, B. pH-Dependent KOW Provides New Insights in Understanding the Adsorption Mechanism of Ionizable Organic Chemicals on Carbonaceous Materials. Sci. Total Environ. 2018, 618, 269–275. [Google Scholar] [CrossRef] [PubMed]
  21. Li, X.; Pignatello, J.J.; Wang, Y.; Xing, B. New Insight into Adsorption Mechanism of Ionizable Compounds on Carbon Nanotubes. Environ. Sci. Technol. 2013, 47, 8334–8341. [Google Scholar] [CrossRef]
  22. Chen, Z.; Ji, W. Sorption of Ionizable Organic Chemicals to Carbonaceous Adsorbents: Solution pH Change and Contributions of Different Species. Sci. Total Environ. 2019, 647, 1069–1079. [Google Scholar] [CrossRef]
  23. Rudneva, Y.V.; Shubin, Y.V.; Plyusnin, P.E.; Bauman, Y.I.; Mishakov, I.V.; Korenev, S.V.; Vedyagin, A.A. Preparation of Highly Dispersed Ni1-XPdx Alloys for the Decomposition of Chlorinated Hydrocarbons. J. Alloys Compd. 2019, 782, 716–722. [Google Scholar] [CrossRef]
  24. Wang, J.; Guo, X. Adsorption Isotherm Models: Classification, Physical Meaning, Application and Solving Method. Chemosphere 2020, 258, 127279. [Google Scholar] [CrossRef]
  25. Bering, B.P.; Dubinin, M.M.; Serpinsky, V.V. Theory of Volume Filling for Vapor Adsorption. J. Colloid Interface Sci. 1966, 21, 378–393. [Google Scholar] [CrossRef]
  26. Dubinin, M.M. Adsorption Properties and Microporous Structures of Carbonaceous Adsorbents. Carbon N. Y. 1987, 25, 593–598. [Google Scholar] [CrossRef]
  27. Podlesnyuk, V.V.; Levchenko, T.M.; Marutovskii, R.M.; Koganovskii, A.M. Adsorption of Dissolved Organic Compounds on Porous Polymeric Materials. Theor. Exp. Chem. 1985, 21, 363–365. [Google Scholar] [CrossRef]
  28. Kaneko, K. Determination of Pore Size and Pore Size Distribution. 1. Adsorbents and Catalysts. J. Memb. Sci. 1994, 96, 59–89. [Google Scholar] [CrossRef]
  29. Mel’gunov, M.S.; Ayupov, A.B. Direct Method for Evaluation of BET Adsorbed Monolayer Capacity. Microporous Mesoporous Mater. 2017, 243, 147–153. [Google Scholar] [CrossRef]
  30. Brunauer, S.; Emmett, P.H.; Teller, E. Adsorption of Gases in Multimolecular Layers. J. Am. Chem. Soc. 1938, 60, 309–319. [Google Scholar] [CrossRef]
  31. Scofield, J.H. Hartree-Slater Subshell Photoionization Cross-Sections at 1254 and 1487 EV. J. Electron Spectrosc. Relat. Phenom. 1976, 8, 129–137. [Google Scholar] [CrossRef]
  32. Potylitsyna, A.R.; Bauman, Y.I.; Mishakov, I.V.; Plyusnin, P.E.; Vedyagin, A.A.; Shubin, Y.V. The Features of the CCVD of Trichloroethylene over Microdispersed Ni and Ni–Mo Catalysts. Top. Catal. 2023, 66, 326–337. [Google Scholar] [CrossRef]
  33. Li, B.; Zhou, L.; Wu, D.; Peng, H.; Yan, K.; Zhou, Y.; Liu, Z. Photochemical Chlorination of Graphene. ACS Nano 2011, 5, 5957–5961. [Google Scholar] [CrossRef]
  34. Chiang, Y.C.; Hsu, W.L. Carbon Dioxide Adsorption on Nano/Micro-Scale Porous Adsorbents. Int. J. Nanomanuf. 2016, 12, 1–14. [Google Scholar] [CrossRef]
  35. Kundu, S.; Xia, W.; Busser, W.; Becker, M.; Schmidt, D.A.; Havenith, M.; Muhler, M. The Formation of Nitrogen-Containing Functional Groups on Carbon Nanotube Surfaces: A Quantitative XPS and TPD Study. Phys. Chem. Chem. Phys. 2010, 12, 4351–4359. [Google Scholar] [CrossRef] [PubMed]
  36. Liu, H.; Wang, J.; Wang, J.; Cui, S. Sulfonitric Treatment of Multiwalled Carbon Nanotubes and Their Dispersibility in Water. Materials 2018, 11, 2442. [Google Scholar] [CrossRef]
  37. Chen, X.; Wang, X.; Fang, D. A Review on C1s XPS-Spectra for Some Kinds of Carbon Materials. Fuller. Nanotub. Carbon Nanostructures 2020, 28, 1048–1058. [Google Scholar] [CrossRef]
  38. Rajalakshmi, K. Vibrational Study of 2,4-Dichlorobenzoic Acid by DFT. Int. J. Adv. Sci. Technol. Eng. Manag. Sci. 2016, 2. [Google Scholar]
  39. Giles, C.H.; MacEwan, T.H.; Nakhwa, S.N.; Smith, D. Studies in Adsorption. Part XI. A System of Classification of Solution Adsorption Isotherms, and Its Use in Diagnosis of Adsorption Mechanisms and in Measurement of Specific Surface Areas of Solids. J. Chem. Soc. 1960, 786, 3973–3993. [Google Scholar] [CrossRef]
  40. Piccin, J.S.; Cadaval, T.R.S.A.; De Pinto, L.A.A.; Dotto, G.L. Adsorption Isotherms in Liquid Phase: Experimental, Modeling, and Interpretations. In Adsorption Processes for Water Treatment and Purification; Bonilla-Petriciolet, A., Mendoza-Castillo, D., Reynel-Ávila, H., Eds.; Springer: Cham, Switzerland, 2017; pp. 19–51. ISBN 9783319581361. [Google Scholar]
  41. Hallén, D.; Wadsö, I.; Wasserman, D.J.; Robert, C.H.; Gill, S.J. Enthalpy of Dimerization of Benzene in Water. J. Phys. Chem. 1988, 92, 3623–3625. [Google Scholar] [CrossRef]
  42. Strong, L.E.; Brummel, C.L.; Ryther, R.; Radford, J.R.; Pethybridge, A.D. Dimerization of Some Substituted Benzoic Acids in Aqueous Solution from Conductance Measurements. J. Solut. Chem. 1988, 17, 1145–1167. [Google Scholar] [CrossRef]
  43. Peral, F.; Gallego, E.; Morcillo, J. Self-Association of Pyridine Carboxylic Acids and Orotic Acid in Aqueous Solution. An Ultraviolet Study. J. Mol. Struct. 1990, 219, 251–256. [Google Scholar] [CrossRef]
  44. Yamamoto, K.; Nishi, N. Hydrophobic Hydration and Hydrophobic Interaction of Carboxylic Acids in Aqueous Solution: Mass Spectrometric Analysis of Liquid Fragments Isolated as Clusters. J. Am. Chem. Soc. 1990, 112, 549–558. [Google Scholar] [CrossRef]
  45. Pham, H.H.; Taylor, C.D.; Henson, N.J. First-Principles Prediction of the Effects of Temperature and Solvent Selection on the Dimerization of Benzoic Acid. J. Phys. Chem. B 2013, 117, 868–876. [Google Scholar] [CrossRef]
  46. Zettlemoyer, A.C.; Micale, F.J. Adsorption from Solution. Croat. Chem. Acta 1970, 42, 247–263. [Google Scholar]
  47. Leon y Leon, C.A.; Solar, J.M.; Calemma, V.; Radovic, L.R. Evidence for the Protonation of Basal Plane Sites on Carbon. Carbon N. Y. 1992, 30, 797–811. [Google Scholar] [CrossRef]
  48. Tong, Y.; McNamara, P.J.; Mayer, B.K. Adsorption of Organic Micropollutants onto Biochar: A Review of Relevant Kinetics, Mechanisms and Equilibrium. Environ. Sci. Water Res. Technol. 2019, 5, 821–838. [Google Scholar] [CrossRef]
  49. Kah, M.; Sigmund, G.; Xiao, F.; Hofmann, T. Sorption of Ionizable and Ionic Organic Compounds to Biochar, Activated Carbon and Other Carbonaceous Materials. Water Res. 2017, 124, 673–692. [Google Scholar] [CrossRef] [PubMed]
  50. Zhou, J.; Lou, Z.; Yang, K.; Xu, J.; Li, Y.; Liu, Y.; Baig, S.A.; Xu, X. Electrocatalytic Dechlorination of 2,4-Dichlorobenzoic Acid Using Different Carbon-Supported Palladium Moveable Catalysts: Adsorption and Dechlorination Activity. Appl. Catal. B Environ. 2019, 244, 215–224. [Google Scholar] [CrossRef]
  51. Zhou, J.; Lou, Z.; Wang, Z.; Zhou, C.; Li, C.; Ali Baig, S.; Xu, X. Electrocatalytic Dechlorination of 2,4-DCBA Using CTAB Functionalized Pd/GAC Movable Granular Catalyst: Role of Adsorption in Catalysis. Chem. Eng. J. 2021, 414, 128758. [Google Scholar] [CrossRef]
Figure 1. pHPZC determination for CNF-Cl and CNF-Cl-N samples. The mass of the carbon samples was 0.05 g, and the volume of solution was 10 mL.
Carbon 09 00098 g001
Figure 2. SEM (a,b) and TEM (c,d) images of the mosaic carbon product (CNF-Cl) obtained by the decomposition of TCE at 600 °C over Ni catalysts. Highlighted in yellow-the individual segments are closely spaced sheets of graphene.
Carbon 09 00098 g002
Figure 3. SEM (a,b) and TEM (c,d) images of the segmented carbon product (CNF-Cl-N) obtained by the decomposition of TCE and AN at 600 °C over Ni catalysts. Highlighted in yellow-the individual segments are closely spaced sheets of graphene.
Carbon 09 00098 g003
Figure 4. XRD patterns for the synthesized CNF-Cl and CNF-Cl-N samples.
Carbon 09 00098 g004
Figure 5. Pore size distribution for the CNF-Cl and CNF-Cl-N samples.
Carbon 09 00098 g005
Figure 6. XPS survey spectra for CNF-Cl and CNF-Cl-N samples.
Carbon 09 00098 g006
Figure 7. XPS spectra of (a) Cl2p, (b) N1s, (c) O1s, and (d) C1s regions for CNF-Cl and CNF-Cl-N samples.
Carbon 09 00098 g007
Figure 8. Model of 2,4-DCBA in molecular (left) and ionic (right) forms, visualized using the Avogadro program. The models are color-coded based on electrostatic surface potentials, with negative and positive charges represented by red and blue colors, respectively, and neutral residues shown in gray.
Carbon 09 00098 g008
Figure 9. Experimental adsorption isotherms of 2,4-DCBA on CNF-Cl and CNF-Cl-N samples at a natural pH.
Carbon 09 00098 g009
Figure 10. Functional groups on the surfaces of carbon materials in alkali and acidic medium.
Carbon 09 00098 g010
Figure 11. Experimental and fitted isotherms of 2,4-DCBA on the (a) CNF-Cl and (b) CNF-Cl-N samples.
Carbon 09 00098 g011
Figure 12. Variation of achieved adsorption capacities with pH for (a) CNF-Cl and (b) CNF-Cl-N samples.
Carbon 09 00098 g012
Table 1. Textural characteristics of the CNF-Cl and CNF-Cl-N samples calculated using BET analysis data.
SampleSSA, m2·g−1VΣpore, cm3·g−1Vmicropore, cm3·g−1Vmesopore, cm3·g−1Vmacropore, cm3·g−1 d - , nm
CNF-Cl3100.530.0250.350.1556.8
CNF-Cl-N2500.820.0170.410.39313.2
Table 2. Elemental composition of the surface for CNF-Cl and CNF-Cl-N samples (XPS data).
SampleContent, at%
CClNO
CNF-Cl98.10.23-1.6
CNF-Cl-N96.1-0.333.6
Table 3. Fraction of oxygen and carbon functional groups on the surfaces of CNF-Cl and CNF-Cl-N samples based on XPS data.
SampleFunctional Groups, % 1
C=CC-O, C-OH, C-O-CC=OO-C=O, COOH
CNF-ClO1s-70.929.1
C1s77.412.55.54.7
CNF-Cl-NO1s-59.240.8
C1s76.815.24.63.5
1 calculated by taking the total amount of carbon as 100% and oxygen as 100%.
Table 4. The degree of 1,2-DCBA dissociation at different pHs.
pH23459
Dissociation Degree, %17679599.5100
Table 5. Parameters for the monolayer capacity (A0), the achieved adsorption capacity (A), and the pore filling (F) for 2,4-DCBA on the CNF-Cl and CNF-Cl-N samples at different pHs.
SampleA0, mmol·g−1Natural pH 1pH = 2pH = 3pH = 4pH = 5pH = 9
A 2, mmol·g−1F, %A 2, mmol·g−1F, %A 2, mmol·g−1F, %A 2, mmol·g−1F, %A 2, mmol·g−1F, %A 2, mmol·g−1F, %
CNF-Cl0.632.32552.1501.64391.28301.05250.225
CNF-Cl-N0.52.29351.32200.98150.87130.66100.152.3
1 at maximum. 2 standard deviation was with accuracy of ±3%.
Disclaimer/Publisher’s Note: The statements, opinions and data contained in all publications are solely those of the individual author(s) and contributor(s) and not of MDPI and/or the editor(s). MDPI and/or the editor(s) disclaim responsibility for any injury to people or property resulting from any ideas, methods, instructions or products referred to in the content.

