Article

A Grand Canonical Monte Carlo Simulation for the Evaluation of Pore Size Distribution of Nuclear-Grade Graphite from Kr Adsorption Isotherms

by
Giuliano M. Laudone
* and
Katie L. Jones
Faculty of Science and Engineering, University of Plymouth, Plymouth PL4 8AA, UK
*
Author to whom correspondence should be addressed.
Submission received: 17 July 2023 / Revised: 18 August 2023 / Accepted: 23 August 2023 / Published: 4 September 2023
(This article belongs to the Special Issue Adsorption on Carbon-Based Materials)

Abstract

:
Characterizing materials with low surface areas or with very small sample sizes requires innovative approaches beyond traditional N 2 and Ar adsorption measurements. The measurement of Kr adsorption isotherms is often employed to serve this purpose, yet its potential remains limited by the lack of models for the interpretation of the experimental results in terms of pore size distribution. In this work, simulated adsorption isotherms of Kr onto graphite in slit-shaped pores are generated with a Grand Canonical Monte Carlo method. The pore size distributions of nuclear-grade graphite samples and activated carbon are modelled by fitting simulated isotherms to the experimental data. The resulting distributions are favourably compared with those generated by commercially available modelling packages, based on the use of N2 adsorption isotherms using GCMC and BJH methods. The new GCMC-Kr kernel developed in this study offers an alternative method for the evaluation of the distribution of pore sizes in nuclear graphite and other low surface area materials, which can be employed when N2 and Ar adsorption measurements cannot be carried out.

1. Introduction

Low-temperature gas adsorption isotherms, in conjunction with the BET (Brunauer, Emmett and Teller) method, have long been used as a standard procedure for the evaluation of the surface area of solids [1,2]. N2 at its boiling point of 77.4 K is the standard adsorptive of choice for surface area characterization [3,4,5]. Ar and CO2 adsorption at 87.3 K and 273 K, respectively, can be used in the study of materials with pores smaller than 1 nm. In the case of very low surface area materials, such as nuclear grade graphites, Kr adsorption is measured at 77.4 K [6,7]. Historically, it has been shown that the adsorption of Kr onto graphite surfaces at temperatures below its triple point results in the formation of isotherms that display several clearly defined steps [8,9,10]. More recently, this stepwise adsorption isotherm, has been attributed to the phase transitions which occur during the formation of successive adsorption layers, and has been the object of extensive experimental and modelling studies [11,12,13,14,15].
Gas adsorption data can be used for the calculation of the pore size distribution (PSD) of porous materials. In the case of mesoporous solids, capillary condensation takes place in the pores; using a modified Kelvin equation to describe the liquid-vapour equilibrium in the pore volume, it is possible to perform PSD calculations, as in the Barrett, Joyner and Halenda (BJH) method [16]. Modern methodologies, such as the Non-Localized Density Functional Theory (NLDFT) [17,18,19] and Grand Canonical Monte Carlo (GCMC) [14,20,21,22], represent an alternative approach for the evaluation of PSD from gas adsorption data. Gas adsorption and phase equilibria in simulated porous materials with various pore geometries, such as cylinders, hexagonal pores, wedges and slits can be investigated using GCMC [11,14,23,24]. The advantage of the NLDFT and GCMC approach over more traditional calculations of PSD is that one single method is able to investigate the distribution of pore sizes in the micro-, meso- and macroporous range, from 0.4 nm to 150–200 nm. As explained in more detail in the Modelling section, these methodologies simulate the adsorption of gases in pores of well-defined and simplified shapes (such as slits or cylinders) over a range of sizes and pressure at set values of temperature. The set of isotherms generated is called kernel. The experimental adsorption data are fitted to the kernel’s simulated ones in order to obtain a PSD representative of the material under investigation. GCMC simulations are ideally suited for the study of adsorption on porous and non-porous solids [25]. Other authors [26,27,28] have used GCMC methods for the simulation of N2 and Ar on graphite and Kr, Ar and Xe on graphene [29]. Siderius and Shen [30] adopted a modified GCMC model for the simulation of CO2 interactions with a metal-organic framework, showing how GCMC simulations can successfully model adsorption in capillaries where phase transitions can occur. Whereas, Prasetyo et al. [14] applied GCMC simulations of Kr on non-porous graphite to study the observed second layer horizontal hysteresis, brought about by the continuous densification and re-ordering of the adsorbate during analysis. The PSD of carbon materials can be obtained from N2, CO2, Ar and H2 adsorption data [31,32,33].
Modelling tools for PSD interpretation of adsorption isotherms of N2, CO2 and Ar on solid materials such as graphite, zeolites and silica, are now included in the software distributed by gas adsorption instrument manufacturers which include suitable GCMC- or NLDFT-generated kernels that can be used to fit experimental data. However, when working with low surface area material, such as nuclear grade graphite, it may not be possible to achieve reliable and reproducible adsorption data from these gases, and analysis with Kr becomes the only viable option [4,7,34]. This is particularly true in the case of samples with size that cannot be easily modified, as in the case of irradiated materials. The PSD characterization of these low surface area materials cannot be carried out using commercially available software packages, as these usually do not include a kernel of Kr adsorption isotherms. In this work, we constructed a kernel of Kr simulated adsorption isotherms for pore sizes from 0.87 to 147 nm using a GCMC method, and the pore size distributions of graphite and activated carbons are generated by fitting the experimental isotherms to the kernel of simulated ones. The resulting PSDs are validated against those obtained from N2 data and the corresponding kernel found in commercial software. The method presented in this work allows for the evaluation of PSD for samples that could not be reliably characterised using other adsorptives, such as N2.

2. Materials and Methods

The adsorption isotherm of Kr onto a non-porous graphitized carbon black (GBC) was studied in order to validate the chosen model of the interactions between gas particles and the graphite’s solid surface. The GCB was supplied by MicrotracBEL (Osaka, Japan) and is used as the standard calibration sample for the gas adsorption instrument. Its specific surface area is 49.52 ± 1.5 m 2 g 1 .
Two different nuclear graphite grades, IG110 and IG430, produced by Toyo Tanso Ltd., Osaka, Japan, were chosen as examples of low-surface area graphite materials of industrial interest. IG110 and IG430 are fine-grained, isotropic graphites which exhibit high thermal durability and strength and are consequently candidates for use as a moderating and structural material in the core of Generation-IV nuclear reactors. The density and porosity values of these nuclear graphites can be found in the Supplementary Information in Table S1. The characterization of the porous space of nuclear-grade graphites is a complex endeavour [35,36,37]. The complex porous structure of these polycrystalline materials can be seen in the scanning electron micrographs provided in the Supplementary Information in Figures S1 and S2. These show porous features as large as tens of μ m, too large to be characterized by gas adsorption, and previous studies [36] identified a pore size distribution centered around 2 μ m. However, a small volume percentage of features in the meso- and micro-porous range are also present, and these are the focus of this work. Despite its difficulties, reaching a better quantitative understanding of nuclear graphite’s voids, including the small percentage of pores and cracks smaller than 100 nm, and of their evolution as irradiation and oxidative phenomena take place, is highly important to correctly predict the ageing of graphite components in a nuclear reactor [38]. It is often difficult to obtain large amounts of irradiated nuclear graphite samples, and the more traditional N2 adsorption fails to produce reliable isotherms on small amounts of such low surface area materials. The use of Kr and the GCMC-generated kernel developed in this study offer a valid alternative for the characterization of these types of samples.
Finally, in order to evaluate the applicability of the method presented in this work to carbon materials with higher surface area, a sample of activated carbon (AC) Darco KB 100 mesh (Aldrich, Dorset, UK) was also characterized using the methodology described in the following section.

2.1. Experimental

All samples were dried under vacuum for a minimum of 3 h at 305 °C using the BELPREP II-vac (MicrotracBEL, Japan) in order to remove all traces of moisture from their pore volume. Adsorption and desorption isotherms of N2 and Kr at 77.4 K were obtained using a BELSORP-Max instrument (Microtrac-BEL, Japan). The system is fitted with three pressure transducers with scale ranges of 0.0133 kPa, 1.33 kPa and 133 kPa, respectively. This allows for high-resolution measurements to be obtained over extremely low relative pressure regions. N2 isotherms were measured for pressures up to 101 kPa. Kr adsorption data were measured for pressures up to around 220 Pa. This is a much lower value of maximum relative pressure compared to that reached during N2 measurements. Beyond this pressure, at the temperature used in these experiments, which is below the triple point of Kr, condensation takes place in the porous structure of the samples, and adsorption measurements are no longer reliable. GCB was characterized using only Kr adsorption, while the graphite samples and the activated carbon were analyzed using both gases. In order to overcome the issues associated with the acquisition of a reliable N2 adsorption measurement for low surface area materials, a large amount of sample, in excess of 3 g, was analyzed using a large sample chamber with a volume of 5 cm 3 . This was possible because the samples under investigation were unirradiated virgin graphite samples, so sample size and availability were not an experimental constraint. Standard sample chambers, employed in the case of materials with higher surface area, have a volume of 1.8 cm 3 . For each sample, 3 replicate measurements were carried out.
N2 adsorption isotherms were used as input to the BELMaster software (Microtrac-BEL, Japan), which provides several models for the evaluation of the surface area and PSD, including BET, BJH modelling of cylindrical mesopores and GCMC simulation of N2 onto slit-shaped graphite micro- to macropores. Kr adsorption isotherms were modelled using the GCMC simulation described in the following section.

2.2. Modelling

In this work, simulated adsorption isotherms of krypton confined into slit-shaped pores were generated using a Grand Canonical Monte Carlo method, described in greater detail elsewhere [39,40]. While pores of different shapes could be present in carbonaceous materials [41,42], the pore shape chosen in this work is consistent with work by Dubinin and Plavnik [43], which shows that activated carbons obtained from vegetable feed consist of nanocrystalline carbon. Analysis of the results of N2 adsorption/desorption hysteresis on graphite, presented in Section 3, supports the choice of pore shape adopted in this study [36].
A simulation box with periodic boundary conditions in the x and y directions and with planar solid walls delimiting its width in the z direction is in equilibrium with a reservoir of gas particles. The volume V, temperature T and chemical potential μ of the system are set. The system is in equilibrium with an infinite reservoir of particles, and the pressure P is calculated from the chemical potential using the bulk equation of state of the ideal gas [44]. The GCMC algorithm generates a large number of system configurations with a Markov chain process of random insertion, removal or translation of fluid particles in the simulation box. The probability of each move being accepted is determined by the potential energy change of the system caused by the move.
Krypton is modelled using a Lennard-Jones 12–6 potential: the interaction between 2 fluid particles, i and j, is given by:
u i j ( r i j ) = 4 ϵ K r K r σ K r K r r i j 12 σ K r K r r i j 6
where r i j is the distance between the 2 fluid particles, ϵ K r K r is the potential well depth and σ K r K r is the kinetic collision diameter. The cut-off distance for the LJ potential is set as 5 σ K r K r .
Sophisticated models of adsorbent-adsorbate interaction potentials, taking into account electrostatic and induction effects, have been developed [45]. However, in this work, due to the non-polar nature of Kr, the interaction between each fluid particle i and a solid graphite plane wall is modelled with a Steele 10-4-3 potential [46]:
u i w ( z i ) = 2 π ρ C ϵ K r C σ K r C 2 Δ 2 5 σ K r C z i 10 σ K r C z i 4 σ K r C 4 3 Δ ( 0.61 Δ + z i ) 3
where ρ C = 114 nm 3 is the density of carbon atoms per unit volume of a graphene layer, Δ = 0.335 nm is the distance between adjacent graphitic layers making up the graphite wall and z i is the distance of a gas particle i from the solid wall. The potential parameters ϵ K r C and σ K r C of the solid-fluid interaction are calculated from the parameters of the Kr–Kr and C–C interactions using Lorentz-Berthelot mixing rules. The values of the potential parameters used in the GCMC calculations are shown in Table 1.
In the case of a slit-shaped pore, there are two walls and the total potential due to the interaction between a gas particles and the graphite solid walls is given by:
U i w ( z i ) = u i w ( z i ) + u i w ( H z i )
where H is the distance between the carbon centres across the pore. The effective pore width accounts for the reduction in accessible pore volume caused by the physical size of the carbon atoms in the pore walls:
H = H 2 z 0 + σ K r K r
where z 0 is the distance of closest approach of the adsorbate to the solid wall, calculated as the root of the adsorbate-solid wall potential equation [31,47].
Following a similar approach to that of Miyahara et al. [48], the simulation box has dimensions 70 σ K r C , 10 σ K r C and H in the x, y and z direction respectively. Initial attempts to run less time-consuming simulations with a smaller number of equilibration and sampling steps (between 10 4 and 10 5 each) resulted in poorly simulated adsorption isotherms, as evidenced by the decrease of the adsorptive capacity with an increase in pressure at some pressure points, and by poorly defined adsorption step-wise behaviour. This is caused by the large number of rejected insertion/deletion attempts during equilibration and sampling. In this work, the simulation of each data point of each adsorption isotherm was run for 2 × 10 6 equilibration steps, followed by 5 × 10 6 sampling steps.
Fitting the experimental adsorption isotherm to the simulated kernel in order to determine the PSD is an ill-posed discrete optimization problem: the adsorption isotherm integral equation is [33]
b ( P ) = H min H max K ( H , P ) x ( H ) d H
where b ( P ) is the experimental adsorption isotherm, K ( H , P ) is the kernel of simulated isotherms for different pore sizes H and x ( H ) is the pore size distribution. The work by Herdes et al. [49] details the numerical procedure needed in order to achieve a physically meaningful solution to this inversion problem by employing the Tikhonov regularization method.
In this work, the optimal PSD was obtained using CVXPY [50], a Python library for the resolution of convex optimization problems.

3. Results and Discussion

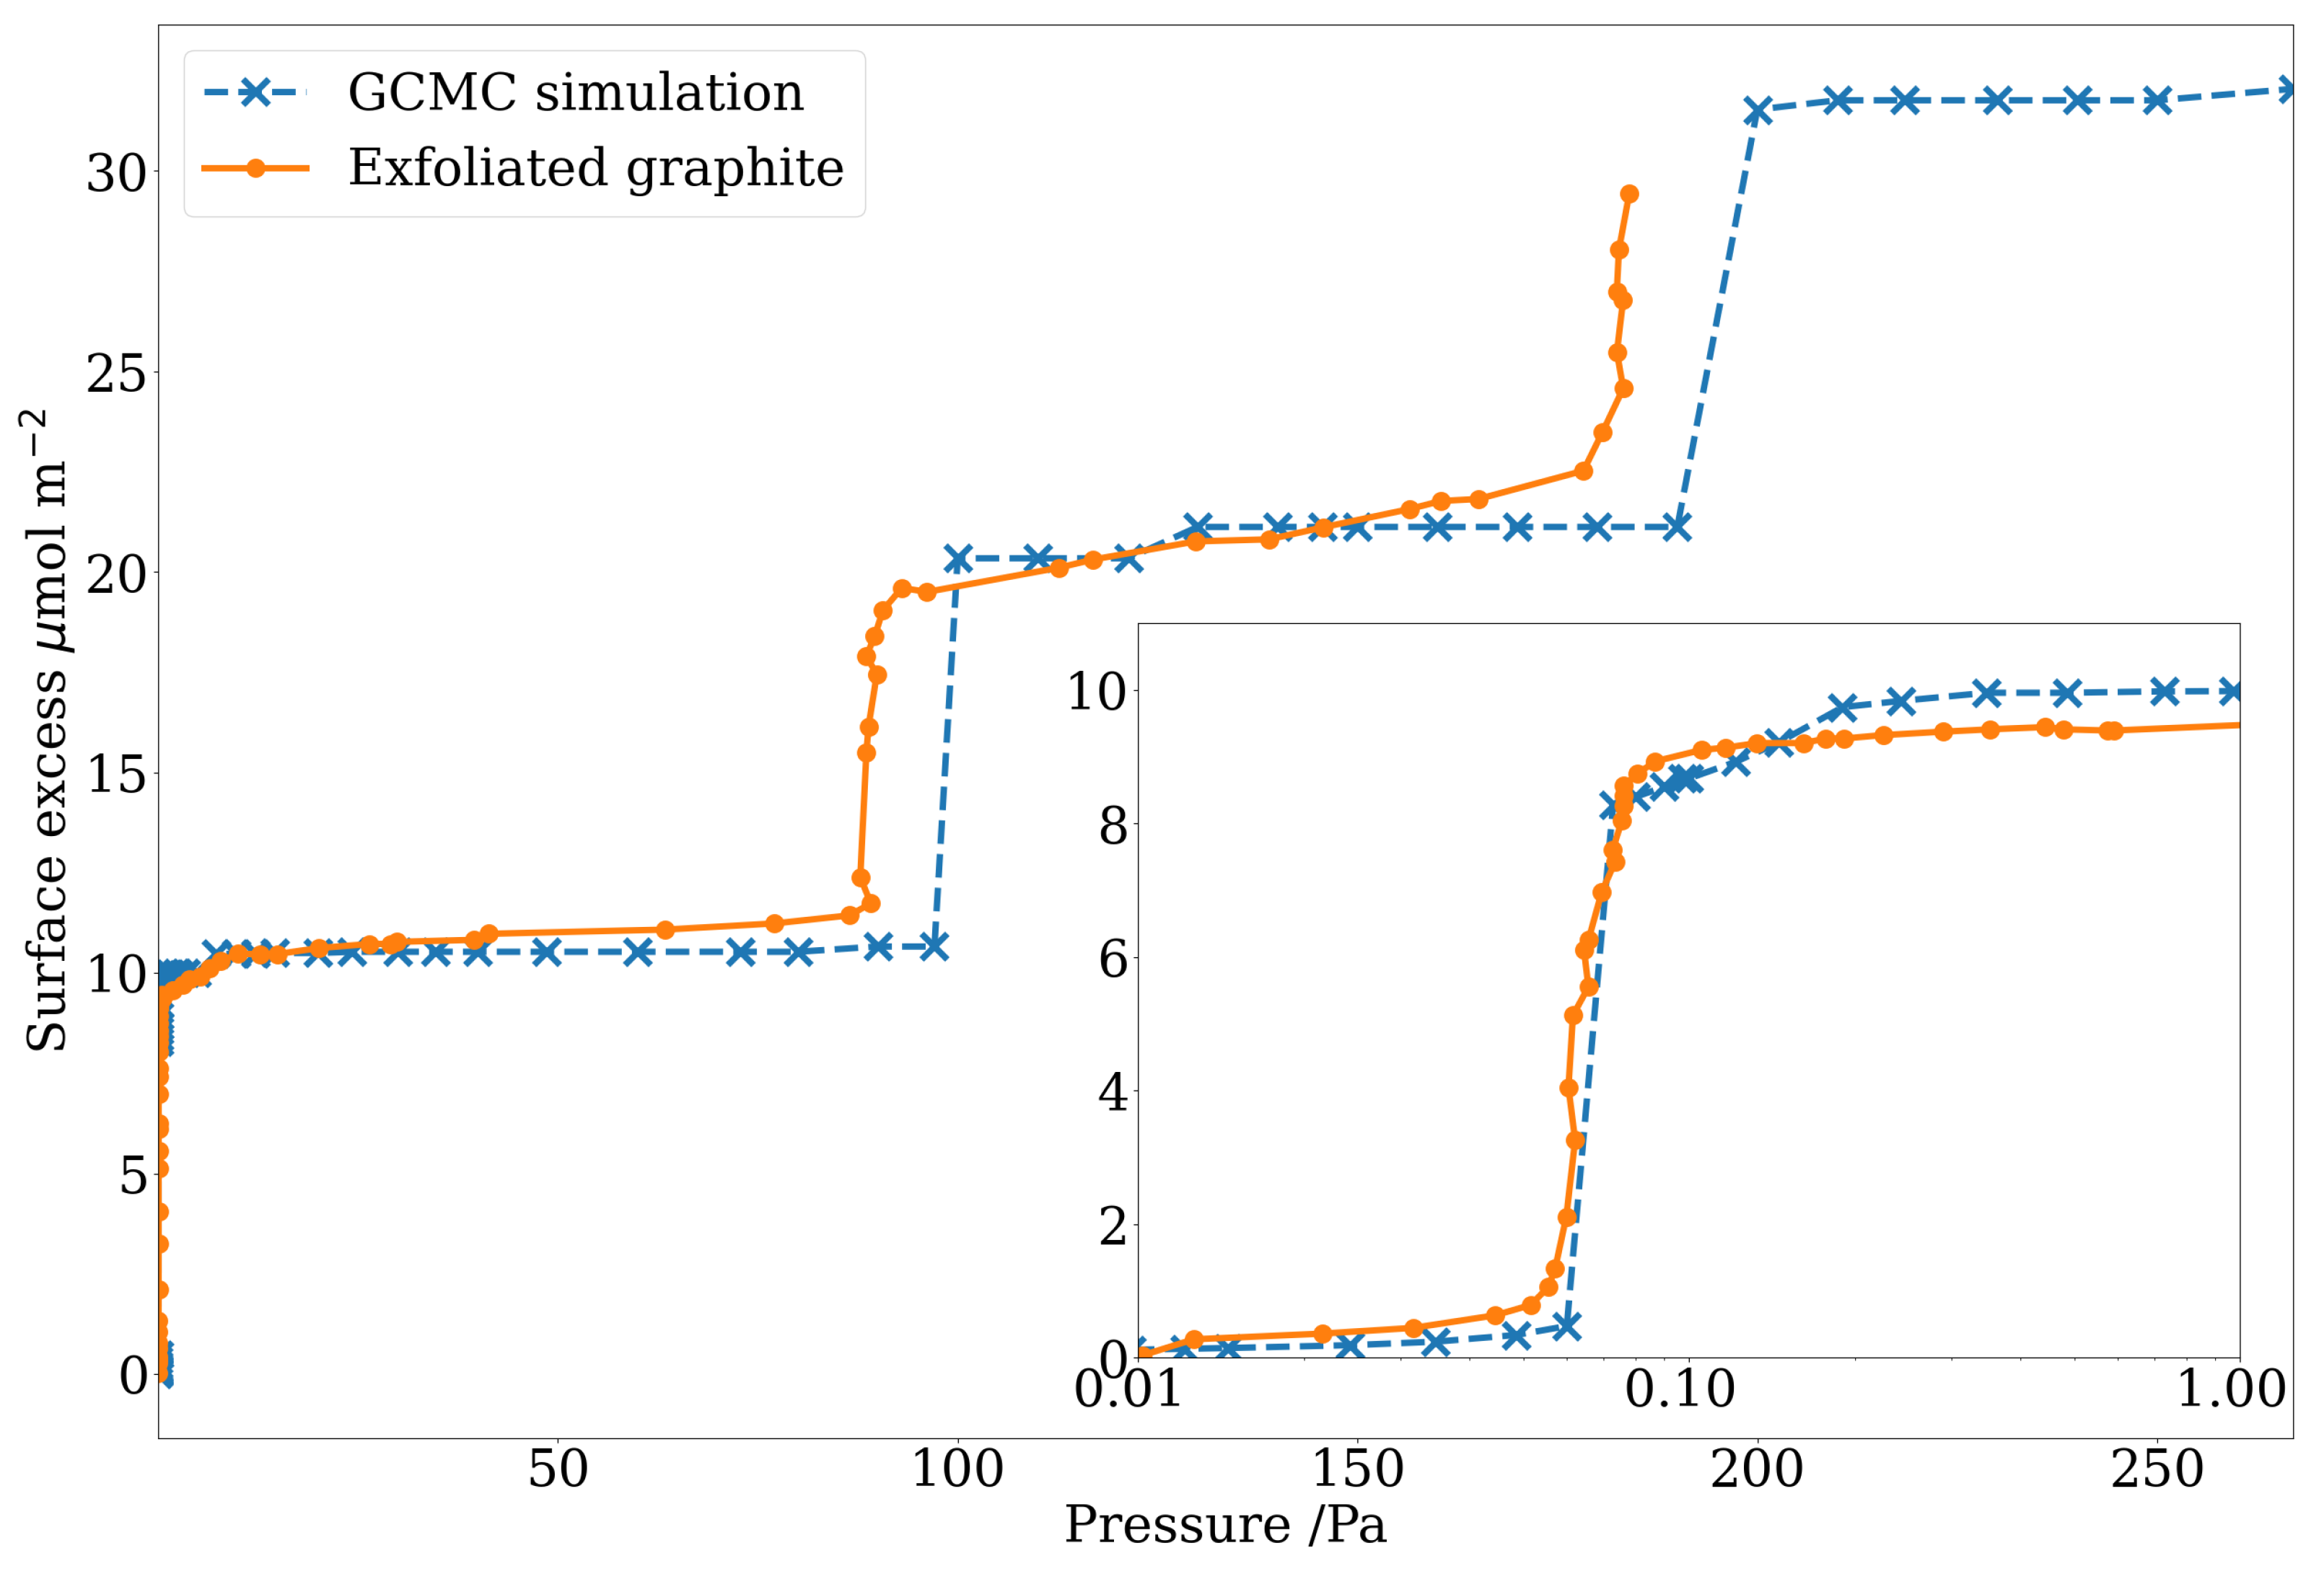
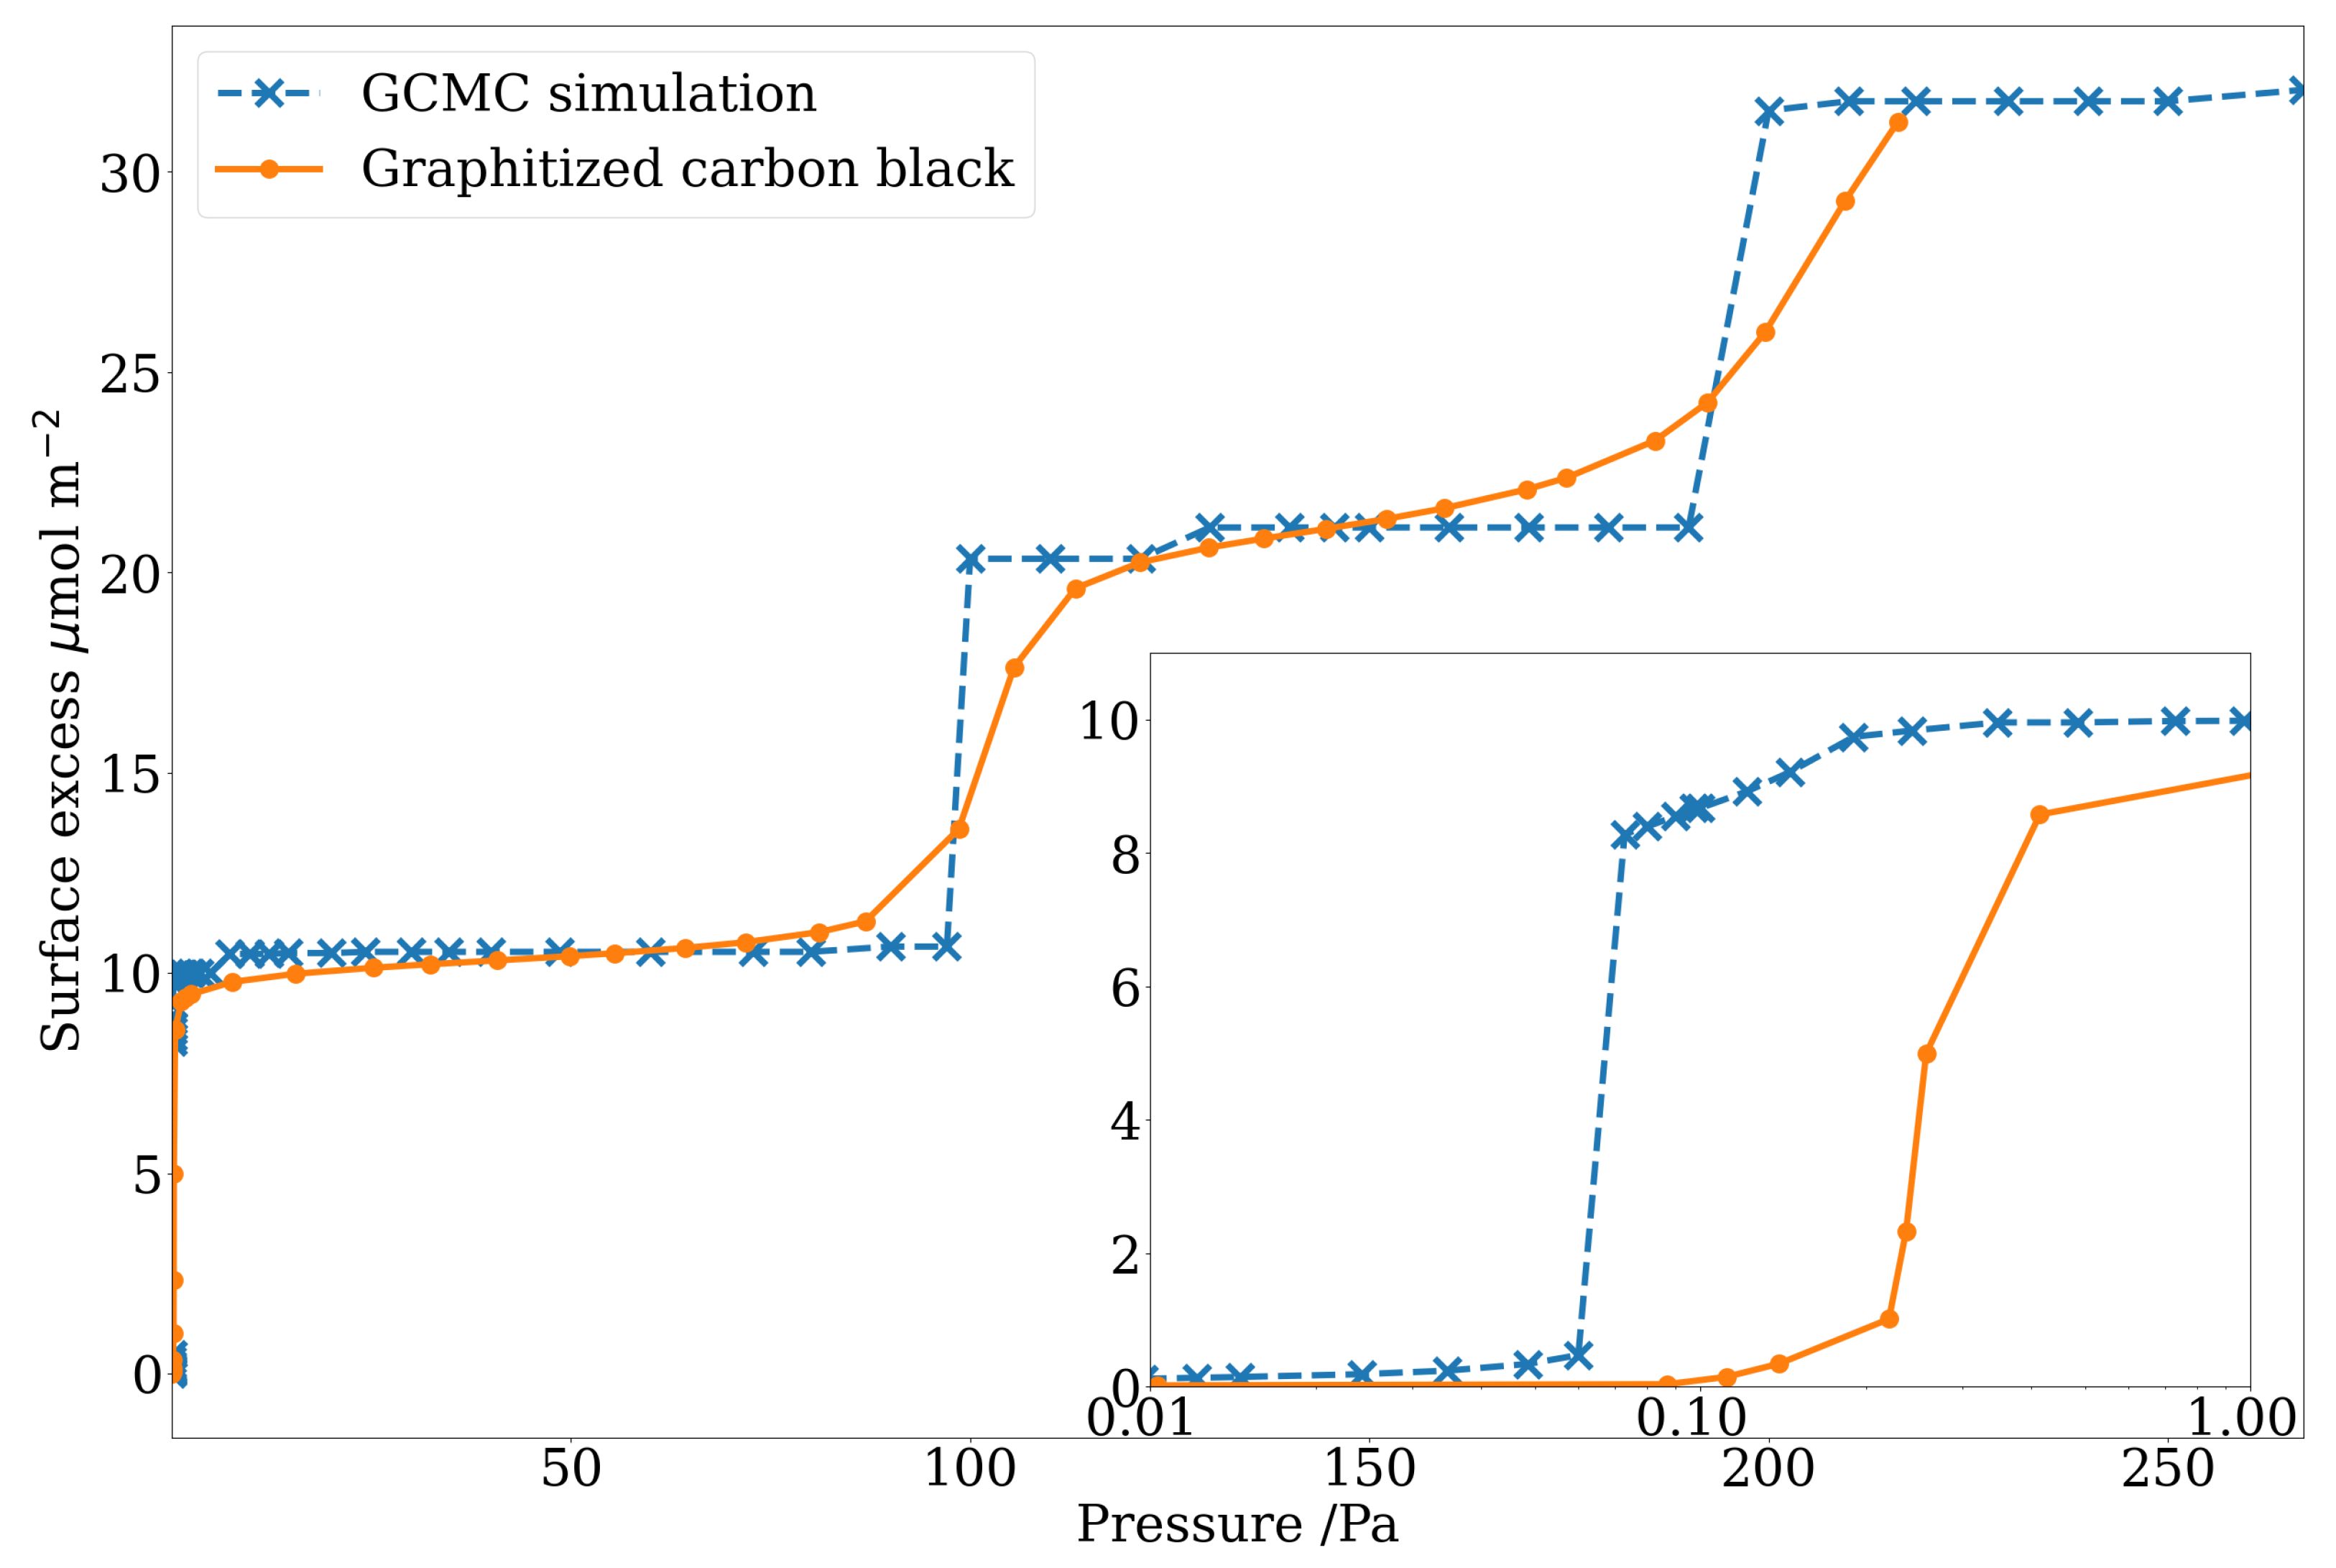
3.1. Interaction between Kr and Graphite

The results of GCMC adsorption simulations are strongly dependent on the potential chosen to describe the interaction between adsorbent and adsorbate, and on the values of the potential parameters. Therefore, an initial validation of the chosen potential and parameters (described in Section 2.2) was carried out. A GCMC simulation of Kr adsorption on a single graphite surface, modelled using the Steele potential, produced an adsorption isotherm that was compared to historical data on exfoliated graphite [9,51], shown in Figure 1. The modelling results were also compared to data obtained experimentally on non-porous graphitized carbon black, Figure 2. Figure 1 shows an excellent agreement between the simulated and experimental data at very low pressure, as the modelled data correctly predict the formation of the first adsorption layer. As the pressure increases, the modelled system shows the formation of a second and third adsorption layers, closely matching those of the experimental data. A similar situation can be observed in Figure 2; in this case, a minor discrepancy in the pressure onset of the first adsorption layer, while the model’s predictions of the second and third adsorption steps are in very good agreement with the measurements carried out on GCB.
The differences between the experimental and modelled adsorption isotherms can be explained by taking into account factors not included in the simplified structureless Steele potential, such as the presence of nano-scale void features between the graphite crystallites [11,13] and the apparent porosity created by the packing of the GCB. The Steele potential does not directly account for the interactions between each C atom on the graphite surface and each Kr atom in the fluid phase; however, the chosen potential is able to quantitatively model the step-wise behaviour of the adsorption of Kr on a non-porous graphite material, successfully simulating the 2-D transitions occurring as the successive adsorption layers are formed. It is also computationally faster than an explicit atomistic representation of the solid phase, which also supports its use in this work.

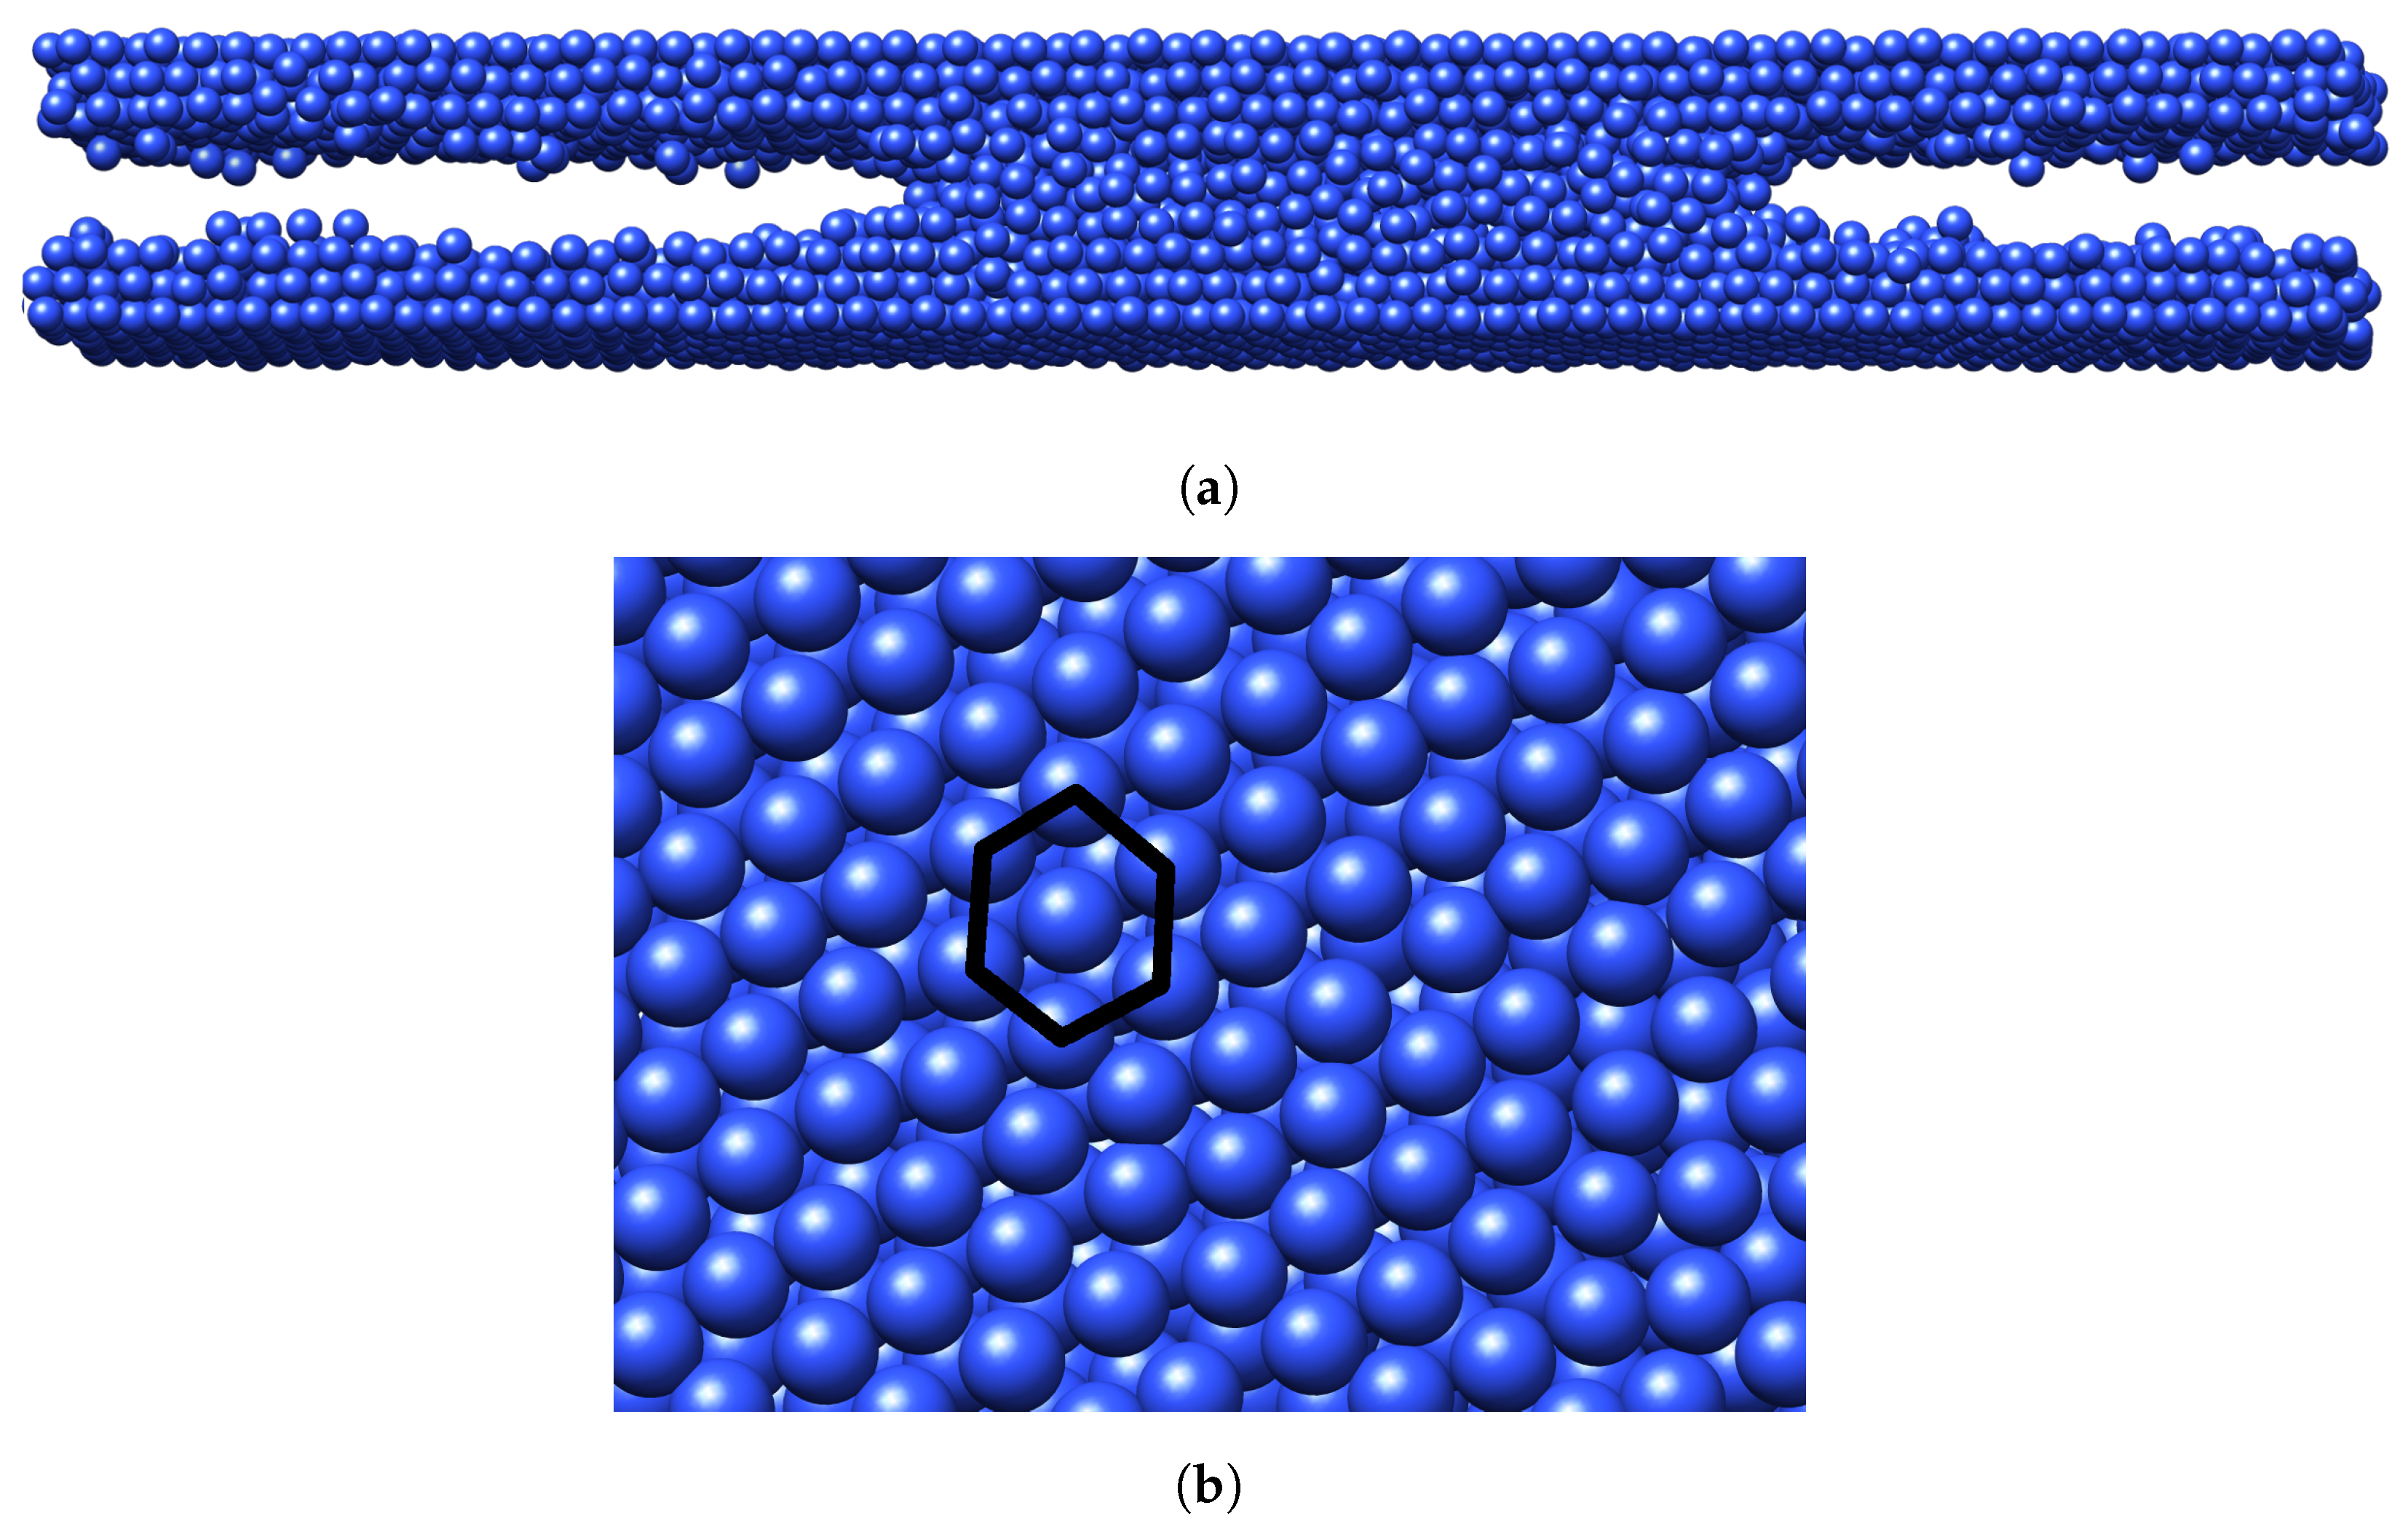
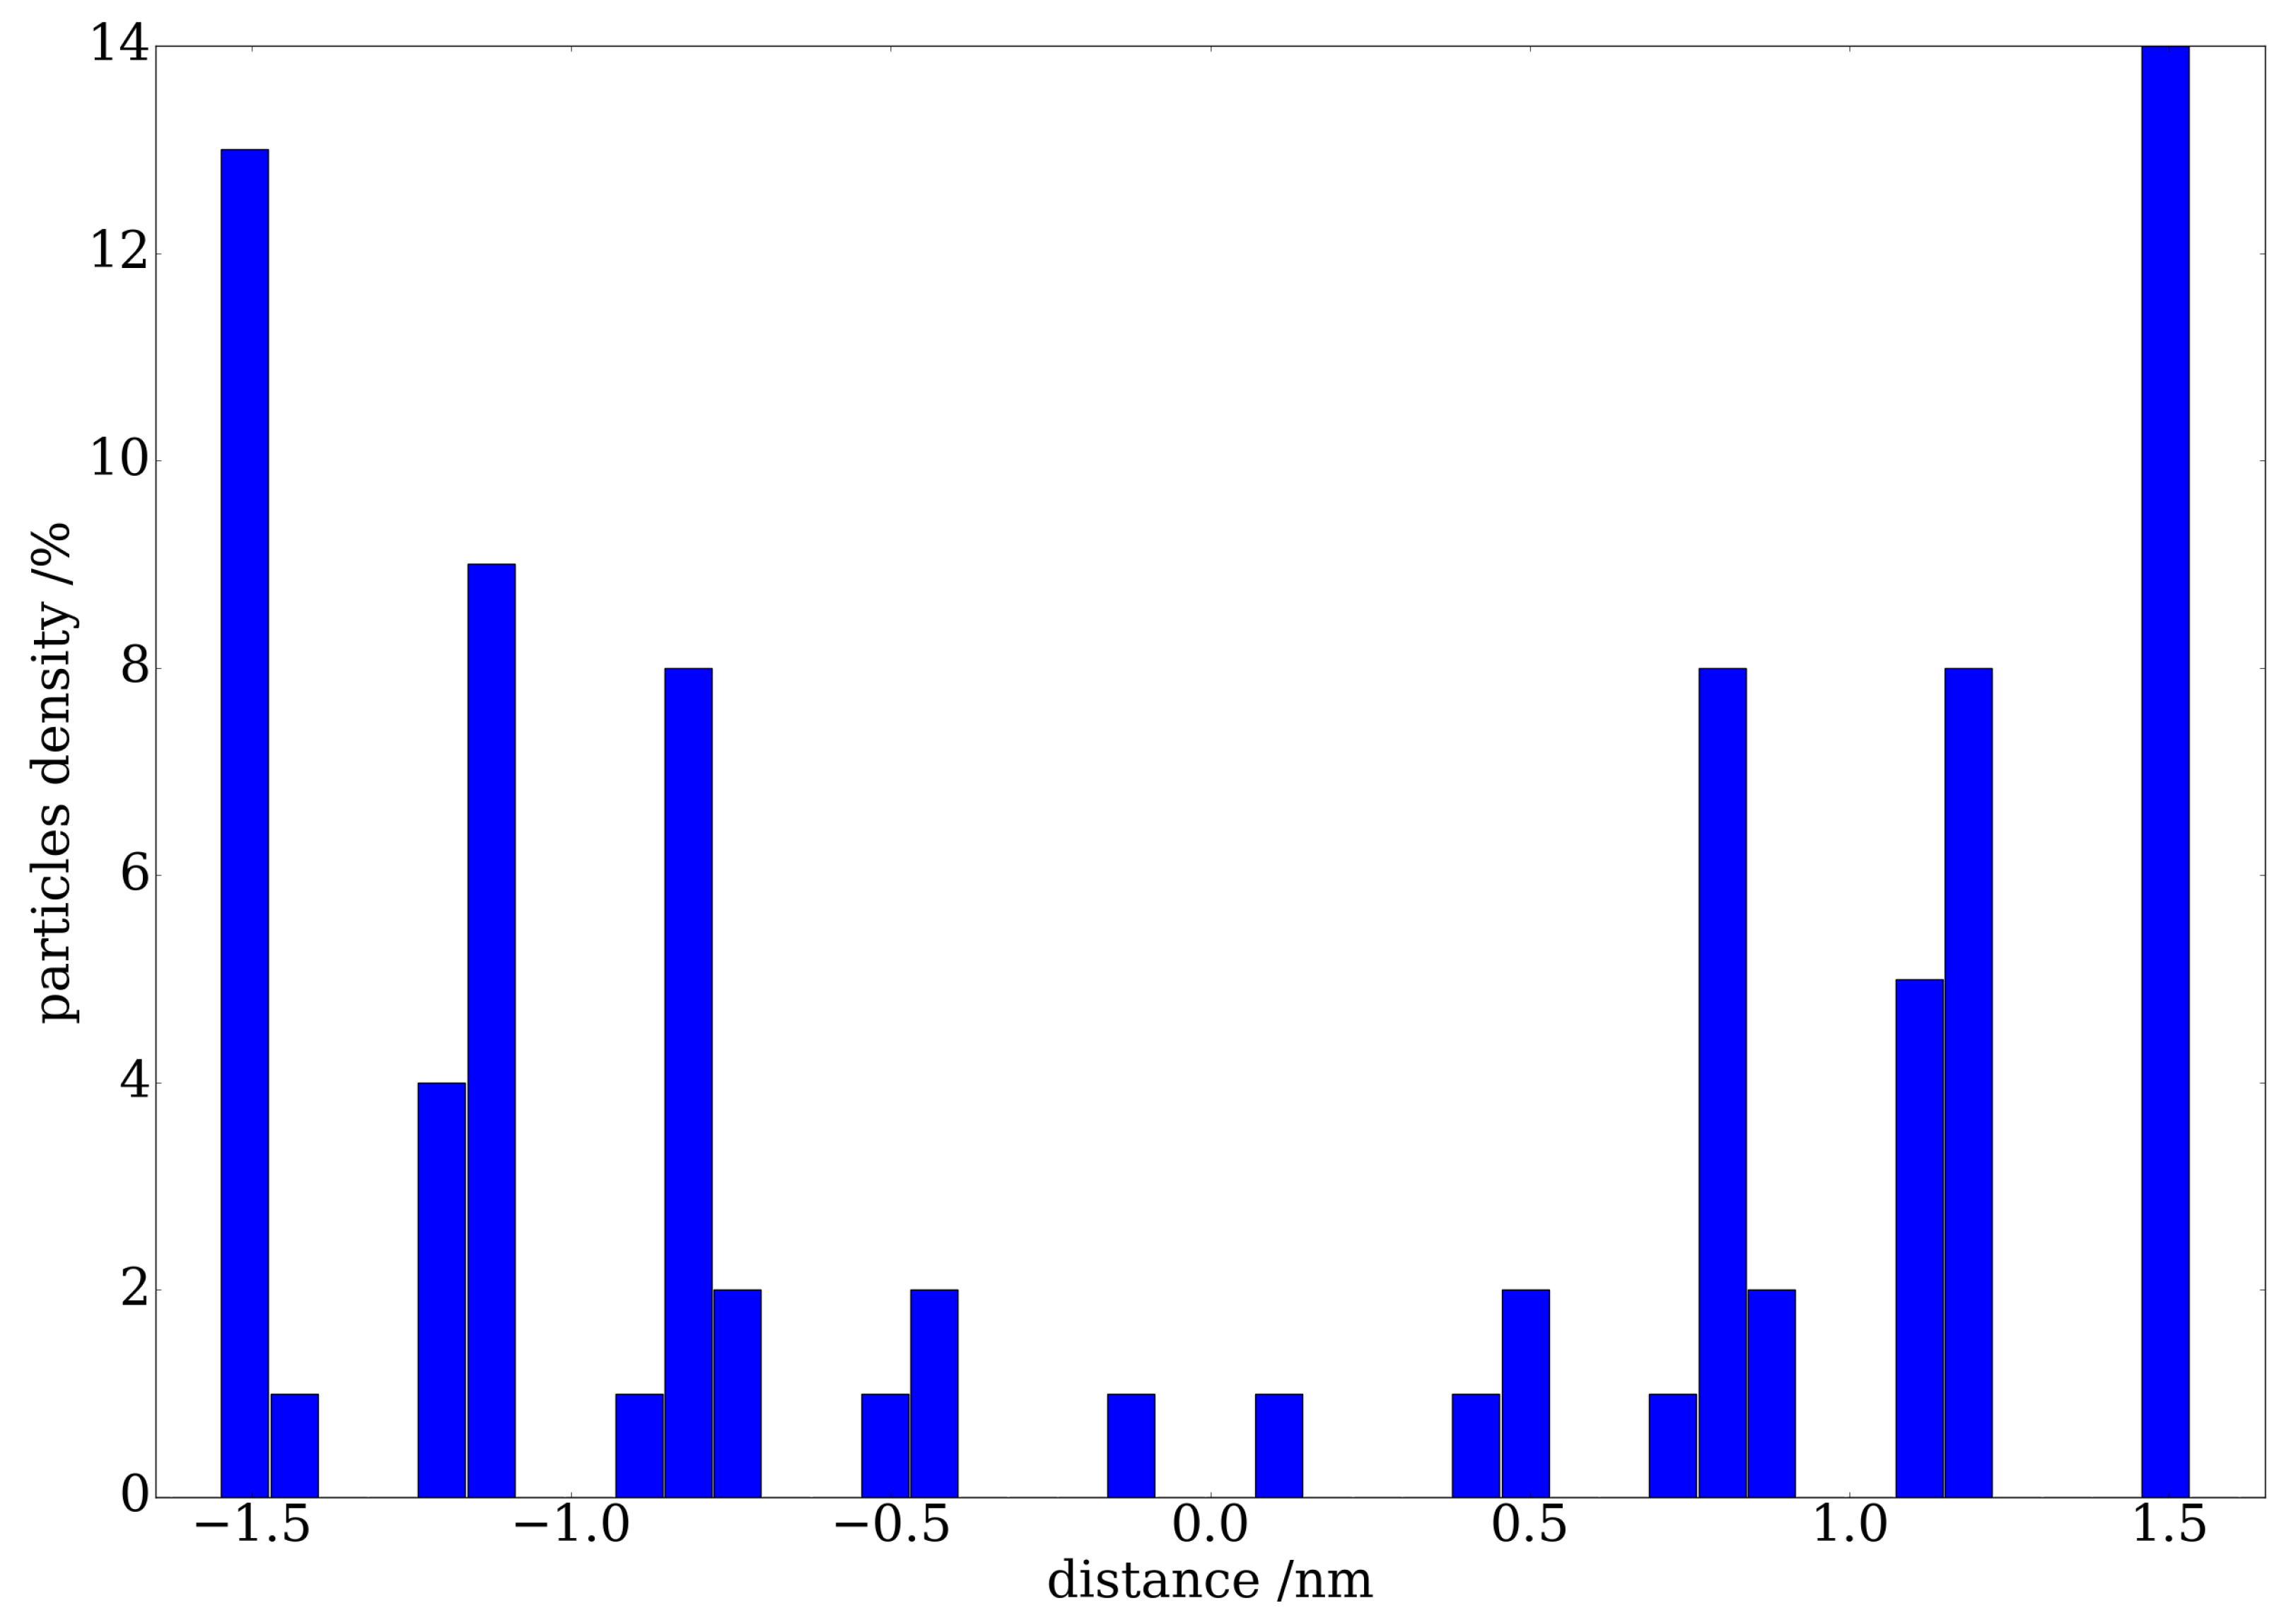
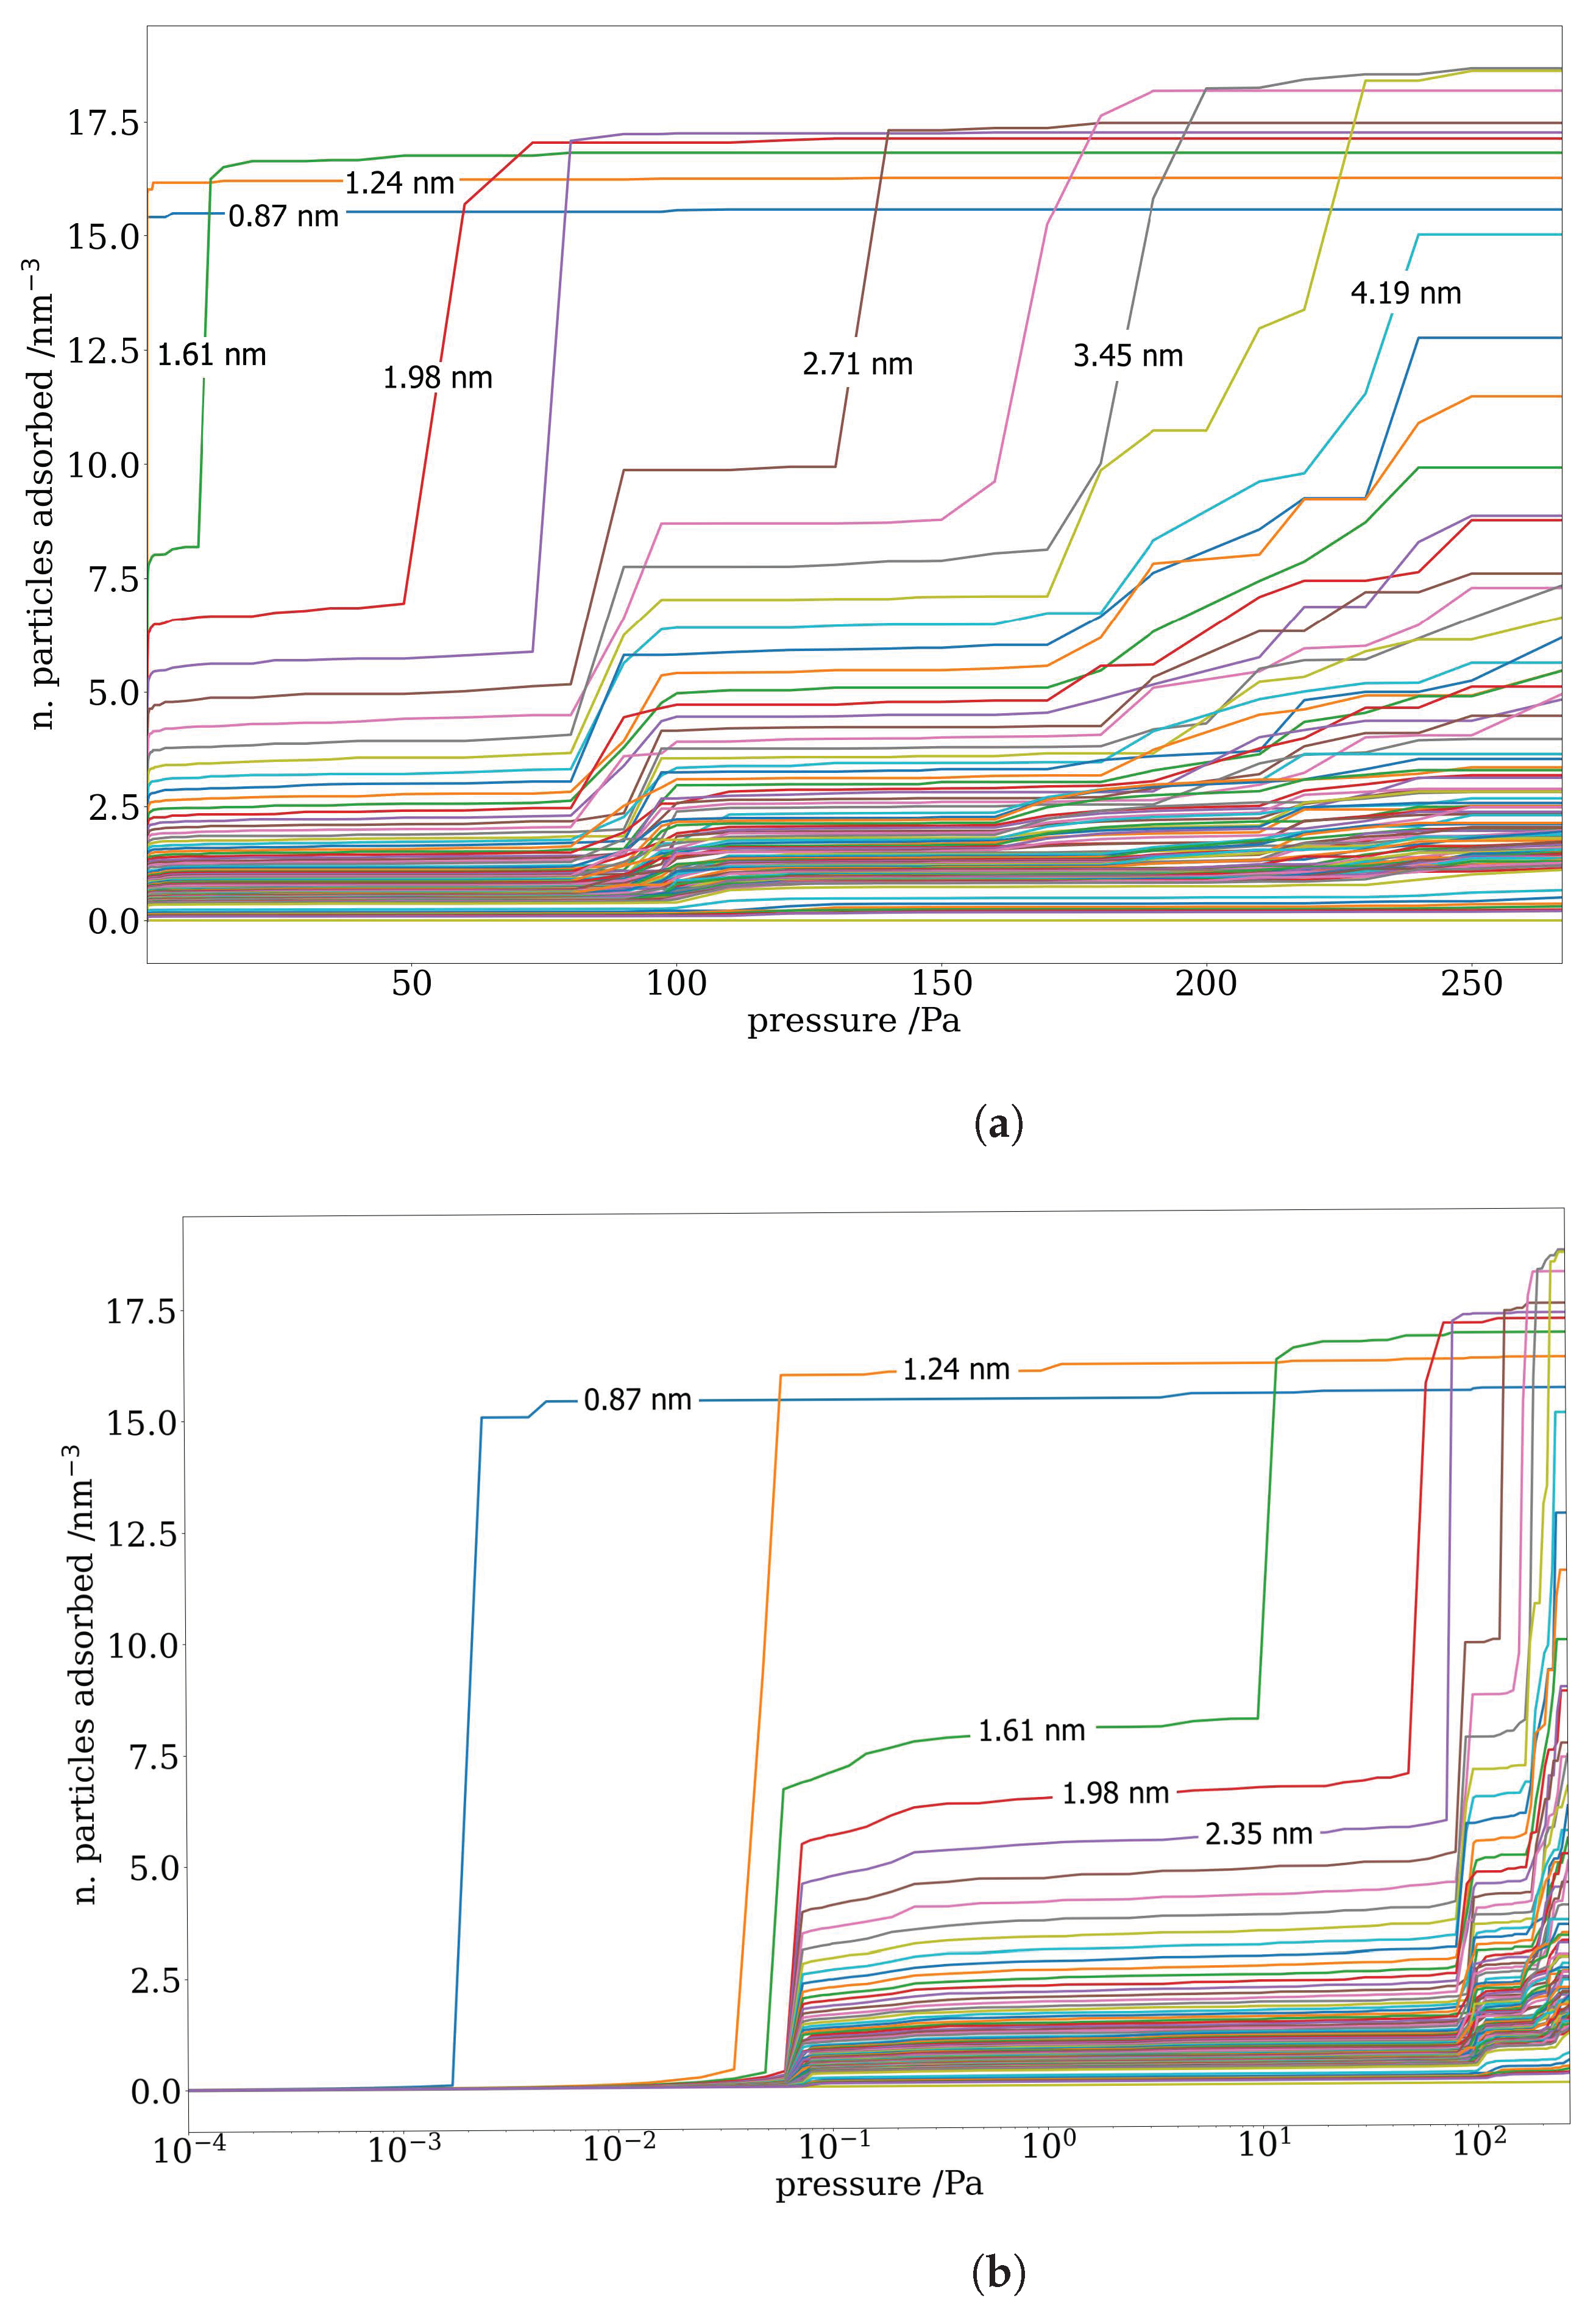
3.2. Slit Pores and GCMC-Generated Kernel

A set of adsorption isotherms for slit-pores was constructed. This comprises 95 isotherms covering pore sizes from 0.87 to 147 nm, each simulating adsorption at 75 pressure values and a temperature of 77.4 K, matching the temperature of the experimental adsorption isotherms. Figure 3a shows Kr adsorption within a simulated slit pore of width 3.7 nm at a pressure of 260 Pa. In order to clearly visualize the Kr particles, the pore walls are not shown in the Figure. It is possible to observe how Kr formed highly ordered layers on top of the pore walls, with localized structures that can be clearly recognized as close hexagonal packing in the x y plane, shown in Figure 3b. As well as the initial 2-D transitions corresponding to the multi-layer adsorption of Kr onto the graphite walls, Figure 3a shows the formation of a liquid bridge with 2 menisci. This is in agreement with the simulations shown in the work of Miyahara and Tanaka [24], who observed the formation of a simulated liquid bridge of N2 in graphite pores. In their work on phase equilibria in confined spaces, they adopted a potential field which linearly decays to zero at the extremities of the simulation cell. This results in a liquid bridge centred in the middle of the simulation volume, where the full potential field acts, and it allows for the precise evaluation of liquid-vapour equilibrium in the pore. The liquid bridge in Figure 3a is not perfectly centred in the middle of the pore along the x axis, as in this work, the full potential field acts over the entire simulation cell; however, the focus of this work is on the evaluation of PSD distribution from Kr adsorption data and not the study of phase equilibria, and extending the full field potential to the entire simulation volume was considered to be a suitable approach.
The local density of Kr particles as a function of their distance in the z direction from the centre of the pore is shown in Figure 4. The density distribution follows the trend shown by other authors [22,24,32], with clearly identified peaks where the successive adsorption layers form. The distance between the peaks is close to krypton’s kinetic collision diameter σ K r K r .
The 95 isotherms forming the GCMC-generated kernel constructed for this work are shown in Figure 5. The vertical axis shows the number of gas particles adsorbed per unit volume of the pore, while the horizontal axis shows the gas pressure. As the narrowest pores can only accommodate one layer of Kr particles within their void volume, they display one single sharp adsorption step, occurring at increasing pressure values for increasing pore width. In particular, the pore with a width of 0.87 nm, the narrowest in this kernel, is entirely filled with Kr even at very low pressure, and its adsorption isotherm is a nearly horizontal straight line. This suggests that, for narrow micropores smaller than 0.87 nm, the simulation method is not sensitive enough, and such pores should not be included in the kernel for the evaluation of PSD of porous materials. Intermediate pore sizes show a reduction in the magnitude of the first adsorption step. However, a second and, as the pore width increases, a third adsorption step become clearly visible, showing the formation of successive adsorption layers. At larger pore sizes, the interactions with the pore walls only affect the particles closer to the solid surfaces, while the particles in the central part of the void volume are virtually unaffected. This results in a further reduction in the relative magnitude of the first adsorption step. Following the formation of the first adsorption layer, the adsorption isotherms of larger pores follow a nearly linear trend with pressure.

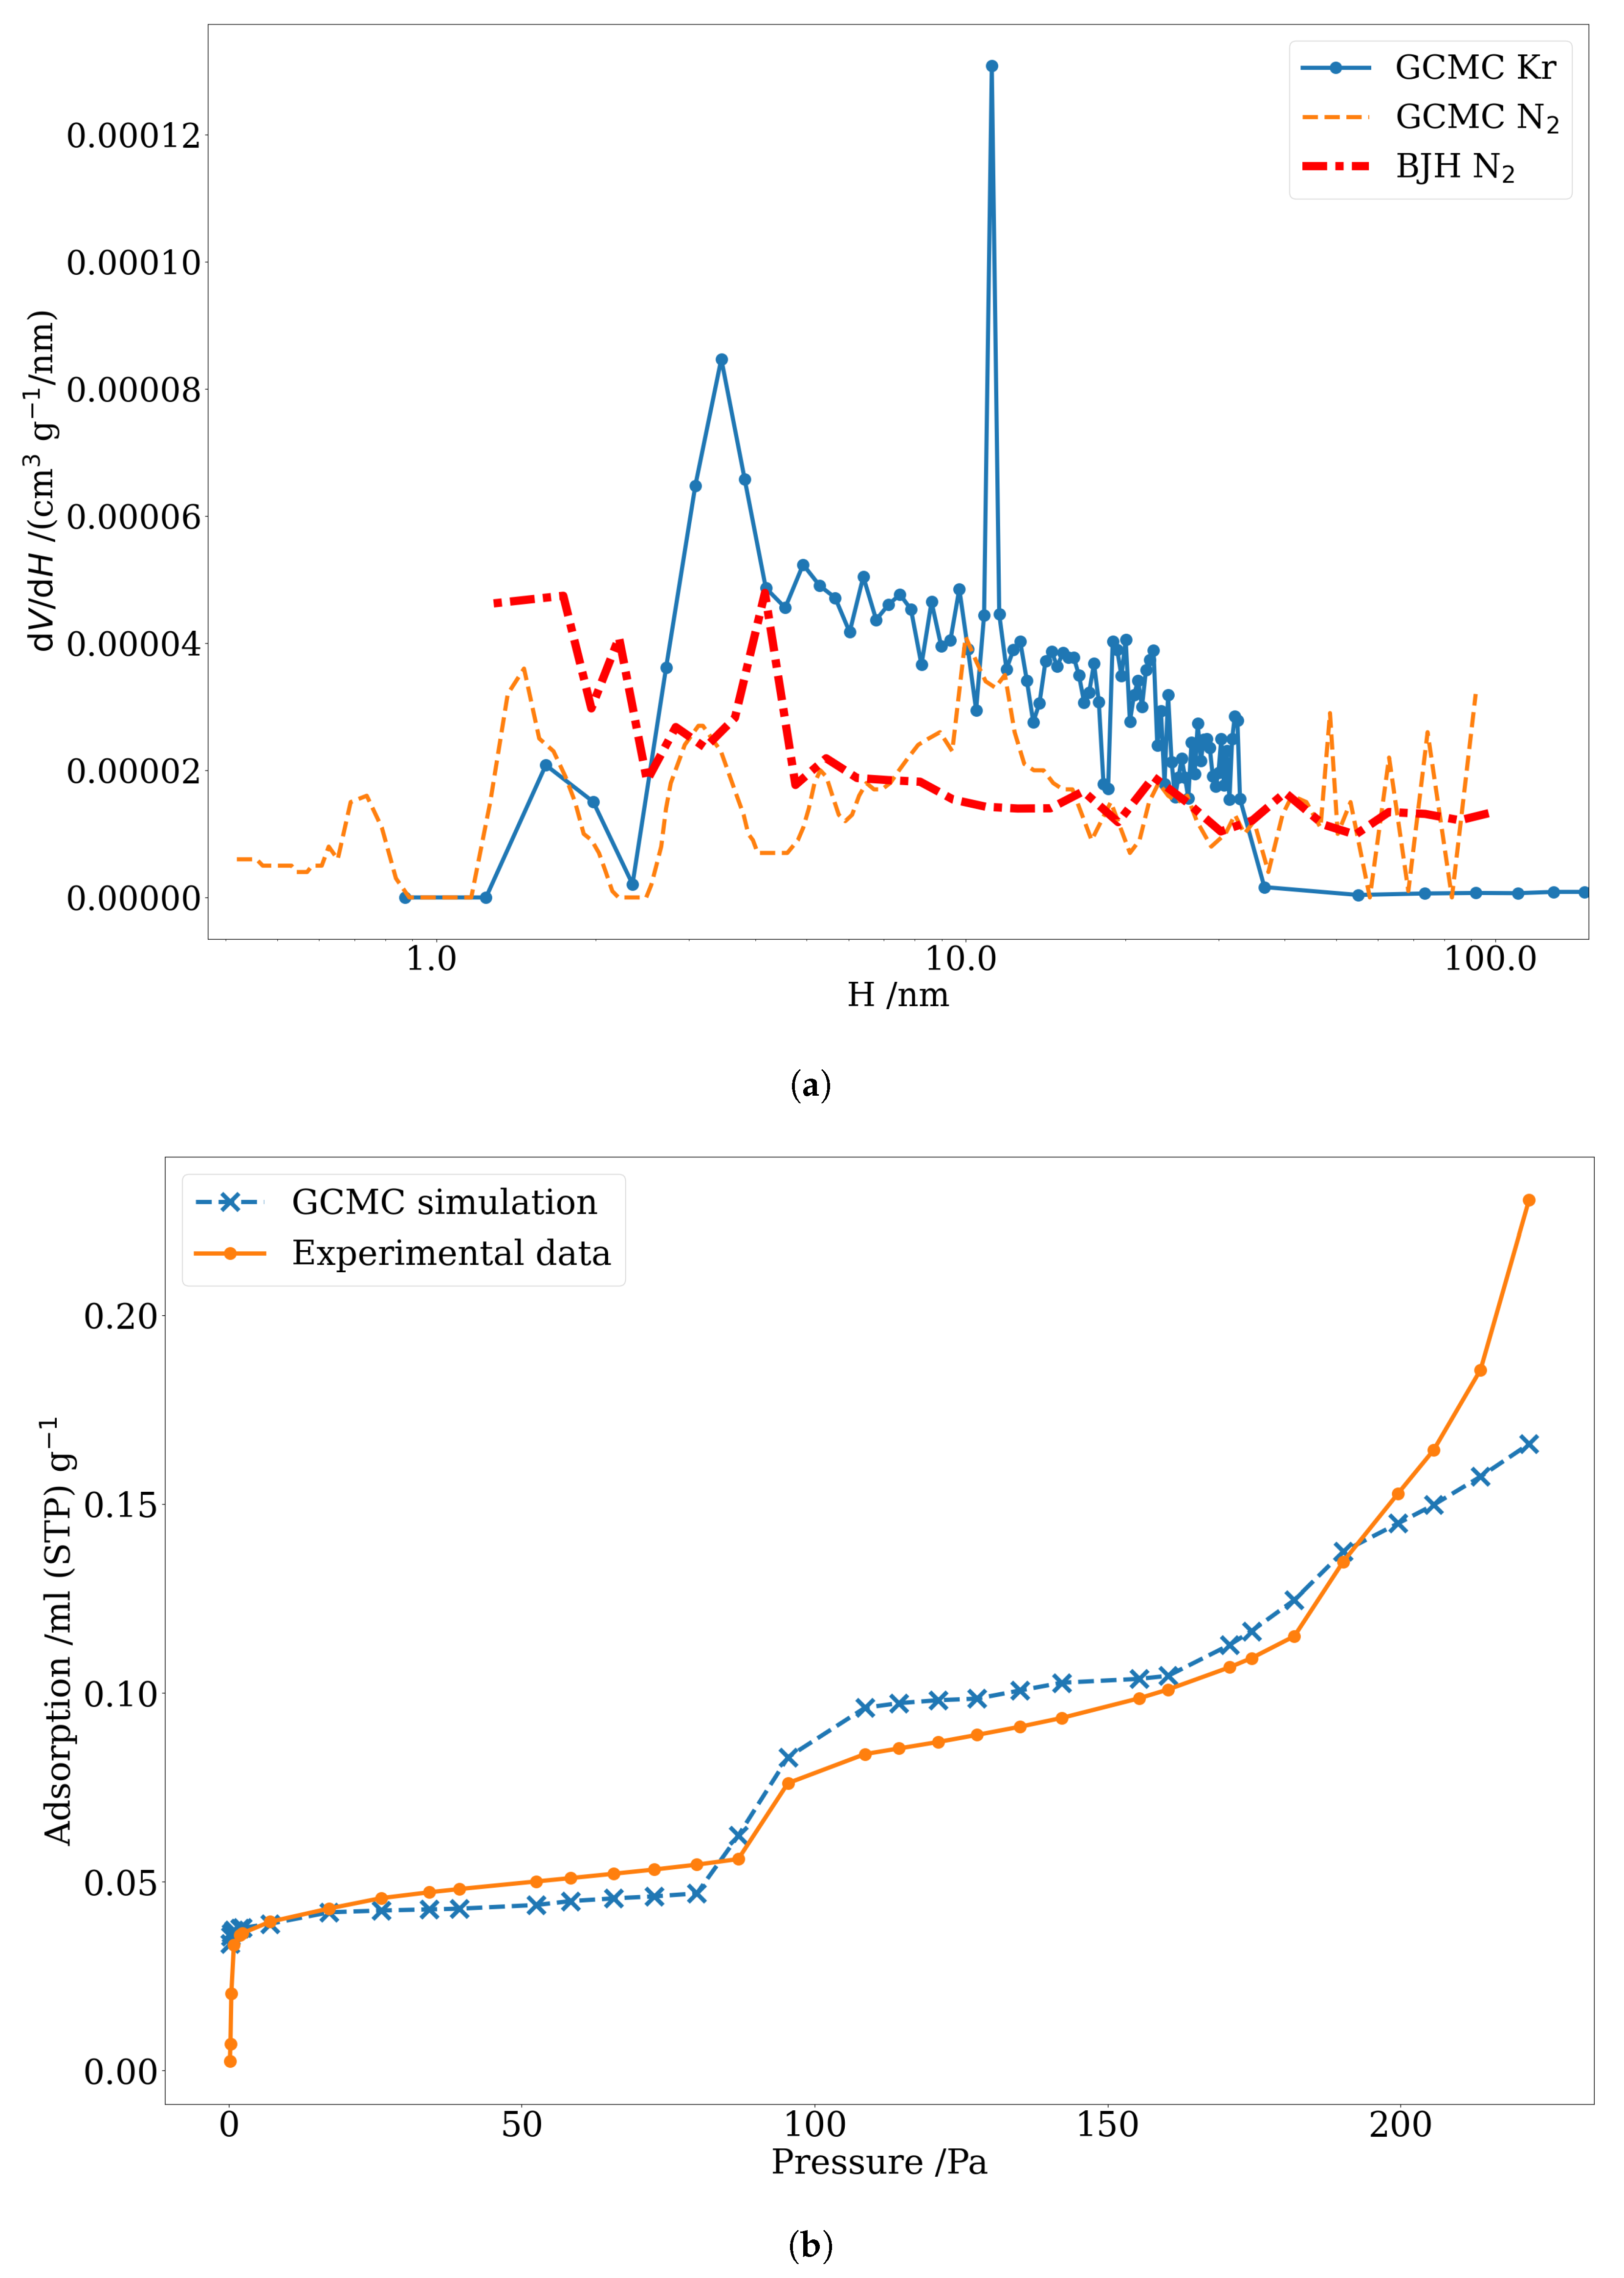
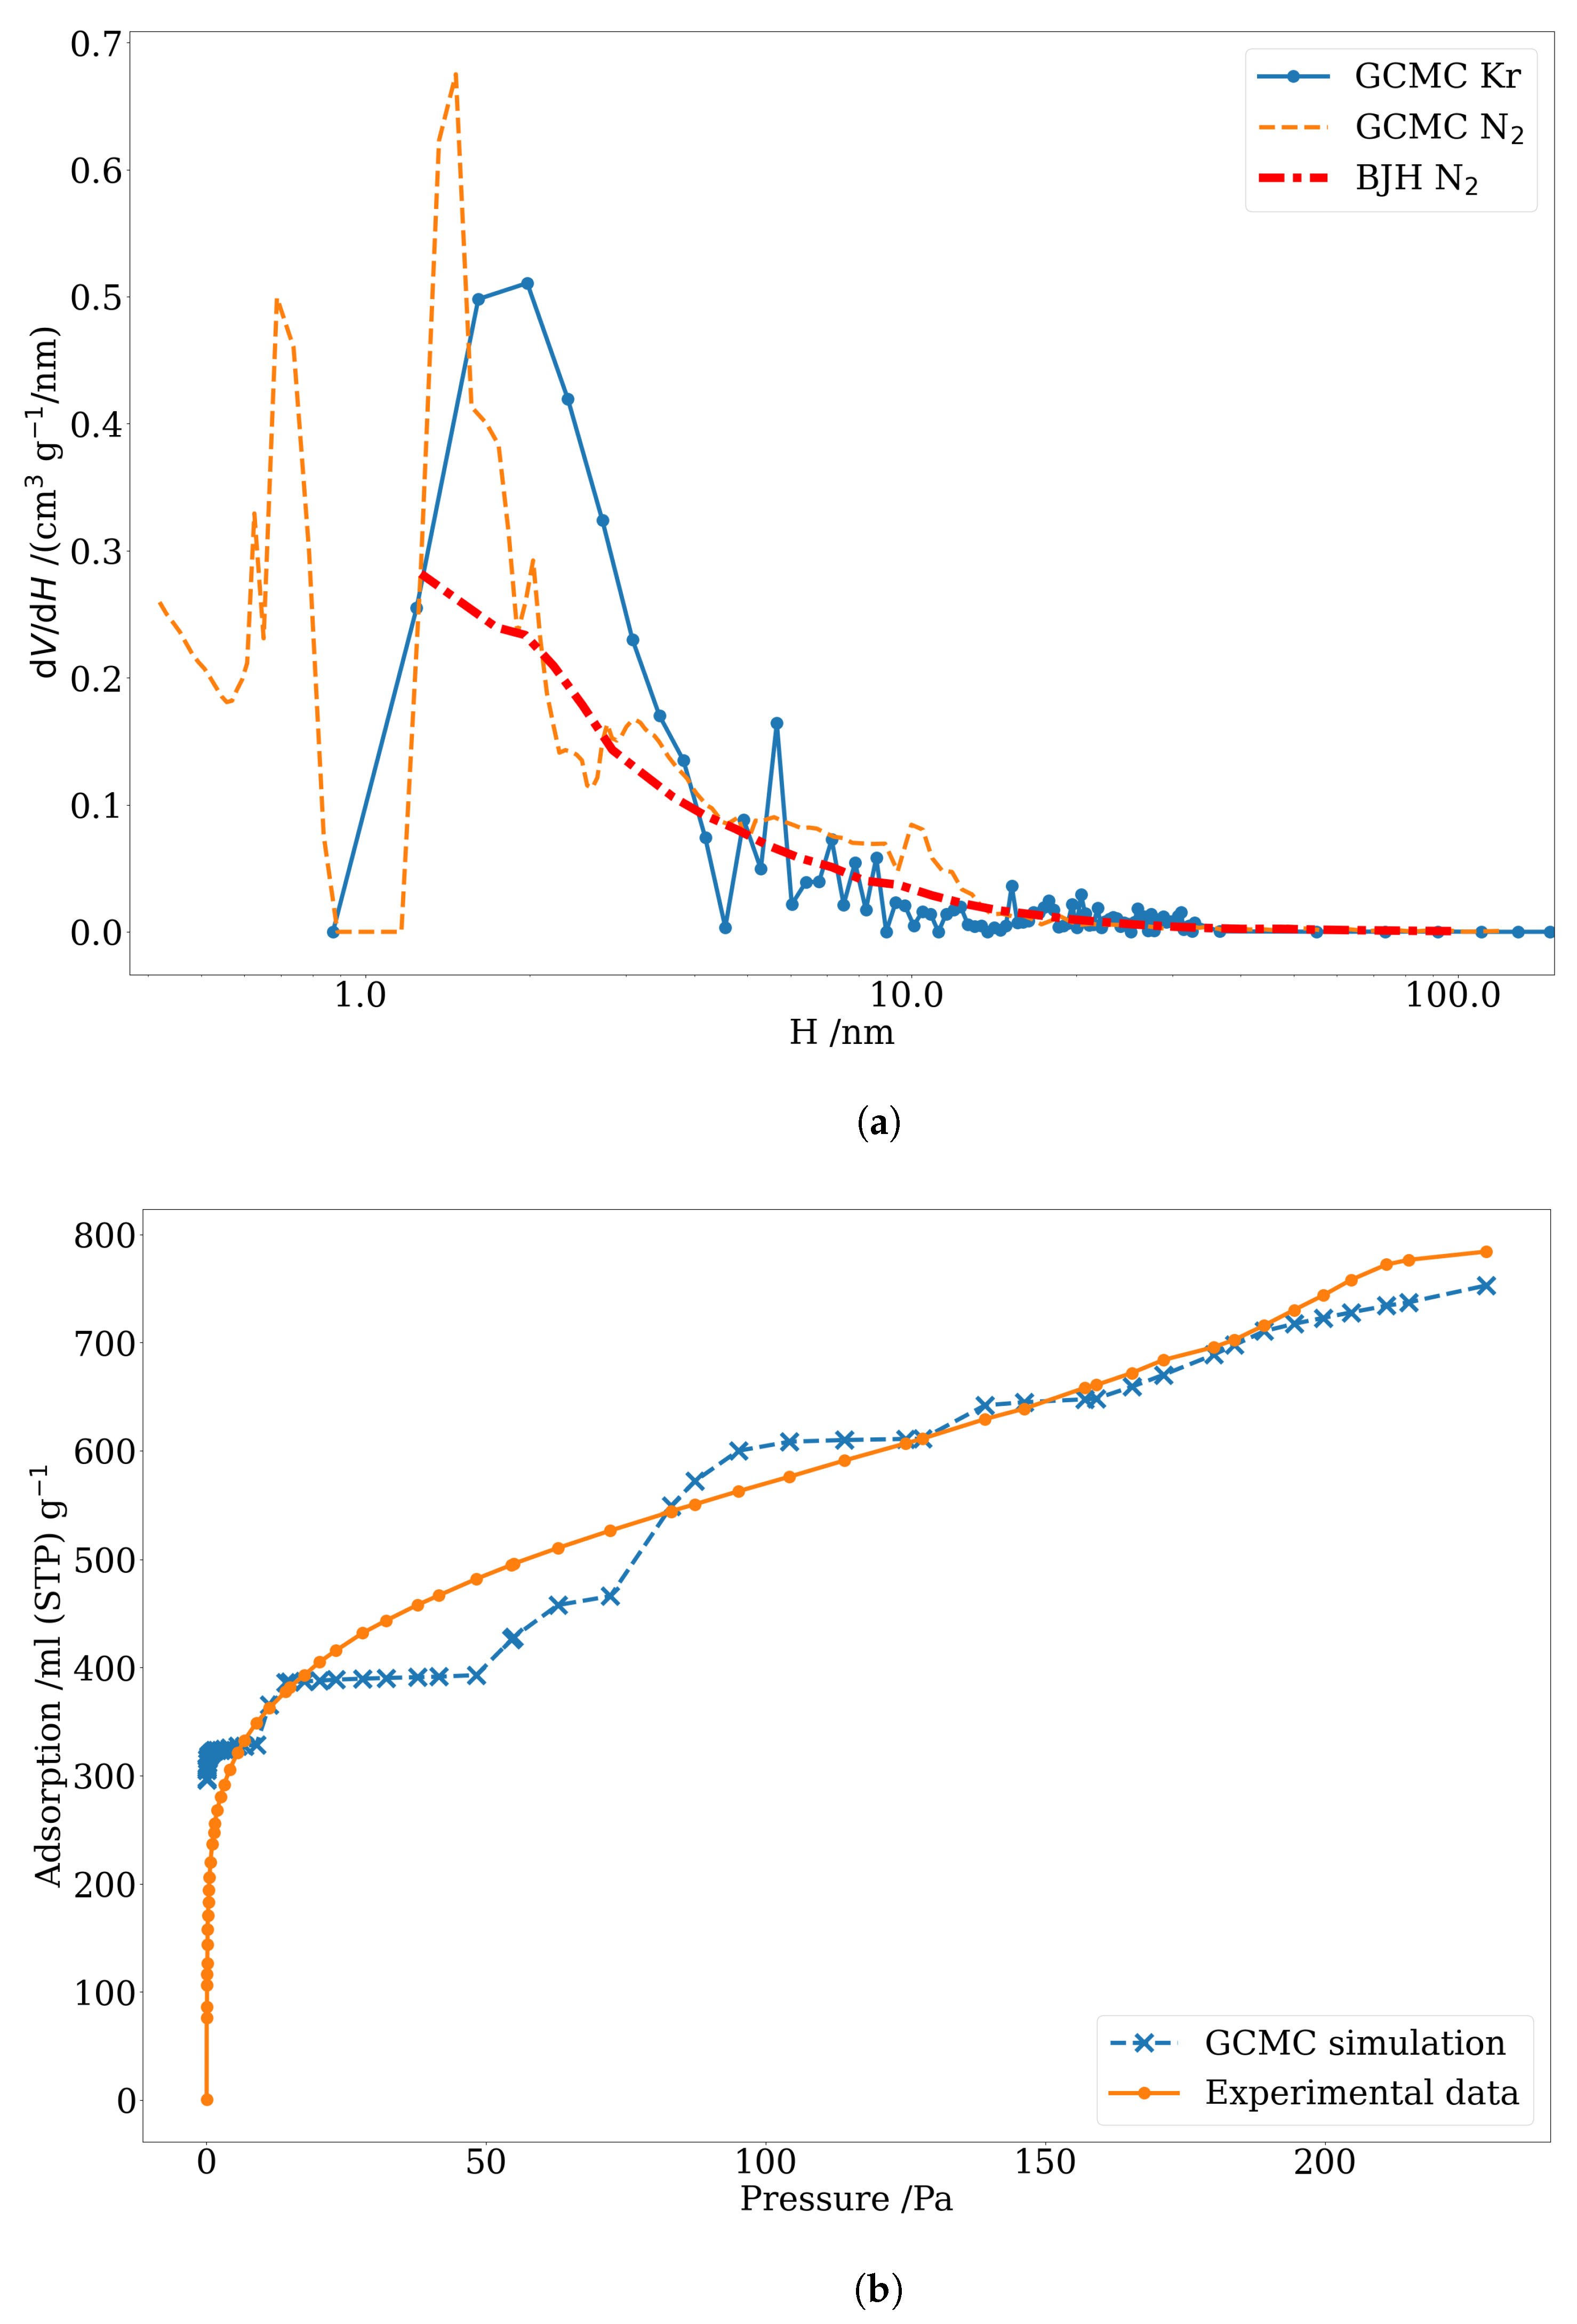
3.3. Pore Size Distribution of Nuclear-Grade Graphite and Activated Carbon

Kr and N2 isotherms for IG110 and IG430 graphites and for activated carbon were obtained as described in Section 2.1. Kr adsorption curves are shown below in Figure 6, Figure 7 and Figure 8, while N2 adsorption and desorption isotherms studied in this work can be found in the Supplementary Information in Figures S3–S5. Replicate measurements were taken for each sample, but as no discernible differences could be identified between replicates, only one of the replicates is shown. The desorption hysteresis loop shown by the graphite samples is classified as type H3, which is usually associated with plate-like particles and slit-shaped pores [6]. This supports the choice of adopting a slit geometry in our simulation of the void features of these samples. Activated carbon displays large initial adsorption of Kr at low pressure. It also shows an H3 desorption hysteresis. The presence of hysteresis on the desorption branch of the isotherm is associated with the presence of mesoporosity and demonstrates adsorption of Kr at high relative pressures had no limits [52]. This confirms that, albeit as a small percentage of the overall void volume for the graphite samples, mesopores are present in all these samples, while it is more likely for the activated carbon pores to be in the microporous range. Table 2 shows the BET-specific surface area of the samples. Closely matching values of specific surface area were derived from the use of both gases in the case of the low surface area graphite samples. The BET surface area measured for activated carbon is 4 orders of magnitude larger than that of graphite; however, the BET method is not designed for microporous adsorbents such as activated carbon, and the results should be interpreted as an apparent surface area [6].
The kernel of simulated Kr adsorption onto slit pores of varying sizes obtained using the GCMC method was used to generate modelled adsorption isotherms and PSDs of the three samples. This was accomplished by fitting a linear combination of the kernel simulated isotherms to the experimental gas adsorption curve, as described in Section 2.2. The PSD produced from the Kr GCMC-generated kernel is also compared to PSDs generated with a commercial GCMC algorithm and BJH model from N2 adsorption data.
Figure 6a shows the results of the PSD simulations of IG110 graphite carried out using the GCMC-Kr adsorption simulations developed in this study and the PSD generated by a GCMC-N2 and BJH N2 from a commercial software package. The GCMC-Kr, in agreement with the GCMC-N2 and BJH-N2 models, shows no pores smaller than 1 nm. The N2-derived PSDs also suggest the presence of pore volume for pores 1.5 to 2 nm wide, which is also found in the modelled PSD from simulated Kr adsorption. In the 1–30 nm range, the trends shown by all models, and in particular by the two GCMC simulations, are similar, with a peak around 3.5–4 nm and 10–12 nm; however, the volume contribution of this peak is much larger, in relative terms, in the case of the GCMC-Kr simulation than in the results from both GCMC-N2 and BJH-N2. While the GCMC-Kr PSD simulation shows very little pore volume for pores larger than 30 nm, both the PSDs generated by GCMC-N2 and BJH-N2 suggest the existence of pores larger than 30 nm. The simulated and experimental Kr adsorption isotherms are shown in Figure 6b. The match between the model and experiment is excellent up to a pressure of 200 Pa, where the simulation fails to predict the onset of the third step on the adsorption isotherm, that can be observed experimentally.
The simulated PSDs of sample IG430 are shown in Figure 7a: similarly to what was observed for IG110, the PSD from the GCMC-Kr method matches very closely those generated by the other models in the 1–30 nm range. However, GCMC-N2 PSD shows pores of sub-nanometre sizes, which are not present in the GCMC-Kr PSD. The GCMC-Kr results show a very small amount of porosity for pore sizes larger than 30 nm, when compared with the results from other models. Figure 7b shows the simulated and experimental Kr adsorption isotherms. The agreement is excellent for pressures up to 170 Pa, including the first and second step of the adsorption isotherm. As in the IG110 case, the third step in the adsorption isotherm develops at a pressure of around 170 Pa, while the simulated isotherm shows a linear increase in adsorption volume for pressures up to 220 Pa.
A comparison between the results of the simulation developed in this work and those produced by modelling of N2 adsorption data was also carried out for an activated carbon with high surface area (Figure 8a). The GCMC-N2 method produces a PSD with a significant fraction of micropores smaller than 0.87 nm, which cannot be simulated by the model developed in this study, for the reason explained in Section 3.2. The GCMC-Kr distribution shows peaks between 1.3 and 20 nm, which matches very closely that in the GCMC-N2 distribution. The match between the results of different simulations for the remaining pore sizes is excellent, with very few pores larger than 20 nm. The experimental and simulated Kr adsorption isotherms are also closely matching. However, at low pressures, the simulated isotherm has a stepwise behaviour, while the experimental adsorption isotherm is smooth over the entire range of pressures.
Table 3 shows the total void volume modelled by the two GCMC methods and by BJH-N2, with values quite closely matching for each sample. In the case of the graphite samples, the GCMC-Kr modelling results in the smallest value of total void volume. All models show IG110 to have a larger total void volume than IG430. The total void volume resulting from these models is very small, and, as to be expected in the case of nuclear-grade graphites, it accounts only for a very small fraction of the overall porosity of the samples. The activated carbon total void volume values estimated by the two GCMC methods are closely matching and 3 orders of magnitude larger than those of the graphite samples. The BJH model, when applied to activated carbon, results in a lower void volume.
Before discussing in detail the results of the PSD simulations, it is important to point out that the direct comparison of results produced by the two GCMC models is complicated by the fact that the fitting methodology used in the commercial software used for the interpretation of N2 adsorption data is not known.
Another issue to be noted is the resolution of the experimental measurements [49]: the minimum pressure at which gas adsorption was measured experimentally is around 0.1 Pa. Figure 5b shows how, according to the GCMC-Kr simulations, pores smaller than 1 nm would be completely filled at pressures below 0.1 Pa. In some of the larger pores, a mono-layer has already formed at this pressure. By obtaining higher resolution experimental Kr adsorption isotherms, it would be possible to gain better predictions of the PSD of porous materials. The graph of GCMC-N2 kernel published in the work of Miyahara et al. [48] suggests that the same issue could also affect, to a lesser extent, the interpretation of N2 adsorption data, and consequently, the PSD generated by such methods at the sub-nanometre scale. This explains the discrepancies between the PSDs obtained from the two GCMC methods for narrow pores ( H < 1 nm ) observed in the case of IG430 and activated carbon. The resolution of the experimental data causes the GCMC-Kr model to fail in modelling such pores; consequently, the simulation attributes their volume contribution to larger pores. However, it should also be noted that there is a level of uncertainty in the quantification of the volume contribution from the narrowest pores as determined by GCMC-N2 modelling, especially in the case of IG430. The highest magnification SEMs shown in the Supplementary Information (Figures S1 and S2) show a randomly arranged structure of relatively large graphite crystals. While it is not possible directly to observe or quantify the presence of porous features smaller than 1 nm, it is likely that these features are mostly due to gaps between the graphite crystals, exposed crystal edges or, to a lesser extent, very small features on the surface of the crystals. So, while the presence of void features smaller than 1 nm cannot be visually verified from image analysis, their contribution to the overall pore-volume of the samples is likely to be very small. It is, therefore, possible to postulate that the commercial GCMC-N2 method is overestimating the presence of the narrowest pores. The shortcomings of both N2 and Kr experimental adsorption measurements in probing the narrowest voids could cause the differences in the distributions of the narrowest pore sizes, resulting from the two corresponding simulation methods, to be exacerbated.
Figure 6a and Figure 7a show good agreement between the two GCMC models, with similar PSDs for pore widths up to 50 nm in IG110 and IG430 samples. For pores wider than 30 nm, the GCMC-Kr seems to underestimate the pore volume when compared to the results produced by modelling based on N2 data. It could be postulated that Kr adsorption isotherms do not contain sufficient information about wider pores. One of the contributing factors could be capillary condensation occurring in the voids between the crystallites; the presence of heterogeneous sites in larger pores may induce condensation. The experimental adsorption isotherms of IG110 and IG430 show sharp steps in the amount of adsorbed Kr at pressures of around 170 Pa, which become completely vertical for pressures greater than 220 Pa. The condensation taking place in the complex graphite void space cannot be predicted by the GCMC simulations, as shown in Figure 6b and Figure 7b, which generate linear isotherms for pressures greater than 100 Pa. The inability of the GCMC-Kr model developed in this study to simulate the adsorption isotherms of graphite for the entire pressure range also explains why its estimate of the total void volume of graphite samples is smaller than the total pore volume obtained by GCMC and BJH methods from N2 data.
The PSDs of activated carbon generated by the two models show the best agreement, especially for pores larger than 1 nm. The overall void volume predicted by the two methods is also closely matching, as, in this case, the GCMC-Kr model can closely simulate the adsorption isotherm over the entire range of pressures. However, there is a noticeable difference between the simulated (stepwise) and experimental (smooth) Kr adsorption isotherms at low pressure. This can be explained by the lack of preferential adsorption sites on the smooth walls of the simulated slit pores compared to the non-uniform surfaces and exposed layer edges found in activated carbon [11,51]. These non-uniformities lead to a smooth adsorption isotherm that cannot be reproduced by the GCMC model in its current formulation, characterized by the sharp step of Kr uptake in smaller pores. In order to reduce the stepwise behaviour of adsorption in the case of activated carbon, it would be necessary to modify the model to take into account the roughness of the pore surface.

4. Conclusions

We presented the development of a kernel of simulated Kr adsorption isotherms generated using a GCMC adsorption model of Kr in slit-shaped carbon pores. Simulated adsorption isotherms and pore size distributions of porous graphite and activated carbon samples were generated by fitting the simulated kernel to experimental Kr adsorption data. The pore size distributions were compared with those generated by other modelling methods requiring N2 adsorption isotherms. The agreement between the method developed in this work and other methodologies, which is good in the pore size range from 1 to 50 nm, confirms that Kr adsorption and the kernel we developed offer an alternative when the traditional characterization by N2 adsorption and the standard PSD models available in commercial software fails to achieve meaningful or reproducible results for low-surface area samples, such as nuclear graphite samples.

Supplementary Materials

The following supporting information can be downloaded at: https://www.mdpi.com/article/10.3390/c9030086/s1. Table S1: Density and porosity data for IG110 and IG430 graphites. Figure S1: Scanning electrong micrographs of IG110 at different magnifications. Figure S2: Scanning electrong micrographs of IG430 at different magnifications. Figure S3: Experimental and simulated N2 adsorption/desorption isotherms for IG110 graphite. Figure S4: Experimental and simulated N2 adsorption/desorption isotherms for IG430 graphite. Figure S5: Experimental and simulated N2 adsorption/desorption isotherms for activated carbon.

Author Contributions

Conceptualization, G.M.L. and K.L.J.; methodology, G.M.L. and K.L.J.; validation, G.M.L. and K.L.J.; formal analysis, G.M.L. and K.L.J.; investigation, G.M.L. and K.L.J.; resources, G.M.L. and K.L.J.; data curation, G.M.L. and K.L.J.; writing—original draft preparation, G.M.L.; writing—review and editing, G.M.L. and K.L.J.; visualization, G.M.L.; supervision, G.M.L.; project administration, K.L.J.; funding acquisition, G.M.L. and K.L.J. All authors have read and agreed to the published version of the manuscript.

Funding

The financial support of EDF Energy (Barnwood, Gloucester, UK) is gratefully acknowledged. However, the views expressed in this paper are those of the authors and do not necessarily represent the views of the sponsors.

Data Availability Statement

The data presented in this study are available in this article and in the Supplementary Information.

Conflicts of Interest

The authors declare no conflict of interest.

Abbreviations

The following abbreviations are used in this manuscript:
BETBrunauer, Emmet and Teller
BJHBarret, Joyner and Halenda
GCBGraphitized Carbon Black
GCMCGrand Canonical Monte Carlo
LJLennard-Jones
NLDFTNon-Localized Density Functional Theory
PSDPore Size Distribution

References

  1. Gregg, S.; Sing, K. Adsorption, Surface Area and Porosity, 2nd ed.; Academic Press: Cambridge, MA, USA, 1982. [Google Scholar]
  2. Sing, K.S. 7—Assessment of Surface Area by Gas Adsorption. In Adsorption by Powders and Porous Solids, 2nd ed.; Rouquerol, F., Rouquerol, J., Sing, K., Llewellyn, P., Maurin, G., Eds.; Academic Press: Oxford, UK, 2014; pp. 237–268. [Google Scholar]
  3. Salama, R.S.; El-Bahy, S.M.; Mannaa, M.A. Sulfamic acid supported on mesoporous MCM-41 as a novel, efficient and reusable heterogenous solid acid catalyst for synthesis of xanthene, dihydropyrimidinone and coumarin derivatives. Colloids Surfaces A Physicochem. Eng. Asp. 2021, 628, 127261. [Google Scholar] [CrossRef]
  4. Contescu, C.I.; Arregui-Mena, J.D.; Campbell, A.A.; Edmondson, P.D.; Gallego, N.C.; Takizawa, K.; Katoh, Y. Development of mesopores in superfine grain graphite neutron-irradiated at high fluence. Carbon 2019, 141, 663–675. [Google Scholar]
  5. Arregui-Mena, J.D.; Contescu, C.I.; Campbell, A.A.; Edmondson, P.D.; Gallego, N.C.; Smith, Q.B.; Takizawa, K.; Katoh, Y. Nitrogen adsorption data, FIB-SEM tomography and TEM micrographs of neutron-irradiated superfine grain graphite. Data Brief 2018, 21, 2643–2650. [Google Scholar] [CrossRef] [PubMed]
  6. Thommes, M. Physical Adsorption Characterization of Nanoporous Materials. Chem. Ing. Tech. 2010, 82, 1059–1073. [Google Scholar]
  7. Gallego, N.C.; Arregui-Mena, J.D.; Contescu, C.I. Probing basal planes and edge sites in polygranular nuclear graphite by gas adsorption: Estimation of active surface area. Carbon 2021, 179, 633–645. [Google Scholar]
  8. Amberg, C.H.; Spencer, W.B.; Beebe, R.A. Heats of adsorption of Krypton on highly graphitized carbon black. Can. J. Chem. 1955, 33, 305–313. [Google Scholar]
  9. Thomy, A.; Matecki, M.; Duval, X. Adsorption de krypton sur membranes et fibres de carbone. Carbon 1971, 9, 587–592. [Google Scholar]
  10. Duval, X.; Thomy, A. The interpretation of Krypton adsorption isotherms on exfoliated graphite. Carbon 1975, 13, 242–243. [Google Scholar] [CrossRef]
  11. Wang, Y.; Razak, M.A.; Do, D.; Horikawa, T.; Morishige, K.; Nicholson, D. A computer simulation and experimental study of the difference between krypton adsorption on a graphite surface and in a graphitic hexagonal pore. Carbon 2012, 50, 2908–2917. [Google Scholar]
  12. Morishige, K. Monolayer Solids of Kr on Graphitized Carbon Black Surfaces and in Graphitic Hexagonal Pores. J. Phys. Chem. C 2013, 117, 10360–10365. [Google Scholar]
  13. Diao, R.; Fan, C.; Do, D.; Nicholson, D. On the 2D-transition, hysteresis and thermodynamic equilibrium of Kr adsorption on a graphite surface. J. Colloid Interface Sci. 2015, 460, 281–289. [Google Scholar] [PubMed]
  14. Prasetyo, L.; Horikawa, T.; Phadungbut, P.; Tan, S.J.; Do, D.; Nicholson, D. A GCMC simulation and experimental study of krypton adsorption/desorption hysteresis on a graphite surface. J. Colloid Interface Sci. 2016, 478, 402–412. [Google Scholar] [CrossRef] [PubMed]
  15. Mbaye, M.T.; Maiga, S.M.; Gatica, S.M. Commensurate phases of Kr adsorbed on single-walled carbon nanotubes. J. Low Temp. Phys. 2016, 185, 129–137. [Google Scholar] [CrossRef]
  16. Barrett, E.P.; Joyner, L.G.; Halenda, P.P. The Determination of Pore Volume and Area Distributions in Porous Substances. I. Computations from Nitrogen Isotherms. J. Am. Chem. Soc. 1951, 73, 373–380. [Google Scholar] [CrossRef]
  17. Ravikovitch, P.I.; Neimark, A.V. Calculations of pore size distributions in nanoporous materials from adsorption and desorption isotherms. Stud. Surf. Sci. Catal. 2000, 129, 597–606. [Google Scholar]
  18. Ravikovitch, P.I.; Neimark, A.V. Characterization of Micro- and Mesoporosity in SBA-15 Materials from Adsorption Data by the NLDFT Method. J. Phys. Chem. B 2001, 105, 6817–6823. [Google Scholar] [CrossRef]
  19. Jagiello, J.; Kenvin, J.; Olivier, J.P.; Lupini, A.R.; Contescu, C.I. Using a New Finite Slit Pore Model for NLDFT Analysis of Carbon Pore Structure. Adsorpt. Sci. Technol. 2011, 29, 769–780. [Google Scholar]
  20. Norman, G.; Filinov, V. Investigations of phase transitions by a Monte-Carlo method. High Temp. 1969, 7, 216. [Google Scholar]
  21. Adams, D. Grand canonical ensemble Monte Carlo for a Lennard-Jones fluid. Mol. Phys. 1975, 29, 307–311. [Google Scholar] [CrossRef]
  22. Konstantakou, M.; Gotzias, A.; Stubos, A.; Kainourgiakis, M.; Steriotis, T. GCMC Simulations of Gas Adsorption in Carbon Pore Structures. In Applications of Monte Carlo Method in Science and Engineering; Mordechai, S., Ed.; INTECH Open Access Publisher: London, UK, 2011; pp. 653–676. [Google Scholar]
  23. Lee, E.J.; Chang, R.W.; Han, J.H.; Chung, T.D. Effect of Pore Geometry on Gas Adsorption: Grand Canonical Monte Carlo Simulation Studies. Bull. Korean Chem. Soc. 2012, 33, 901–905. [Google Scholar] [CrossRef]
  24. Miyahara, M.T.; Tanaka, H. Determination of phase equilibria in confined systems by open pore cell Monte Carlo method. J. Chem. Phys. 2013, 138, 084709. [Google Scholar] [CrossRef]
  25. Herrera, L.F.; Fan, C.; Do, D.D.; Nicholson, D. Monte Carlo Optimization Scheme to Determine the Physical Properties of Porous and Nonporous Solids. Langmuir 2010, 26, 15278–15288. [Google Scholar] [CrossRef]
  26. Bottani, E.J.; Bakaev, V.A. The Grand Canonical Ensemble Monte Carlo Simulation of Nitrogen on Graphite. Langmuir 1994, 10, 1550–1555. [Google Scholar] [CrossRef]
  27. Fan, C.; Do, D.D.; Nicholson, D. New Monte Carlo Simulation of Adsorption of Gases on Surfaces and in Pores: A Concept of Multibins. J. Phys. Chem. B 2011, 115, 10509–10517. [Google Scholar] [CrossRef]
  28. Fan, C.; Do, D.; Nicholson, D.; Jagiello, J.; Kenvin, J.; Puzan, M. Monte Carlo simulation and experimental studies on the low temperature characterization of nitrogen adsorption on graphite. Carbon 2013, 52, 158–170. [Google Scholar] [CrossRef]
  29. Maiga, S.M.; Gatica, S.M. Monolayer adsorption of noble gases on graphene. Chem. Phys. 2018, 501, 46–52. [Google Scholar] [CrossRef]
  30. Siderius, D.W.; Shen, V.K. Use of the Grand Canonical Transition-Matrix Monte Carlo Method to Model Gas Adsorption in Porous Materials. J. Phys. Chem. C 2013, 117, 5861–5872. [Google Scholar] [CrossRef]
  31. Samios, S.; Stubos, A.K.; Kanellopoulos, N.K.; Cracknell, R.F.; Papadopoulos, G.K.; Nicholson, D. Determination of Micropore Size Distribution from Grand Canonical Monte Carlo Simulations and Experimental CO2 Isotherm Data. Langmuir 1997, 13, 2795–2802. [Google Scholar] [CrossRef]
  32. Steele, W.A.; Bojan, M.J. Simulation studies of sorption in model cylindrical micropores. Adv. Colloid Interface Sci. 1998, 76–77, 153–178. [Google Scholar] [CrossRef]
  33. Konstantakou, M.; Steriotis, T.; Papadopoulos, G.; Kainourgiakis, M.; Kikkinides, E.; Stubos, A. Characterization of nanoporous carbons by combining CO2 and H2 sorption data with the Monte Carlo simulations. Appl. Surf. Sci. 2007, 253, 5715–5720. [Google Scholar] [CrossRef]
  34. Paul, R.M.; Arregui-Mena, J.D.; Contescu, C.I.; Gallego, N.C. Effect of microstructure and temperature on nuclear graphite oxidation using the 3D Random Pore Model. Carbon 2022, 191, 132–145. [Google Scholar] [CrossRef]
  35. Laudone, G.M.; Gribble, C.M.; Matthews, G.P. Characterisation of the porous structure of Gilsocarbon graphite using pycnometry, cyclic porosimetry and void-network modeling. Carbon 2014, 73, 61–70. [Google Scholar] [CrossRef]
  36. Jones, K.L.; Laudone, G.M.; Matthews, G.P. A multi-technique experimental and modelling study of the porous structure of IG-110 and IG-430 nuclear graphite. Carbon 2018, 128, 1–11. [Google Scholar] [CrossRef]
  37. Jones, K.L.; Matthews, G.P.; Laudone, G.M. The effect of irradiation and radiolytic oxidation on the porous space of Gilsocarbon nuclear graphite measured with mercury porosimetry and helium pycnometry. Carbon 2020, 158, 256–266. [Google Scholar] [CrossRef]
  38. Murdie, N.; Edwards, I.A.; Marsh, H. Changes in porosity of graphite caused by radiolytic gasification by carbon dioxide. Carbon 1986, 24, 267–275. [Google Scholar] [CrossRef]
  39. Nicholson, D.; Parsonage, N.G. Computer Simulation and the Statistical Mechanics of Adsorption; Academic Press: Cambridge, MA, USA, 1982. [Google Scholar]
  40. Allen, M.P.; Tildesley, D.J. Computer Simulation of Liquids; Clarendon Press: New York, NY, USA, 1989. [Google Scholar]
  41. Shkolin, A.V.; Fomkin, A.A.; Sinitsyn, V.A. Methane adsorption on AUK microporous carbon adsorbent. Colloid J. 2008, 70, 796. [Google Scholar] [CrossRef]
  42. Saurel, D.; Segalini, J.; Jauregui, M.; Pendashteh, A.; Daffos, B.; Simon, P.; Casas-Cabanas, M. A SAXS outlook on disordered carbonaceous materials for electrochemical energy storage. Energy Storage Mater. 2019, 21, 162–173. [Google Scholar] [CrossRef]
  43. Dubinin, M.; Plavnik, G. Microporous structures of carbonaceous adsorbents. Carbon 1968, 6, 183–192. [Google Scholar] [CrossRef]
  44. Coasne, B.; Pellenq, R.J.M. A grand canonical Monte Carlo study of capillary condensation in mesoporous media: Effect of the pore morphology and topology. J. Chem. Phys. 2004, 121, 3767–3774. [Google Scholar] [CrossRef]
  45. Fan, W.; Chakraborty, A. Investigation of the Interaction of Polar Molecules on Graphite Surface: Prediction of Isosteric Heat of Adsorption at Zero Surface Coverage. J. Phys. Chem. C 2016, 120, 23490–23499. [Google Scholar] [CrossRef]
  46. Steele, W.A. The physical interaction of gases with crystalline solids. Surf. Sci. 1973, 36, 317–352. [Google Scholar] [CrossRef]
  47. Kaneko, K.; Cracknell, R.F.; Nicholson, D. Nitrogen Adsorption in Slit Pores at Ambient Temperatures: Comparison of Simulation and Experiment. Langmuir 1994, 10, 4606–4609. [Google Scholar] [CrossRef]
  48. Miyahara, M.T.; Numaguchi, R.; Hiratsuka, T.; Nakai, K.; Tanaka, H. Fluids in nanospaces: Molecular simulation studies to find out key mechanisms for engineering. Adsorption 2014, 20, 213–223. [Google Scholar] [CrossRef]
  49. Herdes, C.; Santos, M.A.; Medina, F.; Vega, L.F. Pore Size Distribution Analysis of Selected Hexagonal Mesoporous Silicas by Grand Canonical Monte Carlo Simulations. Langmuir 2005, 21, 8733–8742. [Google Scholar] [CrossRef]
  50. Diamond, S.; Boyd, S. CVXPY: A Python-Embedded Modeling Language for Convex Optimization. J. Mach. Learn. Res. 2016, 17, 1–5. [Google Scholar]
  51. Thomy, A.; Duval, X.; Regnier, J. Two-dimensional phase transitions as displayed by adsorption isotherms on graphite and other lamellar solids. Surf. Sci. Rep. 1981, 1, 1–38. [Google Scholar] [CrossRef]
  52. Bläker, C.; Muthmann, J.; Pasel, C.; Bathen, D. Characterization of Activated Carbon Adsorbents—State of the Art and Novel Approaches. ChemBioEng Rev. 2019, 6, 119–138. [Google Scholar] [CrossRef]
Figure 1. Comparison of GCMC modelling results for adsorption of Kr on a single graphite wall with experimental adsorption isotherm of Kr on exfoliated graphite, as measured by Thomy et al. [9] (also shown in Diao et al. [13]).
Carbon 09 00086 g001
Figure 2. Comparison of GCMC modelling results for adsorption of Kr on a single graphite wall with experimental adsorption isotherm of Kr on graphitized carbon black.
Carbon 09 00086 g002
Figure 3. (a) 3-D representation of a simulated 3.7 nm wide slit-shaped pore with Kr adsorption taking place onto the solid graphite walls. The pore length is 25.9 nm, and its depth is 3.7 nm. (b) Detail of the first adsorption layer, showing close hexagonal packing of the particles.
Carbon 09 00086 g003
Figure 4. Local density of particles in a simulated 3.7 nm wide slit pore as a function of their distance from the pore centre. The particle density is expressed as a percentage of the total particles in the pore.
Carbon 09 00086 g004
Figure 5. GCMC-generated kernel of Kr adsorption isotherms, expressed as the number of adsorbed gas particles per nm 3 of slit-shaped pore volume. Some of the widths of the pores are identified on the graph. (a) Linear pressure axis. (b) Logarithmic pressure axis.
Carbon 09 00086 g005
Figure 6. IG110 graphite. (a) Comparison between PSDs generated by GCMC and BJH models from N2 isotherms and the results of the algorithm developed for the interpretation of Kr isotherms. (b) Experimental and simulated Kr adsorption isotherms.
Carbon 09 00086 g006
Figure 7. IG430 graphite. (a) Comparison between PSDs generated by GCMC and BJH models from N2 isotherms and the results of the algorithm developed for the interpretation of Kr isotherms. (b) Experimental and simulated Kr adsorption isotherms.
Carbon 09 00086 g007
Figure 8. Activated carbon. (a) Comparison between PSDs generated by GCMC and BJH models from N2 isotherms and the results of the algorithm developed for the interpretation of Kr isotherms. (b) Experimental and simulated K r adsorption isotherms.
Carbon 09 00086 g008
Table 1. Potential parameters used in GCMC simulations. k B is the Boltzmann constant. The values of the Kr–Kr and C–C parameters are those found in Diao et al. [13] The Kr–C parameters are obtained by Lorentz-Berthelot mixing rules.
Pair σ /nm ϵ k B /K
Kr–Kr0.3685164.4
C–C0.340028
Kr–C0.354367.85
Table 2. BET specific surface area of IG110, IG430 and activated carbon derived from Kr and N2 adsorption data.
IG110IG430Activated
Carbon
S K r / m 2 g 1 0.380.22 2.15 × 10 3
S N 2 0.370.21 1.64 × 10 3
Table 3. Simulated void volume of IG110, IG430 and activated carbon derived from different modelling approaches.
IG110IG430Activated
Carbon
V GCMC K r 2.02 × 10 3 1.17 × 10 3 1.55
V GCMC N 2 / cm 3 g 1 2.89 × 10 3 1.35 × 10 3 1.63
V BJH N 2 2.15 × 10 3 1.43 × 10 3 1.26
Disclaimer/Publisher’s Note: The statements, opinions and data contained in all publications are solely those of the individual author(s) and contributor(s) and not of MDPI and/or the editor(s). MDPI and/or the editor(s) disclaim responsibility for any injury to people or property resulting from any ideas, methods, instructions or products referred to in the content.

