Article

RF Sensor with Graphene Film for HRP Concentration Detection

1
Department of Electronics and Telecommunications (DET), Politecnico di Torino, 10129 Turin, Italy
2
Division of Microrobotics and Control Engineering, Department of Computing Science, University of Oldenburg, 26129 Oldenburg, Germany
*
Author to whom correspondence should be addressed.
Submission received: 10 May 2023 / Revised: 16 June 2023 / Accepted: 19 June 2023 / Published: 23 June 2023
(This article belongs to the Special Issue Carbon Nanohybrids for Biomedical Applications)

Abstract

:
This paper presents a radio-frequency (RF) antenna as a sensor to detect Horseradish peroxidase (HRP). At the core of the proposed approach is a graphene film deposited on a stub connected to an RF antenna. The graphene film is doctor bladed on the stub. The film is then properly chemically functionalized in order to detect the presence of Horseradish peroxidase (HRP). We validate the proof-of-concept operation of HRP concentration detection by measuring the frequency shift of the reflection coefficient of the antenna using very small concentration of HRP ( 0.03 mM to 0.6 mM).

1. Introduction

Graphene is a monolayer of carbon atoms with remarkable electronic and mechanical properties. With proper solvent, graphene flakes can be dispersed in different binders to produce inks. The inks can be used with various printing methods to produce films for applications as sensors [1,2]. Films can be realized with several techniques such as drop casting [3], epitaxial growth [4], chemical vapor deposition [5], and screen printing techniques [6]. Graphene films have found many applications due to their unique electronic properties. In particular, gas sensors (see, e.g., [7]), metrological applications [8], humidity, temperature, and pressure monitoring [9,10], wearable devices [11], and tunable devices [12,13,14,15,16].
Recently, great attention has been devoted to the use of graphene for biosensors (see, e.g., [17,18,19]). The introduction of carbon-based nanomaterial films seems promising not only for the detection of biomolecules but also for the realization of biosensors. Sensors are designed for the diagnosis of various type of viruses [20] and cancers (breast, prostate) [21] as well as routine clinical analysis (detection of glucose levels in the serum or drug detection and monitoring [11,22]). For the detection of various bio-molecules, many invasive techniques, such as electro-impedance spectroscopy, enzyme oxidation, time domain reflectometer, and surface plasma resonance, exist [23,24,25,26,27].
The use of radio-frequency (RF) biosensors based on passive and/or active devices and circuits has been investigated [28,29,30,31]. The performance of these biosensors can be enhanced by the introduction of nanomaterials. Therefore, these biosensors possess high potential to modulate their sensitivity and selectivity using tailored chemical functionalization to adsorb particular molecules. Multidisciplinary research capabilities are needed for the realization of biosensors with high sensitivity and low concentration limits.
The colorimetric and electrochemical methods are widely used for enzyme detection. The use of colorimetric methods [32] for enzyme detection can only be used manually and it is difficult to automate the detection process. The optical detection of color change is susceptible to changes in ambient light conditions, type of lens, type of camera, etc. Complicated calibration techniques are required in order to compensate for measurement errors due to variation in ambient light conditions [33]. As for the electrochemical method [34,35], it is difficult to obtain a direct electron transfer with the substrate electrode [36].
Horseradish peroxidase has been widely used as an enzyme for the detection of a number of markers [34,36,37,38,39]. Horseradish peroxidase is not susceptible to ambient conditions when it is adequately stored. Furthermore, the impact of light on HRP is also negligible and it is not impacted by chemiluminescence. When exposed to even a smaller amount of target protein or antigen, the detection is very easy since a chemical reaction occurs. In order to further increase the sensitivity, a number of different procedures can be adopted for the amplification of the signals. An increased number of binding capability of the enzyme makes sure that the chemical reaction occurs over an extended duration. This results in detection capabilities over a longer period of time. Another added advantage is that a number of commercial substrates have the capabilities of chemiluminescence, chromogenesis, and fluorescence, making this a very versatile option with a number of chemicals in use. Lastly, it is a very cost-effective and readily available option for detection [40,41,42]. A substrate is used to be oxidized by HRP by using hydrogen peroxide as the oxidizing agent. This results in a characteristic color change. A number of substrates can be used to demonstrate this color change, e.g., TMB (3,3 ,5,5 -tetramethylbenzidine), DAB, ABTS, etc.
The goal of this paper is to demonstrate the use of chemically functionalized graphene films for the detection of the concentration of substrate in HRP from the chemical variation in electrical properties. The functionalization of carbon films deposited on commercial RF dielectric materials is performed for the first time. In the past, this process has been performed multiple times on silicon materials [43,44]. To the knowledge of authors, this is the first time that the concentration of HRP has been detected with a radio-frequency device. It has a number of advantages as compared to other techniques, for example, integration with electronic readout circuits, low-cost large-scale production, and fast response. Moreover, a similar principle can be used to detect different enzymes, for example, DNA protein, antibodies, and H 2 O 2 .
We focus on passive RF biosensors (microstrip patch antenna). The sensor is designed and realized using standard PCB etching techniques. The graphene films are then printed in between copper electrodes on PCB substrate and properly functionalized for substrate detection in HRP. Detailed investigation of the surface morphology of the graphene nanoplatelets and graphene films using Scanning Electron Microscope (SEM) reveals that the graphene films present a homogeneous dispersion of the filler with a comparatively lower surface roughness at higher concentrations and negligible agglomerates. HRP concentration detection is performed by measuring the frequency shift of the reflection coefficient of the antenna using very small concentration of HRP ( 0.03  mM to 0.6  mM).
In Section 2, the graphene flakes’ characterization, the realization of graphene films, and the scattering parameter measurement setup are introduced. In Section 3, the sensor design and full-wave simulations are introduced, and the results for different HRP concentration are shown. Some conclusions are reported in Section 4.

2. Materials and Methods

2.1. Graphene and Film Characterization

The filler used in the film is composed of graphene nanoplatelets commercially available at Nanoinnova (Toledo, Spain). The filler has a nominal surface area of 110 m 2 / g and it has a carbon content of over 98.9 wt%. The graphene film consists of the filler (graphene) and a binder. The ratio of the filler to binder in the film is 9:1. The binder used in this case is polyvinylidene fluoride (PVdF). As its name suggests, the binder provides the film with mechanical stability and adhesion. The binder is an electrical insulator and given its small ratio in the mixture, its electrical properties do not impact the electrical properties of the film. The binder is mixed in N-methyl-2-pyrrolidone (NMP), which acts as a solvent. NMP is an organic material and helps in dispersion of the filler and the binder during the mixing process. The slurry is a mixture of NMP, PVdF, and graphene flakes. It is placed in a 250 mL beaker along with ethanol. After covering the beaker, the slurry is dispersed through a mixing anchor at room temperature. The slurry is mixed for several hours in order to obtain a well-dispersed mixture. Continuing the stirring process, the temperature is increased, causing ethanol evaporation. The resulting slurry is doctor bladed in the gap on the sensor. The sensor with the slurry is left for 5 min in an ethanol-saturated environment. Once deposited, the film is let to dry under hoof convection for several days.
The fillers and films are characterized by scanning electron microscopy and Raman spectroscopy. The scanning electron microscopy is performed by a ZEISS SUPRA TM 40 microscope. For the Raman spectroscopy [45,46,47], a Renishaw InVia Raman spectrometer (Renishaw plc, Wotton-under-Edge, UK) is used which has a 514.5  nm laser excitation and a 20× objective. An average of five measurements were used in the calculation of the spectrum, all performed on five different spots on the same sample. For each measurement, an extended scanning mode in the 500–3000 cm 1 range was adopted. The normalization of all the spectra was performed by a commercial software (Origin 8.5, OriginLab Co., Northampton, MA, USA).

2.2. Sensor Fabrication and Measurement Setup

The sensor is an inset-fed microstrip antenna connected to two sectioned microstrip stubs separated by a gap. The gap is the sensing part, which is filled with graphene film (see Figure 1). The sensor is simulated with a finite element modeling tool, Ansys HFSS, to resonate at a frequency of 4.5  GHz.
The sensors are fabricated on Rogers Kappa 438, a dielectric material suited for radio-frequency applications. The circuit is realized with a photo-lithographic Press and Peel (PnP) technique. The layout of the circuit is first drawn with a standard CAD system. The layout is then printed on a royal blue HTV heat transfer vinyl sheet with the help of a laser printer. The desired shape printed on the vinyl sheet is placed (adheres) on one side of the dielectric substrate (covered with 35 μ m thick copper on both sides) with a heating source. The opposite side of the dielectric (the ground plane) is covered in order not to be attached by the developer. The circuit is submerged in the iron (III) chloride bath in order to remove the unwanted copper. The slurry (film) is deposited with the help of a mask that has a thickness of 500 μ m. The film deposition has a circular shape which is drawn on the mask prior to the deposition. The diameter of the film is 5 mm. The drying process of the slurry removes any extra solvent. It is completed under a hood in the laboratory, after which the mask is removed. During the slurry preparation, maximum care was taken in order to avoid cross-contamination with copper or other metallic substances. Note that the conductivity of the slurry is considerably lower as compared to metals; therefore, there is a negligible influence of the passage of current in the film.
Surface functionalization is crucial in the realization of sensors with high selectivity and sensitivity. Controlled immobilization is performed on surfaces used as recognition elements of biomolecules that can be correlated to a change in electrical or radio-frequency signal variation [44]. The procedure of functionalization is analogous to the procedure described in [43,48]. Briefly, the film is activated with (EDC-NHS), then anti-HRP protein is immobilized on the film, followed by incubation with an enzyme containing the HRP enzyme in its structure.
The measurement of the reflection coefficient of the sensor is performed with the help of a two-port Vector Network Analyzer (VNA), 300 kHz to 9 GHz, (P9371A by Keysight) in the frequency band 4–6 GHz. Once the surface of the film is functionalized, different concentrations of HRP+TMB are deposited with a volume of 30 μ L. Before depositing a different concentration over the surface, the surface is washed with the help of a buffer solution.

3. Results

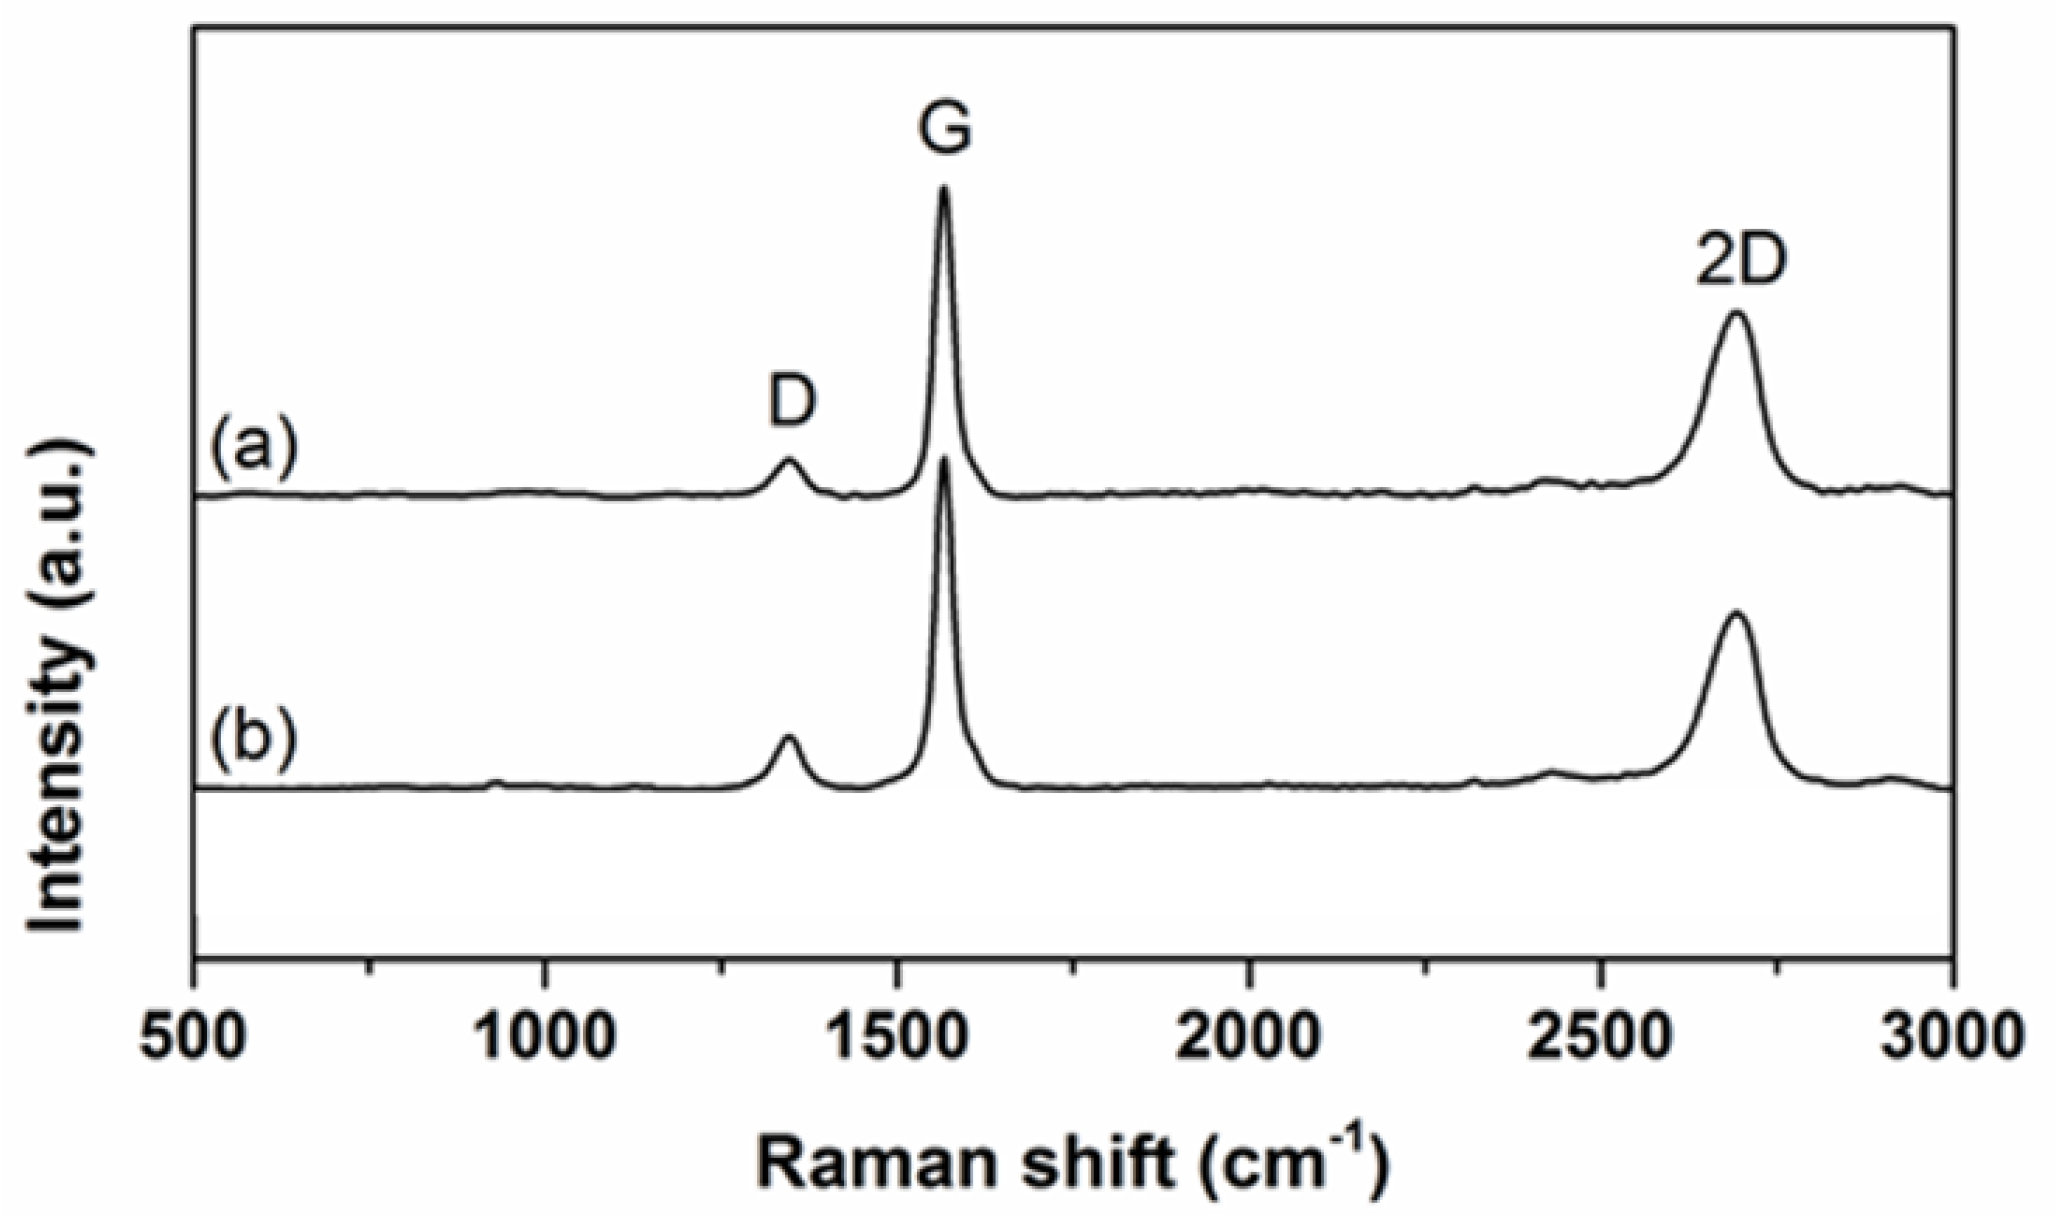
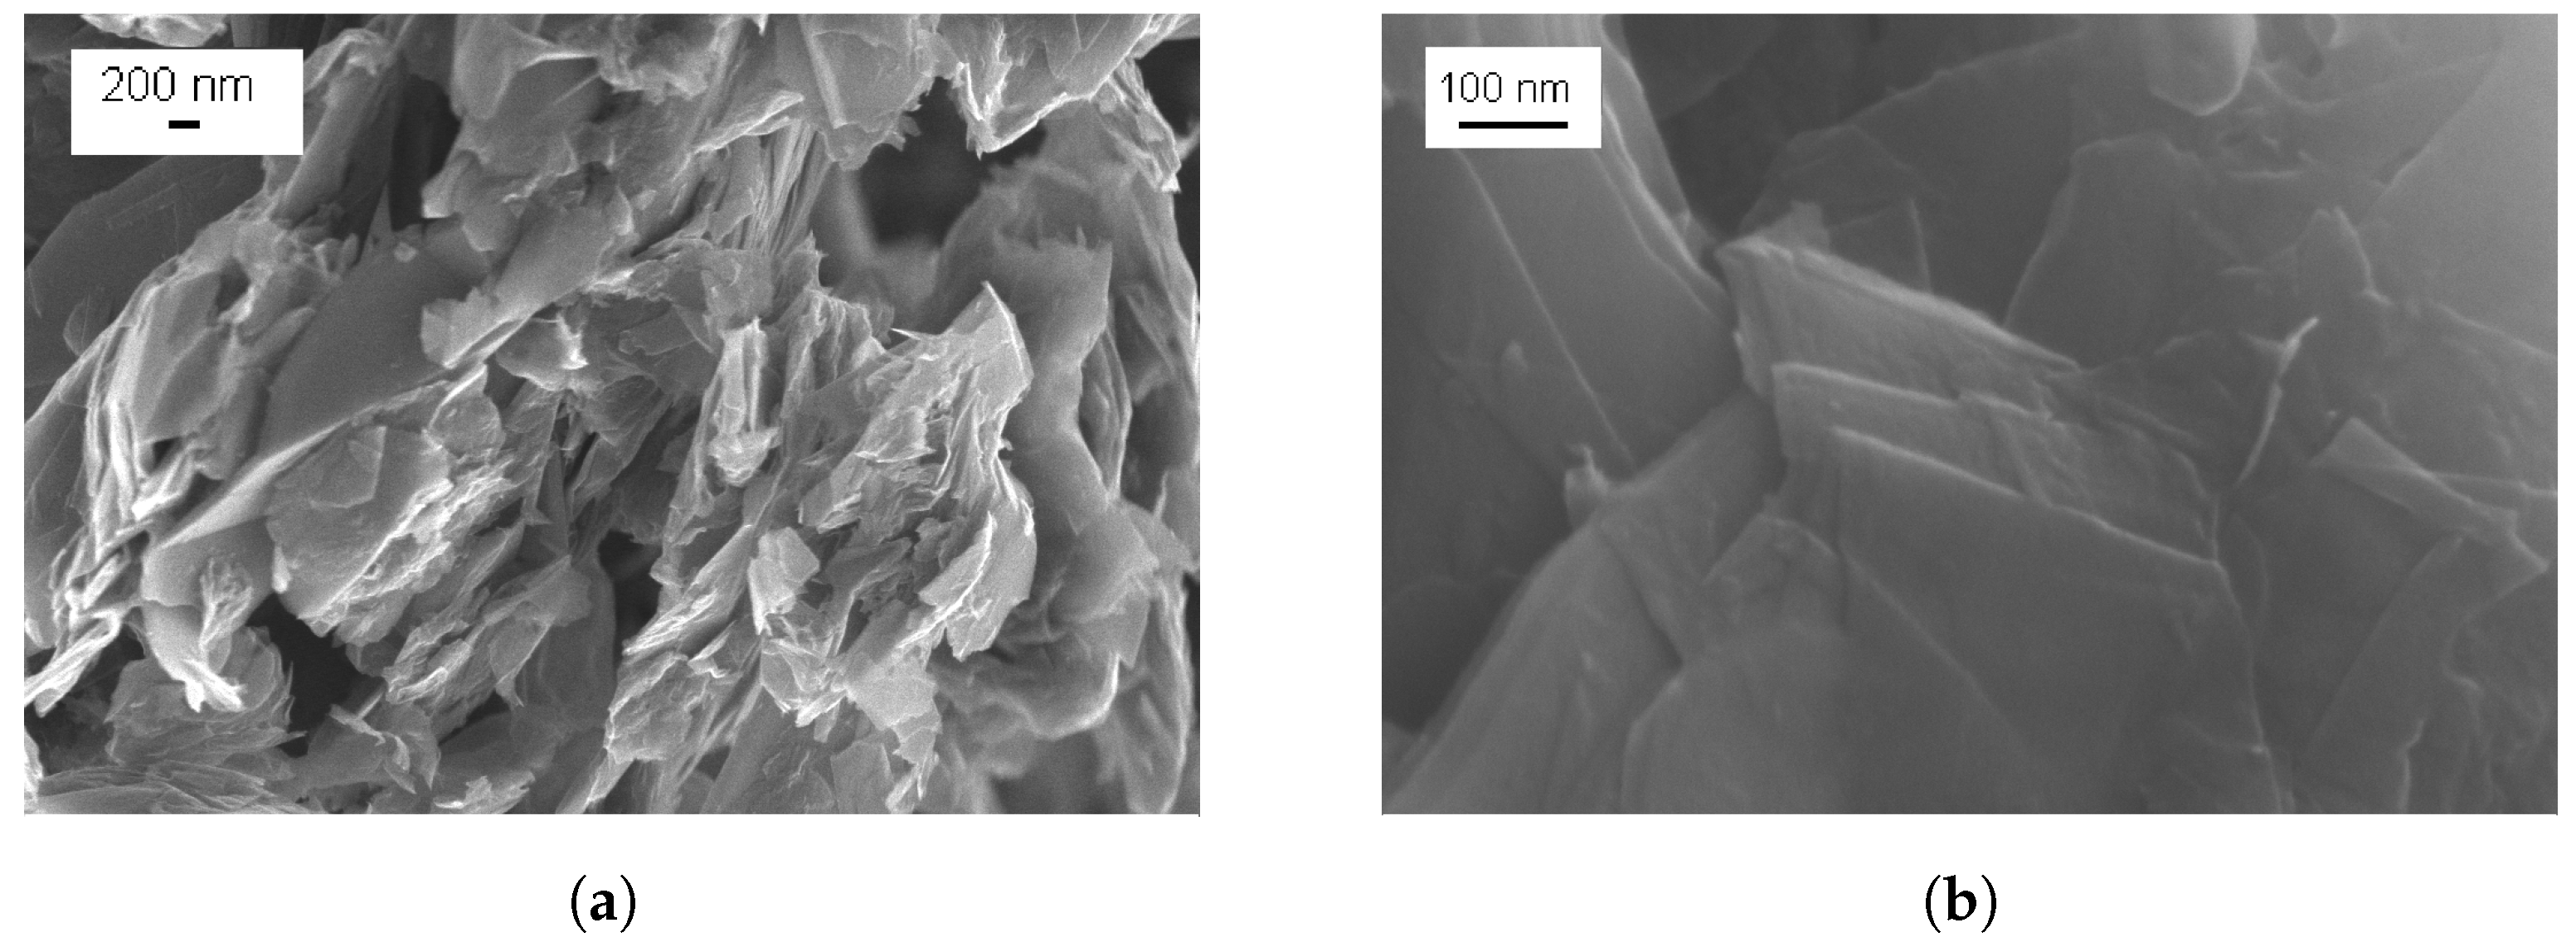
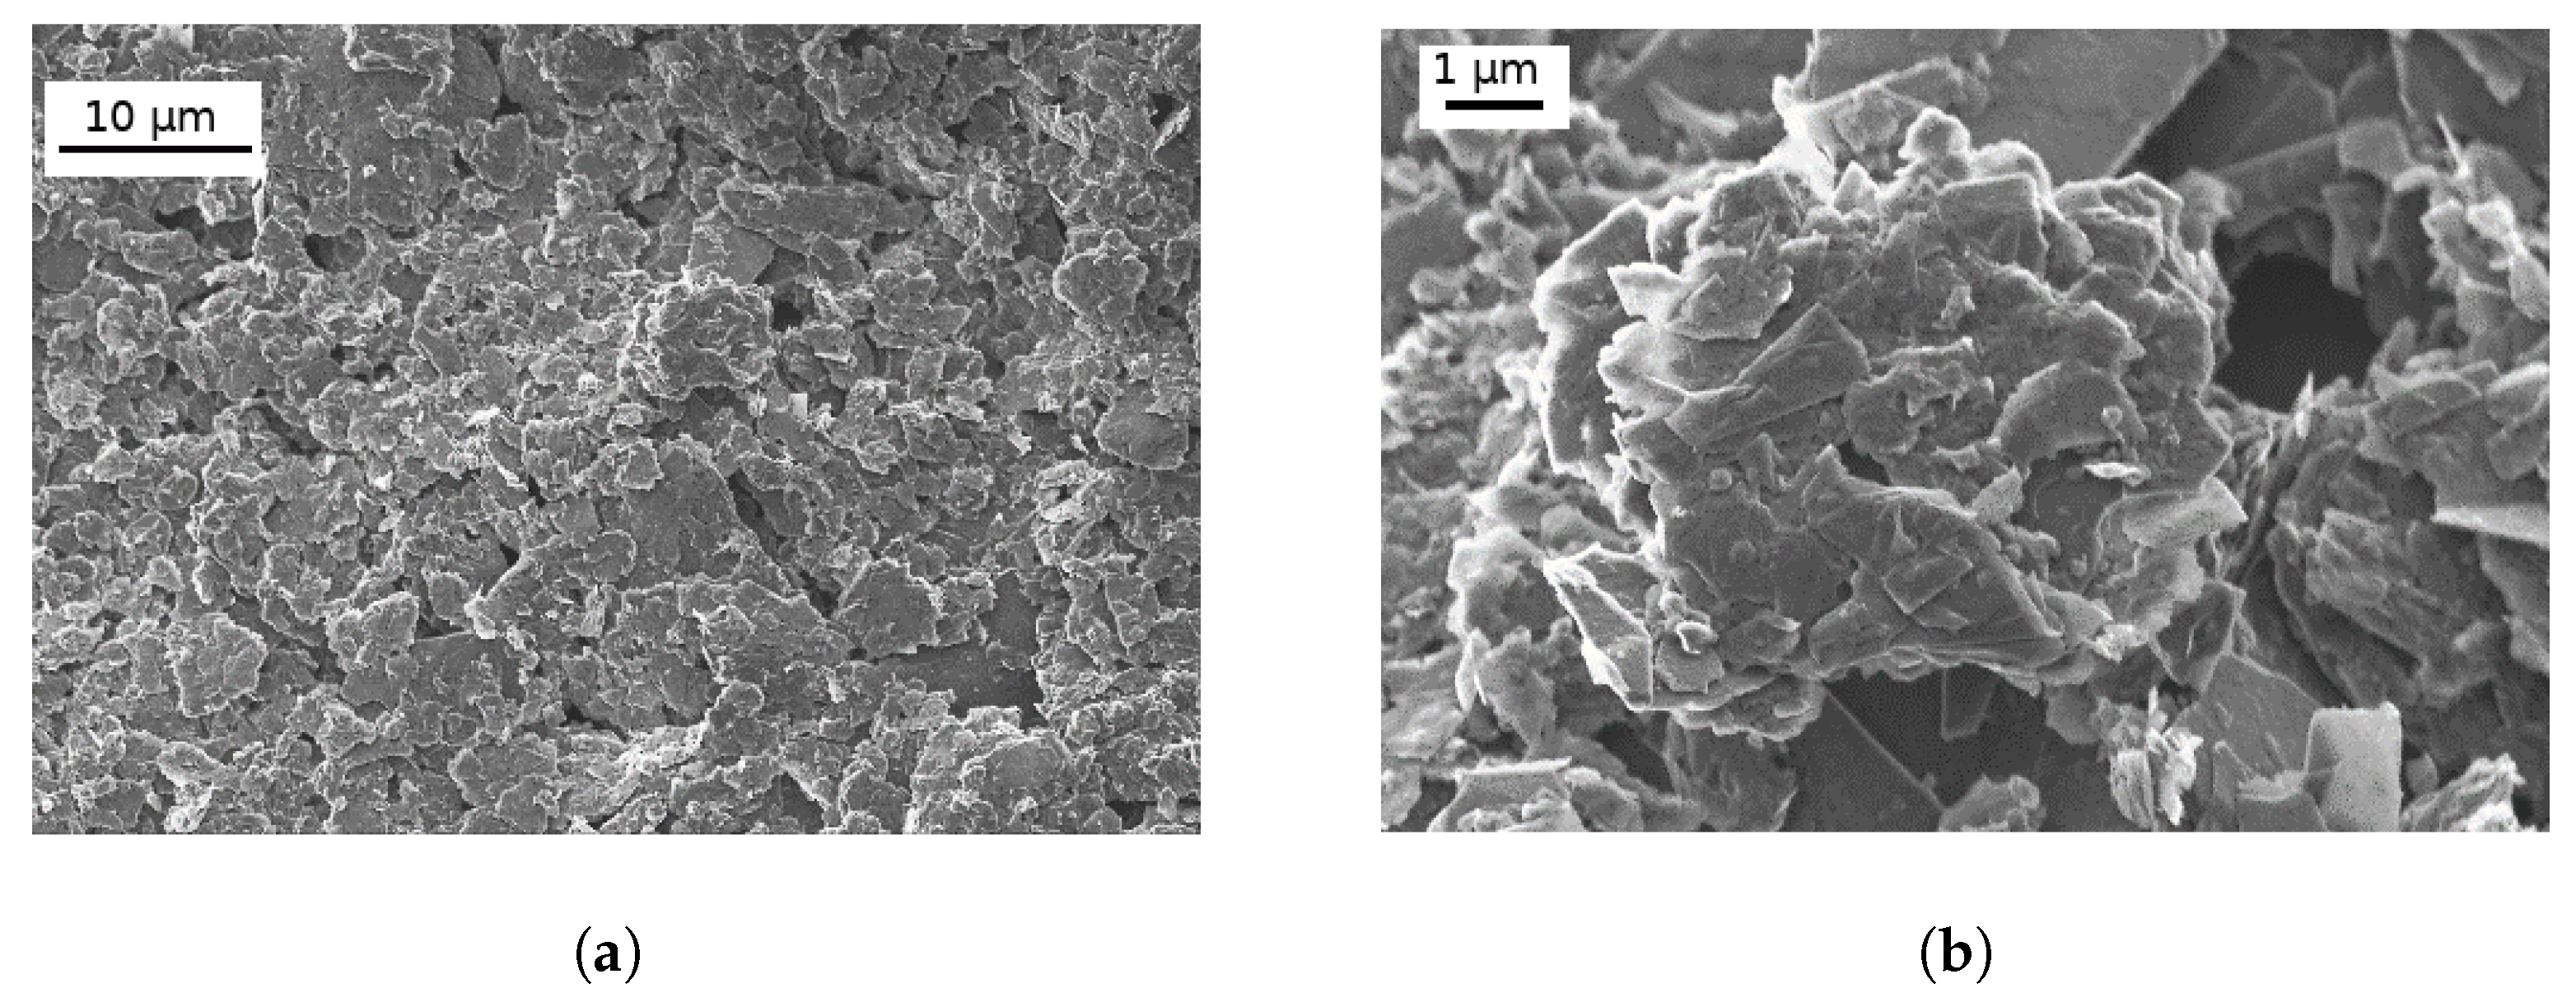
3.1. Characterization of Graphene Nanoplatelets and Its Composite Films

The characterization of the graphene nanoplatelets was performed by Raman spectroscopy. The average spectra for the graphene nanoplatelets are shown in Figure 2. Curve (a) in Figure 2 shows the average Raman spectra of the graphene nanoplatelets before deposition, while curve (b) shows the Raman spectra of the film after deposition. There is no noticeable difference between the graphene spectra before and after deposition due to an overwhelmingly high percentage of filler in the film. It can be noticed that two bands are located at 1350 cm 1 and 1570 cm 1 . These can be attributed to the breathing mode of the graphene ring (D peak) and the in-plane stretching of the s p 2 carbon (G peak). A third band is seen at 2690 cm 1 (2D peak). This third band is an overtone of the D band [49]. These attributes are typical of graphene-based materials, while the defects in the structure of graphene can be confirmed by the presence of the D peak [46,47]. The multilayered structure of graphene can be confirmed from the intensity of the G peak, which is twice as that of the 2D peak [21].
A morphology determination of the graphene flakes and the films was performed by SEM characterization. The SEM images are shown in Figure 3 for graphene flakes and in Figure 4 for the film. The two-dimensional nature of graphene can be confirmed from the SEM image of the filler (Figure 3a). It can be seen that they are numerous and thus following a network interconnecting each other [50]. The SEM image of the filler (Figure 3b) shows an individual graphene nanoplatelet with edges that are transparent, showing that the composition of the nanoplatelets is that of a few graphene layers [51,52]. From the SEM images, the approximate dimension of flakes can be estimated to be 300 nm.
The SEM images of the graphene film after the deposition process are shown in Figure 4. The zoomed-out image (Figure 4a) shows that the nanoplatelets are well-dispersed in the binder matrix. The zoomed-in image of Figure 4b shows that the graphene nanoplatelets retain their shape after being dispersed in the binder. The SEM images lead to some morphological observations about the structure of the graphene film. A partially crumpled structure with irregular agglomeration and stacked arrangement of flakes can be observed. The multi-layer region is well-distributed across the whole surface. The average number of layers is the same provided the image is characterized by homogeneous dark grey areas [53]. The light grey areas represent the reduction in the number of layers of graphene.
Figure 4. SEM image of graphene film with different magnifications: (a) magnification of 10 μ m, (b) magnification of 1 μ m. Taken from [54].
Carbon 09 00063 g004

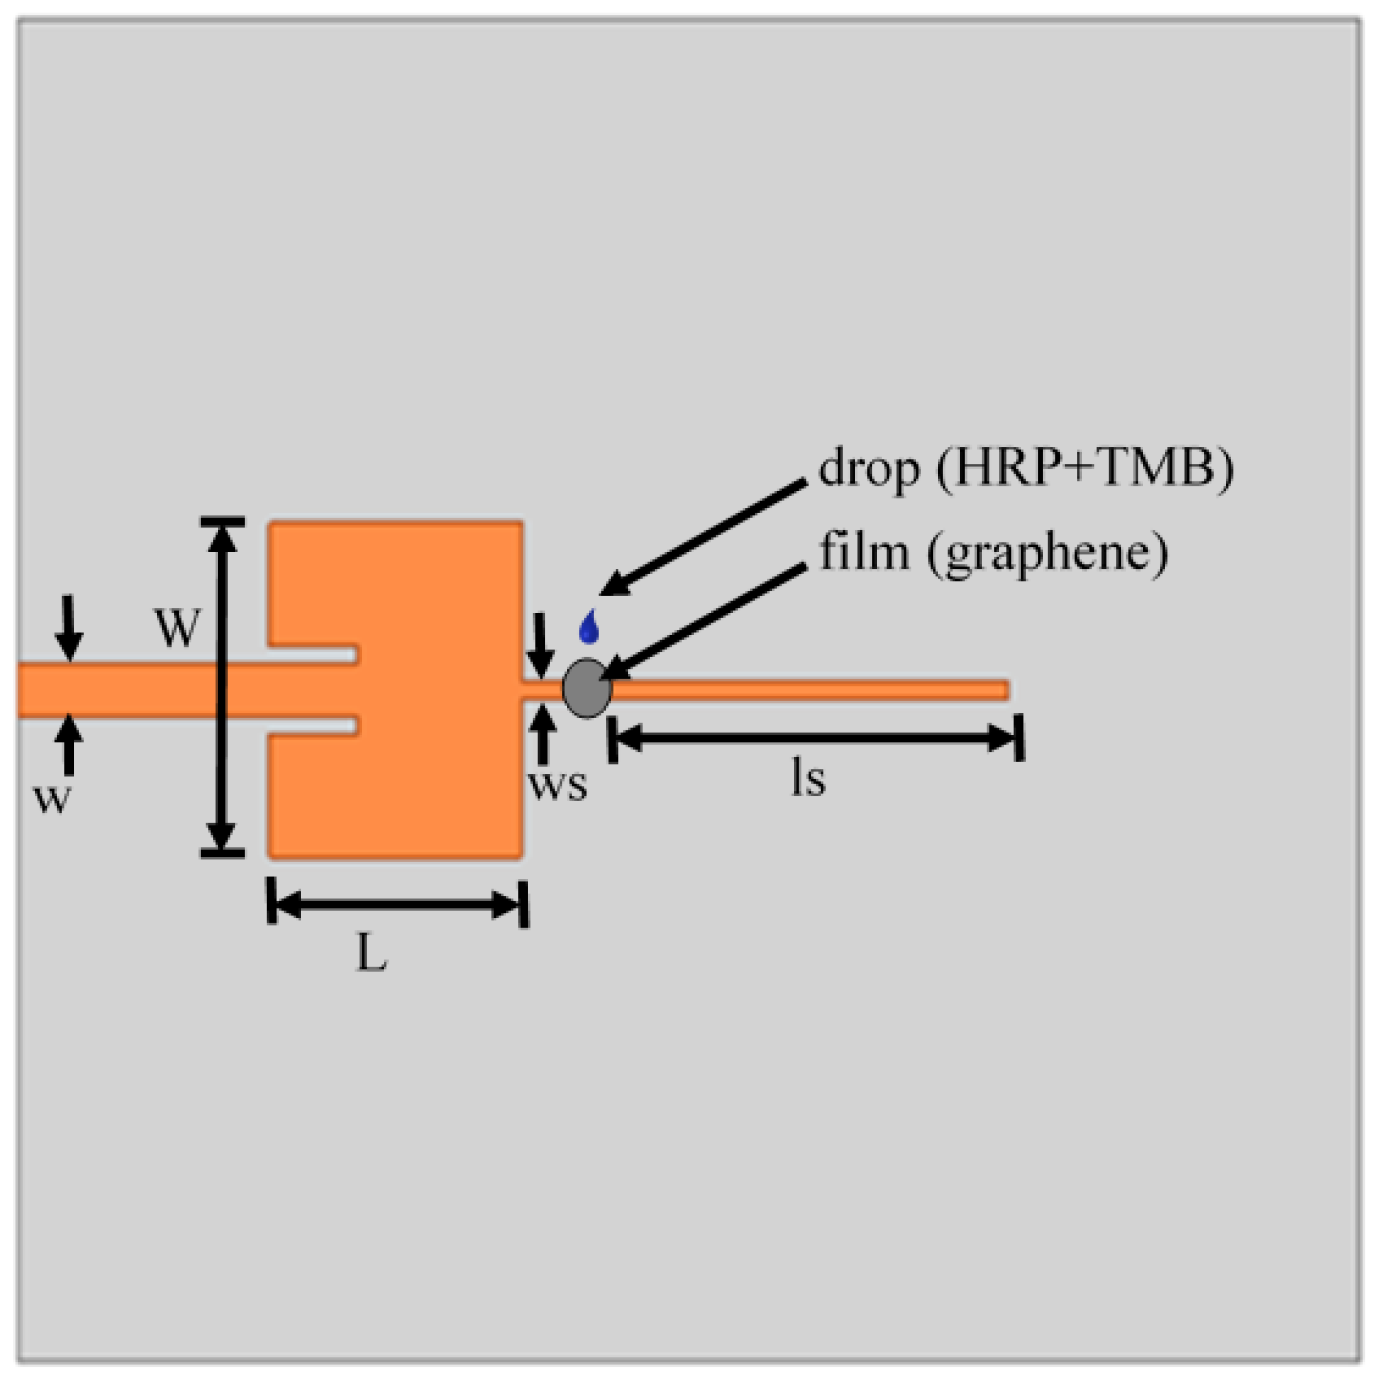
3.2. Sensor Design and Realization

The antenna is designed on Rogers Kappa 438 dielectric substrate that has permittivity ϵ r = 4.38 , loss tangent tan δ = 0.005 , and thickness h = 1.52  mm. The patch itself is made of copper and has a metal thickness t = 32 μ m. The length of the patch is L = 15  mm and it has a width of w = 20  mm. The length of the feed line is 5.5  mm and its width is 3.2  mm. The length of the feed line is optimized to minimize the mismatch at the input of the microstrip antenna. The transmission line characteristic impedance is 50 Ω . The stubs are of equal width of 1 mm, which corresponds to a characteristic impedance of 100 Ω . The length of the gap between the stubs is 2 mm.
Several prototypes were realized and three of them used to detect various concentration of HRP. The prototypes were named from A1 to A8. The prototypes were fabricated with a photolithographic procedure explained in Section 2. We expect a tolerance of approximately ± 0.5  mm on the nominal dimensions. These prototypes are measured with the help of a VNA. The measured reflection coefficients before the film deposition are shown in Figure 5. The tolerances on the nominal dimensions result in a small frequency shift, as for prototype A1 and A8, or in a variation of the value of the reflection coefficient, as for A4 (see Figure 5). The reflection coefficients after the film deposition are shown in Figure 6.
This results in a small frequency shift, as for prototype A1 and A8, or in a variation of the value of the reflection coefficient, as for A4 (see Figure 6). It can be seen that with the introduction of the film, the antenna resonates at a slightly different frequency than its design frequency along with a variation in the mismatch. Such a variation is due to the conductive behavior of the film forming a connection to the open-circuited stub. The surface functionalization of the film does not impact the reflection coefficient of the antenna to a great extent. Nonetheless, the impact of varying concentrations of HRP+TMB will be shown in the following. For sensors A1 and A8, the resonance changes from 25  dB to 4  dB at 4.6  GHz. In the case of sensor A4, the resonance in the presence of the film is 6  dB. Therefore, a better sensitivity to HRP is expected for sensor A4.
The antenna without the film is simulated with the help of HFSS in the frequency band of 4 GHz to 6 GHz. The antenna resonates at the frequency of 4.6  GHz. The comparison between the simulations and the measured reflection coefficient of prototype A1 is shown in Figure 7. The simulated and measured results are in good agreement with each other. However, as expected, the mismatch in reflection coefficient in the measured antenna is slightly higher than in the simulated antenna (see Figure 7).

3.3. Experimental Results

The active area where the chemical process takes place is a film of graphene. The film is round in shape and with a diameter of 5 mm. The surface of the film is functionalized and is exposed to HRP+TMB in different concentrations. This is referred to as the drop. The drop should be of a specific volume ( 30 μ L) in order to cover the surface but not in too much excess so that it does not fall off or contacts the edges of the stub (see Figure 8).
The sensor is connected to a VNA and one-port measurements of the reflection coefficient ( S 11 ) are performed in the frequency band 4–6 GHz. Each time the chemical properties of the film vary, the electrical properties are also varied. This introduces a variation in the input impedance of the stubs and hence the resonant frequency of the antennas is varied. As the aim of this work is to quantify the variation in concentration of HRP+TMB in terms of the frequency shift of the sensor, drops of different concentration are deposited on the film. The resulting reflection coefficients of the sensor are shown in Figure 9 for the prototype A4. In this case, concentrations of 0.03  mM, 0.1  mM were applied. It can be seen that with a concentration of 0.03  mM, the antenna resonates at the frequency of 3.12  GHz, giving a shift in frequency of 400 MHz with respect to the reference case; with a concentration of 0.1  mM, the shift in frequency is 480 MHz. Every time a drop of different concentration is deposited on the film, the film is washed with a buffer solution. This shifts the resonant frequency of the antenna back to its initial value.
A similar experiment was performed using prototype A8 with higher concentrations ( 0.3  mM and 0.6  mM), resulting in a frequency shift of 280 MHz and 340 MHz (Figure 10). This excludes the impact of the depositions performed previously on the successive experiments. It also shows that the sensor can be reused multiple times with different concentrations, and HRP concentration detection is still possible.

4. Conclusions

Electrical detection of the concentration of HRP+TMB has been performed with the help of functionalized surface of graphene-based films. The method can be used to detect other types of peroxidases provided the functionalization of the film is carried out to detect the chosen molecules. Passive sensors based on a patch antenna connected to an open-circuited stub have been used as sensing elements. The active part is a graphene-based film fabricated and doctor bladed onto the radio-frequency substrate. Raman spectra show a good-quality multi-layer graphene, with unchanged physical properties before and after the deposition. It has been shown that the return loss and resonant frequency of a patch antenna sensor varies with varying concentration of HRP+TMB, which can be used as an additional method in concentration detection along with spectrophotometric methods. Given HRP concentration varying between 0.01 mM and 0.6 mM, the maximum measured variation in the resonating frequency is 480 MHz.
The antenna design can be improved by taking into account the presence of the graphene film and the connected open stub. A characterization of the graphene film with and without functionalization is necessary to perform simulations with HFSS during the subsequent steps. Such characterization is in progress and it will be the object of future work. The introduction of a circuital model of the conductive film would be a step forward in such a direction, leading to a drop in the resonance peak magnitude.

Author Contributions

Conceptualization, P.S. and M.Y.; methodology; software, F.P.; validation, P.S. and M.Y.; writing—original draft preparation, P.S. and M.Y.; visualization, F.P.; funding acquisition, P.S. All authors have read and agreed to the published version of the manuscript.

Funding

This research was partially funded by Proof of Concept 2018 program, Venture Factory, Milan, Italy.

Data Availability Statement

Not applicable.

Acknowledgments

The authors thank Gianluca Palmara for the valuable contribution during the measurements, Pietro Zaccagnini for the film realization, and Alessandro Chiadò and Francesca Frascella for the film functionalization.

Conflicts of Interest

The authors declare no conflict of interest.

References

  1. Li, B.; Zhong, W.H. Review on polymer/graphite nanoplatelet nanocomposites. J. Mater. Sci. 2011, 46, 5595–5614. [Google Scholar] [CrossRef]
  2. Hill, E.W.; Vijayaragahvan, A.; Novoselov, K. Graphene sensors. IEEE Sens. J. 2011, 11, 3161–3170. [Google Scholar] [CrossRef]
  3. Kymakis, E.; Stratakis, E.; Stylianakis, M.; Koudoumas, E.; Fotakis, C. Spin coated graphene films as the transparent electrode in organic photovoltaic devices. Thin Solid Film. 2011, 520, 1238–1241. [Google Scholar] [CrossRef]
  4. Novikov, S.; Lebedeva, N.; Pierz, K.; Satrapinski, A. Fabrication and study of large-area QHE devices based on epitaxial graphene. IEEE Trans. Instrum. Meas. 2015, 64, 1533–1538. [Google Scholar] [CrossRef] [Green Version]
  5. Kiraly, B.; Jacobberger, R.M.; Mannix, A.J.; Campbell, G.P.; Bedzyk, M.J.; Arnold, M.S.; Hersam, M.C.; Guisinger, N.P. Electronic and mechanical properties of graphene–germanium interfaces grown by chemical vapor deposition. Nano Lett. 2015, 15, 7414–7420. [Google Scholar] [CrossRef]
  6. Hyun, W.J.; Secor, E.B.; Hersam, M.C.; Frisbie, C.D.; Francis, L.F. High-resolution patterning of graphene by screen printing with a silicon stencil for highly flexible printed electronics. Adv. Mater. 2015, 27, 109–115. [Google Scholar] [CrossRef] [PubMed]
  7. Novikov, S.; Satrapinski, A.; Lebedeva, N.; Iisakka, I. Sensitivity optimization of epitaxial graphene-based gas sensors. IEEE Trans. Instrum. Meas. 2013, 62, 1859–1864. [Google Scholar] [CrossRef]
  8. Fukuyama, Y.; Elmquist, R.E.; Huang, L.I.; Yang, Y.; Liu, F.H.; Kaneko, N.h. Controlling the fermi level in a single-layer graphene QHE device for resistance standard. IEEE Trans. Instrum. Meas. 2015, 64, 1451–1454. [Google Scholar] [CrossRef]
  9. Leng, X.; Li, W.; Luo, D.; Wang, F. Differential structure with graphene oxide for both humidity and temperature sensing. IEEE Sens. J. 2017, 17, 4357–4364. [Google Scholar] [CrossRef]
  10. Sanaeepour, M.; Abedi, A.; Sharifi, M.J. Performance analysis of nanoscale single layer graphene pressure sensors. IEEE Trans. Electron Devices 2017, 64, 1300–1304. [Google Scholar] [CrossRef]
  11. Shi, G.; Liu, T.; Kopecki, Z.; Cowin, A.; Lee, I.; Pai, J.H.; Lowe, S.E.; Zhong, Y.L. A multifunctional wearable device with a graphene/silver nanowire nanocomposite for highly sensitive strain sensing and drug delivery. C 2019, 5, 17. [Google Scholar] [CrossRef] [Green Version]
  12. Dragoman, M.; Neculoiu, D.; Dragoman, D.; Deligeorgis, G.; Konstantinidis, G.; Cismaru, A.; Coccetti, F.; Plana, R. Graphene for microwaves. IEEE Microw. Mag. 2010, 11, 81–86. [Google Scholar] [CrossRef]
  13. Bozzi, M.; Pierantoni, L.; Bellucci, S. Applications of graphene at microwave frequencies. Radioengineering 2015, 24, 661–669. [Google Scholar] [CrossRef]
  14. Pierantoni, L.; Mencarelli, D.; Bozzi, M.; Moro, R.; Moscato, S.; Perregrini, L.; Micciulla, F.; Cataldo, A.; Bellucci, S. Broadband microwave attenuator based on few layer graphene flakes. IEEE Trans. Microw. Theory Tech. 2015, 63, 2491–2497. [Google Scholar] [CrossRef]
  15. Savi, P.; Naishadam, K.; Bayat, A.; Giorcelli, M.; Quaranta, S. Multi-walled carbon nanotube thin film loading for tuning microstrip patch antennas. In Proceedings of the 2016 10th European Conference on Antennas and Propagation (EuCAP), Davos, Switzerland, 10–15 April 2016; pp. 1–3. [Google Scholar]
  16. Yasir, M.; Savi, P.; Bistarelli, S.; Cataldo, A.; Bozzi, M.; Perregrini, L.; Bellucci, S. A planar antenna with voltage-controlled frequency tuning based on few-layer graphene. IEEE Antennas Wirel. Propag. Lett. 2017, 16, 2380–2383. [Google Scholar] [CrossRef]
  17. Yuan, M.; Alocilja, E.C.; Chakrabartty, S. A novel biosensor based on silver-enhanced self-assembled radio-frequency antennas. IEEE Sens. J. 2013, 14, 941–942. [Google Scholar] [CrossRef]
  18. Yuan, M.; Alocilja, E.C.; Chakrabartty, S. Self-powered wireless affinity-based biosensor based on integration of paper-based microfluidics and self-assembled RFID antennas. IEEE Trans. Biomed. Circuits Syst. 2016, 10, 799–806. [Google Scholar] [CrossRef]
  19. Su, W.; Xu, J.; Ding, X. An electrochemical pH sensor based on the amino-functionalized graphene and polyaniline composite film. IEEE Trans. Nanobiosci. 2016, 15, 812–819. [Google Scholar] [CrossRef]
  20. Curulli, A. Functional Nanomaterials Enhancing Electrochemical Biosensors as Smart Tools for Detecting Infectious Viral Diseases. Molecules 2023, 28, 3777. [Google Scholar] [CrossRef]
  21. Wu, H.W. Label-free and antibody-free wideband microwave biosensor for identifying the cancer cells. IEEE Trans. Microw. Theory Tech. 2016, 64, 982–990. [Google Scholar] [CrossRef]
  22. Song, S.; Shen, H.; Wang, Y.; Chu, X.; Xie, J.; Zhou, N.; Shen, J. Biomedical application of graphene: From drug delivery, tumor therapy, to theranostics. Colloids Surf. B Biointerfaces 2020, 185, 110596. [Google Scholar] [CrossRef]
  23. Purr, F.; Lowe, R.D.; Stehr, M.; Singh, M.; Burg, T.P.; Dietzel, A. Biosensing based on optimized asymmetric optofluidic nanochannel gratings. Micro Nano Eng. 2020, 8, 100056. [Google Scholar] [CrossRef]
  24. Nikoleli, G.P.; Siontorou, C.G.; Nikolelis, D.P.; Bratakou, S.; Karapetis, S.; Tzamtzis, N. Biosensors based on lipid modified graphene microelectrodes. C 2017, 3, 9. [Google Scholar] [CrossRef] [Green Version]
  25. Bernacka-Wojcik, I.; Senadeera, R.; Wojcik, P.J.; Silva, L.B.; Doria, G.; Baptista, P.; Aguas, H.; Fortunato, E.; Martins, R. Inkjet printed and “doctor blade” TiO2 photodetectors for DNA biosensors. Biosens. Bioelectron. 2010, 25, 1229–1234. [Google Scholar] [CrossRef]
  26. Marzo, A.M.L.; Mayorga-Martinez, C.C.; Pumera, M. 3D-printed graphene direct electron transfer enzyme biosensors. Biosens. Bioelectron. 2020, 151, 111980. [Google Scholar] [CrossRef]
  27. Pogăcean, F.; Varodi, C.; Măgeruşan, L.; Pruneanu, S. Highly Sensitive Graphene-Based Electrochemical Sensor for Nitrite Assay in Waters. Nanomaterials 2023, 13, 1468. [Google Scholar] [CrossRef]
  28. Jang, C.; Lee, H.J.; Yook, J.G. Radio-frequency biosensors for real-time and continuous glucose detection. Sensors 2021, 21, 1843. [Google Scholar] [CrossRef] [PubMed]
  29. Ferrari, A.C.; Meyer, J.C.; Scardaci, V.; Casiraghi, C.; Lazzeri, M.; Mauri, F.; Piscanec, S.; Jiang, D.; Novoselov, K.S.; Roth, S.; et al. Raman spectrum of graphene and graphene layers. Phys. Rev. Lett. 2006, 97, 187401. [Google Scholar] [CrossRef] [PubMed] [Green Version]
  30. Lee, H.J.; Yook, J.G. Recent research trends of radio-frequency biosensors for biomolecular detection. Biosens. Bioelectron. 2014, 61, 448–459. [Google Scholar] [CrossRef] [PubMed]
  31. Park, B.; Park, H.G.; Ji, J.h.; Cho, J.; Jun, S.C. A reduced graphene oxide based radio frequency glucose sensing device using multi-dimensional parameters. Micromachines 2016, 7, 136. [Google Scholar] [CrossRef] [Green Version]
  32. Zhang, X.; Wang, S.; Dao, J.; Guo, J.; Gao, Y. A colorimetric sensing platform for the determination of H2O2 using 2D–1D MoS2-CNT nanozymes. RSC Adv. 2022, 12, 28349–28358. [Google Scholar] [CrossRef] [PubMed]
  33. Shen, L.; Hagen, J.A.; Papautsky, I. Point-of-care colorimetric detection with a smartphone. Lab Chip 2012, 12, 4240–4243. [Google Scholar] [CrossRef] [PubMed]
  34. Umasankar, Y.; Unnikrishnan, B.; Chen, S.M.; Ting, T.W. Graphene impregnated with horseradish peroxidase multimer for the determination of hydrogen peroxide. Anal. Methods 2012, 4, 3653–3660. [Google Scholar] [CrossRef]
  35. Bocanegra-Rodríguez, S.; Jornet-Martínez, N.; Molins-Legua, C.; Campíns-Falcó, P. New reusable solid biosensor with covalent immobilization of the horseradish peroxidase enzyme: In situ liberation studies of hydrogen peroxide by portable chemiluminescent determination. ACS Omega 2020, 5, 2419–2427. [Google Scholar] [CrossRef] [PubMed] [Green Version]
  36. Li, X.; Wang, L.; Wang, B.; Zhang, S.; Jiang, M.; Fu, W.; Sun, W. Preparation and application of electrochemical horseradish peroxidase sensor based on a black phosphorene and single-walled carbon nanotubes nanocomposite. Molecules 2022, 27, 8064. [Google Scholar] [CrossRef]
  37. Natsuki, T.; Yiwada, A.; Natsuki, J. Influence of temperature on vibrational frequency of graphene sheet used as nano-scale sensing. C 2017, 3, 4. [Google Scholar] [CrossRef] [Green Version]
  38. Chrouda, A.; Ayed, D.; Elamin, M.B.; Ali, S.M.A.; Alhaidari, L.M.; Bessueille, F.; Jaffrezic-Renault, N. Design of a Boron-Doped Diamond Microcell Grafted with HRP for the Sensitive and Selective Detection of Ochratoxin A. Chemosensors 2023, 11, 176. [Google Scholar] [CrossRef]
  39. Chaudhary, K.; Kumar, K.; Venkatesu, P.; Masram, D.T. Protein immobilization on graphene oxide or reduced graphene oxide surface and their applications: Influence over activity, structural and thermal stability of protein. Adv. Colloid Interface Sci. 2021, 289, 102367. [Google Scholar] [CrossRef]
  40. Evtugyn, G.A.; Goldfarb, O.; Budnikov, H.; Ivanov, A.; Vinter, V. Amperometric DNA-peroxidase sensor for the detection of pharmaceutical preparations. Sensors 2005, 5, 364–376. [Google Scholar] [CrossRef] [Green Version]
  41. Sharafeldin, M.; McCaffrey, K.; Rusling, J.F. Influence of antibody immobilization strategy on carbon electrode immunoarrays. Analyst 2019, 144, 5108–5116. [Google Scholar] [CrossRef]
  42. Koposova, E.; Liu, X.; Kisner, A.; Ermolenko, Y.; Shumilova, G.; Offenhäusser, A.; Mourzina, Y. Bioelectrochemical systems with oleylamine-stabilized gold nanostructures and horseradish peroxidase for hydrogen peroxide sensor. Biosens. Bioelectron. 2014, 57, 54–58. [Google Scholar] [CrossRef] [PubMed]
  43. Chiadò, A.; Palmara, G.; Ricciardi, S.; Frascella, F.; Castellino, M.; Tortello, M.; Ricciardi, C.; Rivolo, P. Optimization and characterization of a homogeneous carboxylic surface functionalization for silicon-based biosensing. Colloids Surf. B Biointerfaces 2016, 143, 252–259. [Google Scholar] [CrossRef] [PubMed]
  44. Palmara, G. Microcantilever-Based Sensing Arrays for Evaluation of Biomolecular Interactions. Ph.D. Thesis, Politecnico di Torino, Piedmont, Italy, 2016. [Google Scholar] [CrossRef]
  45. Bokobza, L.; Bruneel, J.L.; Couzi, M. Raman spectra of carbon-based materials (from graphite to carbon black) and of some silicone composites. C 2015, 1, 77–94. [Google Scholar] [CrossRef] [Green Version]
  46. Wu, J.B.; Lin, M.L.; Cong, X.; Liu, H.N.; Tan, P.H. Raman spectroscopy of graphene-based materials and its applications in related devices. Chem. Soc. Rev. 2018, 47, 1822–1873. [Google Scholar] [CrossRef] [PubMed] [Green Version]
  47. Yang, D.; Velamakanni, A.; Bozoklu, G.; Park, S.; Stoller, M.; Piner, R.D.; Stankovich, S.; Jung, I.; Field, D.A.; Ventrice, C.A., Jr.; et al. Chemical analysis of graphene oxide films after heat and chemical treatments by X-ray photoelectron and Micro-Raman spectroscopy. Carbon 2009, 47, 145–152. [Google Scholar] [CrossRef]
  48. Frascella, F.; Ricciardi, C. Functionalization protocols of silicon micro/nano-mechanical biosensors. In Nanomaterial Interfaces in Biology: Methods and Protocols; Humana Press: Totowa, NJ, USA, 2013; pp. 109–115. [Google Scholar]
  49. Roppolo, I.; Chiappone, A.; Bejtka, K.; Celasco, E.; Chiodoni, A.; Giorgis, F.; Sangermano, M.; Porro, S. A powerful tool for graphene functionalization: Benzophenone mediated UV-grafting. Carbon 2014, 77, 226–235. [Google Scholar] [CrossRef]
  50. Yasir, M.; Savi, P. Dynamically Tunable Phase Shifter with Commercial Graphene Nanoplatelets. Micromachines 2020, 11, 600. [Google Scholar] [CrossRef]
  51. Yasir, M.; Savi, P. Commercial graphene nanoplatelets-based tunable attenuator. Electron. Lett. 2020, 56, 184–187. [Google Scholar] [CrossRef]
  52. Yasir, M.; Fatikow, S.; Haenssler, O.C. Amplitude-Phase Variation in a Graphene-Based Microstrip Line. Micromachines 2022, 13, 1039. [Google Scholar] [CrossRef]
  53. Kumar, V.; Kumar, A.; Lee, D.; Park, S. Estimation of number of graphene layers using different methods: A focused review. Materials 2021, 14, 4590. [Google Scholar] [CrossRef]
  54. Yasir, M.; Savi, P.; Palmara, G.; Frascella, F.; Chiado, A.; Zaccagnini, P. Detection of HRP at microwave frequency with functionalized graphene film. In Proceedings of the 2022 International Conference on Electromagnetics in Advanced Applications (ICEAA), Cape Town, South Africa, 5–9 September 2022; pp. 323–325. [Google Scholar]
Figure 1. Geometry of the sensor with the functionalized graphene film.
Carbon 09 00063 g001
Figure 2. Raman characterization of the film and its contents: (a) graphene flakes, (b) film.
Carbon 09 00063 g002
Figure 3. SEM of graphene nanoplatelets with different magnifications: (a) magnification of 200 nm, (b) magnification of 100 nm.
Carbon 09 00063 g003
Figure 5. Measured reflection coefficient of three prototypes without film.
Carbon 09 00063 g005
Figure 6. Measured reflection coefficient of three prototypes with film.
Carbon 09 00063 g006
Figure 7. HFSS simulations and measured reflection coefficient.
Carbon 09 00063 g007
Figure 8. Sensor with drop of HRP.
Carbon 09 00063 g008
Figure 9. Measured reflection coefficient of the sensor with a drop of HRP with different concentrations (prototype A4).
Carbon 09 00063 g009
Figure 10. Measured reflection coefficient of the sensor with a drop of HRP with different concentrations (prototype A8).
Carbon 09 00063 g010
Disclaimer/Publisher’s Note: The statements, opinions and data contained in all publications are solely those of the individual author(s) and contributor(s) and not of MDPI and/or the editor(s). MDPI and/or the editor(s) disclaim responsibility for any injury to people or property resulting from any ideas, methods, instructions or products referred to in the content.

