1. Introduction
Doxorubicin (
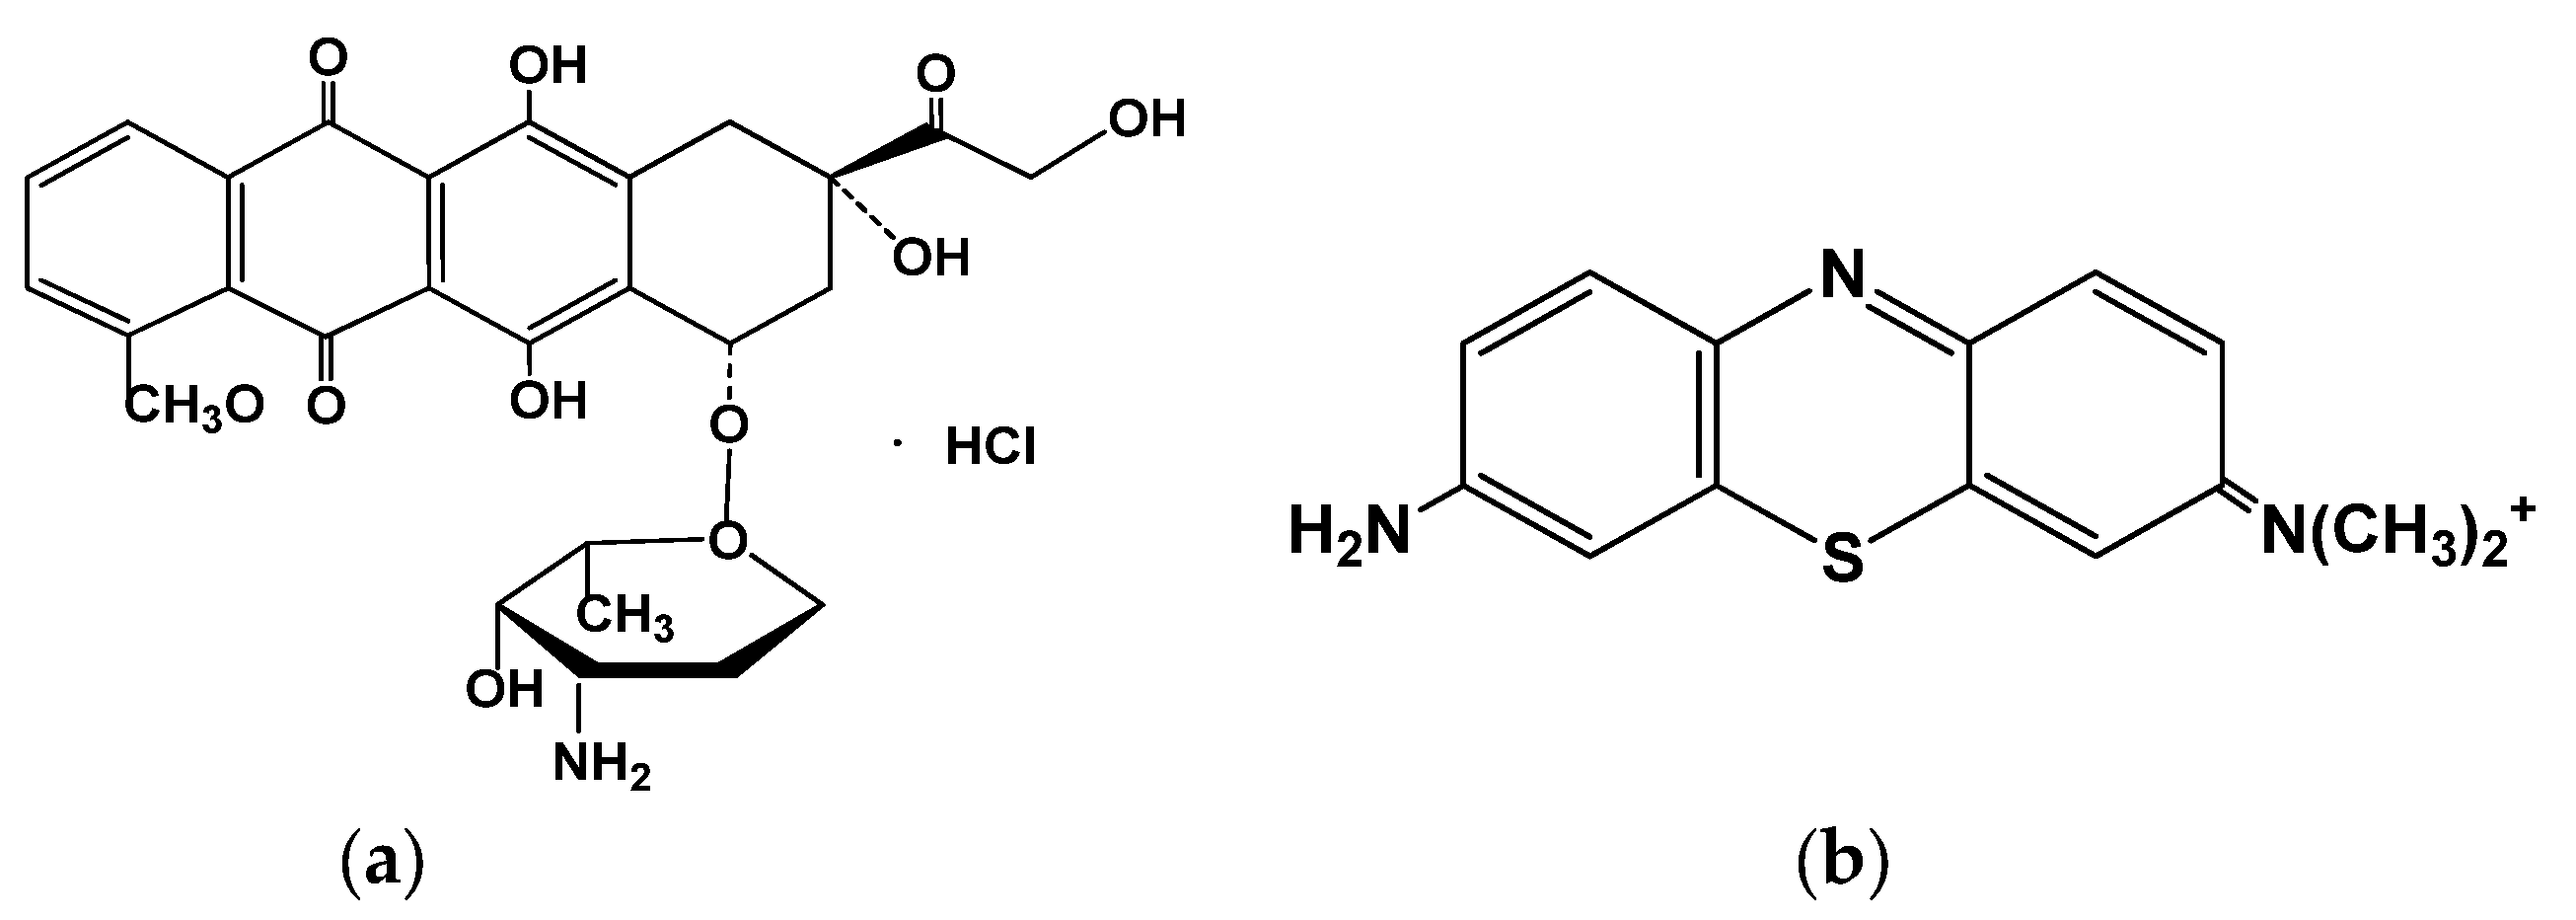
Figure 1), a 14-hydroxyl derivative of daunorubicin, belongs to the first generation of anthracycline antitumor antibiotics with a broad action spectrum. It can be used in child and adult treatment of acute lymphoblastic and myeloblastic leukemia, soft tissue and bone sarcomas, neuroblastoma, Hodgkin’s and malignant lymphoma, and many types of carcinomas [
1,
2,
3].
Doxorubicin has been applied in tumor treatment since 1974, and it exhibits good solubility in water and polar organic solvents [
1]. High cardiotoxicity caused by oxidative stress is the most dangerous doxorubicin side effect [
4,
5]. Cardiotoxicity is dose dependent, and the toxic level depends on individual patient specificity. Cytostatic drugs are present in biological fluids of oncology patients at subnanomolar concentrations, so there is an urgent need for detecting doxorubicin at its low levels in complex biological matrices. Today, doxorubicin can be detected by several physicochemical methods, such as spectrofluorimetry [
6], spectrophotometry [
7], surface plasmon resonance [
8], high performance liquid chromatography (HPLC) with UV [
9], or fluorometric [
10] detector and electrochemical methods [
11,
12]. Chromatographic approaches show high sensitivity and selectivity, but are time-consuming and require high-cleaned solvents and reactants, as well as high qualification of staff. Along with physicochemical methods, bioanalytical techniques are also considered for cytostatic drug monitoring and occupational exposure evaluation [
13]. Electrochemical methods of doxorubicin determination offer many advantages over conventional instrumentation techniques; i.e., simpler design, cost-effective measurement protocol, intuitively understandable mechanism of signal generation, simple robust design of appropriate sensors compatible with point-of-care diagnostics devices, and application outside biochemical laboratory.
In biosensor design, DNA is often used as a bioreceptor for detection of the biorecognition event between the double-stranded DNA helix and intercalators [
14,
15,
16]. DNA—anthracycline interactions cause changes in bioreceptor volume, charge distribution, configuration, and arrangement in the biorecognition layer. The resulting response depends on the molar mass of the DNA molecules and their source. All the factors affecting the DNA—intercalator interactions are the subject of optimization to amplify the signal and increase sensitivity of the analyte determination. Regarding doxorubicin, its reaction with DNA implemented in the assembly of the DNA-sensor is frequently applied as a model system for the elaboration of effective approaches to the detection of other anthracycline medications. Doxorubicin determination is based on the intercalation phenomena, so that all other anthracycline antitumor drugs exert similar effects on the response. Meanwhile, it has been previously shown that sulfonamide drugs do not interfere with the anthracycline detection [
14]. The effect of stabilizers applied in appropriate medicines (mannite, lactose, etc.), serum proteins, urine components, and plasma electrolytes can be suppressed by dilution of the samples. The effect of such a protocol should be assessed on the stage of sample treatment optimization.
Carbon nanomaterials are widely used in assembling various biosensors due to unique opportunities related to their electroconductivity, high mechanical durability, biocompatibility, thermal and chemical stability, functionalization varieties, etc. [
17]. They improve the electron exchange on the electrode interface, enhance the effective surface area of the electrode, and quantities of bioreceptors, including DNA that are accumulated on the electrode, and provide a high and durable analytical signal. Graphene and its related materials [
18], carbon nanotubes [
19], graphitic carbon nitride [
20], CB [
21], fullerenes [
22], and carbon dots [
23] can be used in biosensor assembling. Carbon nanomaterials are highly compatible with other additives accumulating analytes or providing the selectivity of their determination by electrochemical methods [
24,
25].
Redox-active and electroconductive polymers are widespread in biosensor assemblies [
26,
27]. They convert the biorecognition event to the electrical signal (current or charge transfer resistance). In most of such materials, the DNA-analyte interaction influences redox equilibrium of the polymer due to changes in the charge distribution and the stabilization of oxidized (cationic) or reduced (neutral) forms of the polymer. Such changes can be quantified by the signals of the redox indicators using direct current voltammetry or electrochemical impedance spectroscopy (EIS), or by the electrochemical activity of the polymer matrix.
Electropolymerization, as a main protocol of the formation of such redox active polymer layers on the electrode interface, offers broad opportunities for modification of the electrodes different in size and geometry, and makes it possible to control the thickness of electropolymerized layer and entrapment of the DNA molecules in the growing polymer film or on its surface. Electrode surface modification can be performed using a layer-by-layer method or by combining some steps to accelerate the modification process and obtain some new materials with outstanding properties. Recently, new ways of one-step electropolymerization from the suspension of carbon nanomaterials and monomers have appeared. Such combinations adduced to sensitivity and electrocatalytic activity enhance appropriate biosensor devices. All spectrum of carbon nanomaterials can be used in this approach [
28,
29,
30], including composites with redox-active [
31] and electroconductive [
32] materials. Carbon nanomaterials improve the electroconductivity and mechanical strength of the resulting composite material by including the electropolymerization process in 3D nanostructures with large surface area, unique geometry, and electrical characteristics.
In this work, we describe for the first time the determination of doxorubicin with DNA-sensors based on one-step electropolymerization of the suspension of the phenothiazine dye Azure A and carbon nanomaterials—CB or fMWCNTs. GCE was used as a transducer due to its higher mechanical durability and having more reproducible surface characteristics against other common electrodes, e.g., carbon paste and pencil graphite electrodes [
33]. Double stranded DNA was immobilized as a biorecognizing element via physical sorption on the electrode surface. To enhance the sensitivity of doxorubicin detection, DNA was saturated with MB. Doxorubicin competes with the MB molecules for binding sites, and the released molecules of the dye leave the layer. This changes their voltammetric signal. The nature of carbon nanomaterials strongly affects the analytical characteristics of doxorubicin detection.
2. Materials and Methods
2.1. Reagents
Azure A (dye content 80%) (
Figure 1), doxorubicin hydrochloride, deoxyribonucleic acid (DNA) from fish sperm, methylene blue (MB), potassium hexacyanoferrate (III) (99%), potassium hexacyanoferrate (II) (98.5–102%), bovine serum albumin (BSA), and fMWCNTs with carboxylic terminal groups were purchased from Sigma-Aldrich (Darmstadt, Germany), chitosan (mol. weight 100,000–300,000 D) from Acros Organics (Geel, Belgium), and CB ENSACO 250G from Imerys (Willebroek, Belgium). Other reagents were of analytical grade. Deionized Millipore Q
® water was used for the preparation of working solutions. Electrochemical measurements were performed in 0.1 M phosphate buffer containing 0.1 M NaNO
3, pH 7.0. In the pH dependence experiments, pH was varied in a range from 2.0 to 9.0. All the solutions were prepared with Millipore Q
® water (Simplicity
® water purification system, Merck-Millipore, Molsheim, France). The doxorubicin preparations Doxorubicin-TEVA
® and Doxorubicin-LANS
® were purchased in the local pharmacy market.
2.2. Apparatus
Voltammetric measurements were performed at ambient temperature using portable bipotentiostat-galvanostat μStat 400 Metrohm DropSens (DropSens, S.L., Asturias Lanera, Spain). A three-electrode cell consisting of the glassy carbon working electrode (GCE, 0.0283 cm2 in diameter), Ni foil auxiliary electrode, and Ag/AgCl/3 M KCl (EVL-1M4 model) as the reference electrode was used.
Scanning electron microscopy (SEM) images of glassy carbon electrodes covered with modifying coatings were obtained with a Merlin™ (Carl Zeiss AG, Oberkochen, Germany) high-resolution field emission scanning electron microscope equipped with an energy dispersion spectrometer, AZtec X-Max.
2.3. One-Step Electropolymerization of Azure A in the Presence of Carbon Nanomaterials and DNA-Sensor Assembling
The GCE was mechanically polished and cleaned with acetone and deionized water. Then, it was electrochemically treated by repeated multiple potential cycling in 0.1 M H2SO4. Carbon nanomaterials suspension with Azure A was prepared by 60 min sonication of 1.8 mg of Azure A and 1.3 mg of CB or 1 mg of fMWCNTs in 1 mL of 0.375% chitosan dissolved in 0.05 M HCl. Then, 2 µL of suspension was dropped on the electrode working area and neutralized with 1.5 µL of 1.0 M NaOH. The electrodes were dried at 60 °C for 10 min, cooled to ambient temperature, and thoroughly washed to remove unbonded components and alkali excess. Based on the ferricyanide cyclic voltammogram and Randles-Sevcik equation, the ratio of effective and geometric surface area was equal to 1.9 for CB and 2.0 for fMWCNTs (both dispersed in chitosan).
In the next step, the electrode modified with suspension was immersed in 5 mL of 0.1 M phosphate buffer containing 0.1 M NaNO
3, pH = 7.0. The Azure A electropolymerization conditions were determined in [
34]. In the case of the Azure A and fMWCNTs suspension, the electrode was polarized at 1.2 V for 300 s, and then its potential was cycled between −0.7 and 1.2 V with a scan rate of 100 mV/s (20 cycles). Finally, the electrode was thoroughly washed with deionized water and phosphate buffer, and dried with air at ambient temperature. In the case of the Azure A and CB suspension, the potentiostatic electrolysis stage was skipped, and only multiple scanning was applied. After electropolymerization, electrodes were immersed in a working buffer with no monomeric Azure A, pH = 7.0, and ten cycles of the potential were performed in a range from—0.6 to 0.8 V until current stabilization. Appropriate surface layers obtained are denoted below as PAA+CB and PAA+fMWCNTs, and the DNA sensor based on appropriate supports as (PAA+CB)/DNA+MB and (PAA+fMWCNTs)/DNA+MB.
The DNA+MB mixture was prepared from equal volumes of 1 mg/mL DNA and 10 mM MB solutions. Maximal signal was achieved for their ratio corresponding to the doubled value that had previously been obtained for full DNA saturation with the dye [
35]. The electrode modified with PAA+CB or PAA+fMWCNTs layer was fixed upside down and 2 µL of DNA+MB mixture was drop-casted on the polymer layer and dried at ambient temperature. The DNA-sensor obtained was washed with deionized water, moved to the phosphate buffer, and 10 cycles of the potential in a range from—0.6 to 0.8 V at 100 mV/s were performed to stabilize the signal by removing unbounded MB molecules from the surface layer.
2.4. Doxorubicin Determination and Real Sample Assay
The DNA-sensor modified with (PAA+CB)/DNA+MB or (PAA+fMWCNTs)/DNA+MB layer was fixed upside down and 2 µL of doxorubicin solution (0.1 pM—0.1 µM) in deionized water was drop-casted on the working surface. The DNA-sensor was then covered with plastic tube for 20 min to prevent drying, washed with deionized water, and dried with air at ambient temperature. Then, the DNA-sensor was transferred to the electrochemical cell for signal measurements performed by cyclic voltammetry.
Ringer-Locke’s solution was taken as the artificial blood plasma sample (9 g/L NaCl, 0.42 g/L KCl, 0.5 g/L NaH2PO4·2H2O, 0.32 g/L CaCl2·2H2O, 0.1 g/L NaHCO3, 0.3 g/L MgSO4, and 1.5 g/L D-glucose), pH 7.0. A moderate level of albumin typical for adult blood serum was selected for the model experiments (41.4 mg/mL BSA dissolved in distilled water).
Artificial urine samples contained 20 mM KCl, 49 mM NaCl, 15 mM KH
2PO
4, 10 mM CaCl
2, 18 mM NH
4Cl, and 18 mM urea [
36]. Human urine samples were collected from healthy volunteers. The pH value of the urine samples was corrected to 7.0. Samples were filtrated if sediment appeared after the pH correction.
3. Results
3.1. Electrochemical Characteristics of PAA+CB and PAA+fMWCNTs Layers
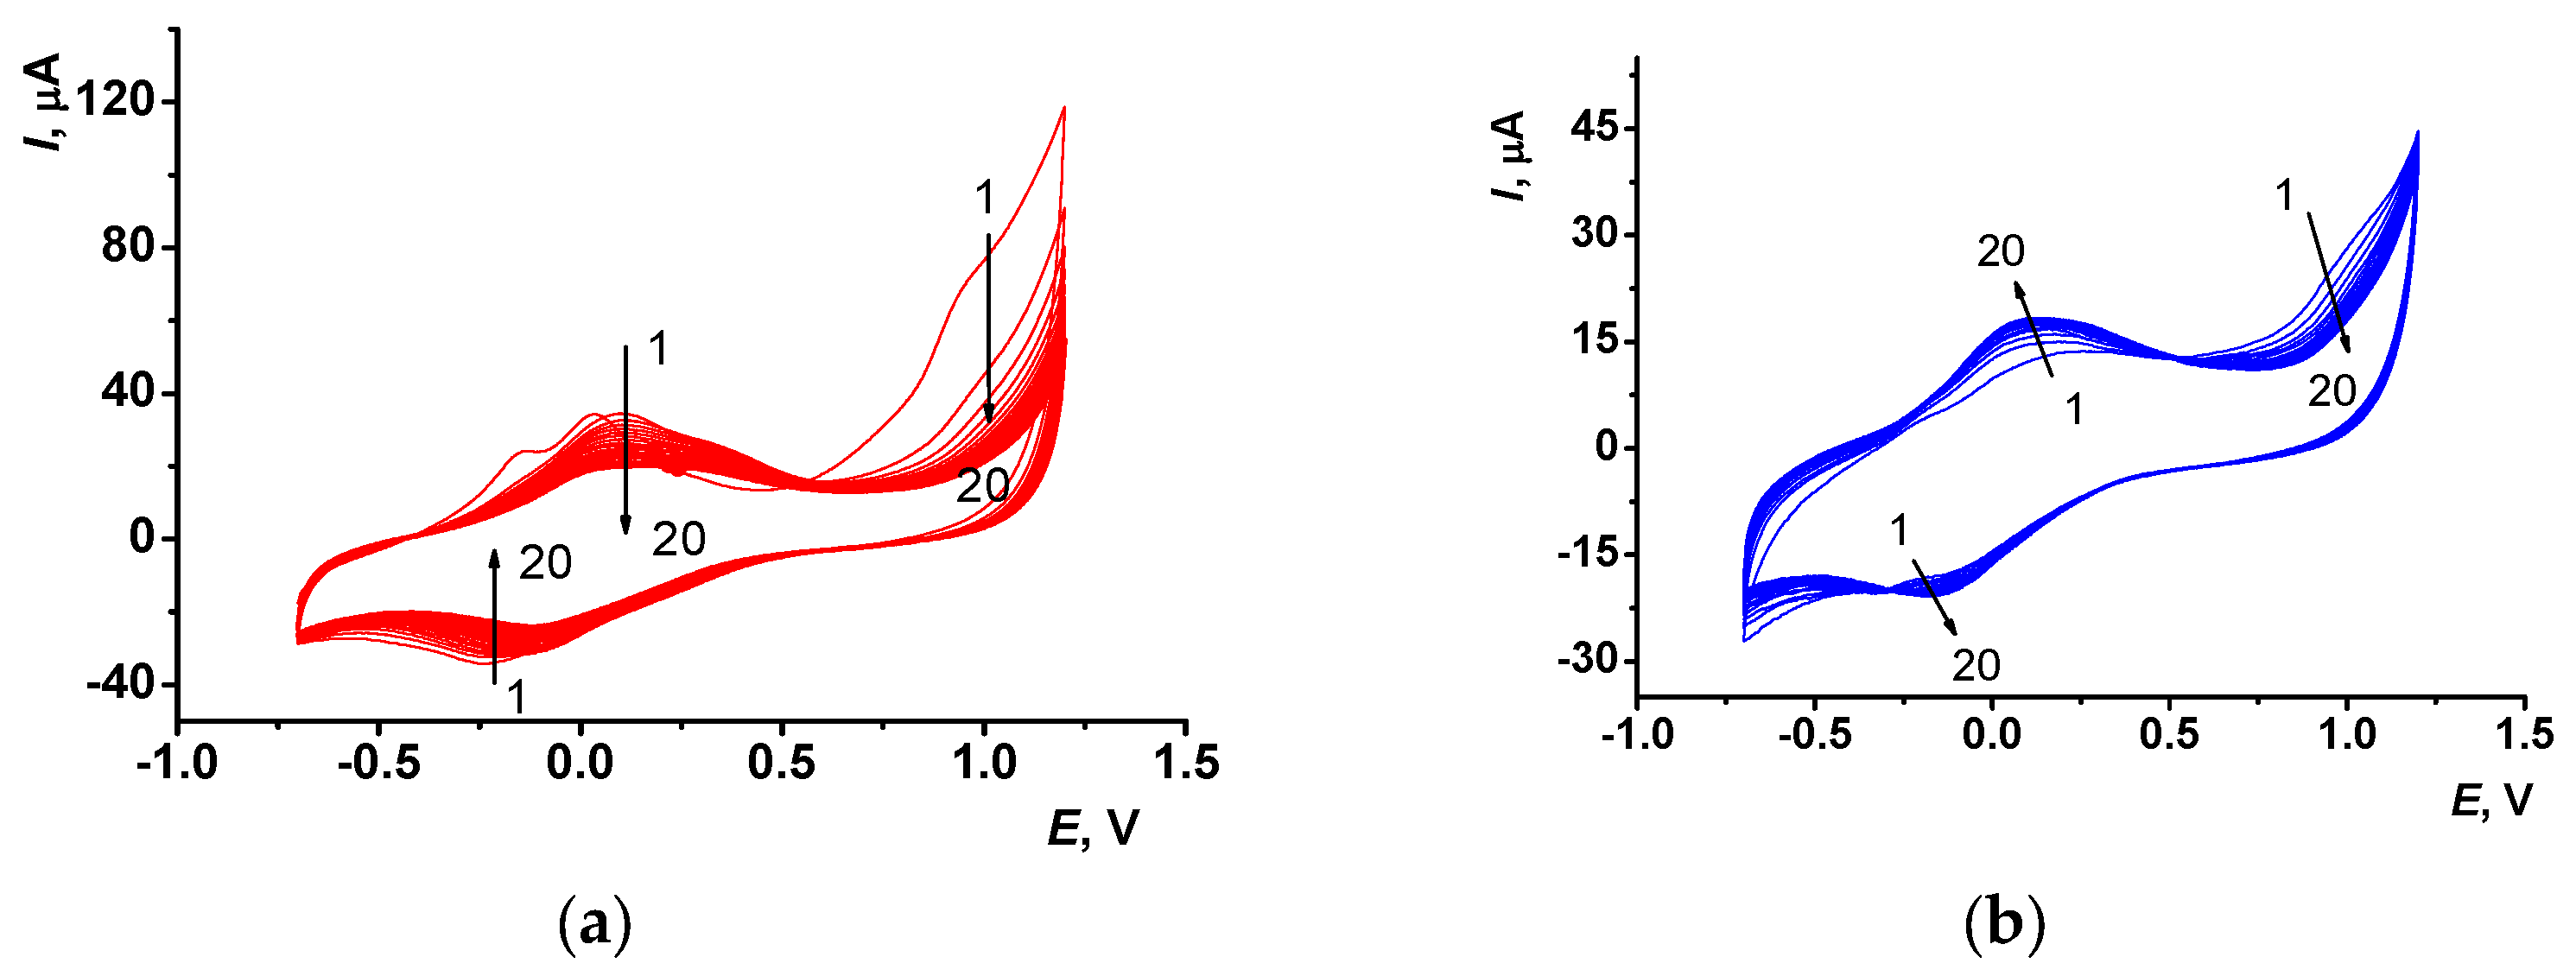
Figure 2 represents cyclic voltammograms recorded for the electropolymerization of Azure A in suspension of CB and fMWCNTs performed in phosphate buffer, pH 7.0. No additional quantities of the monomeric dye were added to the polymerization medium, except that present in suspension aliquot. One-step modification and lower amounts of reagents offer an environmentally friendly approach to electrode modification and biosensor manufacture. Electropolymerization performed with the CB layer resulted in regular decreases of the broaden peaks attributed to the polymeric product formed [
34] (
Figure 2a). This might be due to filling the pores in the carbon nanomaterial followed by the decrease in the effective electrode area. Contrary to that, the application of the fMWCNTs modified GCE led to the consequent increase of the redox peaks at +130 and −180 mV, respectively (
Figure 2b). In this case, the modifier formed a ramified multilayer structure bearing a higher negative charge, so that electropolymerization induced more effective accumulation of the polymer particles on the surface of fMWCNTs, instead of cavity packing. Changes observed at high anodic potentials (
Figure 2a,b) were attributed to the formation of the Azure A dication-radical that initiated electropolymerization [
37].
After transfer to the working buffer with no monomer, the modified GCE showed two distinct peak pairs on the cyclic voltammograms (
Figure 3). Carbon nanomaterials obviously increased the effective surface area accessible for electron transfer against unmodified GCE, so the electropolymerization currents also increased. Phenothiazine dyes usually manifest redox activity of both the monomer entrapped in the surface layer and the polymer formed [
38]. Both peak pairs were then used for electrochemical characterization of the PAA+CB and PAA+fMWCNTs layers.
The stability of electrochemical response was tested for both coatings with six individual electrodes. The polymer signal was found to be more stable against that of the monomeric dye. The reduction peak of the polymer did not depend on the number of measurements consecutively performed in the same buffer with intermediate stirring of the solution, while the oxidation counter peak was stabilized to the fifth measurement. Monomeric dye peak currents grew until the seventh measurement, probably due to increased permeability of the layer.
Monomer and polymer peak currents were affected by the pH value of the solution. Poly(Azure A) redox peaks synchronously changed in the PAA+CB and PAA+fMWCNTs layers. Signals of monomeric and polymeric forms for PAA+fMWCNTs coating were more sensitive to pH and showed higher currents. According to data in
Figure S1 (Supplementary Materials), pH = 7.0 was selected because of the reproducibility of the appropriate signal and its proximity to the pH levels of biological liquids.
The half-sum of the peak potentials of the monomeric and polymeric forms of poly(Azure A) was used as an estimate of the equilibrium redox potential. For the PAA+CB coating, the monomer dye signal demonstrated the Nernstian slope of the pH dependence equal to 59 mV/pH. It corresponded to the transfer of an equal number of electrons and hydrogen ions in the rate-limiting step. In the case of the PAA+fMWCNTs film, the slope increased to 73 mV/pH (pH = 2.0–7.0). This could be attributed to the buffer capacity exerted by the terminal carboxylic groups of the carbon nanotubes. At the higher pH region (pH = 7.0–10.0), the pH sensitivity decreased to 25 mV/pH (transfer of one hydrogen ion and two electrons). This corresponds to the accelerated detachment of the first H+ ion in alkaline media.
Polymeric forms of the dyes obtained in the case of the PAA+CB and PAA+fMWCNTs coatings showed around the same slope of 49 and 46 mV/pH, respectively, in the pH range from 2 to 7. It could be explained by the buffer effects exerted by the modifiers in the surface layer, making the intrinsic pH of the surface layer different from that of the buffer solution.
Bi-logarithmic dependence of the peak current (Ip) on the scan rate (ν) was applied for an assessment of the limiting step of the redox reactions. Monomeric dye forms present in the PAA+CB coating showed the slope of the dependence that corresponded to the formal point of view to the diffusion control for the monomer oxidation (d(log Ip)/d(logν) = 0.57 ± 0.04). The reduction peak of the monomer gave a value of 0.28 ± 0.03, which accounted for the contribution of the chemical intermediate steps to the overall process. The polymeric forms associated with the PAA+CB coating demonstrated mixed adsorption–diffusion control (d(log Ip)/d(logν) = 0.74 ± 0.03 and 0.87 ± 0.01, for anodic and cathodic reactions, respectively.
In the case of the PAA+fMWCNTs layer, only polymer oxidation behaved in a similar way to the diffusion control (d(log Ip)/d(logν) = 0.61 ± 0.01). All the other peaks corresponded to a mixed adsorption-diffusion mechanism: d(log Ip)/d(logν) = 0.75 ± 0.02, 0.81 ± 0.1, 0.75 ± 0.02 for monomer oxidation, monomer reduction, and polymer reduction, respectively.
It should be noted that the dependence of the peak currents on the scan rate has been explored in conditions excluding the participation of diffusion-free reactants. All the voltammograms recorded in the buffer with no Azure A were quite stable and did not show any decreasing trends in the series of measurements. This means that formal diffusion control is attributed to the electron exchange between the reduced and oxidized forms of the dye within the surface layer, without their liberation from the films obtained by electropolymerization.
3.2. Scanning Electron Microscopy of Azure A+CB, PAA+CB, Azure A+fMWCNTs, and PAA+fMWCNTs Layers
Assembling the surface layer is commonly monitored by EIS. However, in this case, the use of carbon nanomaterials forming rather porous spongy layers with numerous defects prevented full coverage of the surface with appropriate components. Furthermore, the redox active area of the ferri/ferrocyanide redox probe and that of the polymeric dyes overlapped. This made the use of the impedimetric method uninformative. For this reason, the morphology of the layers was investigated using SEM.
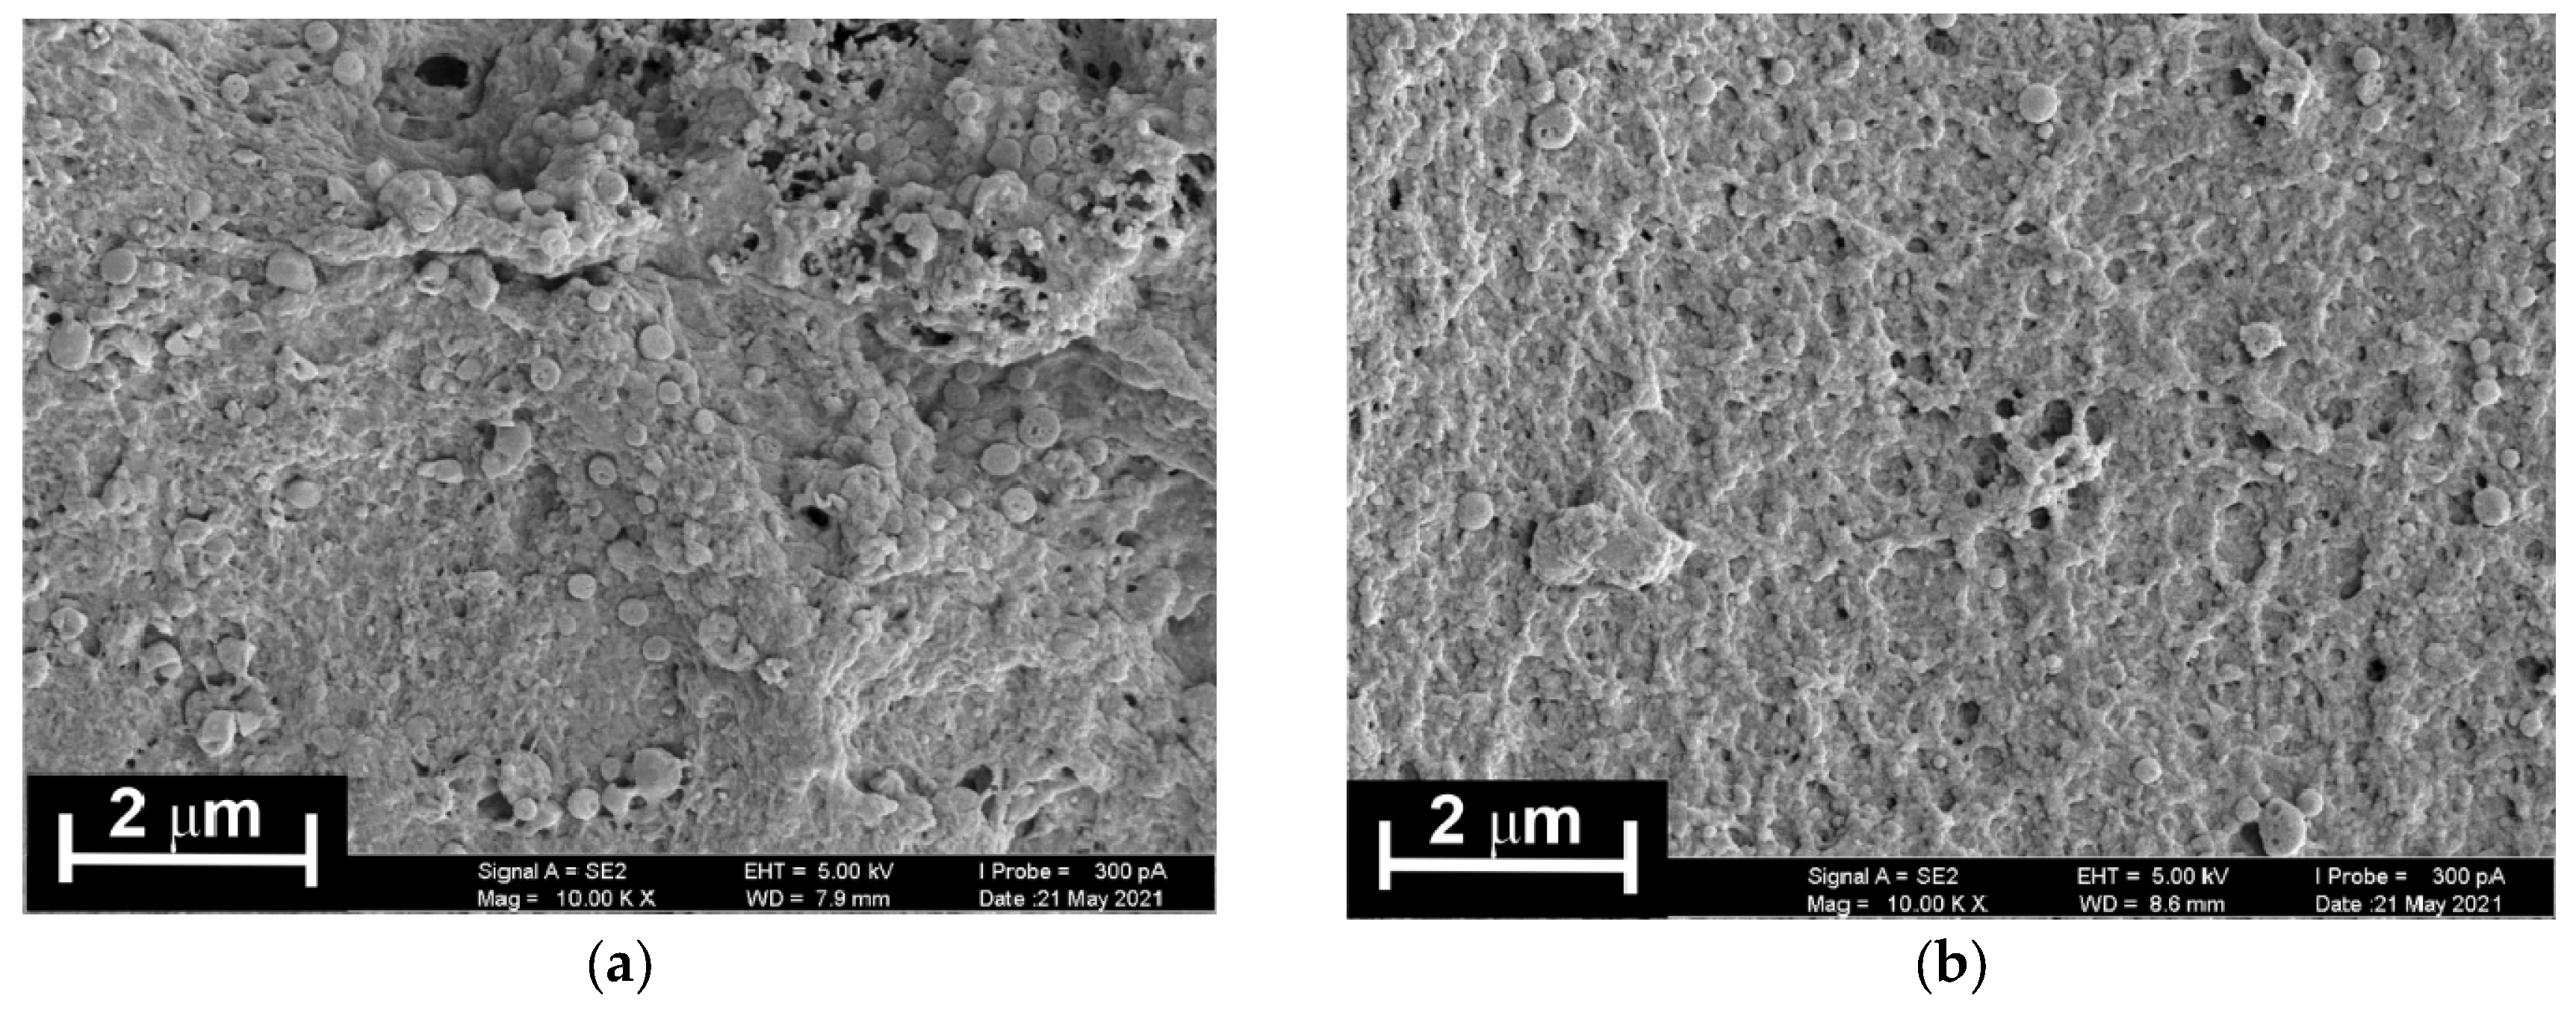
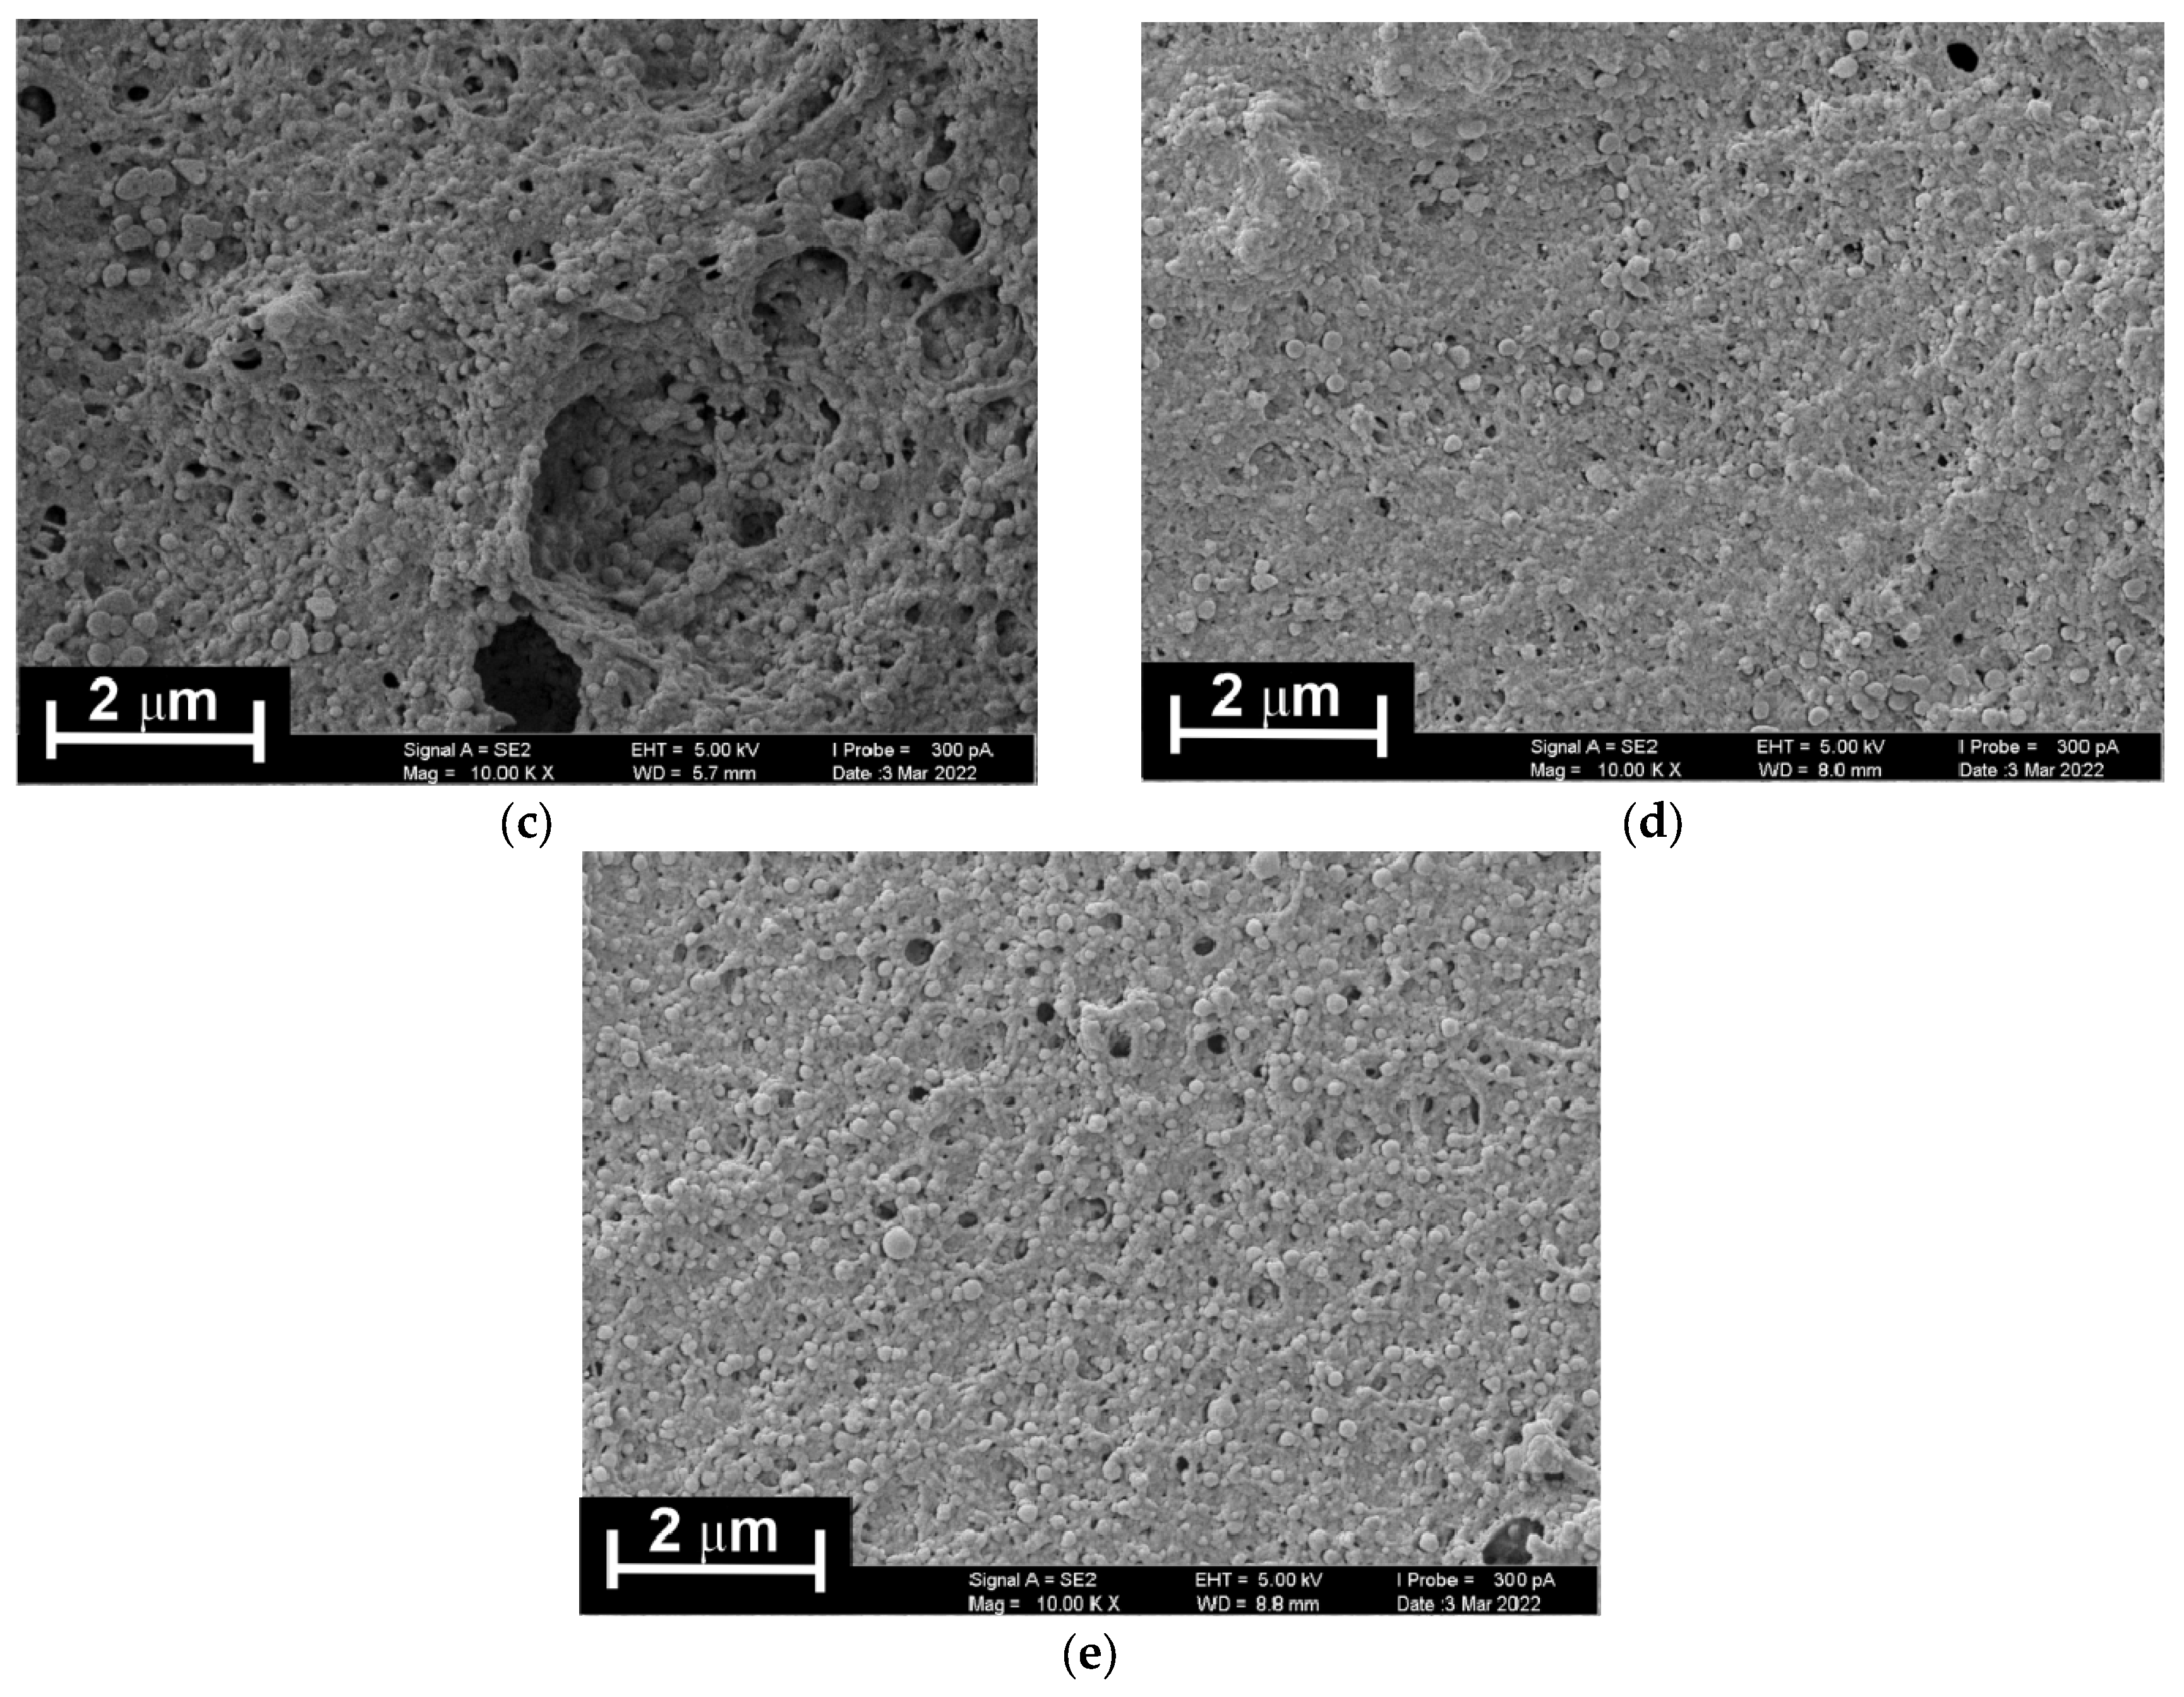
As established by the SEM experiments, dried AA+CB suspension forms on the GCE a dense and bundled coating containing some roundish aggregates with an average diameter of 200–300 nm (
Figure 4a). Their number sharply decayed after the electropolymerization step due to their disaggregation and conversion to fine-granular films. A smooth and uniform surface was obtained due to filling the cavities and free space of the modification layer by the polymeric product (
Figure 4b).
Dried Azure A—fMWCNTs suspension formed a more porous and rough coating against that on the bare electrode (
Figure 4c). Chitosan added as a matrix and filling material prevents the visualization of single nanotubes, contrary to the same coating with fMWCNTs dispersed in dimethylformamide (see
Figure S2 for comparison). Electropolymerization resulted in surface alignment and planarization (
Figure 4d). Stabilization of the surface coating by additional scanning of the potential in the buffer with no monomer resulted in the formation of a more porous surface with an inner volume filled with the fine-granulated polymer particles. Possibly, such a treatment disaggregated the particles of the electrolysis products (
Figure 4e). The removal of weakly bonded products and excessive monomers from the layer promotes better reproducibility of the coating structure and redox signals related to its activity.
3.3. DNA Implementation Effects
Double-stranded DNA from fish sperm was implemented in the surface layer by physical adsorption on the PAA+CB or PAA+fMWCNTs films. In all the experiments, constant quantities of 1 mg/mL DNA solution (aliquot 2 µL per electrode) was used. It corresponded to the most reproducible results and was previously applied in similar DNA sensors based on polyphenothiazine dyes [
34,
35,
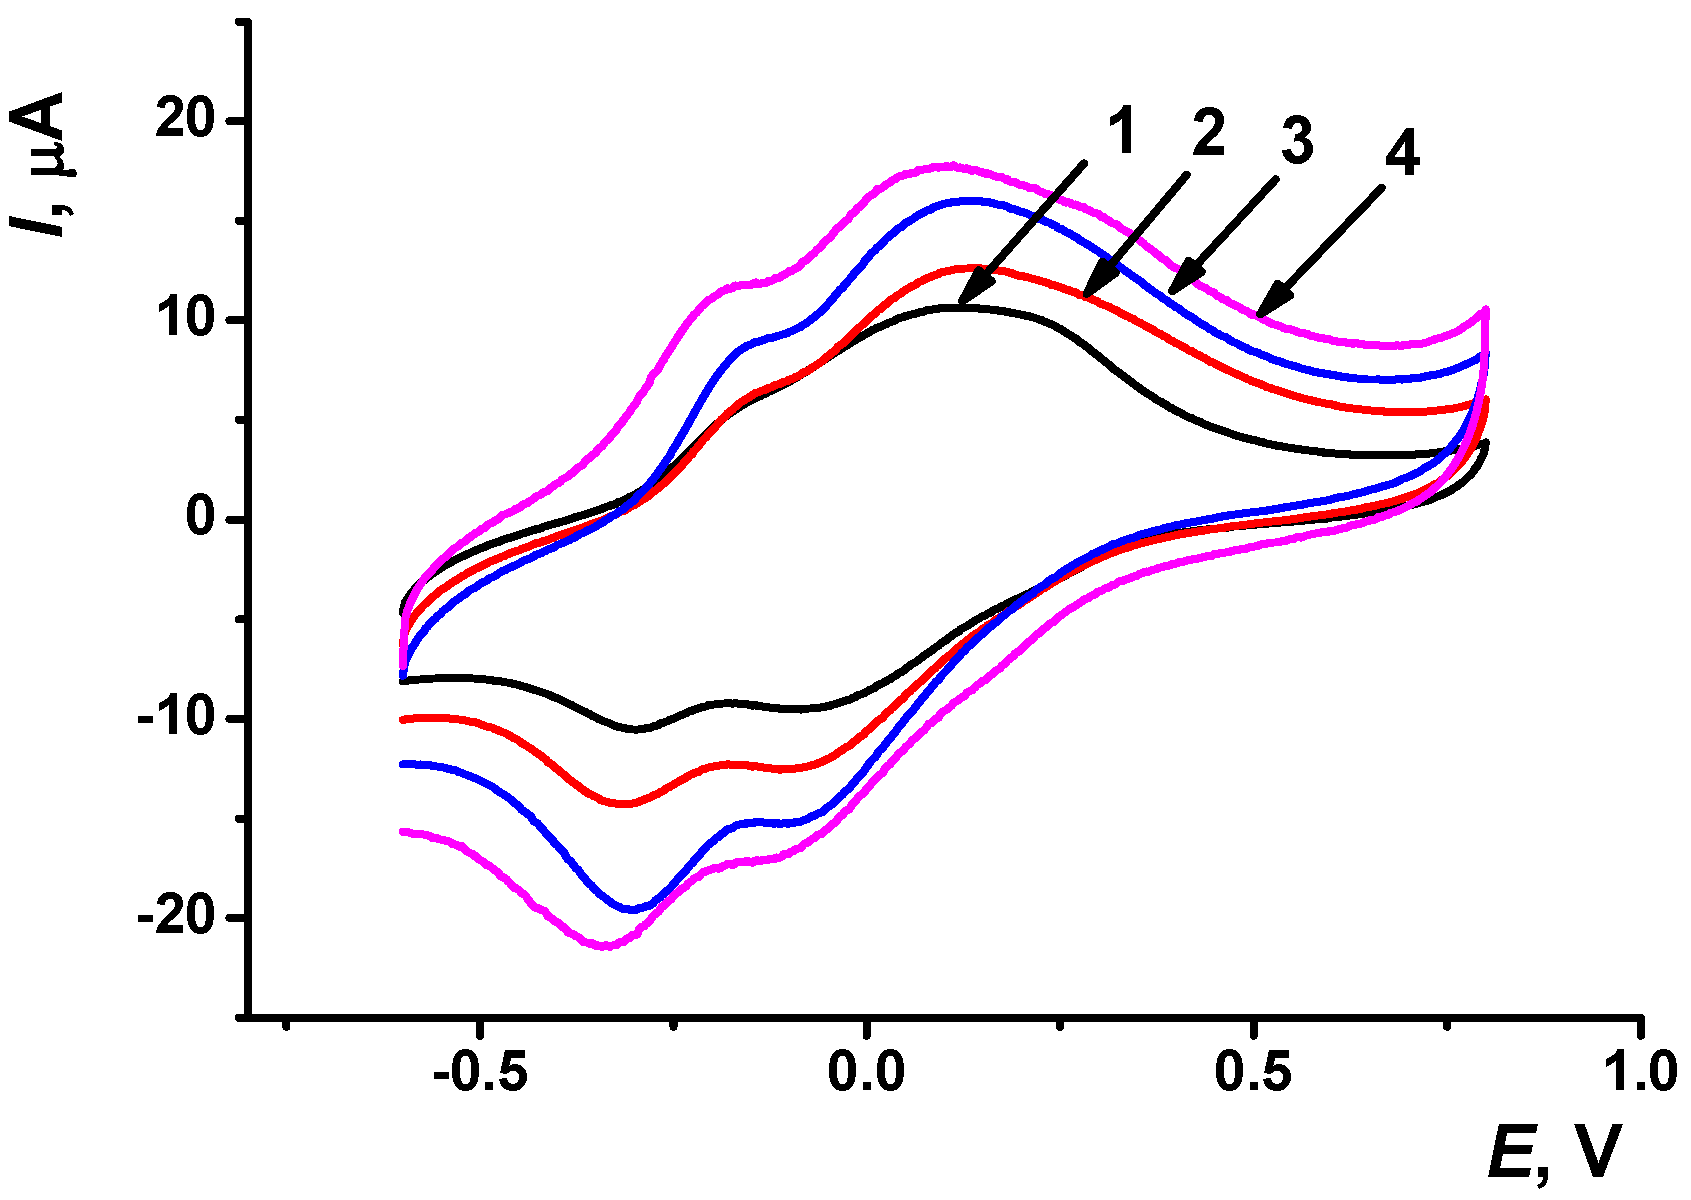
39]. The incubation period varied from 10 to 30 min. After DNA adsorption, the electrode was washed with buffer and cyclic voltammograms were recorded as described above. DNA did not significantly alter the shape of the peaks of the voltammograms but increased the peak currents of monomeric dye (
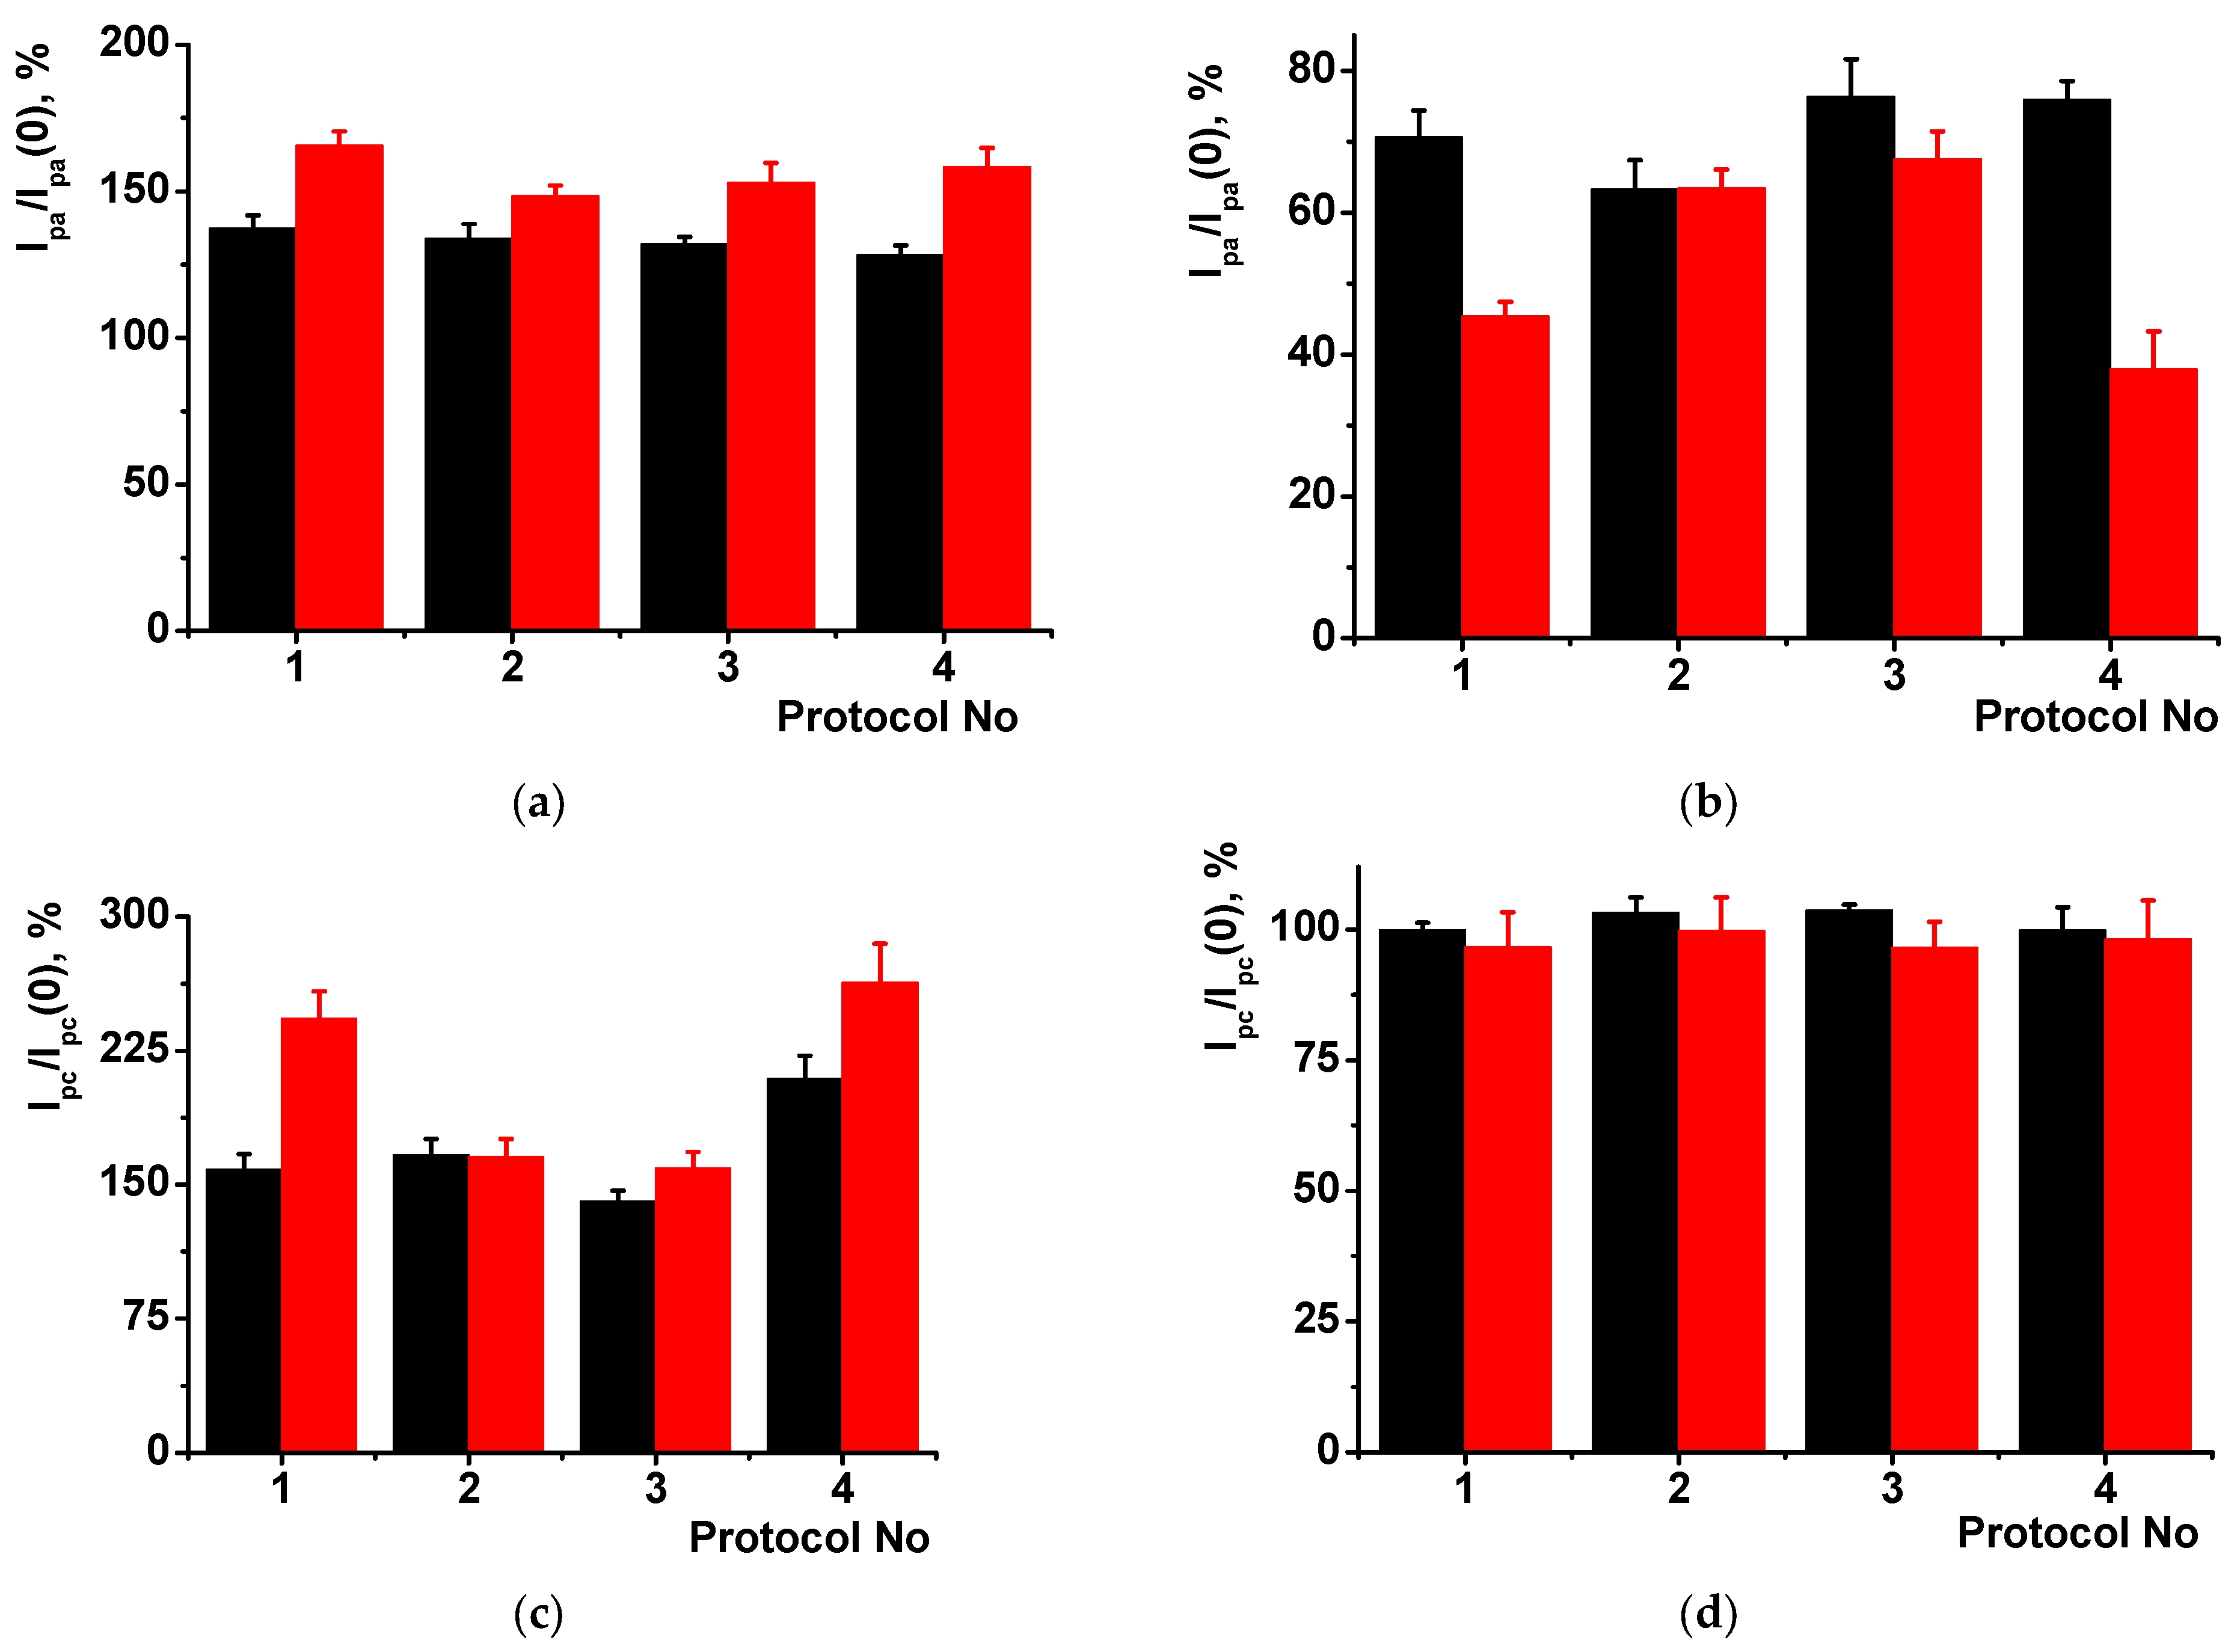
Figure 5). The observed phenomenon can be related to the electrostatic interactions between the negatively charged phosphate residues of the DNA backbone and the positively charged dye fragments of the coating. This was proved by similar experiments with poly(styrene sulfonate) instead of the DNA in the coating. The peak currents shifted in the same direction, though their sensitivity to the polyelectrolyte was much lower than that to DNA (not shown).
The effect of DNA implementation was more pronounced for the PAA+fMWCNTs coating and longer incubation period. DNA application did not alter the signals of the polymer reduction and decreased that of the polymer oxidation, regardless of the carbon material used. Conversely, the monomer signals increased up to 300% for a long incubation period and about 150% for other protocols of DNA implementation. Drying DNA aliquot followed by washing the sensor showed relative changes in the peak currents comparable with those obtained for 30 min incubation in the case of fMWCNTs dispersion. In the case of CB, such a protocol did not exert remarkable advantages over the incubation approach. Variation of the sensitivity toward DNA application can be caused by different accessibility of monomeric and polymeric forms of the dye for the DNA interaction and different rate of equilibrium establishment achieved on various carbon materials.
3.4. Voltammetric Determination of Doxorubicin
Doxorubicin—DNA interaction is well characterized by various spectroscopic techniques. Tetracyclic ring moiety interacts via intercalation between pairs of nucleobases in the double-stranded DNA in both guanine-cytosine and adenine-thymine rich regions; amino sugar moiety of the drug is located in the minor groove of the helix [
40]. DNA-doxorubicin adduct is stable due to electrostatic interactions between negatively charged phosphate residuals of the DNA backbone and positively charged amino groups of cytostatic drug molecules [
41]. Doxorubicin implementation leads to an increase in the DNA helix volume and partial unwinding of the double stranded DNA molecule.
Direct detection of the doxorubicin with the developed DNA-sensors resulted in non-linear concentration dependences. Sensitivity of the response was found to be quite low and insufficient for drug content quantification. Amplification of the sensitivity of the voltammetric response was achieved by the addition of MB as a mediator of electron transfer, able to specifically interact with DNA. The chemical structure of the MB is similar to that of Azure A. It can intercalate double-stranded DNA molecules and accumulate in the grooves of the biopolymer [
42].
Previously, we have shown in similar experimental conditions that MB contacted with the DNA molecules outside the surface layer did not exert its own redox activity due to the shielding effect preventing direct contact of the MB molecules with the electrode interface [
39]. As a result, MB could only mediate the electrochemical conversion of the Azure A, the currents of which grew after the addition of MB. We have applied a similar measurement protocol for the DNA-sensors developed. First, they were treated with the MB solution and then transferred to the fresh buffer, washed, and fixed upside down. Doxorubicin solution was applied on the working surface and left for 20 min under a plastic cup to avoid drying the surface of the DNA-sensor. Then, it was washed again and the cyclic voltammograms were recorded and compared with those corresponding to the poly(Azure A) activity prior to the contact of the DNA-sensor with the drug.
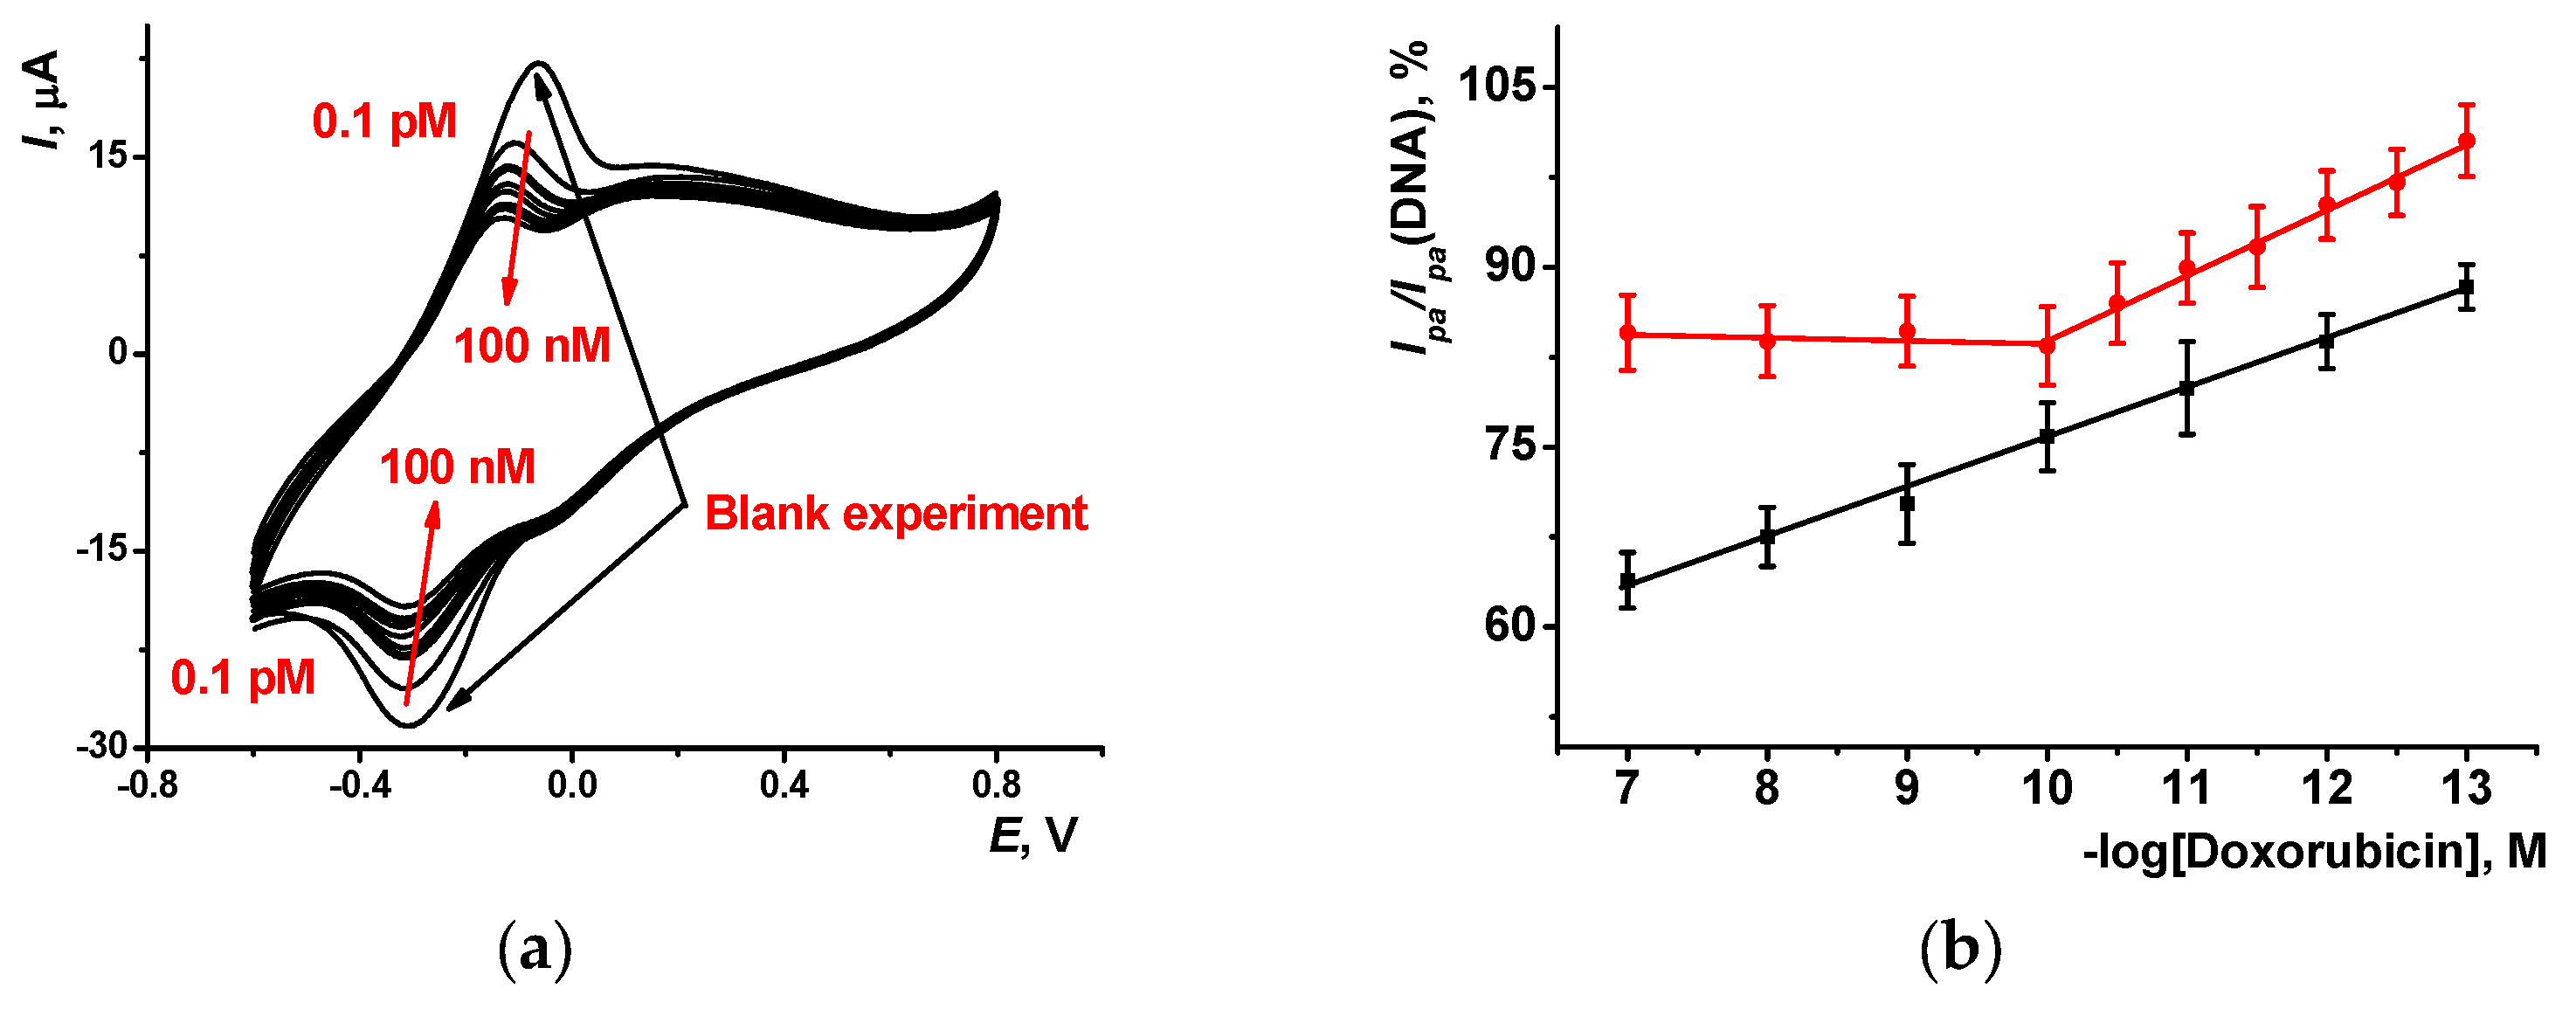
Doxorubicin added to the solution engaged in competition with the MB molecules for the same binding sites in the DNA helix. Increasing doxorubicin concentration promoted displacement of the MB molecules in the adduct with DNA, so that it left the layer and the current attributed to the monomeric Azure A progressively decayed. As an example, changes on voltammograms observed for the (PAA+CB) layer after DNA deposition and MB treatment are presented in
Figure 6 for increasing doxorubicin concentrations together with appropriate calibration dependencies for the anodic peak current. In blank experiments, working buffer was used instead of the doxorubicin solution. Analytical characteristics of doxorubicin determination are summarized in
Table 1. Limit of detection (LOD) was calculated from S/N = 3 criterion.
The (PAA+CB)/DNA biosensor showed a wider range of concentrations determined and higher slope of the linear piece against the parameters obtained with the (PAA+fMWCNTs)/DNA biosensor. This might have resulted from a higher contribution of unspecific adsorption of the MB on carbon nanotubes and their participation in compensation for the losses of mediation abilities resulting from the displacement of the MB with doxorubicin from the DNA adduct. For PAA+CB/DNA+MB, doxorubicin concentration dependence was linear in a wider range of concentrations both for oxidation and reduction peak currents, and the detected LOD value was tenfold lower than that for the (PAA+fMWCNTs)/DNA+MB-based biosensor. It should be noted that the maximum shift of the peak current was about 40–50% of the initial peak value, so only semi-quantitative assessment of the doxorubicin concentration could be reached. Nevertheless, low concentrations of doxorubicin offered good opportunities for the application of the DNA-sensors developed in pharmacokinetics studies and control of the drug residues in biological fluids and medications.
High dispersity and size distribution of the fMWCNTs applied as modifiers worsened the repeatability of the results obtained against those of the CB particles. This resulted in a lower regression coefficient.
The analytical characteristics obtained are comparable or better than those reported for electrochemical DNA-sensors based on similar principles of signal generation. Comprehensive reviews have been recently published in the area of sensor-based drug determination including biosensor approaches [
1,
17]. A comparison of their performance is presented in
Table 2. As shown, joint deposition of carbon nanomaterials, DNA, and polymeric dye offers synergistic effects due to the dense contact of all the reactants in the composite film; better electrical wiring of the redox active species is responsible for the analytical signal. The MB displaced by doxorubicin in the DNA helix releases from the inner space of the layer, and its effect on the electron exchange chain becomes higher than for conventional modifiers of the electrode. Similar sensitivity toward doxorubicin was also reported for other DNA sensors with carbon nanomaterials.
3.5. Measurement Precision and Real Sample Assay
The repeatability of the DNA-sensor response toward 0.1 and 1.0 nM doxorubicin was assessed using individual sensors prepared from the same set of reagents and stored at 4 °C within the measurements. Sensor-to-sensor repeatability was found to be 4.5 and 5.5% for 1.0 and 0.1 nM doxorubicin if the (PAA+CB)/DNA+MB sensor was tested and 7.5 and 8.0% for that based on (PAA+fMWCNTs)/DNA+MB. The calibration curves were stable during at least one month of storage. Each DNA-sensor was used only for one doxorubicin measurement to avoid accumulation of the analyte and long-term effects of such non-specific adsorption on the MB accessibility within the surface layer.
Possible interference of sample components was estimated by using spiked samples mimicking plasma electrolyte content (Ringer-Locke’s solution), serum protein effect (BSA), artificial urine, healthy volunteers’ urine, and doxorubicin medications (Doxorubicin-LANS® and Doxorubicin-TEVA®). Analyte content corresponded to the final doxorubicin concentration of 0.1 nM for DNA-sensors based on the (PAA+CB)/DNA+MB layer and 10 pM for that on the (PAA+fMWCNTs)/DNA+MB support.
In the case of the (PAA+CB)/DNA+MB-based DNA-sensor, no significant influence of matrix components was observed with Ringer-Locke’s solution and artificial urine. BSA (41.4 mg/mL) required tenfold dilution to prevent the obstructive influence of proteins. Medications contained stabilizers (mannitol in 4:1 mass ratio against drug content for Doxorubicin-LANS
® and lactose in 5:1 mass ratio in Doxorubicin—TEVA
®). Nevertheless, being dissolved in deionized water, they showed a 100% recovery response. Measurement results obtained with the (PAA+CB)/DNA+MB-based DNA-sensor for various samples are presented in
Table S1.
Similar measurements were performed with the (PAA+fMWCNTs)/DNA+MB-based DNA-sensor. Only oxidation peak currents were considered because of their higher reproducibility (
Table S2). The concentration of doxorubicin was tenfold lower compared to (PAA+CB)/DNA+MB (0.1 nM and 10 pM, respectively); mannitol presented in Doxorubicin-LANS
® affected the sensor signal (
Figure S3).
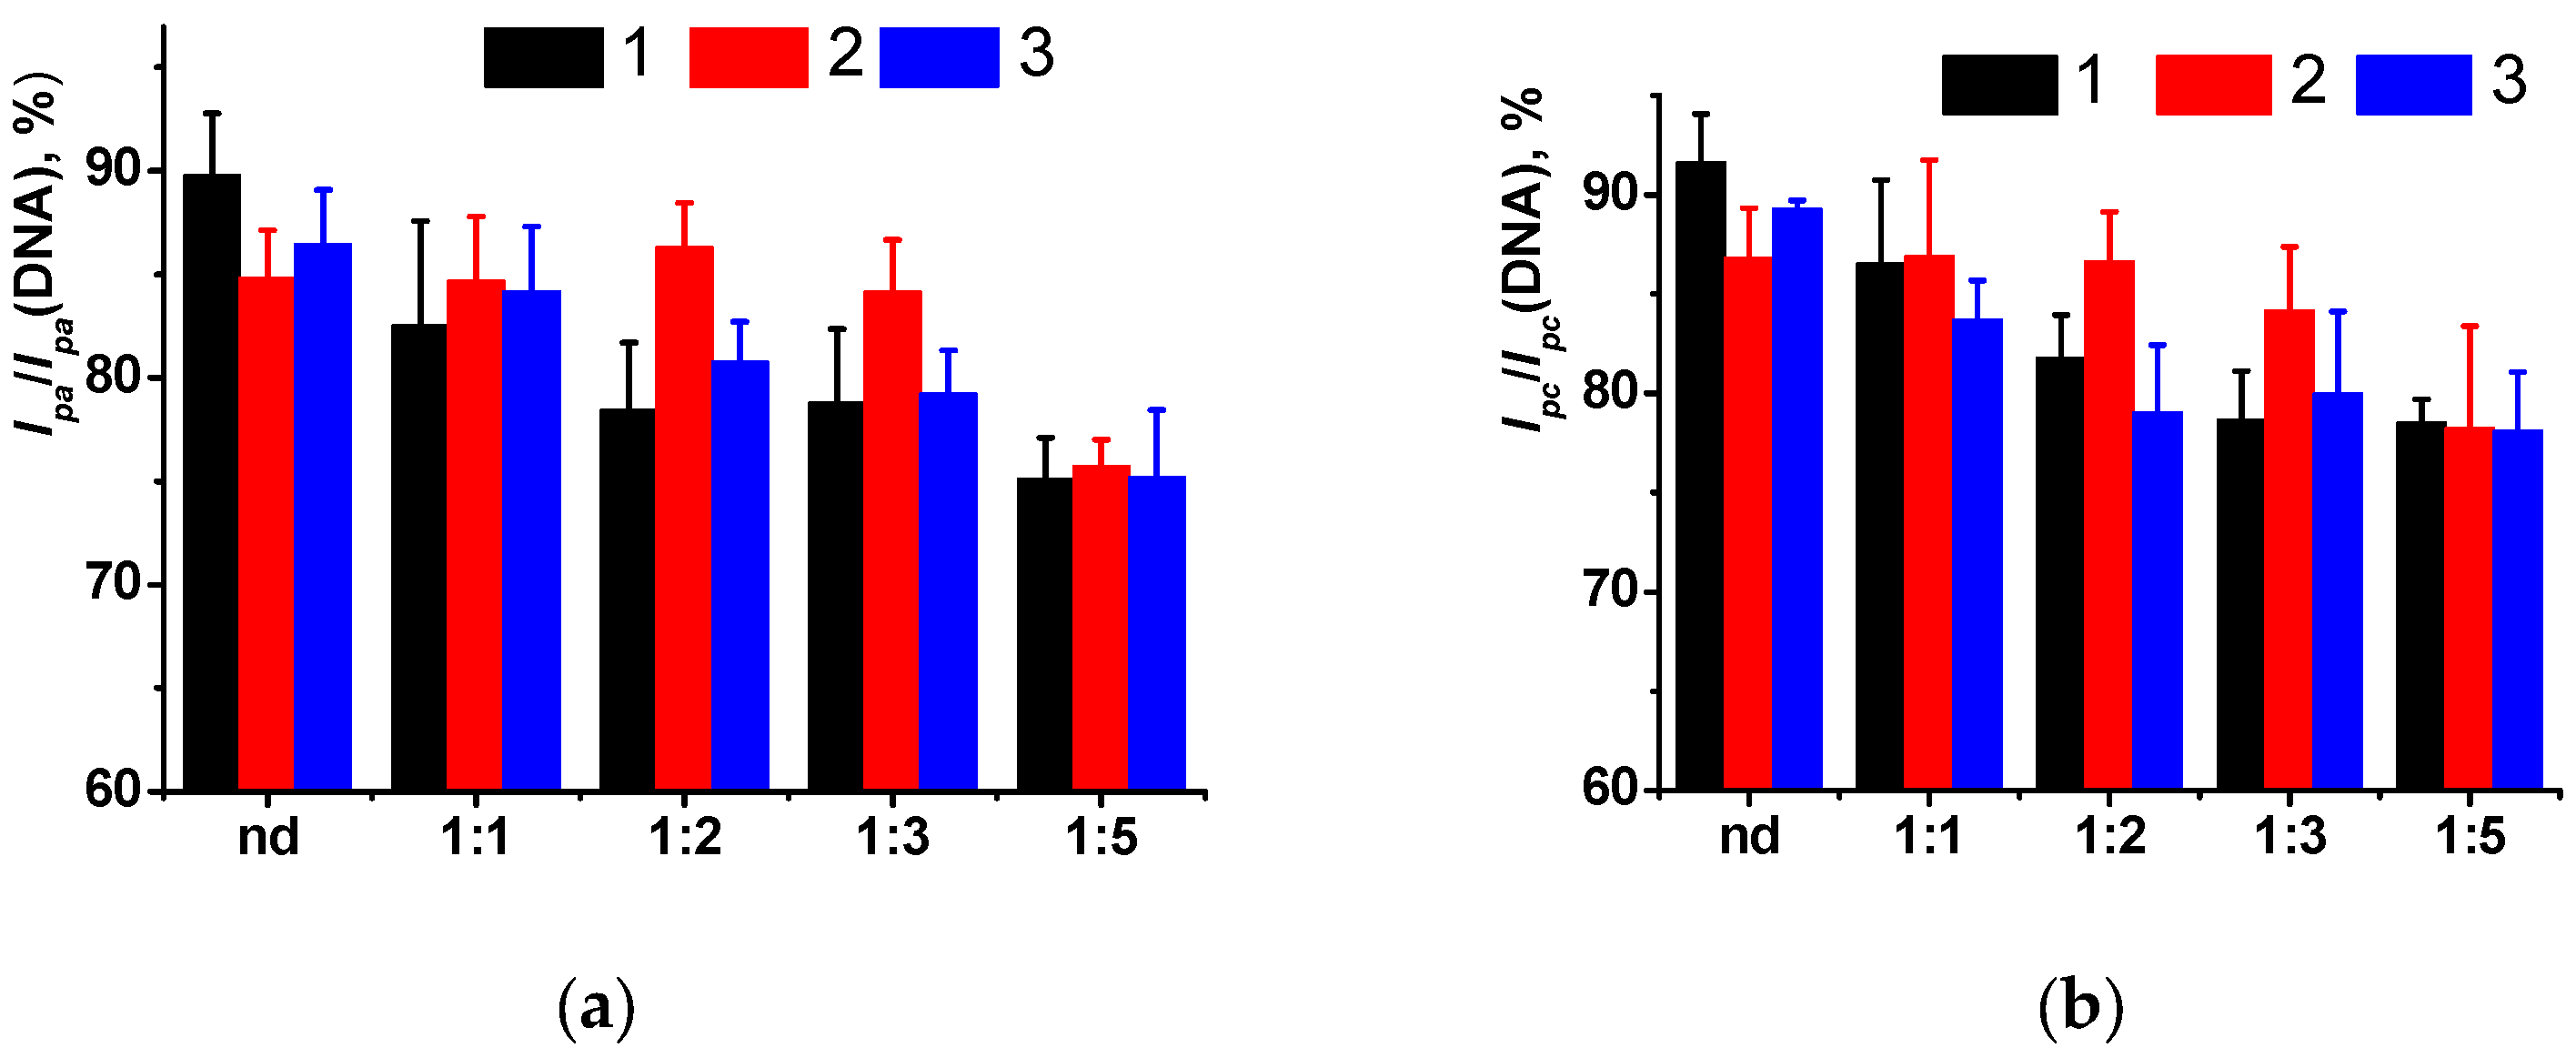
Finally, the DNA-sensors developed were assessed using spiked samples of healthy urine. Contrary to model systems, urine contains much bigger amounts of organic components (urea, creatinine, amino acids, uric acid, ketone bodies, creatine, glucose, hippuric acid) that affect the biosensor signal. The (PAA+CB)/DNA+MB-based DNA-sensor provided underestimated quantities of doxorubicin after incubation in non-diluted urine, probably due to the adsorption of the drug molecules on suspended solid microparticles [
52]. Only fivefold dilution fully suppressed interference (
Figure 7). Three samples were tested and showed similar changes in the relative shifts of the peak currents in the range of dilutions from 1:1 to 1:5. Final values of the signals corresponded to the doxorubicin response measured with standard solution with the same concentration of the analyte. Though the deviation of the signal was higher than that measured in other samples tested, the changes recorded were quite sufficient for express monitoring of the drug release and establishment of the personal drug dose for the patients. This offers new opportunities for preventing toxic effects caused by excessive quantities of antitumor drugs and increasing the efficiency of chemotherapy protocols.
4. Discussion and Conclusions
The one-step electropolymerization of Azure A from its suspension in CB is an effective and environmentally friendly approach to the formation of a redox active polymer layer able to respond to the adsorption of DNA and its biospecific interactions. Contrary to similar protocols including separate steps of electrode modification and polymer deposition, lower quantities of the dye were applied and simpler manufacture protocols were proposed. The use of carbon nanomaterials was necessary due to the rather low rate of polymer deposition, so that the increased specific electrode surface promoted the formation of the film with better electrochemical characteristics. Meanwhile, the use of fMWCNTs showed less of an effect on the electrochemical properties of the product and a less sensitive response to the DNA intercalators. This might be due to the formation of a spongy 3D net that accumulated lower DNA amounts or exerted higher adsorption ability toward non-conductive species present in the solution.
The application of electrochemical impedance spectroscopy was found ineffective due to the overlapping of the redox activity potentials of the polymer and redox probe (ferri/ferrocyanide ion pair), as well as not achieving full coverage of the underlying electrode surface with the polymer.
Synergistic effect of the surface layer components resulted in remarkable sensitivity of the response toward doxorubicin as the model intercalator. The positive effect of carbon nanomaterials has been previously proved for other redox active modifiers, e.g., for the detection of electron transfer of glycine adsorbed on the graphene nanosheets [
53]. Alanine was found to be active in redox reactions on the graphene interface [
54]. In both cases, the mechanism of the transfer of the amino acids on the carbon nanomaterials and regioselectivity of redox reactions were confirmed by DFT calculations.
DNA adsorbed on the poly(Azure A) film interacted with the underlying surface, preferably via electrostatic interactions by negatively charged phosphate residues of the DNA backbone. Such interactions stabilized oxidized (positively charged) polymer molecules and shifted the redox equilibrium of redox conversion. This resulted in changes of the peak currents on appropriate voltammograms. Monomers entrapped in the growing polymer film showed electrochemical properties similar to those of the polymer, but differed from them in terms of their accessibility to biospecific DNA interactions. For this reason, further assessment of doxorubicin as a model intercalator was performed by assessing the changes in the peak current of the monomeric dye. Intercalation of the DNA molecules changed its size and shape, but appropriate shifts of the currents did not allow for quantifiable effects. The use of MB molecules with a much higher redox activity and an ability to compete with doxorubicin for the DNA binding sites made it possible to increase sensitivity of the drug determination to sub-nanomolar concentrations. The total shift in the peak currents within the whole range of doxorubicin concentrations was about 40–50% of the initial value, but provided a semi-quantitative assessment of the drug concentration. Such information is important for the estimation of the drug release and for choosing personal doses of the drug in chemotherapy protocols. This might be useful for avoiding the cardiotoxic effects of anthracycline preparations and decreasing the side effects of the treatment.


