Article

An Analysis of the Factors Influencing Cadmium Removal in Aquatic Environments by Chlorella vulgaris-Derived Solids

1
Department of Soil Sciences, University of Zanjan, Zanjan 45371-38791, Iran
2
Department of Civil, Environmental and Mechanical Engineering, University of Trento, 38123 Trento, Italy
3
Department of Chemistry, Faculty of Science, University of Maragheh, Maragheh 83111-55181, Iran
4
Department of Agriculture, Payame Noor University, Tehran 19395-4697, Iran
*
Authors to whom correspondence should be addressed.
Submission received: 1 November 2023 / Revised: 14 December 2023 / Accepted: 20 December 2023 / Published: 25 December 2023
(This article belongs to the Special Issue Adsorption on Carbon-Based Materials)

Abstract

:
Chlorella vulgaris is an inexpensive microalga that could be employed for environmental remediation, but further investigations are needed to assess its suitability and optimal treatment methodology. With this aim in mind, this study focused on the raw biomass and the biochar and hydrochar obtained from it, analyzing their physicochemical properties and testing them to capture cadmium from an aqueous environment. The adsorption/absorption tests assessed the effect of adsorbent dosage, pH, Cd concentration, and contact time, and the results were analyzed through a structural equation model. Biochar and hydrochar performed similarly and better than the raw biomass, with the highest Cd removal observed at an adsorbent dosage of 0.8 g L−1, an initial concentration of Cd solution of 30 mg L−1, a pH of 6, and a contact time of 30 min. The adsorption isotherm data for Cd could be well-described by the Langmuir and Temkin models. The results from the structural equation modeling revealed that the variables material type, dosage, and concentration all contributed to Cd removal in water, with time mediating these effects.

1. Introduction

Heavy metal pollution in water is a significant environmental concern [1,2]. Metals or metalloids with a density of 3.5–7.0 g cm−3 are considered toxic, even at low concentrations [3,4]. Heavy metals that exceed maximum acceptable concentrations, according to the regulatory agencies, are harmful to the environment and must be removed through appropriate processing [5]. Cadmium (Cd) is one of the most toxic heavy metals and hazardous environmental pollutants, highly noxious to aquatic organisms, even at low concentrations, and carcinogenic to humans [6]. Although the definition of “heavy metal” is somehow debated [7], Cd fits several criteria, both in terms of its atomic number (48) and toxicity [8]. Cadmium contamination in aquatic environments can have adverse effects on the ecosystems themselves and can easily affect the human food chain [9,10]. This problem is not limited to specific regions but is a global menace [11]; various governments and agencies have established regulatory limits. The urgency to study methods to monitor and control Cd levels in water sources is, thus, evident. Numerous methods exist to remove heavy metals from water, including ion exchange, membrane filtration, adsorption, electrochemical precipitation, and chemical precipitation. Each method has intrinsic advantages and limitations that determine its applicability [12].
Biochar and hydrochar are two important types of solid materials derived from biomass. They can be employed as sorbents, catalysts, and precursors for activated carbon and other functional materials [13,14]. Pyrolysis biochar is the solid product of the thermochemical degradation of biomass at high temperatures (generally 600 °C) in the presence of little or no oxygen and under dry or semi-dry conditions. Biochar is a semi-combustible charcoal, and its physical, chemical, and structural properties (stability, pore size, dispersion, cation exchange capacity, ash fraction, specific surface area (SSA), and mineral content) largely depend on the type of feedstock and production conditions (heating rate, pyrolysis duration, oxidation condition, and temperature) [15]. Hydrochar is a dark solid with lignite-like properties that is produced by heating biomass submerged in liquid water at a pressure of 10–50 bar and a temperature of 180–250 °C without oxygen. The process used to produce hydrochar is called hydrothermal carbonization (HTC) [16]. Hydrochar offers several advantages over biochar, including higher yield, lower acidity, and lower energy input [17]. Additionally, since HTC occurs in liquid water, there is no need to dry the biomass, making it particularly suitable for wet residues [18]. Both biochar and hydrochar typically have modest SSAs, but these can be enhanced through further activation steps to meet the requirements for activated carbons [19].
Algae are photosynthetic organisms with various ecological applications. Their ability to store nutrients such as phosphorus and nitrogen, their excellent adsorption/absorption capacity for heavy metals, and their high photosynthetic efficiency make them highly suitable for application in aquatic environments. Algae are economically viable for biochar production because they do not require arable soil or additional nutrients. Several studies have demonstrated that biochar produced from algae is a clean material that enhances carbon sequestration and bioremediation [20]. Algal biochar has proven capabilities as an adsorbent/adsorbent for heavy metal ions, such as Cu, Cd, and Zn, from aqueous solutions [21,22]. Among the various algal species, Chlorella vulgaris (CV) often stands out; it is a microscopic organism measuring 2–10 µm in size and has a structure comparable to that of higher plants. CV growth occurs through simple asexual reproduction. This microalga is ideal for industrial production due to its resistance to harsh conditions and disturbances. It can also be used to treat agricultural, industrial, and domestic wastewater [23] or to produce higher-value products, such as bioplastics [24,25].
Producing adsorbents, such as activated carbons, usually involves high temperatures and expensive (and possibly non-renewable) feedstocks. Thus, it is vital to develop low-cost and effective adsorbents using alternative technologies and cheap materials to meet the increasing demand. One approach for this purpose is to use waste as a source of inexpensive and readily available raw materials to produce adsorbents. Overall, studying biochar and hydrochar derived from CV for the removal of heavy metals is valuable for developing sustainable solutions to address environmental pollution while exploring the potential of these materials in various applications. However, no comprehensive study has been conducted so far to compare hydrochar and biochar produced from CV for removing heavy metals from water. Moreover, modeling and categorizing the factors influencing cadmium removal in water using structural equation models has often been neglected. Hence, given the significance of Cd contamination in water, this study aims to accomplish two objectives: (1) to examine the impact of three types of algal biomass materials, namely raw algal biomass and the biochar and hydrochar derived from it, and (2) to model and categorize the influential factors affecting cadmium removal in water using the structural equation model. It shall be noted that the mechanism of Cd cation capture is complex and not completely established [26]. Most likely, it involves more than one phenomenon, including the formation of ionic bonds with ion exchange sites. In this framework, the term “adsorption” may not be entirely adequate to describe the present observations; nonetheless, we decided to employ it for the sake of conciseness.

2. Materials and Methods

2.1. CV and Derived Materials

The CV algae stock was prepared from the algae culture laboratory of Organic Algae Co. The stock was stored in vitro at 25 °C for 12 h in light and 12 h in the dark (2500 lux). F/2 medium was used for microalgae culture. Table 1 shows the chemical composition of the culture medium used. The culture steps were performed in clean conditions using a separate and completely isolated room. The initial growth period of microalgae was 7 days. When the growth reached the logarithmic growth phase, they were transferred to a larger container with fresh culture medium added. After a two-week growth period, biomass was collected. The algal biomass was washed five times with distilled water to remove salts, then dried in an oven at 40 °C and sieved. For the preparation of the biochar and hydrochar, this material was then crushed in a mill and passed through a 1 mm sieve. The biochar was obtained by placing samples in an electric oven at 450 °C for 120 min, with inert conditions being achieved through a flow of nitrogen. The hydrochar was instead obtained starting from 40 g of algal biomass and 310 mL of distilled water. Following the procedure by Fang et al. [16], the mixture was placed into a sealed stainless-steel pot, which was heated to 250 °C on a hot plate and maintained at this temperature for 6 h. Subsequently, the pot was left to cool down to room temperature. The resulting hydrochar was isolated through filtration using 0.45 µm filter paper (Whatman), then washed for 1 h by immersing it in tap water followed by a 10 min rinse in distilled water. Finally, it was oven-dried for 24 h at 70 °C. Each experiment in this study was repeated three times. The yield of the biochar and hydrochar was calculated as the ratio between the mass of the dried recovered material and the initial mass of the dry biomass.

2.2. Materials Characterization

The three materials were subjected to various experimental analyses to determine their properties, with each analysis being repeated at least twice. The investigated properties were:
  • pH and electrical conductivity (EC): Measured after the samples had been put in deionized water (with a 1/10 mass ratio) for 24 h on a reciprocating shaker at 20 °C. Then, pH value and electrical conductivity at 20 °C were measured according to the ASTM 2866-D standard method, employing an EYELA pH meter and 4320-JENWAY conductivity meter, respectively;
  • Ash content: Obtained by keeping the samples at 730 °C for 8 h in a muffle furnace; the obtained ashes were then weighed, and their content was calculated by dividing it by the initial dry mass of the material;
  • Volatile matter content: Measured according to ISO 562-2010 [28]. One gram of each sample was put into a porcelain crucible. Samples were heated via a furnace at 950 °C for 10 min in nitrogen flow, and after cooling, the final mass of the samples was weighed. The amount of the volatilized substance was calculated as the relative weight difference before and after the treatment;
  • Ultimate analysis: The measurement of carbon (C), hydrogen (H), nitrogen (N), and sulfur (S) mass fractions within the samples was performed using a Thermo Finnigan elemental analyzer (FlashEA 1112 series). Oxygen was instead calculated by the difference in the mass fractions of the other elements and ash. Employing the element mass fractions, the products’ gross calorific value (GCV) was obtained through the equation proposed by Friedl et al. [29]: GCV = 3.55C2 − 232C − 2230H + 51.2C × H + 131N + 20,600 (MJ kg−1);
  • Specific surface area (SSA): Measured based on the Brunauer–Emmett–Teller (BET) method using the Belsorp mini II Surface Area Analyzer (Microtrac Bel Corp, Haan, Germany). External or non-microporous area and micro-pore volume (Vp) were calculated based on nitrogen gas adsorption before measuring the samples’ surface areas.
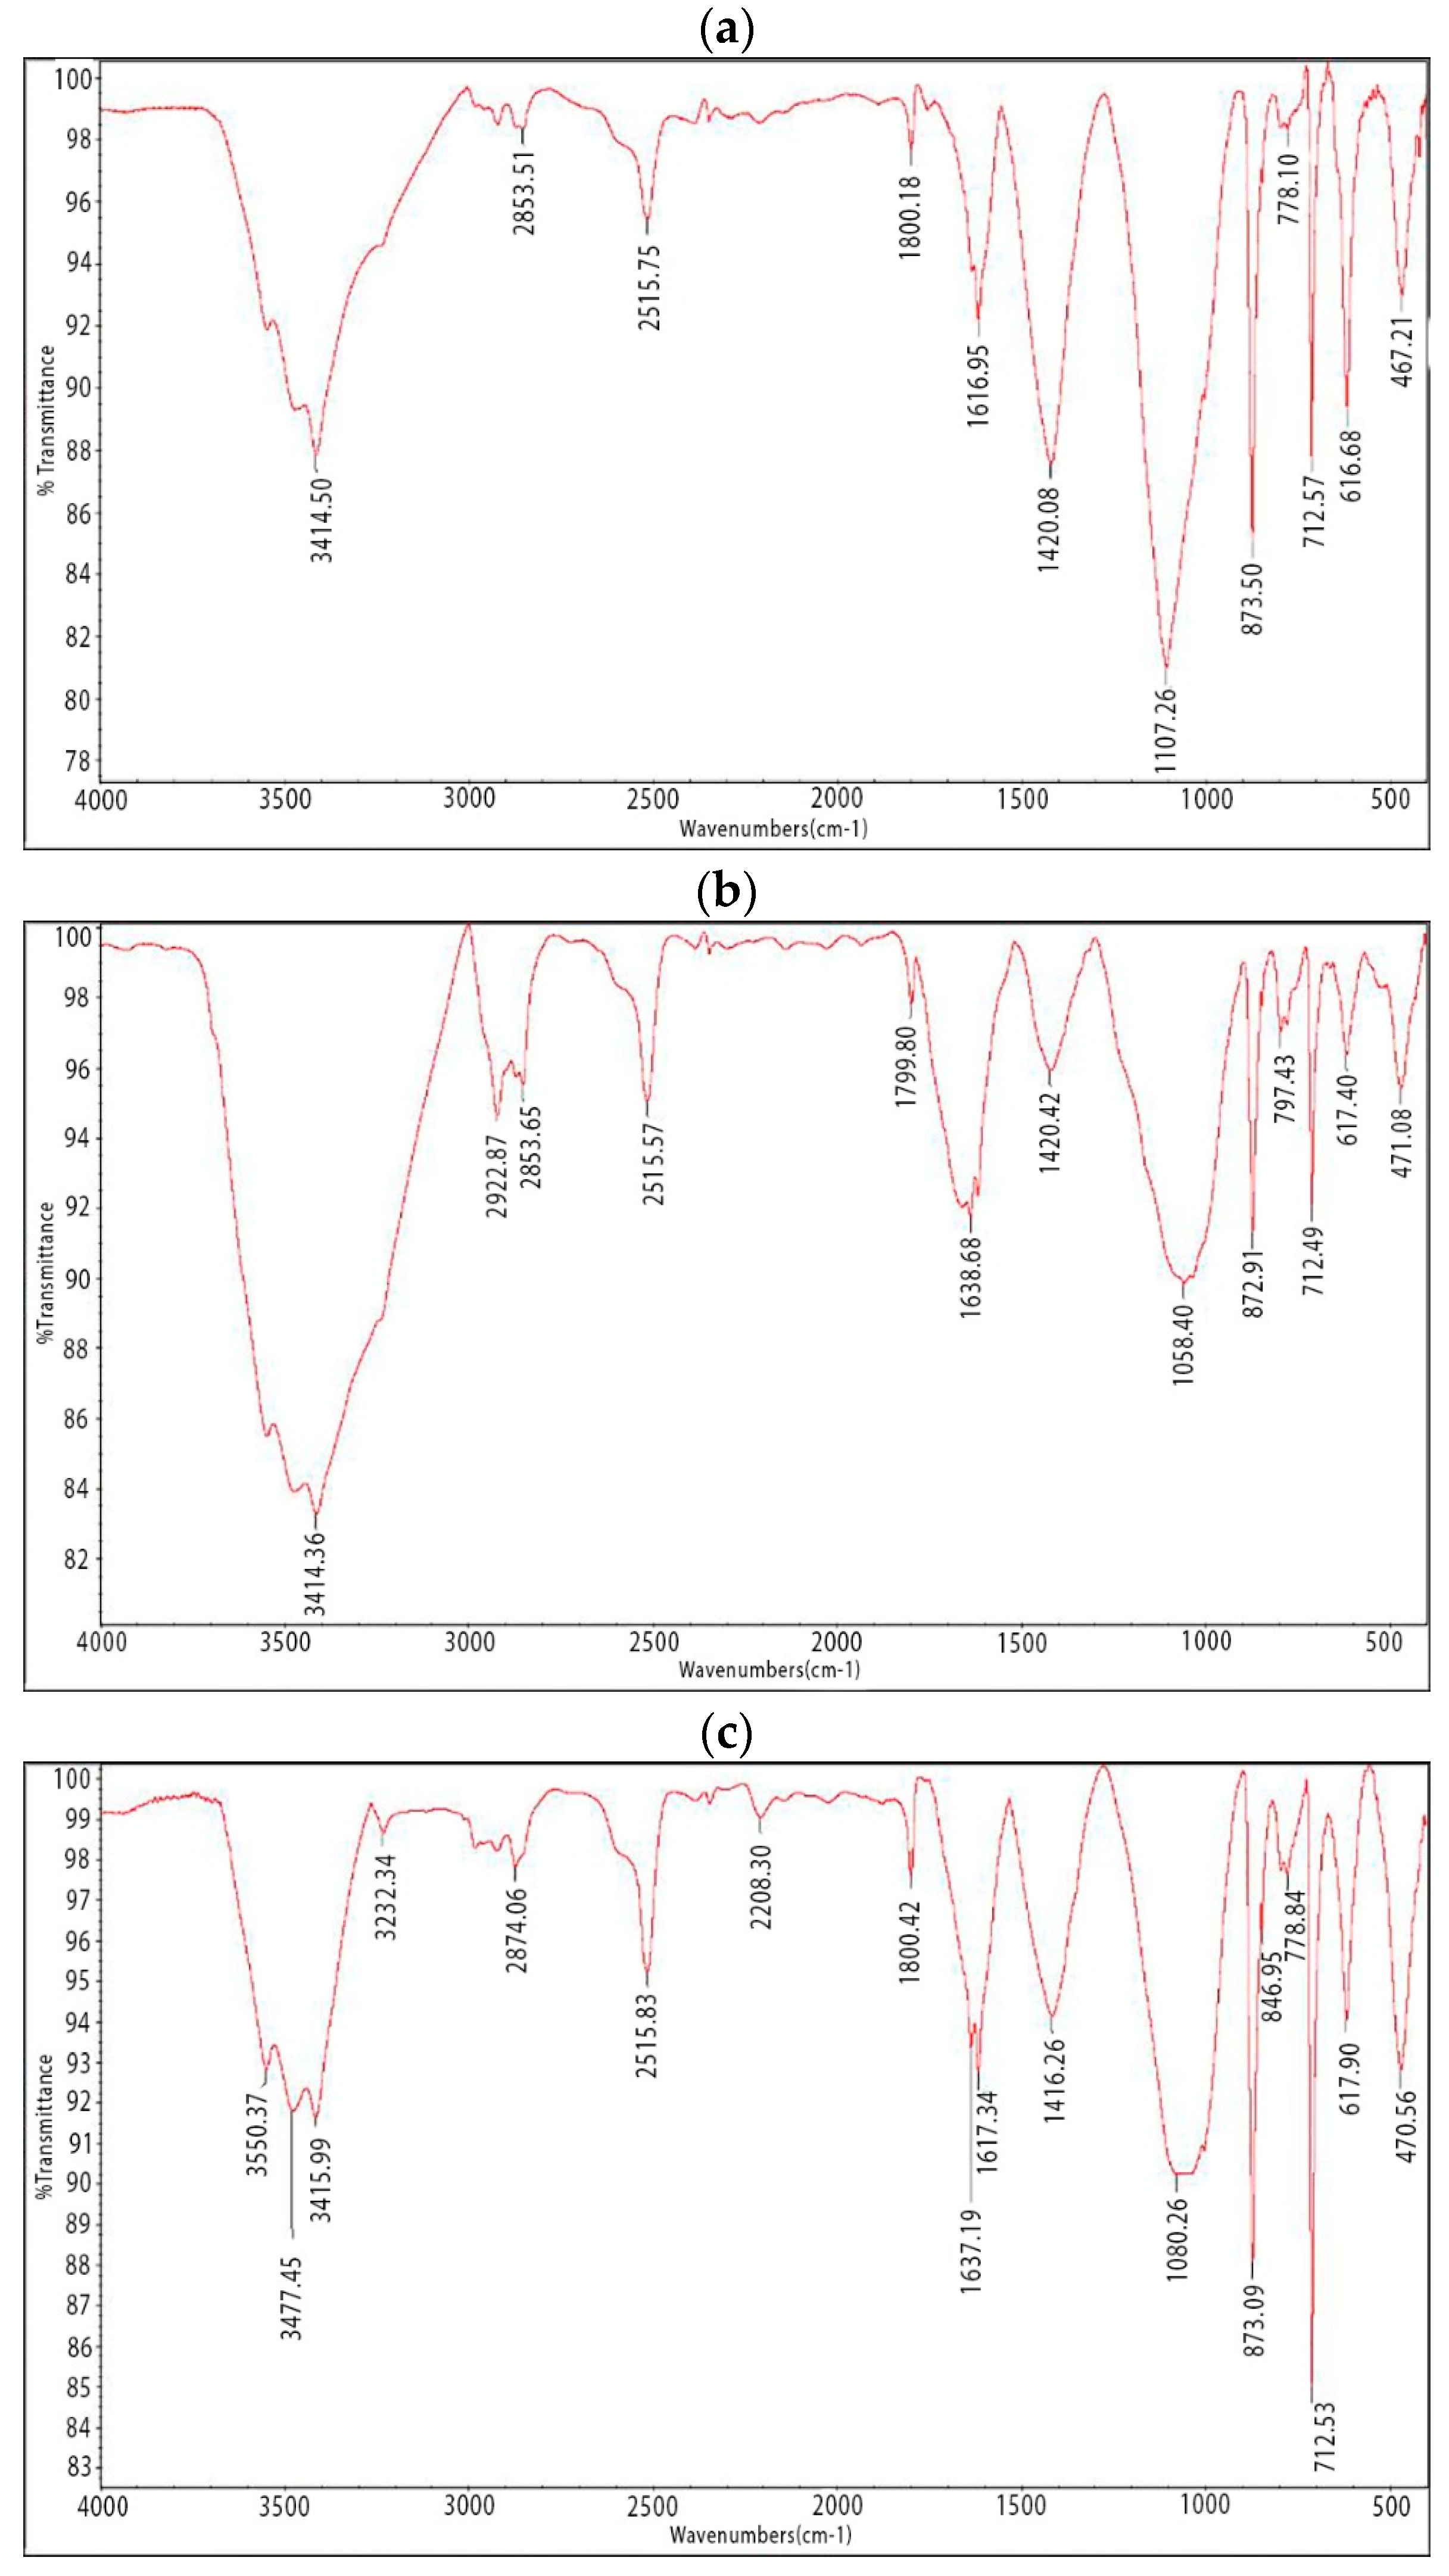
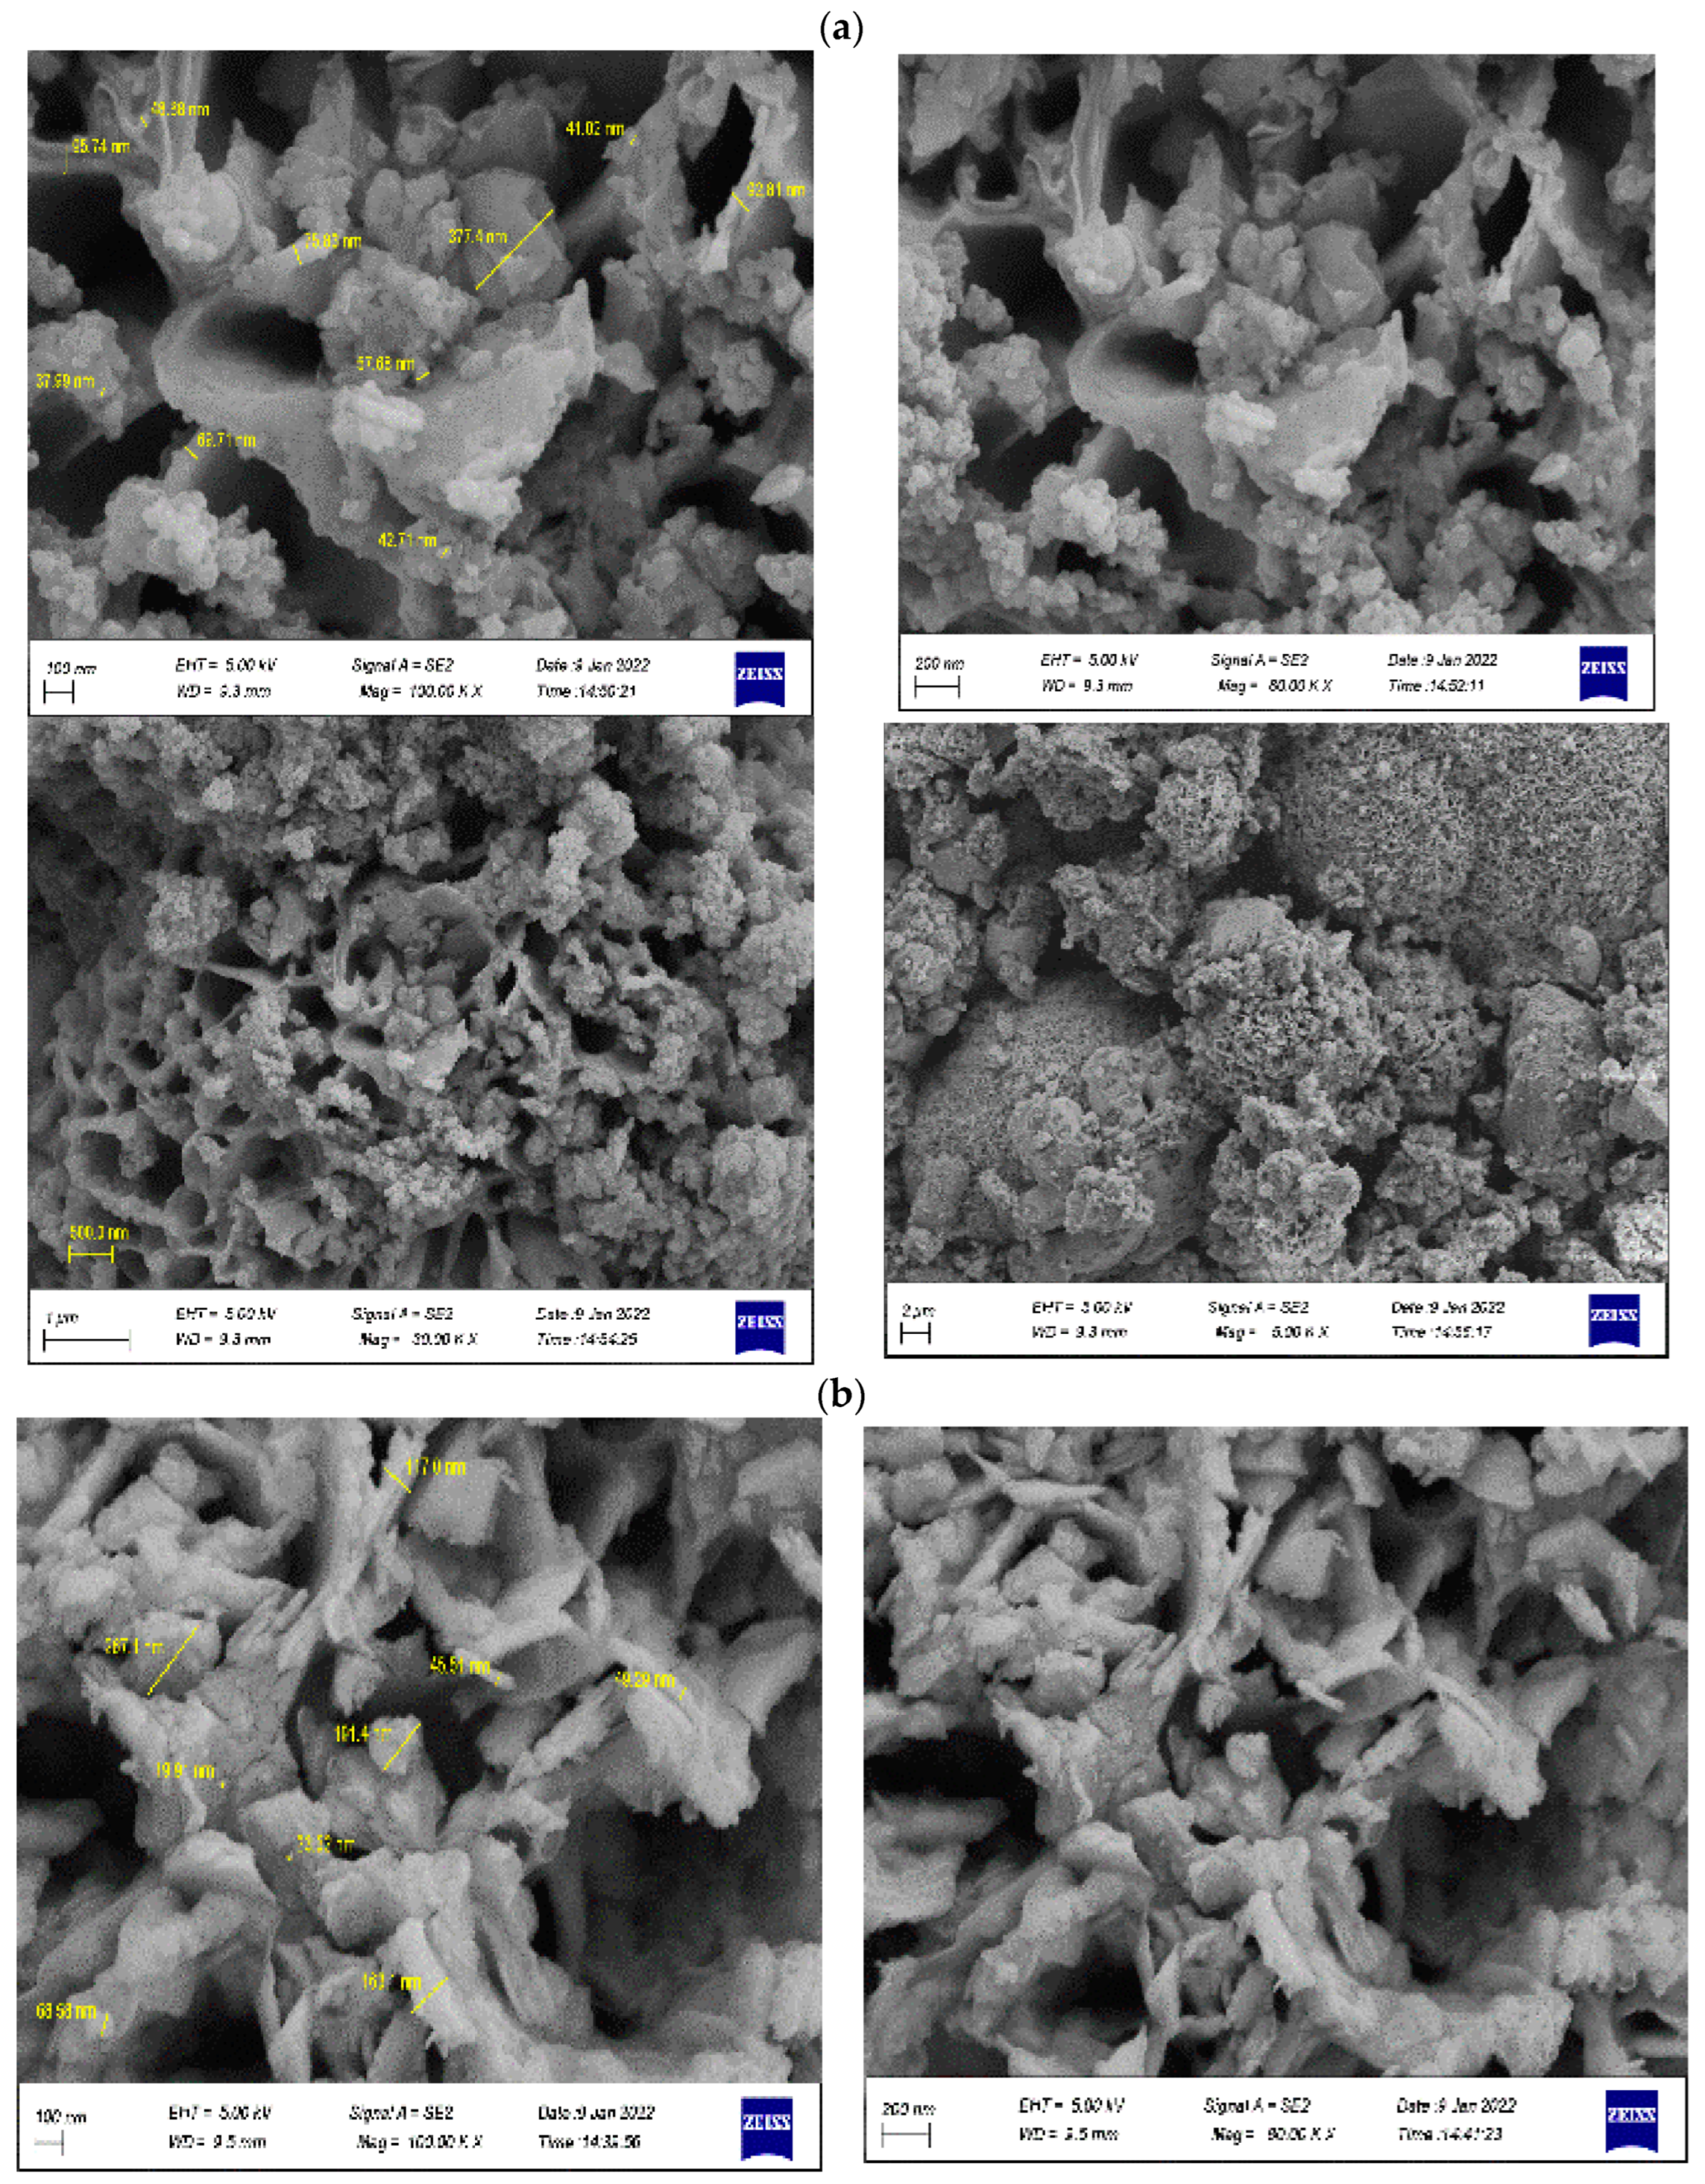
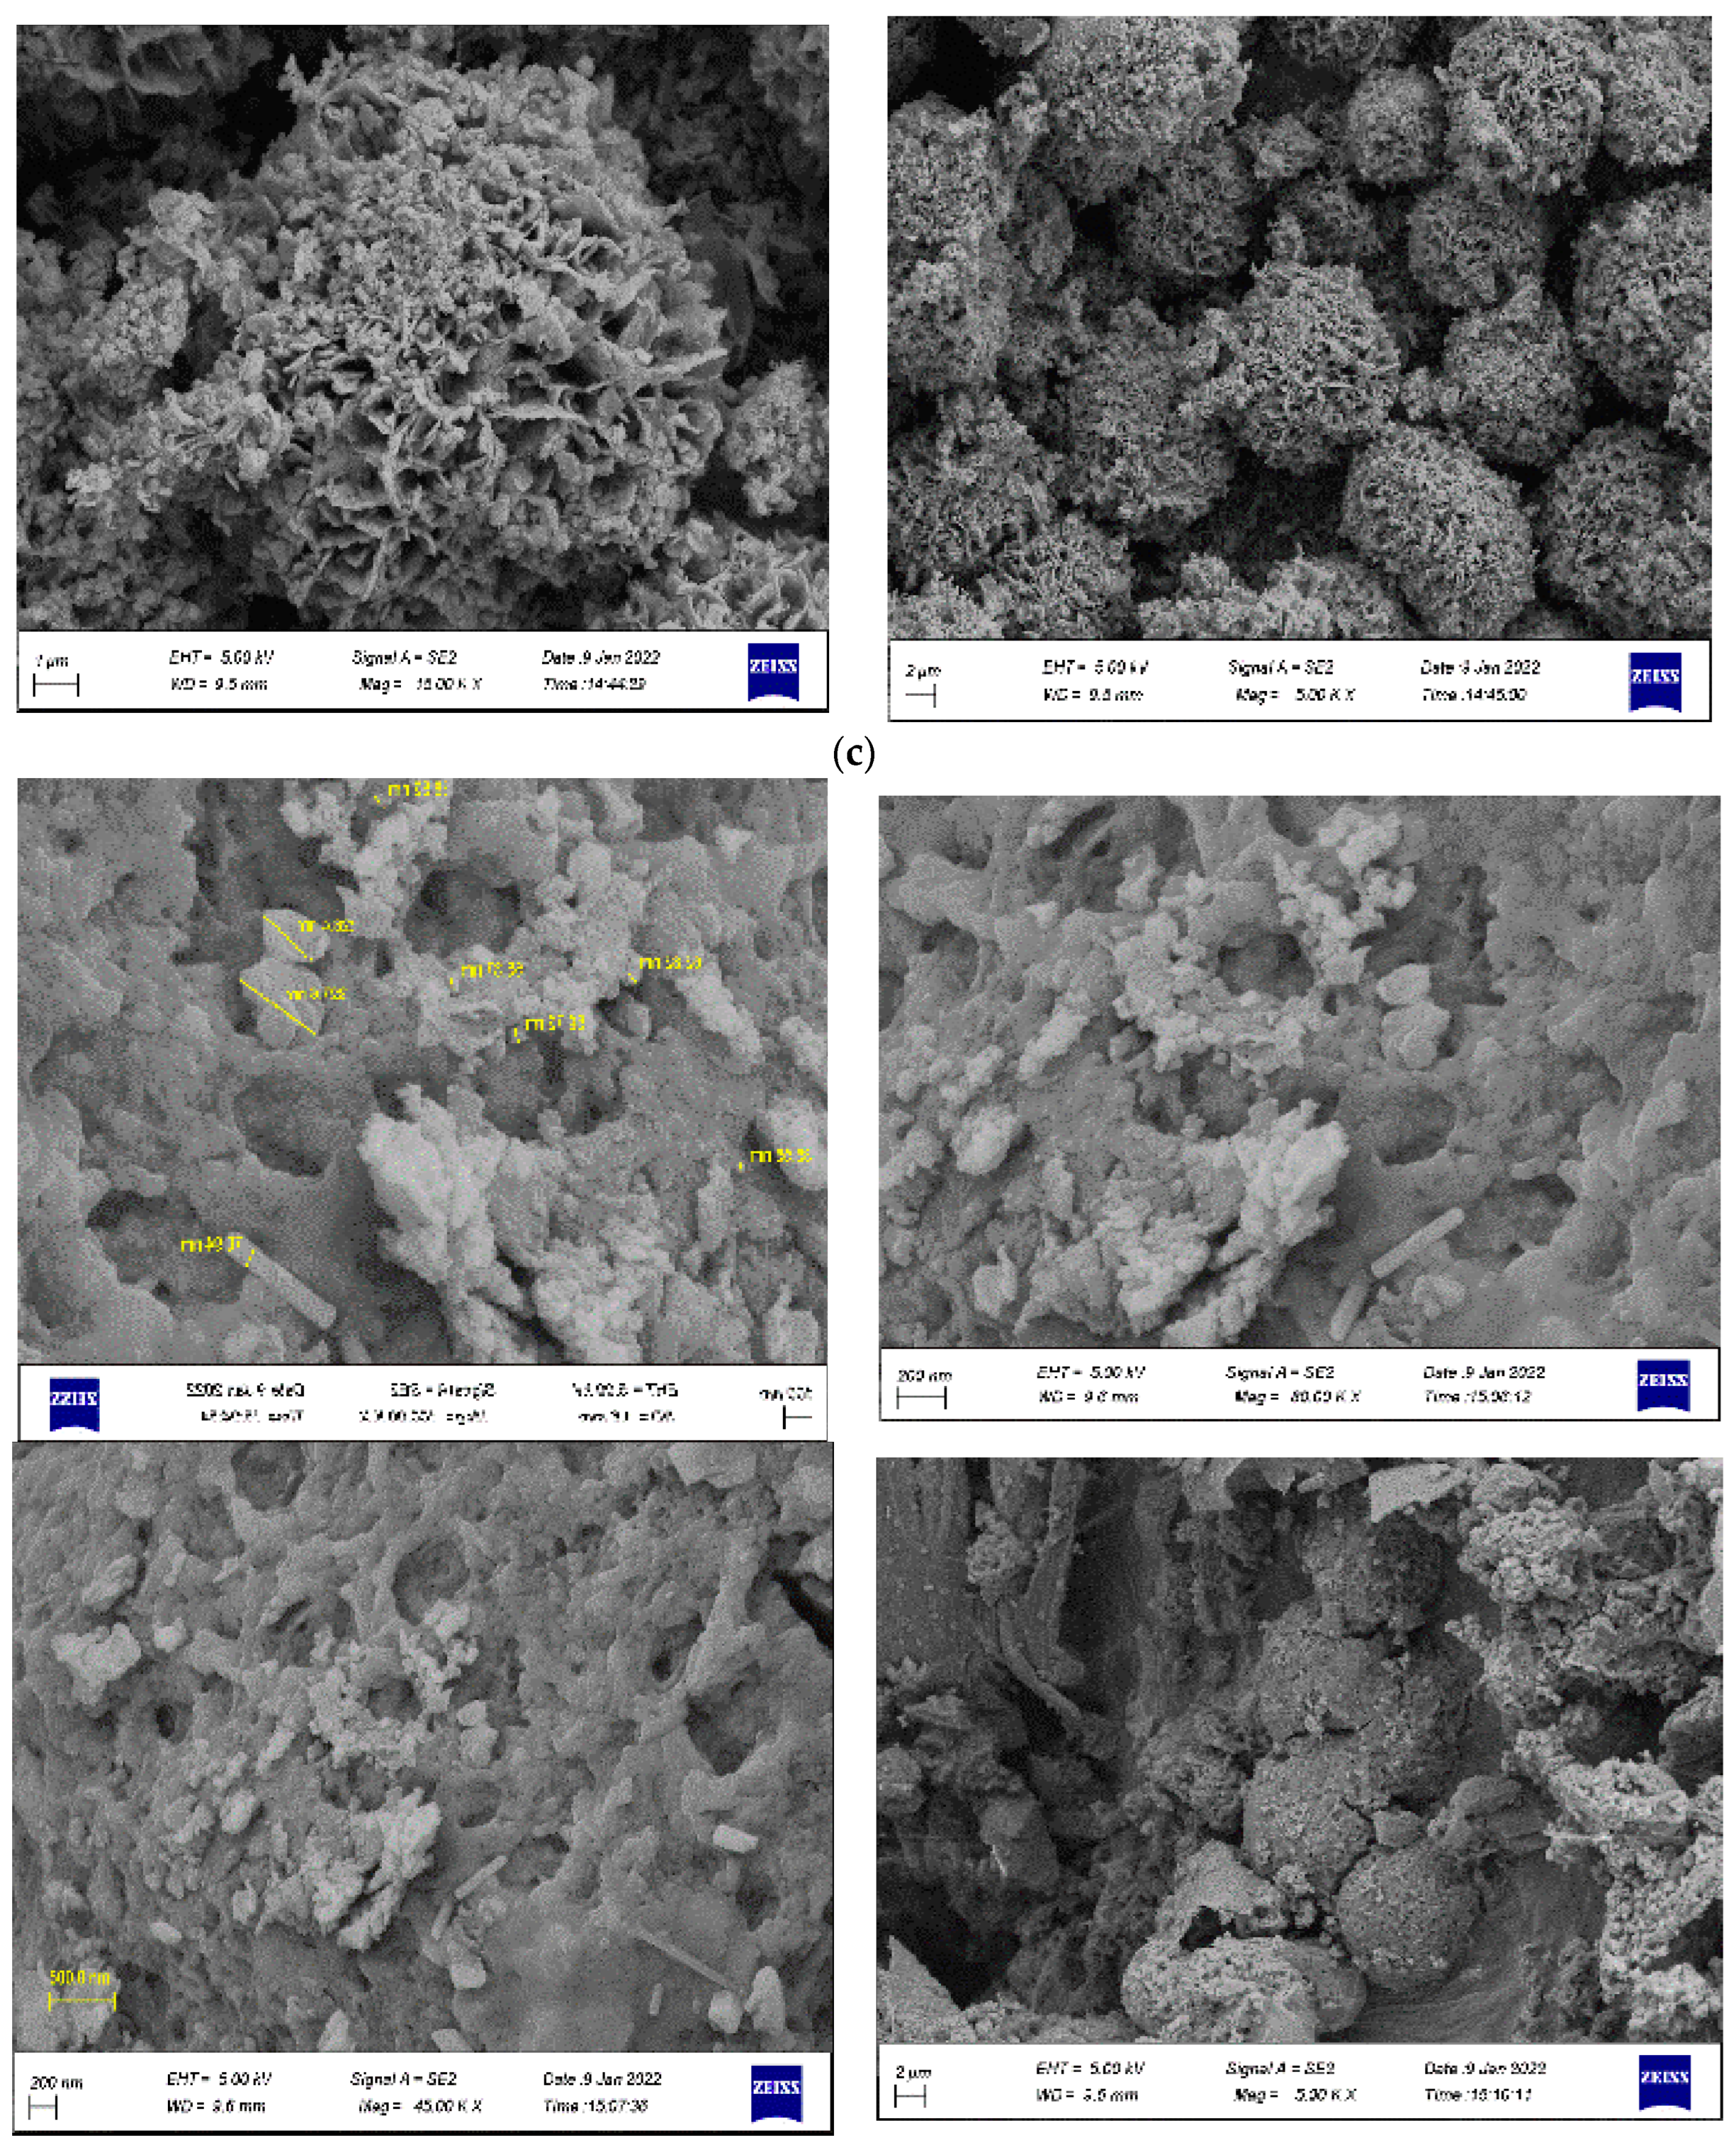
  • Surface properties: The morphology of the samples was investigated using the FESEM-EDX Inspect 24 (ZEISS Sigma 300, Oberkochen, Germany). FESEM testing was conducted to determine the surface and pore patterns of the products. The surface functional groups of activated carbon were analyzed using an FTIR spectrophotometer (Nicolet is 10/Thermo Scientific, Waltham, MA, USA).

2.3. Adsorption Experiments

The Cd adsorption tests were conducted using a batch equilibration technique at room temperature for triplicate samples. Stock solutions of Cd (1000 mg L−1) were prepared by dissolving CdCl2·2.5H2O (Merck, Darmstadt, Germany) in double-distilled water. For the adsorption kinetics, 0.4 g of biochar/hydrochar/algae biomass was added to a 50 mL solution containing 20 mg L−1 of Cd as CdCl2. The solution was then agitated at 150 rpm on a reciprocating shaker. Finally, the concentration of Cd in the solutions was determined using atomic absorption spectrometry (AAS, ZEEnit 700P, Analytik Jena, Jena, Germany). The effect of the dosage of adsorbents on the removal of Cd (20 mg L−1) from the water was investigated by mixing 50 mL of Cd solution (20 mg L−1) at room temperature with various amounts of each sample (0.1–2 g L−1) for 30 min. The effect of different pH values (2–9) on the removal of Cd was also studied. The percentage removal of Cd was calculated based on the difference between the equilibrium concentration (Ce) and initial concentration (C0) of Cd in solution (mg L−1). The equilibrium adsorption amounts (Qe, mg g−1) of Cd onto biochar, hydrochar, and algae biomass, as well as the adsorption efficiencies (%), were calculated using Equations (1) and (2), respectively.
Qe = ( C 0 C e ) V M
Adsorption   efficiency % = C 0 C e C 0 × 100
where V is the volume of the solution (mL), and M is the mass of the adsorbent (g).

2.3.1. Isotherm Study

In this study, three important and widely employed isotherms are used to provide a mathematical description of Cd removal at equilibrium conditions. The adsorption data were fitted to the logarithmic form of the Langmuir (Equation (3)), Freundlich (Equation (4)), and Temkin (Equation (5)) equations/models. These models were developed for adsorption, which may indeed represent only a step in the complex removal mechanism that takes place when Cd ions interact with a carbon-based adsorption material. Nonetheless, these models are often applied for Cd ions removal [30,31,32,33] because they represent an intuitive and easy-to-use means to discriminate, at least at a preliminary level, between different interaction/adsorption mechanisms between removed material (Cd ions in the present case) and adsorbent material.
The Langmuir isotherm [34] is represented by Equation (3)
C e q e = 1 q max b + C e q max
where Ce is the equilibrium concentration (mg L−1), qe is the equilibrium adsorption value (mg g−1), qmax is the maximum adsorption amount (mg g−1), and b (L mg−1) is the Langmuir constant.
The Langmuir equation shows the maximum adsorption on absorbent surfaces (qmax). Compared to other isotherm equations, the Langmuir equation provides more information about the adsorption of elements [35].
The Freundlich isotherm [36] was calculated by Equation (4):
log qe = log k f × 1 n   ( log C e )
where n and kf (L mg−1) are the Freundlich constants, corresponding to the biosorption capacity and surface heterogeneity, respectively. The Freundlich equation is considered better than the Langmuir equation because, in addition to being simple, it is based on more realistic assumptions. The Freundlich equation can explain the non-ideal adsorption on heterogeneous surfaces and the adsorption of multiple layers well. The Freundlich equation can be justified with the assumption that the decrease in adsorption energy with increasing surface coverage is due to the uniformity of the absorbing surfaces [37].
The Temkin isotherm [38] is given as Equation (5):
q e = RT b T ln k T + RT b T ln C e
In which bT is the Temkin constant, and kT is the constant of equilibrium of Temkin (L g−1). The ratio RT/bT is associated with the adsorption heat (J mol−1), R is the perfect gas constant (8.314 J mol K−1), and T is the temperature (K).

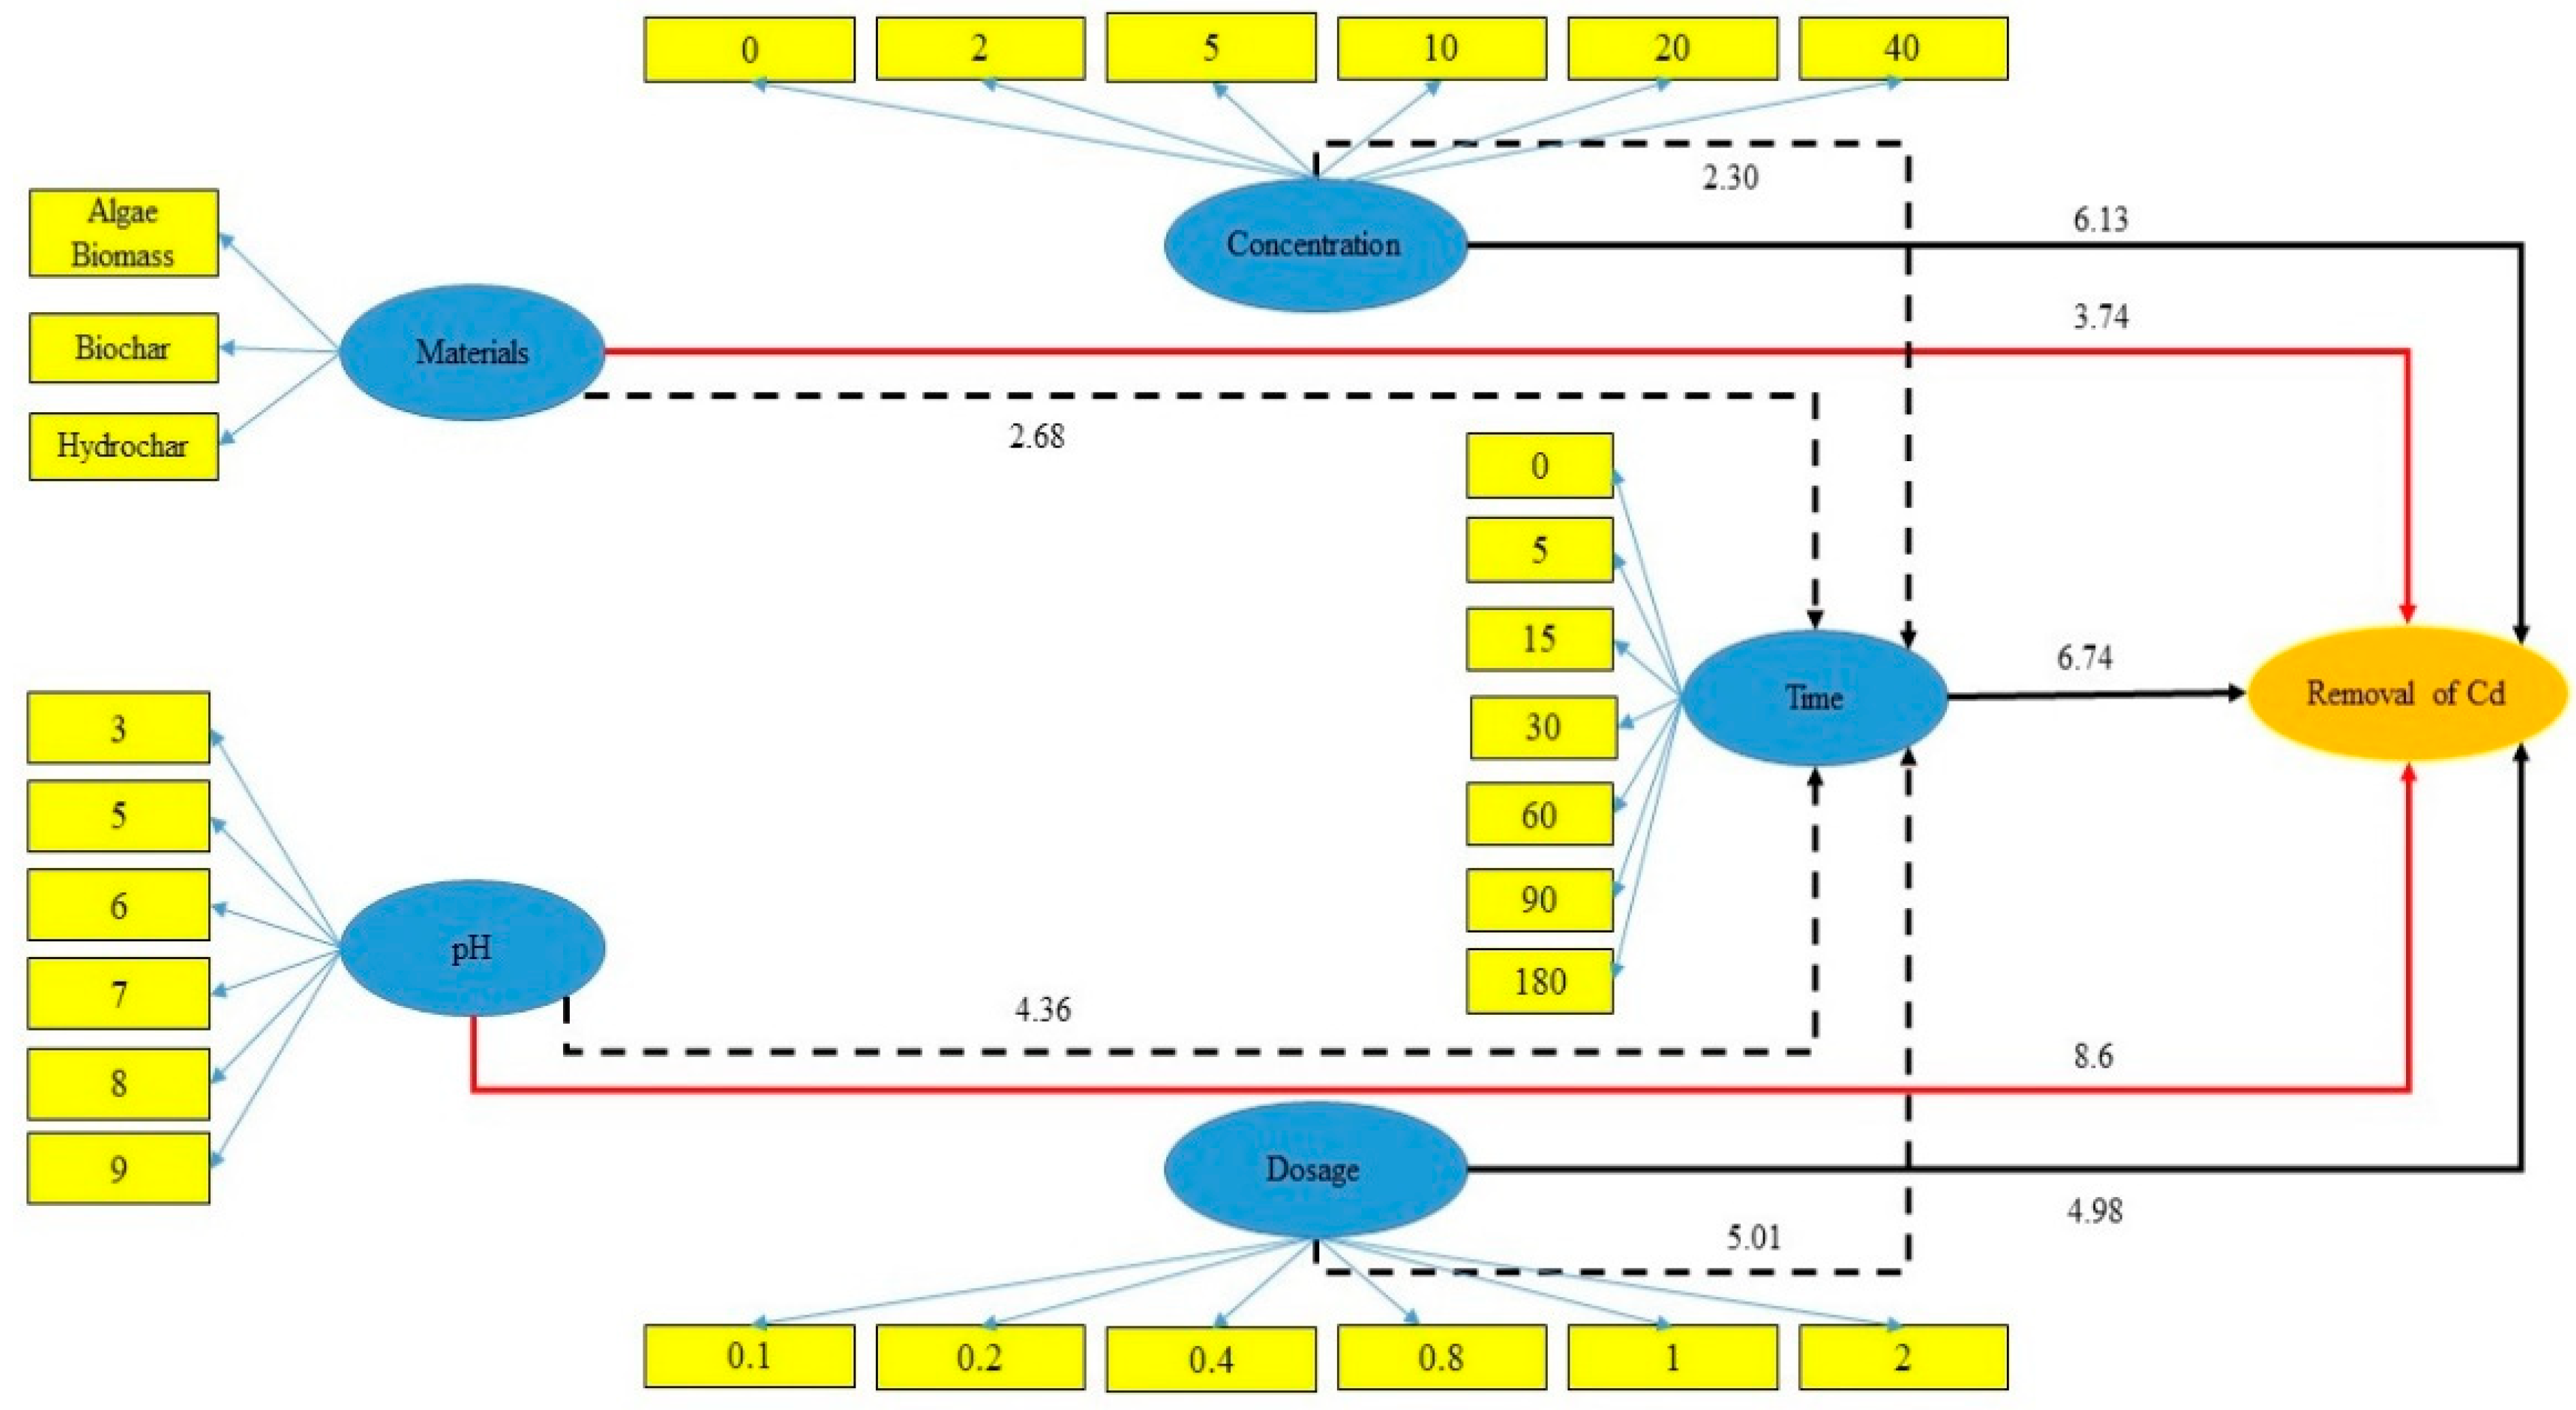
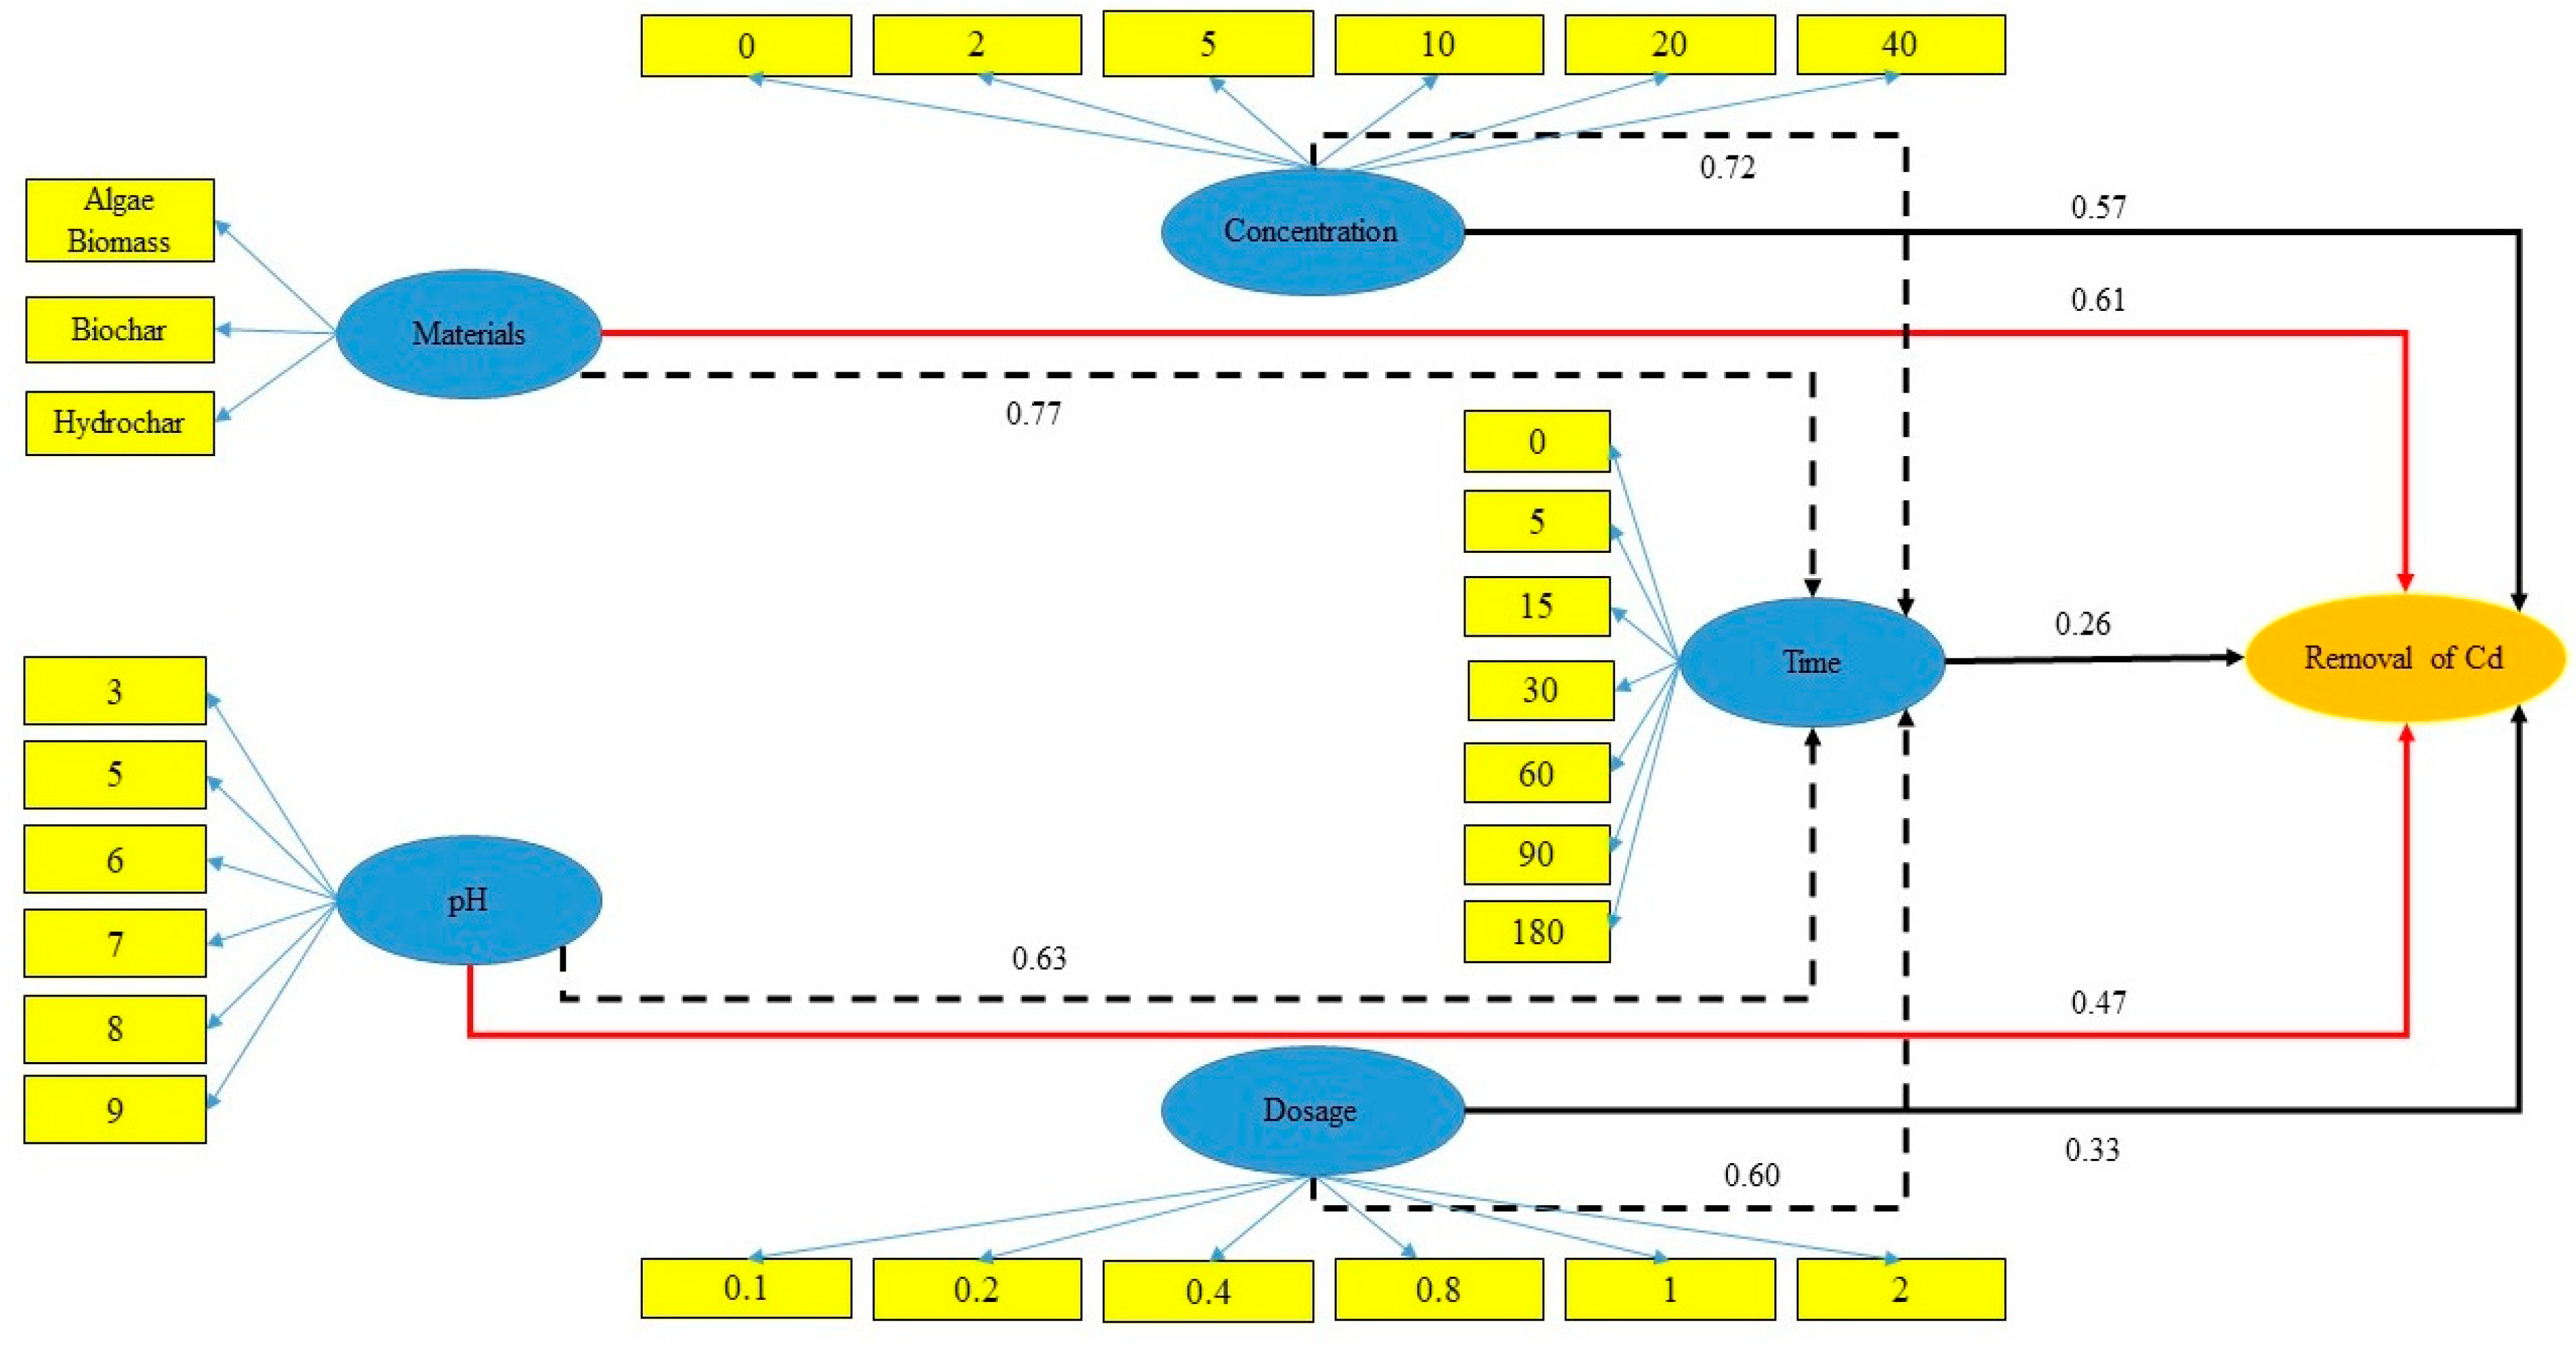
2.3.2. Structural Equation Modeling (SEM)

SEM is a statistical technique that allows modeling and evaluating complex relationships among different variables. It is a multivariate statistical method combining factor analysis and multiple regression to test and estimate the relationships between observed and unobservable variables. The key components of SEM include:
  • Latent variables: These are variables that cannot be directly observed but are inferred from a set of observed variables that are related to them. Latent variables are also known as constructs or factors;
  • Observed variables: These are variables that are directly measured or observed in the study. They are also referred to as indicators or manifest variables;
  • Structural model: This is the part of SEM that represents the hypothesized relationships between the latent variables. It is specified by proposing paths (direct or indirect effects) between the latent variables based on theoretical assumptions;
  • Measurement model: This represents the relationships between the latent variables and their observed indicators. It specifies how the latent variables are measured by the observed variables;
  • SEM allows researchers to test complex hypotheses, explore the underlying structure of the data, and evaluate the fit of the proposed models to the data. It also provides estimates of the strength and significance of the relationships between variables and allows for the inclusion of measurement errors in the analysis.

3. Results and discussion

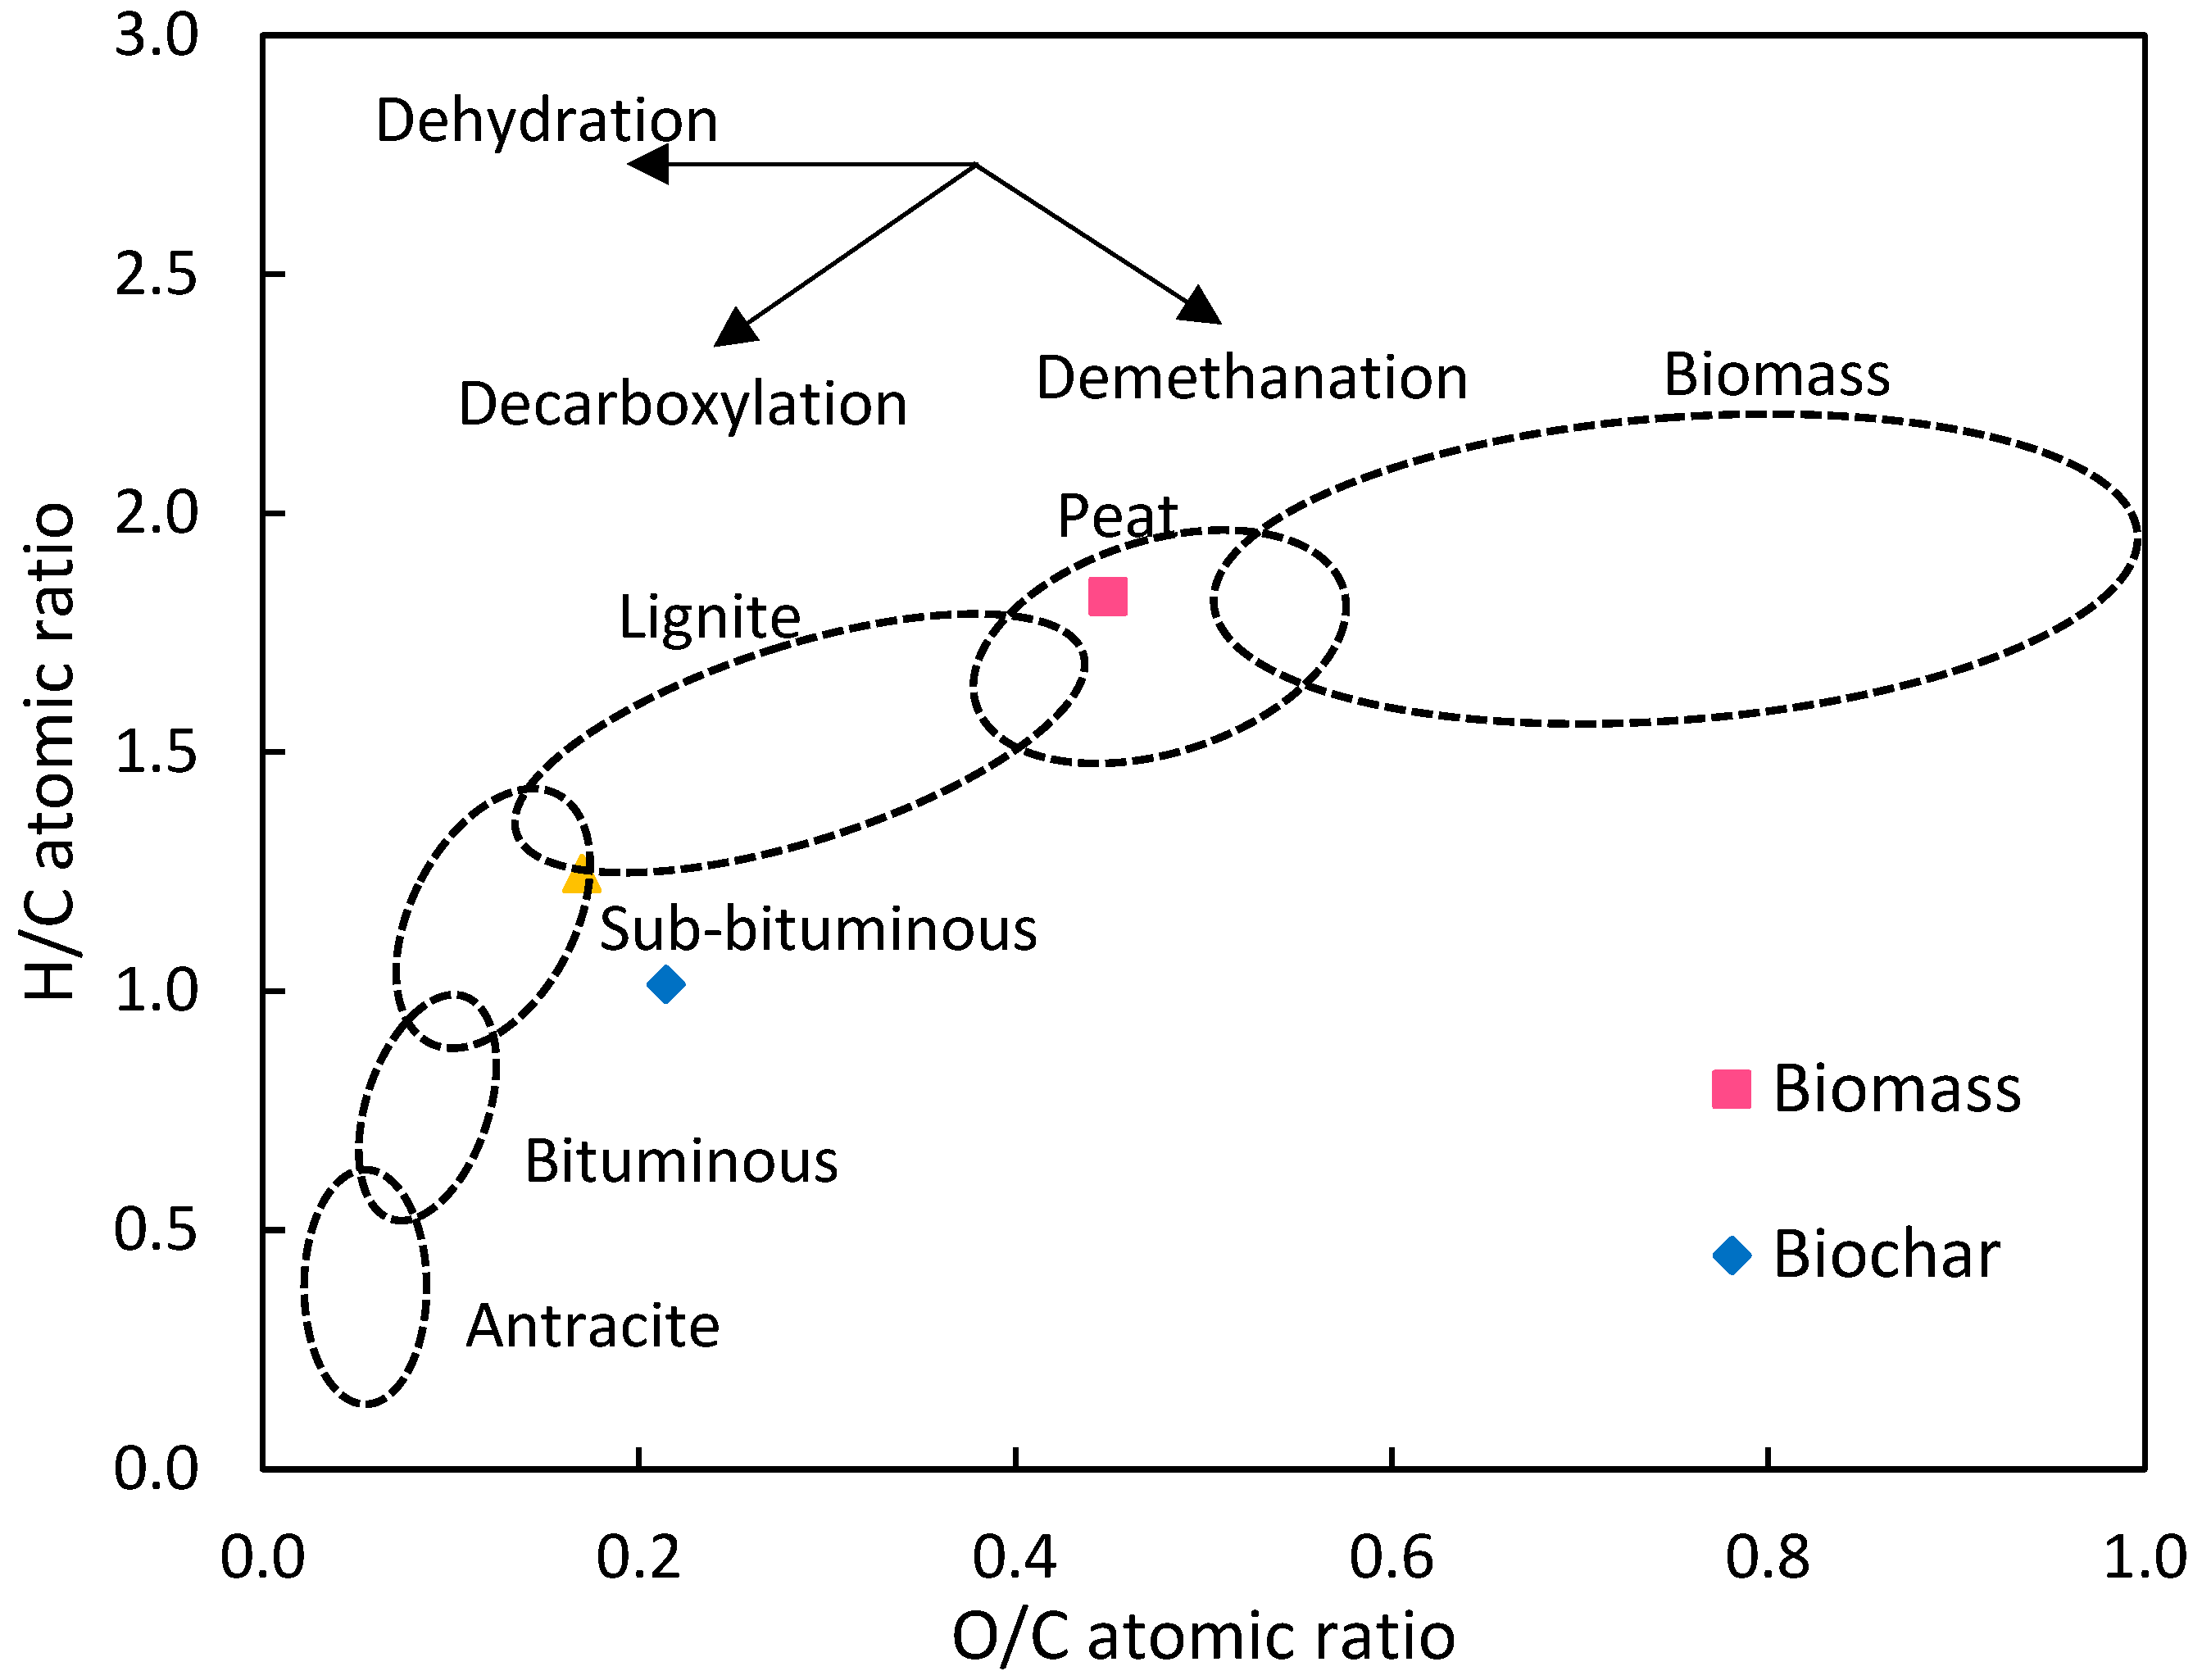
3.1. Properties of CV and Its Biochar and Hydrochar

Table 2 presents the main results from the characterization of CV and the biochar and hydrochar obtained from it.
The highest yield was observed for hydrochar, which is often reported in the literature and ascribed to the lower severity of the HTC process. The results of Binda et al. [39] also showed a lower yield for the biochar from CV; the yields obtained in this study are higher than theirs. In terms of composition, the findings revealed that biomass had the lowest carbon content, whereas hydrochar had the highest carbon content. Biochar exhibited the minimum hydrogen value, while biomass had the maximum hydrogen value. Regarding nitrogen, biomass showed the highest value, whereas hydrochar had the lowest value. Furthermore, biomass yielded the maximum sulfur value, whereas hydrochar had the minimum sulfur value. The results indicate that hydrothermal processes resulted in a significant increase in carbon and a decrease in hydrogen, which aligned with the findings of Tsarpali et al. [40]. During hydrothermal carbonization, condensation and aromatization reactions occurred, leading to an enrichment of carbon in the hydrochar [41]. Additionally, biochar prepared at less than 500 °C contained more dissolved organic C and O functional groups at relatively low C/N ratios, making it more effective for removing inorganic contaminants. Dehydration and methanation reactions during pyrolysis have a significant impact on the elemental composition and ratio. The H/C and O/C atomic ratios are indicators of biochar stability. These ratios are used to measure aromaticity and maturation [42]. Higher levels of carbonization and a lack of oxygen and hydrogen-containing functional groups (such as carboxyl, hydroxyl, etc.) at higher temperatures result in lower H/C and O/C ratios, which are signs that the surface of the material is more aromatic and less hydrophilic [43]. Changes in O/C and H/C atomic ratios are commonly depicted on Van Krevelen diagrams, allowing comparison and prediction of the combustion properties [44]. These changes allow for evaluating the degree of deoxygenation of biomass through decarboxylation or dehydration. Figure 1 illustrates that pyrolysis and hydrothermal carbonization lead to a probable increase in aromaticity, as evidenced by a decrease in O/C and H/C ratios compared to the values of the raw materials. The degree of carbonization observed in both biochar and hydrochar materials was similar. The molar ratios of H/C and O/C for biomass were 1.83 and 0.45, respectively, which differed from those for brown coal and lignite. Pyrolysis and HTC increase the ash content due to the removal of volatiles and the accumulation of inorganic fractions from algal biomass. During HTC, some soluble mineral salts may dissolve, which explains the lower ash content of hydrochar. A high ash content in algae biochar can enhance adsorption [45]. The ash on the char surface consists of various inorganic compounds that may be exchanged through the adsorption process of Cd; thus, cation exchange could be a plausible mechanism for Cd adsorption on char [46].
The pyrolysis and HTC treatment also changed other material properties in accordance with the existing literature. Most notably, the GCV increases in both cases, reaching values more similar to those of lignocellulosic biomass, while the volatile matter content decreases. Volatile matter content characterizes the degree of thermal conversion for biochar and hydrochar, which is influenced by their chemical composition and production conditions [47]. Chaiwong et al. [48] observed a similar phenomenon when studying the proximate analysis of algal biochar (Cladophora). Their results indicated that algal biochar had lower volatile matter content (35.5%) compared to the parent raw macroalga (60.6%). Furthermore, this study found that carbon content increased from 28.8% in the feedstock to 51.1% in algal biochar, while ash content increased from 33.4% in Cladophora algae as feedstock to 38.8% in algal biochar.
Finally, the specific surface area also increased after both treatments but still remained much lower than that of activated carbons (around 500 m2 g−1), indicating that a further physical or chemical activation step would be necessary to enhance it. However, the average pore size differed among all three materials. The increase in mean pore diameter with increasing temperature is attributed to the evaporation of water and organic compounds from biochar, which is caused by the presence of numerous small pores on its surface [49]. Interestingly, hydrochar is produced at lower temperatures (thus often requiring less energy) and contains O-rich functional groups (carboxyl, carbonyl, hydroxyl, and phenolic hydroxyl) that may improve metal absorption [50]. Additionally, the raw materials used for the hydrothermal carbonization reaction influence surface and porosity characteristics, which aligns with the findings of Bird et al. [51], where low surface area was reported for all algal biochar production temperatures.
Biochar has the highest pH (7.9) and EC (4.5 dS m−1) values, while hydrochar has the lowest pH value (6.7). Biochar is typically alkaline due to its high concentration of alkaline elements, whereas hydrochar is often acidic due to its lower concentration of alkaline elements and the presence of acidic compounds in its structure [52]. The high pH of biochar may be ascribed to basic cations (such as Ca and Mg) being released at high temperatures during the pyrolysis process [53]. A study by Sun et al. [54] reported a strong positive correlation between ash content and biochar pH, with higher pH observed in biochar with high ash content. However, hydrochar surfaces often contain acidic functional groups due to the reaction mechanism of hydrothermal carbonization.
Figure 2 shows FTIR spectra that are useful for gathering information about the various functional groups present on the surface of materials. The FTIR spectra of biomass, hydrochar, and biochar exhibited a similar trend, with biochar displaying fewer peaks compared to biomass. However, the peaks in biochar were sharper and taller. The emergence of new peaks in biochar can be attributed to volatiles being released and chemical bonds being broken during pyrolysis. Similarly to biochar, hydrochar also displayed sharper peaks. The functional groups present on the surface of biochar are crucial for effective sorption and electron transfer, which aid in contaminant removal [54]. Additionally, the hydroxyl and carboxyl groups on the surface of each material play a significant role in capturing metal ions from solutions [55]. The peak observed at 3415 cm−1 in all samples indicated O-H tensile vibrations, suggesting the presence of phenols, alcohols, or carboxylic acid. Table 3 reports the tentative assignments. The peaks at 2853 cm−1 in biochar and 2874 cm−1 in hydrochar correspond to asymmetric and symmetric CH2 bonds. In biochar, sharp peaks at 1420 and 1416 cm−1 confirm the presence of C-H groups in alkanes, which were weaker in hydrochar and biomass. Absorption bands between 1600 and 1800 cm−1 indicate the presence of aldehyde/ketone compounds that varied in size among all three materials. The absorption bands at 1600–1700 cm−1 suggest stretching vibrations for C=O and C=C bonds found in carboxyl, carbonyl, or ester compounds. These oxygen-containing functional groups with acidic properties may facilitate heavy metal adsorption. Sharp peaks between 1300 and 1000 cm−1 were attributed to C-O-C asymmetric bonds, while the sharp peaks at 872 and 873 cm−1 correspond to the C-O group in carbonate.
These findings were accompanied by a reduction in volatiles in the proximate analysis of biochar and hydrochar. The presence of oxygenated functional groups and a high O/C atomic ratio in the two chars indicate the potential application of these compounds in adsorption studies [50]. According to the results, some biomass peaks disappeared in the biochar spectra, while the release of volatiles and chemical bond breakage during the pyrolysis reaction caused new peaks to appear. Regarding the products’ aromaticity, biochar contains more aromatic groups due to the higher production temperature, while hydrochar contains more alkyl moieties. Since pyrolysis occurs at higher temperatures, biochar also has a lower H/C ratio and the presence of graphite-like layers with particles of varying sizes. On the other hand, the surface of hydrochar samples consists of spherical particles with more uniform sizes [56].
Scanning electron micrographs (SEM) of biomass, biochar, and hydrochar derived from CV are shown in Figure 3a–c. The cells of CV in the biomass are mostly spherical (Figure 3c), but the biochar appears to be deformed due to cell fragmentation during thermal treatment. Wang et al. [57] reported that the particles of biochar derived from CV are compact and irregular. Reactions during pyrolysis can cause a fragmented, porous structure [58]. The hydrochar obtained from spherical particles appears to be porous, but the spherical shape of the cells is still almost preserved. At a 200% magnification, the hydrochar’s surface appears more porous and irregular.

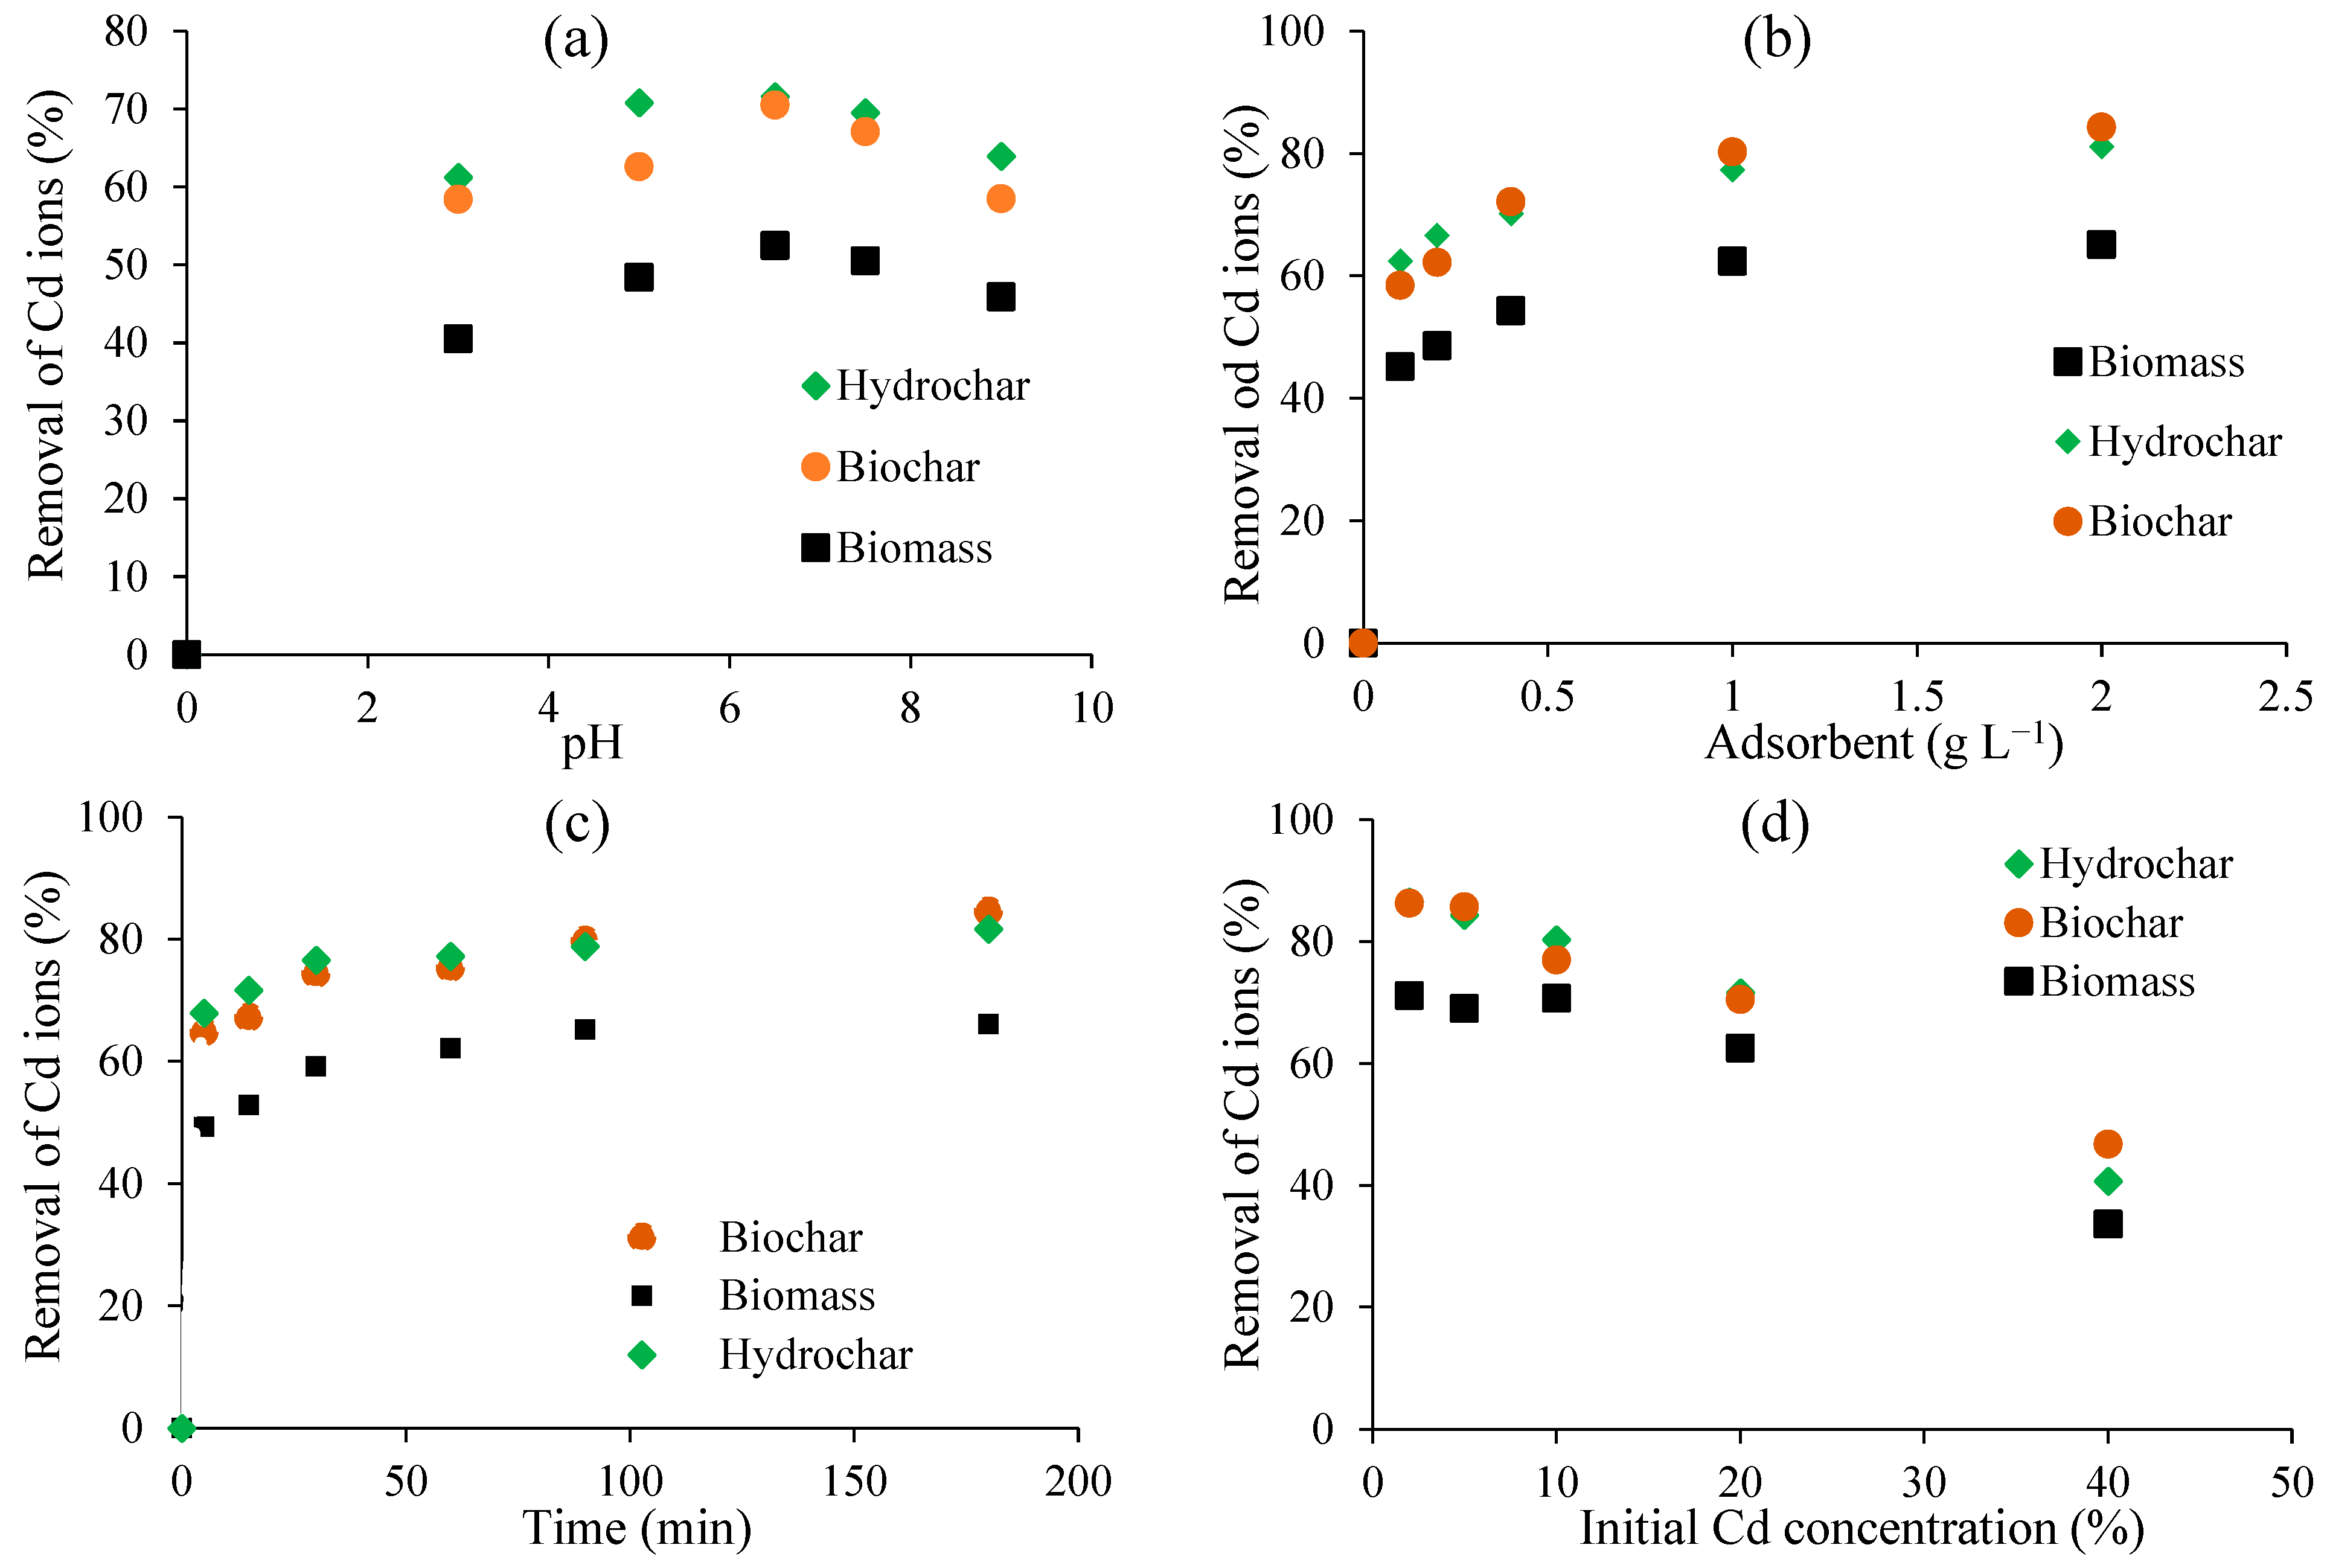
3.2. Adsorption Tests

3.2.1. Results

The adsorption tests revealed interesting patterns for the studied variables; Figure 4 reports the results in terms of the percentage of Cd ions that were removed.
The initial pH of the metal-containing solution is usually a very relevant variable. Biochar, hydrochar, and biomass were assessed for the removal of Cd in batch experiments, where the initial pH ranged from 3 to 9. As shown in Figure 4a, the removal efficiency of Cd by biochar, hydrochar, and biomass was at its maximum at pH = 5. Increasing the pH value from 2 to 6 led to an increase in Cd removal, while increasing the pH value from 6 to 9 resulted in a decrease in Cd removal. When the solution’s pH is above 8, hydroxyl ions can react with Cd to produce a precipitate [59]. At pH 9, only removal efficiencies of 45% for biomass, 56.9% for hydrochar, and 56% for biochar were achieved. The removal of Cd by chitosan-modified peanut shell biochar was also observed at pH levels ranging from 2 to 6, with removal efficiency decreasing as pH levels increased from 6 to 8. These results are consistent with those obtained when employing Ni/Fe bimetallic nanoparticles for the removal of Cr [60]. Large amounts of H+ in solution media can effectively compete with Cd cations for active adsorption sites. Additionally, most researchers have reported that the ideal pH range for heavy metal adsorption is from 5 to 6 [61].
The effect of adsorbent doses on Cd removal at optimal pH (6) was also studied (Figure 4b). There has been a clear increase in the removal rate of Cd by each adsorbent as the adsorbent dosage increased from 0.1 to 0.8 g L−1; however, after 0.8 g L−1 of each adsorbent, only a little increment was observed. Hence, the adsorbent dose of 0.8 g L−1 appears near optimal for each adsorbent.
The effect of contact time is shown in Figure 4c. The contact time ranged from 5 to 180 min. The percentage of Cd removal on biochar, hydrochar, and biomass increases with longer contact time. There is a significant increase in Cd removal within the first 30 min, followed by a gradual increase up to 180 min for biochar. However, for hydrochar and biomass, the adsorption remains relatively constant thereafter. For heavy metal adsorption/absorption, comparable trends have been reported previously. The initial increase in adsorption is attributed to the abundance of available adsorption sites that become saturated over time, resulting in decreased adsorption efficiency after 30 min [62]. Therefore, an equilibrium time of 30 min was considered for adsorption in this study.
The effect of the initial Cd concentration is depicted in Figure 4d. Overall, biochar, hydrochar, and biomass exhibited a similar response pattern. The removal efficiency decreased as the initial Cd concentration increased. Higher initial metal concentrations enhance the velocity at which mass transfers from liquid to solid surfaces, possibly increasing the adsorption capacity. However, the decrease in Cd removal efficiency at high concentrations can be attributed to the adsorbent being saturated. As the Cd concentration in the solution increases, more Cd is adsorbed onto the material. At low Cd concentrations, there is high accessibility to adsorption sites, and all Cd ions bind to the adsorbent. However, as metal ion concentration increases further, the rate of adsorption decreases due to saturation of available sites.
The obtained adsorption capacities can be compared with those of similar materials that are reported in the literature. To this aim, some values are reported in Table 4. The adsorption capacity is indeed comparable, although the CV materials are not the best-performing ones. In this framework, the production cost will likely play a key role in determining the optimal material for the application.

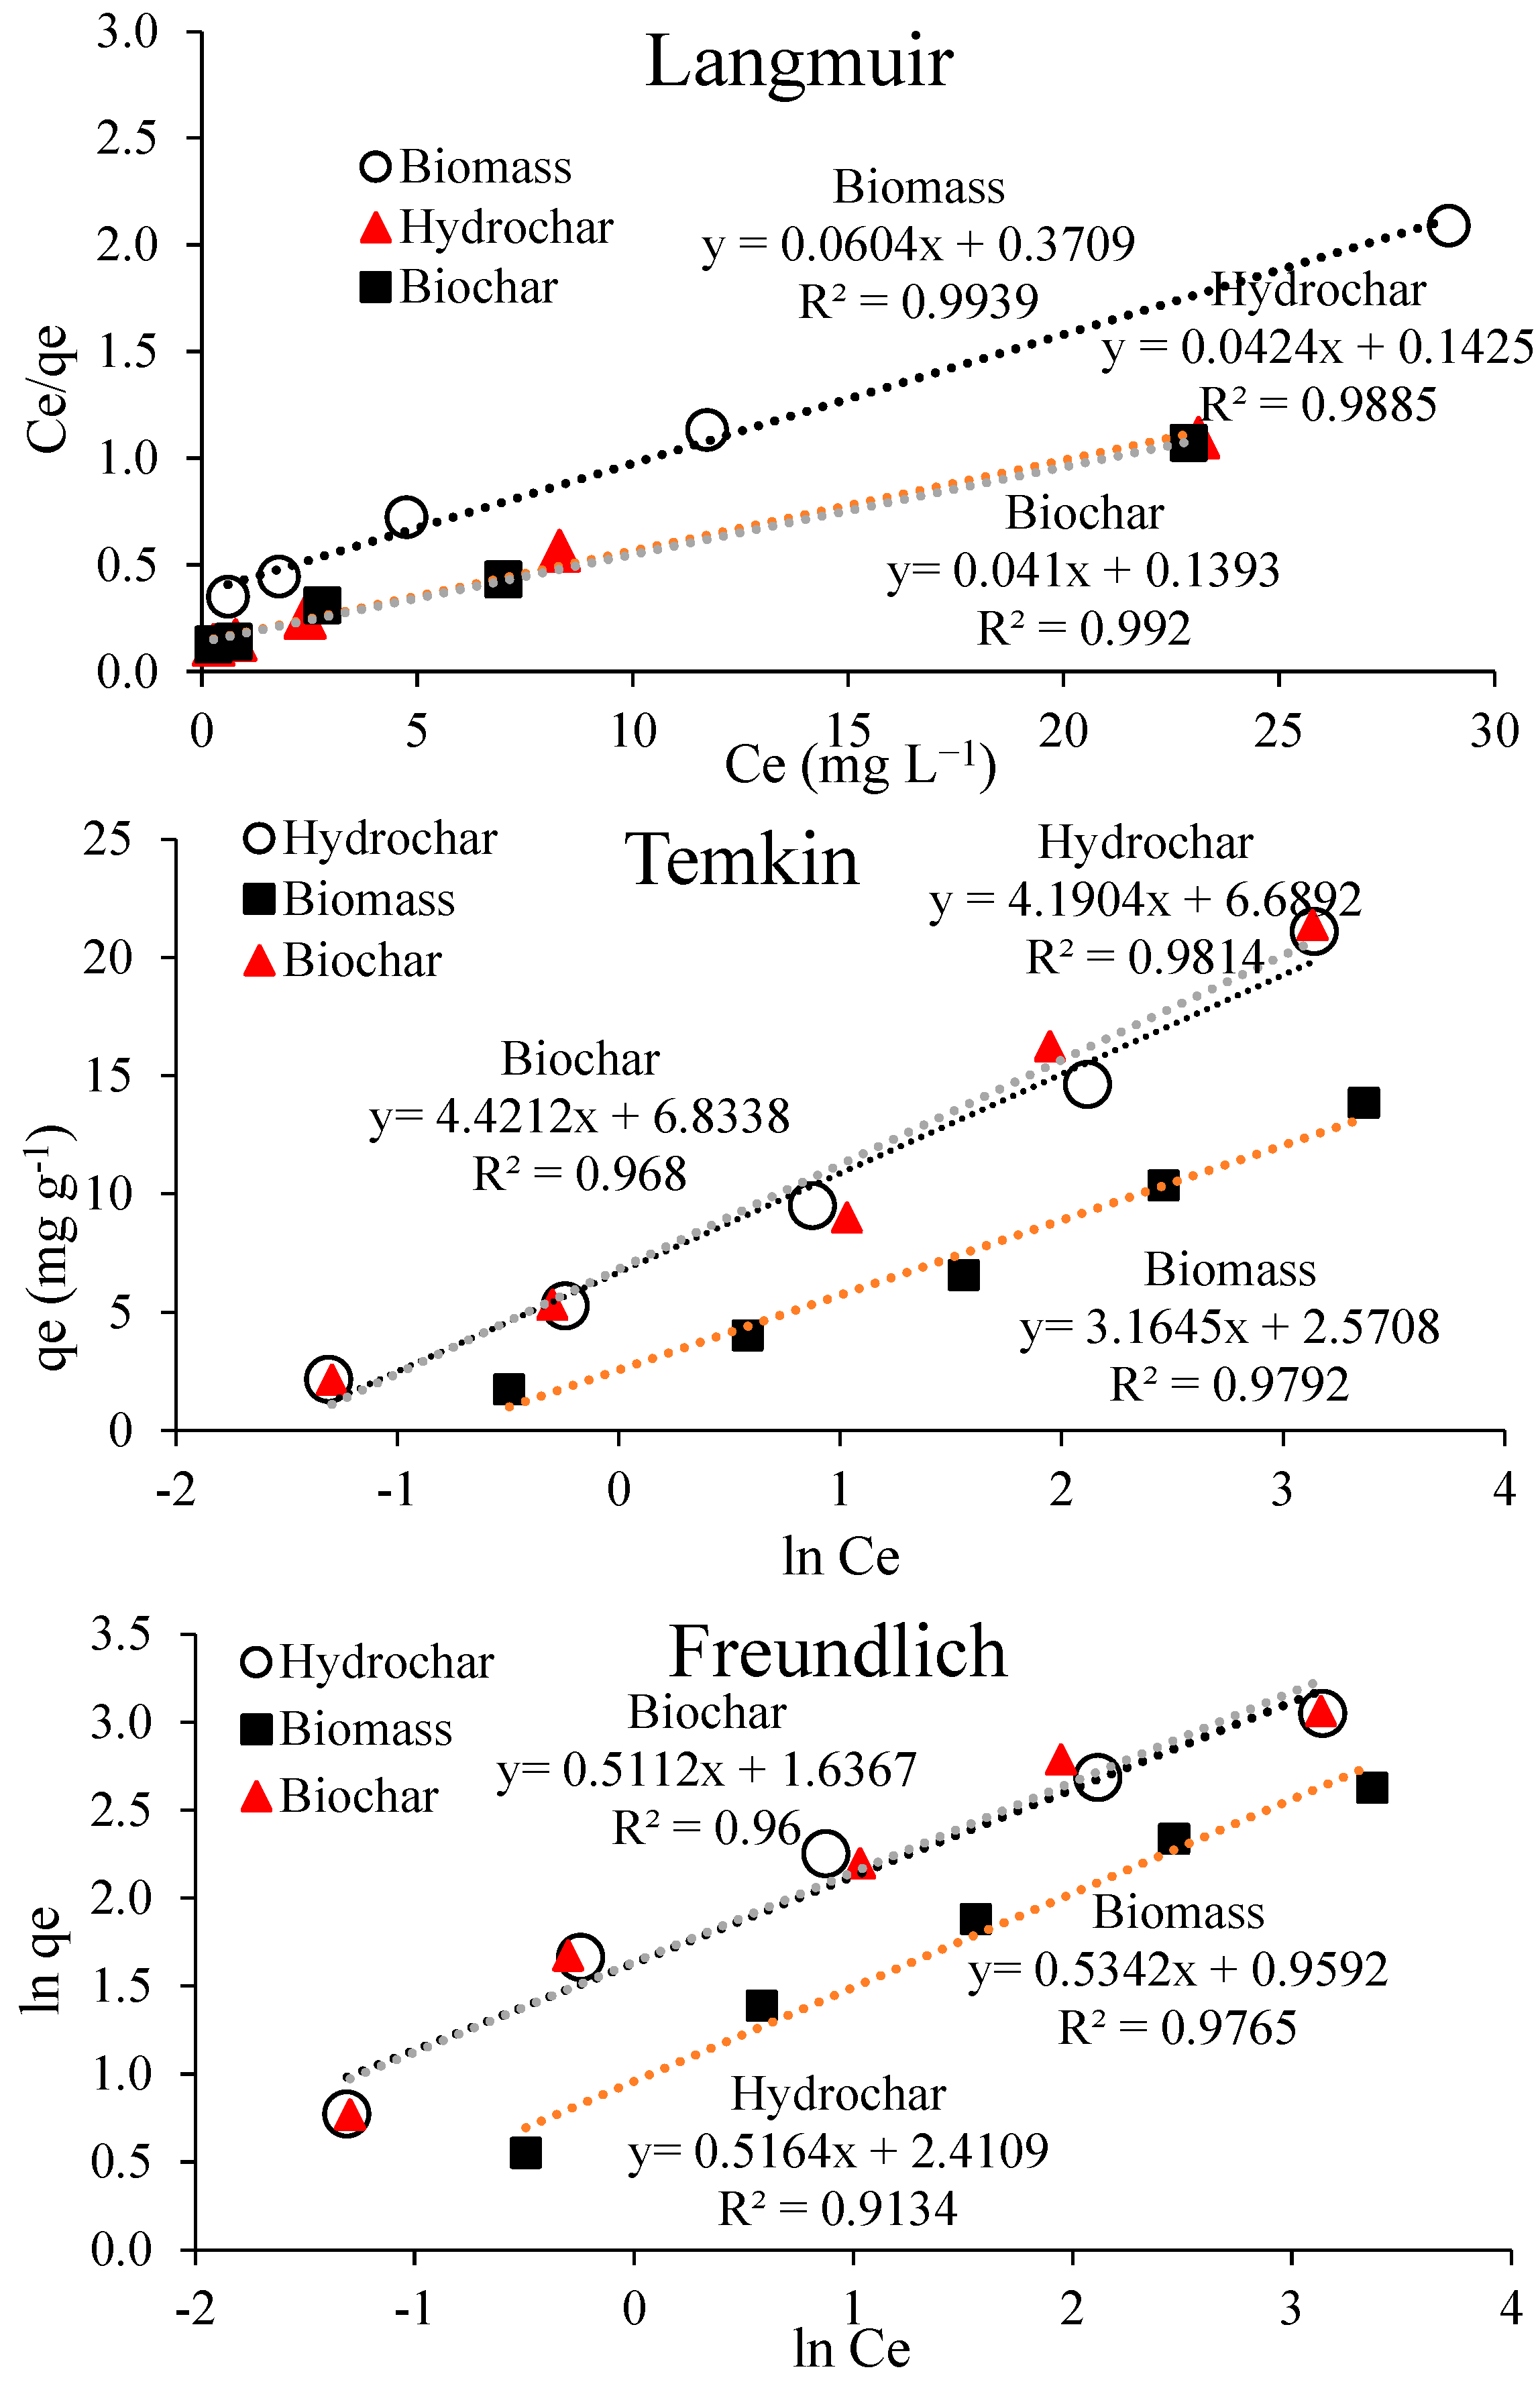
3.2.2. Adsorption Isotherms Modeling

The Langmuir, Freundlich, and Temkin isotherms were used to describe the adsorption characteristics of Cd onto biochar, hydrochar, and raw biomass. The values of qmax, K, and R2 in the Langmuir isotherm model were assessed from the linear plot between Ce/qe and Ce, with their values reported in Table 5. Furthermore, the values of n, Kf, and R2 in the Freundlich isotherm model and bT, KT, and R2 in the Temkin isotherm model were determined from the linear plots of logqe against logCe and qe against lnCe, respectively, as Figure 5 depicts. The Langmuir isotherm showed a better R2 ranging from 0.98 to 0.99 compared to the Freundlich isotherm model (0.913–0.976) and Temkin models (0.96–0.98) in all samples. In addition, the Langmuir model appeared as the superior fit, implying that all samples were monolayered and had identical binding sites distributed equally all over their surface for Cd removal.
The maximum Cd capture capacity (qmax) is well described by Langmuir fitting. In this study, the values for biochar, hydrochar, and biomass were 24.39 mg g−1, 23.58 mg g−1, and 16.56 mg g−1, respectively. The adsorption isotherm is a tentative equation that depends on temperature, the surface area of the adsorbent, the concentration of solute in the solution, and the nature of the adsorbent. A higher AT value for biochar and hydrochar than that of biomass indicates that with pyrolysis and hydrothermal carbonization, a stronger adsorption potential can be achieved. The Temkin adsorption isotherm fits nicely with correlation coefficients ≥0.97 (as per Table 5), implying the chemisorption of Cd onto the adsorbent [68]. It shall be emphasized again that the Cd removal mechanism may be more complex than plain adsorption, involving phenomena such as precipitation due to reactions with OH- ions and cation exchange with active sites on the material’s matrix, just to cite some [69]. More advanced analytical techniques and models [33] would be necessary for a more rigorous description of the Cd removal mechanism at a molecular level; these will be considered in future works.

3.2.3. Structural Equation Modeling (SEM)

The factor loadings obtained from the model implementation are presented in Table 6. In many cases, when calculating the correlation between indicators and their corresponding structure, an appropriate value equal to or greater than 0.4 is considered significant [70]. Kline [71] further explains that factor loadings range between zero and one. Loadings below 0.3 are considered weak and are disregarded, while loadings between 0.3 and 0.6 are deemed acceptable. Loadings exceeding 0.6 are considered highly desirable.
Following the assessment of the validity and reliability of the measurement model, the SEM is examined to determine the relationships between the independent variables. In this research, commonly used criteria are employed to evaluate the fit of the SEM, including significant coefficients (T-values), the determination coefficient (R2), and the predictive power coefficient (Q2).
The fundamental criterion for measuring the relationships between constructs in the SEM is the significance of T-values. If the absolute value of these values is greater than or equal to 1.96, it indicates a statistically significant relationship between the constructs, confirming the research hypotheses at a 95% confidence level. Figure 6 illustrates the model’s T-values.
R2 is a measure utilized to establish a connection between the measurement and structural components of SEM, demonstrating the influence of an independent variable on a dependent variable. One of the principal advantages of the partial least squares (PLS) method is its capability to diminish errors in measurement models or amplify the variance between constructs and indicators. An important aspect to note is that the R2 value is exclusively computed for the dependent structures of the model; for independent structures, this criterion holds a value of zero. Ranging from zero to one, the R2 value signifies the degree of fit of the SEM across three levels: weak (0 to 0.19), moderate (0.19 to 0.33), and strong (0.33 to 0.67). Table 7 presents the R2 results. Notably, the R2 values for all parameters indicate a moderate to strong level of fit.
This measure determines the predictive power of the model. According to the beliefs of researchers, models with an acceptable structural fit should be capable of predicting the indicators related to the endogenous structures of the model. This implies that if the relationships between the structures are accurately defined in a model, these structures will have a significant impact on each other’s indicators, thus confirming the research hypotheses. In the case of an endogenous structure, the value of Q2 can fall into three categories: 0.02 to 0.15 (weak predictive power), 0.15 to 0.35 (medium predictive power), and above 0.35 (strong predictive power). If the value of Q2 for an endogenous construct is zero or negative, it indicates that the relationships between other constructs in the model and the endogenous construct are not well explained, suggesting the need for model modification. In general, this criterion demonstrates the predictive power of the model based on three levels: weak, medium, and strong. Table 8 presents the results of the Q2 index. According to Table 8, it is evident that the model exhibits very strong predictive power since the predictive power of the structures exceeds 0.35.
Figure 7 presents the results of the intensity of the effect of each variable and the mediating effect of time on Cd removal from water. Time is used as a mediator because all the investigated variables are influenced by time, and they exert their effects over a period. Both Figure 6 and Figure 7 demonstrate that all parameters have a significant impact on Cd removal in water. Notably, the type of material, when mediated by time with an effect intensity of 0.77, exhibits the greatest influence on Cd removal compared to other variables. Additionally, the direct material type, with an effect intensity of 0.61, is crucial in removing Cd. The experiment’s results also highlight the significant impact of time on Cd removal through both direct and mediated paths. Furthermore, concentration shows a significant effect on Cd removal through the mediating path of time. Overall, the intensity of the effects is higher in the intermediate paths compared to the direct path, emphasizing the significance of time in the Cd removal process. The intensity of the effect of materials such as biochar and hydrochar on Cd removal in aqueous environments can be quite significant. Both biochar and hydrochar are known for their strong adsorption capabilities, making them effective in removing heavy metals like Cd from water. Biochar and hydrochar have porous structures, providing ample sites for Cd ions to adsorb onto their surfaces. The adsorption process involves the attraction and binding of Cd to the functional groups present on the biochar and hydrochar surfaces. The effectiveness of these materials in Cd removal depends on various factors, such as the specific properties of the biochar and hydrochar, the dosage used, the initial concentration of Cd in the water, and the pH of the aqueous solution. Moreover, the type of material and its preparation methods can also influence the adsorption capacity. Therefore, it is crucial to optimize the characteristics and application of biochar and hydrochar to achieve maximum Cd removal efficiency.

4. Conclusions

CV holds great industrial potential due to its high production rate and availability. This study aimed to compare the physicochemical properties and Cd adsorption/absorption performance of biomass, biochar, and hydrochar derived from CV. The results showed that the conversion of CV biomass to biochar and hydrochar caused a decrease in volatile matter content and pH in hydrochar. SSA was only slightly increased after both pyrolytic and hydrothermal carbonization, which conversely more significantly affected pore volume and diameter. Treatment through pyrolysis and HTC led to an increase in C mass fraction while decreasing N, O, S, and H. The presence of functional groups (as evidenced by FTIR) and irregular pores suggests the applicability of all three materials for soil and water pollutant sorption. Scanning electron micrographs showed an increase in the number and pore size of the carbonized materials compared to the raw biomass. More advanced analytical techniques, such as thermogravimetric analysis and thermal desorption spectroscopy (to quantify the ion exchange sites), could also be interesting for future studies.
The maximum Cd capture capacity of biochar, biomass, and hydrochar was investigated: the adsorption performances of biochar and hydrochar resulted both similar to one another and better than that of the parent raw CV. The results showed that Cd removal depended on adsorbent dosage, contact time, and pH. The ideal conditions for the highest Cd removal were observed for all the materials tested at an adsorbent dosage of 0.8 g L−1, an initial Cd concentration of 30 mg L−1, and a pH of 6 within 30 min. The maximum adsorption capacities of biochar, hydrochar, and biomass were determined to be 24.39 mg g−1, 23.58 mg g-1, and 16.6 mg g−1, respectively. The experimental data fit three well-known adsorption isotherm models well, seemingly implying that they may represent reasonable simplifications for the observed removal. Nonetheless, from the literature, it is well-known that the capture of Cd ions is much more complex and involves phenomena other than physical adsorption, such as the formation of ionic bonds with the cations. Nonetheless, such a deep examination of the full mechanism is beyond the scope of this work. More advanced experimental and modeling techniques are required to attain this aim, which will be addressed in future works.
It is important to note that the efficiency of CV and its carbonized derivatives in removing Cd is influenced by various factors, such as initial Cd concentration, pH, time, and temperature. Using structural equation modeling to categorize the variables affecting the removal of Cd in water allows for the simultaneous examination of multiple variables and their interrelationships, providing a holistic view of how various factors interact and influence Cd removal, enabling a more comprehensive analysis than studying individual variables in isolation. Once the most appropriate material and operating conditions are established, further practical details will need to be investigated with care, such as the possibility of regenerating the sorbent and the effects of the presence of other metal ions.

Author Contributions

Conceptualization, J.S., M.B.S., F.M. and L.F.; methodology, M.B.S., A.A. and S.M.; software, J.S.; validation, M.B.S., A.A. and S.M.; formal analysis, J.S.; investigation, J.S., A.A. and S.M.; resources, M.B.S.; data curation, J.S.; writing—original draft preparation, J.S.; writing—review and editing, M.B.S., F.M., L.F., A.A. and S.M.; visualization, J.S.; supervision, M.B.S.; project administration, M.B.S.; funding acquisition, M.B.S. All authors have read and agreed to the published version of the manuscript.

Funding

The publication was created with the co-financing of the European Union—FSE-REACT-EU, PON Research and Innovation 2014–2020 DM1062/2021.

Data Availability Statement

Data will be made available upon request.

Conflicts of Interest

The authors declare no conflict of interest.

References

  1. El-Sorogy, A.S.; Youssef, M.; Al-Hashim, M.H. Water Quality Assessment and Environmental Impact of Heavy Metals in the Red Sea Coastal Seawater of Yanbu, Saudi Arabia. Water 2023, 15, 201. [Google Scholar] [CrossRef]
  2. Shetaia, S.A.; Nasr, R.A.; Lasheen, E.S.R.; Dar, M.A.; Al-Mur, B.A.; Zakaly, H.M.H. Assessment of Heavy Metals Contamination of Sediments and Surface Waters of Bitter Lake, Suez Canal, Egypt: Ecological Risks and Human Health. Mar. Pollut. Bull. 2023, 192, 115096. [Google Scholar] [CrossRef] [PubMed]
  3. Gautam, R.K.; Sharma, S.K.; Mahiya, S.; Chattopadhyaya, M.C. CHAPTER 1. Contamination of Heavy Metals in Aquatic Media: Transport, Toxicity and Technologies for Remediation. In Heavy Metals In Water; Royal Society of Chemistry: Cambridge, UK, 2014; pp. 1–24. [Google Scholar]
  4. Liapun, V.; Motola, M. Current Overview and Future Perspective in Fungal Biorecovery of Metals from Secondary Sources. J. Environ. Manag. 2023, 332, 117345. [Google Scholar] [CrossRef] [PubMed]
  5. Zeng, X.; Xu, X.; Qin, Q.; Ye, K.; Wu, W.; Huo, X. Heavy Metal Exposure Has Adverse Effects on the Growth and Development of Preschool Children. Environ. Geochem. Health 2019, 41, 309–321. [Google Scholar] [CrossRef] [PubMed]
  6. Usman, A.; Sallam, A.; Zhang, M.; Vithanage, M.; Ahmad, M.; Al-Farraj, A.; Ok, Y.S.; Abduljabbar, A.; Al-Wabel, M. Sorption Process of Date Palm Biochar for Aqueous Cd (II) Removal: Efficiency and Mechanisms. Water Air Soil Pollut. 2016, 227, 449. [Google Scholar] [CrossRef]
  7. Appenroth, K.J. Definition of “Heavy Metals” and Their Role in Biological Systems. In Soil Heavy Metals; Soil Biology; Springer: Berlin/Heidelberg, Germany, 2010; Volume 19, pp. 19–29. [Google Scholar]
  8. Mishra, S.; Bharagava, R.N.; More, N.; Yadav, A.; Zainith, S.; Mani, S.; Chowdhary, P. Heavy Metal Contamination: An Alarming Threat to Environment and Human Health. In Environmental Biotechnology: For Sustainable Future; Springer: Singapore, 2019; pp. 103–125. [Google Scholar]
  9. Bouida, L.; Rafatullah, M.; Kerrouche, A.; Qutob, M.; Alosaimi, A.M.; Alorfi, H.S.; Hussein, M.A. A Review on Cadmium and Lead Contamination: Sources, Fate, Mechanism, Health Effects and Remediation Methods. Water 2022, 14, 3432. [Google Scholar] [CrossRef]
  10. Rafati Rahimzadeh, M.; Rafati Rahimzadeh, M.; Kazemi, S.; Moghadamnia, A.-A. Cadmium Toxicity and Treatment: An Update. Casp. J. Intern. Med. 2017, 8, 135–145. [Google Scholar] [CrossRef]
  11. Irfan, M.; Liu, X.; Hussain, K.; Mushtaq, S.; Cabrera, J.; Zhang, P. The Global Research Trend on Cadmium in Freshwater: A Bibliometric Review. Environ. Sci. Pollut. Res. 2021, 30, 71585–71598. [Google Scholar] [CrossRef]
  12. C, F.C.; Kamalesh, T.; Kumar, P.S.; Rangasamy, G. A Critical Review on the Sustainable Approaches for the Removal of Toxic Heavy Metals from Water Systems. Ind. Eng. Chem. Res. 2023, 62, 8575–8601. [Google Scholar] [CrossRef]
  13. Dai, Y.; Zhang, N.; Xing, C.; Cui, Q.; Sun, Q. The Adsorption, Regeneration and Engineering Applications of Biochar for Removal Organic Pollutants: A Review. Chemosphere 2019, 223, 12–27. [Google Scholar] [CrossRef]
  14. Li, S.; Tasnady, D. Biochar for Soil Carbon Sequestration: Current Knowledge, Mechanisms, and Future Perspectives. C 2023, 9, 67. [Google Scholar] [CrossRef]
  15. O’Connor, D.; Peng, T.; Zhang, J.; Tsang, D.C.W.; Alessi, D.S.; Shen, Z.; Bolan, N.S.; Hou, D. Biochar Application for the Remediation of Heavy Metal Polluted Land: A Review of in Situ Field Trials. Sci. Total Environ. 2018, 619–620, 815–826. [Google Scholar] [CrossRef] [PubMed]
  16. Fang, J.; Gao, B.; Chen, J.; Zimmerman, A.R. Hydrochars Derived from Plant Biomass under Various Conditions: Characterization and Potential Applications and Impacts. Chem. Eng. J. 2015, 267, 253–259. [Google Scholar] [CrossRef]
  17. Hu, B.; Wang, K.; Wu, L.; Yu, S.; Antonietti, M.; Titirici, M. Engineering Carbon Materials from the Hydrothermal Carbonization Process of Biomass. Adv. Mater. 2010, 22, 813–828. [Google Scholar] [CrossRef] [PubMed]
  18. Saha, N.; Volpe, M.; Fiori, L.; Volpe, R.; Messineo, A.; Reza, M.T. Cationic Dye Adsorption on Hydrochars of Winery and Citrus Juice Industries Residues: Performance, Mechanism, and Thermodynamics. Energies 2020, 13, 4686. [Google Scholar] [CrossRef]
  19. Purnomo, C.; Castello, D.; Fiori, L. Granular Activated Carbon from Grape Seeds Hydrothermal Char. Appl. Sci. 2018, 8, 331. [Google Scholar] [CrossRef]
  20. Li, G.; Xiao, W.; Yang, T.; Lyu, T. Optimization and Process Effect for Microalgae Carbon Dioxide Fixation Technology Applications Based on Carbon Capture: A Comprehensive Review. C 2023, 9, 35. [Google Scholar] [CrossRef]
  21. Ru, I.T.K.; Sung, Y.Y.; Jusoh, M.; Wahid, M.E.A.; Nagappan, T. Chlorella Vulgaris: A Perspective on Its Potential for Combining High Biomass with High Value Bioproducts. Appl. Phycol. 2020, 1, 2–11. [Google Scholar] [CrossRef]
  22. Sekar, M.; Mathimani, T.; Alagumalai, A.; Chi, N.T.L.; Duc, P.A.; Bhatia, S.K.; Brindhadevi, K.; Pugazhendhi, A. A Review on the Pyrolysis of Algal Biomass for Biochar and Bio-Oil—Bottlenecks and Scope. Fuel 2021, 283, 119190. [Google Scholar] [CrossRef]
  23. Safi, C.; Zebib, B.; Merah, O.; Pontalier, P.-Y.; Vaca-Garcia, C. Morphology, Composition, Production, Processing and Applications of Chlorella Vulgaris: A Review. Renew. Sustain. Energy Rev. 2014, 35, 265–278. [Google Scholar] [CrossRef]
  24. Chong, J.W.R.; Khoo, K.S.; Yew, G.Y.; Leong, W.H.; Lim, J.W.; Lam, M.K.; Ho, Y.-C.; Ng, H.S.; Munawaroh, H.S.H.; Show, P.L. Advances in Production of Bioplastics by Microalgae Using Food Waste Hydrolysate and Wastewater: A Review. Bioresour. Technol. 2021, 342, 125947. [Google Scholar] [CrossRef] [PubMed]
  25. Carnovale, G.; Rosa, F.; Shapaval, V.; Dzurendova, S.; Kohler, A.; Wicklund, T.; Horn, S.J.; Barbosa, M.J.; Skjånes, K. Starch Rich Chlorella Vulgaris: High-Throughput Screening and Up-Scale for Tailored Biomass Production. Appl. Sci. 2021, 11, 9025. [Google Scholar] [CrossRef]
  26. Li, H.; Dong, X.; da Silva, E.B.; de Oliveira, L.M.; Chen, Y.; Ma, L.Q. Mechanisms of Metal Sorption by Biochars: Biochar Characteristics and Modifications. Chemosphere 2017, 178, 466–478. [Google Scholar] [CrossRef] [PubMed]
  27. Guillard, R.R.L. Culture of Phytoplankton for Feeding Marine Invertebrates. In Culture of Marine Invertebrate Animals; Springer: Boston, MA, USA, 1975; pp. 29–60. [Google Scholar]
  28. ISO 562:2010; Hard Coal and Coke—Determination of Volatile Matter. International Organization for Standardization: Geneva, Switzerland, 2010.
  29. Friedl, A.; Padouvas, E.; Rotter, H.; Varmuza, K. Prediction of Heating Values of Biomass Fuel from Elemental Composition. Anal. Chim. Acta 2005, 544, 191–198. [Google Scholar] [CrossRef]
  30. Isaac, P.J.; Amaravadi, S.; MSM, K.; KK, C.; R, L. Synthesis of Zeolite/Activated Carbon Composite Material for the Removal of Lead (II) and Cadmium (II) Ions. Environ. Prog. Sustain. Energy 2019, 38, e13246. [Google Scholar] [CrossRef]
  31. N’goran, K.P.D.A.; Diabaté, D.; Yao, K.M.; Kouassi, N.L.B.; Gnonsoro, U.P.; Kinimo, K.C.; Trokourey, A. Lead and Cadmium Removal from Natural Freshwater Using Mixed Activated Carbons from Cashew and Shea Nut Shells. Arab. J. Geosci. 2018, 11, 498. [Google Scholar] [CrossRef]
  32. Sellaoui, L.; Dotto, G.L.; Lamine, A.B.; Erto, A. Interpretation of Single and Competitive Adsorption of Cadmium and Zinc on Activated Carbon Using Monolayer and Exclusive Extended Monolayer Models. Environ. Sci. Pollut. Res. 2017, 24, 19902–19908. [Google Scholar] [CrossRef] [PubMed]
  33. Saravanan, A.; Kumar, P.S.; Vo, D.-V.N.; Swetha, S.; Ngueagni, P.T.; Karishma, S.; Jeevanantham, S.; Yaashikaa, P.R. Ultrasonic Assisted Agro Waste Biomass for Rapid Removal of Cd(II) Ions from Aquatic Environment: Mechanism and Modelling Analysis. Chemosphere 2021, 271, 129484. [Google Scholar] [CrossRef]
  34. Langmuir, I. The Adsorption of Gases on Plane Surfaces of Glass, Mica and Platinum. J. Am. Chem. Soc. 1918, 40, 1361–1403. [Google Scholar] [CrossRef]
  35. Gransee, A.; Merbach, W. Phosphorus Dynamics in a Long-Term P Fertilization Trial on Luvic Phaeozem at Halle. J. Plant Nutr. Soil Sci. 2000, 163, 353–357. [Google Scholar] [CrossRef]
  36. Freundlich, H. Über Die Adsorption in Lösungen. Z. Für Phys. Chem. 1907, 57U, 385–470. [Google Scholar] [CrossRef]
  37. Bohn, H.L.; McNeal, B.L.; O’Connor, G.A. Soil Chemistry; Wiley: Hoboken, NJ, USA, 1985; ISBN 0471822175. [Google Scholar]
  38. Temkin, M.J.; Pyzhev, V. Recent Modifications to Langmuir Isotherms. Acta Physiochim URSS 1940, 12, 217–225. [Google Scholar]
  39. Binda, G.; Spanu, D.; Bettinetti, R.; Magagnin, L.; Pozzi, A.; Dossi, C. Comprehensive Comparison of Microalgae-Derived Biochar from Different Feedstocks: A Prospective Study for Future Environmental Applications. Algal Res. 2020, 52, 102103. [Google Scholar] [CrossRef]
  40. Tsarpali, M.; Kuhn, J.N.; Philippidis, G.P. Hydrothermal Carbonization of Residual Algal Biomass for Production of Hydrochar as a Biobased Metal Adsorbent. Sustainability 2022, 14, 455. [Google Scholar] [CrossRef]
  41. Khoo, C.G.; Lam, M.K.; Mohamed, A.R.; Lee, K.T. Hydrochar Production from High-Ash Low-Lipid Microalgal Biomass via Hydrothermal Carbonization: Effects of Operational Parameters and Products Characterization. Environ. Res. 2020, 188, 109828. [Google Scholar] [CrossRef] [PubMed]
  42. Spokas, K.A. Review of the Stability of Biochar in Soils: Predictability of O:C Molar Ratios. Carbon Manag. 2010, 1, 289–303. [Google Scholar] [CrossRef]
  43. Chen, X.; Chen, G.; Chen, L.; Chen, Y.; Lehmann, J.; McBride, M.B.; Hay, A.G. Adsorption of Copper and Zinc by Biochars Produced from Pyrolysis of Hardwood and Corn Straw in Aqueous Solution. Bioresour. Technol. 2011, 102, 8877–8884. [Google Scholar] [CrossRef]
  44. Peters, K.E.; Xia, X.; Pomerantz, A.E.; Mullins, O.C. Geochemistry Applied to Evaluation of Unconventional Resources. In Unconventional Oil and Gas Resources Handbook; Elsevier: Amsterdam, The Netherlands, 2016; pp. 71–126. [Google Scholar]
  45. Chen, S.; Yang, M.; Ba, C.; Yu, S.; Jiang, Y.; Zou, H.; Zhang, Y. Preparation and Characterization of Slow-Release Fertilizer Encapsulated by Biochar-Based Waterborne Copolymers. Sci. Total Environ. 2018, 615, 431–437. [Google Scholar] [CrossRef]
  46. Deng, J.; Li, X.; Wei, X.; Liu, Y.; Liang, J.; Song, B.; Shao, Y.; Huang, W. Hybrid Silicate-Hydrochar Composite for Highly Efficient Removal of Heavy Metal and Antibiotics: Coadsorption and Mechanism. Chem. Eng. J. 2020, 387, 124097. [Google Scholar] [CrossRef]
  47. Enders, A.; Hanley, K.; Whitman, T.; Joseph, S.; Lehmann, J. Characterization of Biochars to Evaluate Recalcitrance and Agronomic Performance. Bioresour. Technol. 2012, 114, 644–653. [Google Scholar] [CrossRef]
  48. Chaiwong, K.; Kiatsiriroat, T.; Vorayos, N.; Thararax, C. Study of Bio-Oil and Bio-Char Production from Algae by Slow Pyrolysis. Biomass Bioenergy 2013, 56, 600–606. [Google Scholar] [CrossRef]
  49. Ghani, W.A.W.A.K.; Mohd, A.; da Silva, G.; Bachmann, R.T.; Taufiq-Yap, Y.H.; Rashid, U.; Al-Muhtaseb, A.H. Biochar Production from Waste Rubber-Wood-Sawdust and Its Potential Use in C Sequestration: Chemical and Physical Characterization. Ind. Crops Prod. 2013, 44, 18–24. [Google Scholar] [CrossRef]
  50. Zhang, X.; Wang, Y.; Cai, J.; Wilson, K.; Lee, A.F. Bio/Hydrochar Sorbents for Environmental Remediation. Energy Environ. Mater. 2020, 3, 453–468. [Google Scholar] [CrossRef]
  51. Bird, M.I.; Wurster, C.M.; de Paula Silva, P.H.; Bass, A.M.; de Nys, R. Algal Biochar—Production and Properties. Bioresour. Technol. 2011, 102, 1886–1891. [Google Scholar] [CrossRef] [PubMed]
  52. Bargmann, I.; Rillig, M.C.; Buss, W.; Kruse, A.; Kuecke, M. Hydrochar and Biochar Effects on Germination of Spring Barley. J. Agron. Crop Sci. 2013, 199, 360–373. [Google Scholar] [CrossRef]
  53. Rehrah, D.; Reddy, M.R.; Novak, J.M.; Bansode, R.R.; Schimmel, K.A.; Yu, J.; Watts, D.W.; Ahmedna, M. Production and Characterization of Biochars from Agricultural By-Products for Use in Soil Quality Enhancement. J. Anal. Appl. Pyrolysis 2014, 108, 301–309. [Google Scholar] [CrossRef]
  54. Sun, K.; Tang, J.; Gong, Y.; Zhang, H. Characterization of Potassium Hydroxide (KOH) Modified Hydrochars from Different Feedstocks for Enhanced Removal of Heavy Metals from Water. Environ. Sci. Pollut. Res. 2015, 22, 16640–16651. [Google Scholar] [CrossRef] [PubMed]
  55. Michalak, I.; Mironiuk, M.; Marycz, K. A Comprehensive Analysis of Biosorption of Metal Ions by Macroalgae Using ICP-OES, SEM-EDX and FTIR Techniques. PLoS ONE 2018, 13, e0205590. [Google Scholar] [CrossRef]
  56. Kołtowski, M.; Charmas, B.; Skubiszewska-Zięba, J.; Oleszczuk, P. Effect of Biochar Activation by Different Methods on Toxicity of Soil Contaminated by Industrial Activity. Ecotoxicol. Environ. Saf. 2017, 136, 119–125. [Google Scholar] [CrossRef]
  57. Wang, K.; Brown, R.C.; Homsy, S.; Martinez, L.; Sidhu, S.S. Fast Pyrolysis of Microalgae Remnants in a Fluidized Bed Reactor for Bio-Oil and Biochar Production. Bioresour. Technol. 2013, 127, 494–499. [Google Scholar] [CrossRef]
  58. Chang, Y.-M.; Tsai, W.-T.; Li, M.-H. Chemical Characterization of Char Derived from Slow Pyrolysis of Microalgal Residue. J. Anal. Appl. Pyrolysis 2015, 111, 88–93. [Google Scholar] [CrossRef]
  59. Argun, M.E.; Dursun, S.; Ozdemir, C.; Karatas, M. Heavy Metal Adsorption by Modified Oak Sawdust: Thermodynamics and Kinetics. J. Hazard. Mater. 2007, 141, 77–85. [Google Scholar] [CrossRef] [PubMed]
  60. Zhou, J.; Chen, H.; Huang, W.; Arocena, J.M.; Ge, S. Sorption of Atrazine, 17α-Estradiol, and Phenanthrene on Wheat Straw and Peanut Shell Biochars. Water Air Soil Pollut. 2016, 227, 7. [Google Scholar] [CrossRef]
  61. Deng, J.; Liu, Y.; Liu, S.; Zeng, G.; Tan, X.; Huang, B.; Tang, X.; Wang, S.; Hua, Q.; Yan, Z. Competitive Adsorption of Pb(II), Cd(II) and Cu(II) onto Chitosan-Pyromellitic Dianhydride Modified Biochar. J. Colloid Interface Sci. 2017, 506, 355–364. [Google Scholar] [CrossRef] [PubMed]
  62. Olgun, A.; Atar, N. Equilibrium, Thermodynamic and Kinetic Studies for the Adsorption of Lead (II) and Nickel (II) onto Clay Mixture Containing Boron Impurity. J. Ind. Eng. Chem. 2012, 18, 1751–1757. [Google Scholar] [CrossRef]
  63. Li, H.; Shi, Y.; Bai, L.; Chi, M.; Xu, X.; Liu, Y. Low Temperature One-Pot Hydrothermal Carbonization of Corn Straw into Hydrochar for Adsorbing Cadmium (II) in Wastewater. Energies 2021, 14, 8503. [Google Scholar] [CrossRef]
  64. Ma, F.; Zhao, B.; Diao, J. Adsorption of Cadmium by Biochar Produced from Pyrolysis of Corn Stalk in Aqueous Solution. Water Sci. Technol. 2016, 74, 1335–1345. [Google Scholar] [CrossRef] [PubMed]
  65. Chen, Q.; Zhang, T.C.; Ouyang, L.; Yuan, S. Single-Step Hydrothermal Synthesis of Biochar from H3PO4-Activated Lettuce Waste for Efficient Adsorption of Cd(II) in Aqueous Solution. Molecules 2022, 27, 269. [Google Scholar] [CrossRef]
  66. Kumar, M.; Singh, A.K.; Sikandar, M. Study of Sorption and Desorption of Cd (II) from Aqueous Solution Using Isolated Green Algae Chlorella Vulgaris. Appl. Water Sci. 2018, 8, 225. [Google Scholar] [CrossRef]
  67. Edris, G.; Alhamed, Y.; Alzahrani, A. Biosorption of Cadmium and Lead from Aqueous Solutions by Chlorella Vulgaris Biomass: Equilibrium and Kinetic Study. Arab. J. Sci. Eng. 2014, 39, 87–93. [Google Scholar] [CrossRef]
  68. Biswas, K.; Saha, S.K.; Ghosh, U.C. Adsorption of Fluoride from Aqueous Solution by a Synthetic Iron(III)−Aluminum(III) Mixed Oxide. Ind. Eng. Chem. Res. 2007, 46, 5346–5356. [Google Scholar] [CrossRef]
  69. Chen, T.; Zhou, Z.; Han, R.; Meng, R.; Wang, H.; Lu, W. Adsorption of Cadmium by Biochar Derived from Municipal Sewage Sludge: Impact Factors and Adsorption Mechanism. Chemosphere 2015, 134, 286–293. [Google Scholar] [CrossRef] [PubMed]
  70. Hulland, J. Use of Partial Least Squares (PLS) in Strategic Management Research: A Review of Four Recent Studies. Strateg. Manag. J. 1999, 20, 195–204. [Google Scholar] [CrossRef]
  71. Kline, R.B. Principles and Practice of Structural Equation Modeling, 5th ed.; Guildford Press: New York, NY, USA, 2023; ISBN 9781462552009. [Google Scholar]
Figure 1. Van Krevelen diagram for hydrochar, biochar, and biomass.
Carbon 10 00002 g001
Figure 2. Infrared absorption spectra from (a) biochar, (b) biomass, and (c) hydrochar.
Carbon 10 00002 g002
Figure 3. Scanning electron microscopy images of (a) biochar, (b) hydrochar, and (c) biomass.
Carbon 10 00002 g003aCarbon 10 00002 g003b
Figure 4. Effect of (a) pH, (b) adsorbent dosage, (c) time, and (d) initial Cd concentration on the Cd removal.
Carbon 10 00002 g004
Figure 5. Langmuir, Temkin, and Freundlich isotherm plots for removal of Cd.
Carbon 10 00002 g005
Figure 6. T-values of different components effective on the removal of Cd.
Carbon 10 00002 g006
Figure 7. Intensity of the effect of different variables on the removal of cadmium from water, with time as a mediating factor.
Carbon 10 00002 g007
Table 1. F/2 culture medium [27].
NutrientConcentration (g L−1)
Solution A: Nitrate and phosphate stock solution
NaNO384.2
Na2MoO4·2H2O6.0
FeCl3·6H2O2.9
Na2EDTA·2H2O10.0
Solution B: Silicate stock solution
Na2SiO3·9H2O33.0
Solution C: Trace element stock solution
CuSO4·5H2O2.0
Na2MoO4·2H2O4.4
CoCl2·6H2O2.0
MnCl2·4H2O36.0
Solution D: Vitamins stock solution
Biotin1.0 × 10−4
Vitamin B10.4
Vitamins B122.0 × 10−6
To prepare the culture medium solution for the growth of CV, 2 mL of solutions A and B and 1 mL of solutions C and D were added in 1 L of water.
Table 2. Results from the characterization of CV and its biochar and hydrochar.
PropertyMaterial
BiomassBiocharHydrochar
Yield (%)-56.2 ± 0.261.5 ± 0.3
C (%)37.2045.9248.55
H (%)5.663.885.04
N (%)5.114.414.12
S (%)0.840.570.51
O (%)22.2913.1110.98
Ash (%)28.9 ± 0.132.1 ± 0.230.8 ± 0.2
Volatile matter (%)54.3 ± 0.243.2 ± 0.448.8 ± 0.2
GCV (MJ kg−1)15.7 ± 0.318.5 ± 0.119.5 ± 0.3
pH6.9 ± 0.17.9 ± 0.16.7 ± 0.1
EC (dS m−1)2.6 ± 0.14.5 ± 0.23.4 ± 0.1
SSA (m2 g−1)6.8 ± 0.38.5 ± 0.18.1 ± 0.3
Pore diameter (nm)15.0 ± 0.222.3 ± 0.312.8 ± 0.3
Table 3. Tentative assignments of bands found in FTIR spectra of each material: biomass, biochar, and hydrochar.
ClassFunctional GroupWavelength Range (cm−1)
ReferenceBiomassBiocharHydrochar
AlcoholO-–H stretch3400–35003414.363414.53415.99
Carboxylic acidsO–H stretch (s)3300–25002515.572515.752515.83
AlkanesC–H stretch (s)3000–28502922.272853.212874.05
Aldehydes and ketonesC=O stretch (s)1730–1720
1640–1600
1638.681616.951617.34
AmidesN–H out of plane1470–13501420.421420.081416.26
Alkyl aryl etherC–O stretch (s)1075–10201058.40--
AromaticsC–H out of plane (m)885–870872.91873.50873.09
AlkenesC=C plane (s)730–665712.49712.57712.53
Halo compoundC–Cl stretch, C–Br stretch, and C–I stretch400–600471.08467.21470.56
Table 4. Maximum Cd adsorption capacities (mg g−1) of some carbonaceous materials from the literature.
MaterialsCurrent Study[63][64][65][66][67]
Biochar24.4-33.987.4--
Hydrochar23.611.7–18.1----
Biomass16.6---97.4149.9
Table 5. Fitting parameters of various isotherm models based on Cd adsorption onto biochar, hydrochar, and biomass.
MaterialsLangmuirFreundlichTemkin
qmaxbR2Kf1/nR2AT
(L g−1)
bTR2
Biochar24.390.13930.996.770.5630.964.69560.660.968
Hydrochar23.580.1420.98811.130.5150.9134.94591.600.981
Biomass16.560.37090.9932.610.5340.9762.25783.440.979
Table 6. Coefficients of weight factor for the investigated parameters affecting Cd removal.
SourceParameterWeight FactorSourceParameterWeight Factor
Dosage0.790.1pH0.863
0.830.20.765
0.800.40.856
0.750.80.857
0.911.00.878
0.872.00.839
Concentration0.830Time0.860
0.7750.825
0.86100.8115
0.89200.6730
0.90400.7560
Materials0.73Biomass0.9390
0.88Biochar0.92180
0.81Hydrochar
Table 7. R2 coefficients of endogenous variables in the model.
R2Source
0.17Time—Materials
0.45Time—pH
0.36Time—Concentration
0.54Time—Dosage
0.65Removal of Cd
Table 8. Q2 index coefficient of the fitted model.
SourceQ2 (=1 − SSE/SSO)
Materials0.839
pH0.521
Concentration0.458
Dosage0.744
Time 0.388
Disclaimer/Publisher’s Note: The statements, opinions and data contained in all publications are solely those of the individual author(s) and contributor(s) and not of MDPI and/or the editor(s). MDPI and/or the editor(s) disclaim responsibility for any injury to people or property resulting from any ideas, methods, instructions or products referred to in the content.

