Article

A Study on the Effectiveness of SCD Seeding Fog Dissipation Mechanism Using LiDAR Sensor

1
Laser System R&D, LIG Nex1, Co., Ltd., Yongin 16911, Republic of Korea
2
School of Mechanical Engineering, Sungkyunkwan University, Suwon 16419, Republic of Korea
*
Author to whom correspondence should be addressed.
Fluids 2023, 8(6), 185; https://doi.org/10.3390/fluids8060185
Submission received: 18 April 2023 / Revised: 10 June 2023 / Accepted: 15 June 2023 / Published: 17 June 2023
(This article belongs to the Collection Challenges and Advances in Heat and Mass Transfer)

Abstract

:
Fog interferes with traffic flow and causes major accidents. In foggy conditions, traffic accident death rates are higher than in other weather conditions. Research on fog dissipation technology is needed to reduce the incidence of accidents caused by fog. There are various artificial methods to remove fog. In this study, two methods of natural dissipation by gravity sedimentation and a solid carbon dioxide seeding fog dissipation mechanism were compared and analyzed in cold fog conditions. Solid carbon dioxide was selected as the fog dissipation particle. In this experiment, solid carbon dioxide seeding with three different values of weight (500 g, 1000 g, and 1500 g) was considered. This is because fog particles can be supercooled and fog can be removed. A light detection and ranging (LiDAR) sensor were used to quantitatively check the effect of improving visibility when solid carbon dioxide was seeded in the fog. The LiDAR sensor detects the surrounding environment through distance measurements by emitting lasers and processing the laser responses. A camera was used to visually observe the phenomenon occurring inside the calorimetric chamber. As a result, the fog dissipation mechanism using solid carbon dioxide seeding under cold fog conditions was proven to be effective in improving the visible distance compared with natural dissipation.

1. Introduction

According to the World Meteorological Organization (WMO), fog is defined as a meteorological condition with a horizontal visibility of less than 1000 m. Fog is a localized weather phenomenon caused by narrow and complicated topography. One of the conditions for fog formation is that the atmosphere must contain a lot of water vapor, and the temperature must drop below the dew point. The fog that occurs most in inland South Korea is radiation fog [1]. Radiation fog exists when the wind is weak in the high-pressure zone, and an inversion layer forms from the ground to an altitude near or above 925 hPa. Most of the time, radiation fog appears between dawn and morning. It continues until two or three hours after sunrise. There is steam fog, in which the up-and-down mixing of air into the warm sea level occurs spontaneously. Upslope fog is formed when air flows upward over rising terrain and is adiabatically cooled to its saturation temperature. In nature, there is a process of forming and disappearing various fogs. Among them, radiation fog is formed near the surface of the clear sky of high-pressure and stagnant air, and the fog disappears through turbulence or radiation processes [2,3]. Visibility is reduced when fog is present. Because of this, significant accidents on roads and airports could occur. In the case of South Korea, there was a 104-car chain collision on the Cheonan-Nonsan Highway in 2011 and a 106-car chain collision at Yeongjong Bridge in 2015. As an overseas case, two planes collided at Tenerife Airport in Spain in 1977. It was the worst airplane accident in history, with 583 people killed. According to the traffic accident statistics report of the Korea Road Traffic Authority (KoROAD), there was a small percentage of the total accidents due to fog, but the death rate was the highest. Therefore, research on fog dissipation technology is needed to reduce the death rate caused by fog. Fog dissipation technology is a technology that removes fog particles with a diameter of 0.001 mm to 0.1 mm floating in the air using an artificial method [4,5,6]. Fog is divided into warm fog and cold fog based on a temperature of 0 °C. Depending on the temperature conditions, different fog dissipation mechanisms were employed. There has been a growing body of research that explores fog dissipation technology. In cold fog conditions, Beckwith [7] demonstrated the effect of increasing the visible distance by solid carbon dioxide (SCD) seeding on the airport runway. Kampe et al. [8] performed an experiment of seeding SCD using an airplane on stratus clouds lower than 0 °C. Stratus clouds are called fog clouds and have the same composition as fog. As a result of the experiment, the ground was visible about 30 min after seeding SCD. They also found that SCD had an effect on cloud dissipation. Jung et al. [9] proved the effect of improving the visibility about 45% for 29 min using hygroscopic droplet seeding under warm fog conditions. Recently, research related to predicting future weather phenomena using machine learning based on historical meteorological data has been actively performed [10,11,12,13,14]. Furthermore, there are studies related to measuring visibility through light detection and ranging (LiDAR) sensor in fog [15,16]. Li et al. [17] evaluated experimental results using a time of flight (ToF) LiDAR sensor quantitatively and proposed a concept of ‘disappear visibility’ under foggy conditions. In this study, an experimental study was performed to improve visibility by seeding SCD in cold fog conditions. The experiments were conducted indoors in a calorimetric chamber. The effect of improving fog visibility according to the amount of SCD seeded was studied.

2. Artificial Fog Dissipation Technique

2.1. Fog Dissipation Technology with Cooling Material

A typical technique for cold fog dissipation is the method of dispersing fog by seeding cooling materials. Among the cooling materials, SCD is the most used. SCD removes fog using a supercooling method that uses a rapid temperature drop around the fog particles. A material that can be used as a fog dissipation particle needs to diffuse easily in the fog and generate many condensation nuclei or ice crystal nuclei. It is also good that the price is low and that it does not harm the natural environment. SCD is a substance that satisfies all these conditions. In this study, SCD was selected as the fog dissipating particle in consideration of the characteristics that can dissipate fog particles by gravity sedimentation. The effect of SCD on fog dissipation was analyzed. In cold fog conditions below 0 °C, Findeisen et al. [18] theoretically and experimentally demonstrated that SCD seeding on fog particles causes fog particles to fall on the ground as ice nuclei through a supercooling mechanism.

2.2. Fog Dissipation Technology with Evaporation

The technology for dissipating fog by evaporation is a method of heating air by burning fuel. After that, hot and dry air is blown into the fog using wind to dissipate the fog. In the process of dissipating fog by heat and wind, liquid fog particles cause a phase change to water vapor, which removes fog. Usually, a jet engine is used to dissipate fog at airports. It costs a lot of money to use a jet engine. There are new fog dissipation devices, such as thermoacoustic waves and microwave generators, to remove fog at a relatively low cost. A thermoacoustic wave is a kind of pressure wave. When vibration is applied to fog particles in air using frequency, the fog particles are quickly heated and expanded.

2.3. Fog Dissipation Technology with Hygroscopic Droplets Seeding

Hygroscopic droplet seeding was attempted to dissipate the warm fog. As the hygroscopic droplet seeding spreads in the fog, it undergoes a process of condensing and colliding. During this process, fog particles grow into raindrops and fall to the ground, thereby improving visibility. Silver iodide (AgI) is a commonly used hygroscopic material. Song et al. [19] found that sodium polyacrylate had an effect on warm fog dissipation, and the fog dissipation effect was best when sodium polyacrylate and sodium chloride were mixed at a mass ratio of 1:2. A typical technique for cold fog dissipation is the method of dispersing fog using seed.

3. Experiment

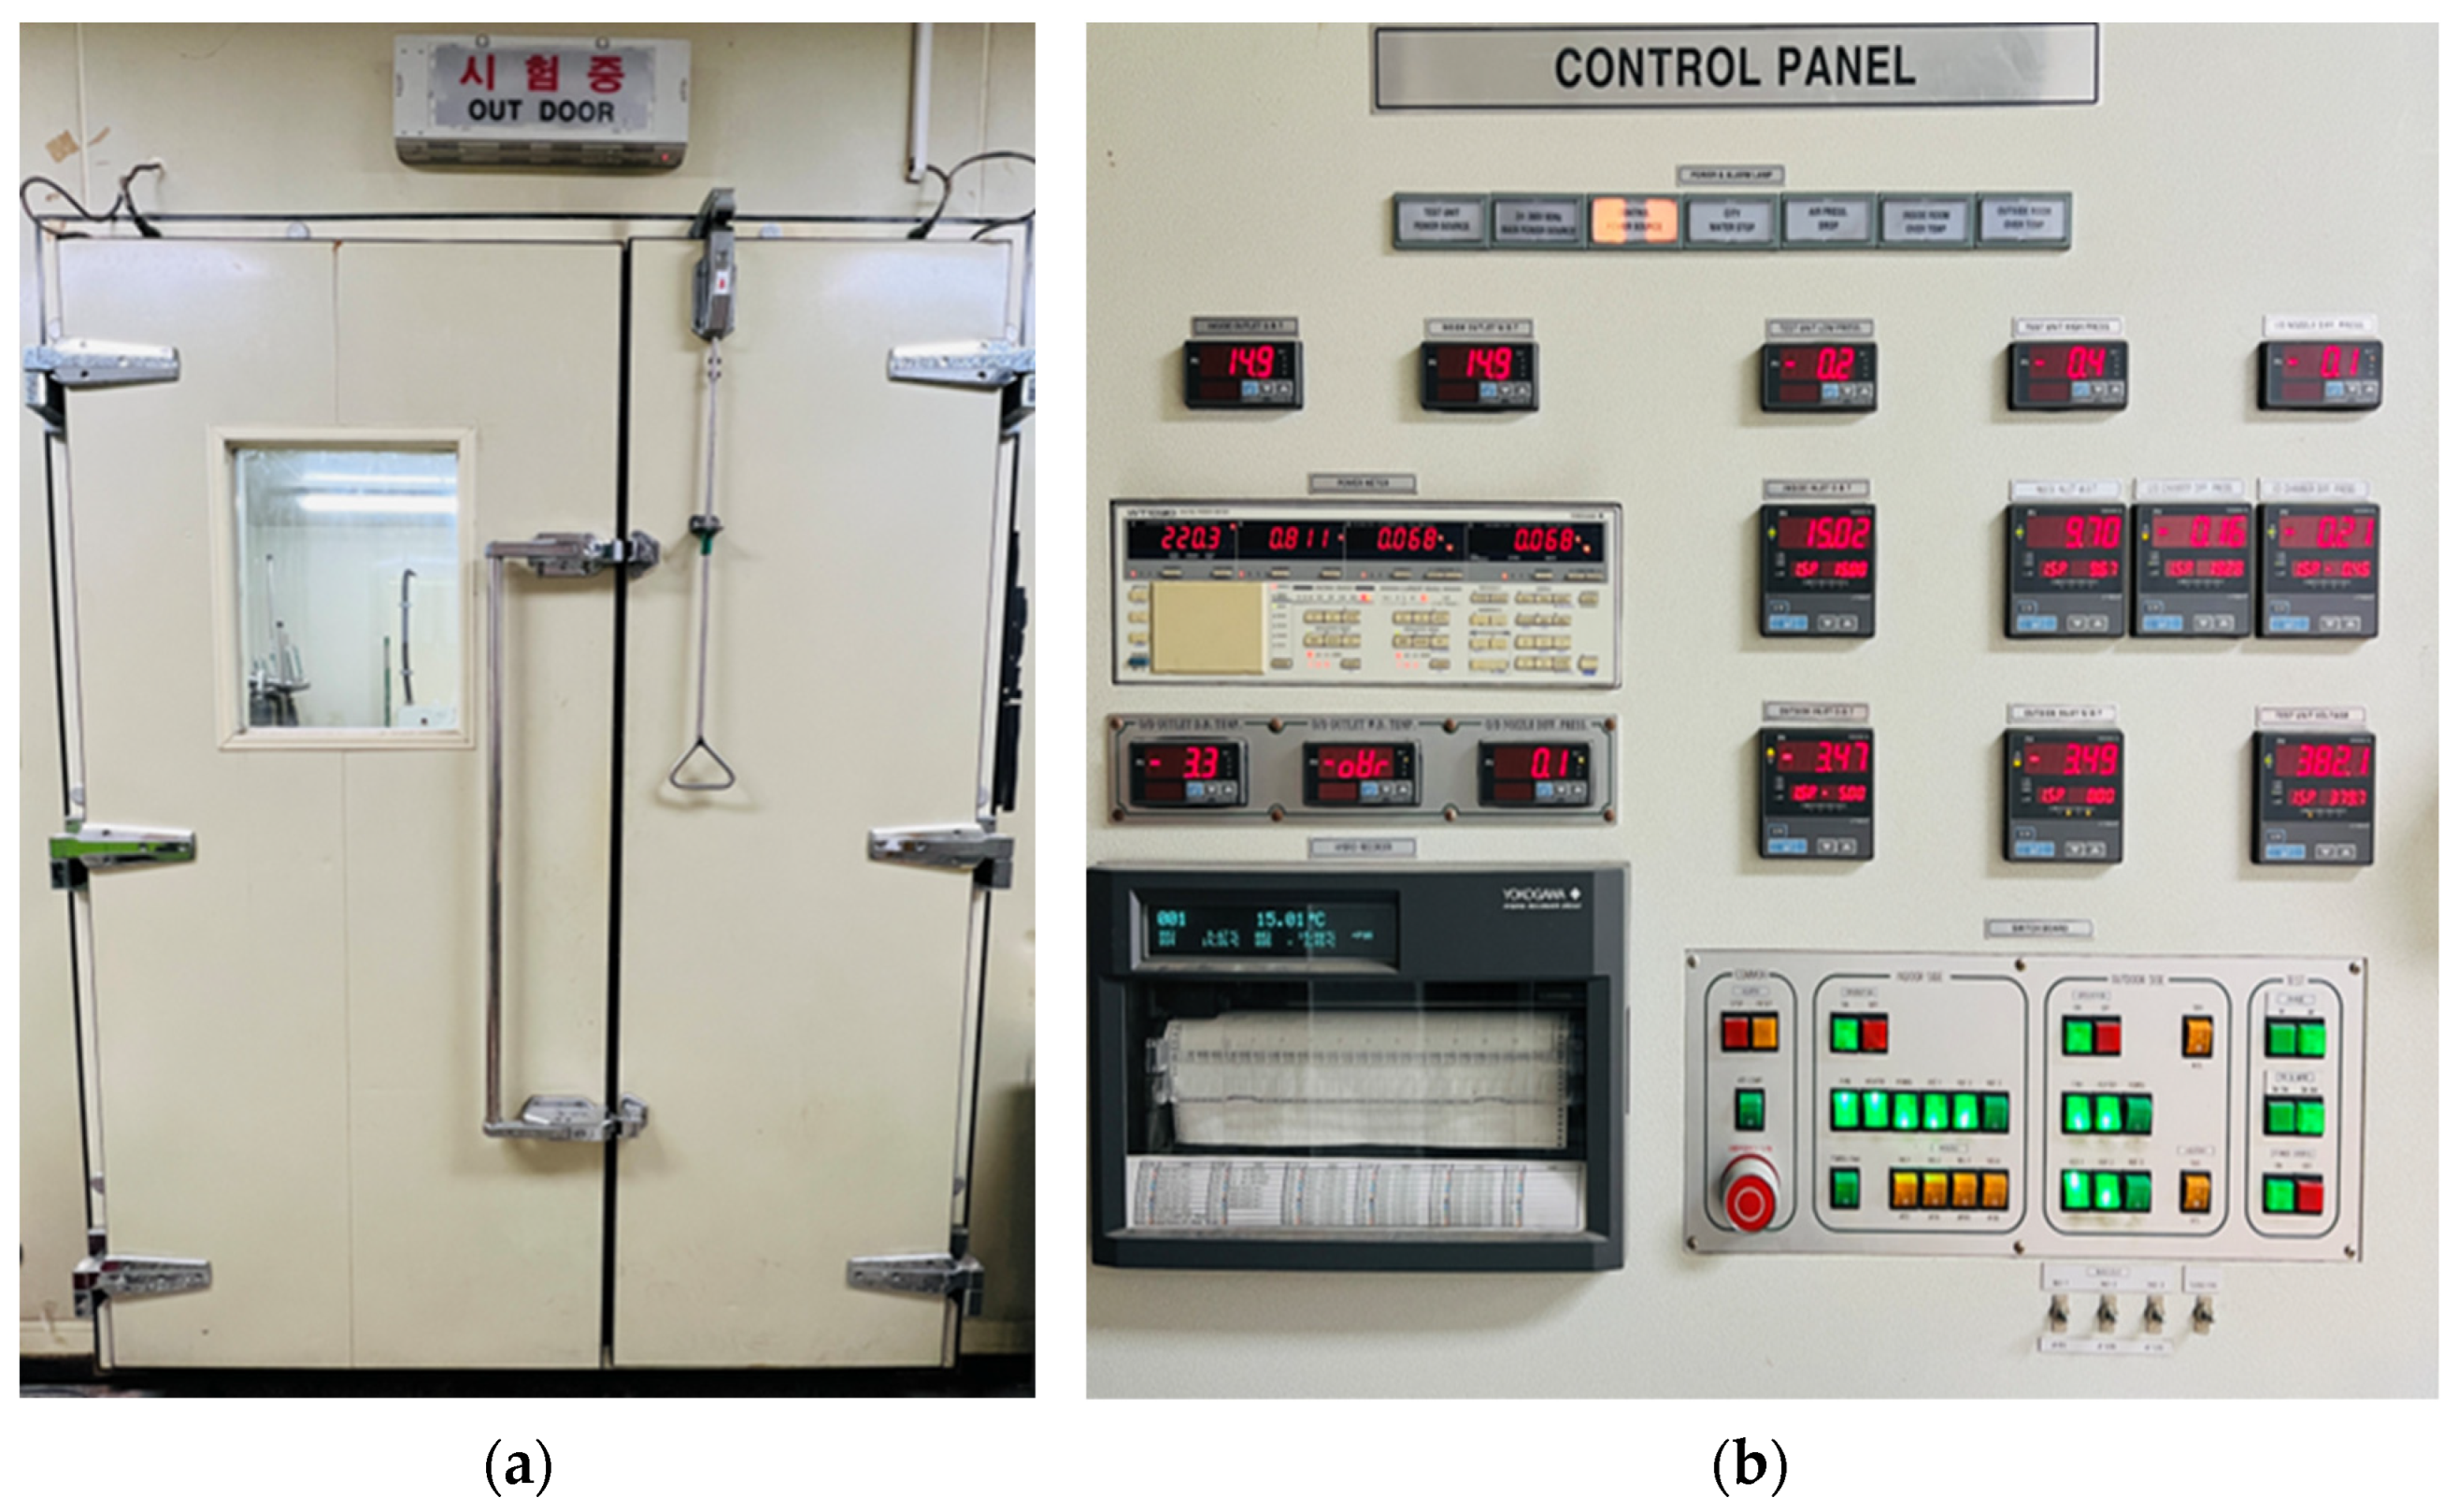
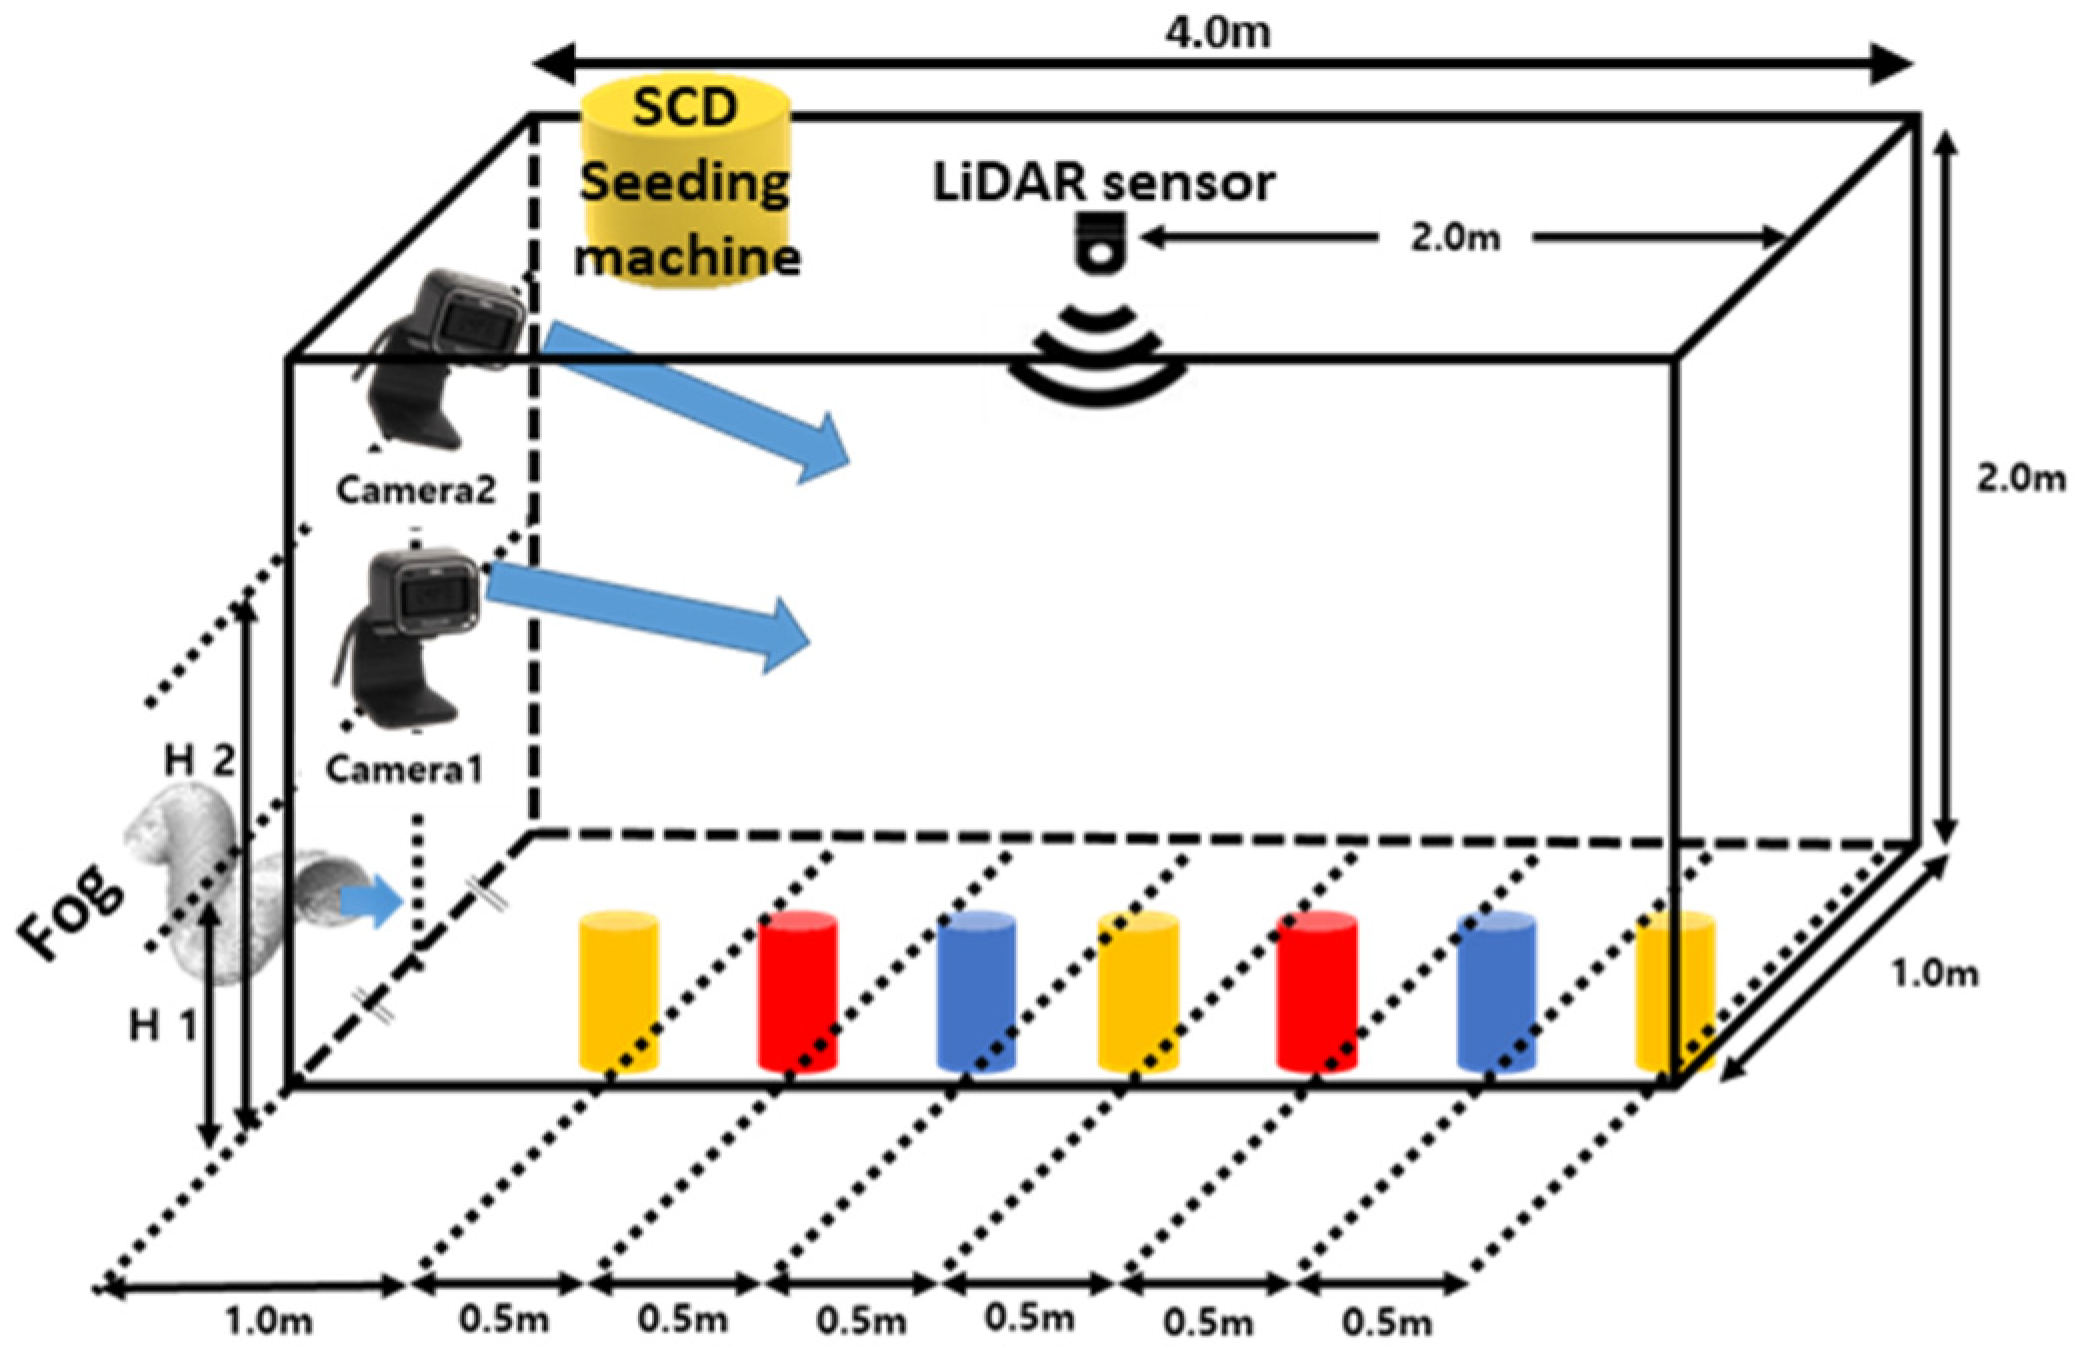
3.1. Experimental Apparatus

The temperature of the cold fog was regulated to −1 °C using a calorimeter that could control temperature and humidity. The photos and specifications of the calorimeter used in this study are shown in Figure 1 and Table 1. Inside the calorimeter, an acrylic chamber was employed to produce specific experimental conditions. The experimental equipment for this study is as follows: It consists of a scale for measuring the amount of water that escapes through the humidifier, a seeding machine for SCD seeding, and a camera and LiDAR sensor for monitoring fog generation to dissipation. The LiDAR sensor specifications are shown in Table 2. The size of the calorimetric chamber was L (4000 mm) × H (2000 mm) × W (1000 mm). The humidifier was located outside the chamber and configured to generate fog inside the chamber through a nozzle. To detect data on the fog generation to dissipation process in the center of the chamber, a LiDAR sensor was placed at the top center point of the chamber. Two cameras for visual observation were employed, including an upper corner where the entire shape of the chamber could be observed and an intermediate position of the chamber wall. Subjects were placed on the bottom of the chamber at 0.5 m intervals between 1 m and 3.5 m to determine the effect of improving the visible distance. The locations of the experimental devices are shown in Figure 2.

3.2. Experimental Procedure

There are four steps in this experiment: Step 1: Set up the initial temperature and humidity conditions; Step 2: Fog formation; Step 3: Fog dissipation technology application; and Step 4: Ventilation inside the chamber. Two cases of experimentation were performed under cold fog conditions: natural dissipation and three different weights of SCD (500 g, 1000 g, and 1500 g) seeding. SCD was selected as the fog dissipating particles. This is because SCD can utilize a supercooling mechanism in which the temperature of the fog particles is rapidly cooled down. SCD with a diameter of 3 mm as fog dissipation particles was used. When the temperature (−1 °C) and humidity (50~55% RH) conditions inside the chamber are satisfied, it creates a fog of 150 g. Based on the experimental results, the amount of water used for reproducibility was set to 150 g. The fog dissipation termination criterion was set to within 2% of the distance data before fog generation. The correlation equations related to this are described in detail in Section 3.3. Additionally, the tendency of LiDAR sensor distance data and camera images was analyzed.

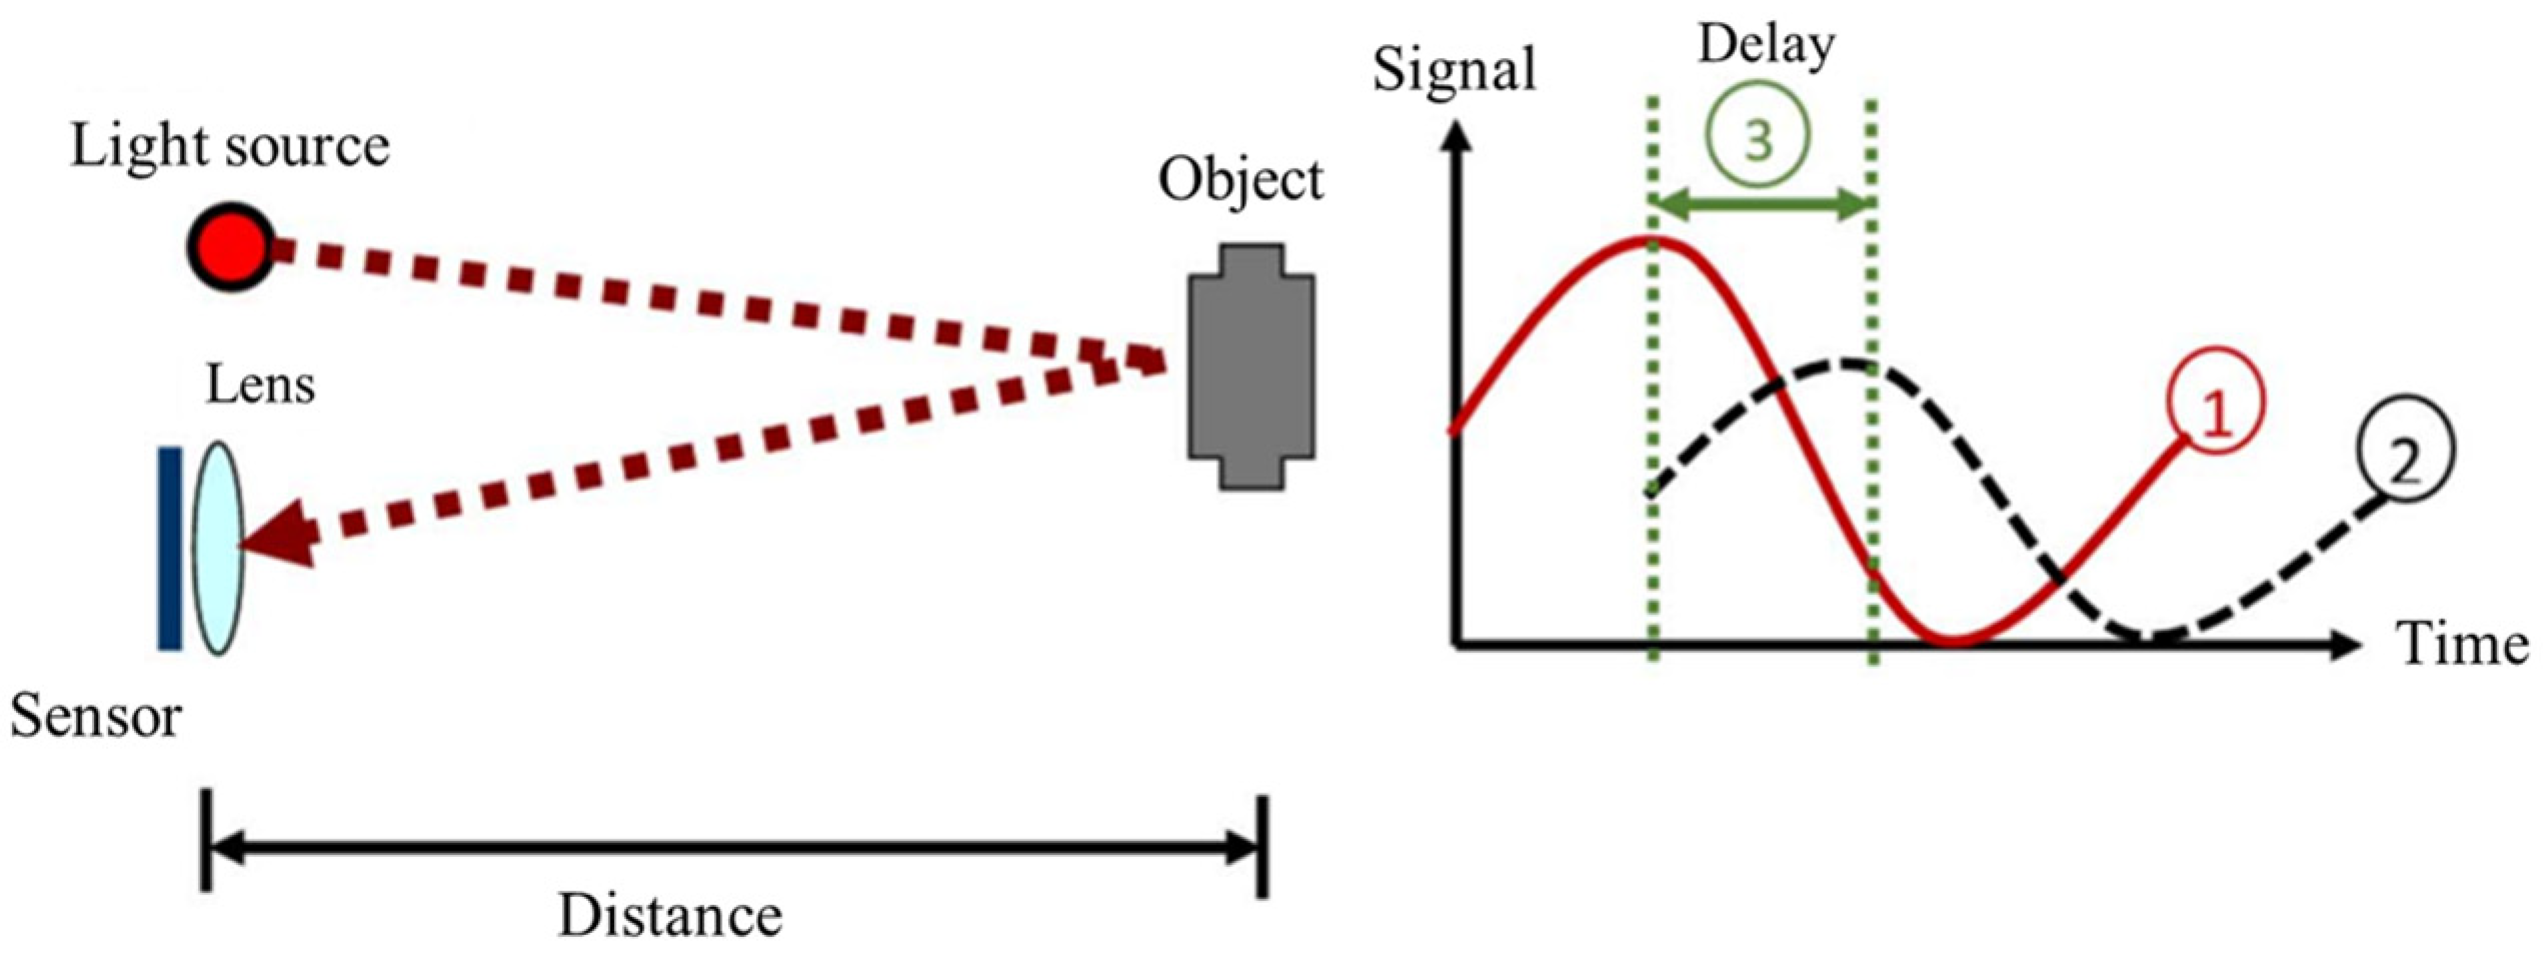
3.3. Method of Data Analysis

The camera images were compared at regular time intervals to see whether they improved the visible distance. Visible distance measurement methods are usually measured using a device called a visibility sensor. The visibility sensor’s minimum measuring distance is 10 m. However, in small environments, such as laboratory-scale chambers designed for indoor research, visibility measurement through a visibility sensor is not possible. In order to replace the visible sensor, in this experiment, the visible distance that changes according to fog was quantitatively measured using a LiDAR sensor. Through the signal returned by the emitted pulse laser bouncing off the object, the LiDAR sensor can calculate the measurement time and distance information. The measurement principle is the time of flight (ToF) method. The method measures the distance by calculating the time of the reflected signal after hitting the fog particles by emitting a laser pulse. As a feature of the ToF method, distance measurement data are stored at thousands of points per second, and distance measurements up to several kilometers are possible. Figure 3 shows a schematic diagram of the ToF measuring principle [20]. 1 and 2 represent different signals, and 3 represents the lag between the two signals. Using the measurement principle of the LiDAR sensor, previous papers measured the change in the visible distance caused by fog [21,22]. The fog particles become unstable as SCD is seeded into the chamber. As a result, data in an unstable state were obtained and revised through the following equations. The experimental data were analyzed, and the correlation Equations (1) and (2) were derived.
L n L n + 1 < 1
L n > 0.98 × L 0
Here, L n is the measurement distance value of the LiDAR sensor at n seconds, and L 0 is before fog formation. It represents the measured distance value of the LiDAR sensor. Equation (1) demonstrates that after fog dissipation, the distance difference value in seconds was 1 mm or less. Equation (2) means the error rate. The correlation equation is a criterion that determines that the difference in the measured distance data is dissipated when the difference is within 2%.

4. Results and Discussion

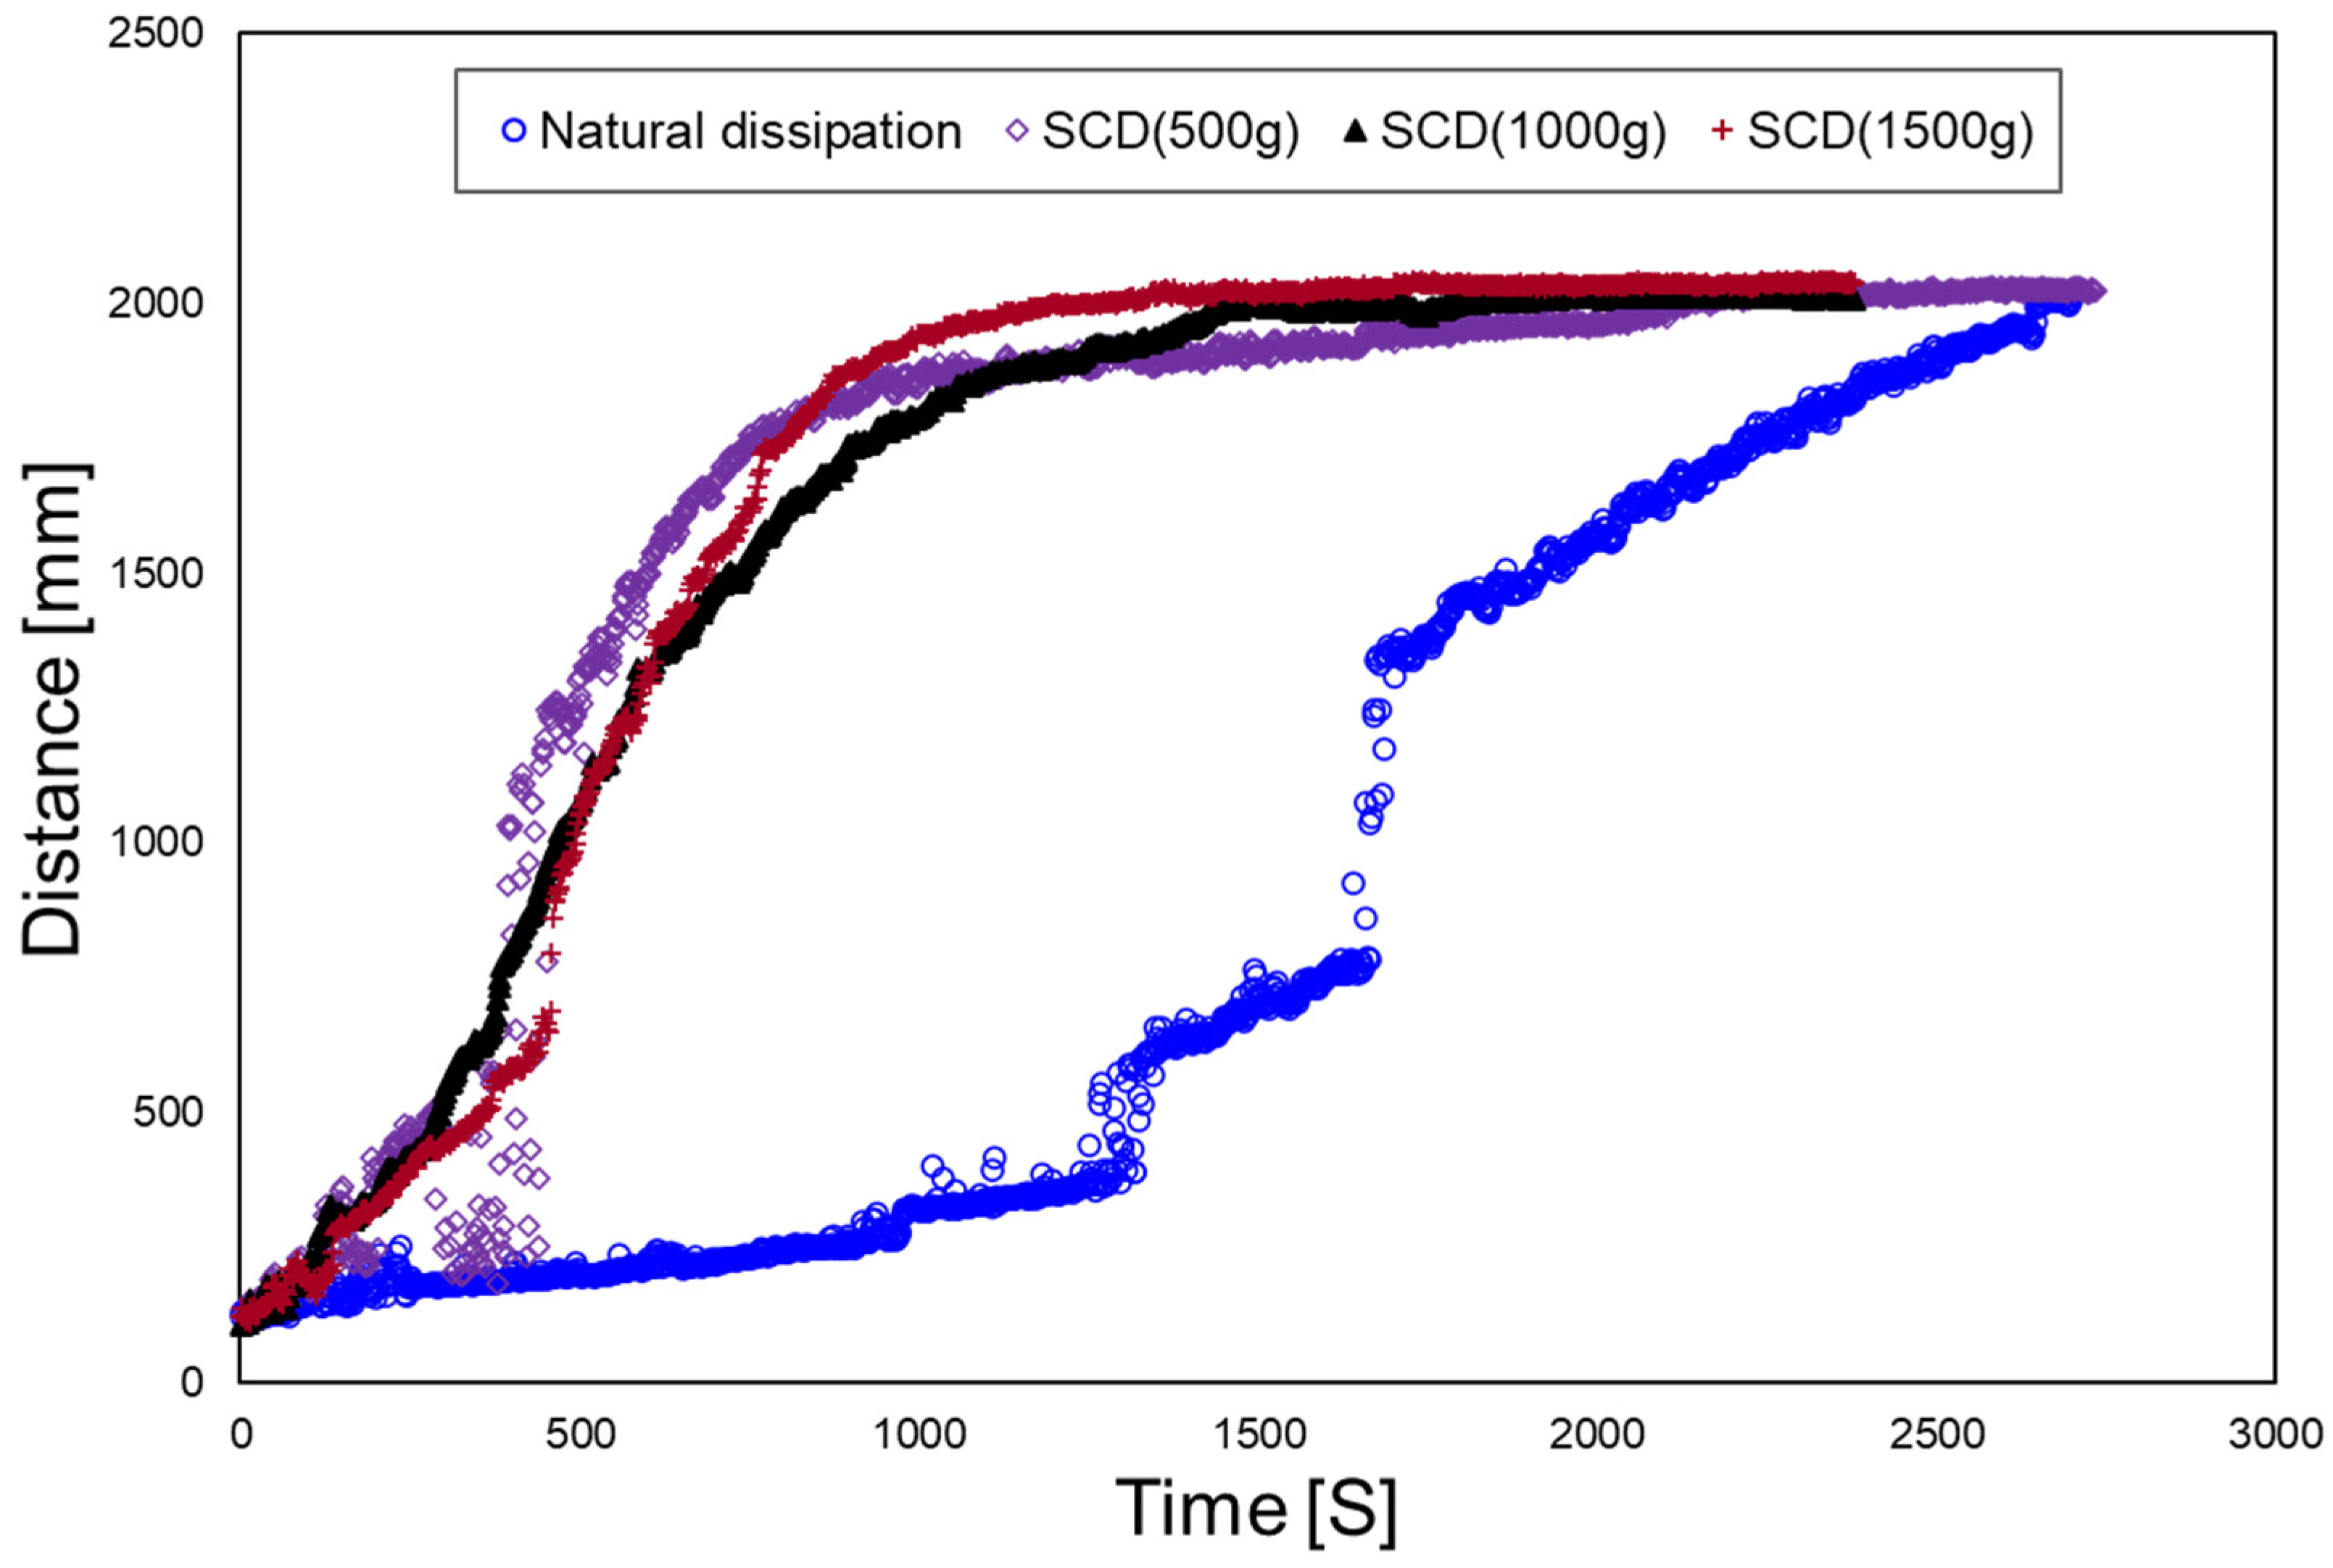
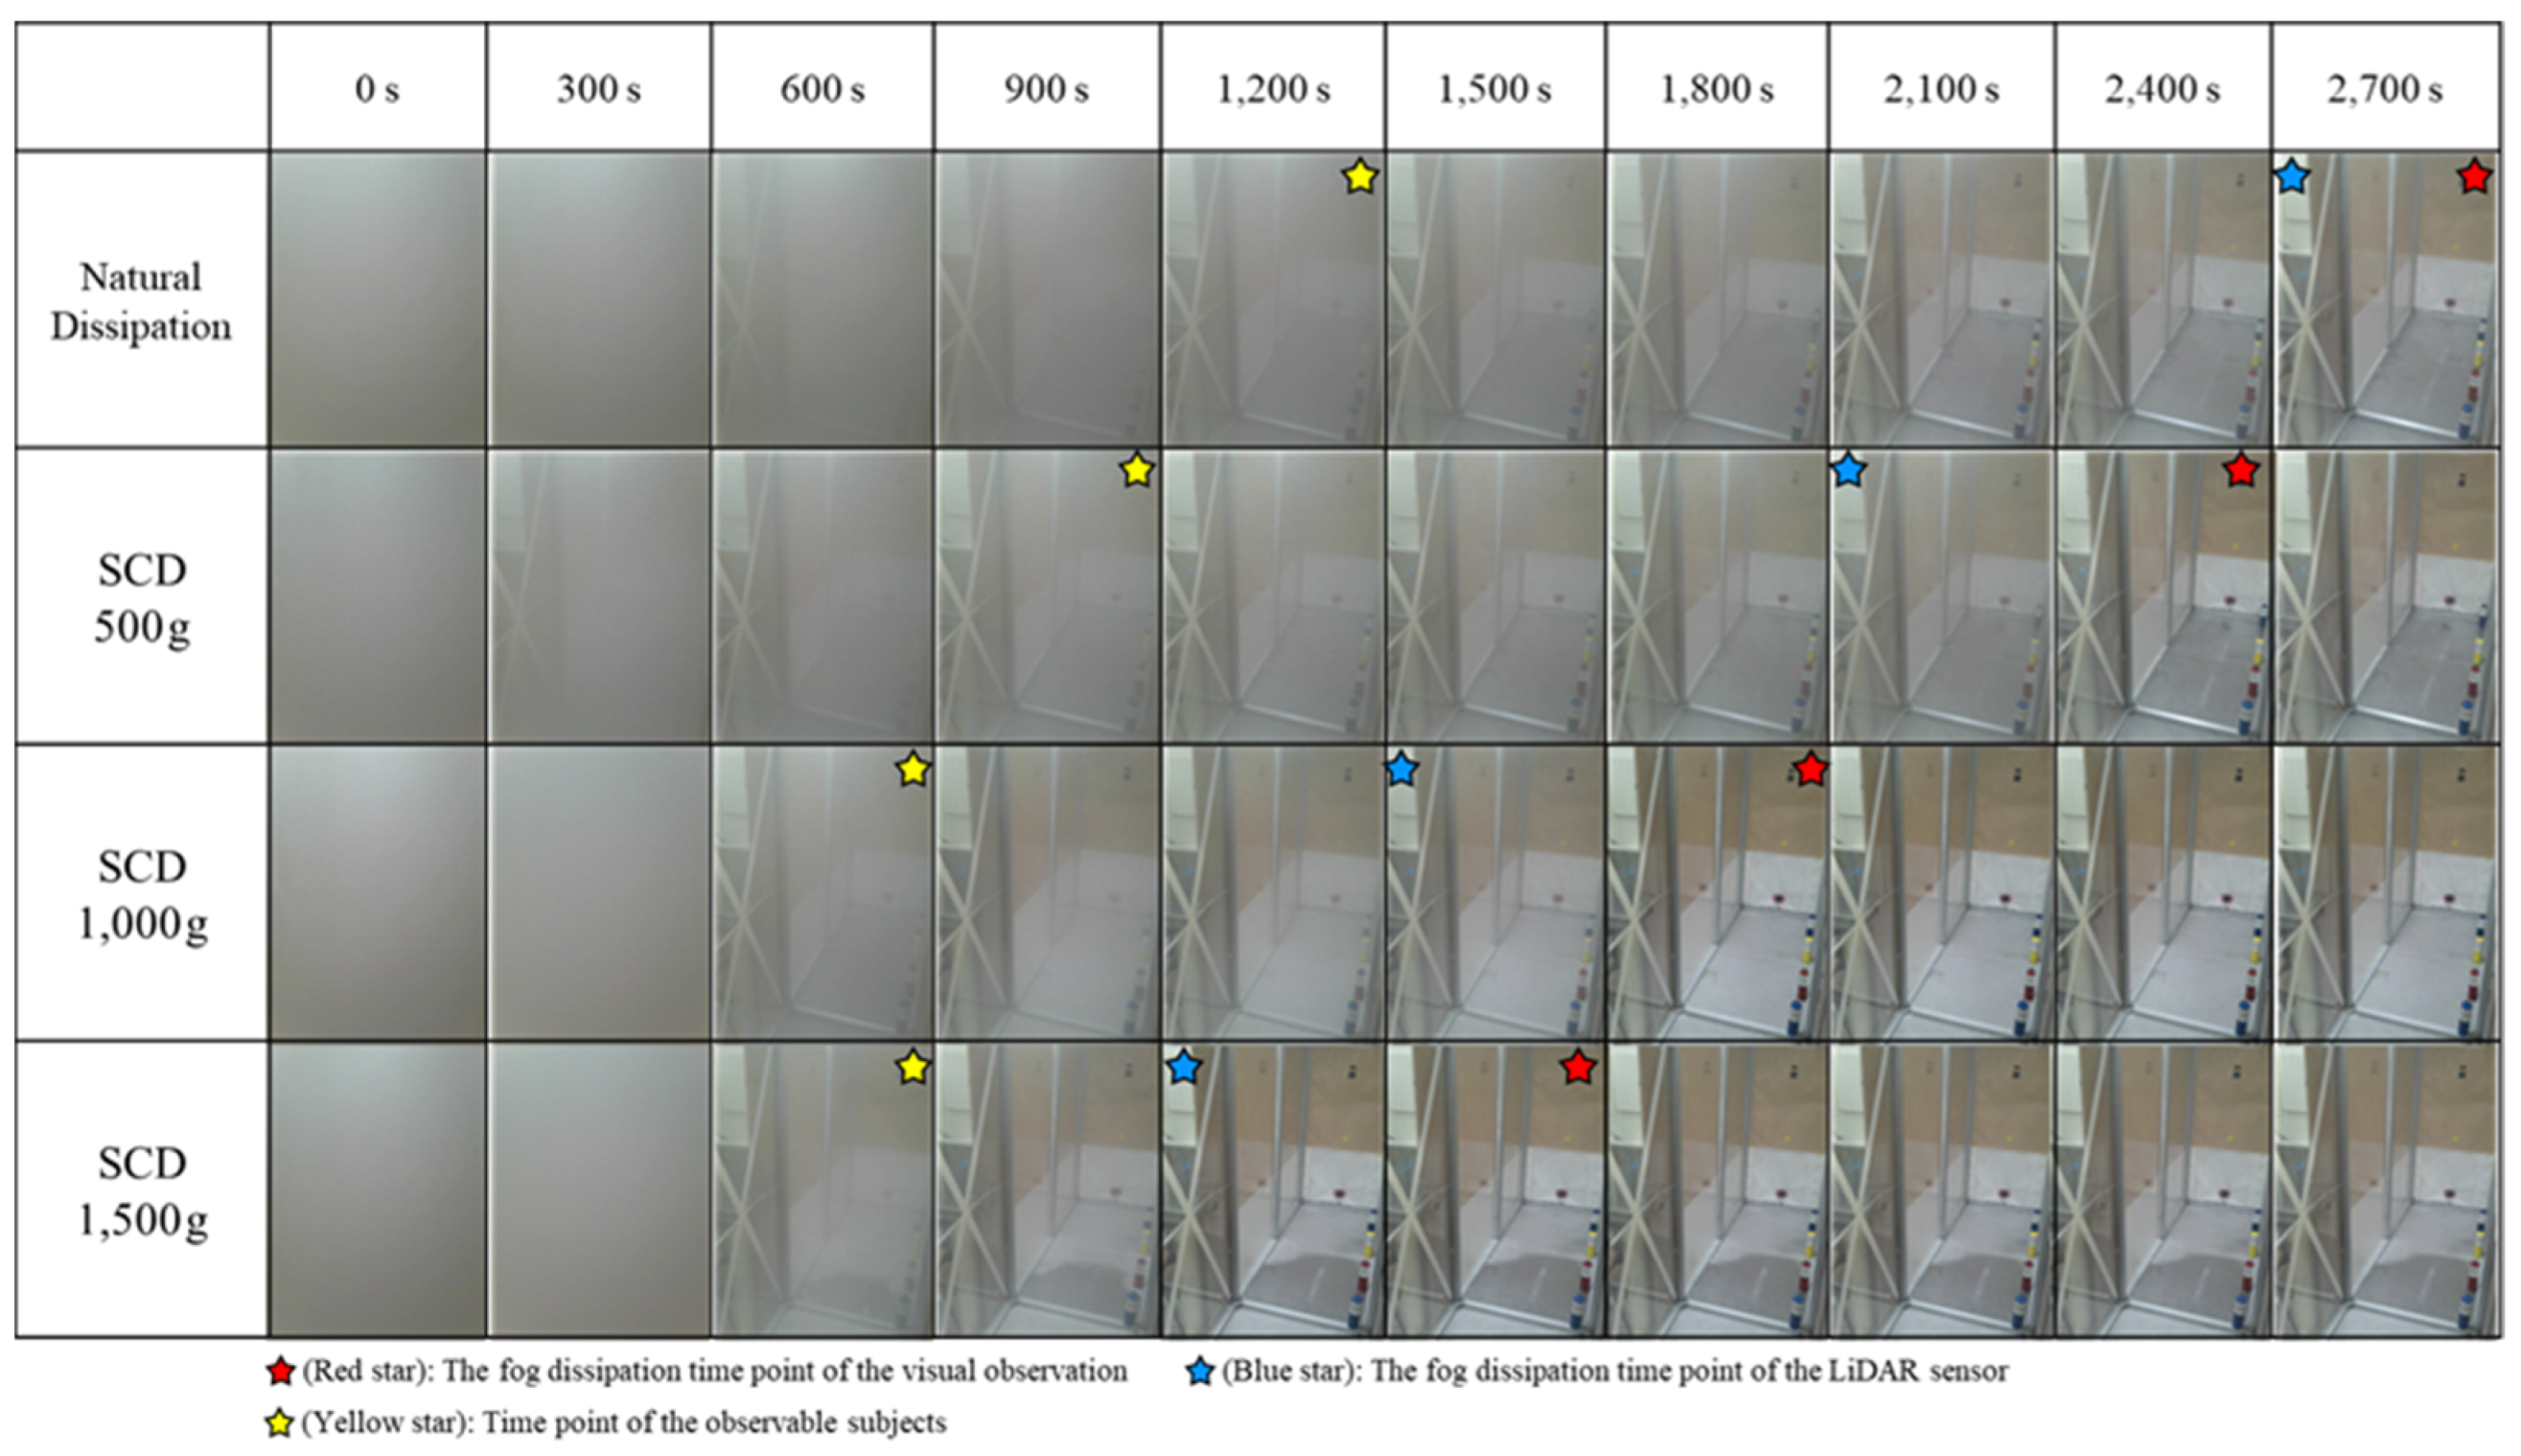
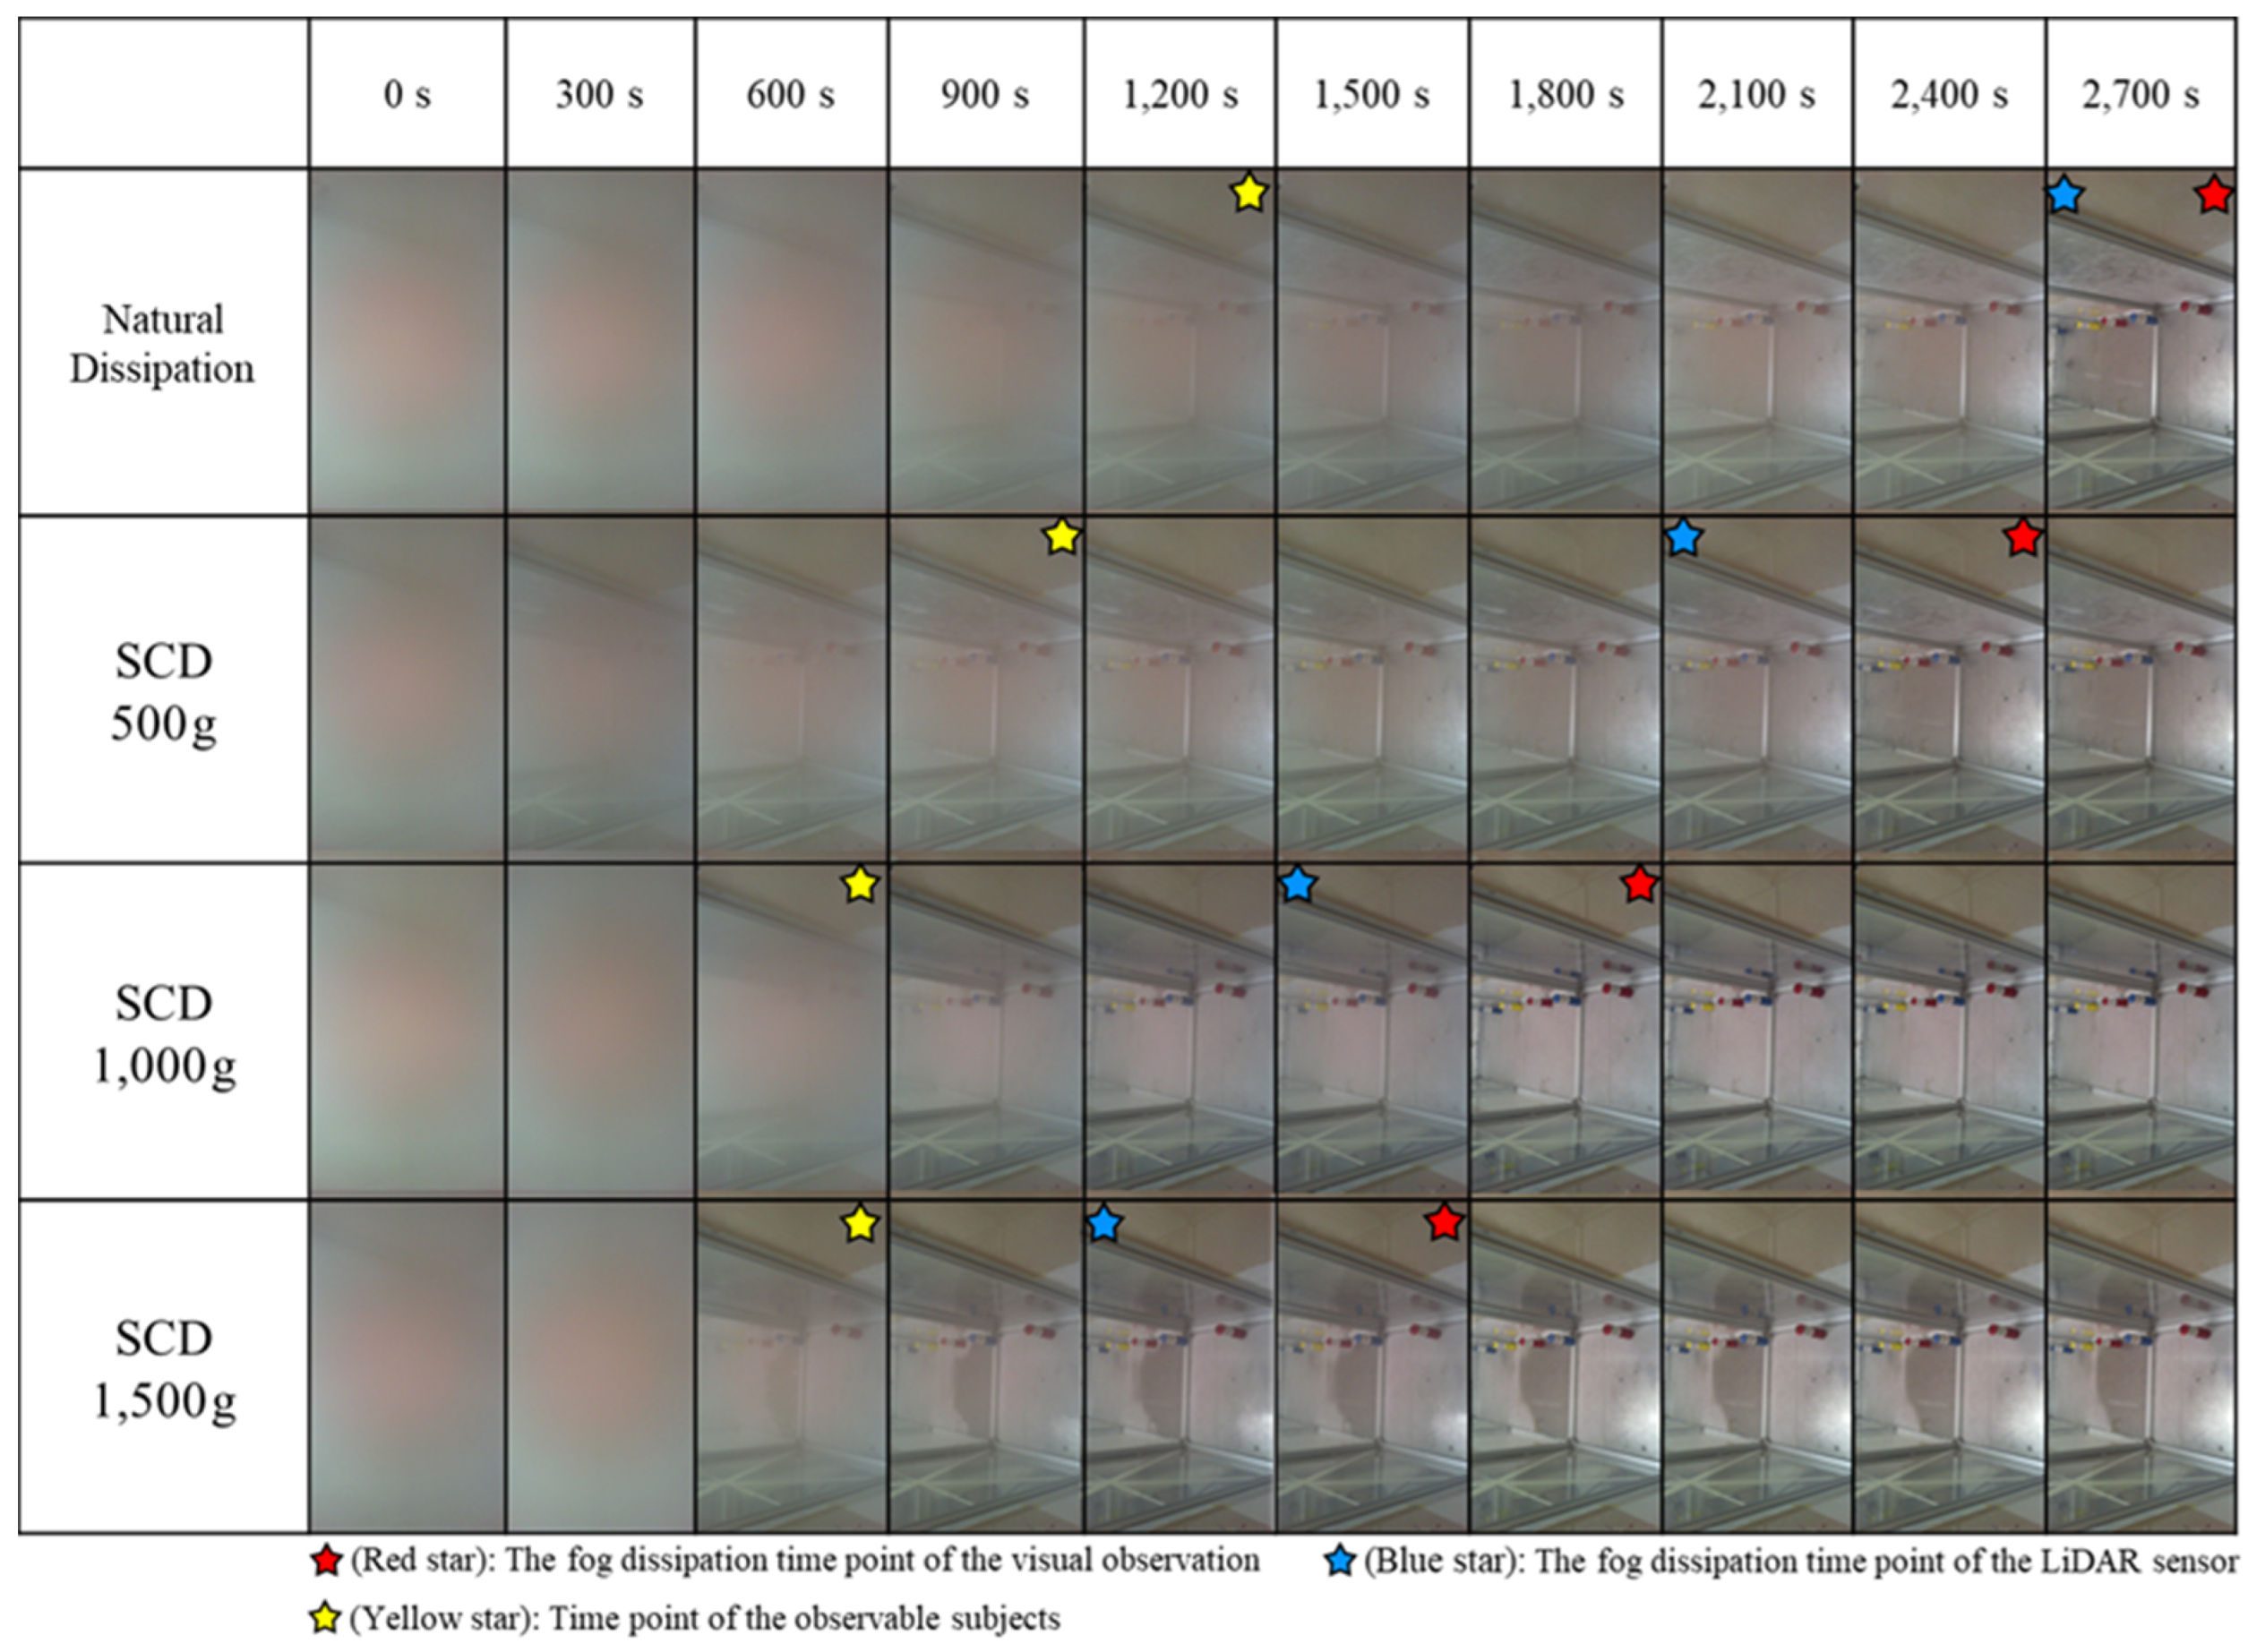
4.1. Results of LiDAR Sensor Experiment

Through the experimental results obtained using the LiDAR sensor, the effect of improving visibility due to natural dissipation and SCD seeding was compared and analyzed. Based on Equations (1) and (2), the result of calculating the time taken ( t m ) from immediately after fog generation to the termination of fog dissipation in cold fog conditions is as follows: First, it took 2701 s to complete the natural dissipation by gravity sedimentation, and it took 2083 s for SCD 500 g seeding, 1426 s for SCD 1000 g seeding, and 1130 s for SCD 1500 g seeding to terminate the dissipation. The distance data results measured by the LiDAR sensor are shown in Figure 4 and are summarized in Table 3. Immediately after the start of fog dispersion, SCD was seeded, and the distance data measurement results were not directly proportional for about 600 s. The reason is that when SCD, which is a fog dissipation particle, is seeded inside the chamber, the flow of fog particles is non-uniformly changed. As a result, a fluctuating flow of fog particles appeared on the distance data measurement graph. It can be observed that the graph increases linearly after about 600 s. From around 600 s, it was determined that the dispersion proceeded in a state where the flow of fog particles was stabilized, because the supercooling phenomenon occurred adequately in the chamber. Through the distance measurement data of the LiDAR sensor, it was numerically confirmed that the more the amount of SCD seeded into the chamber during the dissipation process, the faster the dissipation was terminated. The reason for the rapid termination of fog dissipation is that the SCD and fog particles collide and merge to produce a large amount of condensation nuclei and ice crystal nuclei. It is considered that, as the SCD capacity increases, the amount of energy that can be supercooled by fog particles also increases, which affects fog dissipation.

4.2. Results of Camera Experiment
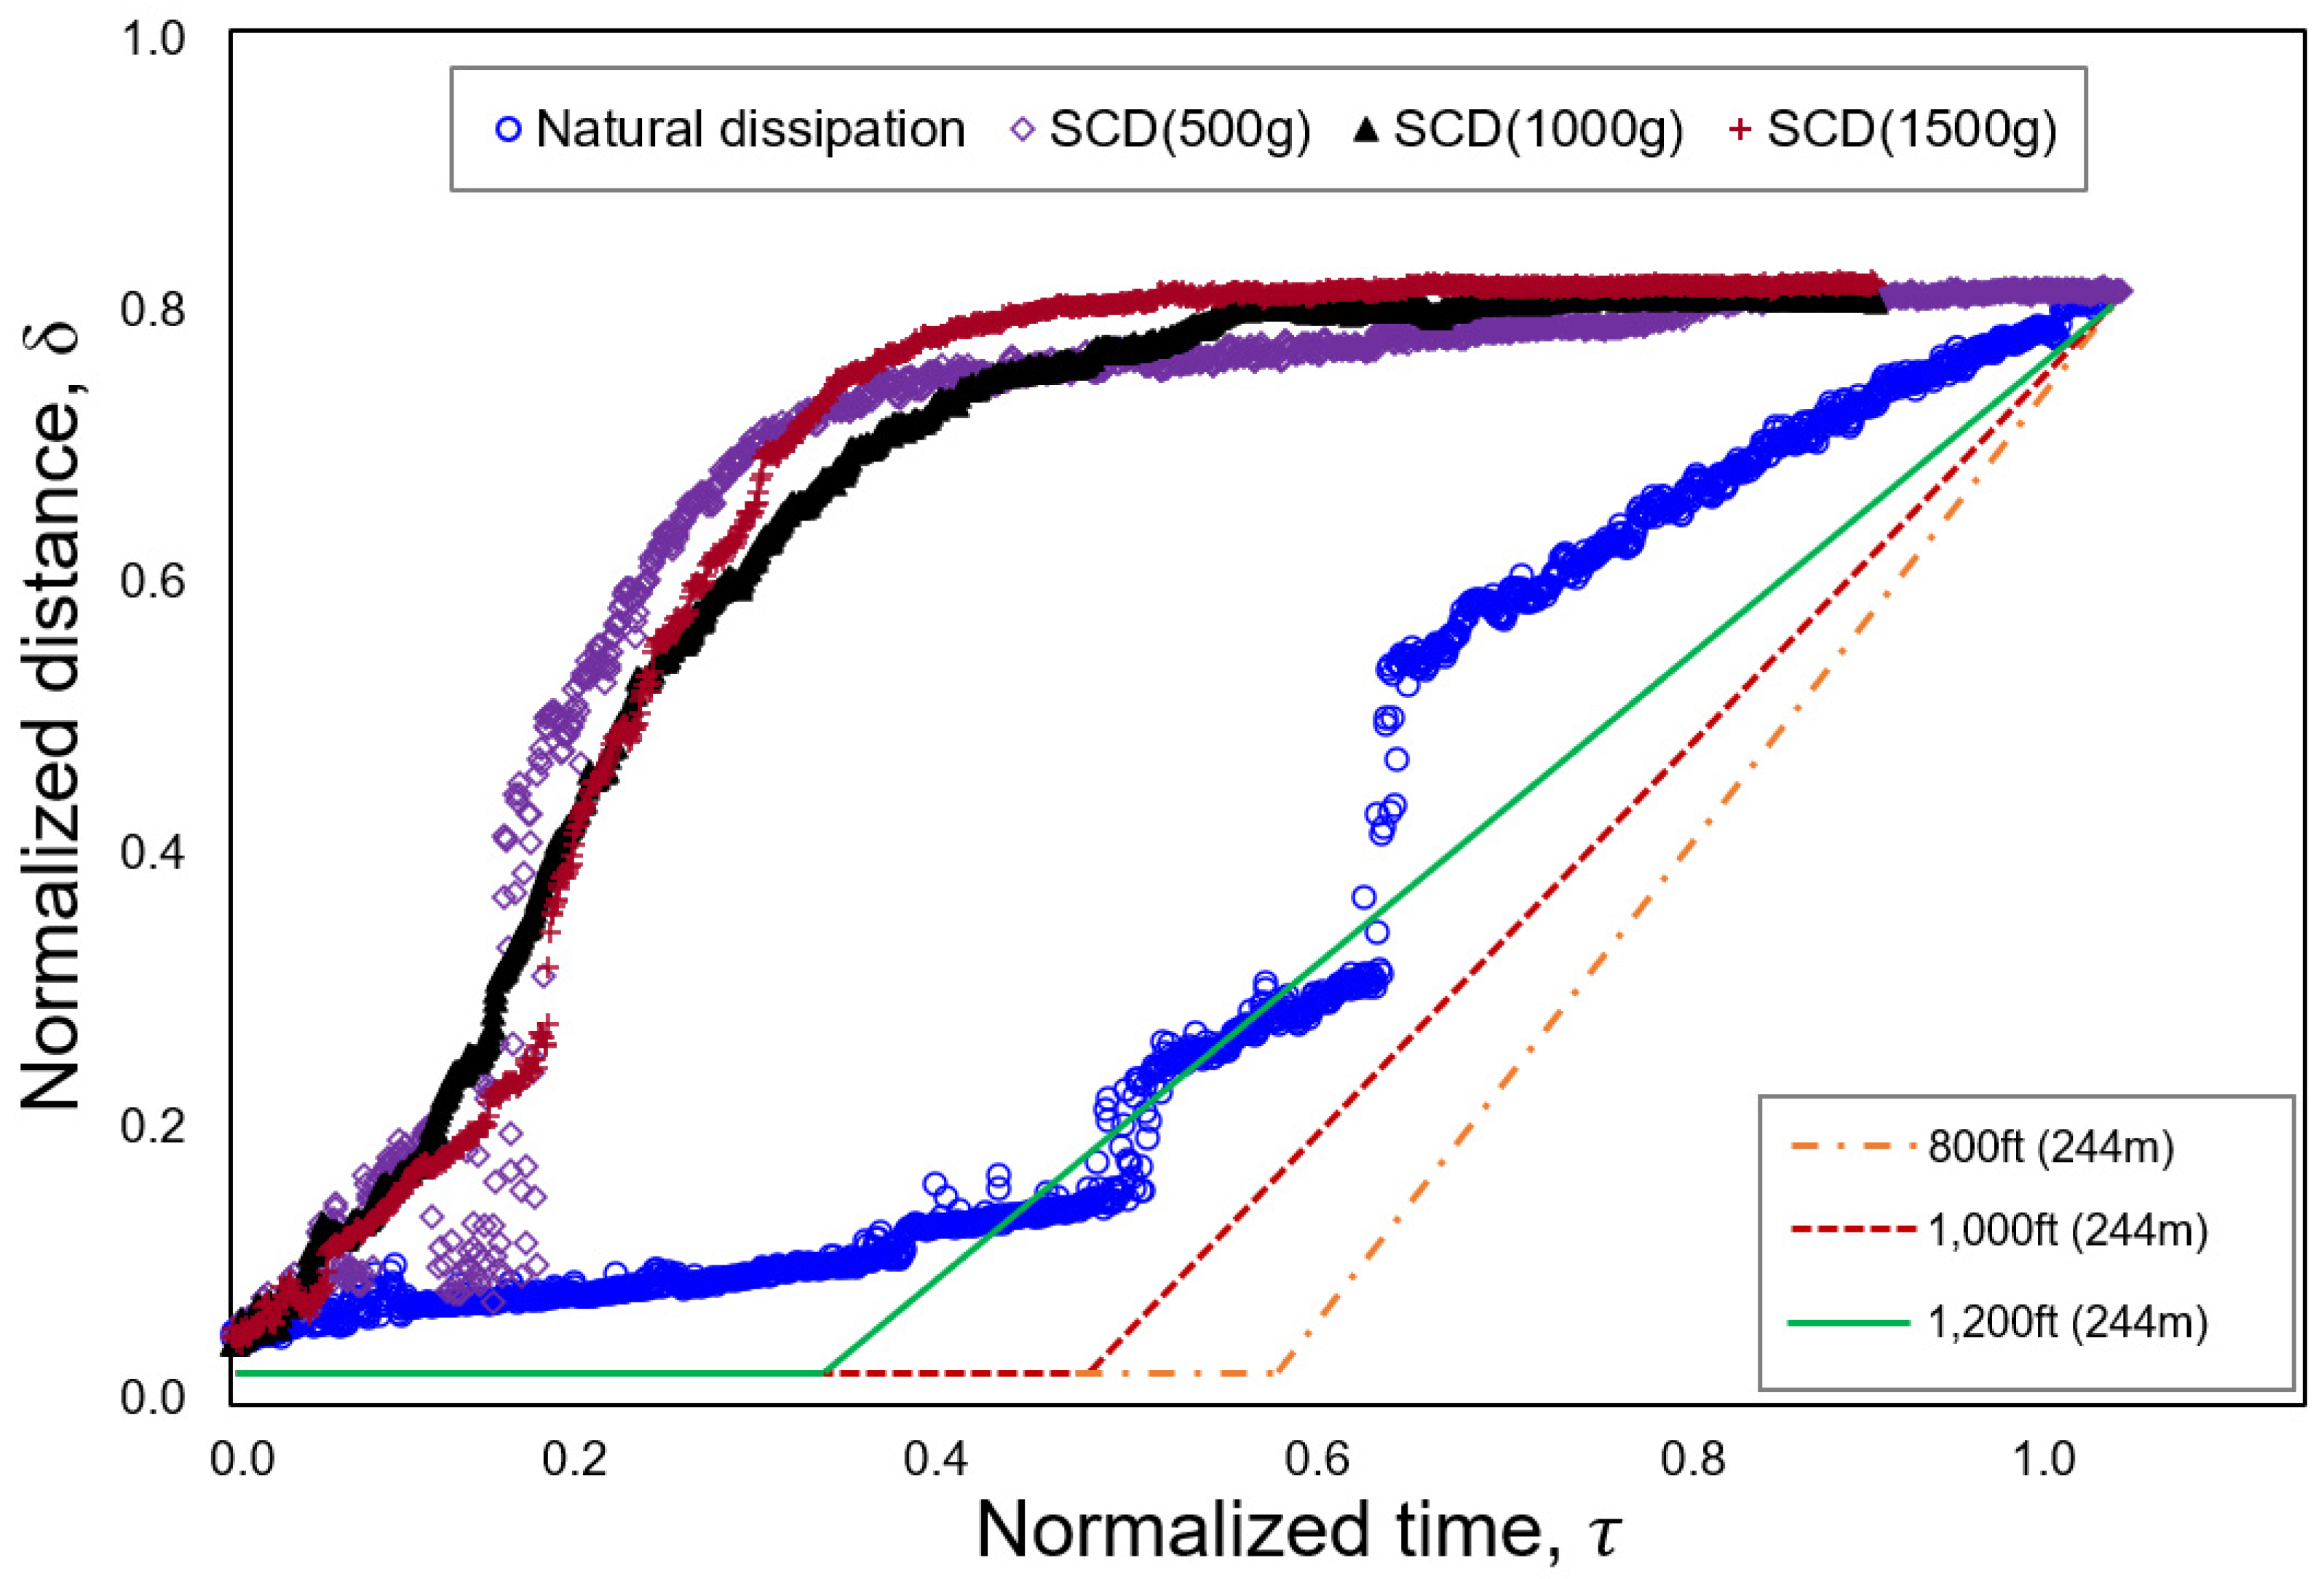
The camera experiment was performed to validate the tendency of the distance measurement results using the LiDAR sensor. Figure 5 and Figure 6 show the results of the camera experiments according to the natural dissipation and SCD seeding amounts (500 g, 1000 g, and 1500 g). In addition, yellow stars are marked at the observation time of the subject, and red stars are marked at the termination of fog dissipation. The blue stars indicate the fog dissipation point of the LiDAR sensor. After the start of fog dissipation, the subject observation time was natural dissipation: 1250 s, and when SCD 500 g, 1000 g, and 1500 g was seeded, 930 s, 660 s, and 600 s were taken, respectively. The time, when the fog was not visible in the camera image, was 2260 s at 500 g, 1670 s at 1000 g, and 1320 s at 1500 g, according to the amount of SCD seeding weight. When comparing the three different weights of SCD seeding, it was established that the visibility improvement effect was significant on the order of 1500 g, 1000 g, and 500 g, which matches the LiDAR sensor results. In all experiments using SCD, it was confirmed that the SCD seeding dissipation time was faster than natural dissipation, as a result of the camera image. When 1500 g, the largest weight of SCD seeding, was seeded, the dissipation terminated the fastest. The termination time of the LiDAR sensor fog dissipation calculated according to Equation (2) was 9.15% p faster on average than the visual observation dissipation time. There was a slight difference between the LiDAR distance measurement data and the visual observation through the camera at the termination of fog dissipation. This is because the position measured by the LiDAR sensor inside the chamber and the shooting positions of cameras 1 and 2 are different. As a result of comparing the LiDAR experimental data and the camera images, the tendencies of the two experimental methods were similar. As shown in Figure 6, the dissipation of the LiDAR among each fog dispersion measurement method was first confirmed in all cases. Through this, it was found that the method of detecting fog dispersion using a LiDAR sensor was more sensitive than visual observation. Therefore, it was determined that the measurement method using the LiDAR sensor was effective. In addition, based on the tendency of the experimental results, the effectiveness of SCD seeding was validated.

4.3. Verification

The experimental results of this paper were compared and analyzed with the results of Kampe et al. [8], who seeded SCD to actual clouds using airplanes (refer to Figure 7). In the reference paper [8], the experiment was conducted by seeding SCD at about 305 m (1000 ft) above the sky.
Figure 7 shows SCD seeding at three heights (800 ft, 1000 ft, and 1200 ft), and the point at which the ground becomes visible from the plane is indicated by black filled circles. The point at which the fog completely disappears is indicated by an empty circle with E. It means the time from when the SCD and fog droplets react through the supercooling mechanism to start dissipation of the fog and completely disappear. The dissipation end time for the three experimental cases was 50 min from the SCD seeding. The dissipation of fog and clouds was completed by seeding the SCD in both the referenced paper [8] and the experiments of this paper. When the supercooling mechanism of the SCD proceeds during the total dissipation time, the visual observation points are indicated ‘yellow star’ in this study and ‘ground visible’ in the referenced study [8]. Therefore, the ‘yellow star’ of this study and the ‘ground visible’ of the referenced study [8] can be seen to be the same. In order to use this time, the time ratio at which the subject was observed in the total dissipation time was defined as follows:
τ = t 1 t 2 t 1
Here, t 1 means the total dissipation time, and t 2 means the time from the time when the subject and the ground are visible to the end of dissipation. In this study, the minimum value was 0.469 and the maximum was 0.553 based on LiDAR data, and the average value of the three cases was 0.533 in the referenced paper [8]. The smaller this value, the slower the reaction between SCD and water vapor particles. A slow reaction means that it takes a little longer for all reactions to occur. In other words, it affects the total dissipation time. Similar to the results of the referenced study [8], this study confirmed that a sufficient amount of SCD affected fog dissipation. The results were quantified numerically. In order to compare this experiment with the experiment of Kampe et al. [8], all experimental data were normalized from 0 to 1. The start of dissipation is denoted as 0, and the end of dissipation is denoted as 1. The Y-axis is the normalized observation distance, where 0 is the minimum observation distance and 1 is the maximum observation distance. The total normalized distance ‘ δ ’ of the Y-axis is defined in Equation (4) by dividing the estimated distance L 2 by the total observation distance L 1 .
C δ = L 2 L 1
Table 4 shows the weight of SCD seeding in this study and the distance of SCD seeding in an airplane in the referenced paper [8] normalized to the ‘ τ ’ value. Based on this table, it is possible to compare and analyze the experiments in this study with those in actual fog. As can be seen in Figure 8, the results of this study and the referenced study [8] were compared in a graph by normalized distance and time. The 800 ft, 1000 ft, and 1200 ft lines in Figure 8 linearly represent the normalized when the ground started to be visible and the fog was dissipated after SCD seeding. In the referenced paper [8], it was confirmed that fog dissipated when a sufficient amount of SCD was seeded at different heights. Based on this, we conducted a study on how large the amount of SCD should be for our experimental chamber size. Although there was a slight difference depending on the amount of SCD, it was confirmed that SCD had an effect on fog dissipation. In addition, in order to simply compare the fog dissipation process of this study and the referenced paper [8], time and distance were normalized and analyzed. As a result, it is considered that both this study and previous studies have confirmed that SCD seeding has an effect on removing fog.

5. Conclusions

In this study, fog dissipation research was conducted to prevent traffic accidents caused by fog. LiDAR was used to clarify the point at which the fog dissipated, and the experimental reproducibility was also confirmed. In cold fog conditions, the effect of SCD seeding (500 g, 1000 g, and 1500 g) on improving fog visibility was explored. The findings suggest that the following conclusions were reached:
  • Based on the results of the distance measurement data of the LiDAR sensor, it was confirmed that the effect of increasing the weight of SCD seeding and improving visibility was proportional, although non-directly proportional. Due to the space limitations of the lab-scale chamber, it was determined that the energy conversion was limited. Therefore, further studies are needed to optimize the amount of suitable SCD for fog dissipation in different sized spaces.
  • Using LiDAR sensor measurement results and camera images, the tendency of the fog dissipation method with natural and SCD seeding dissipation was analyzed. As a consequence, the similarities between the LiDAR sensor distance measurement and the camera result were validated. As a consequence, the effect of SCD seeding on improving visibility when compared to natural dissipation under cold fog conditions was proven based on LiDAR sensor distance data and camera images.
  • It is considered that the results of this study are available as basic data for developing new fog dissipation technology.

Author Contributions

Supervision, Y.-J.K.; writing the original draft, M.-G.P.; writing, review, and editing, H.-S.K. and M.-G.P. All authors have read and agreed to the published version of the manuscript.

Funding

This research was funded by the Korea Agency for Infrastructure Technology Advancement (KAIA), grant number 21CTAP-C157760-02.

Data Availability Statement

The datasets analyzed during the current study are available from the corresponding author on reasonable request.

Conflicts of Interest

The authors declare no conflict of interest.

References

  1. Bang, C.H.; Lee, J.W.; Hong, S.Y. Predictability experiments of fog and visibility in local airports over Korea using the WRF model. J. Korean Soc. Atmos. Environ. 2008, 24, 92–101. [Google Scholar]
  2. Gultepe, I.; Tardif, R.; Michaelides, S.C.; Cermak, J.; Bott, A.; Bendix, J.; Müller, M.D.; Pagowski, M.; Hansen, B.; Ellrod, G.; et al. Fog research: A review of past achievements and future perspectives. Pure Appl. Geophys. 2007, 164, 1121–1159. [Google Scholar] [CrossRef]
  3. Niu, S.J.; Liu, D.Y.; Zhao, L.J.; Lu, C.S.; Lü, J.J.; Yang, J. Summary of a 4-year fog field study in northern Nanjing, Part 2: Fog microphysics. Pure Appl. Geophys. 2012, 169, 1137–1155. [Google Scholar] [CrossRef]
  4. Lee, Y.K.; Choi, J.S. A study on development of fog dissipating system using dry air. In Proceedings of the KAIS Fall Conference; Jeonbuk National University: Jeonju, Republic of Korea, 2011; pp. 276–279. [Google Scholar]
  5. Elbing, F.; Möller, D.; Ulbricht, M. Fog Dissipation by SCD Blasting: Technology and Applications. In Proceedings of the 2nd International Conference on Fog and Fog Coll, St. John’s, NL, Canada; 2011; pp. 485–488. [Google Scholar]
  6. Möller, D.; Wieprecht, W.; Hofmeister, J. Fog Dissipation by SCD Blasting: Process Mechanism. In Proceedings of the 2nd International Conference on Fog and Fog Coll, St. John’s, NL, Canada; 2011; pp. 489–491. [Google Scholar]
  7. Beckwith, W.B. Supercooled Fog Dispersal for Airport Operations. Bull. Am. Meteorol. Soc. 2011, 46, 323–327. [Google Scholar] [CrossRef] [Green Version]
  8. Kampe, H.J.; Kelly, J.J.; Weickmann, H.K. Seeding experiments in subcooled stratus clouds. In Cloud and Weather Modification; American Meteorological Society: Boston, MA, USA, 1957; pp. 86–111. [Google Scholar]
  9. Jung, J.I.; Kyu, S.S.; Park, Y.S.; Lee, S.Y.; Yang, H.Y. Verification of Corrective Improvement Effect of Cloud (Fog) Control Experiments by Hygroscopic Substances. In Proceedings of KOMES Spring Conference; Kyungpook National University: Daegu, Republic of Korea, 2014; pp. 176–177. [Google Scholar]
  10. Kim, T.Y.; Park, G.W.; Kang, H.G.; Lee, S.H. A Prediction for Fog Dissipation Using Artificial Neural Network. In Proceedings of KIISE, Fall Conference; Chung-Ang University: Seoul, Republic of Korea; Volume 35, pp. 316–319.
  11. Holmstrom, M.; Liu, D.; Vo, C. Machine Learning applied to Weather Forecasting. Meteorol. Appl. 2016, 10, 1–5. [Google Scholar]
  12. Choi, S.; Kim, Y.J.; Briceno, S.; Mavris, D. Prediction of Weather-induced Airline Delays based on Machine Learning Algorithms. In Proceedings of the 2016 IEEE/AIAA 35th Digital Avionics Systems Conference (DASC), Sacramento, CA, USA, 25–29 September 2016; IEEE: Piscataway, NJ, USA, 2016; pp. 1–6. [Google Scholar]
  13. Sravanthi, N.; Venkat, M.L.; Harshini, S.; Ashesh, K. An ensemble Approach to Predict Weather Forecast Using Machine Learning. In Proceedings of the 2020 International Conference on Smart Electronics and Communication (ICOSEC), Trichy, India, 10–12 September 2020; IEEE: Piscataway, NJ, USA, 2020; pp. 436–440. [Google Scholar]
  14. Schultz, M.G.; Betancourt, C.; Gong, B.; Kleinert, F.; Langguth, M.; Leufen, L.H.; Mozaffari, A.; Stadtler, S. Can Deep Learning Beat Numerical Weather Prediction? Philos. Trans. R. Soc. A 2021, 379, 2194. [Google Scholar] [CrossRef]
  15. Gusmão, G.F.; Barbosa, C.R.H.; Raposo, A.B. Development and Validation of LiDAR sensor Simulators based on Parallel Raycasting. Sensors 2020, 20, 7186. [Google Scholar] [CrossRef] [PubMed]
  16. Hahner, M.; Sakaridis, C.; Dai, D.; Van Gool, L. Fog Simulation on Real LiDAR Point Clouds for 3D Object Detection in Adverse Weather. In Proceedings of the IEEE/CVF International Conference on Computer Vistion, Nashville, TN, USA, 20–25 June 2021; pp. 15283–15292. [Google Scholar]
  17. Li, Y.; Duthon, P.; Colomb, M.; Ibanez-Guzman, J. What Happens for a ToF LiDAR in Fog? IEEE Trans. Intell. Transp. Syst. 2020, 22, 6670–6681. [Google Scholar] [CrossRef]
  18. Findeisen, W.; Volken, E.; Giesche, A.M.; Brönnimann, S. Colloidal meteorological processes in the formation of precipitation. Meteorol. Z. 2015, 24, 443–454. [Google Scholar] [CrossRef]
  19. Song, T.L.; Xing, X.H.; Yang, Y.; Li, X.D.; Yang, R.J. Study on the Effect of Sodium Polyacrylate and its Compounds on Artificial Warm Fog Dissipation. In Advanced Materials Research; Trans Tech Publications Ltd.: Bäch, Switzerland, 2014; Volume 1052, pp. 226–230. [Google Scholar]
  20. Bamji, C.S.; O’Connor, P.; Elkhatib, T.; Mehta, S.; Thompson, B.; Prather, L.A.; Snow, D.; Akkaya, O.C.; Daniel, A.; Payne, A.D.; et al. A 0.13 μm CMOS System-on-chip for a 512 × 424 Time-of-Flight Image Sensor with Multi-frequency Photo-demodulation up to 130 MHz and 2 GS/s ADC. IEEE J. Solid-State Circuits 2014, 50, 303–319. [Google Scholar] [CrossRef]
  21. Momma, E.; Nakano, S.; Ono, T.; Okayasu, K.; Nemoto, M.; Ebata, H.; Mammoto, A. Detection of Fog and Smoke Particles with Discrete near Infrared Light. Electron. Commun. Jpn. 2018, 101, 3–9. [Google Scholar] [CrossRef]
  22. Liu, J.; Sun, Q.; Fan, Z.; Jia, Y. TOF Lidar Development in Autonomous Vehicle. In Proceedings of the 2018 IEEE 3rd Optoelectronics Global Conference (OGC), Shenzhen, China, 4–7 September 2018; pp. 185–190. [Google Scholar]
Figure 1. Calorimeter chamber: (a) Calorimeter; (b) Control panel.
Fluids 08 00185 g001
Figure 2. Schematic of experimental equipment.
Fluids 08 00185 g002
Figure 3. Measuring system of ToF LiDAR [20]. 1 and 2 represent different signals, and 3 represents the lag between the two signals.
Fluids 08 00185 g003
Figure 4. Comparison of LiDAR sensor distance measurements results in seconds.
Fluids 08 00185 g004
Figure 5. Comparison of natural and SCD seeding dissipation results for camera 1.
Fluids 08 00185 g005
Figure 6. Comparison of natural and SCD seeding dissipation results for camera 2.
Fluids 08 00185 g006
Figure 7. Life history of SCD seeding experiments (Kampe et al. [8]).
Fluids 08 00185 g007
Figure 8. Comparison graph between the experiments of this paper and the referenced paper [8].
Fluids 08 00185 g008
Table 1. Specifications of calorimeter.
IndoorOutdoor
Capacity (cooling)
Capacity (heating)
2000~15,000 kcal/h
2000~16,000 kcal/h
Range of hydrothermograph10~50 °C−20~60 °C
30~90% RH5~90% RH
Range of air volume3~50 m 3 / min 5.5~60 m 3 / min
Wind speed0.5 m/s
Reproducibility ± 2%
Accuracy ± 2%
Air conditioner1 set
130 m 3 / min , 2.2 kW
Heater: 40 kW
Unit of refrigerator4 kW-1 set (Bitzer)5.5 kW-1 set (Bitzer)
5.5 kW-2 set (Bitzer)
Refrigerant: R-22
7.5 kW-2 set (Bitzer)
Refrigerant: R-22
Table 2. Specification of LiDAR sensor.
Detection Range (2D)200 mm~8000 mm
Measure1 mm
Distance accuracy ± 1%
FOV (Field of view, α )0 ° < α < 120 °
Size (W × D × H)37.4 × 24.5 × 37.4 ( mm 3 )
Weight28 g
Operating temperature−10~50 °C
Table 3. The distance data results measured by LiDAR sensor.
L 0   [ mm ] t m   [ s ]
Natural dissipation1972.852701
SCD (500 g)1969.752083
SCD (1000 g)1951.681426
SCD (1500 g)1973.651130
Table 4. Comparison of the time ratio ( τ ) between the observable subjects and the ground visible.
τ
SCD (500 g)0.553
SCD (1000 g)0.537
SCD (1500 g)0.469
Referenced paper [8]800 ft (244 m)0.660
1000 ft (305 m)0.431
1200 ft (366 m)0.490
Disclaimer/Publisher’s Note: The statements, opinions and data contained in all publications are solely those of the individual author(s) and contributor(s) and not of MDPI and/or the editor(s). MDPI and/or the editor(s) disclaim responsibility for any injury to people or property resulting from any ideas, methods, instructions or products referred to in the content.

