Article

Numerical Analysis of Convective Mass Transfer during Multi-Droplet Impingement on a Structured Surface in the Presence of an Adhered Liquid Film—An Application to Spray Etching of PCBs

1
Materials Center Leoben Forschung GmbH, Roseggerstrasse 12, 8700 Leoben, Austria
2
Chair of Nonferrous Metallurgy, Montanuniversitaet Leoben, Franz-Josef-Strasse 18, 8700 Leoben, Austria
3
Austria Technologie & Systemtechnik (AT&S) Aktiengesellschaft, Fabriksgasse 13, 8700 Leoben, Austria
*
Author to whom correspondence should be addressed.
Fluids 2023, 8(6), 180; https://doi.org/10.3390/fluids8060180
Submission received: 24 April 2023 / Revised: 5 June 2023 / Accepted: 8 June 2023 / Published: 14 June 2023

Abstract

:
Multi-droplet impingement is a fundamental aspect inherent to all kinds of technical spray processes which typically aim at enhancing the convective exchange of reagents or heat at the impinged surface. In this paper, the impingement of multiple droplets onto a structured surface is investigated by a comprehensive CFD model, which resolves the dynamics of the individual droplets and the film on a micro-scale level based on the Volume of Fluid (VOF) method. The considered surface topology includes cavities and is typical for protective masks used in the spray etching of Printed Circuit Boards (PCBs). The agitation of the liquid film in terms of the convective mass transfer rates across virtual horizontal evaluation planes is studied and the influence of film height and droplet impaction velocity is elaborated. Passive tracer tracking is employed to investigate the release and re-entrainment of fluid at the surface cavities. Two modes of mass exchange between the cavities and the main flow upon droplet impingement are identified, which are central inflow accompanied by lateral outflow (1) and lateral inflow with outflow at the opposing side (2). A statistical analysis of the allocation of tracer particles shows that high impaction velocities and low film heights correlate with an enhanced decay of tracer particles within the cavities. The susceptibility to re-entrainment is also reduced by high impaction velocities, whereas increased film heights are found to promote re-entrainment.

1. Introduction

The interaction between droplets and liquid films upon impingement is a process which plays a key role in a wide range of technical applications [1]. Spray cooling, for example, is an integral part of numerous high-performance cooling concepts used in material processing technology [2], power electronics [3], electrical drives [4] and green energy production devices, such as photovoltaic thermal (PVT) systems [5]. A further significant field of utilization consists of spray etching, which is involved in large-scale production in the micro-electronics industry, for example, in the manufacturing of conduction paths on Printed Circuit Boards (PCBs) [6,7,8]. Spray etching involves the transfer of mass, momentum and energy from droplets into a liquid film of etchant solution and further towards the surface to be etched. In this process, the surface of the PCBs is formed by a copper foil, which is partly imprinted with an etch-protective mask. The masked regions protect the desired conduction path system. Unmasked regions of the copper foil are removed during the etching process. The trend towards performance improvement by miniaturization and consequently the decrease in the distance between the conduction paths affects not only the in-service behavior [9,10,11] but also the production of PCBs [12]. In spray etching, the narrow spacing between masked regions and the comparatively high layer thicknesses of the mask constitute a surface structure with cavities, wherein the etching reaction takes place. With the ongoing etching process, these cavities deepen. The surface structure promotes stagnation and thus reduces the supply of fresh etchant solution towards the reacting surface zones in the cavities. Depending on the geometry, the adhered film and the impinging droplets, more or less mass transfer between the cavities and the film regions above them takes place. While etchant is steadily consumed at the surface to be etched, fresh etchant is delivered via the impinging droplets. The etchant concentration at the reacting surface zones determines the speed and the uniformity of the etching reaction. The underlying transport processes are thus essential determinants which, together with the reaction kinetics, control the spray etching process.
A series of numerical works related to etching of PCBs investigate the evolution of the etched surface under quiescent conditions [13] and under convective flow patterns [12,14,15]. The works related to convective flow focus on specific steady flow conditions without covering droplet impingement explicitly. Instead, flow conditions are imposed at the boundaries whereby shear flow conditions [14,15] or flows which stream perpendicularly towards the surface to be etched are prescribed [12]. Shin et al. [15] studied the influence of shear flow. According to their study, the etching rate increases by a factor of four when etching in a quiescent etchant is compared to the case with shear flow. They report that the cavity geometry is a further main factor of influence on the etching rate. Cavities with a high aspect ratio in terms of deepness to width displayed a reduced etching rate. Sheng et al. [12] investigated flows which are perpendicularly directed to the surface to be etched. They identified recirculating eddies within the etching cavities, which were accompanied by changes of local etching rate.
The characterization of mass transfer during multi-droplet impingement in general, and spray etching in particular, requires the accurate tracking of the inherent flow conditions. Numerical modelling of single and multiple droplet impingement is frequently based on the Volume of Fluid (VOF) method [1,16,17,18,19,20,21,22,23]. Further methods are the Level Set (LS) method [24], combinations of the Level Set and the VOF method (CLSVOF) [25] as well as the Lattice Boltzmann (LB) methods [26]. Additionally, models combining the LB method for flow field simulation with a direct solution of the Cahn–Hillard equation for the interface have been presented [27,28]. Experimental studies typically use high-speed imaging techniques to visualize the droplet impaction process [29,30,31,32]. Main topics in experimental works include the morphology of the impact and splashing behaviors as well as impingement to surfaces with specifically tuned properties, as detailed in a recent review by Wang et al. [33]. Droplet impingement to liquid surfaces results in different impact morphologies such as splashing, jet formation or coalescence [31]. The observed impact morphology essentially depends on the impaction conditions, such as Reynolds number, Weber number and dimensionless film height. Several correlations have been proposed to relate the impaction conditions to impact morphologies [29,30,31,34,35]. However, experimental droplet impingement studies are typically based on droplet sizes in the range of millimeters, which exceeds the typical size of spray droplets significantly, as detailed by Zhang et al. [36]. Therefore, they used a numerical model based on the VOF method, which was validated by impingement experiments of millimeter-sized droplets, applied it to micro-droplet impingement, elaborated on the scale effect of droplet size and derived a splashing criterion for micro-meter-sized droplets [36]. In general, experimental droplets are mainly at the millimeter scale, hence experimental and numerical studies on technically relevant micro/nano droplets would be of broad interest, as detailed by Wang et al. [33] in a recent review.
Numerical models based on the VOF method ensure conservation of mass, momentum and energy, and allow for transient tracking of the free-surface including effects of surface tension. The impingement of a single droplet on a liquid film resting on a flat surface was investigated by Peng et al. [1]. According to their work, the properties of the fluid affect the film dynamics. The diameter of the crown pattern formed on impingement increased with the surface tension coefficient. The tendency to film rupture decreased with increasing viscosity of the fluid. Thalackottore Jose and Dunne [16] examined the impingement of single droplets onto static and vibrating surfaces. Guggilla et al. [17] published a numerical study of two droplets impinging consecutively onto a flat heated wall, focusing on film and heat transfer dynamics. They further elaborated on the influence of spreading dynamics of the leading droplet on that of trailing droplet and identified the time interval between consecutive droplets as a determining factor of influence. Guilizzoni and Frontera [18] investigated crater depth evolutions under the impingement of multiple droplets to a liquid film. Muthusamy et al. [19] investigated a single stream of equally sized droplets impinging on a liquid film in terms of hydro-dynamics and heat transfer. Diaz et al. [20] reported on the effect of a gas stream carrying a droplet towards a heated solid surface. Yuan et al. [21] analyzed droplet impingement on a hierarchically structured hydrophobic surface.
Numerical models for droplet impingement are based on 2D, 2D axisymmetric and 3D models. Three-dimensional models entail very high computational costs [22]. Thus, although a simplification, 2D models are frequently used to model droplet impingement onto liquid films in the presence of multiple droplets, inclined impaction or asymmetric film flow [22,23,25,26,27,28,37]. Yang et al. [23] performed comparisons between the results obtained by a 2D model and experiments. They found that the numerical model agreed well with the experiment considering a case of millimeter-sized droplets impinging to a liquid film on an inclined plate. Additionally, impaction onto a micro-structured surface was examined in their study and again the model predicted the spreading behavior on impaction.
Flows alongside geometrical structures display a certain intensity of convective mass transfer between the surface features which promote stagnation, such as cavities, and the main flow. Nardecchia et al. [38], for example, evaluated the mass transfer between urban canopy layers and overlying layers. Zhao et al. [39] evaluated the mass transfer rate between structural cavities and a main flow in ultra-compact combustors in gas-turbines. Furthermore, passive tracers are frequently utilized. Broecker et al. [40] analyzed passive tracer retention during a free-surface flow over a rippled stream bed based on a numerical multi-phase model using the Volume of Fluid (VOF) method for tracking the free surface. The tracer was initially dispersed in a specified region of the main flow, whereby a certain fraction of the tracer particles came into the spacing between the ripples, where they remained for some time. The retention time was found to be dependent on the surface geometry as well as on the flow velocity of the main stream. Constantinescu et al. [41] published a study, wherein they investigated a single-phase flow along a series of cavities. A passive tracer was used to monitor its escape from an upstream cavity as well as its partial re-entrainment in down-stream cavities. Sandoval et al. [42] and Oliveira et al. [43] employed passive tracers to investigate single-phase flows past lateral cavities of various geometrical shapes in riverine systems. They monitored the temporal decay of the passive tracer within the cavity volume. Passive tracer decay is also employed, for example, to characterize mass transfer in studies on the effect of ventilation on indoor air quality in terms of the temporal decay of CO2 concentration [44], the evaluation of the air exchange rate in urban canopy layers [45] as well as the evaluation of the local mean age of air [46].
Applications of sprays typically require a fast and uniform mass transfer at the impinged surface to effectively exchange heat or reagents. The presence of a structuring on the surfaces, however, imposes a challenge since cavity structures tend to deteriorate the mass exchange. While much research related to convective mass transport in the presence of cavity structures is available, as for example in the context of flows of air over urban canopy layers or water in riverine systems with embayments, little is yet known on how finely structured surfaces behave under spray impingement. In this work, the convective mass transfer in liquid films on structured surfaces, which is induced by the agitation of consecutively impinging droplets, is studied. To this end, established characterization methods comprising mass transfer rates through virtual surfaces and tracking of tracer particles are applied to flow data obtained from highly resolved simulations of multiple droplet impingement based on the VOF method. The studies comprise an identification of modes of convective mass transfer between the cavities of the structure surface and the main flow and comparisons of the effects of different impingement velocities and film heights.

2. Model

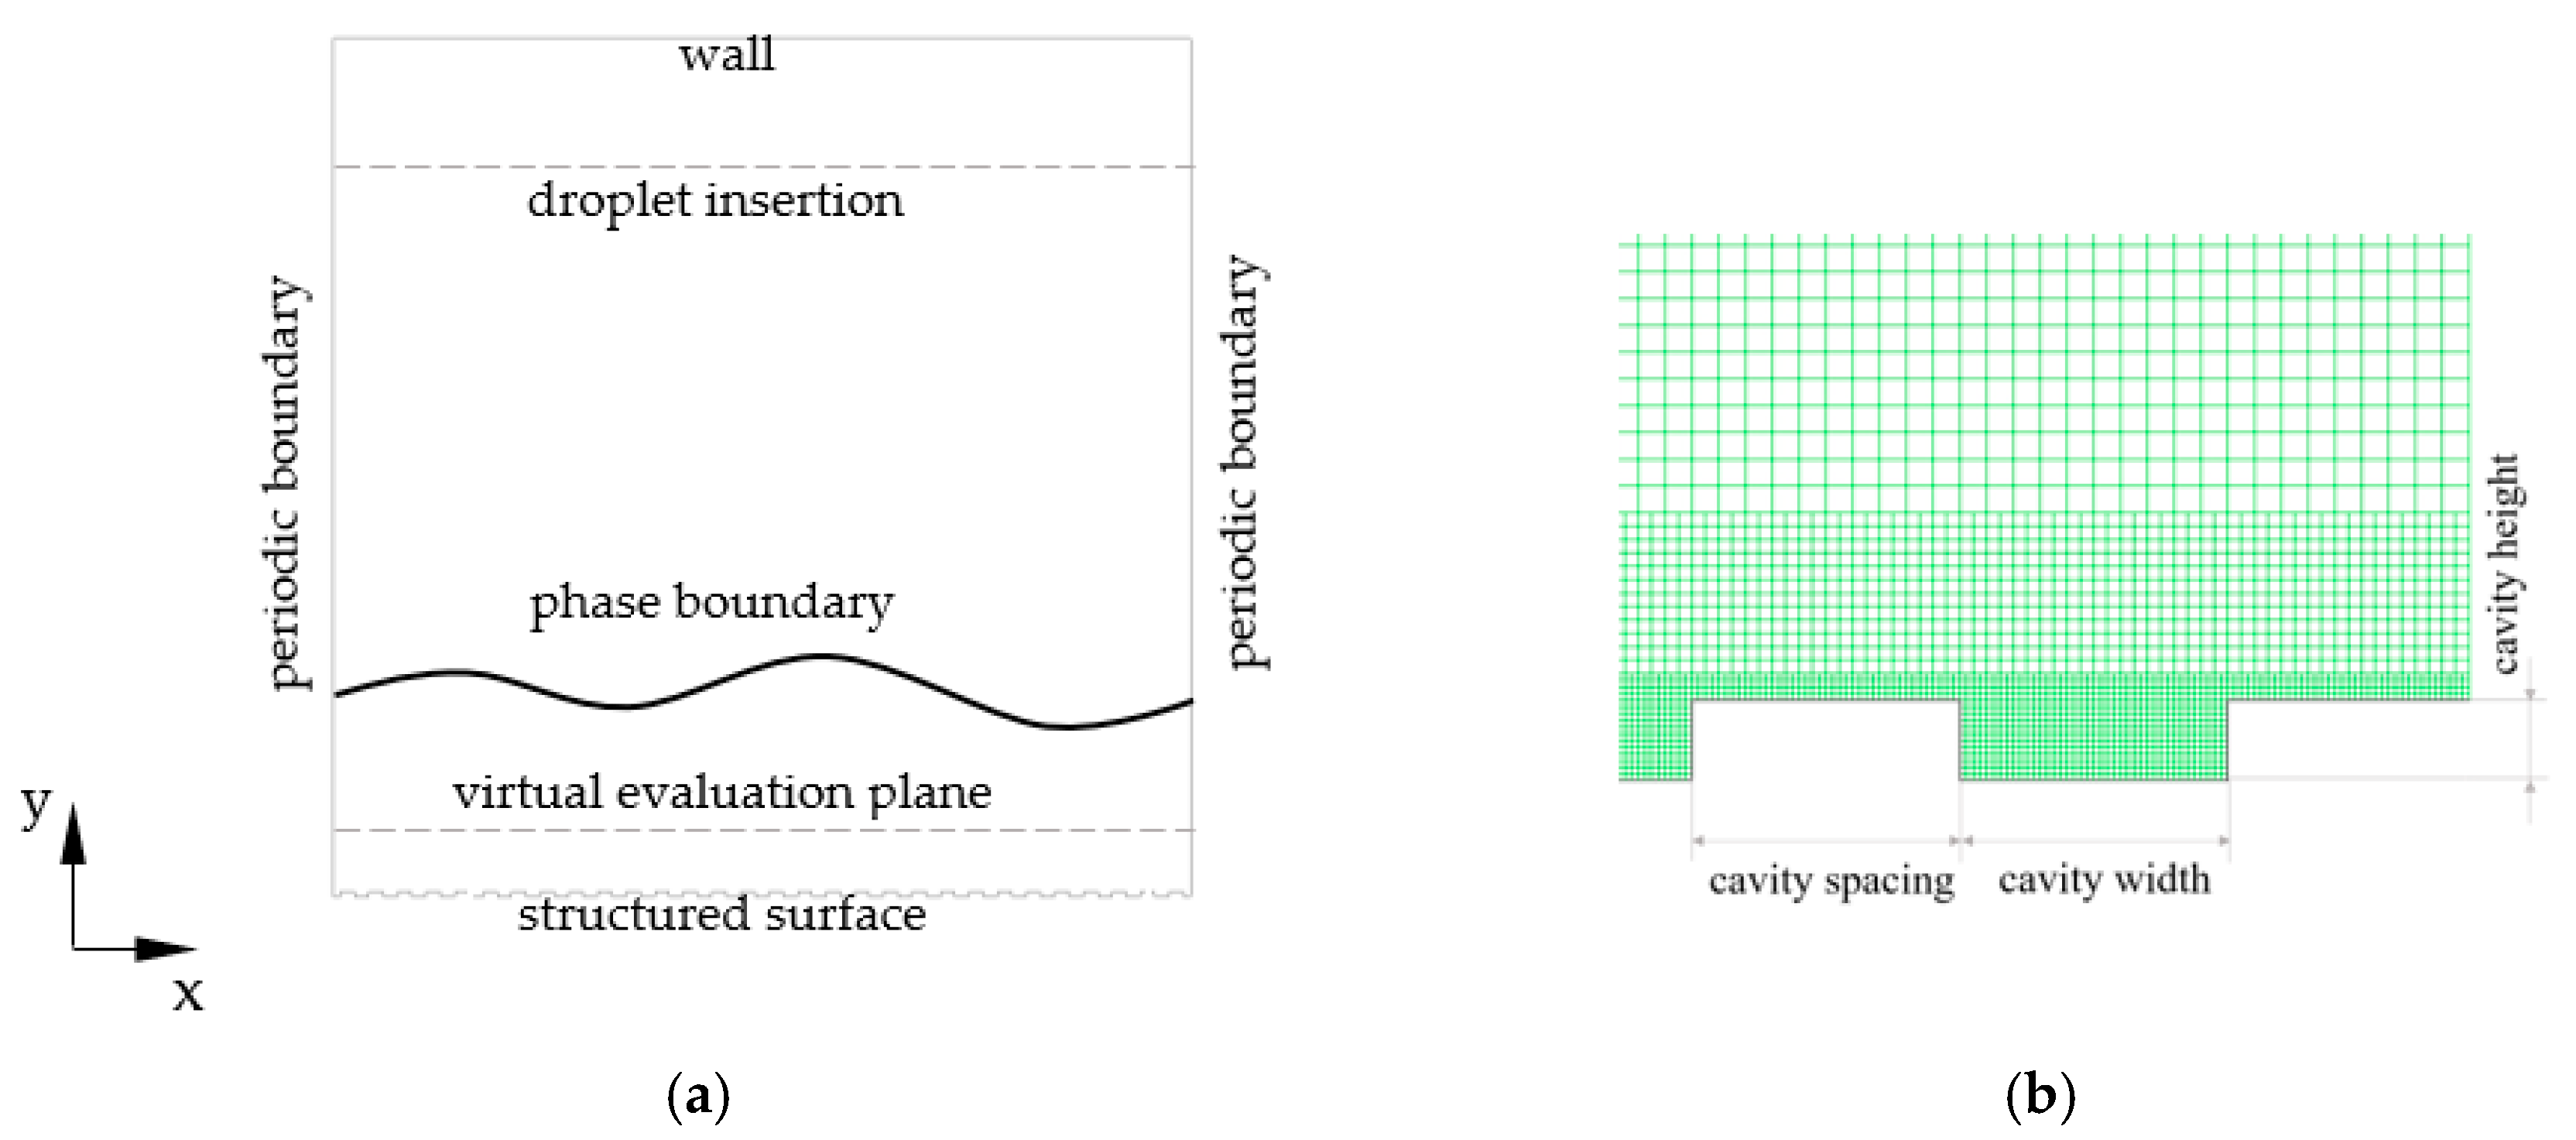
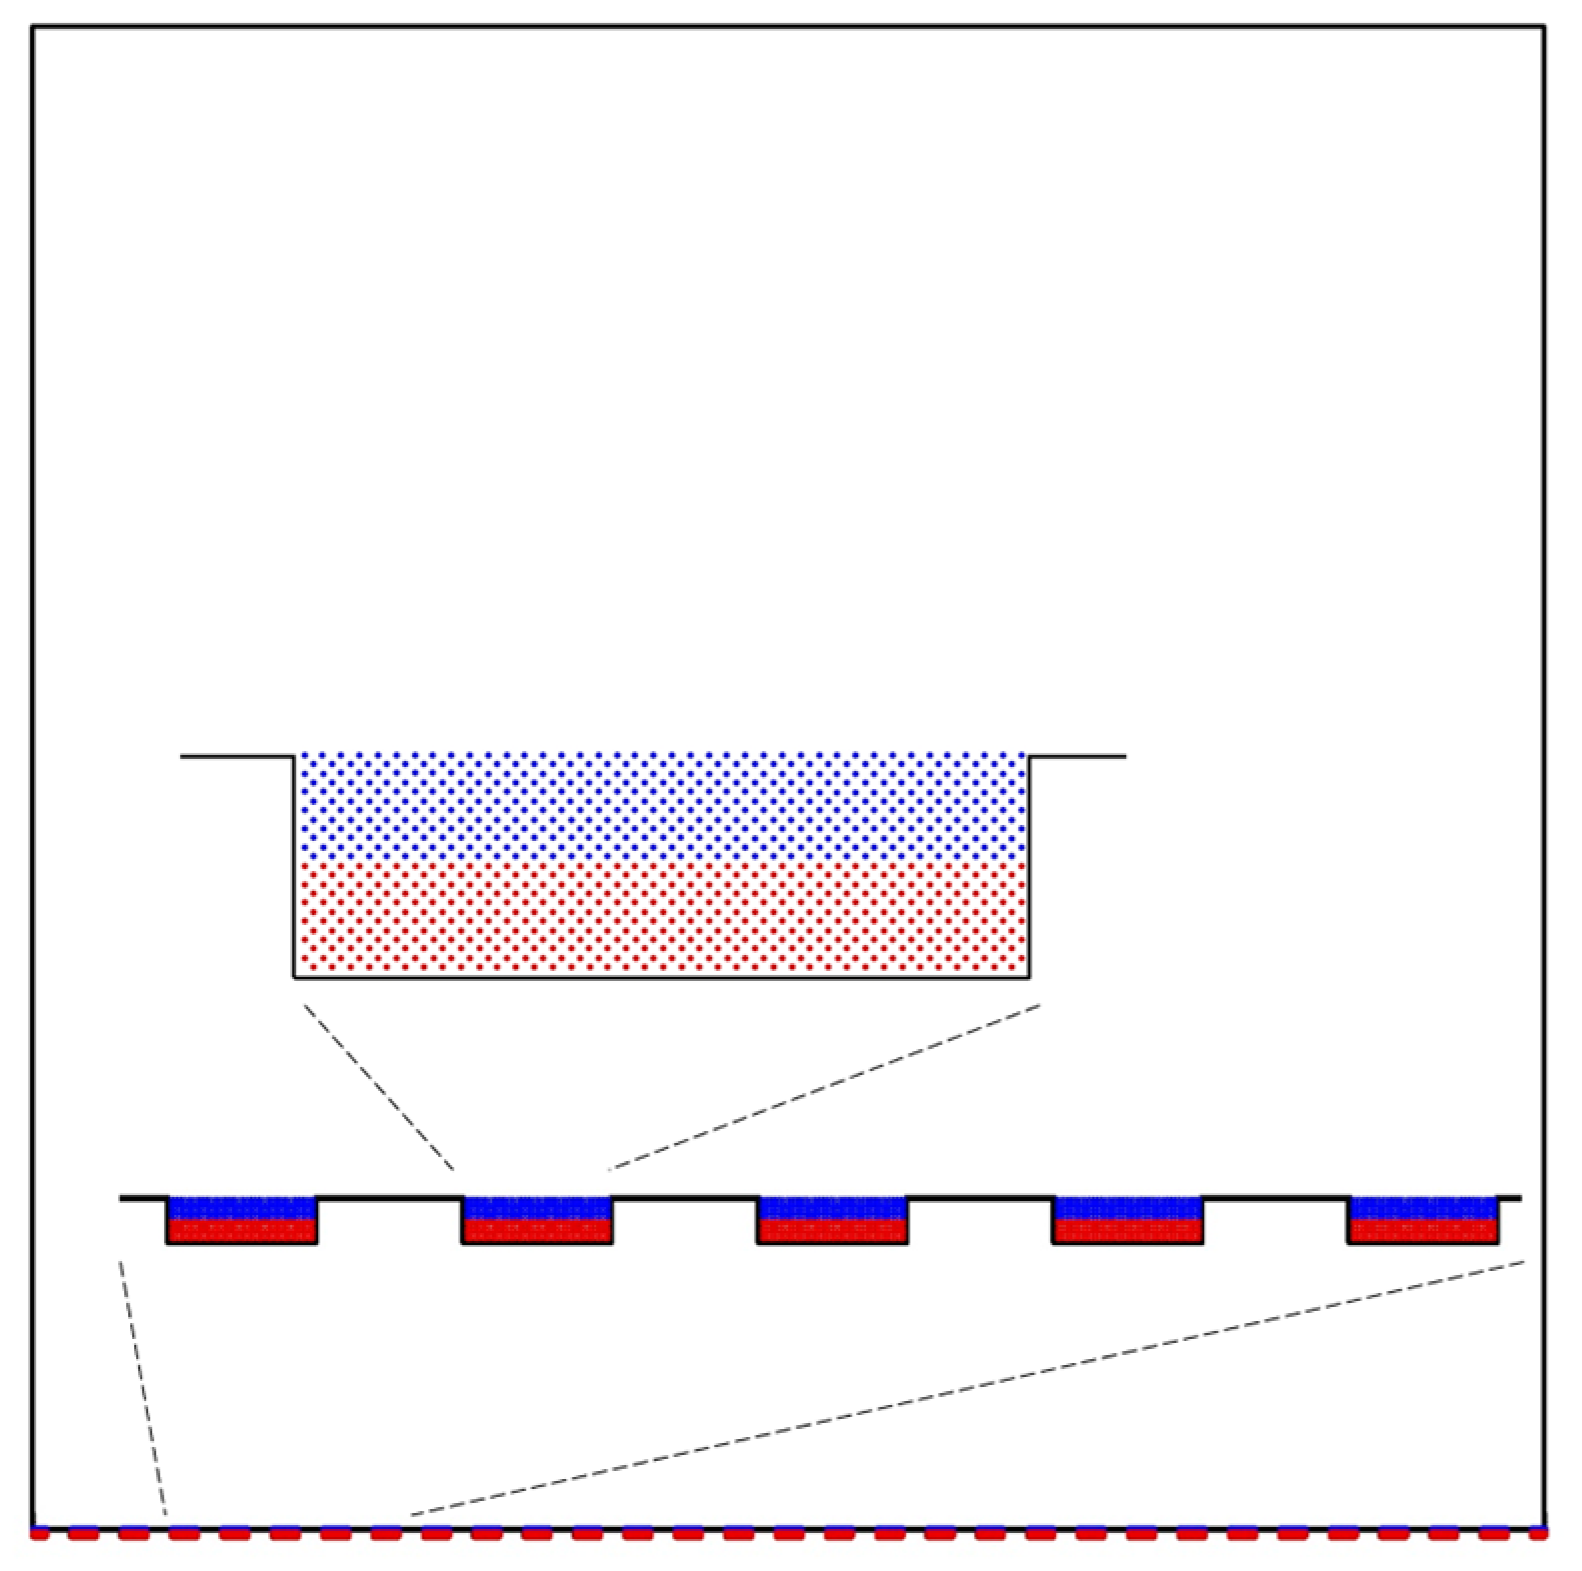
2.1. Computational Domain

The model is set up in ANSYS Fluent [47] and comprises a 2D section of the gas–fluid domain above the impinged structured surface. The dimensions of the domain are 3 mm × 3 mm. Top and bottom boundaries are defined as walls. The top boundary is placed at a sufficient height so that it is not affected by splashing upon droplet-film impact. The bottom boundary represents the structured surface, whereby a detailed resolution of the cavity structure is ensured (Figure 1a). Cyclic periodic conditions are imposed on the flow at the lateral boundaries. The geometrical parameters are summarized in Table 1. As a starting condition, the structures of the bottom surface are entirely covered by a static liquid film with a flat surface. Droplets are consecutively inserted into the domain according to a pre-defined spatio-temporal pattern. Specifically, a constant vertical distance between insertion position of droplets and the impinged surface is prescribed. The horizontal positions were selected from a random uniform distribution. The time intervals between droplet insertions are constant. The domain is discretized by a structured mesh consisting of 392,400 quadratic cells. A two-step mesh refinement based on the cut-cell method is realized in vicinity of the structured surface (Figure 1b). Cell sizes range between 1.25 µm and 5 µm.

2.2. Material Properties

The material parameters used in the model relate to a copper chloride etching solution (Table 2). The composition of the aqueous etching solution is as follows: CuCl (1.871 g/L), CuCl2 (232.99 g/L) and HCl (394 mL/L). The properties of the etching solution were measured at a temperature of 50 °C. Surface tension was measured by Krüss GmbH employing the Wilhelmy plate method [48] using a KRÜSS Force Tensiometer—K100 (Krüss GmbH, Hamburg, Germany). Viscosity was measured by Anton Paar GmbH using a rotational rheometer MCR xx2 with a C-PTD 200 tempering unit and a CC27/CX measurement system (all from Anton Paar GmbH, Graz, Austria).

2.3. Impingement Conditions

The selection of the impingement conditions was performed based on comparisons with experimental studies on droplet impingement. Four simulation cases were defined, representing a full factorial Design of Experiment (DoE), whereby two levels of film height and two droplet impingement velocities are considered. Droplet diameters and release rates are constant, ensuring that the same mass of fluid is added during the impingement process for each case. The selected droplet diameter is 150 µm, and the release rate is 1000 Hz. The droplet velocities on insertion are defined as 2.5 m/s and 5 m/s. The initial film heights prior to impingement are 0.25 mm and 0.5 mm. The droplet Reynolds numbers [49] are 368.34 and 736.69, which relate to Weber numbers [50] of 17.29 and 69.17, respectively. The impact forces [51] (i.e., the momentum flux per unit time [52]), are 5.50 µN and 11.00 µN per droplet. The dimensionless film heights [49] are 1.67 and 3.33. The impingement data are summarized in Table 3. The aforementioned conditions, which were imposed on the numerical model, correspond well to published experimental studies on droplet impingement related to spray etching [52,53], as, for example, overall Sauter Mean Diameters (SMDs) of 102.6 µm–110.6 µm, average axial droplet velocities of 4.6 m/s–7.47 m/s and average droplet impact forces of 0.87 µN–1.41 µN were investigated in [53]. Overall SMDs of 160 µm–200 µm, average axial velocity of 6.5 m/s–9 m/s and average impact force of 1.5 µN–3.5 µN were studied in [52]. The film height resulting from a general continuous spray impaction process of water droplets from a full-cone air atomizing nozzle was experimentally studied by Ma et al. [54]. They performed spatially and temporally resolved measurements of water film thickness by the Laser-Induced Fluorescence (LIF) method. The droplet Reynolds numbers in their study were between 127 and 253. They identified an impaction zone and a free flow zone, whereby the impaction zone is characterized by strong fluctuations and a reduced average film thickness (0.33 mm–0.73 mm) compared to the free flow zone (1.20 mm–2.27 mm).

2.4. Governing Equations

The model relates to two-dimensional, laminar, iso-thermal and incompressible flow conditions. Gas and liquid phases are immiscible. The VOF method is employed for tracking the phases, which solves the mass conservation equations of the phases q on a per-phase level [55]. Accordingly, mass conservation for a phase q is given by:
t ρ q α q + · ρ q α q v = 0
t denotes time; α q is the volume fraction; ρ q is the mass density; and v is the velocity vector. If n phases prevail, the volume fraction for the n-th phase is obtained from the condition that the volume fractions of all phases sum up to unity:
q = 1 n α q = 1
The phases share the same velocity field, which is a significant feature of VOF models [55]. The conservation of momentum is defined as follows:
t ρ v + · ρ v v = p + · μ v + v T + ρ g + F
Here, ρ is the density; v is the velocity vector; p is the pressure; μ is the viscosity; g is the gravitational acceleration; and F is the force vector due to surface tension.
ρ and μ are obtained from a linear mixture rule:
ρ = q = 1 n ρ q α q
μ = q = 1 n μ q α q
F is computed from the Continuum Surface Stress (CSS) model proposed by Laufaurie et al. [56].

2.5. Computation Schemes

The pressure-based solver with the SIMPLEC (Semi-Implicit Method for Pressure Linked Equations-Consistent) method for pressure velocity coupling is used. Momentum and pressure are discretized with QUICK (Quadratic Upstream Interpolation for Convective Kinematics) and PRESTO (PRESsure Staggered Option), respectively. The volume fraction is discretized with a compressive scheme with sharp interface settings and implicit formulation. Time integration is performed with the first order implicit scheme. Time steps are adaptively selected by prescribing a Courant Friedrichs Levy (CFL) number lower or equal to 0.25.

2.6. Passive Tracer Tracking

The flow near the surface structures due to droplet impingement is analyzed with passive tracer particles. The particles are modeled as massless particles employing the ANSYS Fluent Discrete Phase Model (DPM). Particles are transported with the fluid with the particle velocity being identical to that of the flow ( v p = v ) [55]. As an initial condition, tracer particles are uniformly dispersed in relevant regions. Specifically, these regions are the cavities which are further subdivided into an upper half and a lower half, cf. Figure 2. The movement of tracer particles in the respective regions is statistically evaluated including re-entrainment into cavities.

3. Results

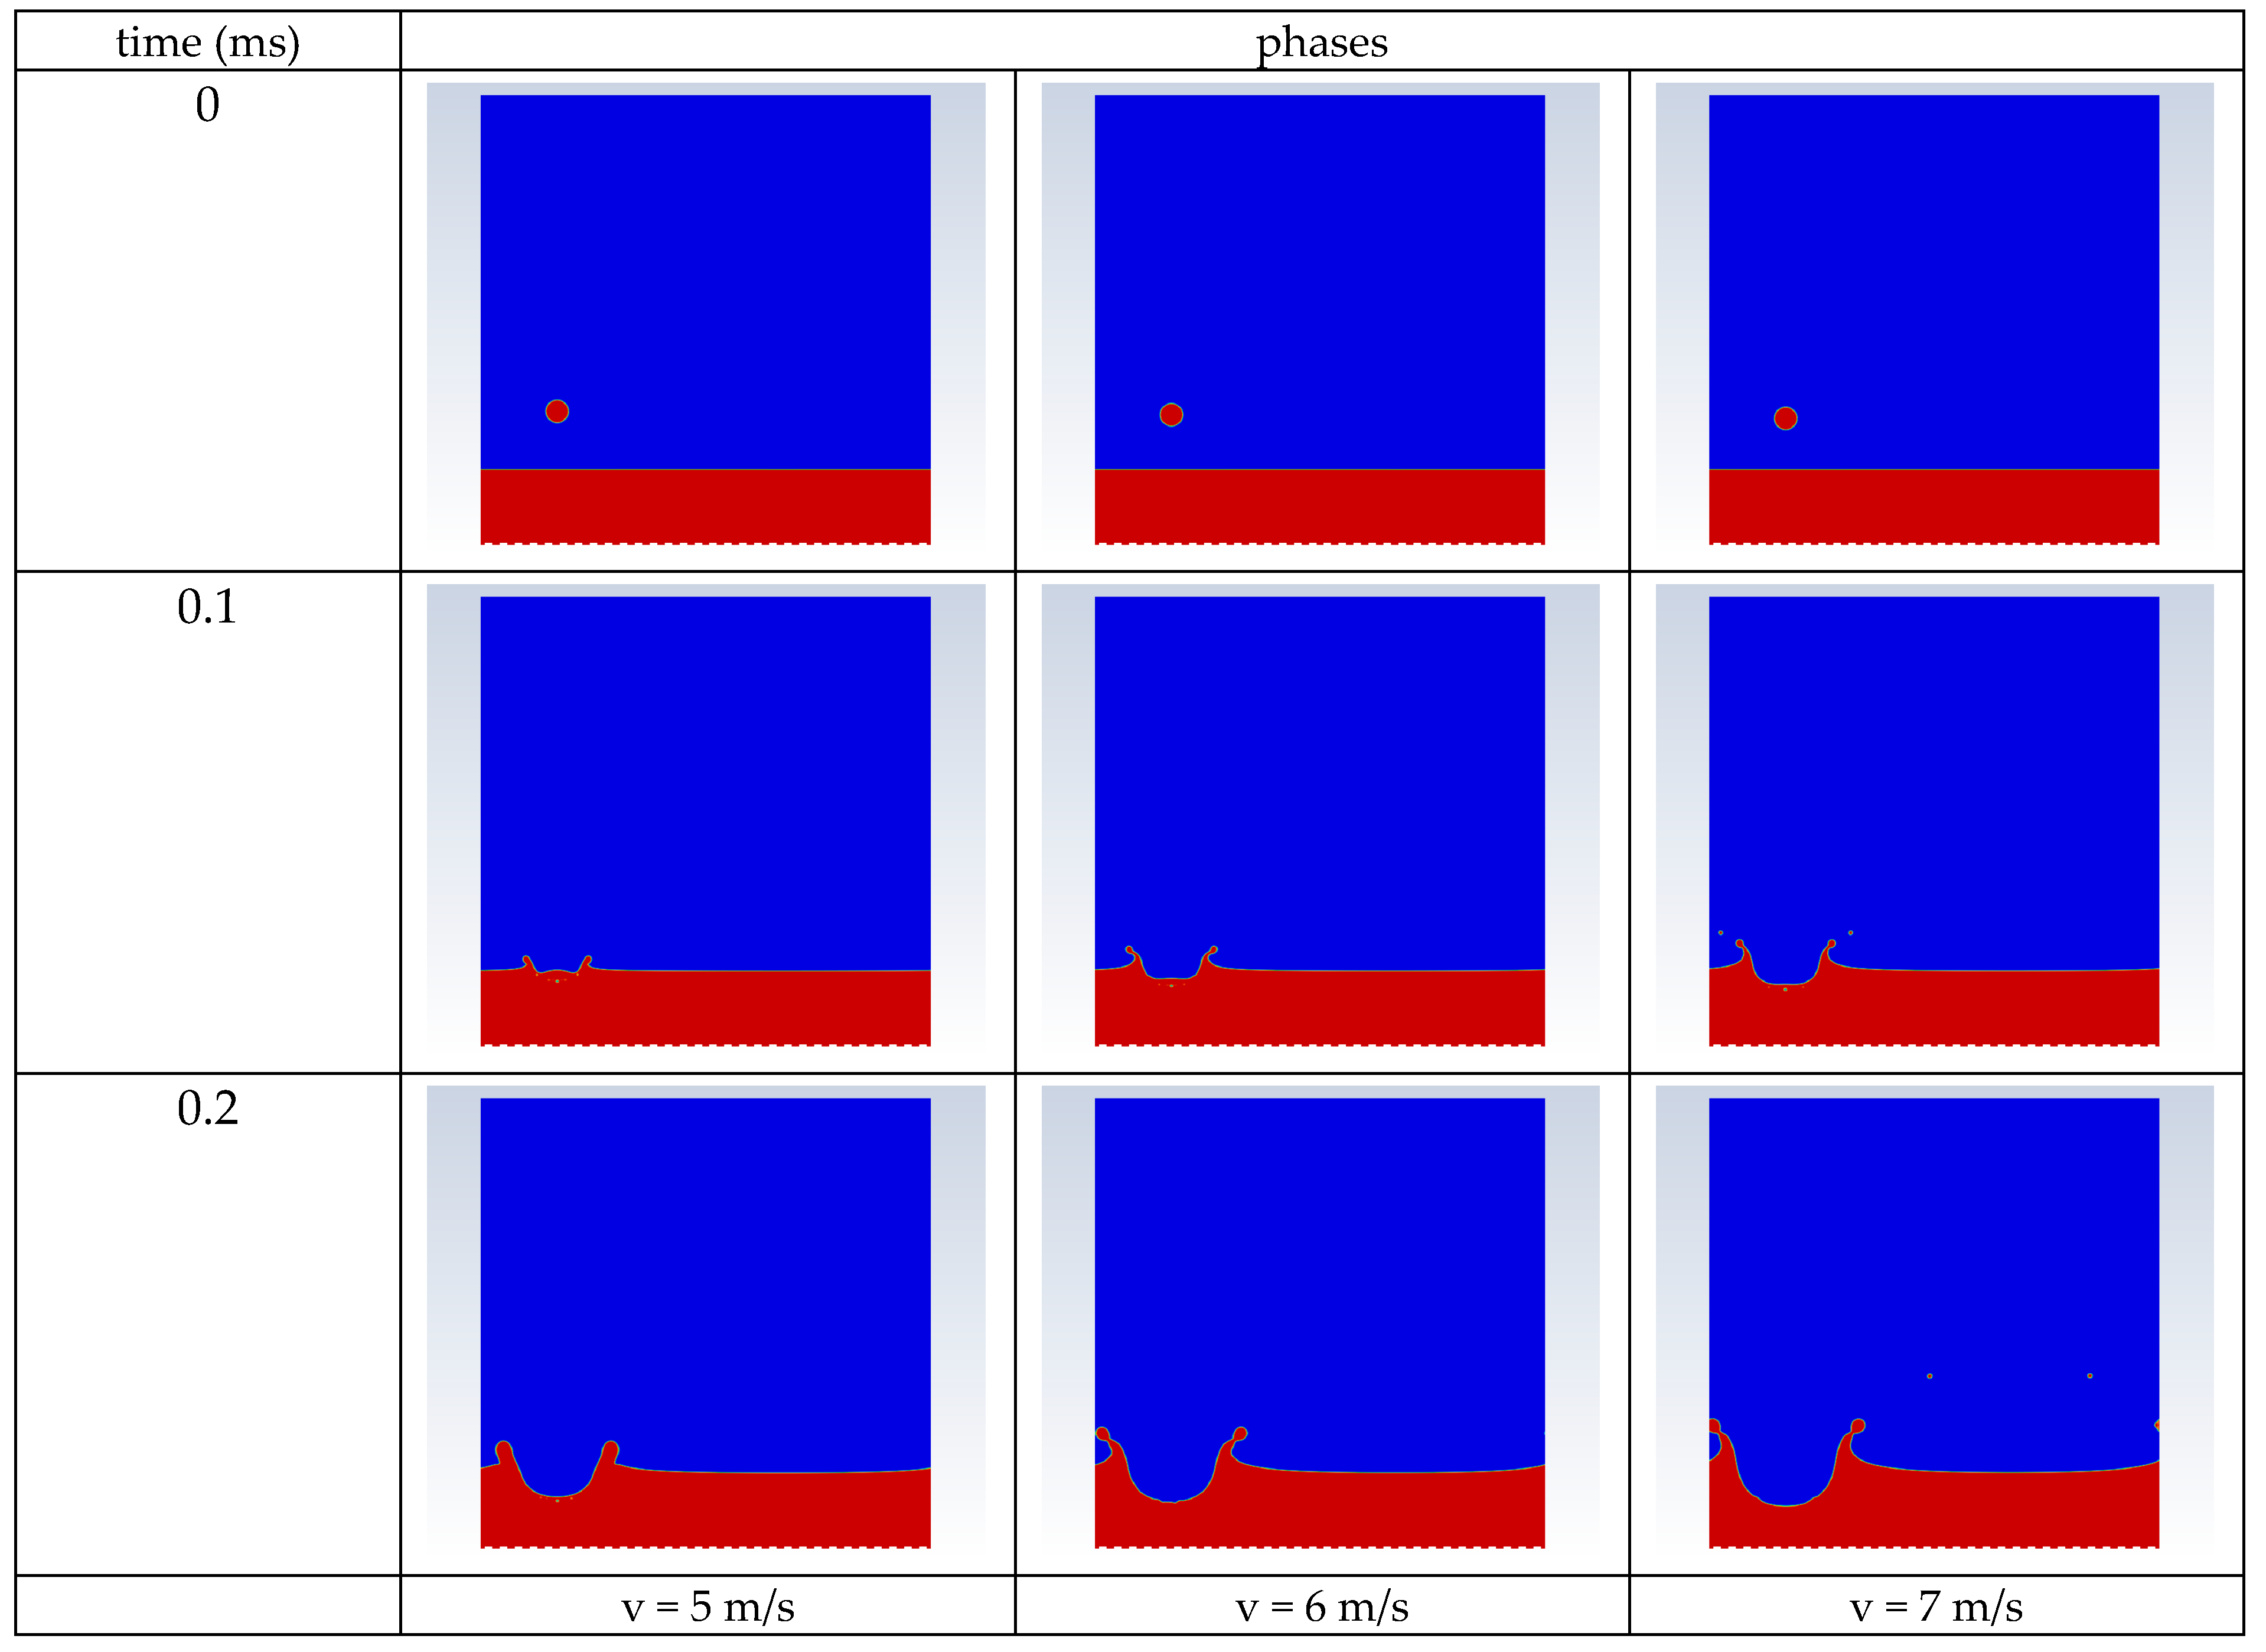
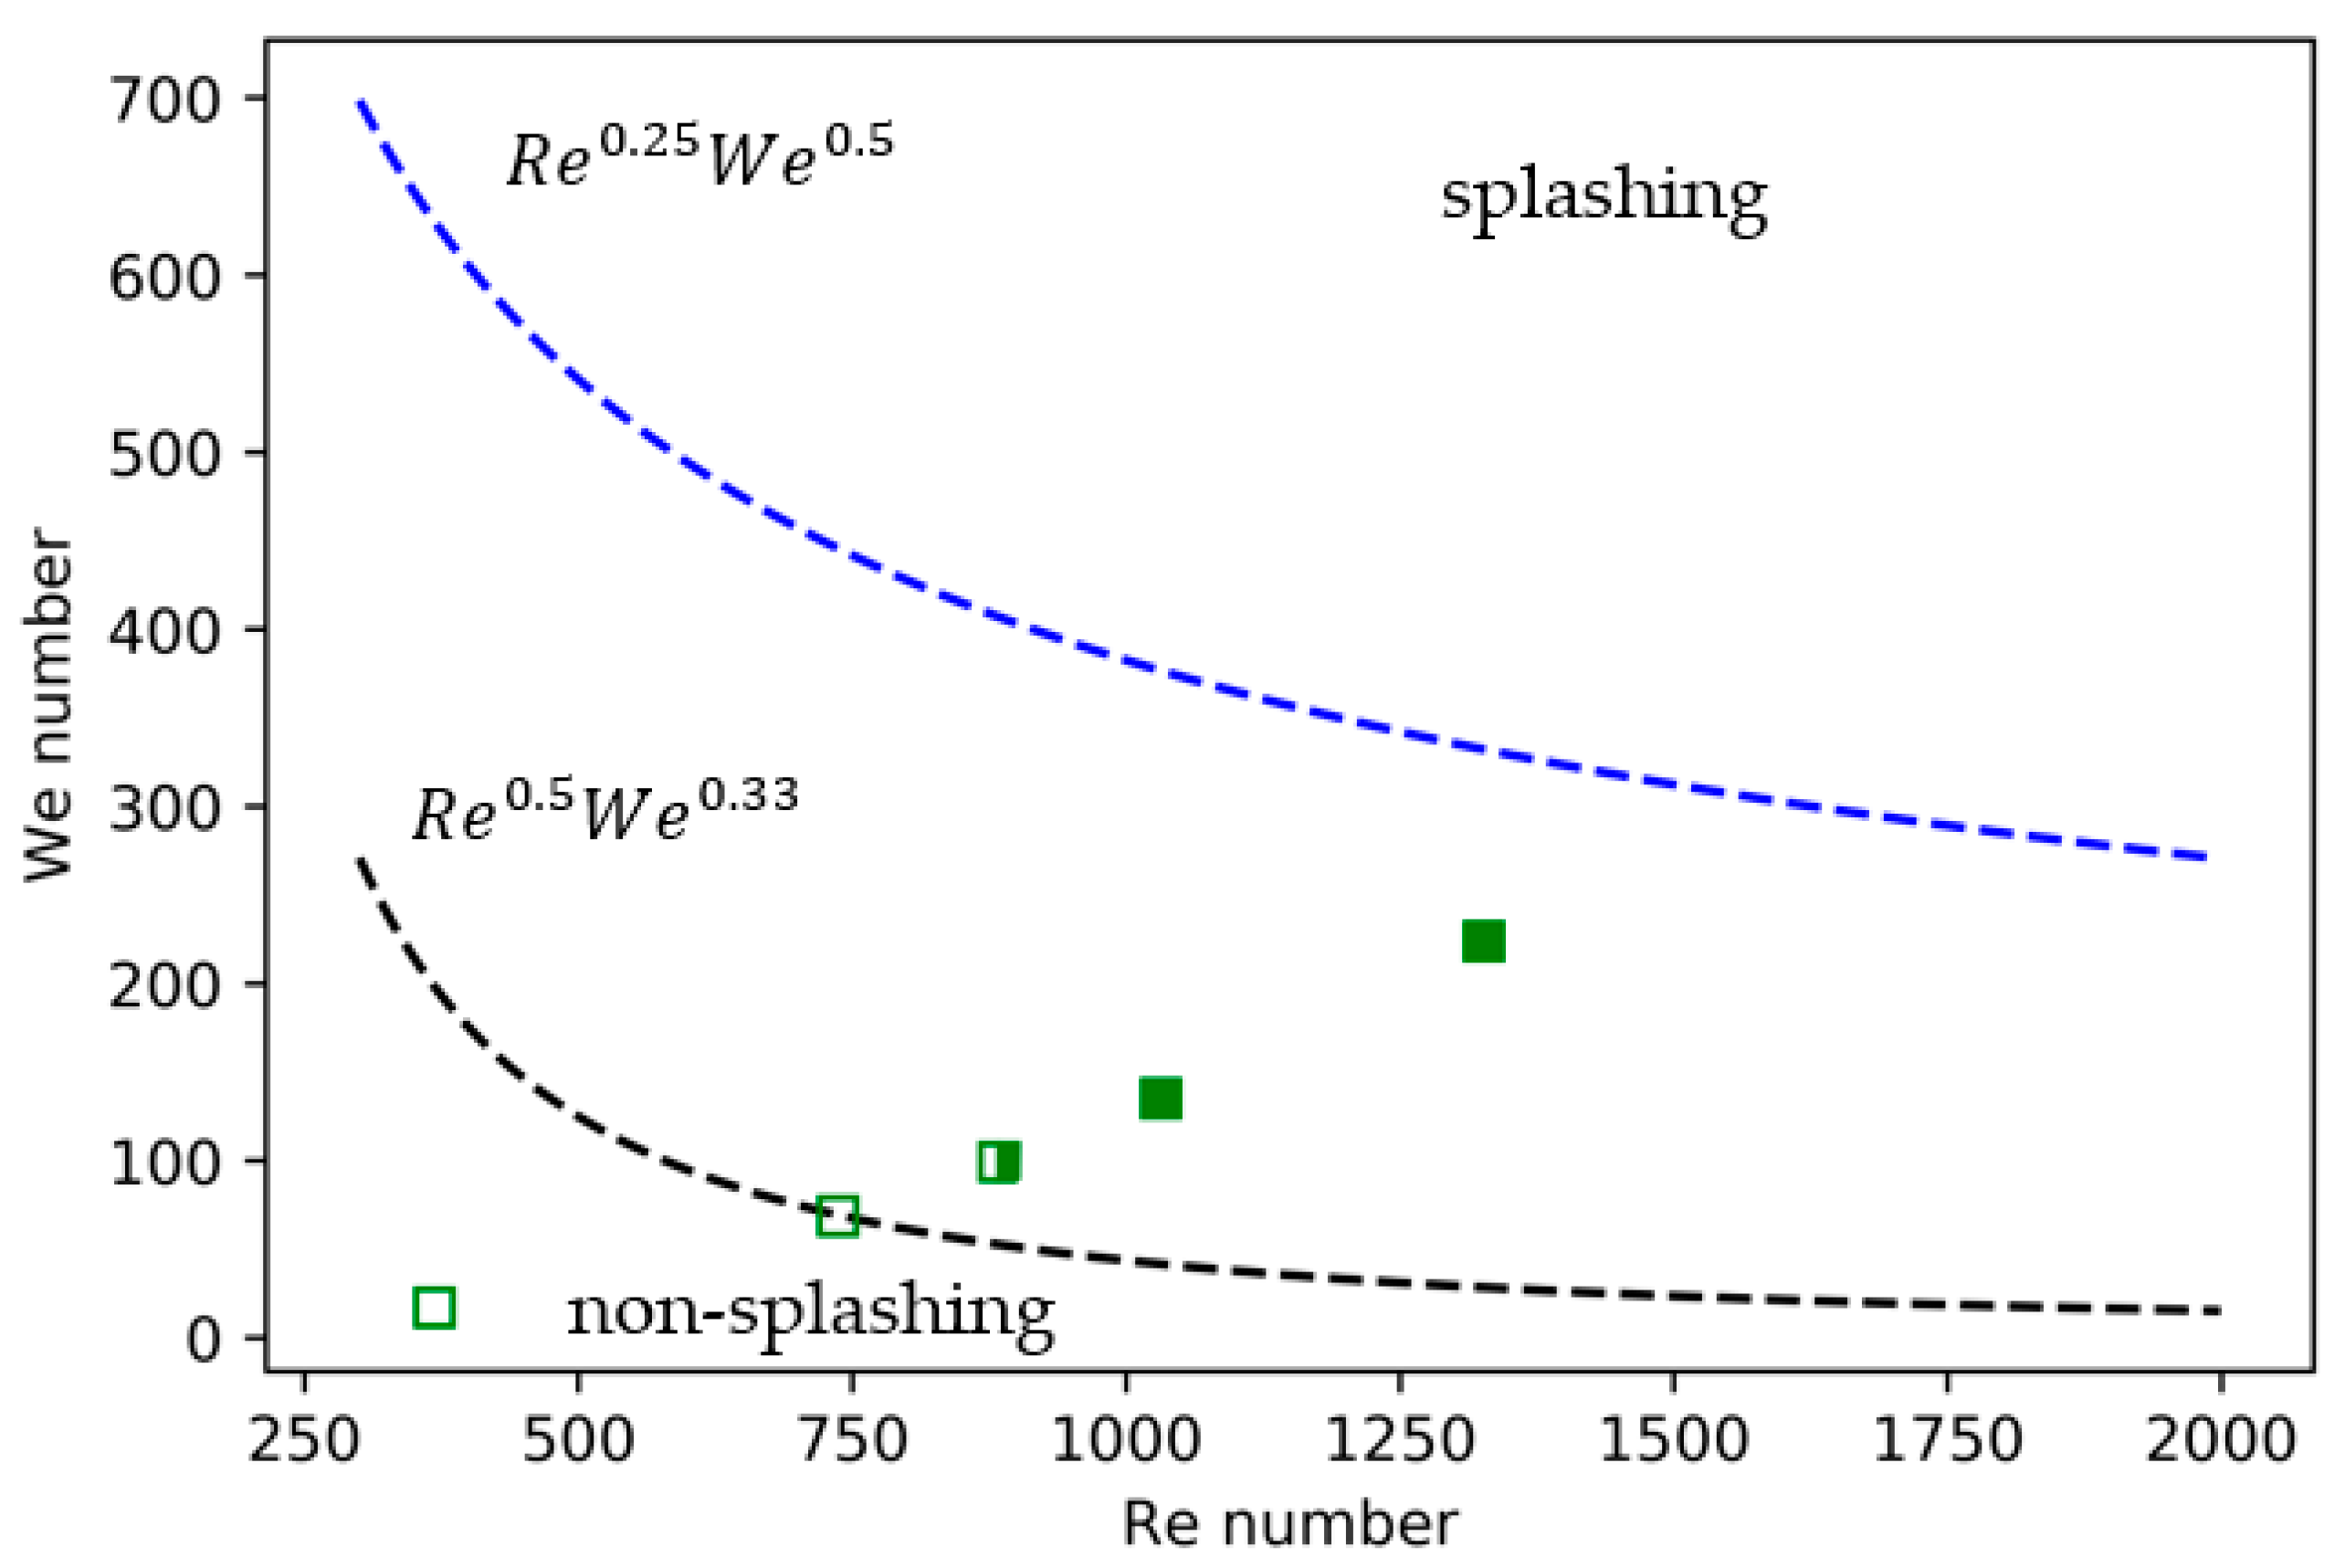
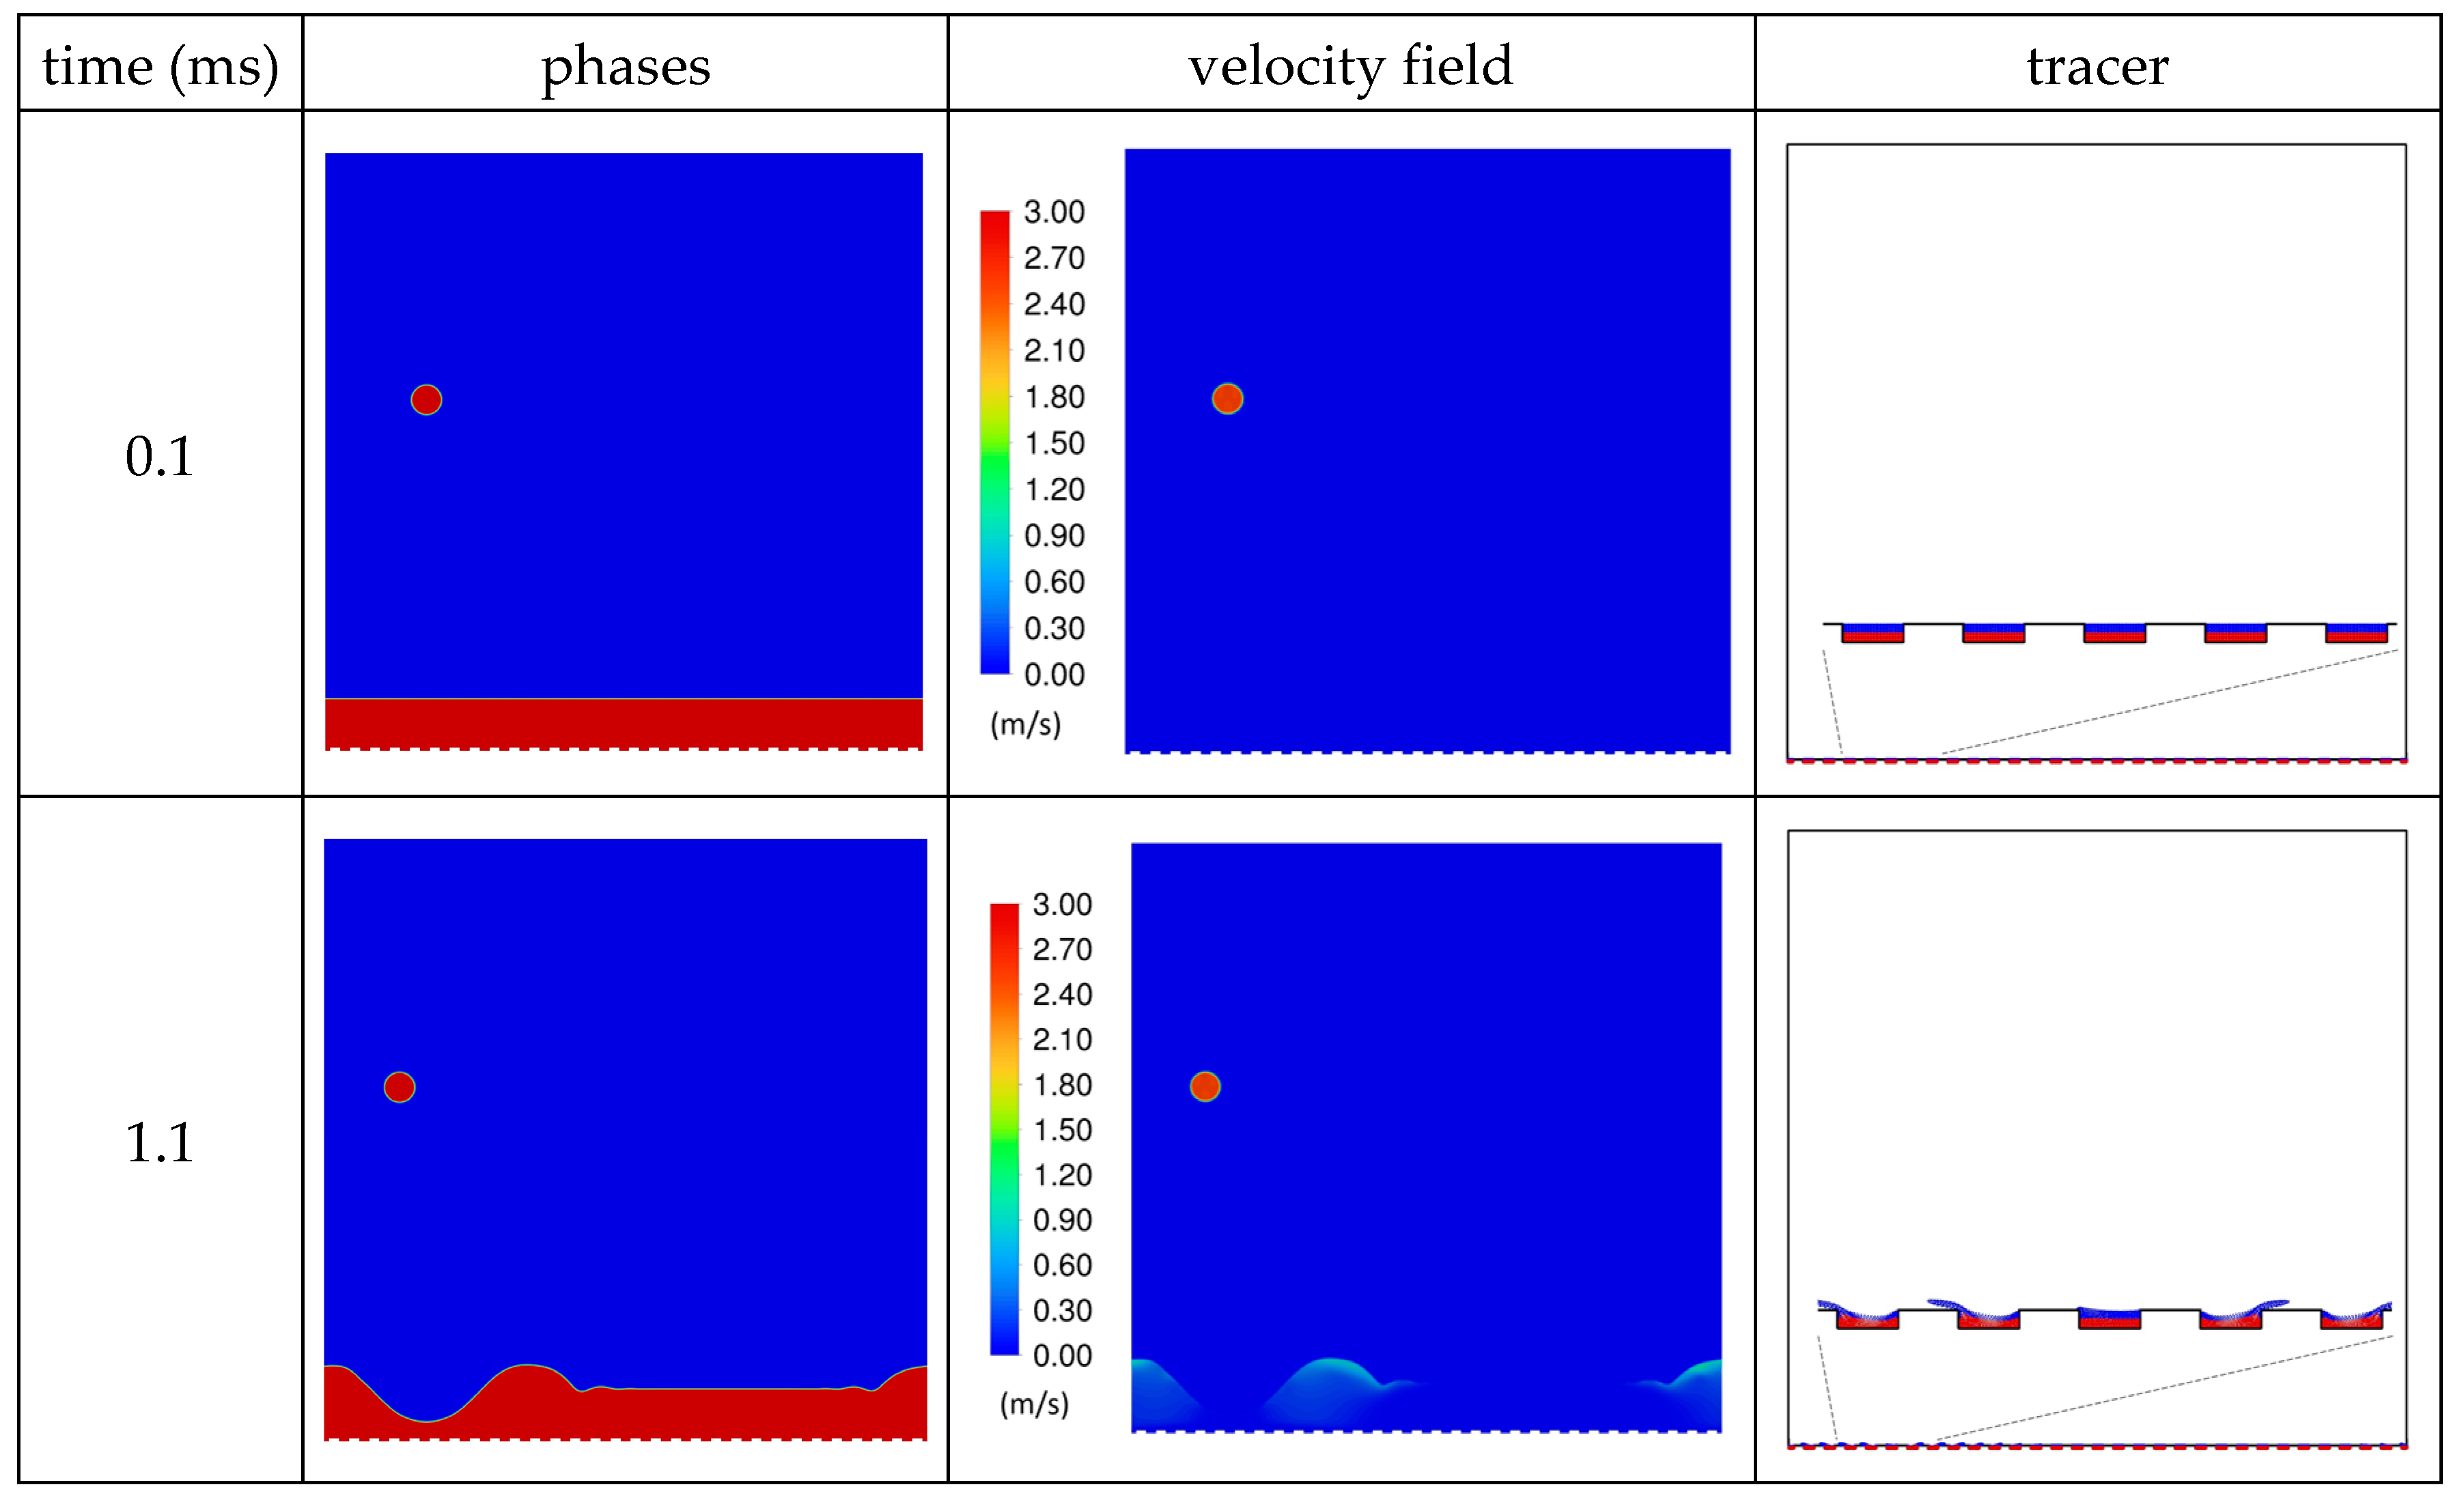
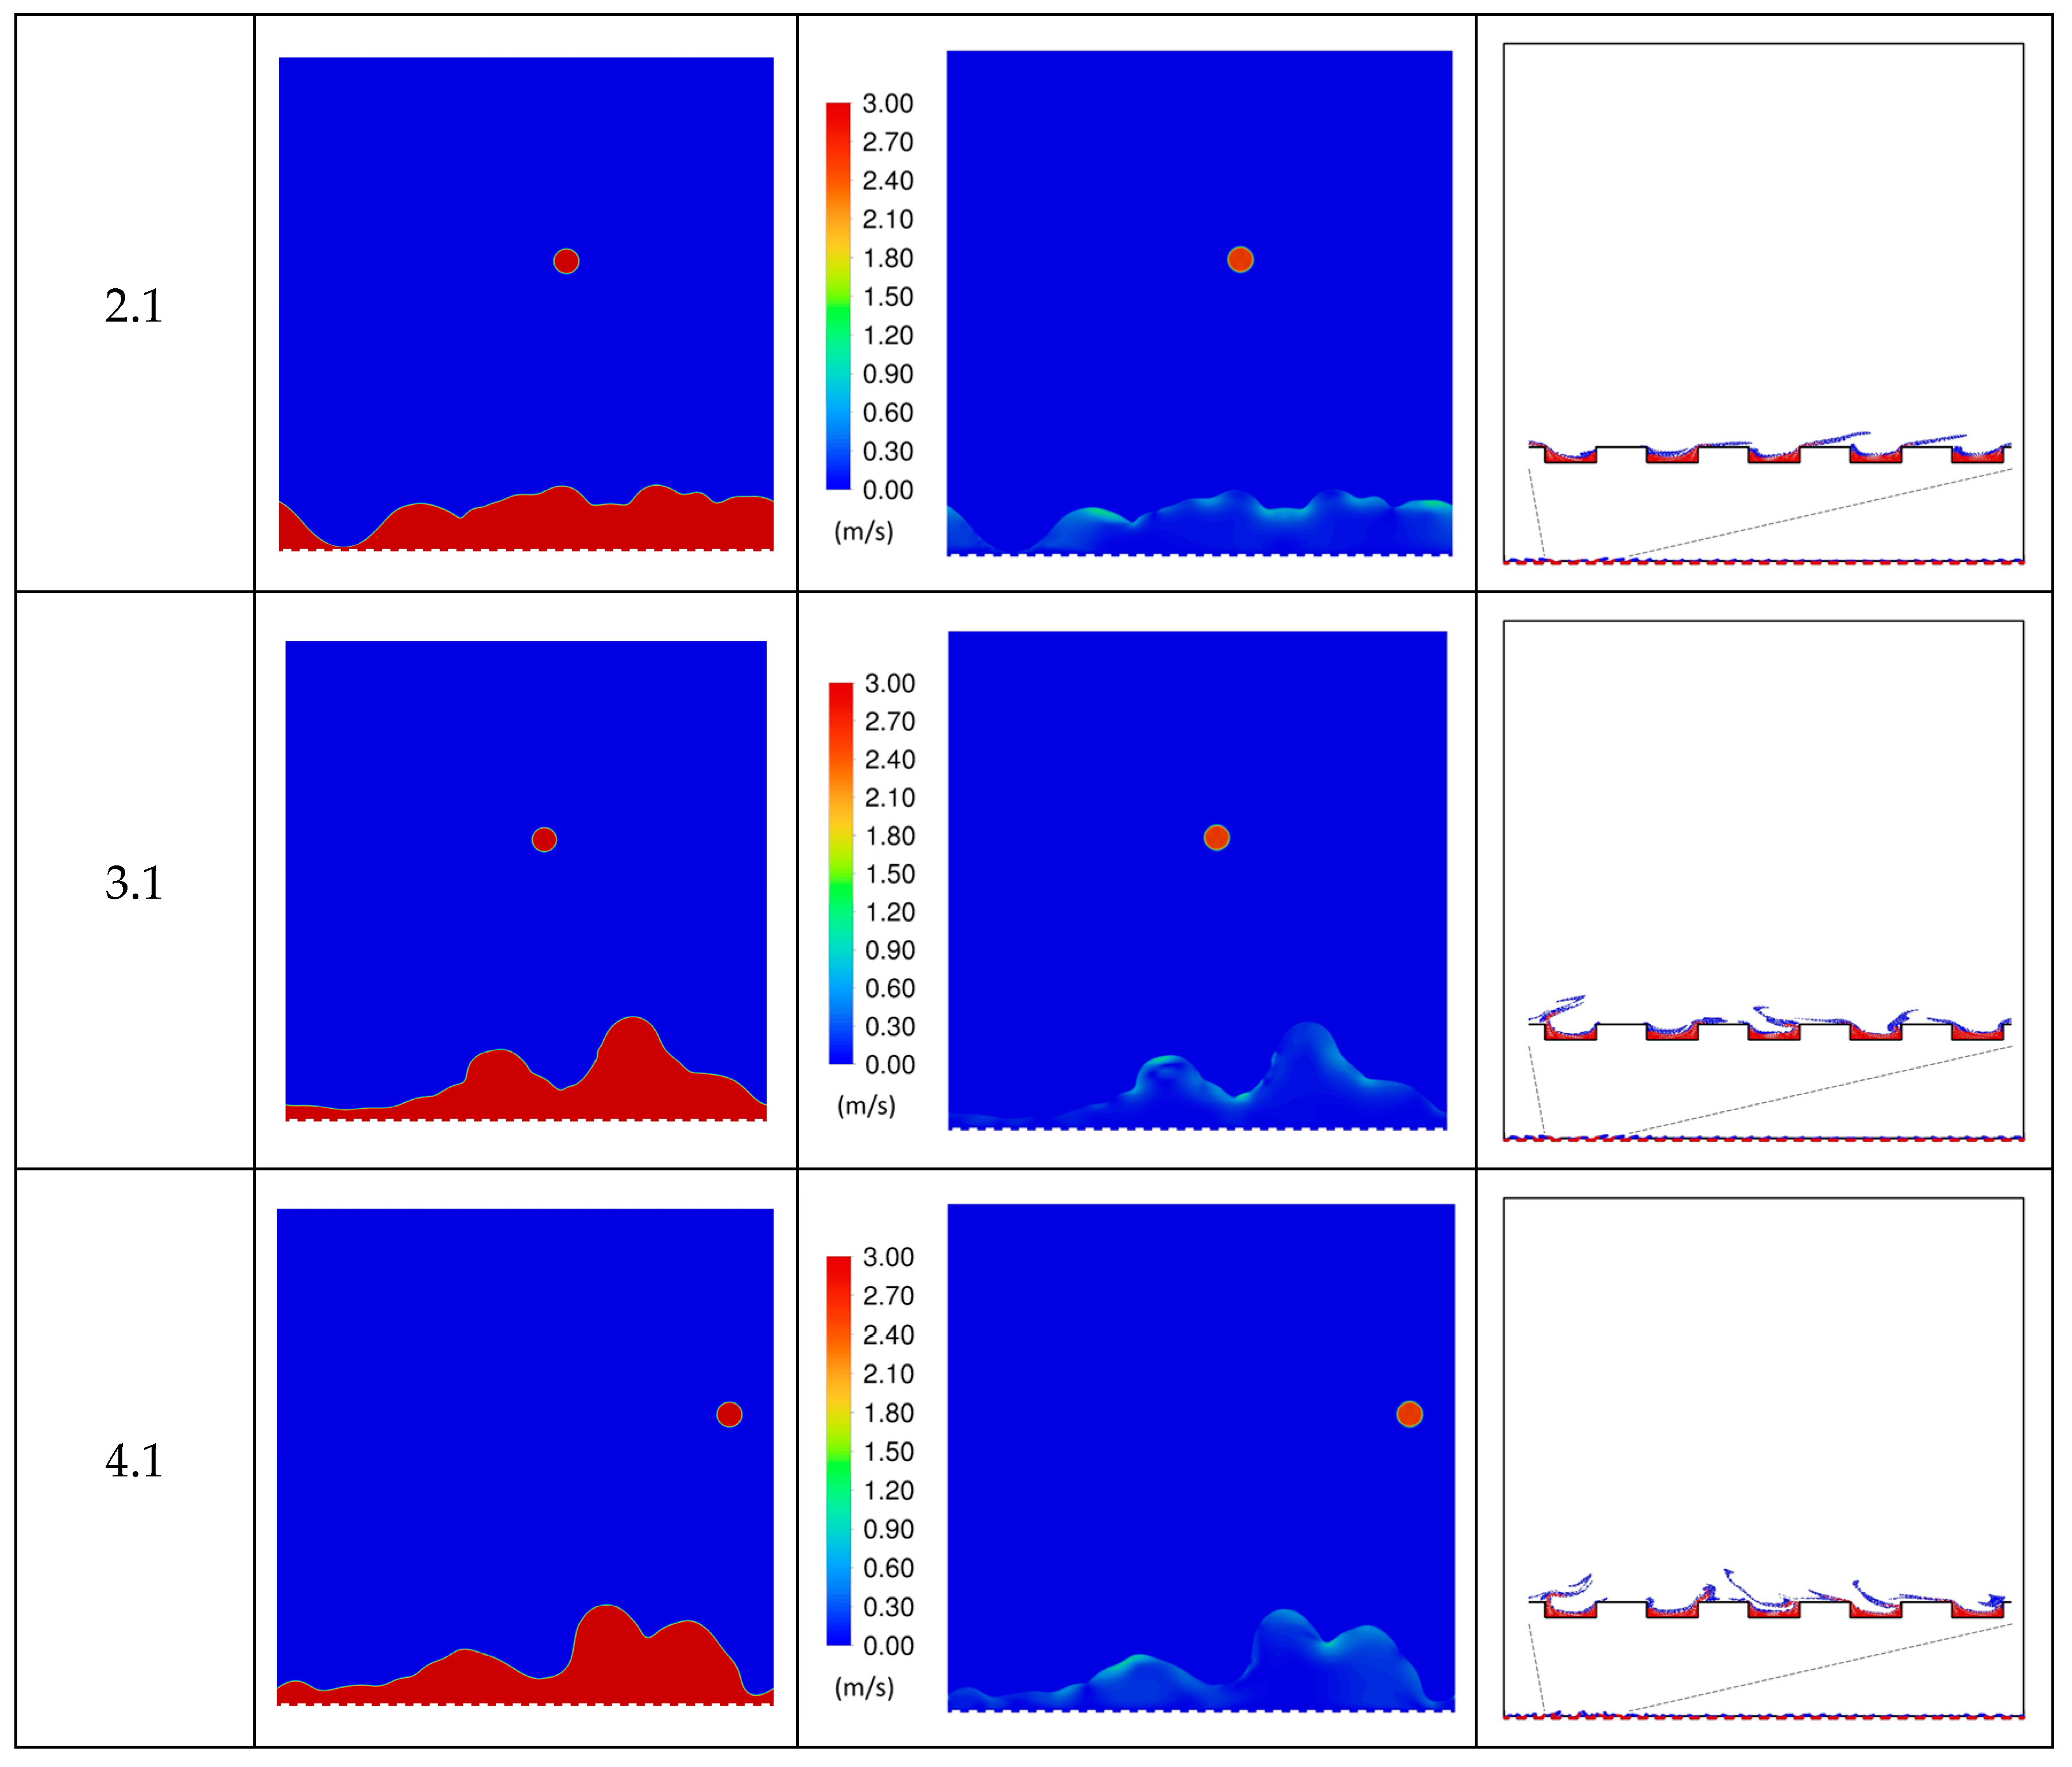
3.1. Film Dynamics on Droplet Impingement

The impingement of a single droplet with diameter of 150 µm to an initially quiescent liquid film of thickness 0.5 mm was evaluated for droplet impaction velocities between 2.5 m/s and 9 m/s. Figure 3 shows the temporal evolution of the impingement morphologies which are categorized as non-splashing (impaction velocity 5 m/s) and splashing (impaction velocity 7 m/s) with a transition at an impaction velocity of 6 m/s. These predictions are well in line with the splashing correlations for small-scale and large-scale droplet impaction proposed by Zhang et al. [36]. Figure 4 shows the model predictions together with the correlation lines for small-scale impaction (droplet diameter 40 µm) and large scale-impaction (droplet diameter 2 mm).
The physics of droplet impingement-induced flows in cavities is strongly determined by the disruptive nature of the droplet impingement events. Individual impingement events give insight into the convective flow entering and leaving the cavity. The investigation of the overall effect of droplet impingement parameters on the mass flow, however, requires statistical analysis, which will be provided in chapter 3.2. The film dynamics resulting from vertical impingement of droplets having an initial velocity of 2.5 m/s onto an initially quiescent liquid film of 0.25 mm thickness was monitored over time by snapshots of the film surface, the velocity field and the tracer dispersion (Figure 5). When the first droplet impinges onto the film surface, an indentation at the impingement spot is formed, which is accompanied by a both-sided lateral displacement of the liquid and pile-up of waves. With the impingement of further droplets, waves are excited all over the domain and interact with each other. The droplet-induced agitation of the liquid film is most pronounced at its free surface. In lower regions, agitation is much weaker, which is evident from the velocity fields. How the still present agitation in the lowest film regions affects mass exchange in and nearby the cavity structures was investigated by monitoring tracer dispersion. Two tracer species were introduced to this end at the beginning of the simulation, one covering the lower half of the cavities (red) and the other covering the upper half (blue). First of all, it is evident that the cavities below the impingement spots experience a pronounced mass exchange onto impingement. The mass exchange is driven by the normal component of the induced velocity field at the entries of the cavities. Two modes of flow can be discerned from tracer movement in the studied case. Either central inflow with lateral outflow (1) or lateral inflow with outflow at the opposing side (2) takes place. The deeper regions of the cavity, in particular the regions around concave corners, are most affected by stagnation. The lateral component of the flow field leads to a deflection of the tracer, especially in the main flow region, which carries tracer particles towards or away from cavity entries. Tracer particles which are already released into the main flow can be re-entrained into cavities. This results in a decrease in the efficiency of convective mass exchange between cavities and main flow.

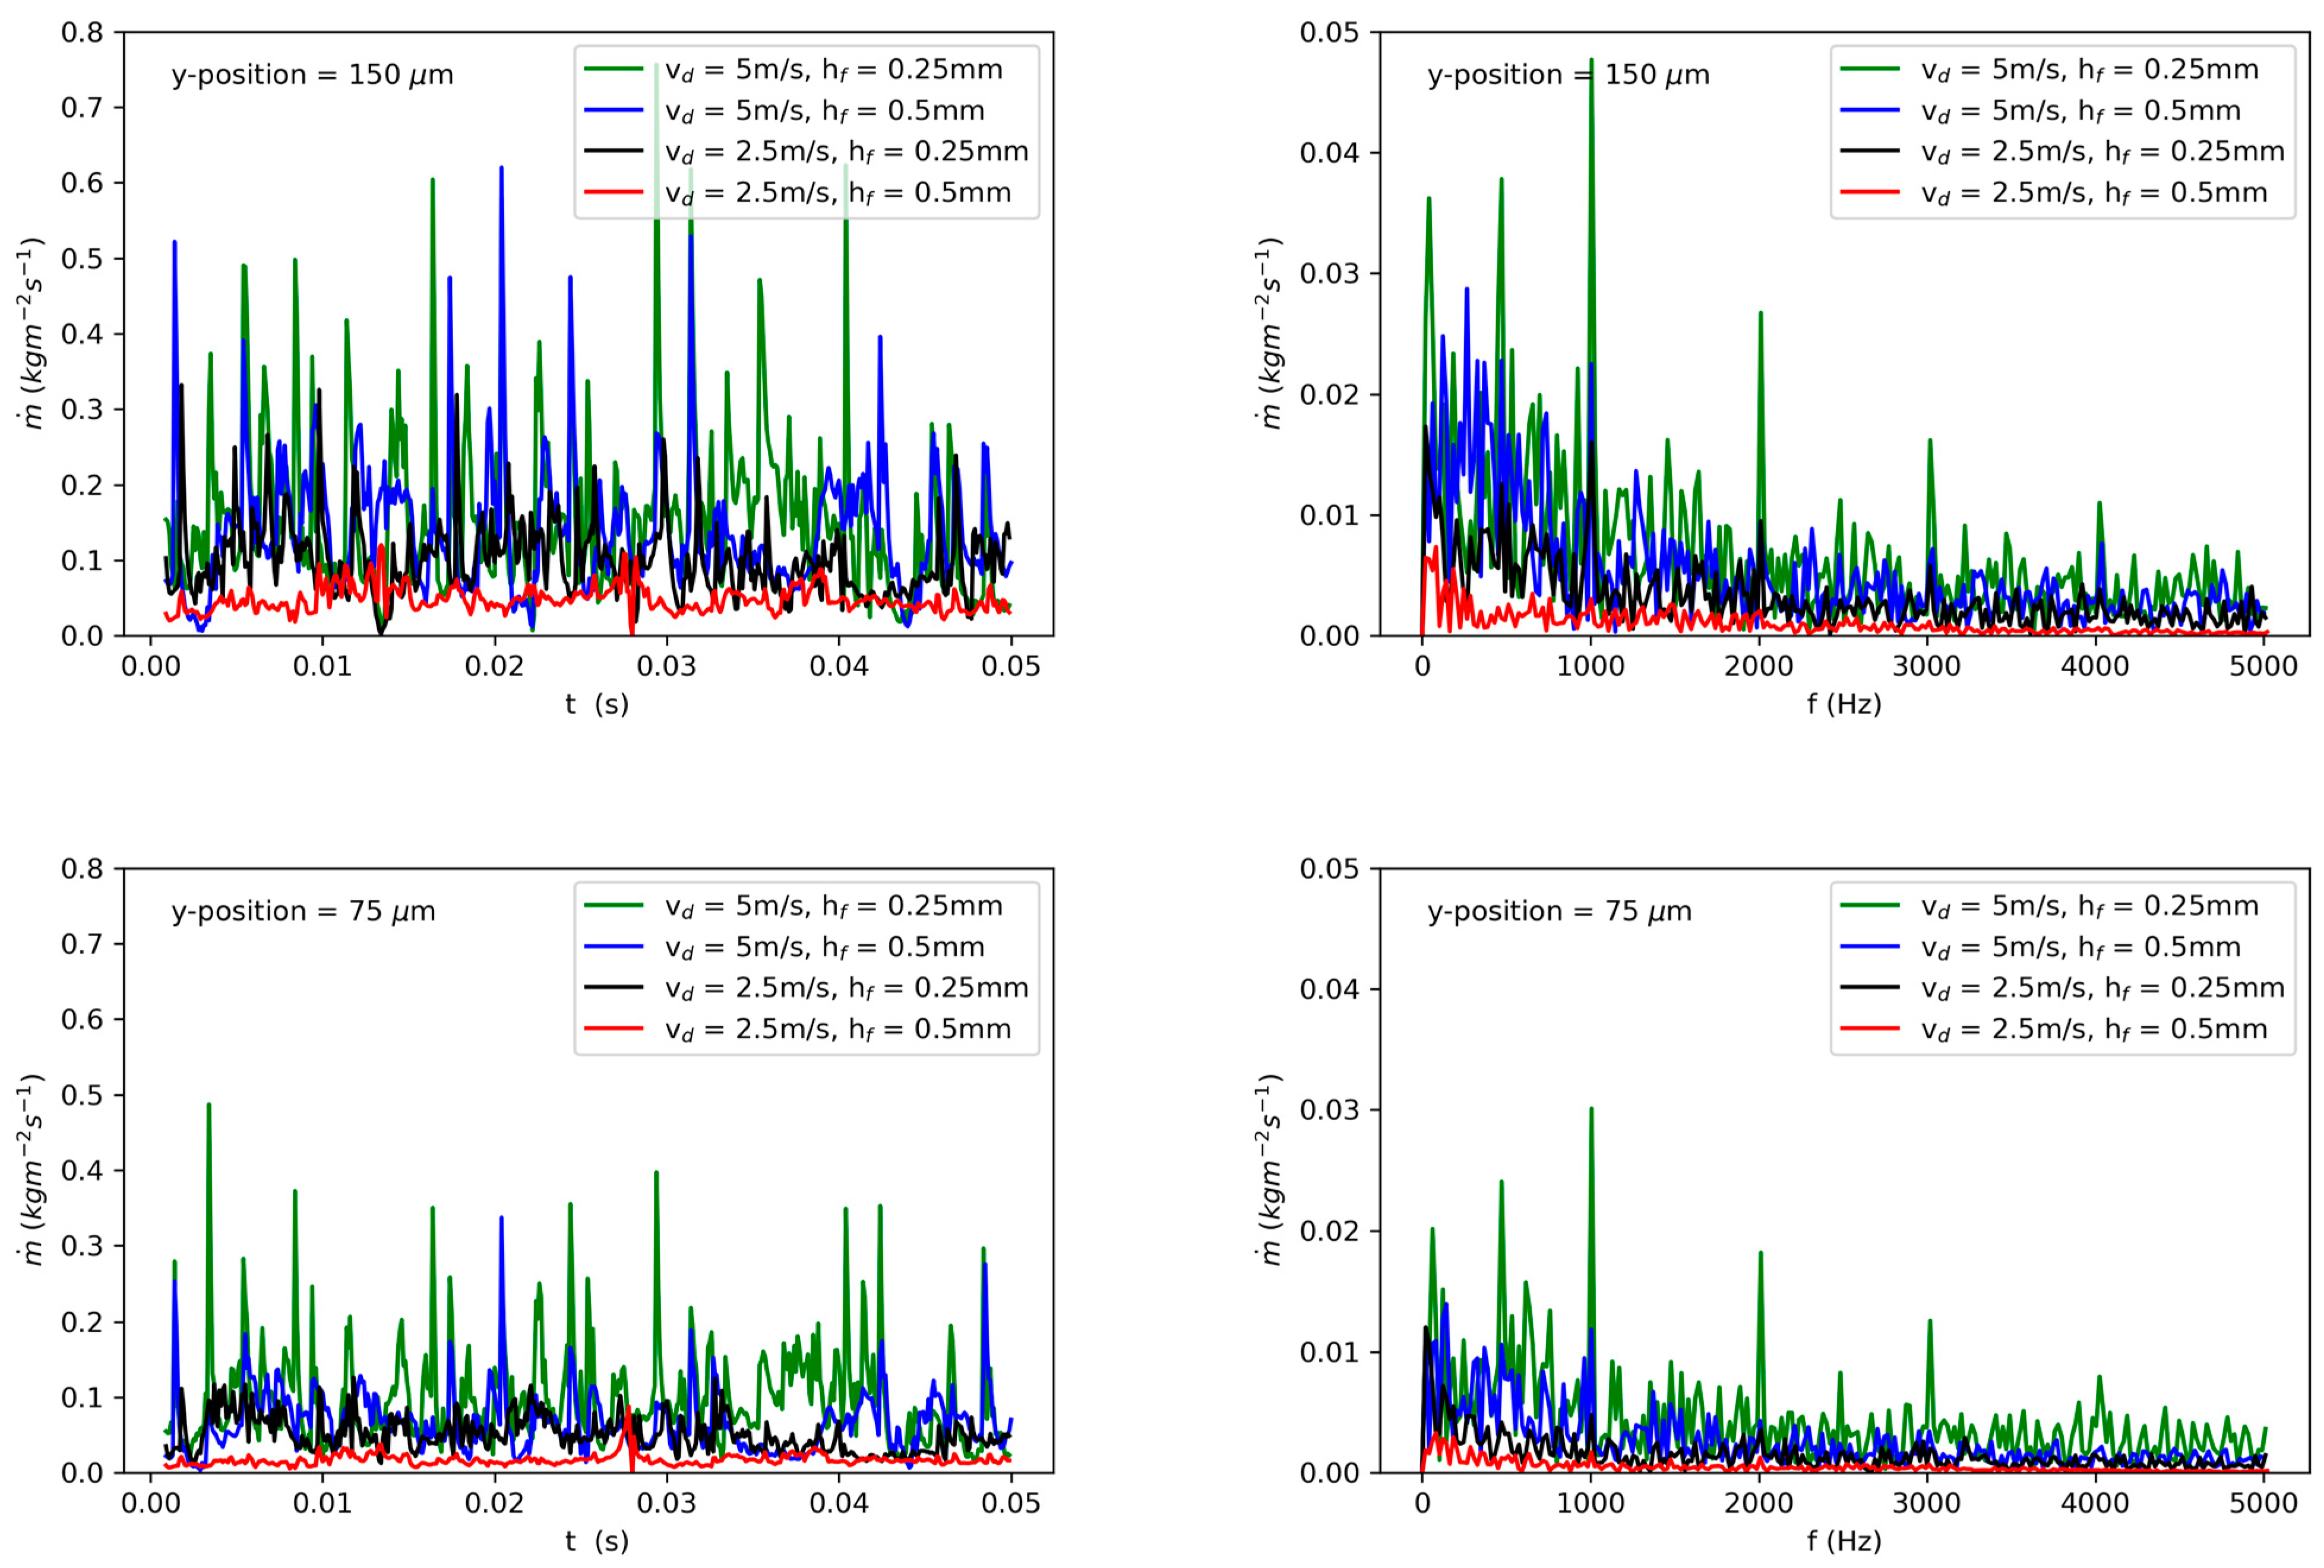
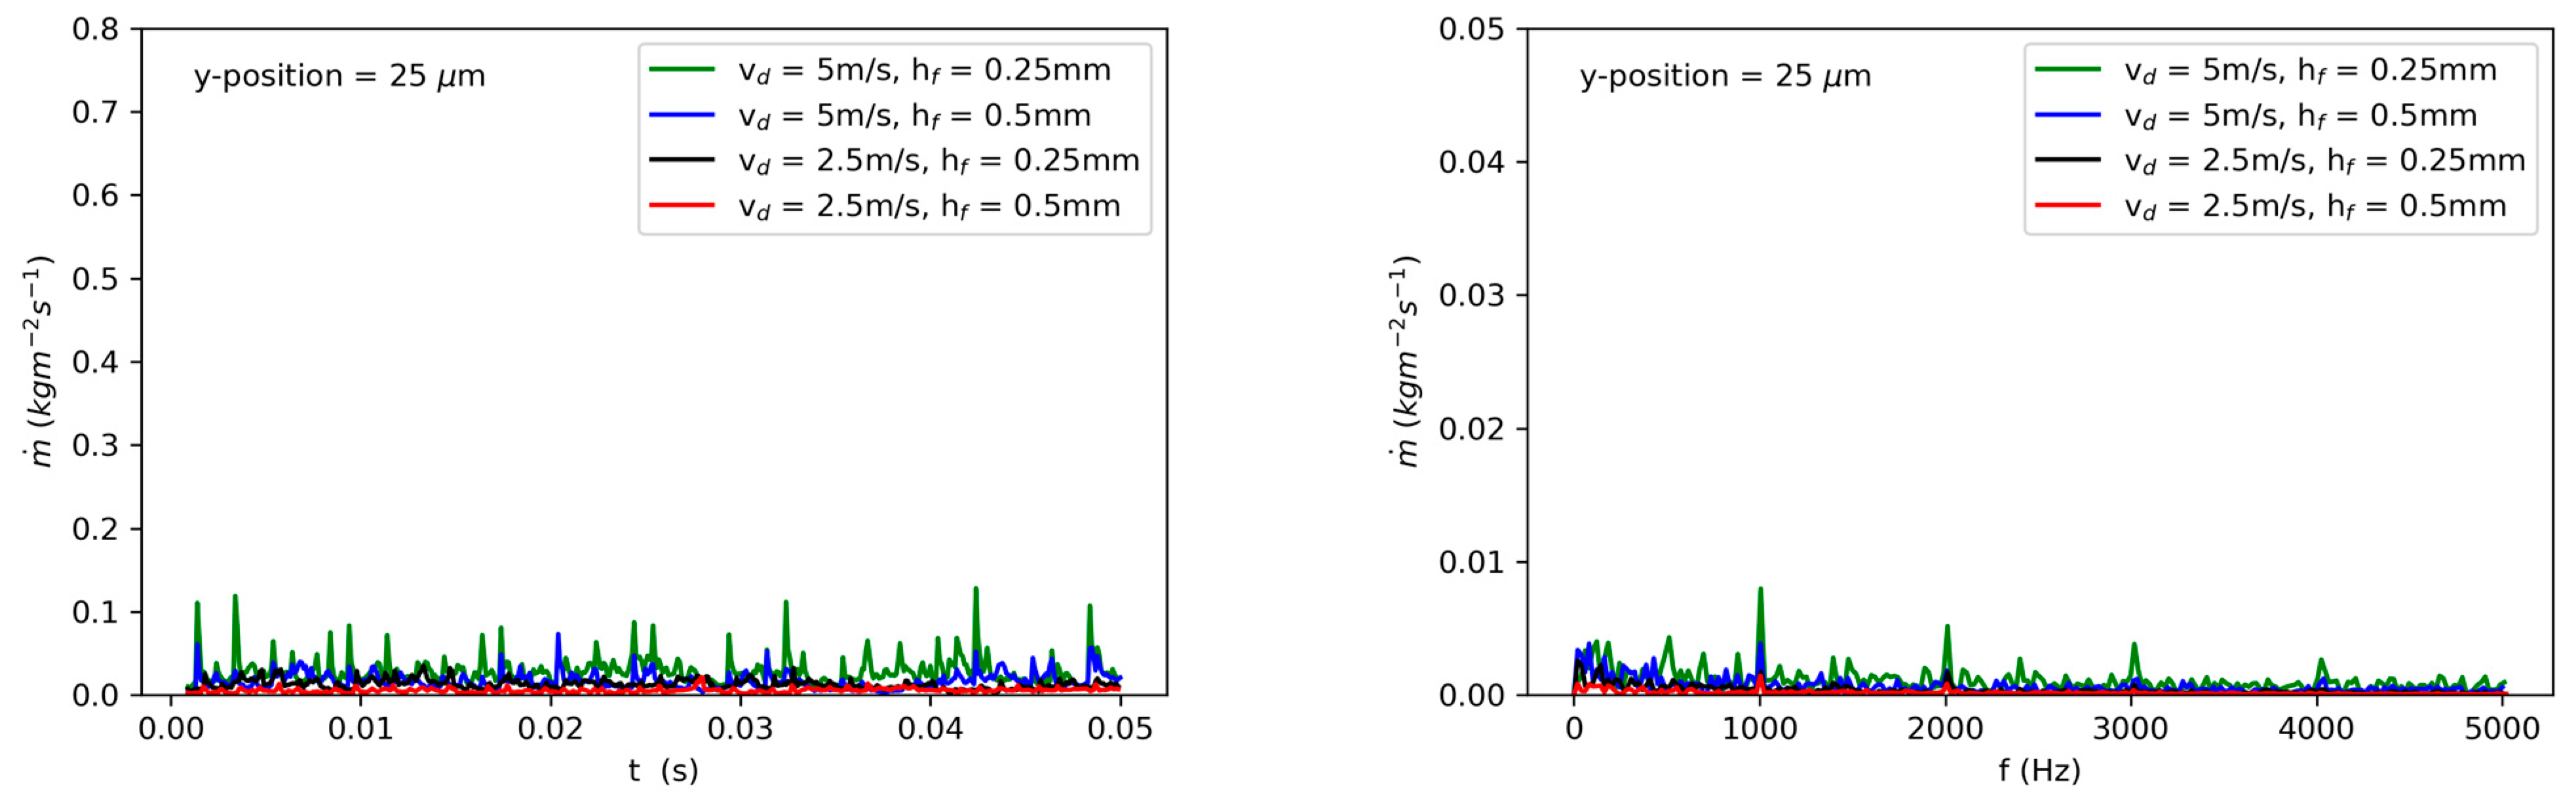
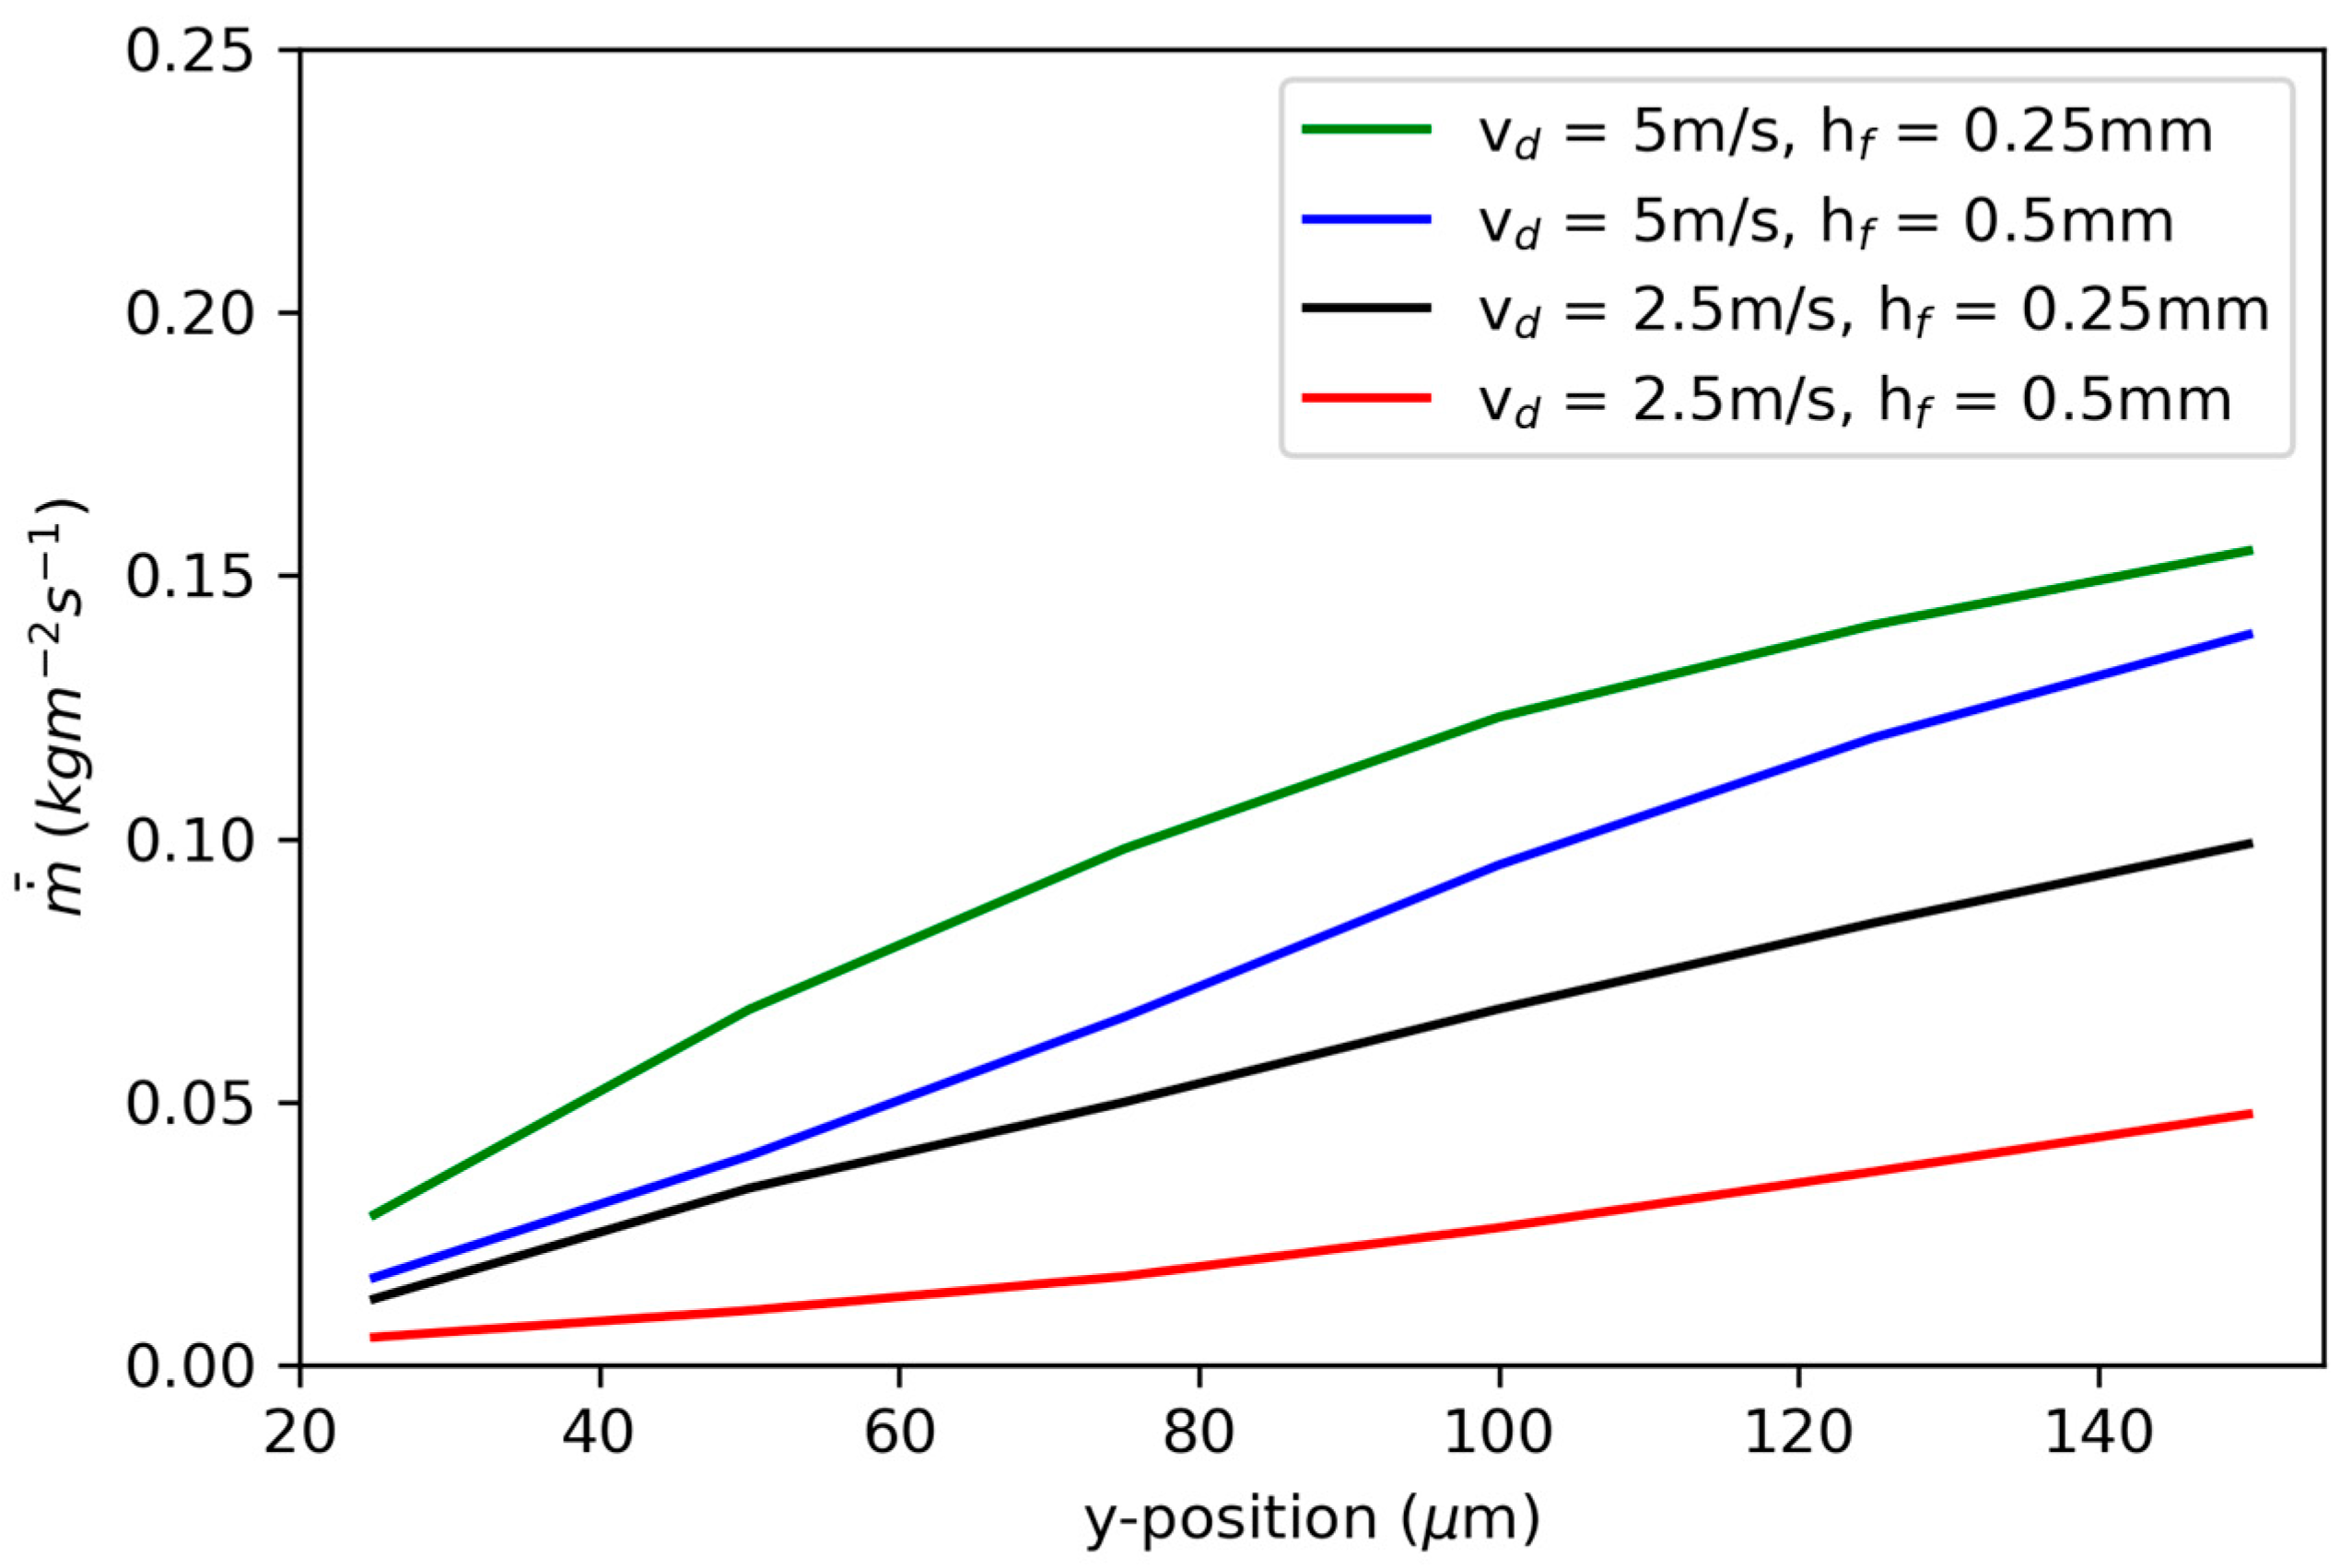
3.2. Convective Mass Transfer Rate
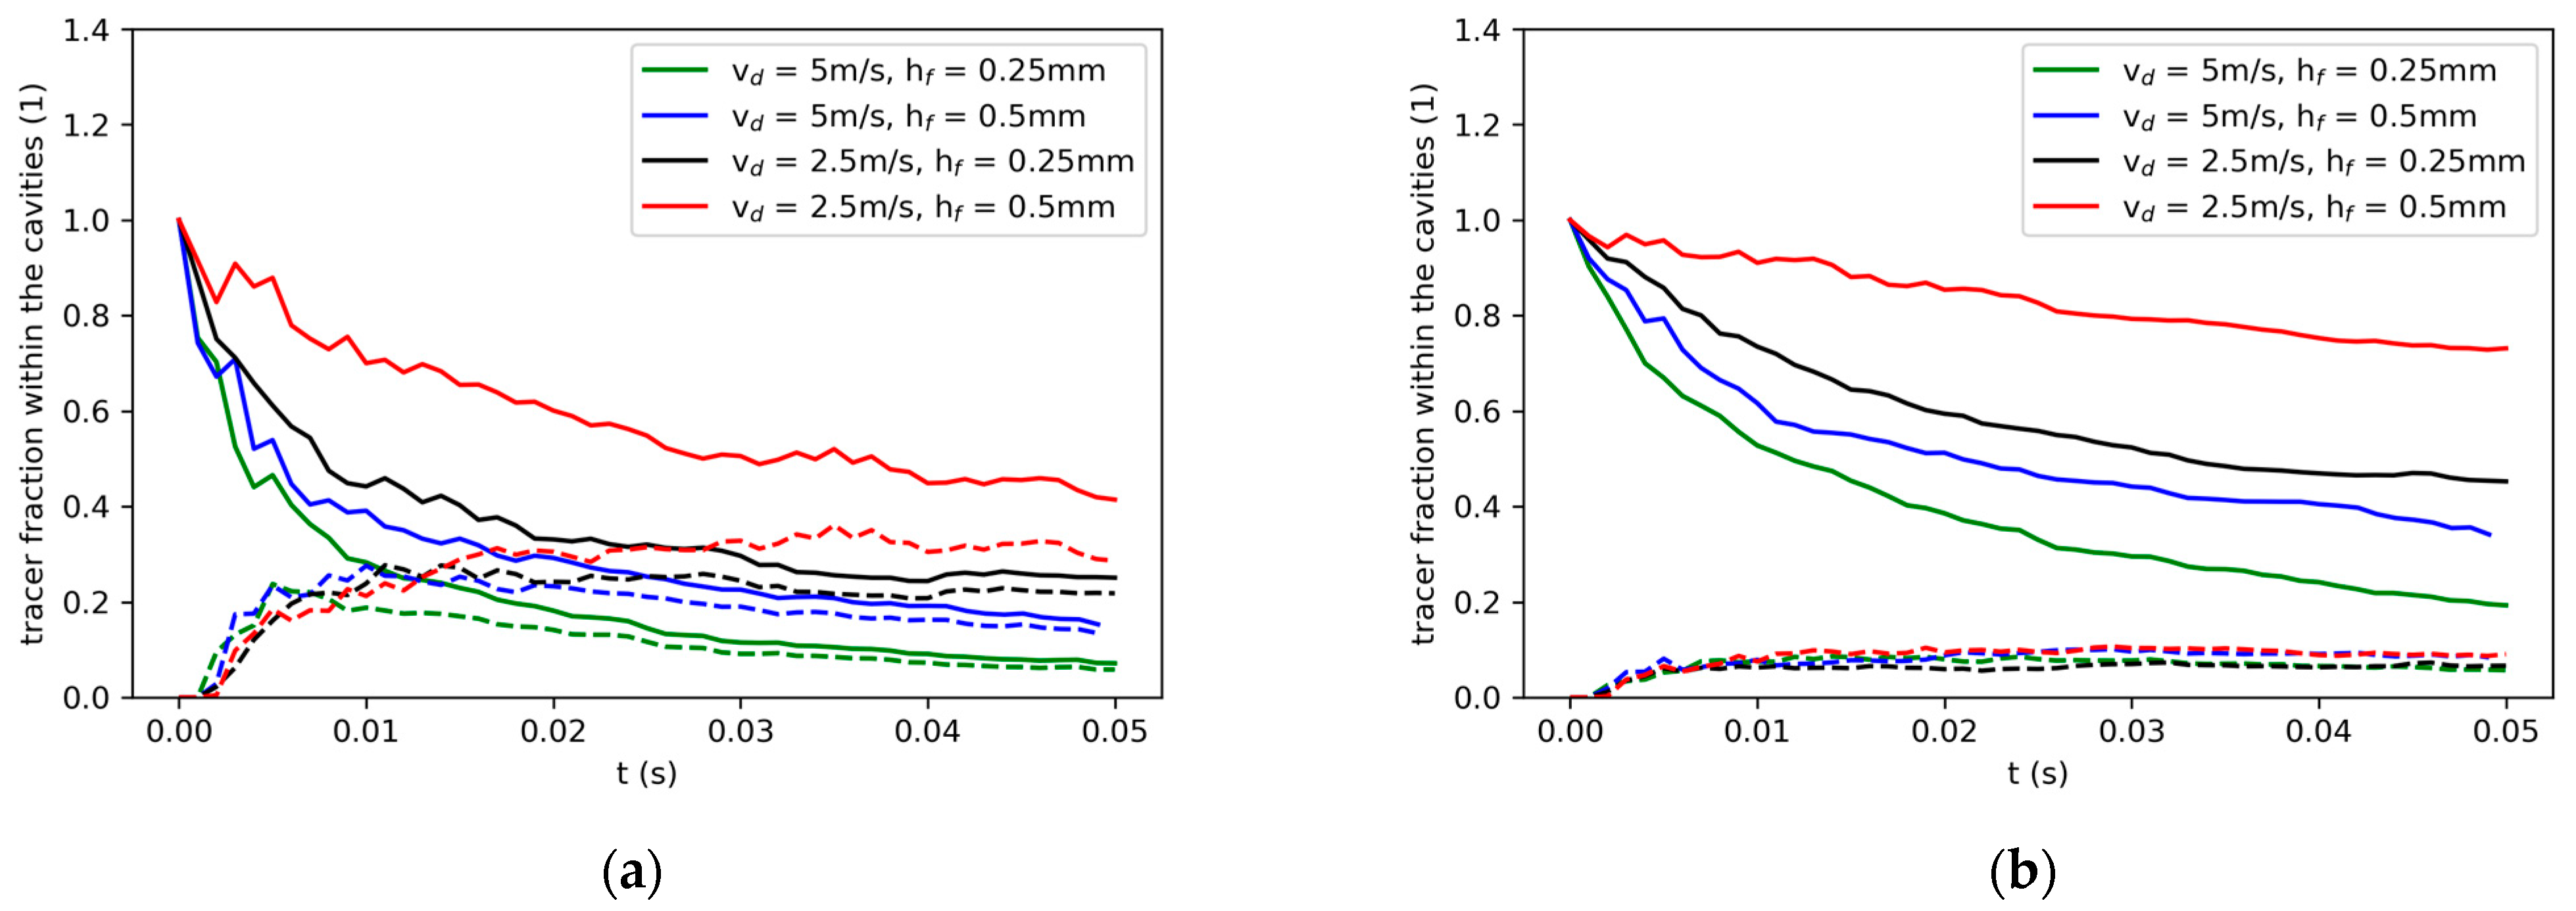
The convective mass transfer rate is used as a measure to characterize the excitation of the film due to droplet impingement. Zhao et al. [39] evaluated the rate of mass transferred through a virtual plane for a single-phase flow:
m ˙ = 1 2 ρ v y + + v y d A
m ˙ denotes the mass transfer rate, ρ the density. v y + and v y denote positive and negative vertical velocity components:
v y + = v y   i f   v y 0 0   i f   v y < 0
v y = 0   i f   v y > 0 v y   i f   v y 0
Based on their formula, the convective mass transfer rate of a phase α q through a virtual horizontal evaluation plane in positive y-direction is given by:
m ˙ = α q ρ v y + d A
Virtual horizontal evaluation planes were used, as schematically indicated in Figure 1a. The planes are defined at y-positions of 150 µm, 75 µm and 25 µm, measured from the deepest position of the cavities, through which the liquid-phase convective mass transfer rates in positive y-direction (out of cavity direction) were evaluated. The area of the evaluation plane is rendered by the lateral boundaries of the simulation domain (x-direction) and a fictitious dimension normal to the computation domain (z-direction), along which the results are replicated, and which has a dimension of 1 m. A time period of 50 ms was simulated, comprising the consecutive impingement of 50 droplets. The convective mass transfer rates were captured at a sampling frequency of 0.1 ms and plotted over time, cf. Figure 6 (left column). As can be seen, fluctuations of the mass transfer rate prevail. An increase in initial droplet velocities from 2.5 m/s to 5 m/s induces more pronounced fluctuations in the mass transfer rates. The fluctuations depend on the film thickness, whereby an increase in the film thickness from 0.25 mm to 0.5 mm reduces the fluctuations of the mass transfer rates. Comparing different evaluation planes, the significant reduction of the mass transfer rate at lower evaluation planes becomes evident. This applies to its mean values as well as to the fluctuations. The fluctuations were put to a Fourier spectral analysis, cf. Figure 6 (right column). It shows a clear peak at the impaction frequency of the droplets. Further peaks can be discerned at frequencies which are integer multiples of the impaction frequency. The higher the frequency, the lower the peaks. Additionally, peaks which are fractional multiples of the impaction frequency are observed. Further peaks all over the frequency domain indicate fluctuations which are not correlated with the excitation due to droplet impingement. This pattern prevails at all evaluation plane positions, with the planes closer to the structured surface displaying significantly lower peaks. In general, peaks increase with increasing initial droplet velocity and decreasing initial film heights.
The time-averaged mass transfer rates were evaluated as a function of the y-position of a series of evaluation planes for both impaction velocities and film heights, cf. Figure 7. The higher the y-position of the evaluation plane, the higher the mass transfer rate. Increasing the droplet impaction velocities promotes mass transfer across all evaluation planes. The influence of the film thickness is more pronounced at low impaction velocities. However, a higher film thickness generally reduces the vertical mass transfer. Increasing the droplet velocity from 2.5 m/s to 5 m/s overcompensates for the effect of a doubling of the film height from 0.25 mm to 0.5 mm.

3.3. Tracer Decay

As detailed in Section 3.1, the micro flow in and around the cavities is susceptible to re-entrainment. Thus, the allocation of marked tracer particles is employed as a further quantity to characterize the convective mass transport. Initially, the tracer particles are dispersed in the cavities, which form the region of interest. The cavities are sub-divided into an upper and a lower half and two tracer species are used, each pertaining to one half, analogously to Section 3.1. The fraction of tracer particles in the cavity decays in time. In general, the tracer decay is much stronger for tracer species pertaining to the upper half of the cavity (Figure 8a) than for that of the lower half (Figure 8b) since the upper half is more strongly affected by the mass and the momentum sources due to the fact that the impingement and escape paths are shorter. Tracer re-entrainment starts at very early stages of the impingement process. Low initial droplet velocities lead to stronger re-entrainment. Additionally, the initial film heights influence tracer re-entrainment, whereby lower film heights reduce re-entrainment. The influence of the initial droplet velocity exceeds that of the film height in the studied cases. The larger droplet velocity showed less re-entrainment, irrespective of the film height, which is attributed to better mixing in the main stream.

4. Discussion

A numerical multi-phase model based on the VOF method was set up to investigate the convection of a liquid film on a structured surface under multi-droplet impingement. It is shown in a series of snapshots that cavities immediately below the spots where droplets hit the film experience a pronounced mass exchange compared to other regions. The deeper regions of the cavities, especially around concave corners, are affected by stagnation. In tracking the escape of tracers from the cavities, two modes of flow are identified, which are central inflow with lateral outflow (1) and lateral inflow with outflow at the opposing side (2). The statistical evaluation of the convective mass transfer rates through virtual horizontal planes placed within the liquid film displays strong fluctuations due to the excitation by the impinging droplets. High droplet velocities and low film heights increase the temporally averaged mass transfer rate, which correlates with the fastest escape of tracer particles from the cavities. The tracer motion is substantially affected by re-entrainment of already escaped particles, whereby high droplet velocities and low film heights show a reduced tendency for re-entrainment. In the studied cases, higher droplet velocities could compensate for the effect of the increased film thicknesses. In summary, the proposed model provides an insight into the convective transport at structured surfaces under multiple droplet impingement and allows the study of parameters comprising impingement conditions and surface topologies.

Author Contributions

Conceptualization, W.E. (Werner Eßl) and G.R.; methodology, W.E. (Werner Eßl) and G.R.; software, W.E. (Werner Eßl); writing—original draft preparation, W.E. (Werner Eßl); writing—review and editing, G.R., P.R., W.E. (Werner Ecker), N.K., E.G., H.A., J.K. and T.K.; project administration, G.R. and E.G.; funding acquisition, W.E. (Werner Ecker) and H.A. All authors have read and agreed to the published version of the manuscript.

Funding

The authors gratefully acknowledge the financial support under the scope of the COMET program within the K2 Center “Integrated Computational Material, Process and Product Engineering (IC-MPPE)” (Project No 886385). This program is supported by the Austrian Federal Ministries for Climate Action, Environment, Energy, Mobility, Innovation and Technology (BMK) and for Labour and Economy (BMAW), represented by the Austrian Research Promotion Agency (FFG), and the federal states of Styria, Upper Austria and Tyrol.

Data Availability Statement

Not applicable.

Conflicts of Interest

The authors declare no conflict of interest.

References

  1. Peng, C.; Xu, X.; Liang, X. Numerical investigation on crown behavior and energy evolution of droplet impinging onto thin film. Int. Commun. Heat Mass 2020, 114, 104532. [Google Scholar] [CrossRef]
  2. Bhattacharya, P.; Samanta, A.; Chakraborty, S. Spray evaporative cooling to achieve ultra fast cooling in runout table. Int. J. Therm. Sci. 2009, 48, 1741–1747. [Google Scholar] [CrossRef]
  3. Lohrasbi, S.; Hammer, R.; Essl, W.; Reiss, G.; Defregger, S.; Sanz, W. A Comprehensive Review on the Core Thermal Management Improvement Concepts in Power Electronics. IEEE Access 2020, 8, 166880–166906. [Google Scholar] [CrossRef]
  4. Garud, K.; Lee, M.-Y. Grey relational based Taguchi analysis on heat transfer performances of direct oil spray cooling system for electric vehicle driving motor. Int. J. Heat Mass Transf. 2023, 201, 123596. [Google Scholar] [CrossRef]
  5. Esfe, M.; Kamyab, M.; Valadkhani, M. Application of nanofluids and fluids in photovoltaic thermal system: An updated review. Sol. Energy 2020, 199, 796–818. [Google Scholar] [CrossRef]
  6. Shih, C.-W.; Wang, Y.-Y.; Wan, C.-C. Anisotropic copper etching with monoethanolamine-complexed cupric ion solutions. J. Appl. Electrochem. 2003, 33, 403–410. [Google Scholar] [CrossRef]
  7. Löher, T.; Neumann, A.; Böttcher, L.; Pahl, B.; Ostmann, A.; Aschenbrenner, R.; Reichl, H. Smart PCBs Manufacturing Technologies. In Proceedings of the 6th International Conference on Electronics Packaging Technology, Shenzhen, China, 30 August–2 September 2005. [Google Scholar]
  8. Yeh, T.-K.; Tsai, M.-H.; Wang, M.-Y.; Weng, C.-K. Improved shape evolution of copper interconnects prepared by jet-stream etching. J. Appl. Electrochem. 2008, 38, 1495–1500. [Google Scholar] [CrossRef]
  9. Reiss, G.; Kosednar-Legenstein, B.; Riedler, J.; Eßl, W. Impact of electric field at rough copper lines on failure time due to electrochemical migration in PCBs. Microelectron. Reliab. 2021, 117, 114035. [Google Scholar] [CrossRef]
  10. Ramachandran, K.; Liu, F.; Raj, P.; Sundaram, V.; Tummala, R. Conductive Anodic Filament Failures in Fine-Pitch Through-Via Interconnections in Organic Package Substrates. J. Electron. Mat. 2013, 42, 348–354. [Google Scholar] [CrossRef]
  11. Ready, W.; Turbini, L. The Effect of Flux Chemistry, Applied Voltage, Conductor Spacing, and Temperature on Conductive Anodic Filament Formation. J. Electron. Mat. 2002, 31, 1208–1224. [Google Scholar] [CrossRef]
  12. Sheng, J.; Li, H.; Shen, S.; Ming, R.; Sun, B.; Wang, J.; Zhang, D.; Tang, Y. Investigation on Chemical Etching Process of FPCB with 18 µm Line Pitch. IEEE Access 2021, 9, 50872–50879. [Google Scholar] [CrossRef]
  13. Rath, P.; Chai, J.; Zheng, H.; Lam, Y.; Murukeshan, V.; Hu, H. A fixed-grid approach for diffusion- and reaction-controlled wet chemical etching. Int. J. Heat Mass Transf. 2005, 48, 2140–2149. [Google Scholar] [CrossRef]
  14. Rath, P.; Chai, J.C. Modeling Convection-Driven Diffusion-Controlled Wet Chemical Etching Using a Total-Concentration Fixed-Grid Method. Numer. Heat Tr B Fund. 2007, 53, 143–159. [Google Scholar] [CrossRef]
  15. Shin, C.B.; Economou, D.J. Effect of Transport and Reaction on the Shape Evolution of Cavities during Wet Chemical Etching. J. Electrochem. Soc. 1989, 136, 1997–2004. [Google Scholar] [CrossRef]
  16. Jose, J.T.; Dunne, J.F. Numerical Simulation of Single-Droplet Dynamics, Vaporization, and Heat Transfer from Impingement onto Static and Vibrating Surfaces. Fluids 2020, 5, 188. [Google Scholar] [CrossRef]
  17. Guggilla, G.; Narayanaswamy, R.; Stephan, P.; Pattamatta, A. Influence of flow rate and surface thickness on heat transfer characteristics of two consecutively impinging droplets on a heated surface. Int. J. Heat Mass Transf. 2021, 165, 120688. [Google Scholar] [CrossRef]
  18. Guilizzoni, M.; Frontera, G. Crater Depth after the Impact of Multiple Drops into Deep Pools. Fluids 2022, 7, 50. [Google Scholar] [CrossRef]
  19. Muthusamy, J.; Zhang, T.; Alvarado, J.; Kanjirakat, A.; Sadr, R. Hydrodynamic and heat transfer characteristics of droplet train spreading-splashing transition on heated surface. Int. J. Heat Mass Transf. 2021, 164, 120500. [Google Scholar] [CrossRef]
  20. Díaz, A.; Ortega, A. Investigation of a gas-propelled liquid droplet impinging onto a heated surface. Int. J. Heat Mass Transf. 2013, 67, 1181–1190. [Google Scholar] [CrossRef]
  21. Yuan, Z.; Matsumoto, M.; Kurose, R. Numerical study of droplet impingement on surfaces with hierarchical structures. Int. J. Multiphas. Flow 2022, 147, 103908. [Google Scholar] [CrossRef]
  22. Rafi, A.; Haque, M.; Ahmed, D. Two-dimensional analogies to the deformation characteristics of a falling droplet and its collision. Arch. Mech. Eng. 2022, 69, 21–43. [Google Scholar]
  23. Yang, Q.; Wang, X.; Zhu, L.; Wang, R.; Zhao, J. Numerical investigation of local heat transfer characteristics of an oblique droplet impacting a wetted wall. Case Stud. Therm. Eng. 2019, 14, 100461. [Google Scholar] [CrossRef]
  24. Lee, S.H.; Hur, N.; Kang, S. A numerical analysis of drop impact on liquid film by using a level set method. J. Mech. Sci. 2011, 25, 2567–2572. [Google Scholar] [CrossRef]
  25. Wang, Y.-B.; Wang, X.-D.; Wang, T.-H.; Yan, W.-M. Asymmetric heat transfer characteristics of a double droplet impact on a moving liquid film. Int. J. Heat Mass Transf. 2018, 126, 649–659. [Google Scholar] [CrossRef]
  26. Raman, K.; Jaiman, R.; Lee, T.; Low, H. On the dynamics of crown structure in simultaneous two droplets impact onto stationary and moving liquid film. Comput. Fluids 2015, 107, 285–300. [Google Scholar] [CrossRef]
  27. Wu, J.; Liu, C.; Zhao, N. Dynamics of falling droplets impact on a liquid film: Hybrid lattice Boltzmann simulation. Colloids Surf. A Physicochem. Eng. Asp. 2015, 472, 92–100. [Google Scholar] [CrossRef]
  28. Liu, C.; Shen, M.; Wu, J. Investigation of a single droplet impact onto a liquid film with given horizontal velocity. Eur. J. Mech. B Fluids 2018, 67, 269–279. [Google Scholar] [CrossRef]
  29. Qiyu, H.; Holden, Z. A study of different fluid droplets impacting on a liquid film. Pet. Sci. 2008, 5, 62–66. [Google Scholar]
  30. Motzkus, C.; Gensdarmes, F.; Géhin, E. Study of the coalescence/splash threshold of droplet impact on liquid films and its relevance in assessing airborne particle release. J. Colloid Interface Sci. 2011, 362, 540–552. [Google Scholar] [CrossRef]
  31. Yang, J.H.; Lee, C.Y. Experimental study on phenomena of single water droplet impacts on liquid surfaces: Pattern maps and correlations. Exp. Therm. Fluid Sci. 2022, 130, 110480. [Google Scholar] [CrossRef]
  32. Gao, X.; Li, R. Impact of a single drop on a flowing liquid film. Phys. Rev. E 2015, 92, 053005. [Google Scholar] [CrossRef] [Green Version]
  33. Wang, X.; Xu, B.; Guo, S.; Zhao, Y.; Chen, Z. Droplet impacting dynamics: Recent progress and future aspects. Adv. Colloid Interface Sci. 2023, 317, 102919. [Google Scholar] [CrossRef]
  34. Cossali, G.E.; Coghe, A.; Marengo, M. The impact of a single drop on a wetted solid surface. Exp. Fluids. 1997, 22, 463–472. [Google Scholar] [CrossRef]
  35. Marengo, M.; Tropea, C. Aufprall von Tropfen auf Flüssigkeitsfilme. Dtsch. Forsch. 1999, 194, 1. [Google Scholar]
  36. Zhang, Z.; Liu, H.; Zhang, F.; Yao, M. Numerical study of spray micro-droplet impinging on dry/wet wall. Appl. Therm. Eng. 2016, 95, 1–9. [Google Scholar] [CrossRef]
  37. Li, D.; Liang, G.; Hua, D. Simultaneous Impact of Hollow Droplet and Continuous Dense Droplet on Liquid Film. Front. Energy Res. 2022, 10, 911458. [Google Scholar] [CrossRef]
  38. Nardecchia, F.; Bernardino, A.D.; Pagliaro, F.; Monti, P.; Leuzzi, G.; Gugliermetti, L. CFD Analysis of Urban Canopy Flows Employing the V2F Model: Impact of Different Aspect Ratios and Relative Heights. Adv. Meteorol. 2018, 2018, 2189234. [Google Scholar] [CrossRef]
  39. Zhao, Y.; Fan, W.; Zhang, R. Influence of coupling schemes of radial and circumferential flame stabilization modes on flow and combustion characteristics of compact combustion for gas turbine. Fuel 2023, 333, 126543. [Google Scholar] [CrossRef]
  40. Broecker, T.; Elsesser, W.; Teuber, K.; Özgen, I.; Nützmann, G.; Hinkelmann, R. High-resolution simulation of free-surface flow and tracer retention over streambeds with ripples. Limnologica 2018, 68, 46–58. [Google Scholar] [CrossRef] [Green Version]
  41. Constantinescu, G.; Sukhodolov, A. Mass exchange in a shallow channel flow with a series of groynes: LES study and comparison with laboratory and field experiments. Environ. Fluid Mech. 2009, 9, 587–615. [Google Scholar] [CrossRef]
  42. Sandoval, J.; Mignot, E.; Mao, L.; Pastén, P.; Bolster, D.; Escauriaza, C. Field and Numerical Investigation of Transport Mechanisms in a Surface Storage Zone. J. Geophys. Res. Earth Surf. 2019, 124, 938–959. [Google Scholar] [CrossRef] [Green Version]
  43. de Oliveira, L.D.; Janzen, J.; Gualtieri, C. Effects of Geometric Shapes on the Hydrodynamics and Sediment Transport in Lateral Cavities. In Proceedings of the 39th IAHR World Congress, Granada, Spain, 19–24 June 2022. [Google Scholar]
  44. van Hooff, T.; Blocken, B. CFD evaluation of natural ventilation of indoor environments by the concentration decay method: CO2 gas dispersion from a semi-enclosed stadium. Build. Environ. 2013, 61, 1–17. [Google Scholar] [CrossRef]
  45. Wang, Q.; Sandberg, M.; Lin, Y.; Yin, S.; Hang, J. Impacts of Urban Layouts and Open Space on Urban Ventilation Evaluated by Concentration Decay Method. Atmosphere 2017, 8, 169. [Google Scholar] [CrossRef] [Green Version]
  46. Hormigos-Jimenez, S.; Padilla-Marcos, M.; Meiss, A.; Gonzalez-Lezcano, R.; Feijó-Muñoz, J. Experimental validation of the age-of-the-air CFD analysis: A case study. Sci. Technol. Built Environ. 2018, 24, 994–1003. [Google Scholar] [CrossRef]
  47. ANSYS Fluent User’s Guide, 2021 R1; ANSYS Inc.: Canonsburg, PA, USA, 2021.
  48. Shanahan, M.E.R. A Simple Analysis of Local Wetting Hysteresis on a Wilhelmy Plate Method. Surf. Interface Anal. 1991, 17, 489–495. [Google Scholar] [CrossRef]
  49. Breitenbach, J.; Roisman, I.V.; Tropea, C. From drop impact physics to spray cooling models: A critical review. Exp. Fluids 2018, 59, 55. [Google Scholar] [CrossRef]
  50. Yang, C.; Cao, W.; Yang, Z. Study on dynamic behavior of water droplet impacting on super-hydrophobic surface with micro-pillar structures by VOF method. Colloids Surf. A Physicochem. Eng. Asp. 2021, 630, 127634. [Google Scholar] [CrossRef]
  51. Choi, M.; Eom, S.; Sung, Y.; Noh, K.; Choi, G. Experimental prediction of multi-nozzle spray characteristics for optimal design in a lead frame etching process. J. Mech. Sci. Technol. 2018, 32, 2127–2139. [Google Scholar] [CrossRef]
  52. Jung, J.-W.; Choi, G.-M.; Kim, D.-J. Experimental Study on Spray Etching Process in Micro Fabrication of Lead Frame. KSME Int. J. 2004, 18, 2294–2302. [Google Scholar] [CrossRef]
  53. Jeong, H.-C.; Kim, D.-W.; Choi, G.-M.; Kim, D.-J. The Effect of Spray Characteristics on the Etching of Invar Alloy with FeCl3 Solution. Int. J. Precis. Eng. Manuf. 2009, 10, 107–114. [Google Scholar] [CrossRef]
  54. Ma, D.; Chang, S.; Wu, K.; Song, M. Experimental study on the water film thickness under spray impingement based on planar LIF. Int. J. Multiph. Flow 2020, 130, 103329. [Google Scholar] [CrossRef]
  55. ANSYS Fluent Theory Guide, 2021 R1; ANSYS Inc.: Canonsburg, PA, USA, 2021.
  56. Lafaurie, B.; Nardone, C.; Scardovelli, R.; Zaleski, S.; Zanetti, G. Modelling merging and fragmentation of multiphase flows with surfer. J. Comput. Phys. 1994, 113, 134–147. [Google Scholar] [CrossRef]
Figure 1. (a) Schematic representation of the simulation domain (3 mm × 3 mm), showing the boundary conditions, the vertical position of droplet initiation as well as a schematically indicated virtual horizontal evaluation plane, through which the mass transfer rate is monitored; (b) detail view of the mesh at the structured surface with refinement based on the cut-cell method nearby the cavity structures.
Fluids 08 00180 g001
Figure 2. Illustration of the passive tracer distribution before droplet impaction. The close-up shows one single cavity with two tracer species which are placed in the upper and the lower half.
Fluids 08 00180 g002
Figure 3. Evolution of impaction morphologies onto a single droplet impact to a quiescent liquid film obtained by the simulation model.
Fluids 08 00180 g003
Figure 4. Droplet impaction map. The lines indicate the transition between non-splashing and splashing for droplets of sizes of 40 µm (black) and 2 mm (blue) [36]. The markers show the simulation results, whereby the half-filled marker indicates the transition and the filled (open) markers pertain to splashing (non-splashing) conditions.
Fluids 08 00180 g004
Figure 5. Snapshots during droplet impingement (left column). Velocity field of the fluid (middle column). Release of tracer particles from the cavities and re-entrainment (right column).
Fluids 08 00180 g005aFluids 08 00180 g005b
Figure 6. Mass transfer rates of fluid through virtual planes at y-positions of 150 µm, 75 µm and 25 µm. The left column shows the absolute mass transfer rate and the right columns the Fourier spectral decomposition.
Fluids 08 00180 g006aFluids 08 00180 g006b
Figure 7. Time-averaged mass transfer rates m ˙ ¯ at different y-positions.
Fluids 08 00180 g007
Figure 8. Fraction of tracer particles, which are allocated within the cavity (solid curves) and fraction of tracer particles that are allocated in the cavity due to re-entrained after having already been released into the main flow (dashed line). The evaluations pertain to tracer particles which are initially positioned in the upper half of the cavities (a) and to tracer particles which are initially positioned in the lower half of the cavities (b).
Fluids 08 00180 g008
Table 1. Geometrical parameters.
ParameterValue
domain height3 mm
domain width3 mm
cavity height15 µm
cavity width50 µm
spacing between cavities50 µm
Table 2. Properties of copper chloride etching solution (measured) and air [47].
PropertySymbolValue
density (air) ρ 1 1.225 kg m−3
density (etching solution) ρ 2 1245 kg m−3
viscosity (air) μ 1 1.7894 × 10⁻⁵ kg m−1 s−1
viscosity (etching solution) μ 2 1.2675 × 10⁻³ kg m−1 s−1
surface tension σ 0.0675 N m−1
Table 3. Impingement characteristics.
QuantitySymbolValue
droplet release rate f 1000 Hz
droplet release interval Δ t 0.001 s
droplet diameter D d 150 µm
droplet velocity v d 2.5 m/s, 5 m/s
film height h f 0.25 mm, 0.5 mm
dimensionless film height = h f D d h * 1.67, 3.33
droplet Reynolds number ( = v d D d ρ 2 μ ) R e 368.34, 736.69
Weber number ( = ρ 2 υ d 2 D d σ ) W e 17.29, 69.17
impact force = π 6 D d 3 ρ 2 υ d Δ t F 5.50 µN, 11.00 µN
Disclaimer/Publisher’s Note: The statements, opinions and data contained in all publications are solely those of the individual author(s) and contributor(s) and not of MDPI and/or the editor(s). MDPI and/or the editor(s) disclaim responsibility for any injury to people or property resulting from any ideas, methods, instructions or products referred to in the content.

