Article

Hemodynamic Assessment of the Pathological Left Ventricle Function under Rest and Exercise Conditions

1
Research Campus STIMULATE, University of Magdeburg, 39106 Magdeburg, Germany
2
Department of Fluid Dynamics and Technical Flows, University of Magdeburg, 39106 Magdeburg, Germany
3
Department of Cardiology, University Hospital Magdeburg, 39120 Magdeburg, Germany
4
Department of Cardiovascular Engineering, Institute of Applied Medical Engineering, Medical Faculty, RWTH Aachen University, 52074 Aachen, Germany
5
Department of Healthcare Telematics and Medical Engineering, University of Magdeburg, 39106 Magdeburg, Germany
*
Author to whom correspondence should be addressed.
Fluids 2023, 8(2), 71; https://doi.org/10.3390/fluids8020071
Submission received: 23 January 2023 / Revised: 7 February 2023 / Accepted: 13 February 2023 / Published: 16 February 2023
(This article belongs to the Special Issue Image-Based Computational and Experimental Biomedical Flows)

Abstract

:
Purpose: The analysis of pathological human left ventricular hemodynamics using high-resolved image-based blood flow simulations shows a major potential for examining mitral valve insufficiency (MI) under exercise conditions. Since capturing and simulating the patient-specific movement of the left ventricle (LV) during rest and exercise is challenging, this study aims to propose a workflow to analyze the hemodynamics within the pathologically moving LV. Methods: Patient-specific ultrasound (US) data of ten patients with MI in different stages were captured with three-dimensional real-time echocardiography. US measurements were performed while patients were resting and while doing handgrip exercise (2–4 min work). Patient-specific hemodynamic simulations were carried out based on the captured ventricular wall movement. Velocity and kinetic energy were analyzed for rest and exercise and for the different MI stages. Results: The results reveal a dependency of the kinetic energy over time in the ventricular volume curves. Concerning the comparison between rest and exercise, the left ventricular function reveals lower systolic kinetic energy under exercise (kinetic energy normalized by EDV; mean ± standard deviation: rest = 0.16 ± 0.14; exercise = 0.06 ± 0.05; p-value = 0.04). Comparing patients with non-limiting (MI I) and mild/moderate (MI II/III) MI, lower velocities (mean ± standard deviation: non-limiting = 0.10 ± 0.03; mild/moderate = 0.06 ± 0.02; p-value = 0.01) and lower diastolic kinetic energy (kinetic energy normalized by EDV; mean ± standard deviation: non-limiting = 0.45 ± 0.30; mild/moderate = 0.20 ± 0.19; p-value = 0.03) were found for the latter. Conclusion: With the proposed workflow, the hemodynamics within LVs with MI can be analyzed under rest and exercise. The results reveal the importance of the patient-specific wall movement when analyzing intraventricular hemodynamics. These findings can be further used within patient-specific simulations, based on varying the imaging and segmentation methods.

1. Introduction

Mitral valve insufficiency (MI) is a pathology occurring at the left ventricle of the human heart, causing reflux through the mitral valve back to the atrium [1]. MI occurs with an incidence up to 11.7% for people over 75 years [2] and in different stages (non-limiting—MI I and mild/moderate—MI II/III) [3]. For most patients, the MI stage increases under exercise [4], which has an effect on the development of symptoms specific for each patient [5]. The relationship between rest or exercise conditions and the intraventricular blood flow in patients with MI is still not fully understood [6]. However, the patient-specific blood flow analysis is crucial to obtain knowledge about the disease itself and for the planning of support therapy [7]. This can be realized by performing image-based patient-specific hemodynamic simulations [8,9]. In this regard, the numerical replication of the patient-specific movement of the ventricular wall is crucial to provide realistic flow characteristics [10].
As found by Nquyen et al. [11], magnetic resonance imaging scans can be used as a basis for a patient-specific moving mesh simulation to analyze the intraventricular hemodynamics. Boundary conditions are calculated by the deviation of the inlet and outlet mass flow from the ventricular volume over time [11]. Nevertheless, there is a lack of patient-specific pressure curves at the inflow and outflow tract, affecting the resulting hemodynamics. More recently, Goubergrits et al. and Obermeier et al. [12,13] used CT scans and calculated the movement of the LV walls using scaling based on the volume curve over time. With their approach, the patient-specific volume, including a detailed description of the valves, is considered. However, the patient-specific ventricular wall movement was not taken into account, and radiation exposure argues against the use of additional CT. Bavo et al. [14] developed a promising moving mesh method using ultrasound images from transesophageal echocardiography. The application of this method in clinical routine may, however, be constrained due to its invasive character [15]. Instead, transthoracic echocardiography (TTE) can capture time-resolved images of the ventricular volume in a non-invasive and radiation-free manner [16]. The imaging is even possible while patients perform low impact exercises [17]. Bakkestrøm et al. [18] investigated hemodynamics in patients with MI I and MI II/III, under rest and exercise, using catheterization and imaging modalities (echocardiography and magnetic resonance imaging). Within their study, significant differences in pulmonary capillary wedge and artery pressure were found between patients with MI I and MI II/III; however, highly resolved hemodynamics were not evaluated. Addressing these mentioned limitations, image-based hemodynamic simulations are used to investigate the hemodynamics in LVs of 10 patients with different MI stages, under rest and exercise. TTE is used to capture time-resolved medical images, and a moving mesh method is applied to take the patient-specific ventricular wall movement into account.
Therefore, the aim of this study was to determine potential hemodynamic markers that are able to characterize the heart function depending on the MI stage. In addition, the different impact of rest and exercise on the chosen hemodynamic parameters was identified.

2. Materials and Methods

2.1. Patient-Specific Ultrasound Data and Medical Image Segmentation

The database within this study consisted of the 3D patient-specific ventricular wall geometry of the LV. Data was captured in the Division of Cardiology and Angiology, Department of Internal Medicine, University Hospital Magdeburg, with real-time 3D transthoracic echocardiography using a Siemens ACUSON SC2000 ultrasound medical device (Siemens ACUSON SC2000 Ultrasound System, 2016, SIEMENS Healthineers AG Munich, Germany), with a frequency of 4.5 MHz.
Echocardiographic data was collected as part of the CIRCUS study (Compare Impedance Cardiography with Right Heart Catheterization and UltraSound, German Clinical Trials Register, DRKS00015635). The study was approved by the institutional review board. All patients provided written informed consent.
The data comprises 10 patients with different stages of MI I-III (see Table 1). The time discrete LV wall movement was captured via US as n timesteps of the 3D LV geometry during one cardiac cycle (CC). Each LV movement exhibited n = 9 up to n = 22 timesteps per CC. Details on each patient’s timesteps, as well as the patient data, such as sex, age, size, weight, and end-diastolic volume (EDV), end-systolic volume (ESV), and ejection fraction (EF) can be found in Table 1.
The moving LV geometries were captured under rest and exercise, respectively. For exercise measurements, patients performed handgrip exercise for 2–4 min during the data acquisition. Heart rates measured within each patient during data acquisition ranged between 47–89 (66.30 ± 10.84) during rest and 89–133 (114.40 ± 10.80) during exercise (see Table 1).
The 3D US data of the LV geometries was segmented with 4-dimensional left ventricle analysis (4D LVA) using the ImageArena 2020 software by TomTec (TOMTEC Imaging Systems, Unterschleißheim, Germany). Initial geometry files (IGF) were provided in Standard Triangle Language (STL). Due to the existing image resolution, the valves could not be segmented from US and were represented as surfaces moving with the ventricular wall (see Figure 1). For each patient (P1–5: first and second column, P6–P10: third and fourth column) the end-systolic state of the moving LV geometry is presented in Figure 1 during rest (first and third column) and exercise (second and fourth column).

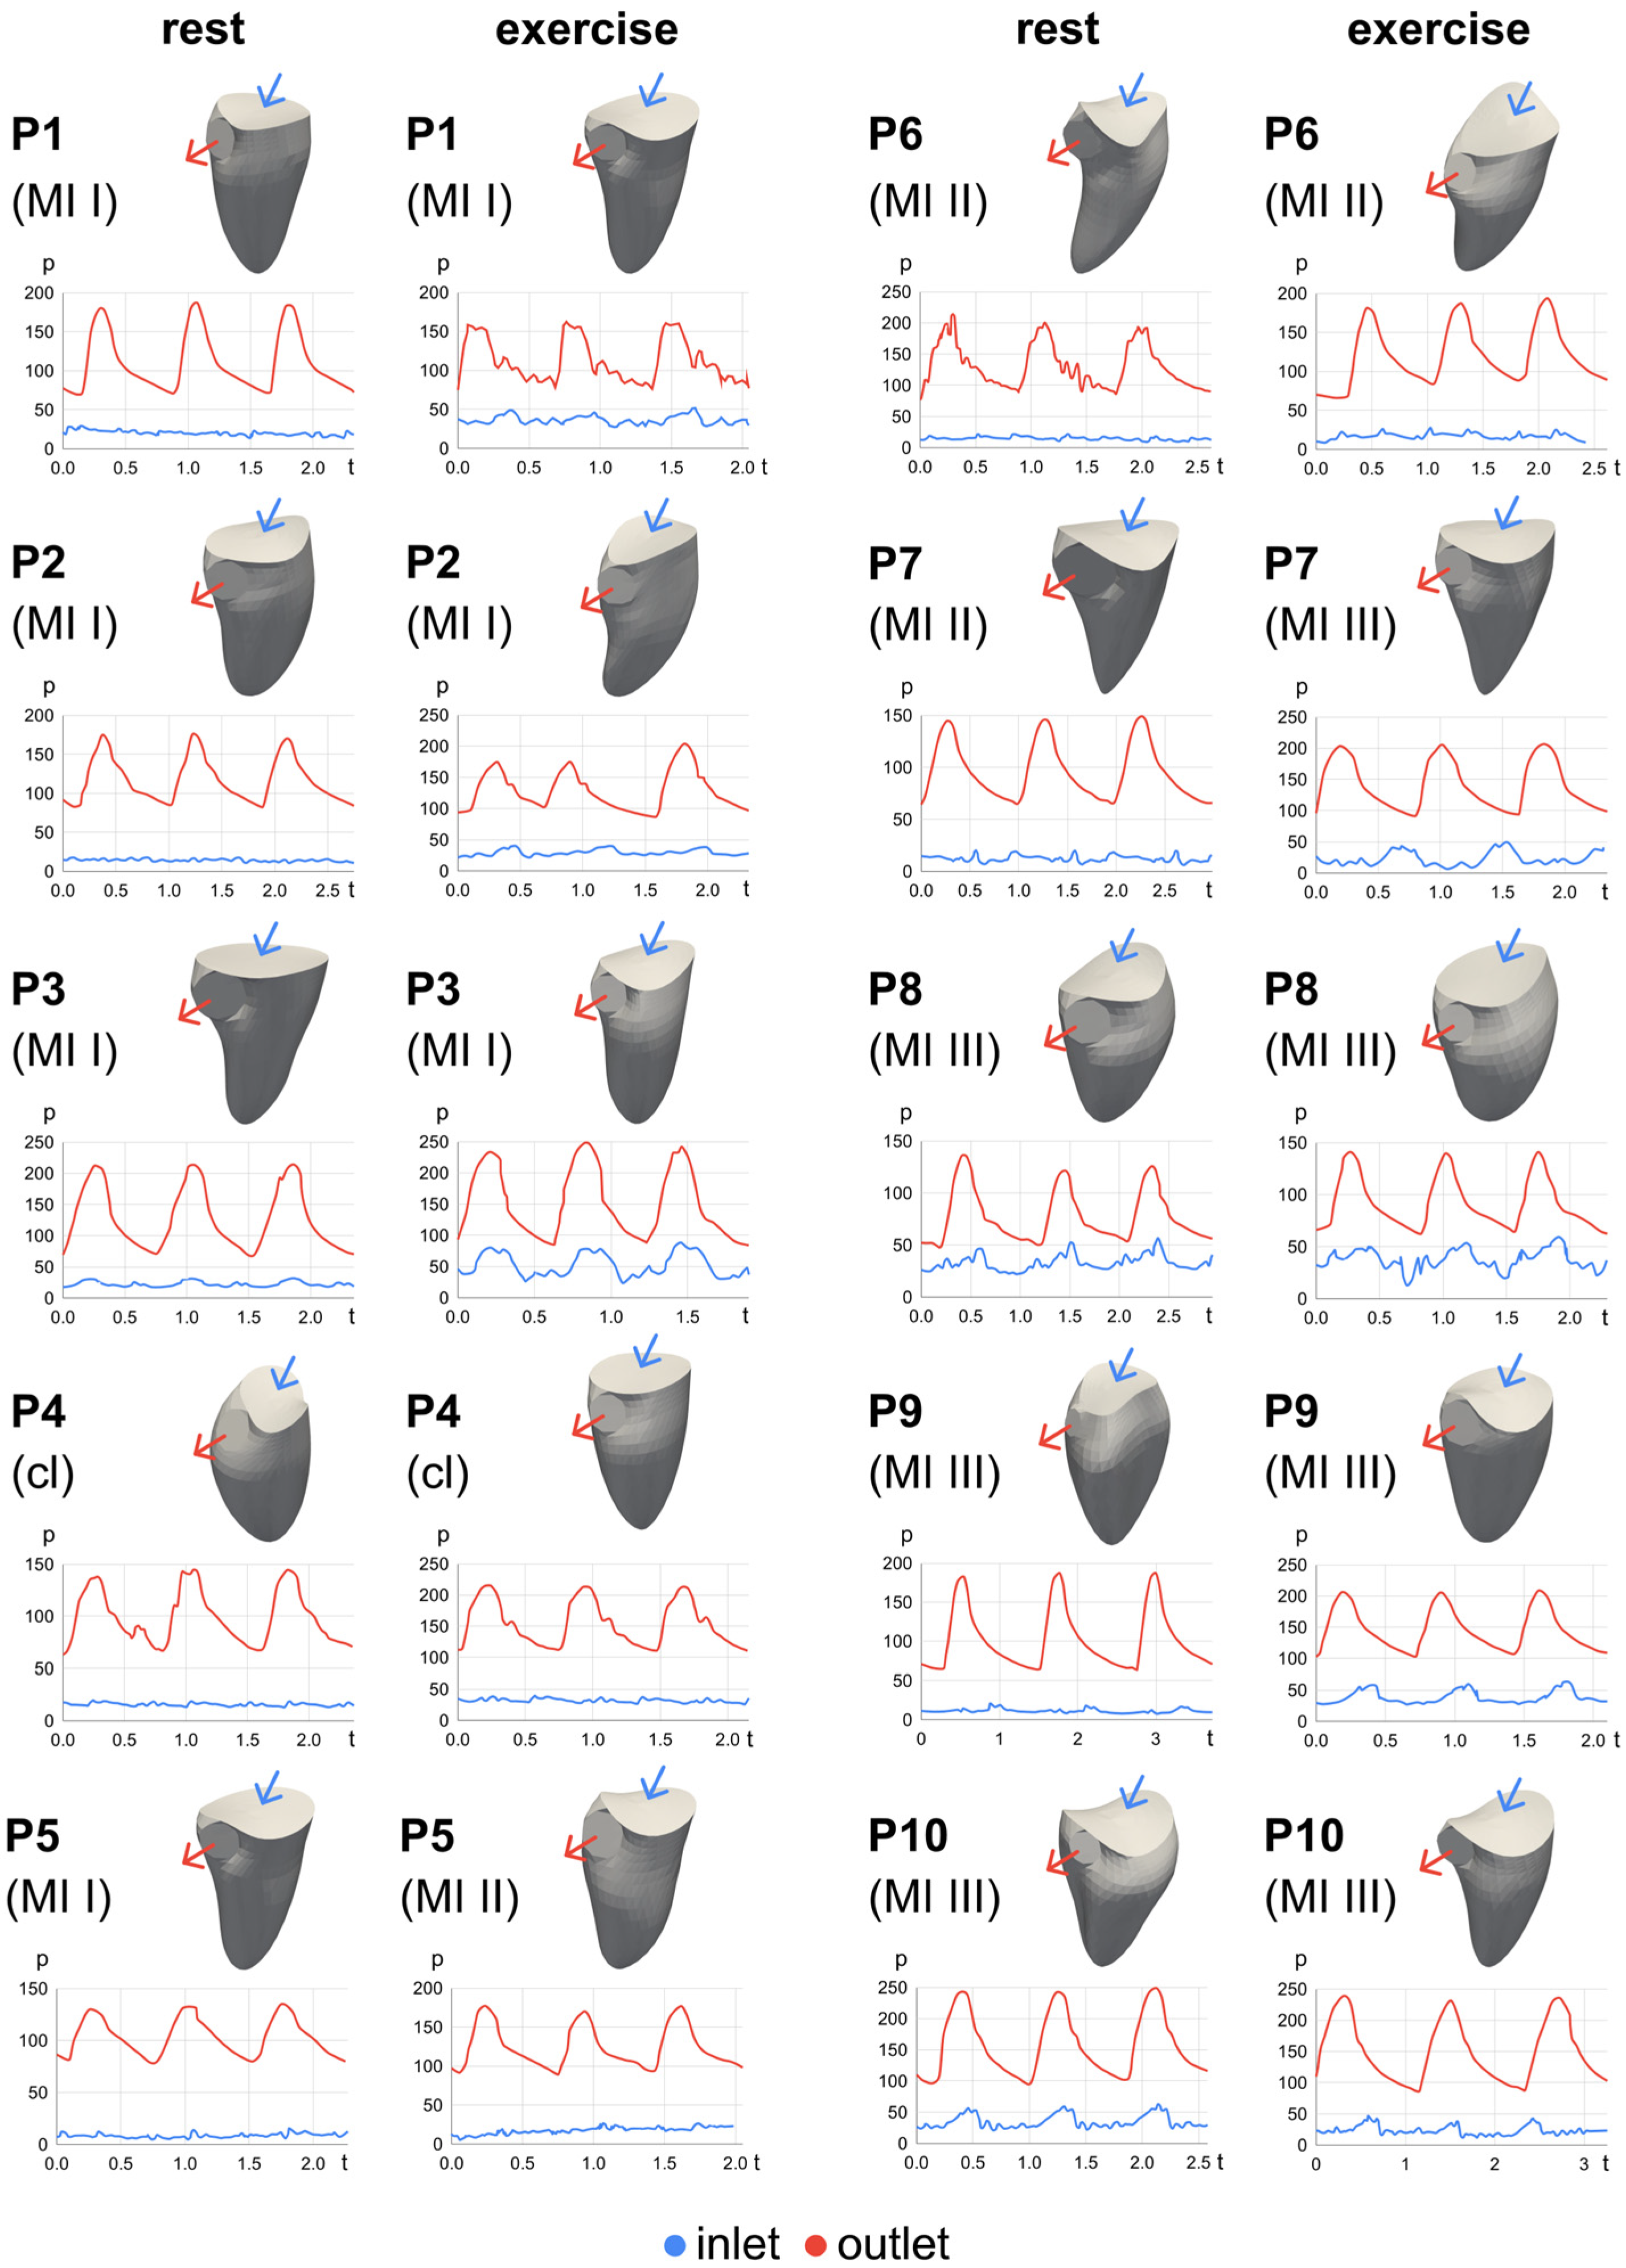
2.2. Boundary Conditions: Ventricular Wall Movement and Pressure Curves

To implement the patient-specific wall movement as a boundary condition in the simulation, n meshed surfaces (for n timesteps) with corresponding surface nodes were provided. To realize this wall movement, the moving mesh method (https://github.com/mneidlin/movingmesh, accessed on 1 June 2022) proposed by Grünwald et al. was chosen [19]. Concerning the creation of the input data for the moving mesh method, first, the end-systolic timestep (n = 1) of the IGF was load into ANSYS Spaceclaim 2021 R2 as STL and was then meshed (meshed geometry file—MGF) in ANSYS Meshing 2021 R2 (Ansys Inc., Canonsburg, PA, USA). A base mesh size of 0.5 mm was set for each patient, resulting in a total number of cells ranging from 1.3 to 3.6 million, depending on the patient-specific ESV. Mesh independency tests were carried out by analyzing the mesh of the ESV geometry of one patient. Details concerning the analyzed parameters with respect to the mesh study can be found in [19].
Second, the MGF surface nodes Pi on the end-systolic geometry (n = 1) were correlated with the triangular faces on the IGF surface nodes (triangular face with edge points P1 P2 P3). Here, for each MGF surface node Pi the location at the IGF triangular face was searched. When found, the correlation between the location Pi and the triangle corner points P1, P2, P3 was calculated. For this, the factors α and β were defined to describe the location of Pi on the triangle faces using the terms of the cross product (CP) and dot product (DP) of two parallel vectors: CP equals zero, and DP equals the product of their lengths. This combination reveals the following formula to calculate α and β :
P i = P i 2 + α i P i 2 P i 1 + β i P i 2 P i 3
Since the original STL geometries over the time series (n1, n2, …, nT; with T = amount of timesteps) comprise an equal amount of surface nodes, this correlation could then be used to create the exact same mesh for each timestep n over the time series (for the amount of timesteps for each case, see Table 1) [19].
Third, to overcome the time discrete movement, an interpolation was carried out between the Pi to the Pi+1 meshed points to create a continuous mesh movement of the LV over one CC. A cubic spline interpolation was used with 20 interpolation steps for each LV geometry.
From the velocity curves measured with pulsed waves (PW) and continuous waved (CW) Doppler for each patient using the ultrasound scanner, the pressure curves at the LV inlet (mitral valve) and the LV outflow tract were derived directly within the machine using the Bernoulli’s principle [20]:
v 2 2 + g z + p ρ = c o n s t a n t
with v = velocity, g = gravity acceleration, z = elevation of the point above a reference plane, p = pressure at chosen point, and ρ = fluid density.
The pressure curves over one CC at the inlet and outlet of the LV are presented below the end-systolic geometries for each patient in Figure 1. These derived curves are used as boundary conditions at the inlet and outlet during simulation. Additionally, the velocity curves at the LV inlet were further correlated with the resulting flow from computational fluid dynamics (CFD) (for details, see Appendix A, Figure A1).

2.3. Hemodynamic Moving Mesh Simulation

CFD simulations were performed, solving the Navier–Stokes equations using the finite volume solver ANSYS FLUENT 2021 R2 and the moving mesh method. The governing Navier–Stokes equations of the continuity and momentum are shown within (3) and (4):
t V ρ d V + S ρ ( v v b ) n d S = 0
t V ρ v d V + S ( ρ v ( v v b ) + p l τ ) n d S = 0
The moving mesh method is implemented throughout user-defined functions written in the programming language C and compiled within the solver [19]. During each timestep of the simulation, the current mesh was loaded before the fluid solver calculations, with 30 iterations per timestep. Thus, the timestep size depends on the mesh and the cycle duration. Valves were simulated as walls, when closed. Concerning the MI stage, the orifice was assumed as a circular part in the middle of the inlet surface area, which remains a pressure-inlet during systole (~10% of the surface area for MI I and ~20% of the surface area for MI II/III). Blood was assumed to be Newtonian, with a dynamic viscosity of 0.004 Pa × s and incompressible with a density of 1055 kg/m3. A pressure-based coupled solver and a k-ω SST model was used, with an absolute criteria of 10−3 for k and ω [21,22]. Concerning the convergence, residuals for continuity were set to 3 × 10⁻⁴ and to 10−3 for all velocity components, respectively. Since Grünwald et al. [19] determined that flow results reveal cycle independence after the second CC, the simulations ran for three cycles, and the calculated parameters during the third cycle were evaluated.

2.4. Hemodynamic Analysis

Simulation results of the intraventricular blood flow were analyzed in ANSYS EnSight 2021 R2 and MATLAB R2022a (The Mathworks Inc, Natick, MA, USA). Parameters taken into account were the intraventricular velocity (VEL), vorticity (ω), and kinetic energy (KE) [23]. Vorticity is defined with the components ζ x , ζ y , ζ z (using velocity components u, v, w and directions x, y, z):
ζ x = w y v z ,   ζ y = u z w x , ζ z = v x u y  
Kinetic energy is defined as:
KE = 1 2 ρ   ( u 2 + v 2 + w 2 ) 2 ,
Mean values describe the spatial mean inside the ventricle averaged over one CC. Vortex core lines were estimated from the 3D flow field’s velocity gradient tensor using ANSYS EnSight, and the associated vortex core line length (VCL) was calculated during late systole. Statistical tests were performed comparing rest vs. exercise and MI I vs. MI II/III, using a two-sided Student’s t-test with a significance level of p = 0.05.

3. Results

Within this study, the blood flow in patient-specific moving LV geometries was analyzed numerically for 10 patients during rest and exercise. In this section, the resulting chosen hemodynamic parameters, as well as the comparison between rest and exercise and the different MI stages (I and II/II), are presented.

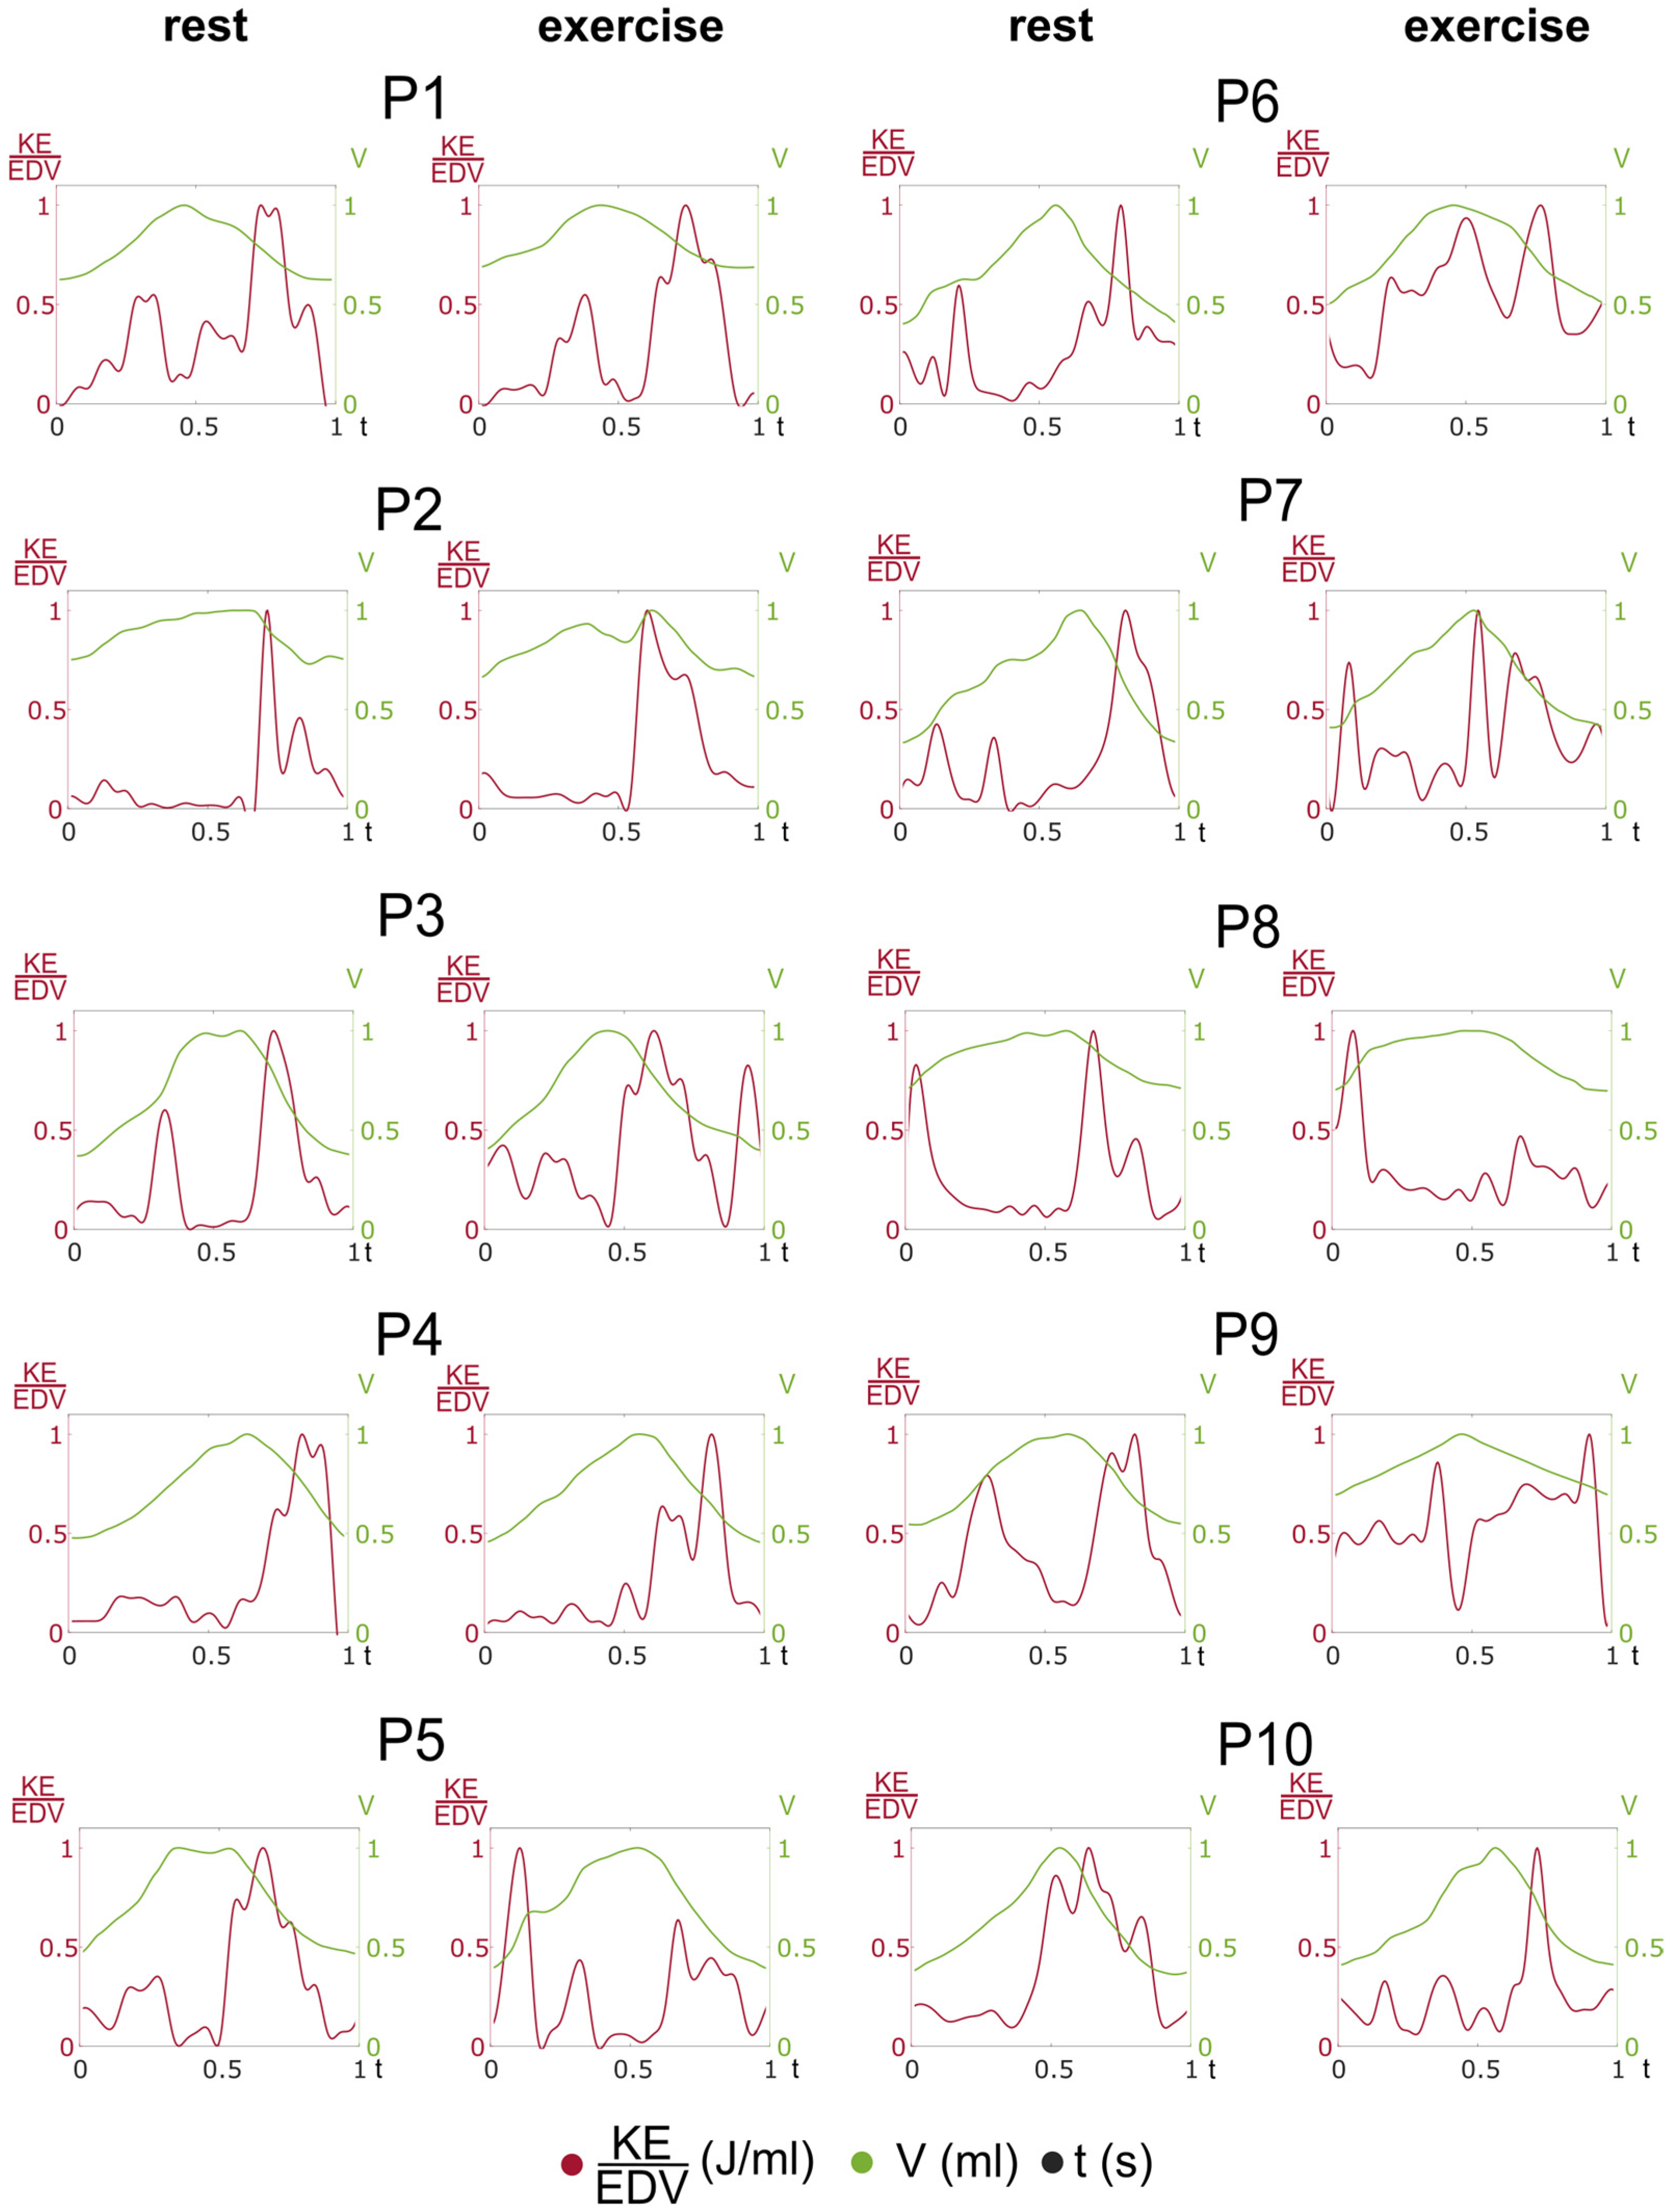
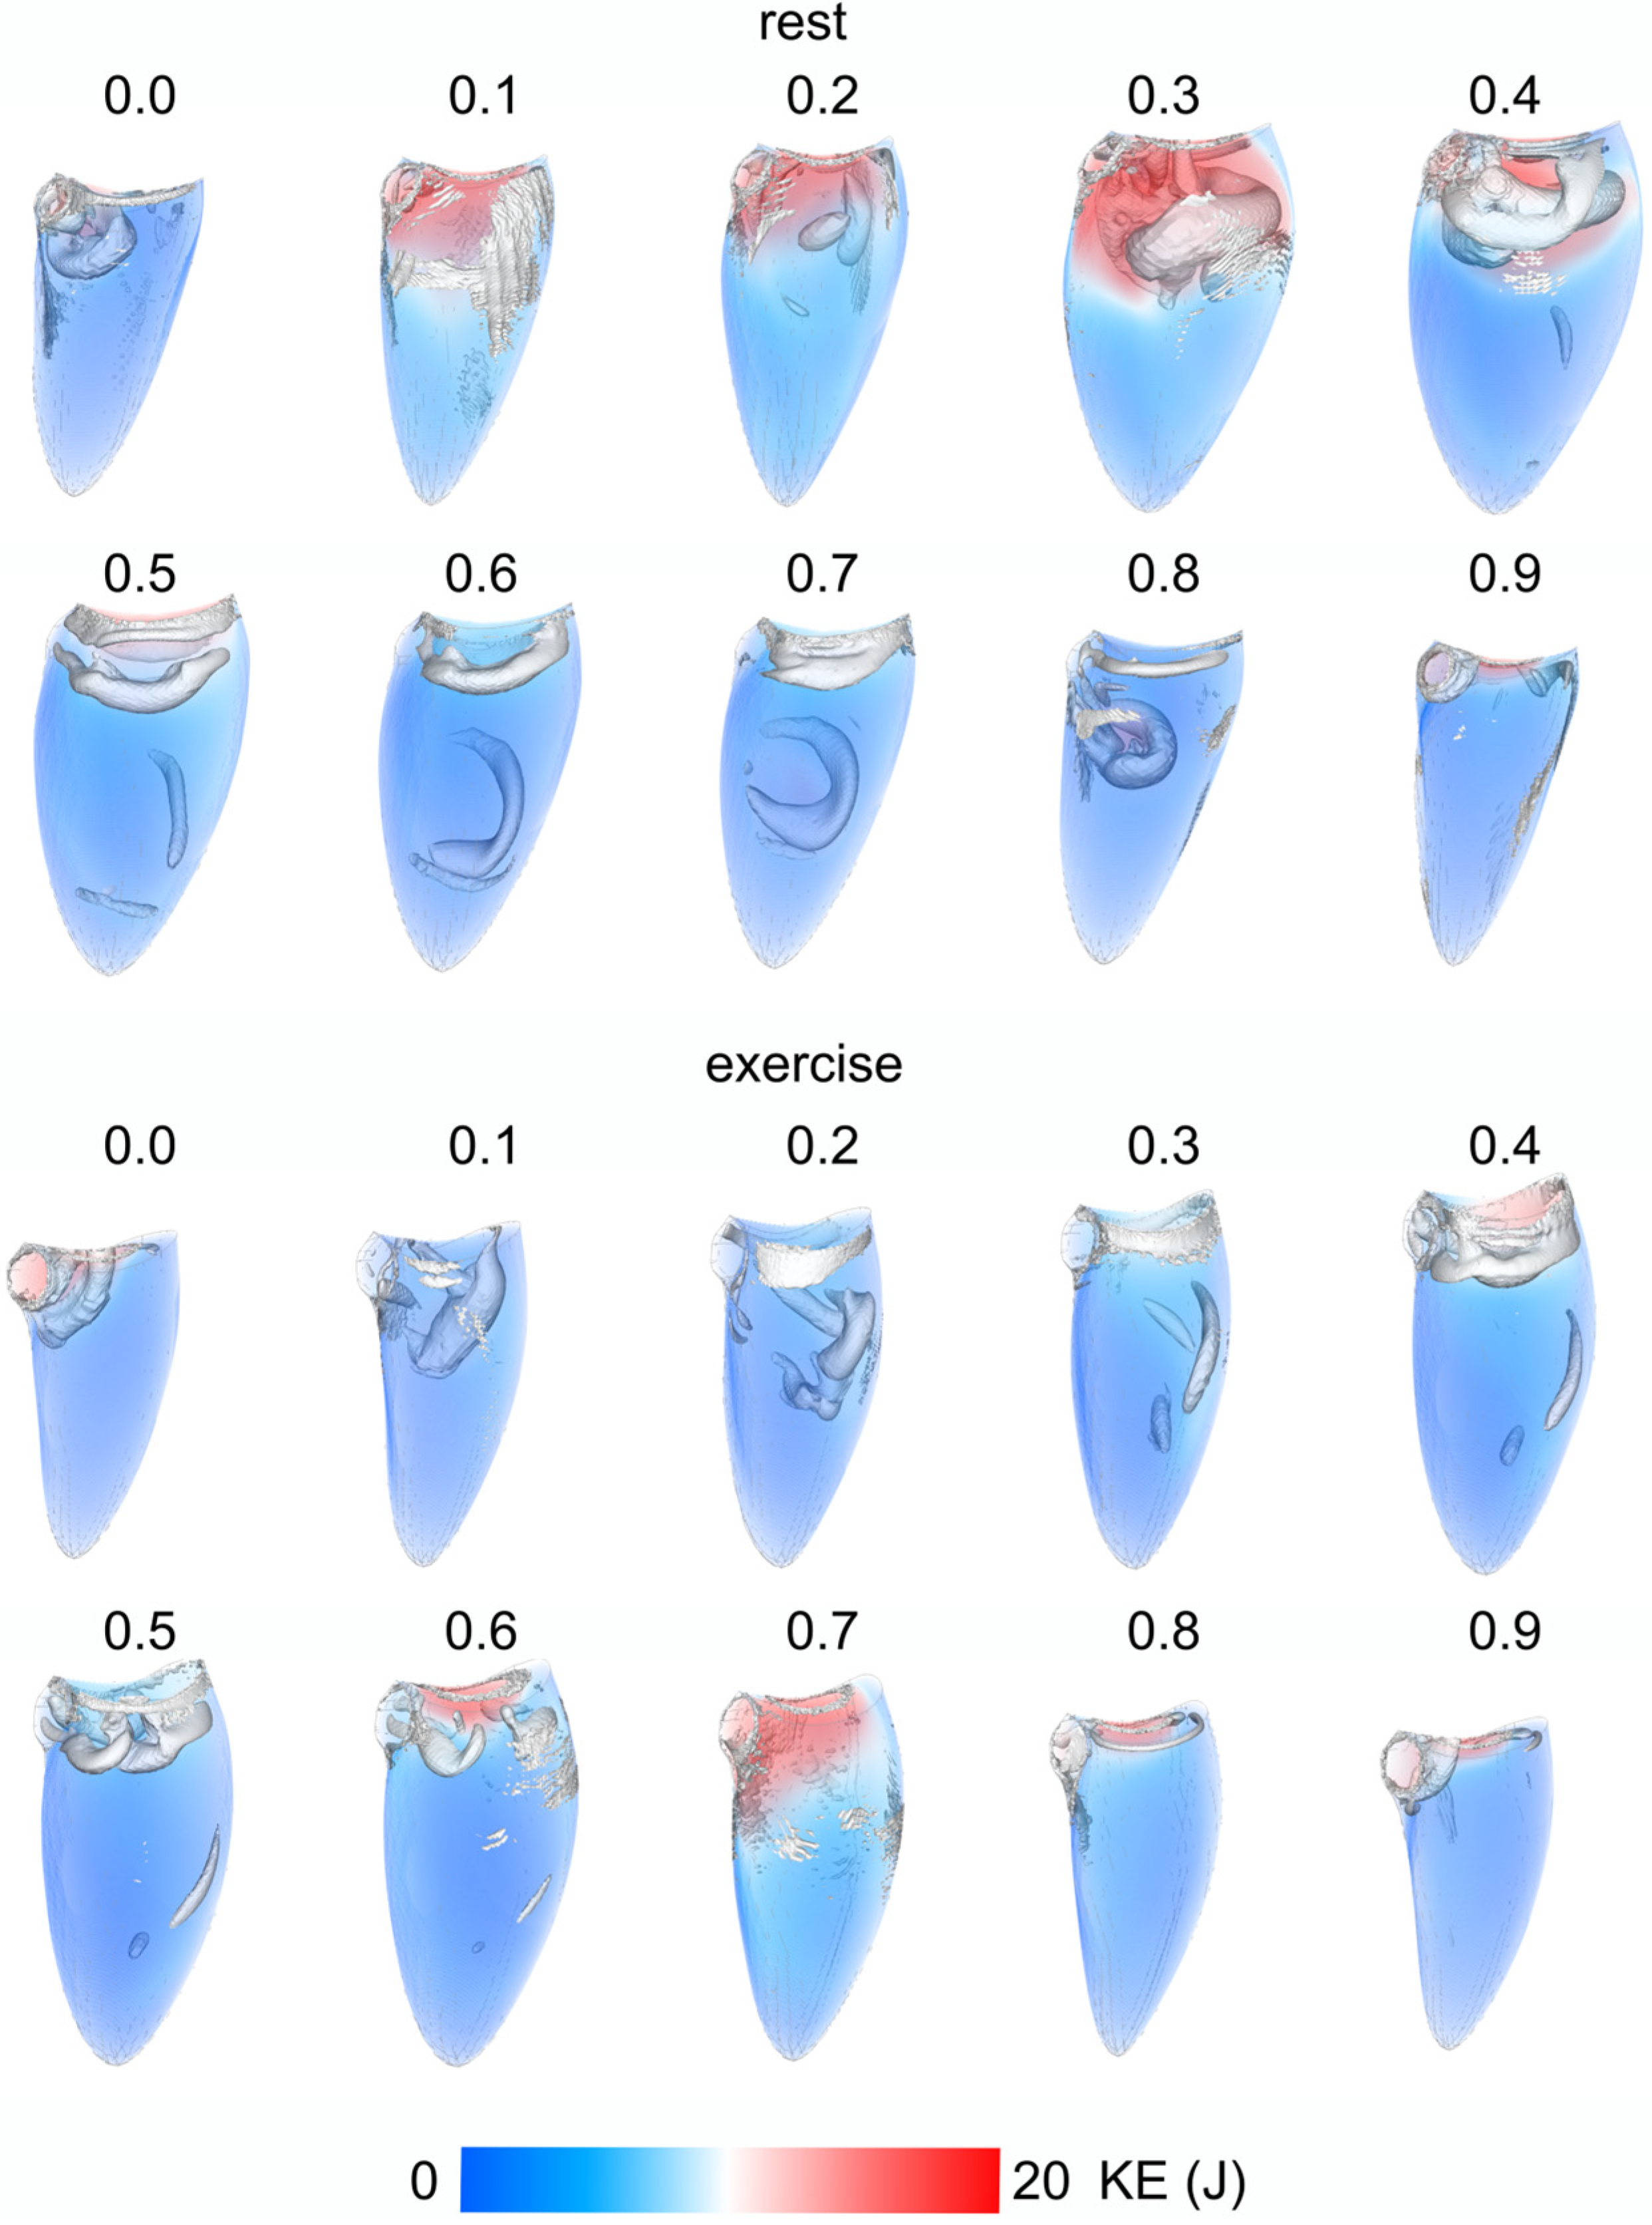
3.1. Intraventricular Kinetic Energy and Volume Curves

The moving mesh method allows for the establishment of a continuous movement of the LV geometries during simulation. In Figure 2, the resulting continuous volume curves of each patient during rest (P1–P5, first, and P6–P10, third column) and exercise (P1–P5, second, and P6–P10, fourth column) are shown in green, along with the resulting kinetic energy curves normalized by EDV (red curves).
For each patient, the curves are normalized by their maximum value to present the progression of the graph and the difference in scale, respectively. The graphs show the dependency of the resulting KE from the ventricular wall movement. For each patient, the decrease in volume results in a peak within the KE graph. As the volume increases, the KE graphs reveal smaller peaks as well. The movement of the LV geometries strongly differs between rest and exercise, not only in volume (see Table 1), but also as indicated: EDV rises during exercise for P1, P5–7; EF rises for P2, P5, and P8, but also in the course of the graph (see Figure 2). The volume curves of P3re (MI I), P4re (cl), P5re (MI I), P8re (MI III), and P9re (MI III) reveal a decrease during diastole before the peak volume is reached and the volume increases again. For P7re (MI II), this decrease appears earlier during the filling phase. This decrease is also presented in the graphs of P2ex (MI I), P7ex (MI III), and P10ex (MI III).
The KE curves (red curves) show peaks during systole, except for P5ex (MI II) and P8ex (MI III). A peak during diastole also occurs for each patient during rest and exercise, except for P2 (MI I), P4 (cl), and P10 (MI III). Concerning the peak waves of the KE graphs, differences between rest and exercise occur only for P8 when looking at the peak formation within the course of the graph. For each patient, this peak is higher during systole than during diastole. Concerning the scale, KE reveals lower values within patients with MI II/III (P7–10) than within P2–5 (MI I). Higher KE is visible, especially for patients with MI I (P1–5). Only P7 (MI II/III) and P10 (MI III) reveal high KE during systole. For each patient at rest, despite P1 (MI I), KE is higher during systole than during diastole. Within exercising patient results, KE is lower during systole for P1–5 (MI I) and higher for P6–10 (MI II/III).
A qualitative visualization of the KE distribution and the vortex formation (using isosurfaces of the Q-criterion Q = 200 1/s2) within one patient (P10), over 10 timesteps per CC during rest and exercise can be found in the Appendix A, Figure A2. Videos showing the continuously moving LV of patient 6 during rest and exercise, with the qualitative KE distribution and vortex formation, can be found in the Supplementary Material (Video S1 and S2).

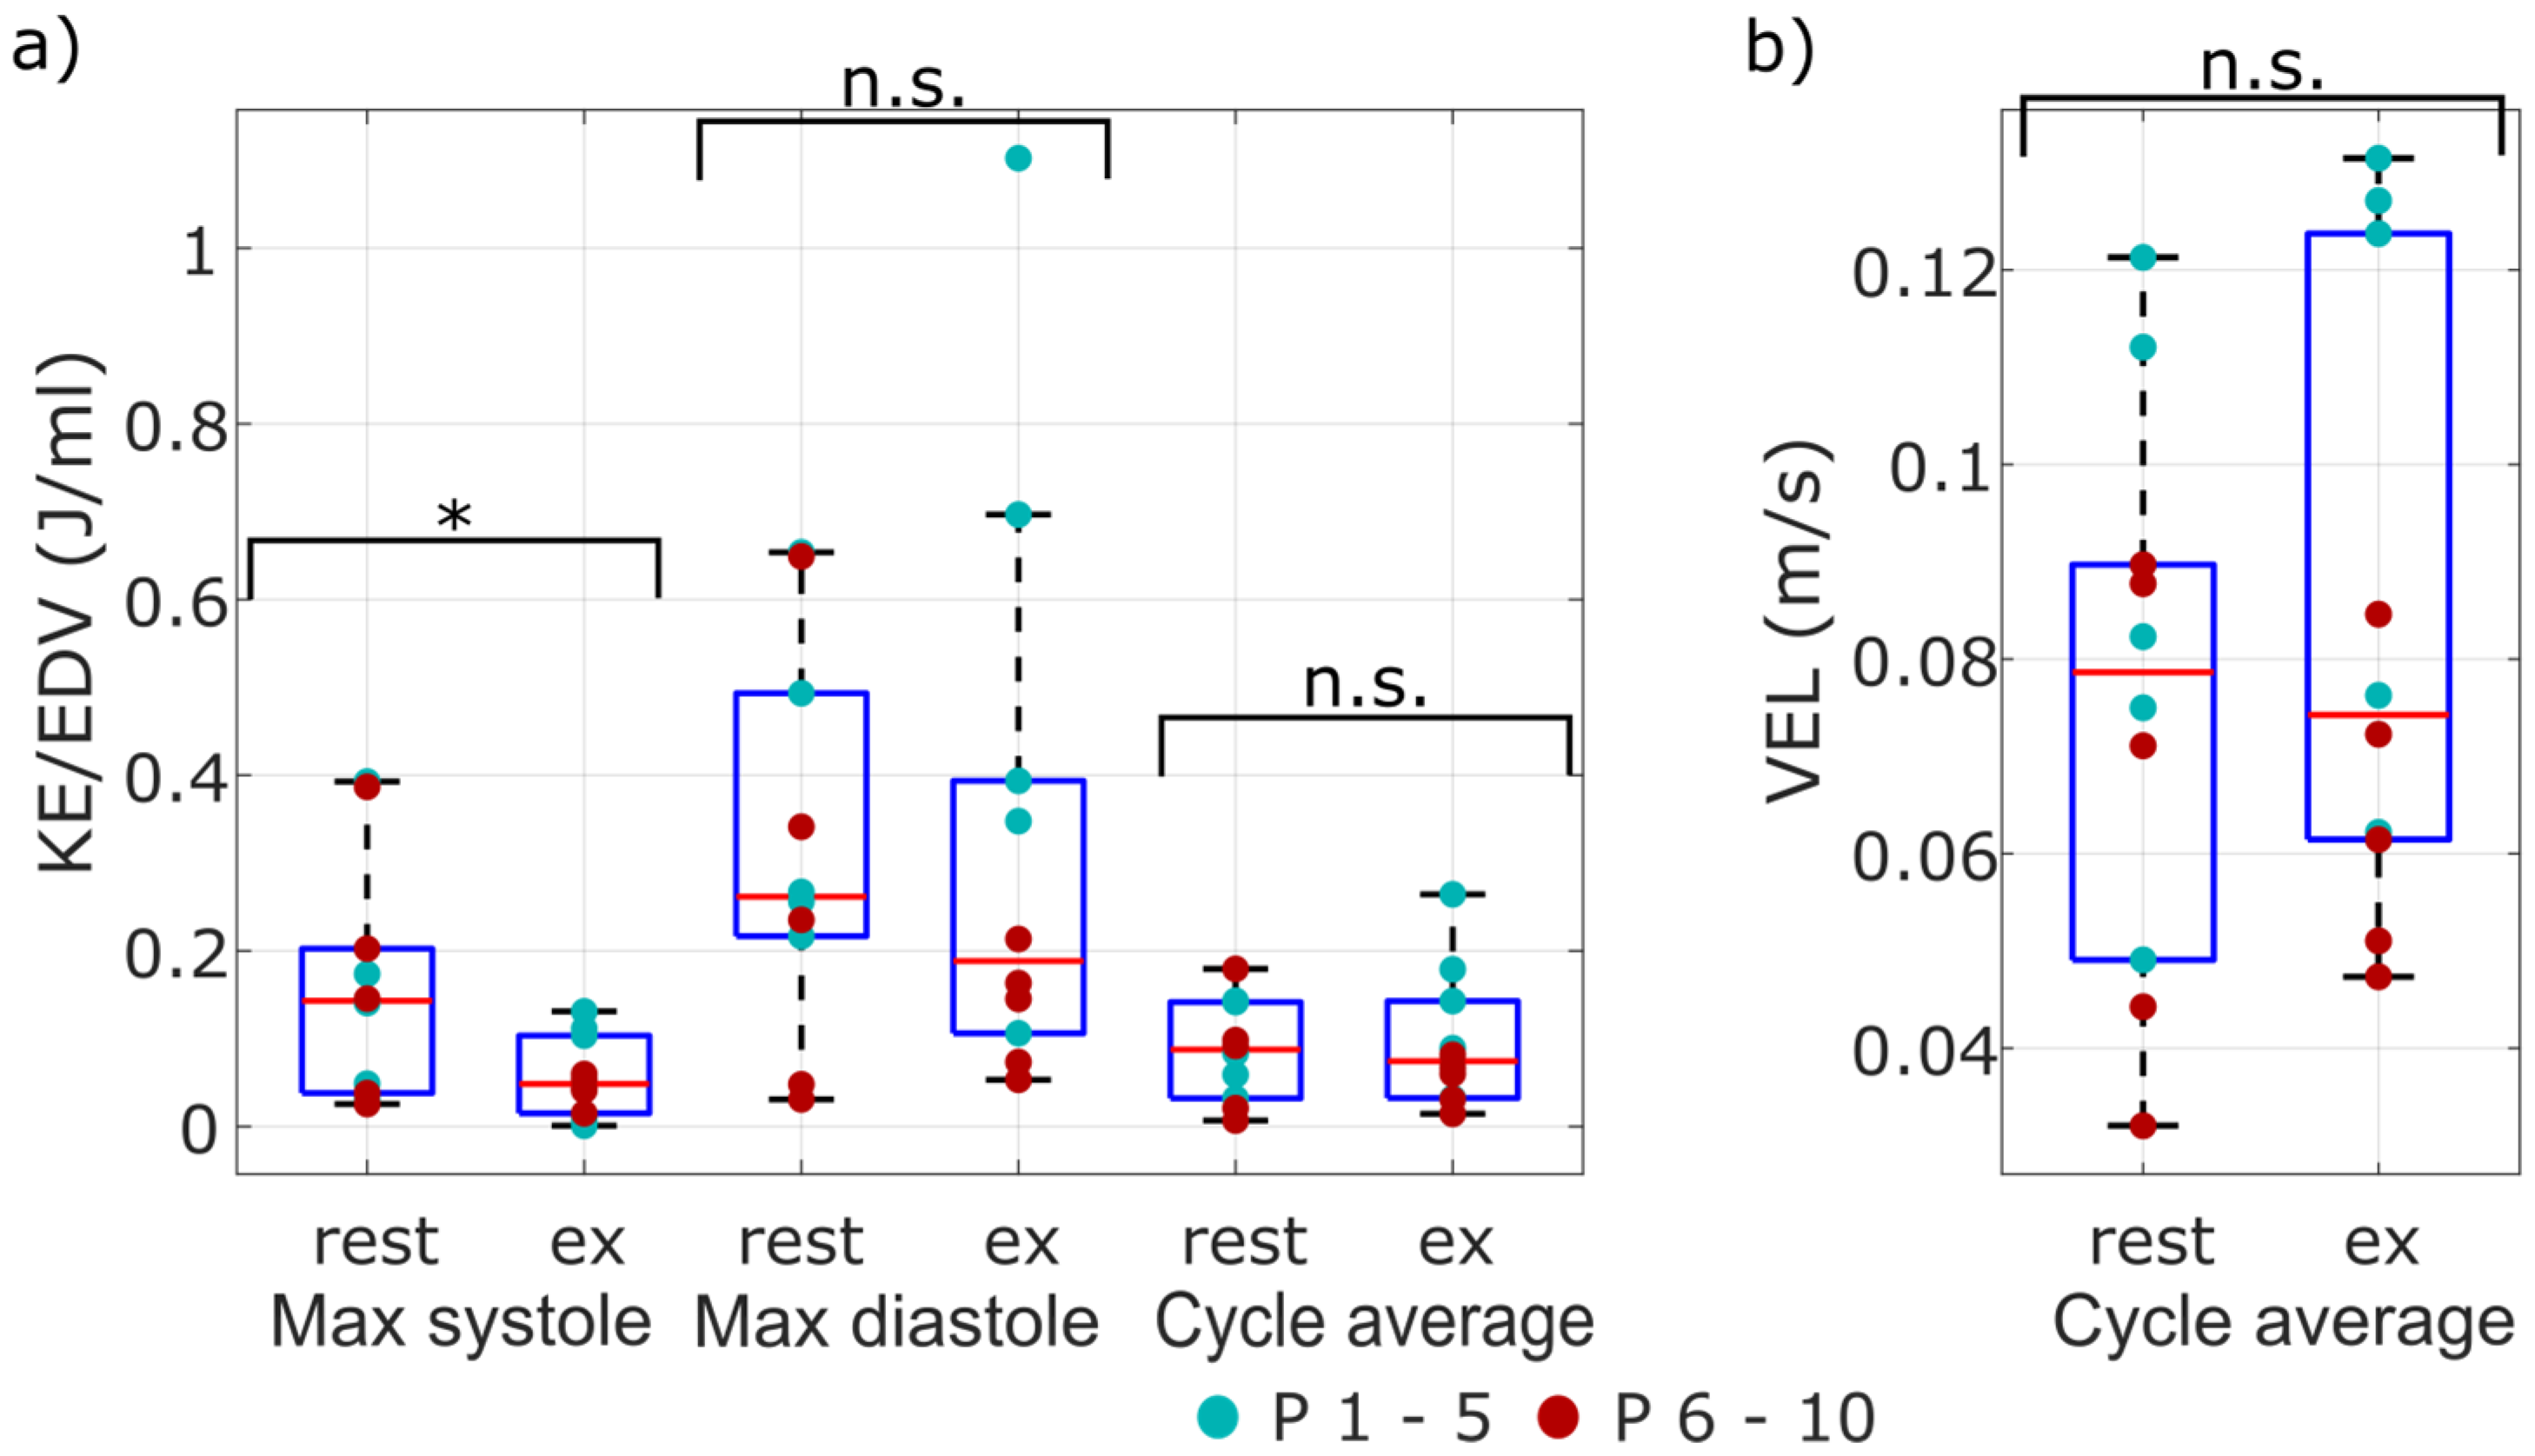
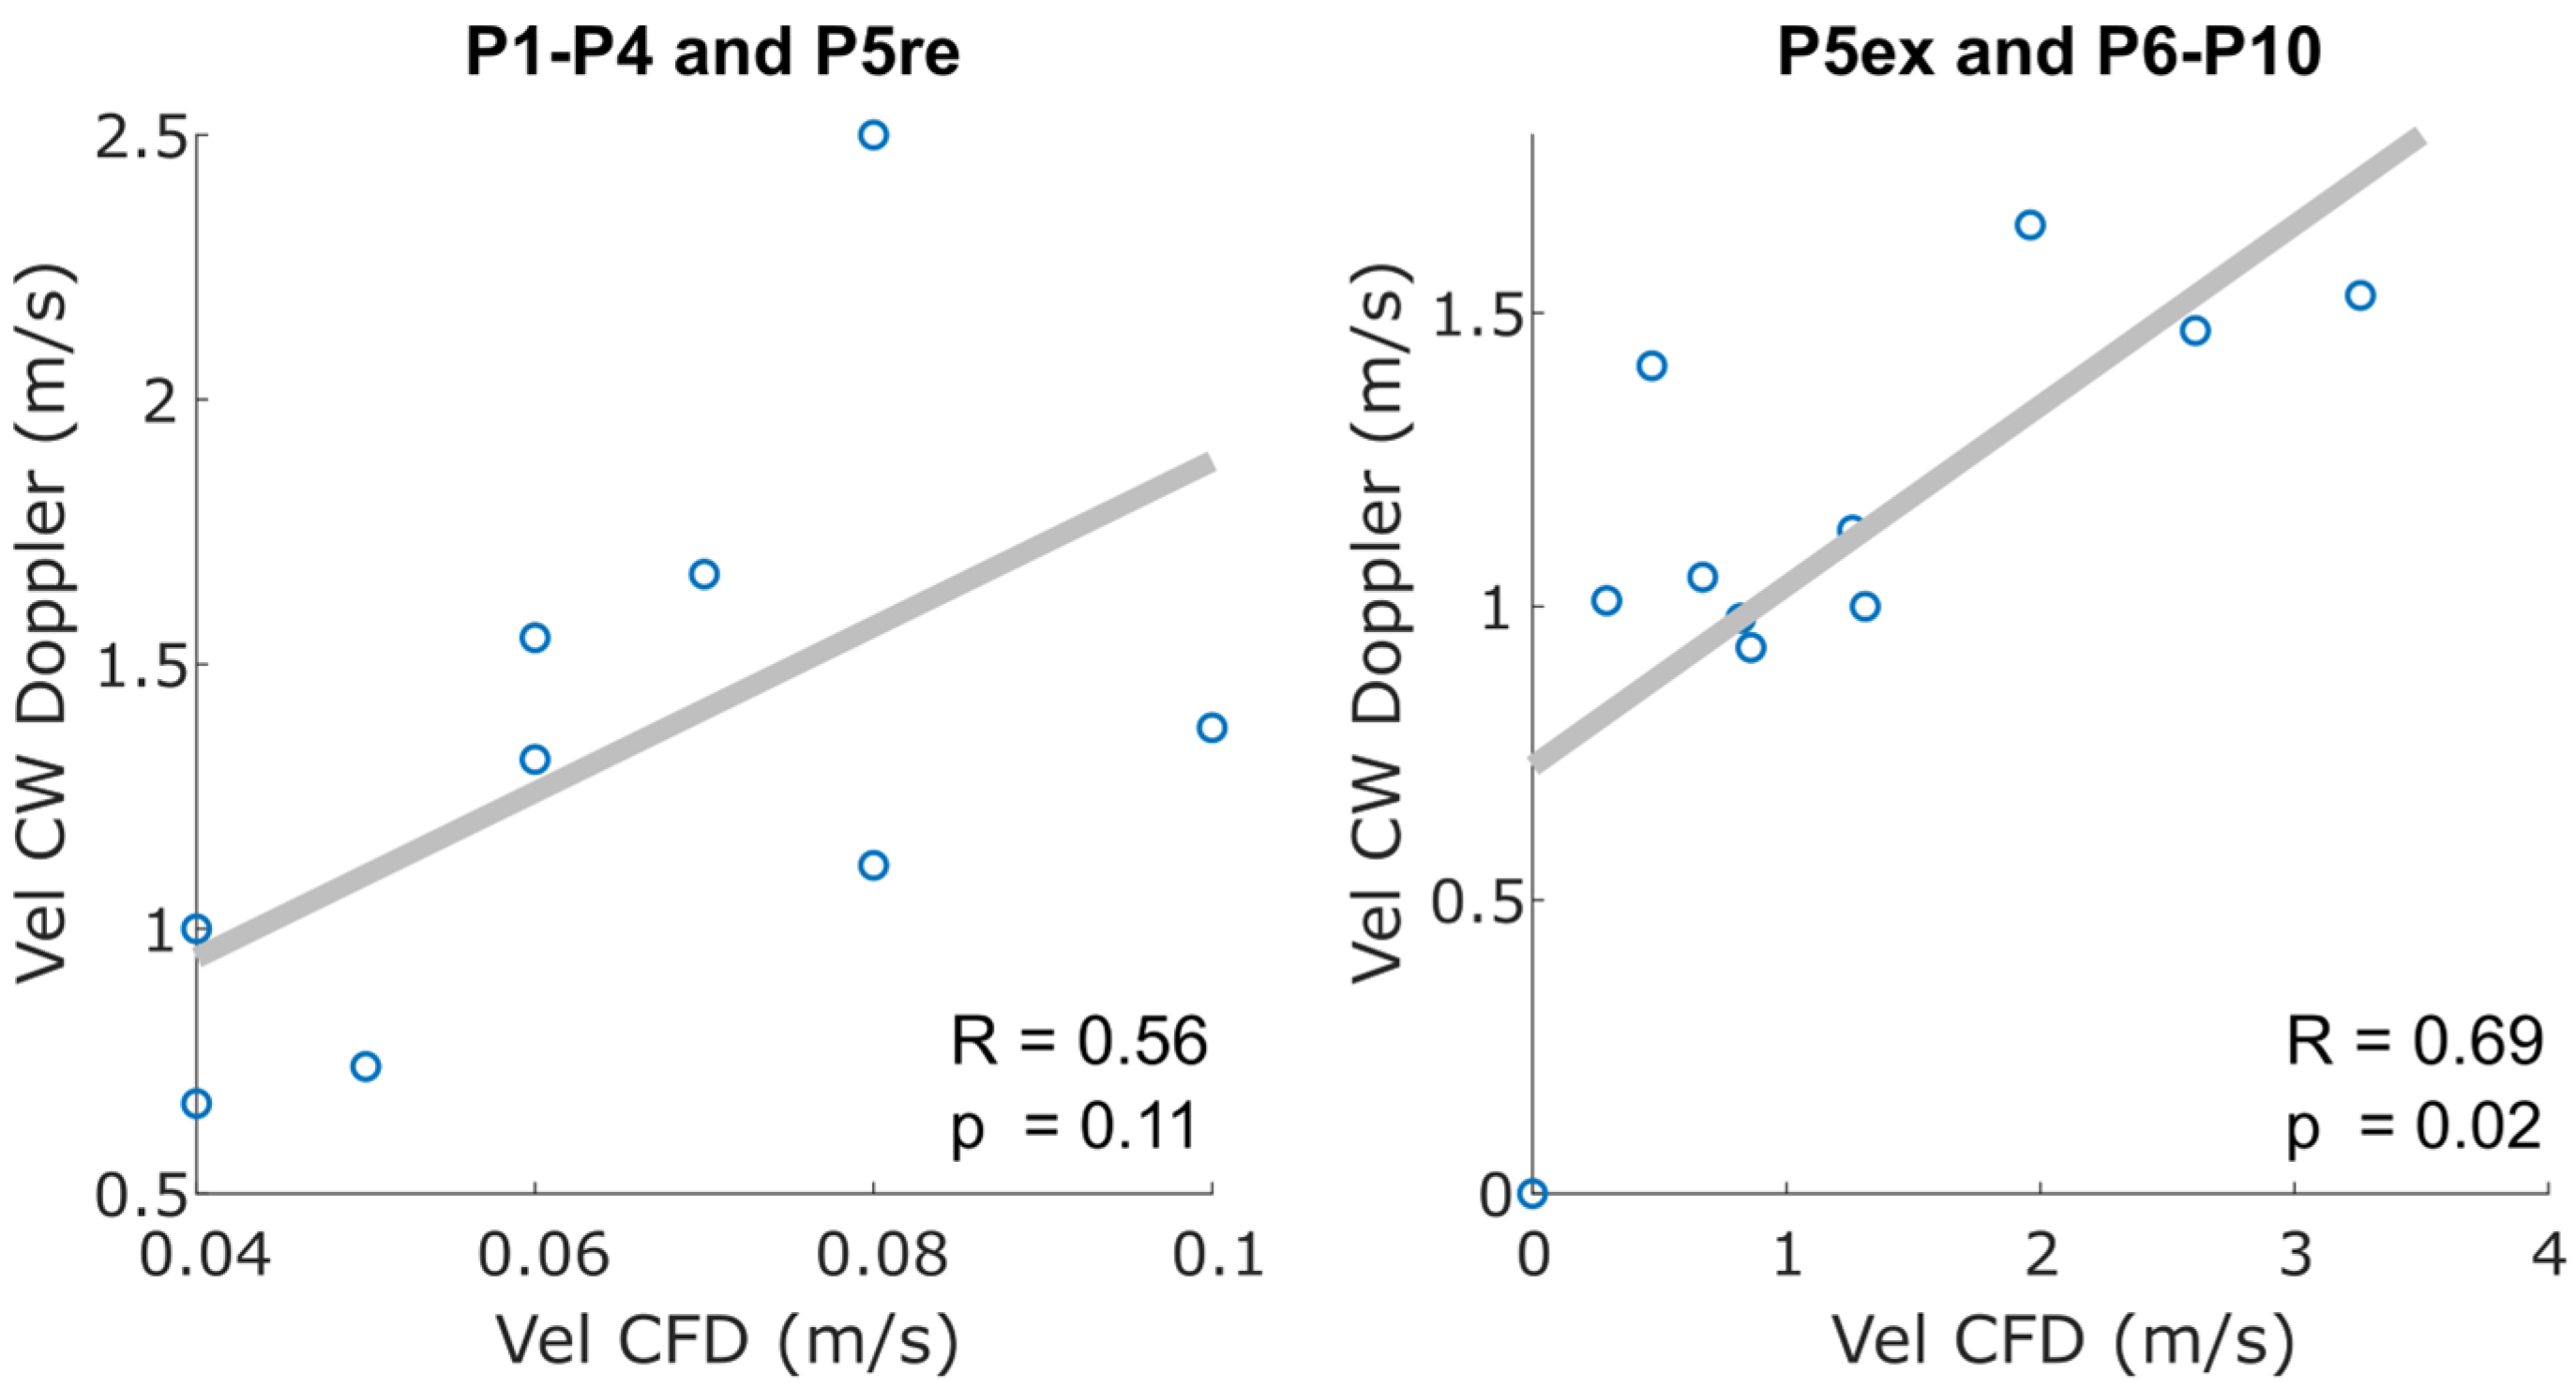
3.2. Hemodynamic Intraventricular Average and Peak Parameters

Mean values (mean over all patients) of VCL (end-systolic state), ω (spatial and temporal average), KE/EDV (spatial and temporal average), VEL (spatial and temporal average), max sys KE/EDV (peak during systole), and max dias EDV (peak during diastole) are shown in Table 2. Details on the patient-specific hemodynamic parameters can be found in Appendix A, Table A1.
The mean values of VCL are lower during rest for P1–P10, but do not show statistical significance (p-value = 0.36). Max sys KE/EDV is significantly lower during exercise (p-value = 0.04). Mean values reveal differences between rest and exercise for KE, ω, VEL, and max dias KE/EDV as well, but no significance was found. To analyze the values specific for each patient, the scatterplots of kinetic energy (max and mean values) and velocity (spatial and temporal mean) are shown in Figure 3. Values of patients with MI I are marked with green dots, and values of patients with MI II/III are marked with red dots, respectively. Specifically for the mean velocity, the values of P1–5 (MI I) are higher than those of P6–10 (MI II/III) for rest and exercise.
In Table 3, the comparison between patients with MI I and with MI II/III is shown. The mean values during rest and exercise for both cohorts reveal differences for KE/EDV (p-value = 0.08) and max sys KE/EDV (p-value = 0.80). The results show significant differences for VEL (p-value = 0.01) and max dias KE/EDV (p-value = 0.03).

4. Discussion

In this study, the LV function of patients with MI during rest and exercise conditions was analyzed by specifically taking the patient-specific wall motion into account. This was carried out by acquiring US scanning and PW/CW-Doppler measurements during rest and exercise and performing image-based blood flow simulations of the moving LV at both states. With US, a medical imaging technology is chosen, providing major clinical applicability [24]. Due to negligible risks for the patients, echocardiography is useful for MI with exercise, as analyzed by Voilliot et al. [25]. In contrast to CT or MRI imaging, US is a low-cost method, which is easily accessible for clinicians [26,27].
Based on the US measurements and the interpolation method, a continuous wall movement could be established within the simulations. The results show the dependency of the kinetic energy on the volume (recall Figure 2). This stands in agreement with the findings of Al-Wakeel et al. [28], who showed that KE and volume can be related in left ventricular hemodynamics in patients with MI.
The comparison of resulting intraventricular hemodynamics between rest and exercise revealed differences in the max systolic KE (normalized by EDV), with a lower value occurring during exercise (p = 0.04). This observation is in accordance to Grewal et al. [29], who identified that the exercise capacity for patients with a mild heart dysfunction is lower than for hearts with normal function. Thus, systolic KE might be a marker for cardiac function in patients with MI.
Additionally, differences in ω and in vortex formation during late diastole by looking at the VCL for rest vs. exercise was observed (recall Table 2). Higher ω and VCL occur during exercise, but when comparing the different MI stages, higher ω occurs during rest in patients with MI II/III. This is in line with ref. [30], who investigated several vortices in LVs in patients with MI compared to less left ventricular vortex formation in probands. However, these differences were not statistically significant, and further statements concerning the comparison between rest and exercise could be made.
When looking at the comparison between patients with MI I and MI II/III, velocity and max diastolic KE (normalized by EDV) particularly showed higher results for patients with MI I than with MI II/III (significant for velocity with a p-value = 0.03 and for max diastolic KE/EDV with a p-value = 0.01). This goes in line with the resulting EF (see Table 1), since the EF for patients with MI II/III was lower during exercise than during rest, which stands in agreement with [29] as well. This leads to the assumption that the LV function is lower under exercise for patients with heart dysfunction.
This study has several limitations. First, the underlying segmentation is a limitation of this study. Since the implementation of the moving mesh method allows for the simulation of the patient-specific ventricular wall movement, the effect of this movement on the intraventricular hemodynamics can be analyzed. Within this study, the high impact of the movement is shown, as can be seen in Figure 2. Kinetic energy curves depend on the volume change of the LVs. Since the TomTec software is used to automatically segment the patient data, the ventricular walls are unrealistically smooth and therefore, biased.
Second, the valves are simplified and represented as surface areas, leading to the assumption of a circular orifice area during systole of patients with MI II/III. The effect of the valve on the flow is not reflected in this analysis. Nevertheless, the patient-specific wall movement is captured and used in the simulation, and the underlying segmentation method was equal for each patient. This leads to an equally biased analysis of the flow parameters, which can be used as a basis for further investigations. There is still the possibility in the provided method to use improved segmentations, including valves. The overall (wall and valves) patient-specific LV movement could then be used as a boundary condition in the moving mesh simulation, presenting reliable results for the intraventricular blood flow.
Finally, substantial differences of inflow velocities at the mitral valve were observed for all patients. For patients with MI I, the results exhibit a very low degree of correlation to the experimental data. Still, the inlet velocity values of patients with MI II/III correlate to the CW Doppler results (R = 0.69, p = 0.02; see Appendix A, Figure A1). The difference might be caused by the modeling approach of the inflow section into the moving domain with MI II/III. Simulations of patients with MI I (P1–P4 and P5re) were performed with the valve areas as closed surfaces during the filling (AV closed) and ejection (MV closed) phases. Patients with MI II/III (P5ex, P6–P10) were modeled with an orifice at the inlet surface area during the ejection phase. Since the blood is assumed to be incompressible, the LV wall movement has the strongest effect on the incoming velocity curves using this approach. When performing simulations on patients with MI, the inlet surface area is never fully closed, and the pressure boundary curves have a higher effect on the inlet VEL. This limitation can be traced back to the lacking segmentation, since it is assumed that with a more precise segmentation (including segmentation of the valves), hemodynamics could appear to be more realistic.
Despite these limitations, the approach in this study provides a useful tool to investigate cardiac function on a patient-specific basis using non-invasive imaging data. The results reveal differences in cardiac function of MI patients between rest and exercise and underline the variations for different MI stages. The implemented workflow for the data processing and hemodynamic simulations allows for the analysis of the movement of the patient-specific human ventricular wall and its impact onto the intraventricular flow. Advantages of this numerical analysis are the highly resolved results of the flow field and the non-invasive patient-specific data acquisition via US. The latter is especially important for patients with existing heart failure, since invasive treatment can have fatal consequences [31].
Future work will include the improvement of the segmentation to obtain a more realistically shaped ventricle. Here, the comparison to higher resolved medical imaging techniques (e.g., MRI) will be taken into account. This includes the implementation of the LV valves, either by improved segmentation or through manual reconstruction. Moreover, a larger amount of patient data can increase the clinical significance of the results. This also includes the comparison to a proband cohort, without heart failure as a control. Additionally, the validation of the intraventricular blood flow will be part of the future work, although different approaches are possible. For instance, Xu et al. [32] showed the validation of CFD velocity curves using particle image velocimetry (PIV) results after implementing a moving mesh method. Eriksson et al. [33] carried out an analysis of the hemodynamics with medical imaging (cardiac magnetic resonance). Combining imaging techniques would not only serve as a possible validation, but also as a basis for the method to be improved in regards to segmentation and temporal resolution.

5. Conclusions

In this study, an analysis of LV functions for patients with MI during rest and exercise using patient-specific wall movement is carried out. By using patient-specific US data and implementing the captured wall movement into the simulation, patient-specific results for hemodynamic parameters were calculated. The results reveal significant differences between rest and exercise for max systolic KE (p-value = 0.04). Differences are found between patients with MI I and MI II/III for mean VEL and max diastolic KE, respectively. The KE curves over a cardiac cycle reveal a dependency on the volume change for each patient, which leads to the conclusion that a precise segmentation of the ventricular wall movement is crucial for deriving patient-specific blood flow parameters. The feasibility of the proposed workflow is shown within this study, and it can be implemented onto a larger cohort of patients.

Supplementary Materials

The following supporting information can be downloaded at: https://www.mdpi.com/article/10.3390/fluids8020071/s1, Video S1: Ventricle vortex formation and kinetic energy distribution in P6 during rest; Video S2: Ventricle vortex formation and kinetic energy distribution in P6 during exercise.

Author Contributions

Conceptualization, J.K., T.R. and A.S.; methodology, J.K.; software, J.K., T.R., M.N. and J.-N.T.; validation, J.K.; formal analysis, J.K.; investigation, J.K.; resources, J.K., J.-N.T., M.N. and P.B.; data curation, J.K., T.R., A.S., A.M., P.B. and R.B.-D.; writing—original draft preparation, J.K.; writing—review and editing, J.K., T.R., A.M., J.-N.T., P.B. and M.N.; visualization, J.K. and P.G.; supervision, P.B.; project administration, J.K.; funding acquisition, P.B. All authors have read and agreed to the published version of the manuscript.

Funding

This study was funded by the German Federal Ministry of Education and Research within the Research Campus STIMULATE (grant no. 13GW0473A) and the German Research Foundation (SPP2311, project number: 465189657). The CIRCUS study (Comparison of Impedance Cardiography with Right Heart Catheterization and Ultrasound, German Clinical Trials Register, DRKS00015635) was supported by the Research Network, “Autonomy in Old Age” (EFRE IP* 1a—EU Structural Funds).

Institutional Review Board Statement

The study was conducted in accordance with the Declaration of Helsinki, and approved by the Institutional Review Board of University of Magdeburg and University hospital Magdeburg (protocol code: DRKS00015635, 22 May 2017).

Informed Consent Statement

Informed consent was obtained from all subjects involved in the study.

Data Availability Statement

The data presented in this study are available on request from the corresponding author. The data are not publicly available.

Conflicts of Interest

The authors declare that they have no conflict of interest.

Appendix A

Figure A1. Correlation of max values at the inlet boundary measured with CW Doppler and calculated with computational fluid dynamic (CFD) simulations for each patient during rest and exercise.
Fluids 08 00071 g0a1
Figure A2. Ventricle vortex formation (isosurfaces Q-criterion Q = 200 1/s2, shown in white) and kinetic energy distribution (shown with volume rendering) in P10 for 10 LV instances over one CC. Instances are normalized by CC period, and are shown above each visualization.
Fluids 08 00071 g0a2
Table A1. Patient-specific hemodynamic parameters: Vortex core length during late systole and all remaining parameters, spatially and temporally (over one CC) averaged.
CaseVCL (m)Mean Vorticity (1/s)Mean KE (J)Mean VEL (m/s)
reexreexreexreex
10.010.3913.469.5711.074.390.110.06
20.46 0.6910.2335.233.4116.340.050.12
300.0722.6124.0415.4514.860.120.13
40.17 0.1810.7415.026.306.790.070.08
50.27 0.2621.7028.698.0416.560.080.13
Mean0.18 0.3215.7522.518.8511.790.090.10
Std0.170.215.359.234.135.140.030.03
60.10 0.1829.3422.097.345.930.090.08
70.160.2117.7016.654.644.270.070.07
80.280.236.8110.340.961.920.030.05
90.290.198.50 7.581.961.940.040.05
100.300.2723.8217.407.81 3.510.090.06
Mean0.230.2217.2314.814.543.510.060.06
Std0.08 0.038.665.202.761.510.020.01

References

  1. Faletra, F.; La Marchesina, U.; Bragato, R.; Grimaldi, A. Insufficienza mitralica. Ital. Heart J. Suppl. 2002, 3, 486–494. [Google Scholar] [PubMed]
  2. Nkomo, V.T.; Gardin, J.M.; Skelton, T.N.; Gottdiener, J.S.; Scott, C.G.; Enriquez-Sarano, M. Burden of valvular heart diseases: A population-based study. Lancet 2006, 368, 1005–1011. [Google Scholar] [CrossRef] [PubMed]
  3. Nagai, T.; Anzai, T. NYHA functional classification and AHA/ACC Stages for heart failure management. Nihon rinsho. Jpn. J. Clin. Med. 2016, 74 (Suppl. 6), 340–344. [Google Scholar]
  4. Sugimoto, T.; Bandera, F.; Generati, G.; Alfonzetti, E.; Barletta, M.; Losito, M.; Labate, V.; Rovida, M.; Caracciolo, M.; Pappone, C.; et al. Left Atrial Dynamics During Exercise in Mitral Regurgitation of Primary and Secondary Origin: Pathophysiological Insights by Exercise Echocardiography Combined With Gas Exchange Analysis. JACC Cardiovasc. Imaging 2020, 13, 25–40. [Google Scholar] [CrossRef]
  5. Izem, O.; Maufrais, C.; Obert, P.; Rupp, T.; Schuster, I.; Nottin, S. Kinetics of Left Ventricular Mechanics during Transition from Rest to Exercise. Med. Sci. Sports Exerc. 2019, 51, 1838–1844. [Google Scholar] [CrossRef] [PubMed]
  6. Zoghbi, W.A.; Adams, D.; Bonow, R.O.; Enriquez-Sarano, M.; Foster, E.; Grayburn, P.A.; Hahn, R.T.; Han, Y.; Hung, J.; Lang, R.M.; et al. Recommendations for Noninvasive Evaluation of Native Valvular Regurgitation: A Report from the American Society of Echocardiography Developed in Collaboration with the Society for Cardiovascular Magnetic Resonance. J. Am. Soc. Echocardiogr. 2017, 30, 303–371. [Google Scholar] [CrossRef] [PubMed]
  7. Vakil, K.; Roukoz, H.; Sarraf, M.; Krishnan, B.; Reisman, M.; Levy, W.C.; Adabag, S. Safety and efficacy of the MitraClip® system for severe mitral regurgitation: A systematic review. Catheter. Cardiovasc. Interv. 2014, 84, 129–136. [Google Scholar] [CrossRef] [PubMed]
  8. Borazjani, I.; Westerdale, J.; McMahon, E.M.; Rajaraman, P.K.; Heys, J.J.; Belohlavek, M. Left Ventricular Flow Analysis: Recent Advances in Numerical Methods and Applications in Cardiac Ultrasound. Comput. Math. Methods Med. 2013, 2013, 395081. [Google Scholar] [CrossRef] [Green Version]
  9. Collia, D.; Zovatto, L.; Tonti, G.; Pedrizzetti, G. Comparative Analysis of Right Ventricle Fluid Dynamics. Front. Bioeng. Biotechnol. 2021, 9, 667408. [Google Scholar] [CrossRef]
  10. Larsson, D.; Spuhler, J.H.; Petersson, S.; Nordenfur, T.; Colarieti-Tosti, M.; Hoffman, J.; Winter, R.; Larsson, M. Patient-Specific Left Ventricular Flow Simulations From Transthoracic Echocardiography: Robustness Evaluation and Validation Against Ultrasound Doppler and Magnetic Resonance Imaging. IEEE Trans. Med. Imaging 2017, 36, 2261–2275. [Google Scholar] [CrossRef]
  11. Nguyen, V.-T.; Wibowo, S.N.; Leow, Y.A.; Nguyen, H.-H.; Liang, Z.; Leo, H.L. A Patient-Specific Computational Fluid Dynamic Model for Hemodynamic Analysis of Left Ventricle Diastolic Dysfunctions. Cardiovasc. Eng. Technol. 2015, 6, 412–429. [Google Scholar] [CrossRef]
  12. Goubergrits, L.; Vellguth, K.; Obermeier, L.; Schlief, A.; Tautz, L.; Bruening, J.; Lamecker, H.; Szengel, A.; Nemchyna, O.; Knosalla, C.; et al. CT-Based Analysis of Left Ventricular Hemodynamics Using Statistical Shape Modeling and Computational Fluid Dynamics. Front. Cardiovasc. Med. 2022, 9, 901902. [Google Scholar] [CrossRef] [PubMed]
  13. Obermeier, L.; Vellguth, K.; Schlief, A.; Tautz, L.; Bruening, J.; Knosalla, C.; Kuehne, T.; Solowjowa, N.; Goubergrits, L. CT-Based Simulation of Left Ventricular Hemodynamics: A Pilot Study in Mitral Regurgitation and Left Ventricle Aneurysm Patients. Front. Cardiovasc. Med. 2022, 9, 828556. [Google Scholar] [CrossRef] [PubMed]
  14. Bavo, A.; Pouch, A.; Degroote, J.; Vierendeels, J.; Gorman, J.; Gorman, R.; Segers, P. Patient-specific CFD models for intraventricular flow analysis from 3D ultrasound imaging: Comparison of three clinical cases. J. Biomech. 2017, 50, 144–150. [Google Scholar] [CrossRef] [PubMed] [Green Version]
  15. Hilberath, J.N.; Oakes, D.A.; Shernan, S.K.; Bulwer, B.E.; D’Ambra, M.N.; Eltzschig, H.K. Safety of Transesophageal Echocardiography. J. Am. Soc. Echocardiogr. 2010, 23, 1115–1127. [Google Scholar] [CrossRef] [PubMed]
  16. Matulevicius, S.A.; Rohatgi, A.; Das, S.R.; Price, A.L.; DeLuna, A.; Reimold, S.C. Appropriate Use and Clinical Impact of Transthoracic Echocardiography. JAMA Intern. Med. 2013, 173, 1600–1607. [Google Scholar] [CrossRef]
  17. Marino, P.N.; Zanaboni, J.; Degiovanni, A.; Sartori, C.; Patti, G.; Fraser, A.G. Left atrial conduit flow rate at baseline and during exercise: An index of impaired relaxation in HFpEF patients. ESC Hear. Fail. 2021, 8, 4334–4342. [Google Scholar] [CrossRef]
  18. Bakkestrøm, R.; Banke, A.; Christensen, N.L.; Pecini, R.; Irmukhamedov, A.; Andersen, M.; Borlaug, B.A.; Møller, J.E. Hemodynamic Characteristics in Significant Symptomatic and Asymptomatic Primary Mitral Valve Regurgitation at Rest and During Exercise. Circ. Cardiovasc. Imaging 2018, 11, e007171. [Google Scholar] [CrossRef] [Green Version]
  19. Grünwald, A.; Korte, J.; Wilmanns, N.; Winkler, C.; Linden, K.; Herberg, U.; Groß-Hardt, S.; Steinseifer, U.; Neidlin, M. Intraventricular Flow Simulations in Singular Right Ventricles Reveal Deteriorated Washout and Low Vortex Formation. Cardiovasc. Eng. Technol. 2021, 13, 495–503. [Google Scholar] [CrossRef]
  20. Qin, R.; Duan, C. The principle and applications of Bernoulli equation. J. Physics: Conf. Ser. 2017, 916, 012038. [Google Scholar] [CrossRef]
  21. Zhang, J.; Zhang, P.; Fraser, K.; Griffith, B.P.; Wu, Z.J. Comparison and Experimental Validation of Fluid Dynamic Numerical Models for a Clinical Ventricular Assist Device. Artif. Organs 2013, 37, 380–389. [Google Scholar] [CrossRef] [PubMed] [Green Version]
  22. Ghodrati, M.; Khienwad, T.; Maurer, A.; Moscato, F.; Zonta, F.; Schima, H.; Aigner, P. Validation of numerically simulated ventricular flow patterns during left ventricular assist device support. Int. J. Artif. Organs 2021, 44, 30–38. [Google Scholar] [CrossRef] [PubMed]
  23. Mut, F.; Löhner, R.; Chien, A.; Tateshima, S.; Viñuela, F.; Putman, C.; Cebral, J.R. Computational hemodynamics framework for the analysis of cerebral aneurysms. Int. J. Numer. Methods Biomed. Eng. 2011, 27, 822–839. [Google Scholar] [CrossRef] [PubMed] [Green Version]
  24. Cheitlin, M.D.; Armstrong, W.F.; Aurigemma, G.P.; A Beller, G.; Bierman, F.Z.; Davis, J.L.; Douglas, P.S.; Faxon, D.P.; Gillam, L.D.; Kimball, T.R.; et al. ACC/AHA/ASE 2003 guideline update for the clinical application of echocardiography: Summary article: A report of the American college of cardiology/American heart association task force on practice guidelines (ACC/AHA/ASE committee to update the 1997 guidelines for the clinical application of echocardiography). J. Am. Coll. Cardiol. 2003, 42, 954–970. [Google Scholar]
  25. Voilliot, D.; Lancellotti, P. Exercise Testing and Stress Imaging in Mitral Valve Disease. Curr. Treat. Options Cardiovasc. Med. 2017, 19, 17. [Google Scholar] [CrossRef]
  26. Marwick, T.H.; Anderson, T.; Williams, M.; Haluska, B.; Melin, J.A.; Pashkow, F.; Thomas, J.D. Exercise echocardiography is an accurate and cost-efficient technique for detection of coronary artery disease in women. J. Am. Coll. Cardiol. 1995, 26, 335–341. [Google Scholar] [CrossRef] [Green Version]
  27. Pearlman, A.S.; Ryan, T.; Picard, M.H.; Douglas, P.S. Evolving Trends in the Use of Echocardiography: A Study of Medicare Beneficiaries. J. Am. Coll. Cardiol. 2007, 49, 2283–2291. [Google Scholar] [CrossRef] [Green Version]
  28. Al-Wakeel, N.; Ms, J.F.F.; Amiri, A.; Siniawski, H.; Goubergrits, L.; Berger, F.; Kuehne, T. Hemodynamic and energetic aspects of the left ventricle in patients with mitral regurgitation before and after mitral valve surgery. J. Magn. Reson. Imaging 2015, 42, 1705–1712. [Google Scholar] [CrossRef]
  29. Grewal, J.; McCully, R.B.; Kane, G.C.; Lam, C.; Pellikka, P.A. Left ventricular function and exercise capacity. JAMA 2009, 301, 286–294. [Google Scholar] [CrossRef] [Green Version]
  30. Stöhr, E.J.; González-Alonso, J.; Bezodis, I.N.; Shave, R. Left ventricular energetics: New insight into the plasticity of regional contributions at rest and during exercise. Am. J. Physiol. Circ. Physiol. 2014, 306, H225–H232. [Google Scholar] [CrossRef] [Green Version]
  31. Vahanian, A.; Iung, B. Mitral regurgitation. Timing of surgery or interventional treatment. Herz 2016, 41, 3–9. [Google Scholar] [CrossRef] [PubMed]
  32. Xu, F.; Kenjereš, S. Numerical simulations of flow patterns in the human left ventricle model with a novel dynamic mesh morphing approach based on radial basis function. Comput. Biol. Med. 2021, 130, 104184. [Google Scholar] [CrossRef] [PubMed]
  33. Eriksson, J.; Carlhäll, C.-J.; Dyverfeldt, P.; Engvall, J.; Bolger, A.F.; Ebbers, T. Semi-automatic quantification of 4D left ventricular blood flow. J. Cardiovasc. Magn. Reson. 2010, 12, 9. [Google Scholar] [CrossRef] [Green Version]
Figure 1. End-systolic LV geometries of all patients (P1–P10) during rest (first and third column) and exercise (second and fourth column) captured with 3D US. Corresponding pressure (p) curves in mmHg over time (t) in seconds at the inlet (blue) and outlet (red) boundaries are shown below each geometry. Pressure curves are shown over 3 CCs.
Fluids 08 00071 g001
Figure 2. Presentation of the volume (green) and KE/EDV (red) curves of each patient during rest and exercise. The graphs (KE/EDV, V, and t) are normalized according to their maximum for better demonstration of the course. For non-normalized mean values, see Table 2 and Table 3 and Figure 3.
Fluids 08 00071 g002
Figure 3. Boxplots with scatters for max (during diastole and systole) and mean KE/EDV (a) and mean velocity (b) for all patients. Patient data for P1–5 (MI I) is presented in green and for P6–10 (MI II/III), with red scatter points. Differences are signed with “*” if significant and with “n.s.” if not significant.
Fluids 08 00071 g003
Table 1. Patient-specific parameters for each case 1–10 comprising the stage of MI (I/II/III), sex, age in years, weight in kg, size in cm, ESV (end-systolic volume) in ml, EDV (end-diastolic volume) in ml, EF (ejection fraction), HR (heart rate) in beats per minute (bpm), and the timestep size n of the captured time frames during ultrasound measurements.
CaseMISexAgeWeightHeightESV (mL)
restexercise (kg)(cm)restexercise
1MI IMI Im758917882.9693.18
2MI IMI Im769317580.4364.93
3MI IMI Im767618841.1842.28
4clippedclippedf788616051.1537.13
5MI IMI IIf788418026.5225.06
6MI IIMI IIf737916816.4638.13
7MI IIMI IIIf675717015.7226.14
8MI IIIMI IIIm8176176100.6393.17
9MI IIIMI IIIf866515450.9843.20
10MI IIIMI IIIf787516330.8123.92
CaseEDV (mL)EF (-)HR (bpm)Timesteps n
restexerciserestexerciserestexerciserestexercise
1132.67135.5037.4731.23891101210
2106.1491.2924.2228.87711331614
3109.02104.0162.2359.35681201411
4106.7676.1252.0851.2260891516
556.1662.6452.7859.98771141616
640.9072.5759.7647.46601161915
747.1263.5766.6358.89471242120
8140.12132.7628.1929.82671101523
993.6562.3345.5630.69581112014
1085.0058.3063.7558.97661171817
Table 2. Comparison of hemodynamic parameters averaged over all patients between rest and exercise. Mean values and standard deviation (std) are shown for each parameter (VCL—vortex core line length, ω—mean vorticity, KE/EDV—mean kinetic energy normalized by end-diastolic volume, VEL—mean velocity).
Mean RestStd RestMean ExStd Exp-Value
VCL (m)0.200.140.270.160.36
ω (1/s)16.497.2418.668.420.56
KE/EDV (J/mL)0.090.060.100.080.73
VEL (m/s)0.080.030.080.030.60
max dias KE/EDV (J/mL)0.320.220.330.340.94
max sys KE/EDV (J/mL)0.160.140.060.050.04
Table 3. Comparison of mean KE/EDV and mean VEL between P1–5 (MI I) and P6–10 (MI II/III), independent of rest or exercise state.
Mean P1–5Std P1–5Mean P6–10Std P6–10p-Value
(ex + rest)(ex + rest)(ex + rest)(ex + rest)
KE/EDV (J/mL)0.120.070.070.050.08
VEL (m/s)0.100.030.060.020.01
max dias KE/EDV (J/mL)0.450.300.200.190.03
max sys KE/EDV (J/mL)0.110.110.100.110.80
Disclaimer/Publisher’s Note: The statements, opinions and data contained in all publications are solely those of the individual author(s) and contributor(s) and not of MDPI and/or the editor(s). MDPI and/or the editor(s) disclaim responsibility for any injury to people or property resulting from any ideas, methods, instructions or products referred to in the content.

