Article

Aerodynamic Interaction of Migratory Birds in Gliding Flight

1
Laboratory of Materials Thermal and Mechanical Engineering (MATIM), University of Reims Champagne Ardenne, CEDEX 2, 51687 Reims, France
2
Pôle de Recherche Châlonnais, University of Reims Champagne Ardenne, 51000 Châlons en Champagne, France
*
Author to whom correspondence should be addressed.
Fluids 2023, 8(2), 50; https://doi.org/10.3390/fluids8020050
Submission received: 6 January 2023 / Revised: 20 January 2023 / Accepted: 27 January 2023 / Published: 1 February 2023

Abstract

:
(1) Background: Many studies suggest that migratory bird groups fly in a V-formation to improve their aerodynamic efficiency, the goal being to reduce their energy expenditure to fly longer distances. To further validate this hypothesis, we numerically simulated the aerodynamic interaction of two gliding migratory birds and evaluated the aerodynamic forces as a function of the bird spacing. (2) Methods: Computational Fluid Dynamics (CFD) was used to model the flow pattern in and around the wake of Canada geese flying at an altitude of 1000 m and a speed of 13.9 m/s. (3) Results: The post-processing of the 3D results revealed a complex flow structure composed of two contra-rotating vortices developing at the wing tip. (4) Conclusions: In a plane perpendicular to the main flow direction, we showed that the bird’s wake could be broken down into two distinct zones: the downwash zone and the upwash zone, the latter being used by birds flying in formation to reduce their energy expenditure. The results of our study suggested an optimal wingtip spacing of -26cm to maximize the lift/drag ratio that characterizes aerodynamic efficiency.

1. Introduction

Some migratory birds cover astounding distances, e.g., up to 96,000 km per year for the Arctic tern [1]. This performance is particularly noteworthy for birds that have a reduced weight and must face headwinds and sometimes-challenging weather conditions. To cover such distances, some migratory birds have developed either remarkable physiological capacities or collaborative strategies that allow them to fly in flocks to minimize their energy expenditure [2,3,4]. Among these strategies, we could mention the V-shaped formation so characteristic of migratory bird flights [5,6]. Research has shown that flying in an organized group provides an energy advantage to birds using the eddy areas generated by their wings [2,3,4,7,8]. However, a definitive understanding of the aerodynamic implications of these formations is still a matter of considerable debate. The aerodynamic models—developed as knowledge was gained—are of great interest to biologists seeking to understand the strategies and constraints of wild bird migration.
When birds fly in a V formation, their wings produce vortices that are generated due to pressure differences on the upper and lower sides of the wings. These wake vortices generate an upwash outside the wing tips and a downwash inside the wing tips [7,9]. Extensive scientific literature has suggested that migratory birds judiciously place their wingtips in upwash areas to minimize their energy expenditure [4,6,10]. Many studies reported decreases in drag forces during V-flight, which could be related to the drafting technique, an aerodynamic phenomenon well-known in the field of sports [11,12,13]. However, a decrease in drag forces can also be accompanied by a decrease in lift, the force required to sustain the bird in flight. Flying animals, unlike aircraft, generate both lift and thrust by flapping their wings. However, many birds also use gliding, i.e., flying without flapping their wings [14]. More than 300 species of birds from various taxonomic groups undertake long migratory journeys alternating between flapping and gliding modes [15]. Even today, measuring the aerodynamic coefficients of flying birds remains challenging. The evolution of the drag and lift of a bird is most often estimated from theoretical mathematical models. Experimental studies attempting to unravel the secrets of the aerodynamics of flying birds are scarce due to the difficulties involved in setting up experiments. However, some authors have applied the digital particle image velocimetry (DPIV) technique to analyses of bird flight [16,17]. This technique requires the use of a low turbulence wind tunnel and a cooperative and well-trained bird. One alternative to experimental techniques is computational fluid dynamics (CFD). Numerical simulations are often less expensive and restrictive than laboratory experiments and provide information on all flow quantities, including those that are not usually available from measurements. CFD has been used by scientists in an attempt to improve our knowledge of the mechanics of bird flight. Maeng et al. [18] performed a numerical study on the energy conservation of Canada Geese in flight by modeling wing flapping dynamics. Beaumont et al. [19] modeled a flapping wing of a Canada goose and studied the effects of altitude on the aerodynamic forces exerted on the wing. More recently, they used CFD to highlight the three-dimensional vortex structures developing in the wake of a Canada goose [20].
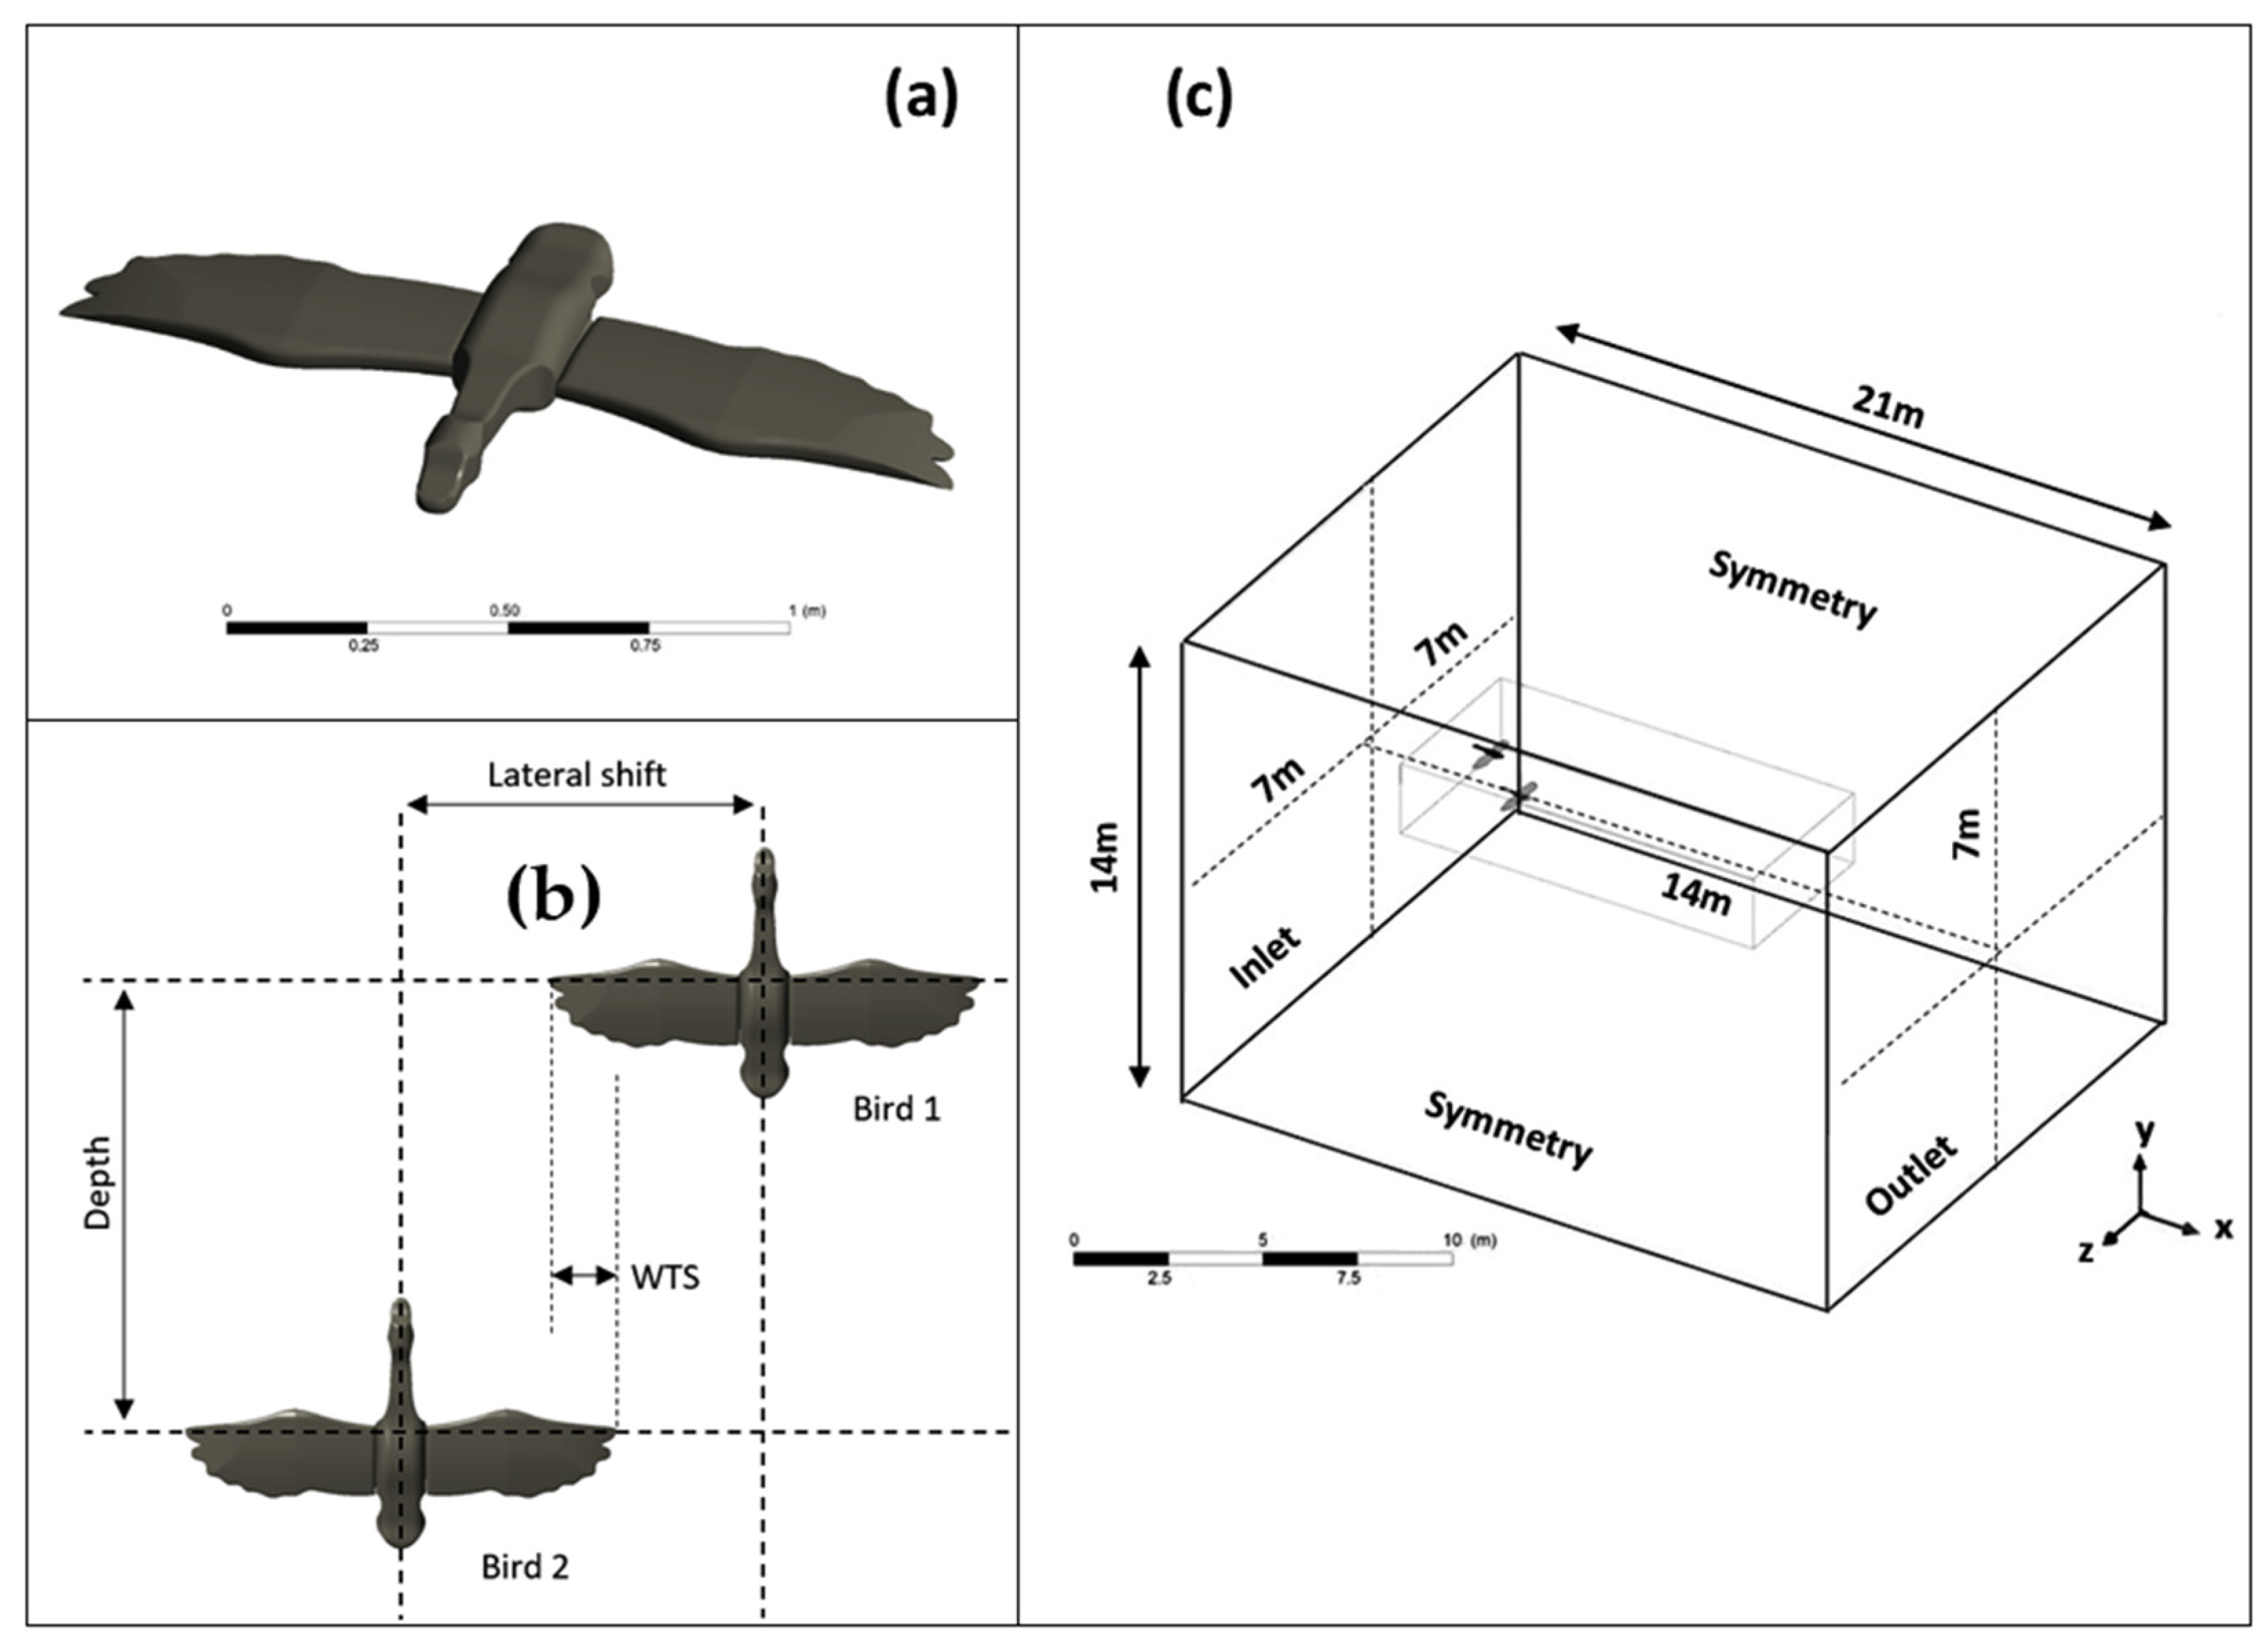
In this study, we evaluated the optimal position of Canada geese in a V-shaped formation. We investigated the influence of wing tip spacing (WTS) and depth on the aerodynamic forces exerted on two birds during gliding flight. We analyzed the vortex wake, the structure of which varied according to the positions of the birds in relation to each other. A computational code, based on the finite volume method, was used to highlight three-dimensional vortex structures developing in the wake of Canada geese flying at an altitude of 1000 m and a speed of 13.9 m/s. Ultimately, the results obtained for 2 birds could easily be extrapolated to a larger bird flock.

2. Materials and Methods

2.1. Geometry and Computational Domain

The simplified geometry (Figure 1a) of the bird was designed using CAD software (ANSYS Worbench Design Modeler®, ANSYS, Inc., 275 Technology Drive, Canonsburg, PA 15317, USA) following the actual wing shape of a Canada goose in flight [21,22]. The wingspan was 0.72 m and the average chord was 0.3 m. In this study, we varied the lateral distance from 0 to 300 cm (−166 ≤ WTS ≤ 134 cm) and depth: 1.73 m and 3.47 m between the two birds (the distance along the flight path between birds). Hainsworth [10] reported that most birds positioned themselves 1 to 3 wingspans behind the bird in front of them because a trailing wing tip vortex formed completely at a distance of 1 to 2 wingspans. In the present case, the birds’ glide implied a wake with a linear character [23], as opposed to flapping flight which induces a periodic wave-like wake [20]. Thus, theoretically, depth would have less influence on the aerodynamic behavior of birds than lateral distance (WTS). For this reason, we only studied two depths, versus sixteen lateral distances (Figure 1b). The distance between the geometry and the boundaries of the computational domain was defined to respect the recommendations published in the CFD best practice guides [24], resulting in a blockage ratio lower than 3. The dimensions of the computational domain and the boundary conditions are shown in Figure 1c.

2.2. Boundary Conditions

At the inlet of the computational domain, we imposed a speed of 50 km/h (13.9 m/s), which corresponded to the average speed of Canada geese during a migratory flight [25]. At the outlet of the computational domain, we imposed a pressure outlet boundary condition with ambient static pressure. The mass conservation law (all gradients are equal to zero) was applied. For the top and side surfaces of the computational domain, a slip-wall boundary (symmetry) was used. Slip walls assume that the normal velocity component and the normal gradients at the boundary are zero, resulting in flow parallel to the boundary. A no-slip wall with zero roughness was applied for the bird’s body surfaces.
A density of air of 1.11 kg/m3, corresponding to an altitude of 1000 m, was used as a reference value for the calculation [26]. The CFD parameters, as well as the dimensional characteristics, of the bird are summarized in Table 1.

2.3. Computational Grid

The computational domain grid was performed based on a mesh independence study carried out in a previous paper [19]. The three-dimensional mesh was achieved using the ANSYS Workbench Meshing software (ANSYS, Inc., 275 Technology Drive, Canonsburg, PA 15317, USA). The grid in a plane intersecting the wing, as well as on the bird’s body, is shown in Figure 2.
The unstructured mesh of the fluid domain consisted of about 7.5 × 10⁶ prismatic and hexahedral elements for the single bird case and up to 16.5 × 10⁶ elements for the other cases (2 birds with varying spacing). The boundary layer mesh required a very fine mesh near the wall to fully resolve the viscoelastic and laminar sublayer. In order to correctly reproduce the boundary layer separation, an inflation layer consisting of 15 prism layers of progressive thickness (growth ratio: 1.2) was generated around the body wall (Figure 2b). To achieve a Y* value of less than 1, which was necessary for accurate boundary layer resolution, the height of the first cells adjacent to the wall around the bird body was set to a value of 10 μm. This first cell height can be defined as the distance between the wall and the first grid point. The cell size of the mesh on the bird body surface was set at 0.005 m to minimize the computational cost, resulting in an average aspect ratio of 36 for the boundary layer mesh. In addition, a mesh refinement zone was created around and in the wake of the bird. In this area, the average element size was less than or equal to 0.05 m. In the remainder of the domain, a Cartesian mesh was used, allowing for a reduction in the number of elements and, consequently, the computational time.

2.4. Numerical Methods

The simulations were performed using the ANSYS Fluent© 2023 R2 CFD code (ANSYS, Inc., 275 Technology Drive, Canonsburg, PA 15317, USA). The shear stress transport (SST) k-ω model was used to solve the Reynolds Averaged Navier-Stokes (RANS) equations in 3D [27]. The simple algorithm was used for pressure–velocity coupling with first-order discretization schemes and gradients computed using the least squares cell method. The SST k-ω turbulence model is a two-equation model of eddy viscosity that is used for many aerodynamic applications.
The momentum and continuity equations can be written as follows:
t ( ρ u i ¯ ) + x j ( ρ u i ¯   u j ¯ ) = p x i + x j [ μ ( u i ¯ x j + u j ¯ x i 2 3 δ i j u k ¯ u k ) ] + x j ( ρ u i u j ¯ )
ρ t + x i ( ρ u i ¯ ) = 0
where, u i ¯ and u i is the mean and fluctuating velocity components (i = 1,2,3), ρ is the fluid density, p is the pressure and the function δ i j is defined as δ i j = { 1 ,   i = j 0 ,   i j .
The SST k-ω turbulence model is fully suitable for unfavorable pressure gradients and separation flow and is, therefore, well adapted for aerodynamic studies [28,29].
Drag and lift coefficients were monitored throughout the iterative computations, which were performed on a Dell Workstation Precision 7820 and parallelized on 40 Xeon Silver 2.2 Ghz processors. Based on the assumption of a constant flight altitude, the calculation was initialized with constant speed and pressure. Additionally, temperature was supposed to remain constant; thus, an energy equation was not required. The results obtained using this numerical method were compared with the results of a previous study [19], as well as with data from the literature. Our results indicated that the drag of one bird varied from 1.35 to 1.77 N, depending on the lateral offset between the two birds. Therefore, our results were consistent with the literature, in which it has been reported that an individual goose in a group generates a drag force between 0.83 and 1.72 N, depending on different wingtip spacings [6]. Furthermore, our results (0.058 ≥ C D ≥ 0.065) were consistent with data from Withers [30], who found that bird wings had a high drag coefficient (0.03–0.13), resulting in a low minimum lift-to-drag ratio (L/D). Finally, the weight (force produced by gravity in the downward direction) of one wing (8.5 N) was found to be close to the weight of a bird with equivalent wingspan (9.4 N) [31].

3. Results

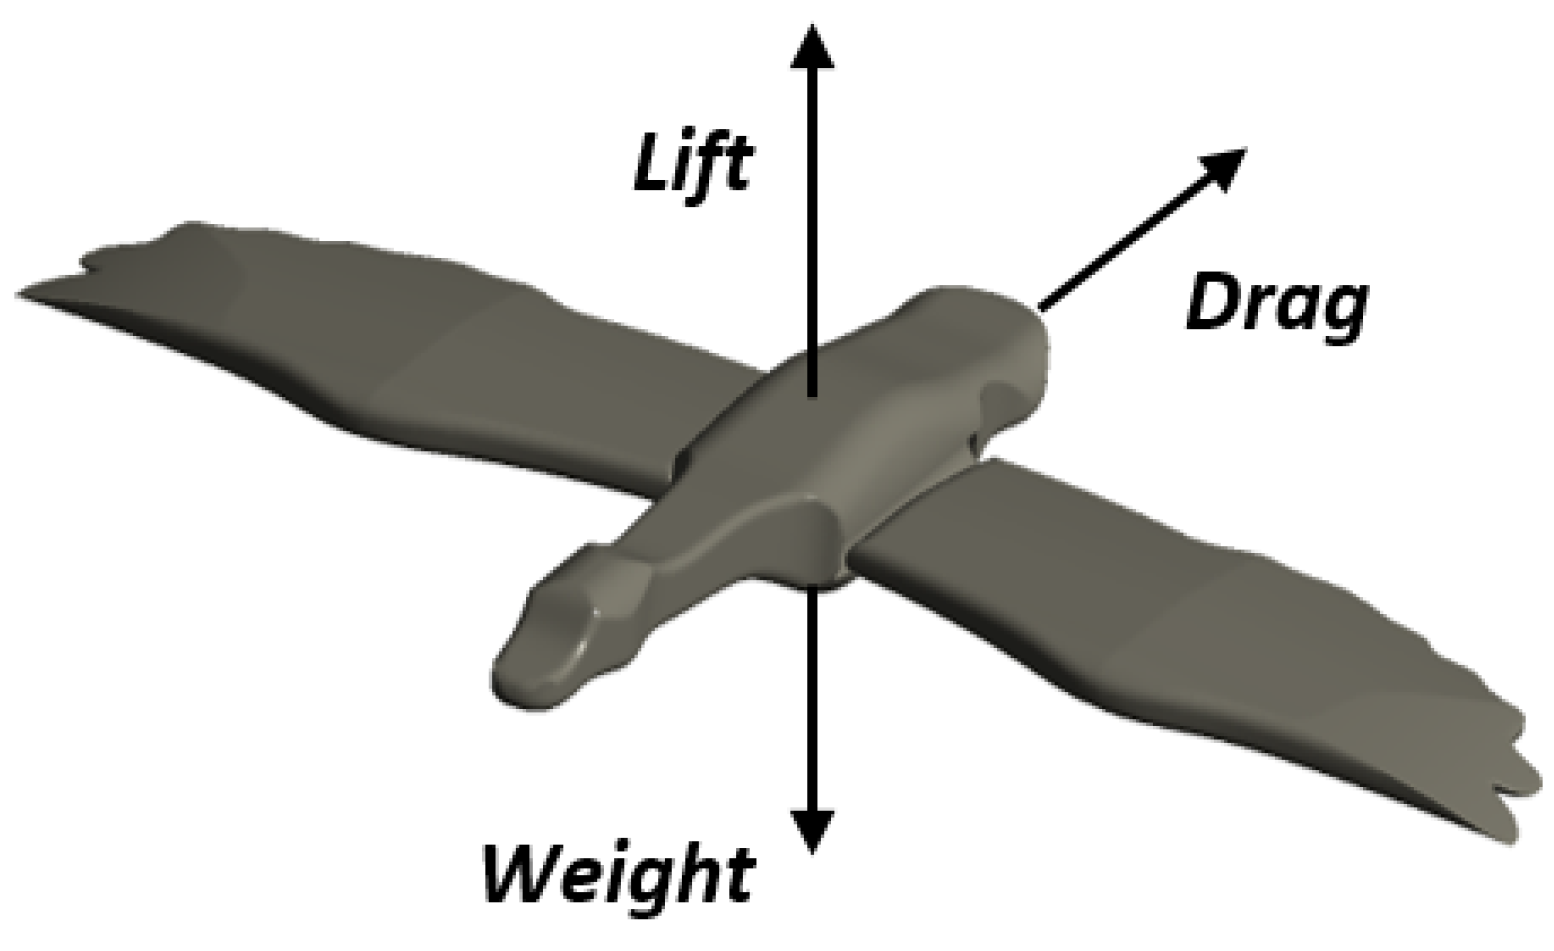
There are four different forces acting on a flying device in flight, whether it is a bird, a bat, an insect or an airplane: lift, thrust, drag and gravity (Figure 3). Thrust must be equal to drag and lift must be equal to gravity in straight and level flight. In flight aerodynamics, several parameters can be used to quantify the flow characteristics. Hereafter, we presented the most representative ones. Two parameters that provide important information in the study of the aerodynamics of bird wings are the drag and lift coefficients, which are defined as follows:
C D = D 1 2 ρ U 2 A
C L = L 1 2 ρ U 2 A
D and L are the drag and lift forces; ρ is the density of the fluid, U is the forward speed and A is the projected area (m2). Lift and drag are two components of the resulting aerodynamic force acting on the wing. Lift can be in any direction relative to gravity, since it is defined relative to the direction of flow rather than the direction of gravity.
When a bird flies straight and level, most of the lift is opposed to gravity [32]. However, when a bird climbs, descends, or tilts in a turn, the lift is tilted away from the vertical.
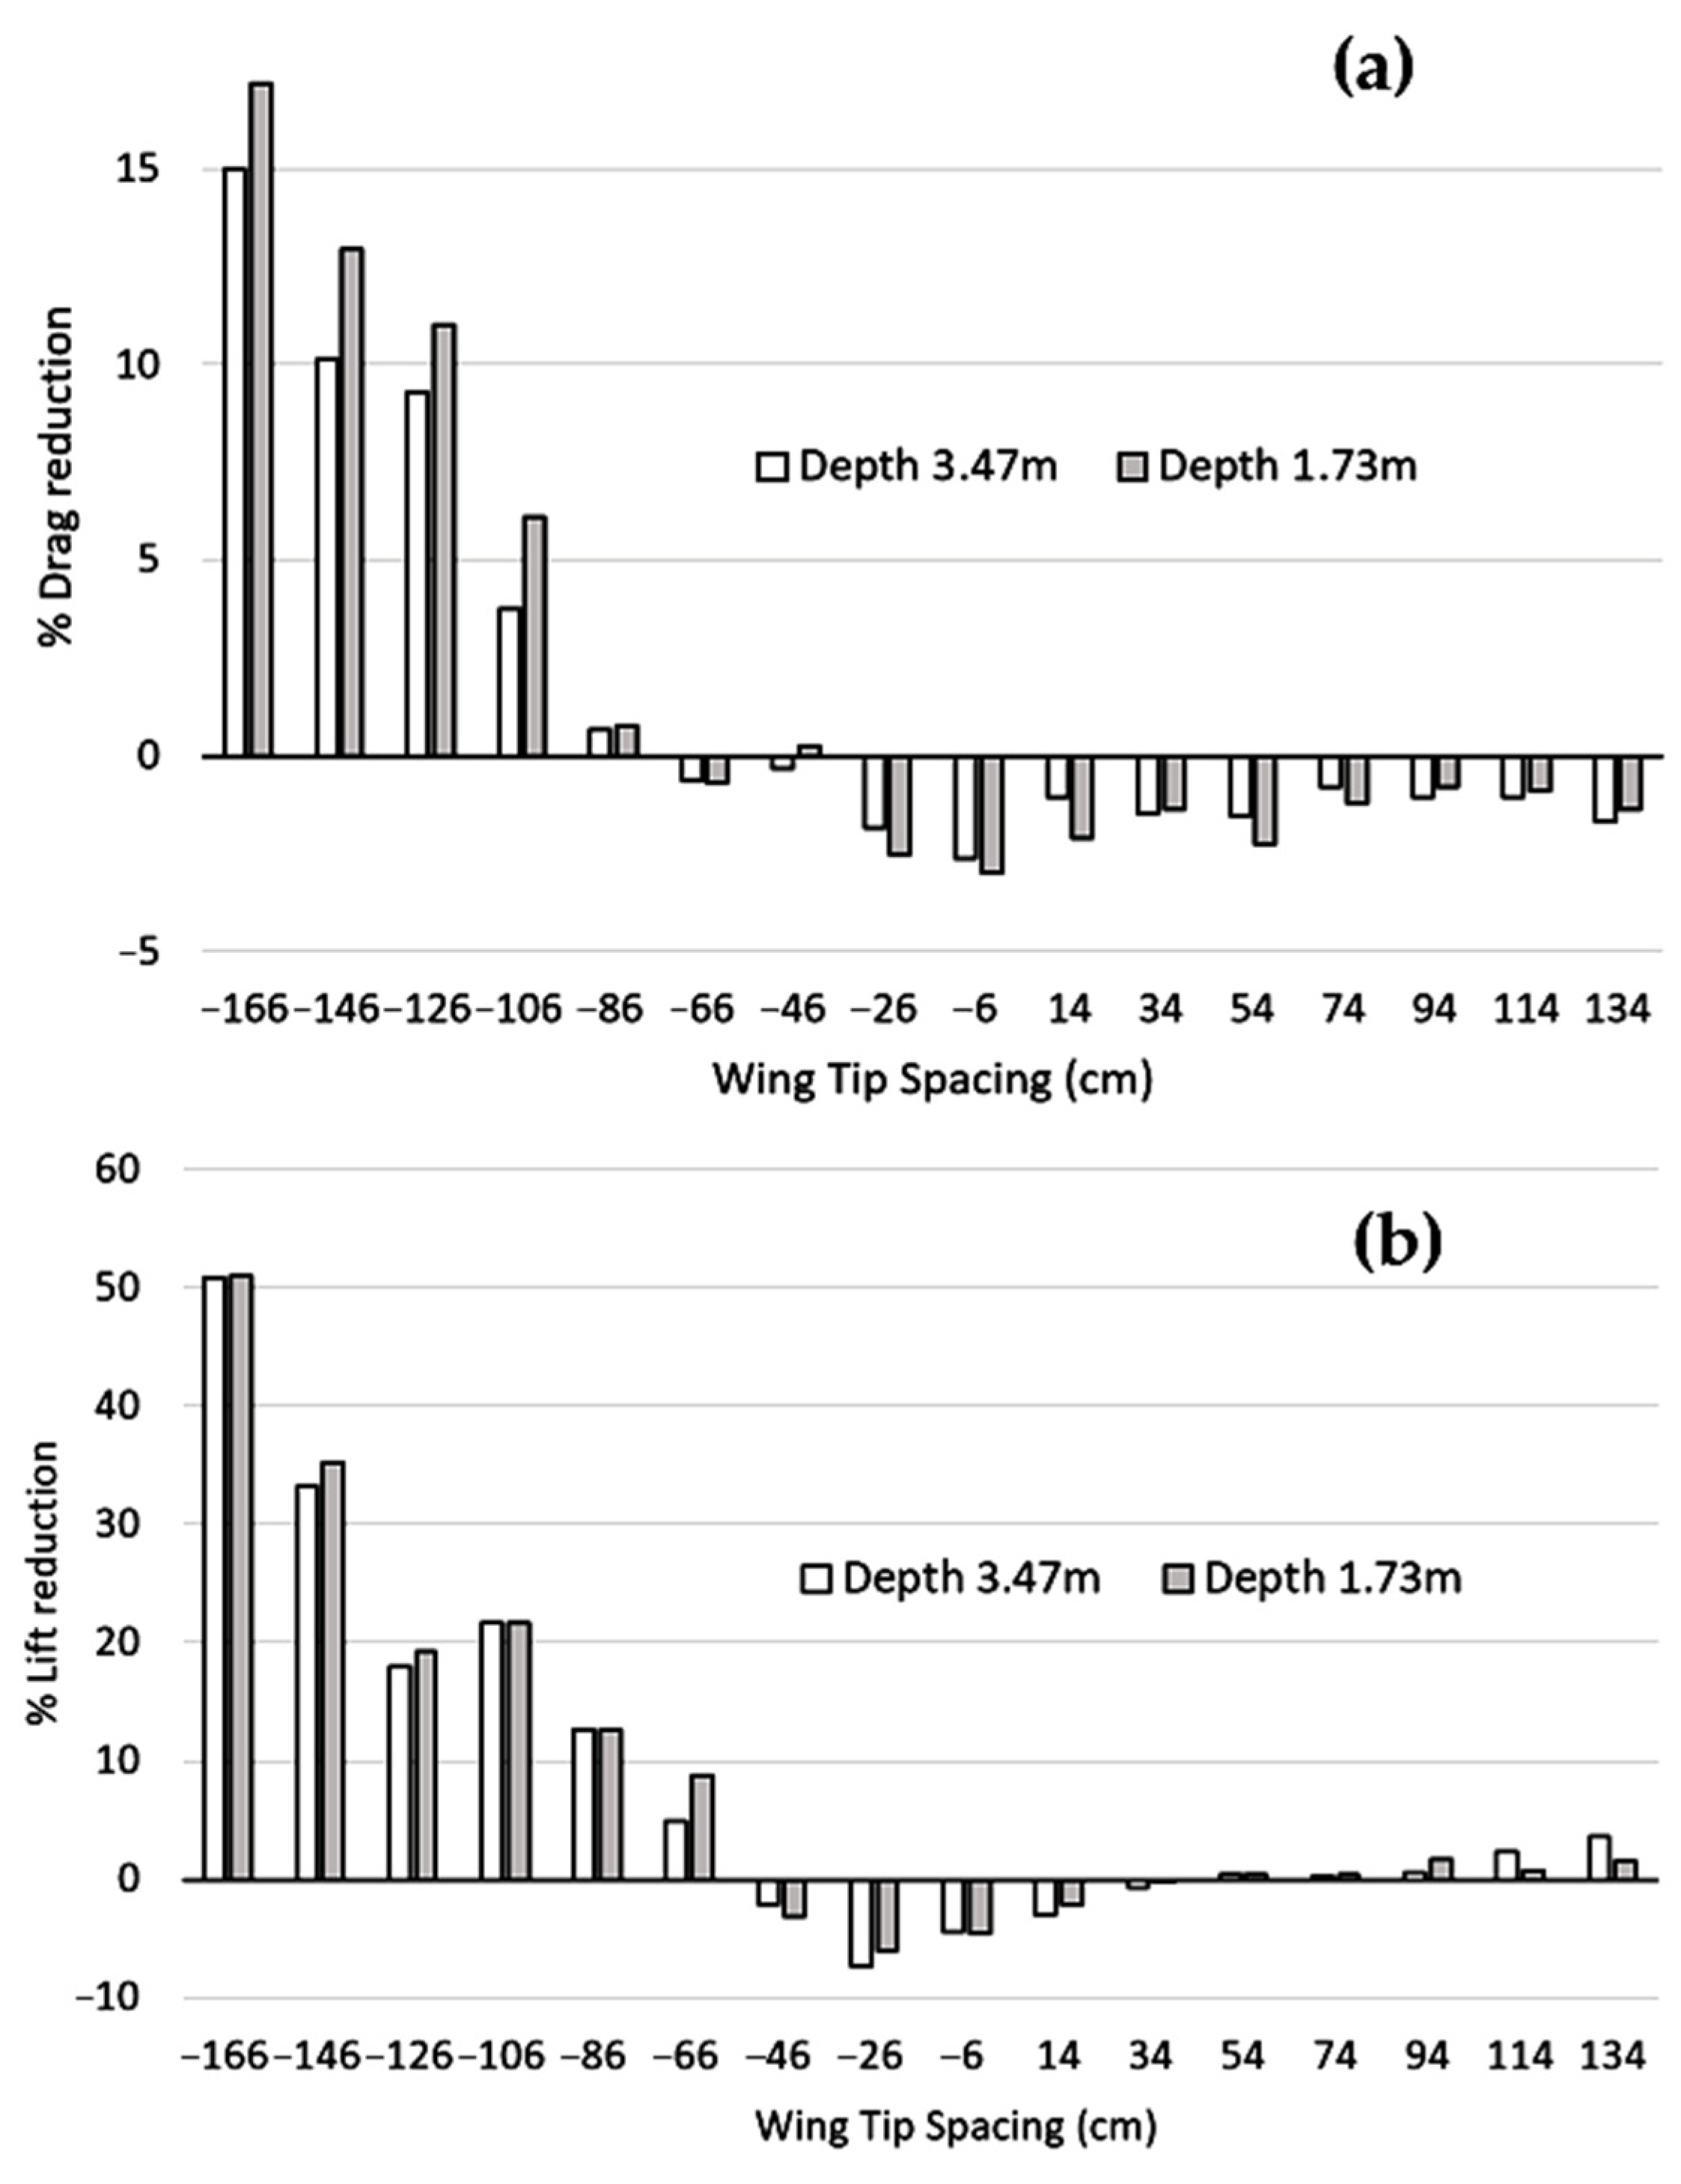
Figure 4 plots reductions or increases (in %) in drag and lift of Bird 2, as compared to Bird alone, as a function of WTS and depth. From this figure, we were able to draw several conclusions. First, a reduction in drag forces was associated with a reduction in lift forces. On the one hand, drag reduction is positive, since it reduces air resistance forces; on the other hand, lift reduction can be a challenge for the bird, since lift must always equal weight. We noted that the reduction of drag and lift forces decreased between −166 and −26 cm. The drag reduction was maximal at −166 cm when the birds were flying in line. In this situation, bird 2 took full advantage of the positive effects of drafting, an aerodynamic principle which consists in reducing air resistance forces by flying in the wake of the preceding bird. We also observed that the reduction of drag forces was higher for a depth of 1.73 m and for a small (or zero) wingtip spacing. For larger WTS, the difference between the two depths (3.47 and 1.73 m) was less significant. On the other hand, the depth seemed to have a smaller impact on lift than on drag.
Our results demonstrated that several forces act on a bird in flight. Flying in formation would allow birds to limit their energy expenditure by reducing aerodynamic drag and improving lift. In this case, it may be appropriate to reason in terms of aerodynamic efficiency, which defines the ratio between lift and drag. The L/D ratio is the amount of lift generated by a wing, divided by the drag it creates while moving through the air.
Generating lift with less drag directly results in better energy economy, better climb performance and better glide. 
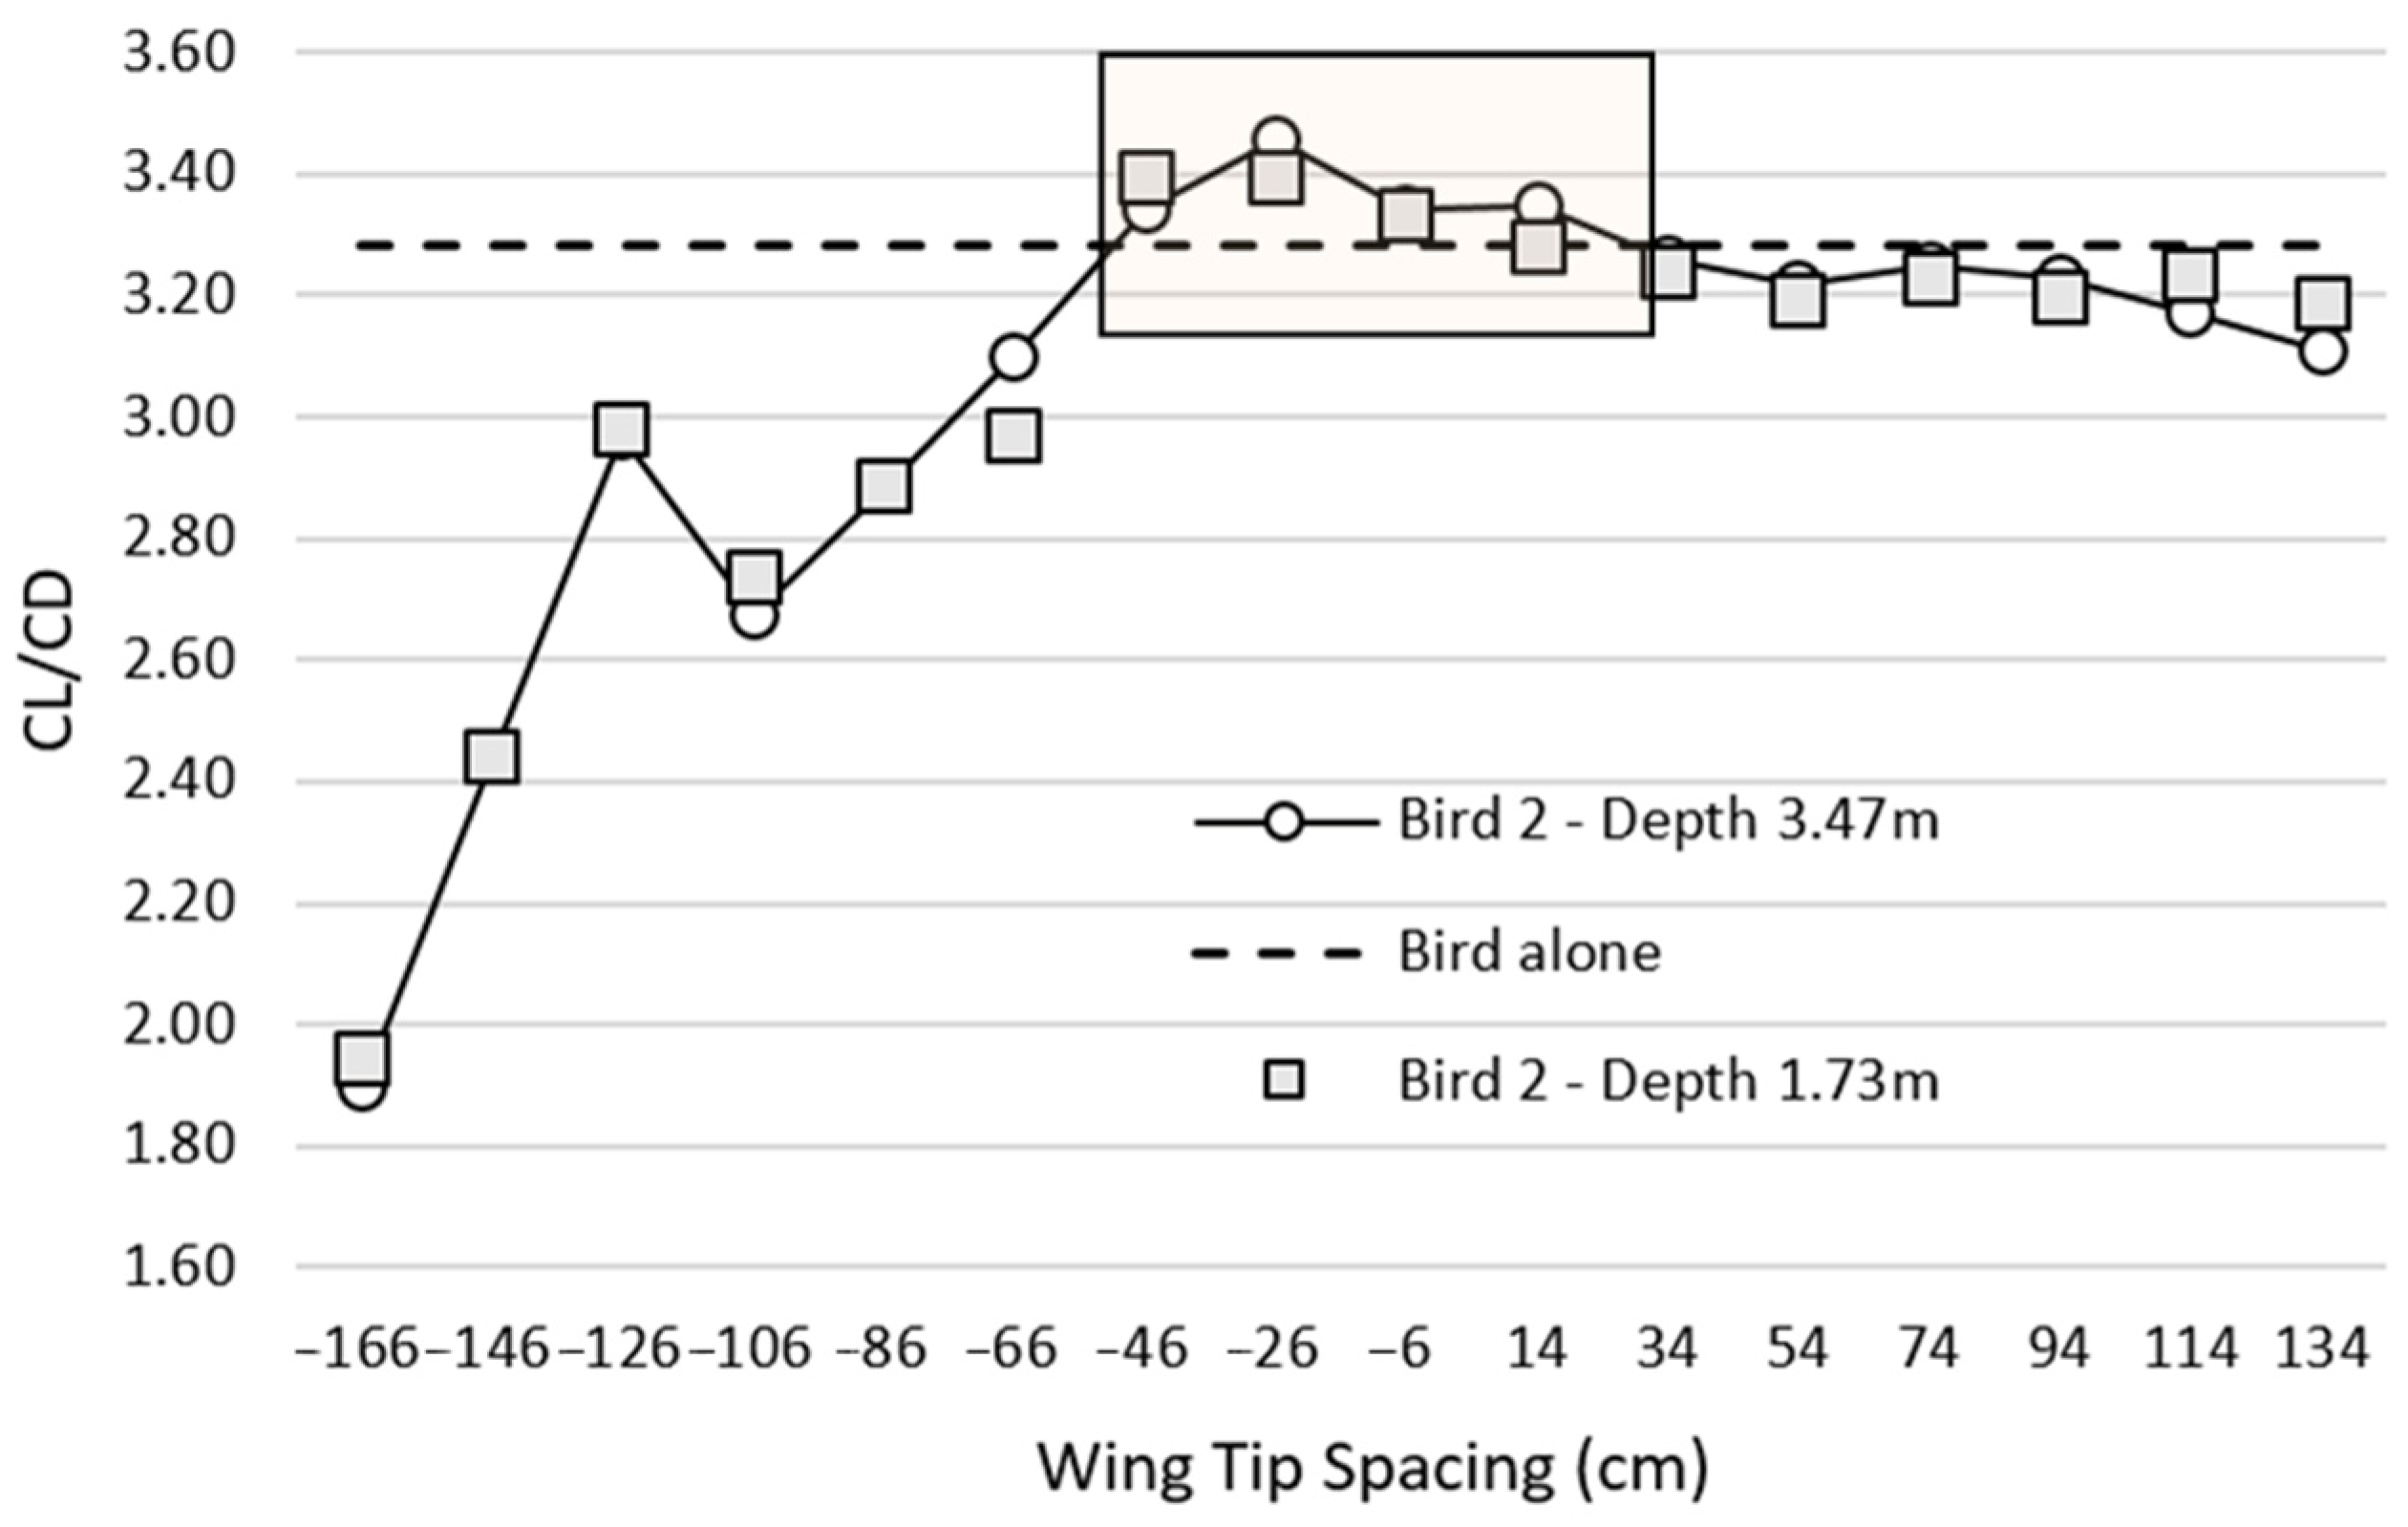
Figure 5 represents the evolution of the CL/CD Ratio for the single bird and for bird 2 as a function of WTS for a depth of 1.73 m and 3.47 m, respectively.
In the present study, the L/D ratio was used to determine the optimal WTS. For the single bird, the L/D ratio was 3.28. Therefore, in order for flocking to be more valuable than flying alone, the value of the L/D ratio of the second bird must be greater than 3.28. Figure 5 suggests that, compared to flying alone, flying in formation improved the aerodynamic efficiency of the second bird for a WTS between −46 and 14 cm. The most interesting position from an aerodynamic perspective was −26 cm with an L/D = 3.46 ratio 5.5% higher than the L/D ratio of the bird alone. Our study showed that it was necessary to laterally overlap the wingtips of the leader bird and the bird in its wake by 26 cm (WTS = −26 cm) to achieve the best aerodynamic efficiency. Hainsworth [10] reported that Canada Geese with depths greater than 5 m had a WTS of 54.5 cm and geese with depths less than 5 m had a median WTS of −28.2 cm. Given that, in our study, the depth between the two birds was less than 5 m, our results were consistent with the literature [10].
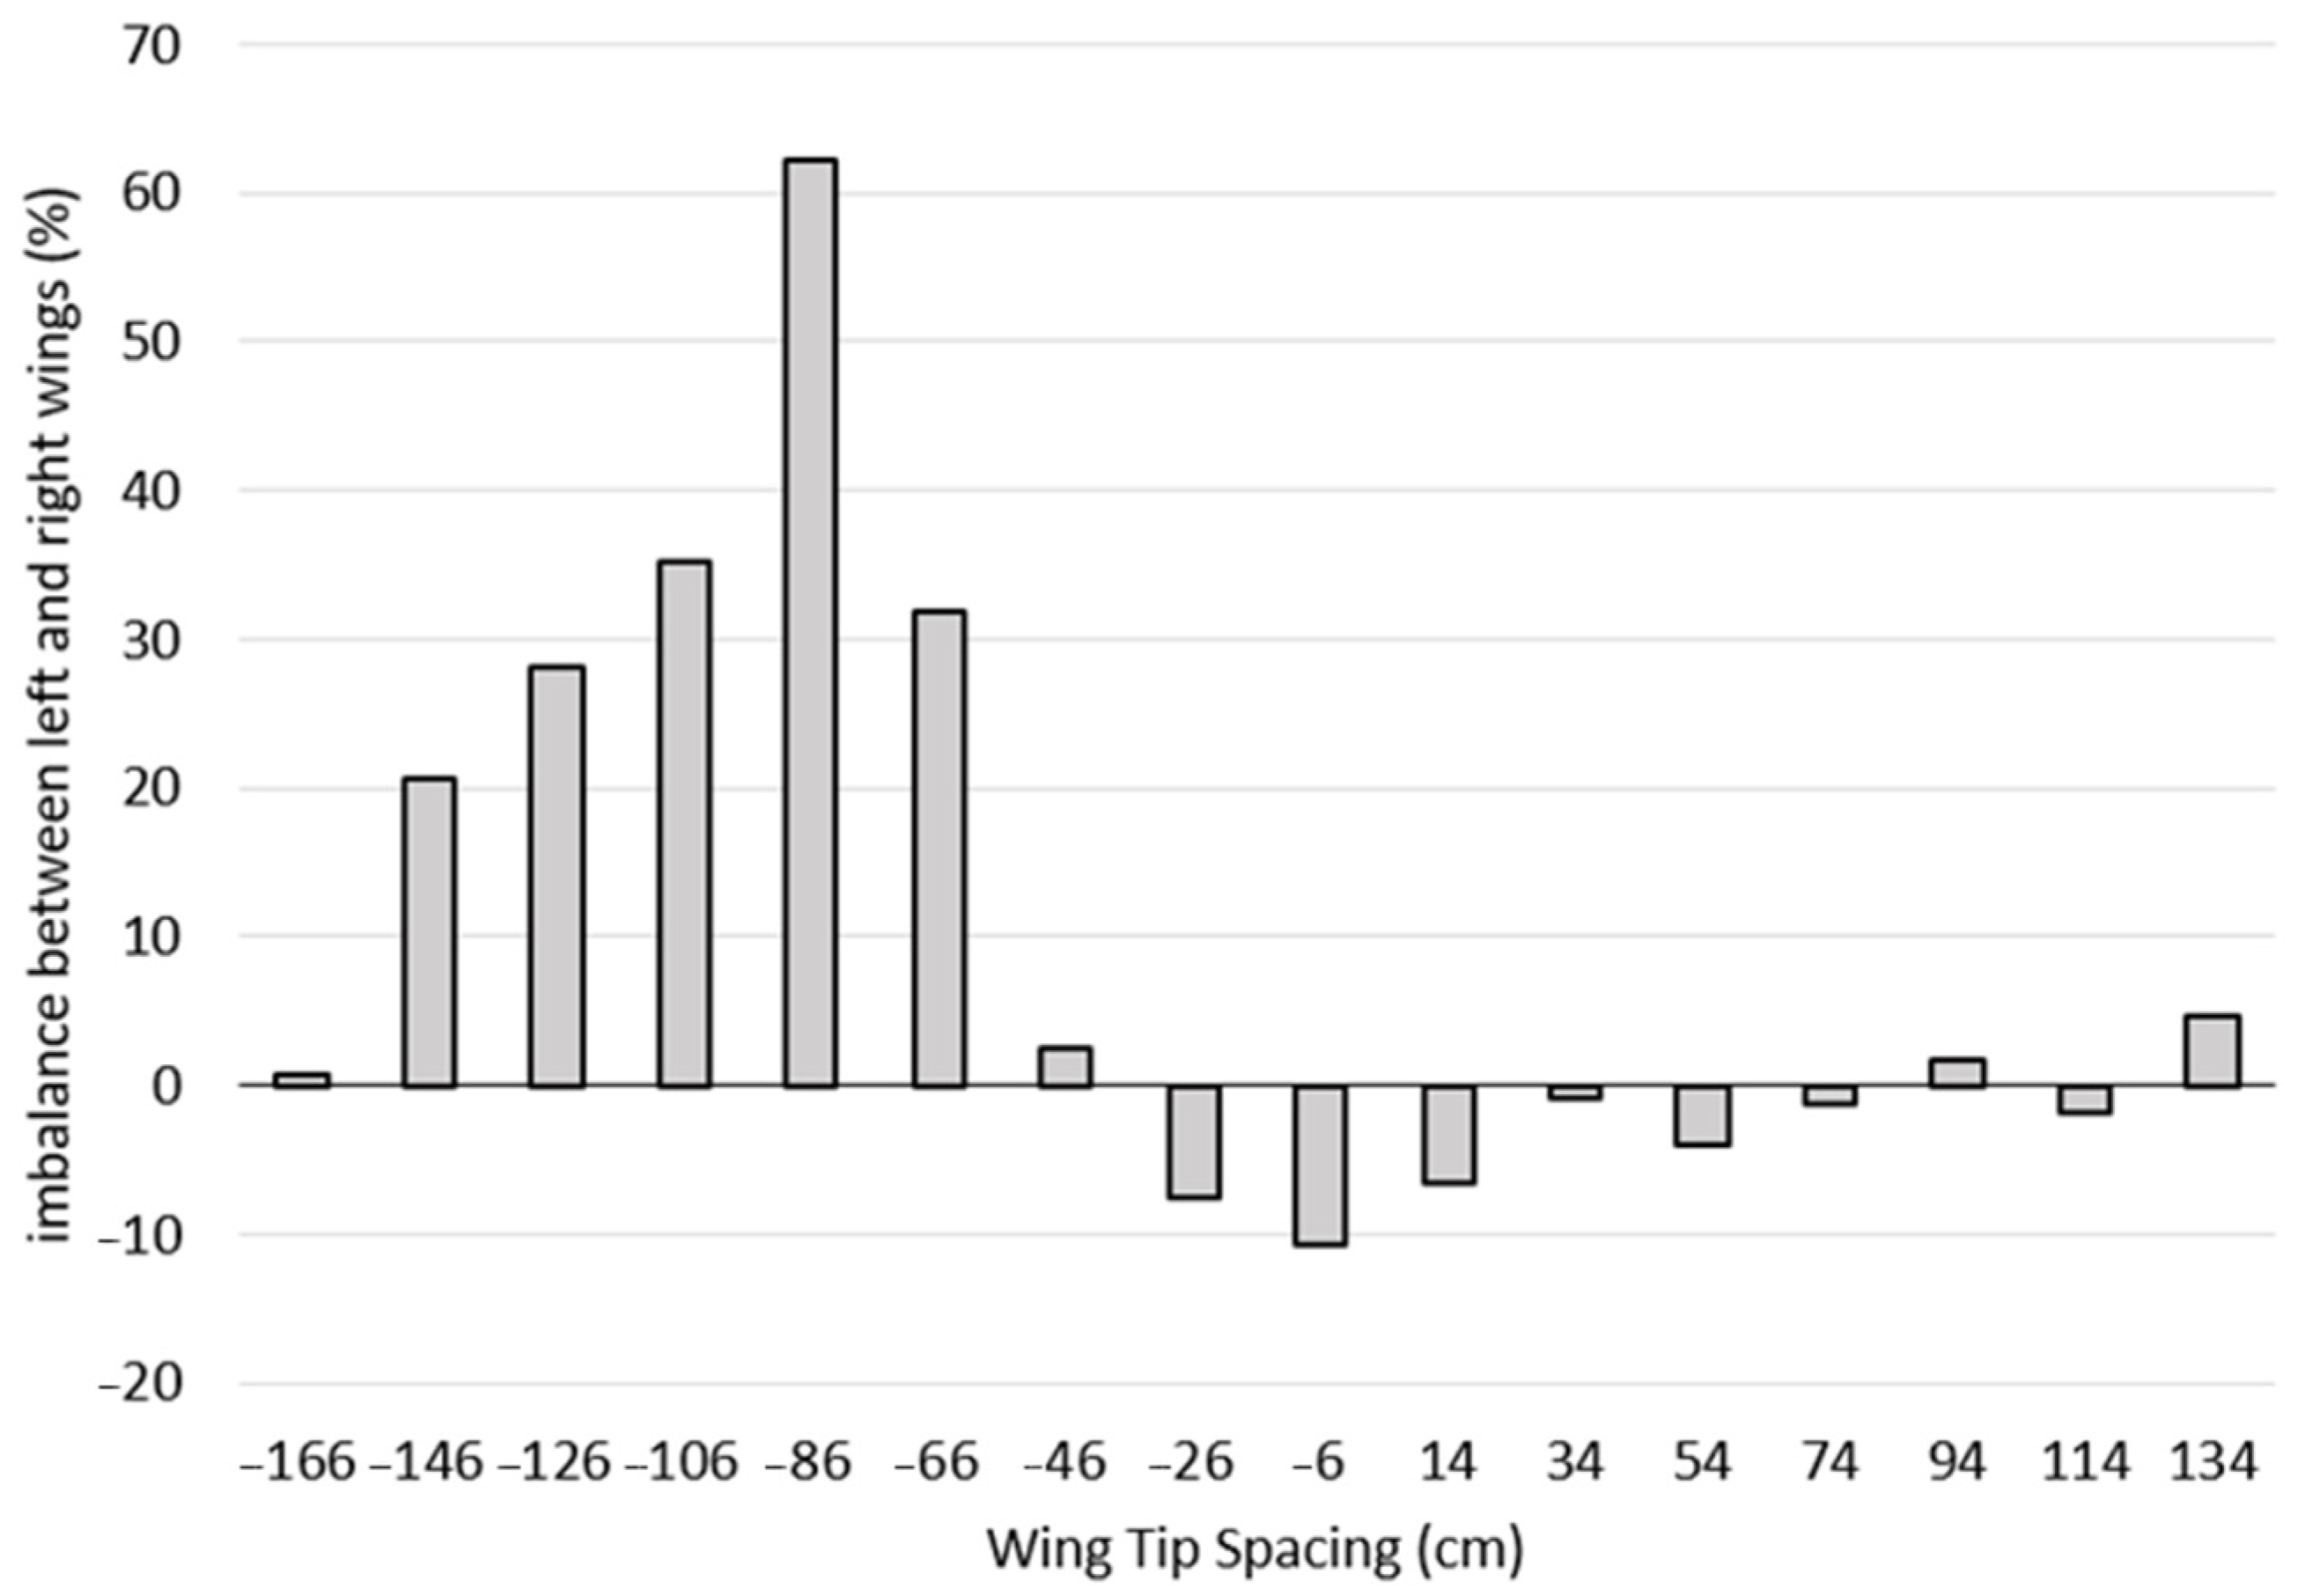
Figure 6 represents the lift imbalance (%) between the right and left wings of the second bird as a function of WTS. The lift imbalance was between 20% and 62% for a WTS between −146 and −66 cm, while the maximum imbalance of 62% was reached at −86 cm.
The lift imbalance remained significant for WTS between −46 and 134 cm but remained below 11%. For WTS, estimated to be optimal at −26 cm, the imbalance between the two wings was 7.6%, although the lift advantage was found at 7.3%. In order to illustrate the force imbalance phenomenon as clearly as possible, 
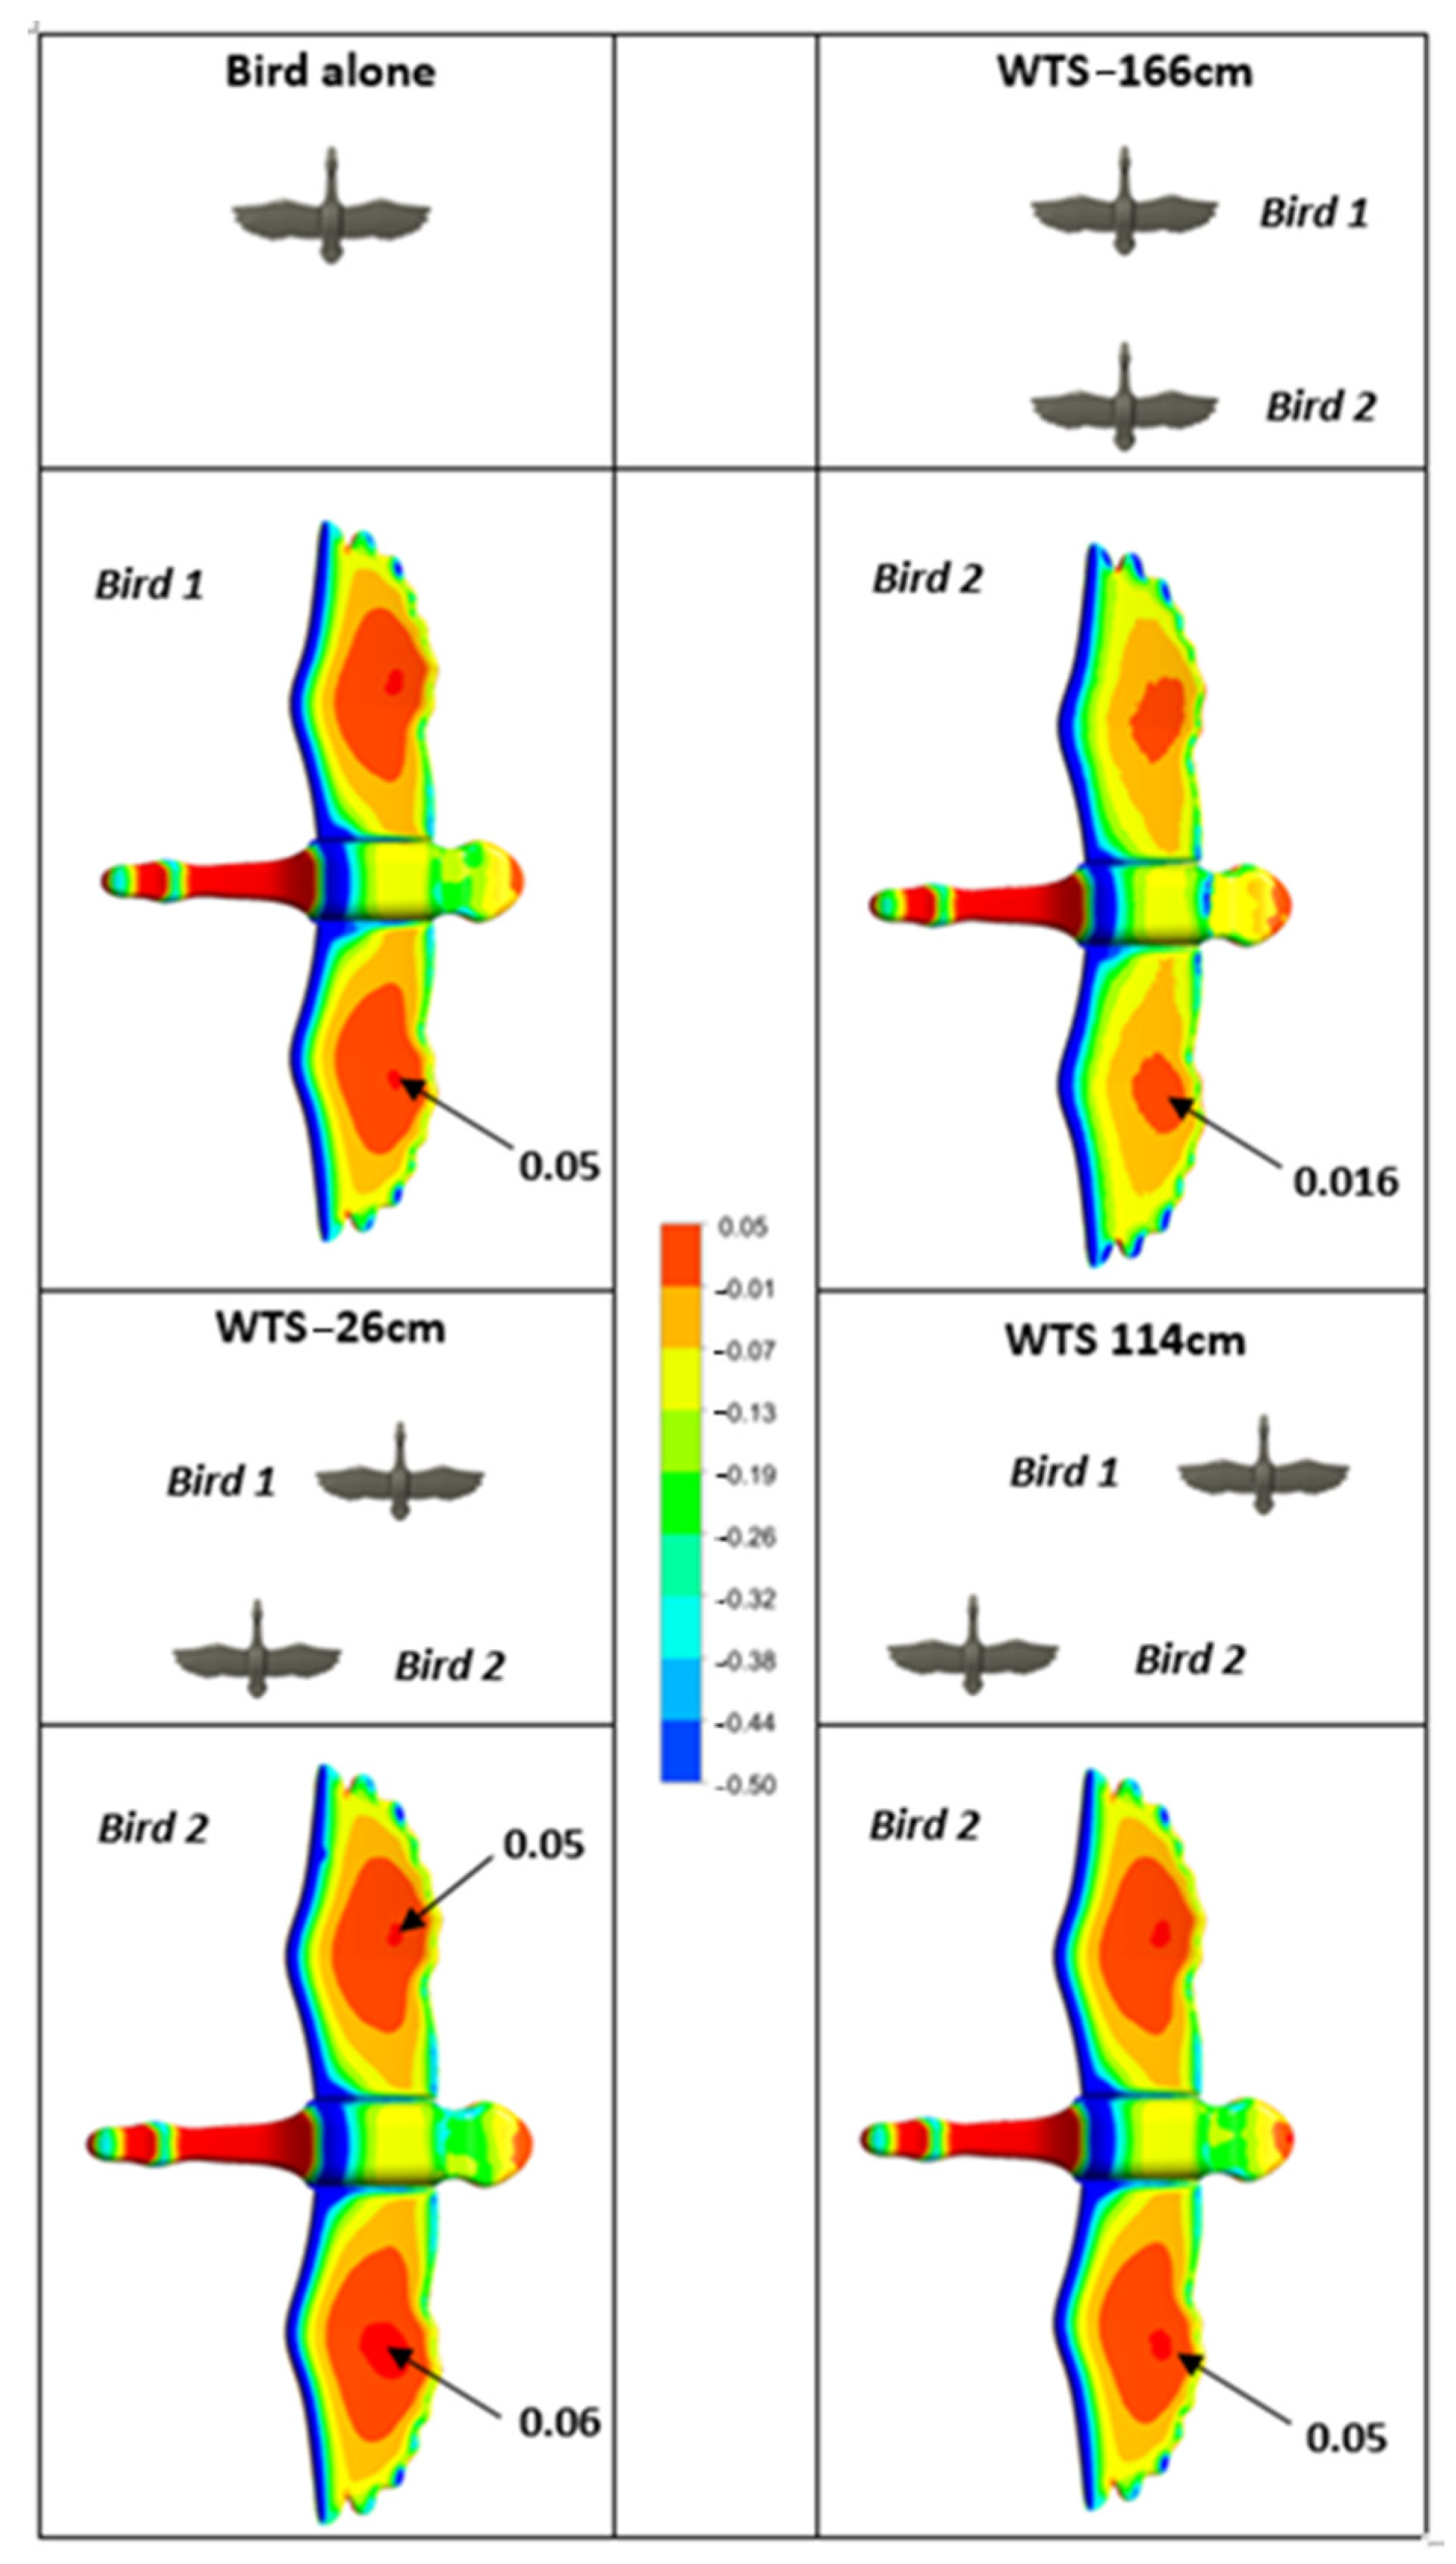
Figure 7 shows a comparison of pressure distributions on the underside of the birds’ wings between the single bird and the second bird for WTS of −26, −166 and 114 cm, respectively.
Note that the pressure coefficient range was purposely limited to the interval [−0.5; 0.05] in order to highlight the slightest change in pressure. The pressure coefficient is defined as follows:
  C p = 2 P P 0 ρ u 2
where P is the static pressure, P 0 is the reference static pressure (i.e., atmospheric pressure), ρ is the air density and u is the speed of the body through the fluid (m.s−1).
Pressure is the force acting on a given surface. The lift force is transferred by the pressure, which acts perpendicular to the surface of the wing. Thus, the net force is expressed as pressure differences. The direction of the net force implies that the average pressure on the upper surface of the wing is lower than the average pressure on the lower surface [33]. In summary, the lowest pressure occurs on the top surface of the wing and the highest pressure on the underside of the wing.
The pressure distribution under the birds clearly showed that being sheltered (WTS = −166 cm) implied a decrease in the pressure under the wings of the second bird. This would result in reduced drag forces, but also reduced lift forces, as confirmed in Figure 4. On the other hand, when the two birds were laterally offset at WTS = −26 cm, we observed a 17% increase in pressure on the underside of the right wing of the second bird. This local increase in pressure improved lift by 7.3%. The distribution of pressures also revealed the pressure imbalance between the right and left wings of bird 2. As mentioned previously, this pressure imbalance induced an imbalance of lift and drag. Beyond a certain offset, the pressure under the wings of the second bird was equivalent to that of the bird alone and the imbalance of forces decreased.
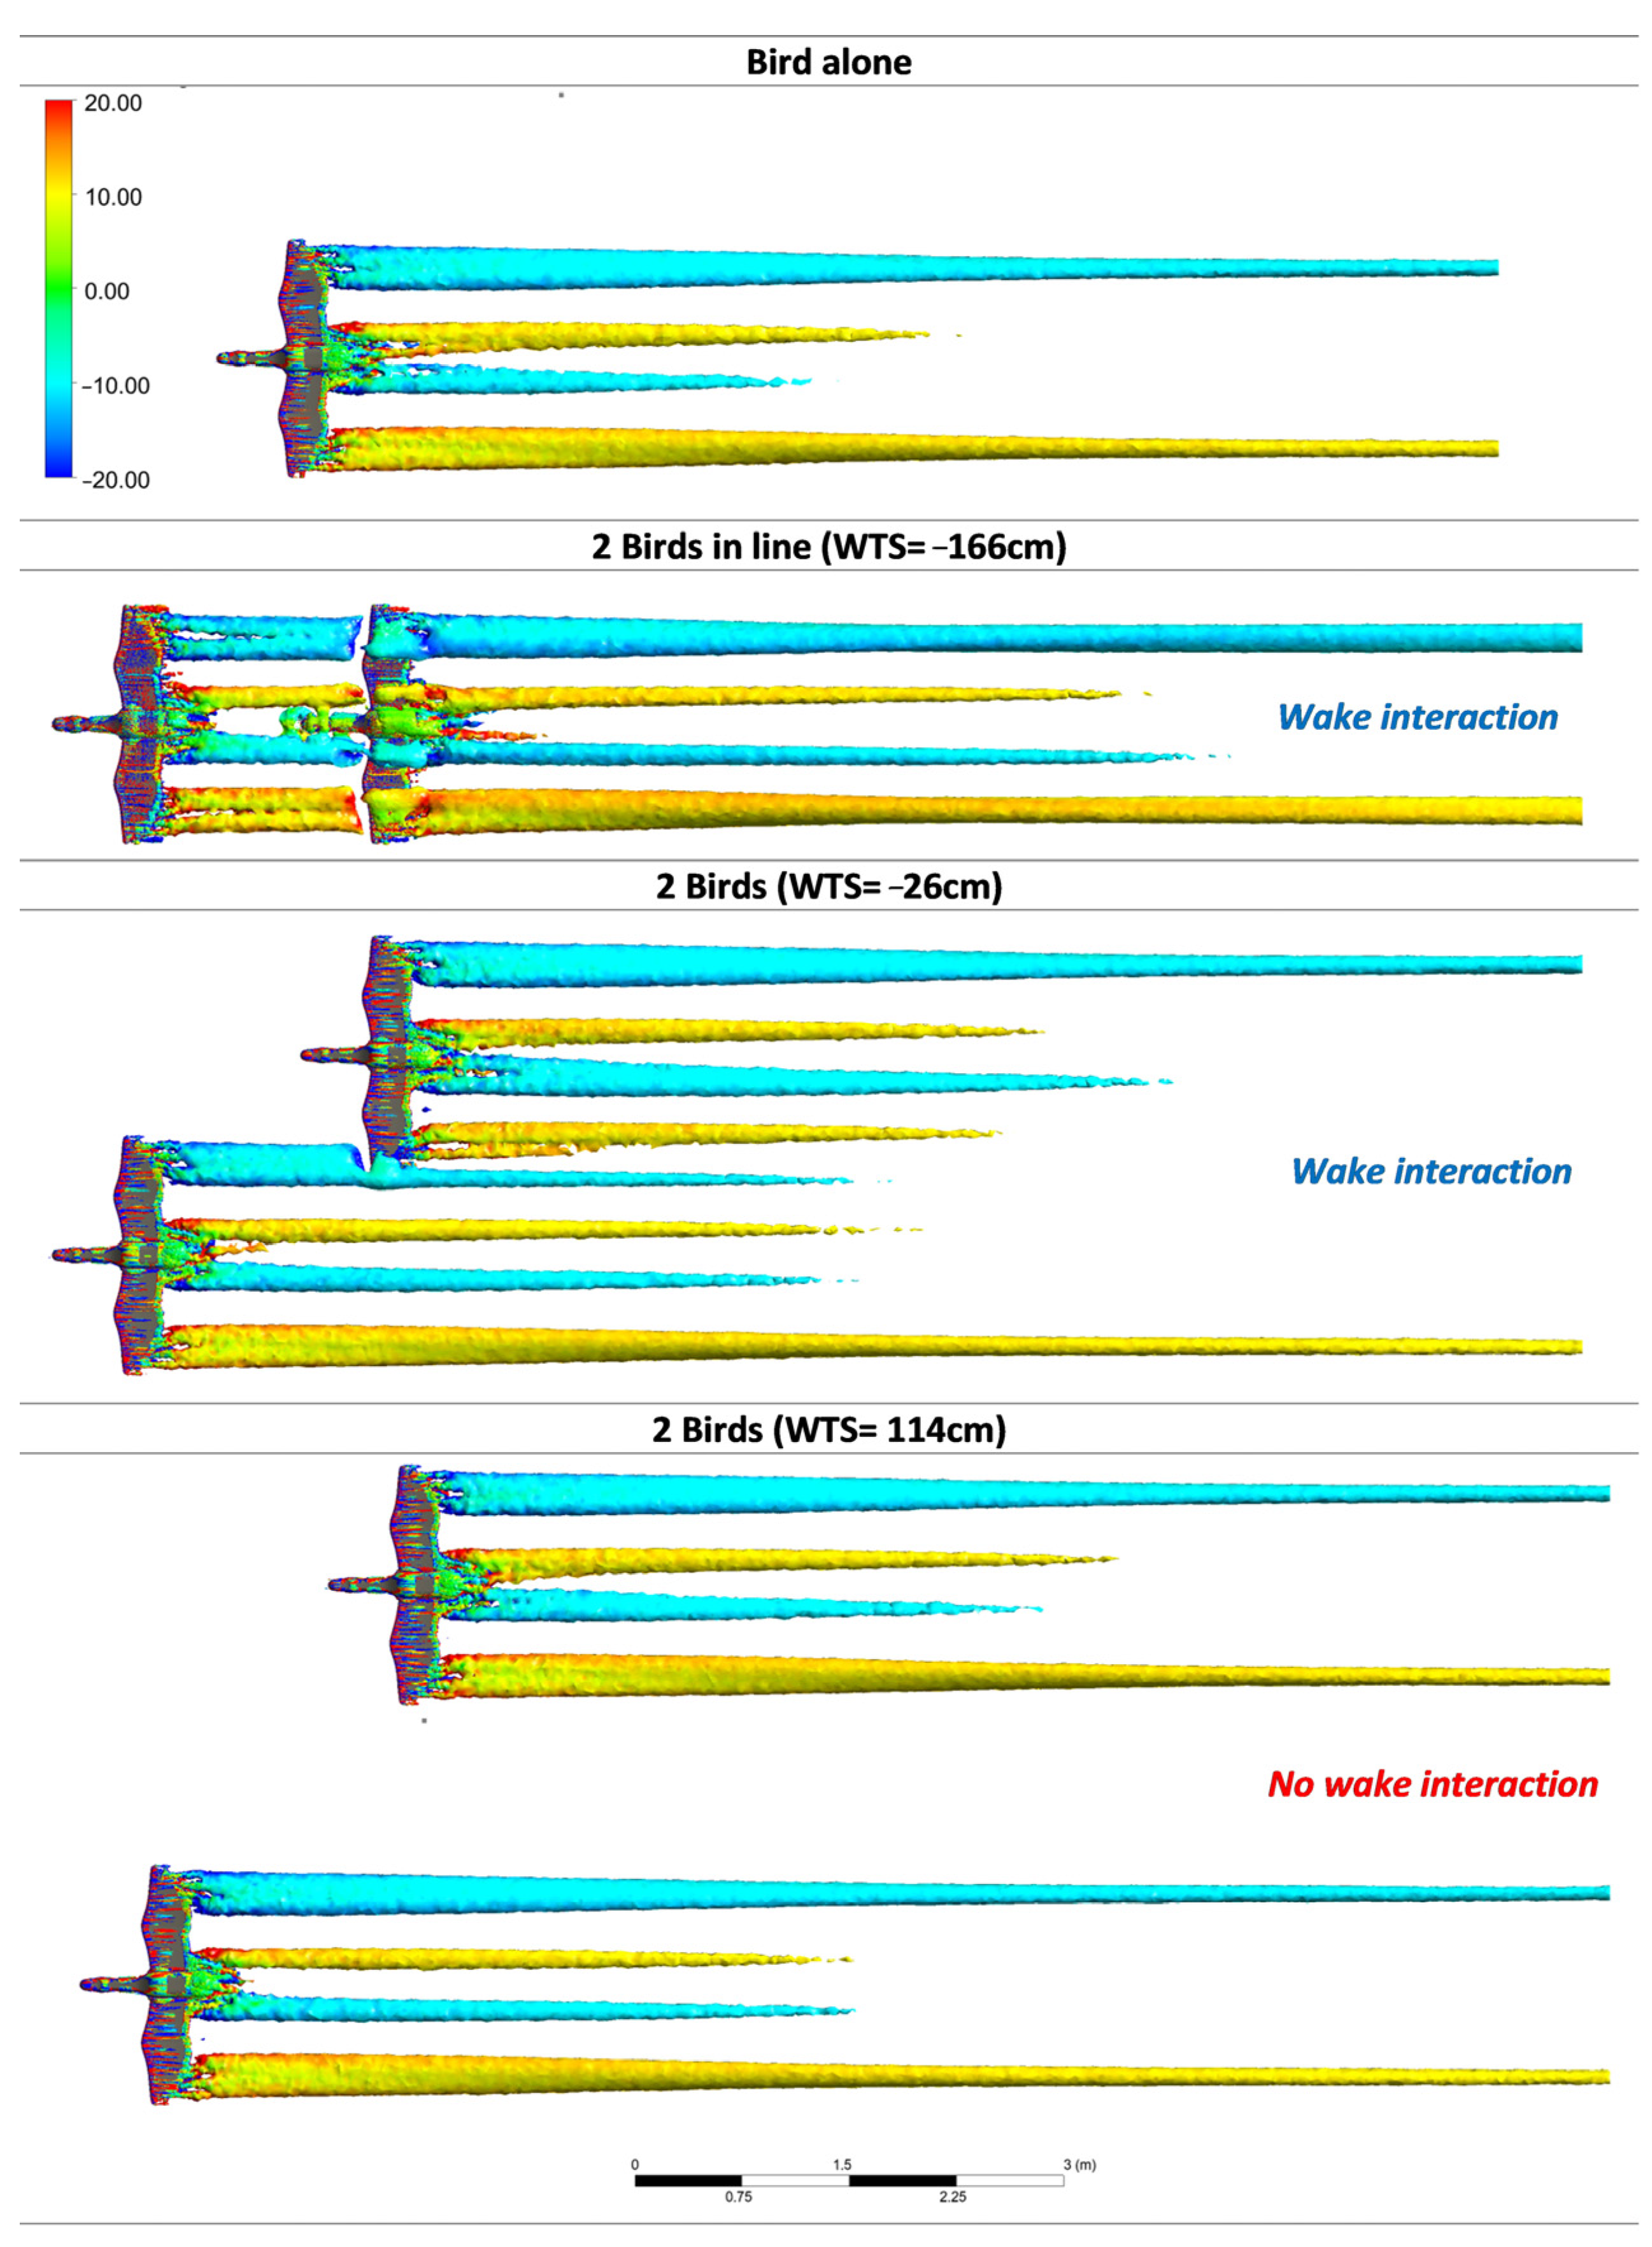
To highlight the structure of the vortex wake, Figure 8 depicts the vorticity isosurfaces for the bird alone, the birds in line (WTS = −166 cm) and the birds offset by WTS = −26 cm and 114 cm, respectively. The isosurfaces provided insight into the three-dimensional structure of the vortex wake while giving quantitative information about the vortex intensity (vorticity).
Note that the vorticity range (vortex intensity in the direction of the bird’s motion) was purposely limited to the interval [−20; 20] to highlight any change in vortex intensity. The red and blue colors indicated that the vortices had opposite directions of rotation, with one vortex at the wingtip flowing clockwise and the other counterclockwise. 
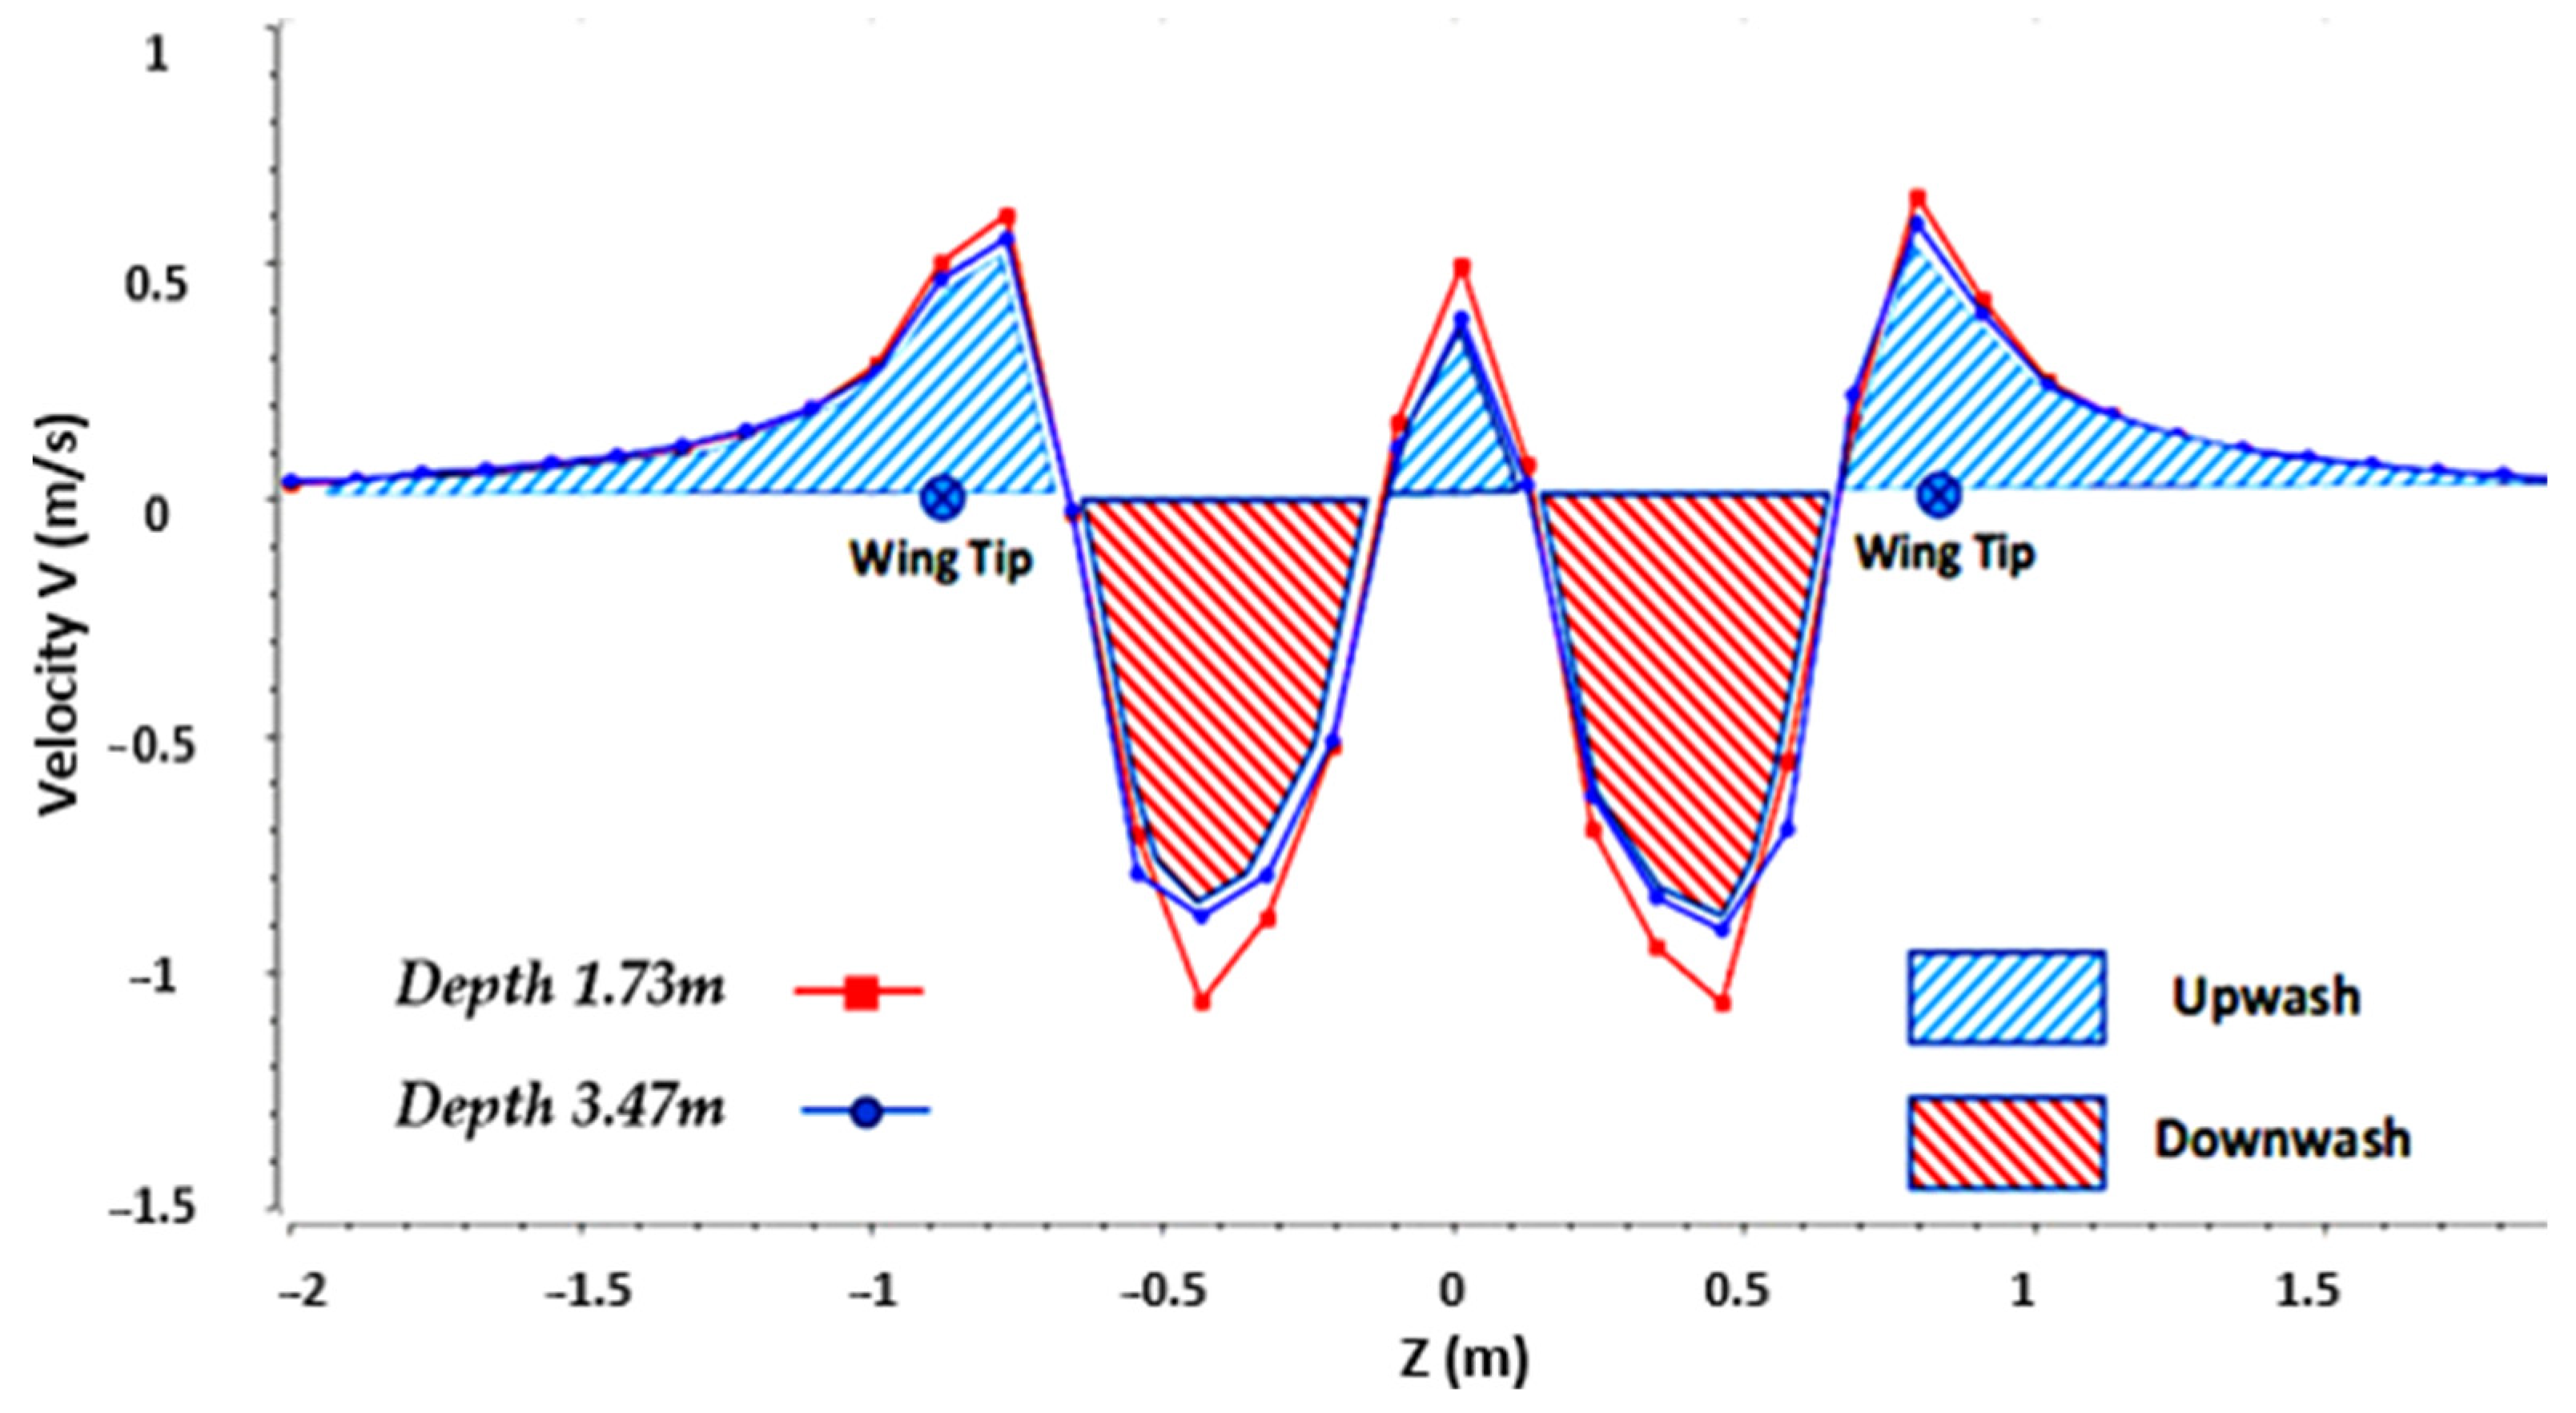
Figure 8 reveals that the wake consisted of a pair of wingtip vortices and a pair of tail vortices. In addition, we plotted (Figure 9) the vertical velocity profile along an axis passing through the core of the vortex flow for different depths (3.47 m and 1.73 m). The velocity profile (Figure 9) gave us valuable information about the flow dynamics in the wake of the bird alone. First, as shown in the figure, the absolute velocities were slightly higher for the shortest depth because the vortex energy dissipated as the wake moved away.
The velocity profile in Figure 9 clearly highlights the upwash zones, in which the vertical velocities are positive, and the downwash zones, in which the vertical velocities are negative.

4. Discussion

The findings of our study revealed that drag was significantly reduced when birds flew in line. In this case, the closer the birds were to each other, the more the drag was reduced (−17% compared to the bird flying alone for a depth of 1.73 m against −15% for a depth of 3.47 m). Another interesting note is that, when the birds flew in a line, the leader bird also gained benefits from the presence of the second bird in its wake, with about an 8% reduction in drag compared to the bird alone. This observation has already been made in other sports such as cycling [13] or running [11] and was consistent with the results of Hainsworth [10], who reported that the leaders also benefited from a reduction in drag, but in smaller proportions than the rest of the group. The results also suggested that the more the birds shifted laterally, relative to each other, the lower the aerodynamic gain. Indeed, birds flying in line in the wake of preceding birds would benefit from a low-pressure zone, allowing them to minimize their drag. In such a case, the birds practice drafting, an aerodynamic phenomenon well known in sports [11,13]. As they emerge from this aerodynamic shelter, the birds increase the aerodynamic forces that oppose their movement. Our calculations showed that the optimum offset to obtain a more favorable L/D ratio than that of the bird alone was around −26 cm. This optimal position implied that the tips of the birds’ wings overlapped laterally (see Figure 8) to obtain better aerodynamic efficiency, as confirmed by Badgerow and Hainsworth [4].
In this study, we monitored the forces exerted on each of the wings of the birds. This highlighted a phenomenon that has seen little discussion in the literature, yet is evident when birds are observed flying in a V formation. When the bird in the wake of the preceding bird shifts laterally, one of its two wings is exposed to the airflow, which induces an imbalance in the forces applied to the left and right wings. These results, which might seem counter-intuitive at first sight, could be explained by a wake interaction that would induce a local modification of the dynamics of the flow in the vicinity of the birds. This wake interaction will, depending on the position of one bird relative to another, prove beneficial or, on the contrary, be disadvantageous from an aerodynamic point of view. As shown in Figure 9, the phenomenon was particularly visible for birds in line and for a WTS of −26 cm. Even if the phenomenon were not visible in Figure 9, the wake of bird 1 continued to disturb the aerodynamic behavior of bird 2 for a significant lateral shift (see Figure 4). The topology of the flow, as illustrated in this study, was consistent with observations performed on the wake of other gliding bird species, such as the swift [23]. The pressure differential between the lower and upper surfaces of the wings is at the origin of a reversal of the air flow behind the wing which causes the rotation of the air masses downstream of the ends of the wings. Once the reversal is complete, the wake consists of two main contra-rotating cylindrical vortices. Green [33] highlighted three mechanisms to describe the origin of wingtip vortices. The first and most common mechanism is pressure imbalance at the tip, during the process of generating lift. The pressure difference accelerates the flow from the pressure side (lower surface) to the suction side (upper surface), which leads to the formation of a wingtip vortex. The strength of the vortex depends on the magnitude of the pressure difference, which in turn depends on the angle of attack. The two wingtip vortices do not merge as they flow in opposite directions. The wingtip vortices rise from the wingtips and tend to dip and roll over each other downstream of the wing. Again, the end vortices eventually dissipate, their energy being transformed by viscosity. These vortices imply that the air located inside the vortex system, in the immediate wake of the bird, moves downwards (downwash), while the air located on the sides, outside the vortex system, moves up (upwash). Theoretically, a bird positioning itself in the upwash zone of the preceding bird would benefit from the upward flow, which would allow it to improve its lift [3,8]. The results obtained for the birds in line and those which implied a significant reduction in drag and lift for the second bird could seem counter-intuitive at first sight.
However, if we observe the velocity profile, as shown in Figure 9, we see that, in absolute value, the velocities in the downwash zone were greater than the velocities in the upwash zone. Thus, when the birds flew one behind the other, part of the body of the second bird was subjected to downward flows of greater intensity than the upward flows, which largely explains the loss of lift estimated by our results. Consequently, the only way for the second bird to benefit from the upwash zones and to improve its lift is to shift laterally to an optimum which corresponds to the peak of positive speed. However, shifting involves an imbalance of forces between the left wing and the right wing. This imbalance is highlighted in Figure 6 and Figure 7. To our knowledge, no scientific study has reported this imbalance of forces between the two wings of a migratory bird. We therefore hypothesized that a bird must implement physiological and biomechanical adaptation mechanisms to counter this aerodynamic phenomenon.

5. Limitations

This study must be interpreted with regard to several limitations. First of all, the geometry used in this study was simplified and did not necessarily reflect the complexity of a real bird wing—in particular, the absence of feathers, which play an active role in aerodynamics. In this study, the bird was considered to be a rigid, non-deformable solid, whereas in reality, a bird’s wing is highly flexible. Secondly, the study was carried out on birds in gliding flight. As such, the interpretation of the results cannot be applied to flapping flight, which involves a different aerodynamic analysis. Finally, the study was freed from environmental constraints (temperature, wind, etc.) which could have modified the aerodynamic parameters.

6. Conclusions

The aim of this work was to investigate the influence of both Wing Tip Spacing (WTS) and depth (the distance along the flight path between birds) on the aerodynamic forces exerted on two Canada Geese in gliding flight. A CFD method was used to highlight the three-dimensional vortex structures that developed in the wake of two Canada geese flying at an altitude of 1000 m and a speed of 13.9 m/s. The post-processing of the 3D results revealed a complex flow whose main structure was composed of two contra-rotating vortices developing at the wing tip, as well as two tail vortices. Velocity profiles plotted in the core of the wake vortex flow highlighted two distinct zones: the upwash zone, in which the flow was upward (positive velocities) and the downwash zone, in which the flow was downward (negative velocities). The results showed that, in absolute value, the velocities in the downwash zone were greater than the velocities in the upwash zone. Thus, when the birds flew one behind the other in a line, part of the body of the following bird was subjected to downward flows of greater intensity than the upward flows. In this specific case, the lift was halved compared to a bird flying alone. Our calculations showed that the optimum WTS was around −26 cm. This optimal position resulted in a more favorable L/D ratio than for the bird alone and implied that the tips of the birds’ wings overlapped laterally to obtain better aerodynamic efficiency. Analysis of the results of our study suggested that, when birds soar, the effects of longitudinal distance (depth) on the aerodynamic performance of the bird were reduced in comparison with flapping flight. This could be attributed to the fact that the structure of the wake had a more linear character than that for flapping flight, which induces a wake of fluctuating shape. Our study also revealed an imbalance in the forces applied to the left and right wings. This was attributed to a local modification of the dynamics of the flow in the vicinity of the birds due to the lateral shift.

Author Contributions

Conceptualization, F.B. (Fabien Beaumont) and G.P.; methodology, F.B. (Fabien Bogard); software, F.B. (Fabien Beaumont); validation, S.M., G.P. and F.B. (Fabien Bogard); formal analysis, F.B. (Fabien Beaumont); investigation, G.P.; resources, F.B. (Fabien Bogard); data curation, S.M.; writing—original draft preparation, F.B. (Fabien Beaumont); writing—review and editing, G.P.; visualization, F.B. (Fabien Bogard); supervision, G.P.; project administration, S.M. All authors have read and agreed to the published version of the manuscript.

Funding

This research received no external funding.

Data Availability Statement

The datasets generated during the current study are available from the first author on reasonable request.

Conflicts of Interest

The authors declare no conflict of interest.

References

  1. Morten, J.M.; Burgos, J.M.; Collins, L.; Maxwell, S.M.; Morin, E.-J.; Parr, N.; Thurston, W.; Vigfúsdóttir, F.; Witt, M.J.; Hawkes, L.A. Foraging Behaviours of Breeding Arctic Terns Sterna paradisaea and the Impact of Local Weather and Fisheries. Front. Mar. Sci. 2022, 8, 760670. [Google Scholar] [CrossRef]
  2. Lissaman, P.B.S.; Shollenberger, C.A. Formation Flight of Birds. Science 1970, 168, 1003–1005. [Google Scholar] [CrossRef] [PubMed]
  3. Weimerskirch, H.; Martin, J.; Clerquin, Y.; Alexandre, P.; Jiraskova, S. Energy saving in flight formation. Nature 2001, 413, 697–698. [Google Scholar] [CrossRef] [PubMed]
  4. Badgerow, J.P.; Hainsworth, F. Energy savings through formation flight? A re-examination of the vee formation. J. Theor. Biol. 1981, 93, 41–52. [Google Scholar] [CrossRef]
  5. Gould, L.L.; Heppner, F. The vee formation of Canada geese. Auk 1974, 91, 494–506. [Google Scholar]
  6. Mirzaeinia, A.; Heppner, F.; Hassanalian, M. An analytical study on leader and follower switching in V-shaped Canada Goose flocks for energy management purposes. Swarm Intell. 2020, 14, 117–141. [Google Scholar] [CrossRef]
  7. Cutts, C.; Speakman, J. Energy savings in formation flight of pink-footed geese. J. Exp. Biol. 1994, 189, 251–261. [Google Scholar] [CrossRef]
  8. Hummel, D. Aerodynamic aspects of formation flight in birds. J. Theor. Biol. 1983, 104, 321–347. [Google Scholar] [CrossRef]
  9. Portugal, S.J.; Hubel, T.Y.; Fritz, J.; Heese, S.; Trobe, D.; Voelkl, B.; Hailes, S.; Wilson, A.M.; Usherwood, J.R. Upwash exploitation and downwash avoidance by flap phasing in ibis formation flight. Nature 2014, 505, 399–402. [Google Scholar] [CrossRef]
  10. Hainsworth, F.R. Precision and Dynamics of Positioning by Canada Geese Flying in Formation. J. Exp. Biol. 1987, 128, 445–462. [Google Scholar] [CrossRef]
  11. Beaumont, F.; Legrand, F.; Bogard, F.; Murer, S.; Vernede, V.; Polidori, G. Aerodynamic interaction between in-line runners: New insights on the drafting strategy in running. Sports Biomech. 2021, 1–16. [Google Scholar] [CrossRef]
  12. Beaumont, F.; Bogard, F.; Murer, S.; Polidori, G. Fighting crosswinds in cycling: A matter of aerodynamics. J. Sci. Med. Sport 2022, 26, 46–51. [Google Scholar] [CrossRef]
  13. Belloli, M.; Giappino, S.; Robustelli, F.; Somaschini, C. Drafting effect in cycling: Investigation by wind tunnel tests. Procedia Eng. 2016, 147, 38–43. [Google Scholar] [CrossRef]
  14. Videler, J.; Groenewold, A. Field Measurements of Hanging Flight Aerodynamics in the Kestrel Falco Tinnunculus. J. Exp. Biol. 1991, 155, 519–530. [Google Scholar] [CrossRef]
  15. Del Hoyo, J.; Wlliott, A.; Sargatal, J. (Eds.) Handbook of the Birds of the World; Lynx Edicions: Barcelona, Spain, 1992. [Google Scholar]
  16. Spedding, G.R.; Rosén, M.; Hedenström, A. A family of vortex wakes generated by a thrush nightingale in free flight in a wind tunnel over its entire natural range of flight speeds. J. Exp. Biol. 2003, 206, 2313–2344. [Google Scholar] [CrossRef]
  17. Nafi, A.; Ben-Gida, H.; Guglielmo, C.G.; Gurka, R. Aerodynamic forces acting on birds during flight: A comparative study of a shorebird, songbird and a strigiform. Exp. Therm. Fluid Sci. 2020, 113, 110018. [Google Scholar] [CrossRef]
  18. Maeng, J.-S.; Park, J.-H.; Jang, S.-M.; Han, S.-Y. A modeling approach to energy savings of flying Canada geese using computational fluid dynamics. J. Theor. Biol. 2013, 320, 76–85. [Google Scholar] [CrossRef]
  19. Beaumont, F.; Murer, S.; Bogard, F.; Polidori, G. Aerodynamics of a flapping wing as a function of altitude: New insights into the flight strategy of migratory birds. Phys. Fluids 2021, 33, 127118. [Google Scholar] [CrossRef]
  20. Beaumont, F.; Bogard, F.; Murer, S.; Matim, P.G. Modeling of Three-dimensional Unsteady Wake Past a Large Migratory Bird during Flapping Flight. WSEAS Trans. Fluid Mech. 2022, 17, 10–17. [Google Scholar]
  21. Liu, T.; Kuykendoll, K.; Rhew, R.; Jones, S. Avian Wings. In Proceedings of the 24th AIAA Aerodynamic Measurement Technology And Ground Testing Conference, Portland, OR, USA, 28 June–1 July 2004; pp. 2004–2186. [Google Scholar]
  22. Dimitriadis, G.; Gardiner, J.D.; Tickle, P.G.; Codd, J.; Nudds, R.L. Experimental and numerical study of the flight of geese. Aeronaut. J. 2015, 119, 803–832. [Google Scholar] [CrossRef]
  23. Henningsson, P.; Hedenström, A.; Bomphrey, R.J. Efficiency of Lift Production in Flapping and Gliding Flight of Swifts. PLoS ONE 2014, 9, e90170. [Google Scholar] [CrossRef] [PubMed]
  24. Blocken, B.J.E. Computational Fluid Dynamics for urban physics: Importance, scales, possibilities, limitations and ten tips and tricks towards accurate and reliable simulations. Build. Environ. 2015, 91, 219–245. [Google Scholar] [CrossRef] [Green Version]
  25. Tucker, V.A.; Schmidt-Koenig, K. Flight Speeds of Birds in Relation to Energetics and Wind Directions. Auk 1971, 88, 97–107. [Google Scholar] [CrossRef]
  26. Fergus, C. Canada Goose; Wildlife Notes-20 LDR0103; Pennsylvania Game Commission: Harrisburg, PA, USA, 2010. [Google Scholar]
  27. Funk, G.D.; Milsom, W.K.; Steeves, J.D. Coordination of wingbeat and respiration in the Canada goose. I. Passive wing flapping. J. Appl. Physiol. 1992, 73, 1014–1024. [Google Scholar] [CrossRef]
  28. Blocken, B.; van Druenen, T.; Toparlar, Y.; Malizia, F.; Mannion, P.; Andrianne, T.; Marchal, T.; Maas, G.-J.; Diepens, J. Aerodynamic drag in cycling pelotons: New insights by CFD simulation and wind tunnel testing. J. Wind. Eng. Ind. Aerodyn. 2018, 179, 319–337. [Google Scholar] [CrossRef]
  29. Fintelman, D.; Hemida, H.; Sterling, M.; Li, F.-X. CFD simulations of the flow around a cyclist subjected to crosswinds. J. Wind. Eng. Ind. Aerodyn. 2015, 144, 31–41. [Google Scholar] [CrossRef]
  30. Withers, P.C. An Aerodynamic Analysis of Bird Wings as Fixed Aerofoils. J. Exp. Biol. 1981, 90, 143–162. [Google Scholar] [CrossRef]
  31. Tennekes, H. The Simple Science of Flight: From Insects to Jumbo Jets; MIT Press: Cambridge, MA, USA, 1997. [Google Scholar]
  32. Hoerner, S.F.; Borst, H.V. Fluid-dynamic lift: Practical information on aerodynamic and hydrodynamic lift. NASA STI/Recon Tech. Rep. A 1975, 76, 32167. [Google Scholar]
  33. Green, S.I. Wing Tip Vortices. In Fluid Vortices; Kluwer Academic Publishers: Dordrecht, The Netherlands, 1995. [Google Scholar]
Figure 1. (a) Simplified geometry of the Canada goose. (b) Positioning of the birds in relation to each other. (c) Computational domain size and boundary conditions.
Fluids 08 00050 g001
Figure 2. (a) Surface mesh on the bird’s body and in a 2D vertical plane intersecting a wing of the bird; (b) a detailed view of the inflation mesh around the wings.
Fluids 08 00050 g002
Figure 3. Forces acting on a flying bird.
Fluids 08 00050 g003
Figure 4. Reduction or increase (in %) in drag (a) and lift (b) of bird 2, compared to bird alone, as a function of distance between birds (Wing Tip Spacing and Depth).
Fluids 08 00050 g004
Figure 5. Evolution of the CL/CD ratio for the single bird and for the second bird of each case as a function of WTS and depth.
Fluids 08 00050 g005
Figure 6. Lift imbalance (%) between the right and left wings of the second bird as a function of WTS and for a depth equal to 1.73 m.
Fluids 08 00050 g006
Figure 7. Distribution of pressure coefficients on the underside of the single bird and the second bird of the following cases: aligned birds, WTS = −26 cm, −166 cm and 114 cm. For each case, depth = 1.73 m.
Fluids 08 00050 g007
Figure 8. Isosurfaces colored by vorticity for the single bird, the birds in line (WTS = −166 cm) and the birds offset by WTS = −26 cm and WTS = 114 cm, respectively.
Fluids 08 00050 g008
Figure 9. Vertical velocity profile plotted along an axis passing through the core of the vortex flow for different depth (3.47 m and 1.73 m).
Fluids 08 00050 g009
Table 1. Main CFD parameters and dimensional characteristics of a Canada goose [25,27]. Numerical conditions are determined assuming that the bird flies at an altitude of 1000 m [26].
VariableValue
Chord length (c)0.3 m
Wing size0.72 m
Flight speed (U)13.9 m/s
Wingspan1.66 m
Flight altitude1000 m
Disclaimer/Publisher’s Note: The statements, opinions and data contained in all publications are solely those of the individual author(s) and contributor(s) and not of MDPI and/or the editor(s). MDPI and/or the editor(s) disclaim responsibility for any injury to people or property resulting from any ideas, methods, instructions or products referred to in the content.

