
Mechanisms for CH4/CO2 Swapping in Natural Sediments


1
State Key Laboratory of Oil and Gas Reservoir Geology and Exploitation, Southwest Petroleum University, Xindu Road No. 8, Chengdu 610500, China
2
State Key Laboratory of Natural Gas Hydrate, Sun Palace South Street No. 6, Beijing 100027, China
3
Hyzenenergy, 26701 Quail Creek, Laguna Hills, CA 92656, USA
4
Strategic Carbon LLC, 20 Ladd St., Suite 200, Portsmouth, NH 03801, USA
Fluids 2022, 7(8), 260; https://doi.org/10.3390/fluids7080260
Submission received: 20 May 2022
/
Revised: 13 June 2022
/
Accepted: 28 July 2022
/
Published: 30 July 2022
Abstract
:Production of natural gas from hydrates involves multiple complex competing phase transitions, which are rarely analyzed thermodynamically. Hydrates in sediments are typically examined in terms of the local conditions of indirect thermodynamic variables, such as temperature and pressure. This can be very misleading in the evaluation of hydrate production methods. Any hydrate production method is governed by the thermodynamic laws. The combined first and second laws determine phase distributions in terms of Gibbs free energy minimum. This minimum is constrained by the first law of thermodynamics through enthalpy. The entropy changes during a specific action for hydrate production need to be sufficient to overcome the bottlenecks of breaking hydrogen bonds. In this work, I point out some important drawbacks of the pressure reduction method. The main focus is, however, on combined safe long-term storage of CO2 and release of CH4. It is demonstrated that CO2 hydrate is more stable than CH4 hydrate, in contrast to interpretations of pressure temperature diagrams, which are frequently used in discussions. Pressure and temperature are independent thermodynamic variables and merely determine at which conditions of these independent variables specific hydrates can exist. Gibbs free energy is the dependent thermodynamic variable that determines the level of phase stability. The first law determines the need for supply of thermodynamic driving forces for hydrate dissociation. Unlike in conventional analysis, it is pointed out that chemical work is also a driving force in the pressure reduction method. The release of heat from the formation of a new CO2 hydrate from injection gas is the primary source for CH4 hydrate dissociation in the CO2 method. Increased salinity due to consumption of pure water for new hydrate could potentially also assist in dissociation of in situ CH4 hydrate. Based on thermodynamic calculations, it is argued that this effect may not be significant.
1. Introduction
Pressure reduction as a method for hydrate production has, to a large extent, dominated experimental efforts and was tested early at pilot scale in Alaska [1,2,3,4]. These early studies were far too short (typically one week) to result in any conclusions on the feasibility of the pressure reduction method. The first offshore pilot plant study that utilized the pressure reduction method was conducted in offshore Japan in 2012 [5,6]. The production part of the hydrate reservoir froze down after six days [5,6], and the experiment was stopped. Sand production was also reported as an additional problem. The second test in offshore Japan was planned to last for six months. The formation froze down, however, and the test stopped after 24 days [7]. These pilot studies illustrate a more general challenge, which is also observed in many experimental studies that utilize the pressure reduction method.
In addition to the pilot studies on pressure reduction, numerous experiments have also been conducted and reported in various scientific journals. I am not going to refer to these experiments for three reasons. One reason is that some of the relevant experiments lack essential information and are therefore incomplete in the sense that other researchers should be able to repeat published experimental data. Experiments are also frequently conducted with boundary conditions that are not representative of natural conditions. Constant temperature is an example of a condition that, in practice, involves an unrealistic exchange of heat with the surroundings as compared to hydrates in natural sediments. A third reason is that most experiments, including conducted pilot-scale experiments, are not planned according to a thermodynamic analysis. Projections of hydrate stability limits in pressure and temperature are typically used as a basis for deciding on the level of pressure reduction applied. There are many drawbacks of such an “intuitive” approach. First of all, pressure and temperature are independent thermodynamic variables and do not tell us anything about the thermodynamic driving forces. There is nothing like “hydrate fugacity”, although it appears in some reports on empirical modeling of hydrate phase transition kinetics and driving forces for hydrate formation and dissociation. Fugacity is uniquely defined on a component basis and directly related to the chemical potential for the same component. Definition of a hydrate fugacity is at best an empirical definition.
The thermodynamic driving force for hydrate dissociation is the difference in Gibbs free energy between the final liquid water and released gas minus Gibbs free energy for the hydrate. Specifically, this can be written as follows:
where G is molar Gibbs free energy, and the superscript H,Dissociation denotes hydrate dissociation; x is mole-fraction with superscript for phase and subscript for molecule type; H2O is water, and j is a general guest phase index; i is guest molecule index; superscript w is for water phase, and the use of this superscript for guest as well is just an indication of the same final conditions for gas and liquid water; superscript H is the index for hydrate; and finally, μ is the chemical potential, with subscript as the guest component index.
For a pure component hydrate, Equation (1) involves a change in conditions to the temperature and pressure at the stability limit. Then, the free energy difference is zero until the hydrate is dissociated, and then there is a change to the final condition w. In most cases for volatile hydrate formers, such as CH4, the final dissociation condition will replace w. Hydrates of mixed guests are more complex in terms of dissociation condition.
A fourth problem, which is also related to the general lack of thermodynamic analysis, is the lack of mechanism and explanations for the dissociation due to pressure reduction. This will be discussed in more detail later. Yet another problem involves the implications of the first law and the supply of heat from the surrounding formation. What is the actual heating capacity of a given hydrate reservoir? What is the transport capability for heat from the surroundings to the producing hydrate? Finally—what are the implications of the second law?
A general problem is that most thermodynamic packages for hydrate are based on the so-called reference method and do not have any direct route to Gibbs free energy nor, therefore, any direct route to calculations of enthalpy. See, for instance, Kvamme et al. [8] for more details on the reference method versus the use of residual thermodynamic, which is utilized in this work.
Much of the general concept of residual thermodynamics for hydrates has been illustrated and discussed in several papers that are referred to in this work. Some of the equations need to be repeated here in order to visualize and discuss implications for various hydrate production schemes.
The primary objective of this work is to illustrate why injection of CO2 is a feasible approach, and what is needed to overcome dynamic bottlenecks and injection limitations. A secondary objective is to shed light on some crucial limitations of the pressure reduction method.
Assessing the impact of pore salinity on hydrate stability is a third objective. There is a huge amount of experimental research that illustrate how salinity affects temperature and pressure hydrate stability. There are also many papers on how salinity affects the kinetics of hydrate formation in very specific experimental set-up designs. None of these studies are relevant for the focus of this work. The focus in this work is the impact of salinity on thermodynamic properties, and how this then affects thermodynamic analysis of hydrate production methods. For this reason, there are no references to experimental work, including our own experimental work during the latest three decades. The only exceptions are experimental data for pressure temperature stability limits of hydrate formed from saline water as a basis for model verification.
Hydrate stability, like any other phase stability, is a multi-dimensional quantity that includes concentrations of all components in all co-existing phases in addition to temperature and pressure. Most hydrate researchers, including experimental hydrate researchers since around 1940, are well aware that only one independent thermodynamic variable can be defined for equilibrium in a system of liquid water, methane, and hydrate. It is then obvious that a system with two defined independent thermodynamic variables is mathematically overdetermined and there is no unique solution (i.e., thermodynamic non-equilibrium). See also Kvamme et al. [9] and Kvamme [10] for more details of hydrate non-equilibrium and counting degrees of freedom in natural gas hydrate systems. The Gibbs phase rule is easy to use, although I prefer discrete counting. The Gibbs phase rule does not directly include all phases of importance for hydrate formation. As an example, hydrate formation from liquid water and gas is not formed from water and “bulk” gas, but rather from adsorbed molecules on the liquid water surface. Mixtures of CO2 and N2 have been examined as a possible injection gas for combined safe storage of CO2 and release of CH4 from hydrate. Selective adsorption of CO2 will dominate hydrate formation from injection gas [11].
In order to avoid misunderstandings, it should be stressed that I am not presenting any kinetic models on the nano, meso, or macro scale. For that reason, there are no references to such models or molecular dynamics simulation studies. That also includes our own studies. This work is a purely classical thermodynamic study.
The question of novelty that always arises has an easy answer. I am the only one that uses residual thermodynamics for all phases and all thermodynamic properties based on one consistent thermodynamic platform. No other publications that actively utilize the combined first and second laws to compare phase stabilities were found. Hydrate can form from many phases, and they all give different hydrates (different compositions and different free energies) [8,9,10,11,12,13,14,15,16,17,18,19,20]. This thermodynamic analysis is therefore unique, and it is different from other papers in the available literature in the sense that it is related to a recent experimental study on CO2/CH4 swapping [21]. It is the first paper that examines the impact of pore salinity on the swapping process and mechanisms in terms of thermodynamic functions (Gibbs free energy, enthalpy, and entropy), rather than salinity responses on independent thermodynamic properties such as temperature and pressure. The experiment [21] was deigned to be as close to a real case CO2/CH4 swapping as possible, and the next step will be to modify the experiment [21] so as to control the pressure of section A (see [21]) to slightly lower than injection pressure for a CO2/N2 mixture in order to properly imitate a sampling for released CH4.
The paper is organized as follows. In Section 2, I discuss why hydrates in natural sediments can never reach thermodynamic equilibrium, but rather reside in some dynamic state that depends on new hydrate formation from upcoming gas and the dissociation of hydrate due to inflow of water from above. Another important part of this discussion in that hydrates formed from different phases are different hydrates with unique compositions and unique Gibbs free energies. The thermodynamic framework is discussed in Section 3. Hydrate phase transitions in concentration gradients towards surrounding water are discussed in Section 4, followed by a section on the effects of salinity. Enthalpy changes are discussed in Section 6. A brief discussion is included in Section 7, which also examines, in more detail, why there are relatively few references to publications from other research groups in this specific paper. My conclusions are provided in Section 8.
2. Non-Equilibrium Thermodynamics in Hydrate-Filled Sediments
For a flowing system, the natural independent thermodynamic properties are the temperatures, pressures, and masses of all components in all phases. The constraints on these variables are conservation laws and conditions of thermodynamic equilibrium. For a system of two components outside of hydrate formation condition, the counting is very easy. If we use liquid water and CH4 gas as an example, then independent the thermodynamic variables are the temperatures and pressures in the two phases and the mole-fractions of each component in the two phases—eight independent variables in total. The conservation of mole-fractions in the two phases provides two constraints. Thermal equilibrium involves the same temperatures in gas and liquid water. Mechanical equilibrium involves the same pressures in the two phases. Finally, chemical equilibrium for CH4 and water between the two phases provides two equilibrium conditions. With eight independent thermodynamic variables, two constraints, and four equilibrium conditions, we have to define/control two independent thermodynamic variables. Fixing temperature and pressure provides the solubility of CH4 in water and the solubility of water in CH4 as a solution.
Bringing the same system into the hydrate-forming region adds hydrate as a phase and four new independent variables: temperature, pressure, and the mole-fraction of the two components in hydrate. Conservation of mole-fractions in hydrate is an additional constraint compared to the two-phase system. Mechanical and thermal equilibrium adds two equilibrium conditions, and chemical equilibrium for CH4 and water in hydrate and other phases add two equilibrium conditions. In summary, we have now 12 independent thermodynamic variables and 11 constraints (conservation laws and conditions of equilibrium). This is a very trivial and basic result that should not need to be discussed here. Unfortunately, however, it seems to be needed since it is a very common practice to treat pressure-temperature stability limit curves as equilibrium curves when discussing hydrates in sediments, or hydrates in a pipeline or process equipment. In these settings, then, both temperature and pressure are defined. The number of constraints and equilibrium conditions plus the two defined independent thermodynamic variables is 13, and the number of independent variables is 12. On a macroscopic scale, mechanical equilibrium is typically established fairly fast (seconds to minutes). CH4 is a thermal insulator, and the time to reach thermal equilibrium will vary depending on the relative size of the water and gas phase, as well conditions of temperature and pressure. Thermal equilibrium is still typically achieved in a time scale of seconds to minutes.
When the three-phase system has reached thermal and mechanical equilibrium, we can take these variables out of the list of independent variables and equilibrium, since they are defined in the specific reservoir location. We are then left with six mole-fractions as independent variables, with three constraints and four independent equilibrium conditions for CH4 and liquid water. The conservation laws obviously have to be fulfilled, and we are then left with conditions of chemical equilibrium which are over-determined.
A general consequence of the discussion above is that hydrates in porous media cannot reach equilibrium. As mentioned above, the use of Gibbs phase rule requires extra care in the use for complex water systems. With n being number of components and π being number of phases, τ is then the number of independent thermodynamic variables that must be defined in order for equilibrium to be possible. This can be written as follows:
This obviously works very well for the systems discussed above. CH4 and water distributed over two phases gives τ = 2, and both temperature and pressure can be defined for equilibrium. Adding hydrate as a phase reduces τ to 1, and only temperature and pressure can be fixed. The problem with Equation (6) is that the user has to evaluate the use of the equation critically. The system of water, CO2, and N2 inside the hydrate region was mentioned as an example for selective adsorption. In highly oversimplified terms, adsorption of liquid is determined by the individual components’ attraction to water, and how close to condensation the specific components are. At typical natural gas hydrate conditions, CO2 is either a gas or condensed, while N2 is super-critical. CO2 has a significant quadrupole moment in interactions with water. Short-range interactions between water and CO2 are also significantly stronger than interactions between water and the non-polar N2. These differences are, of course, also reflected in substantial differences in water solubility for these two components. The critical issue is, however, that hydrate does not form from “bulk” gas. Hydrate nucleates on the liquid water side of a gas/water interface. The water interphase phase-side concentration of the different gases will reflect the concentration of adsorbed components on the gas side. If we now use Equation (6) without any reflections, we have three components and three phases, and we can define both temperature and pressure. However, as discussed before, the adsorbed phase involves a selective adsorption so that the concentration of CO2 on liquid water phase is higher than the concentration of CO2 in “bulk” water. By thermodynamic definition, any phase with a unique density and composition is a separate phase with unique Gibbs free energy. Returning to Equation (6) and adding adsorption on liquid water as a separate phase, we end up with τ = 1. See also Kvamme [11] for a 2D adsorption model and example calculations. Since chemical potentials of water and guests are different in different phases in a non-equilibrium situation according to Equations (2)–(5), the hydrates formed from different phases are also different [8,9,10,11,12,13,14,15,16,17,18,19,20]. There will, at minimum, be one unique hydrate from liquid water formed by homogeneous nucleation of dissolved CO2 in water. Practically, there can be many different hydrates formed for concentrations in-between solubility and the minimum concentration of CO2 in water to keep the hydrate stable. For details on the calculations of these curves, see Section 3.
Since hydrate cannot reach equilibrium, I consequently use hydrate stability limits in specific projections, as temperature-pressure hydrate stability limits are not an equilibrium curve but a range of stability limits in line with other stability limits, like those plotted in Figure 1. For simplicity, I use only CO2 in this first illustration and use CO2/N2 later. This way, it is easier to visualize the impact of salinity. As expected, there are not dramatic differences between pure water and average seawater (mole-fraction NaCl equal to 0.108), but there are substantial differences between pure water and results for mole-fraction NaCl 0.0384.
Formation of a new hydrate from injection of CO2 in CH4 hydrate-filled sediments leads to extraction of water and higher salinity, although dissociation of CH4 releases water. This dynamic situation of water consumption and release of water leaves an open question regarding whether the pore salinity changes significantly or not. Due to the limited difference between hydrate from pure water and seawater, I only plot free energies for two cases in Figure 2.
Note that hydrates can form for all concentrations in-between the liquid solubility of CO2 and the hydrate stability limits. Any specific concentration of CO2 between those limits will lead to a unique hydrate. Due to the limited difference between hydrate from pure water and seawater, I only plot free energies for two cases in Figure 2.
It is of relevance to the discussion above to compare the stability of the homogeneous hydrates in Figure 2 to heterogeneous hydrates formed from liquid water and gas. Before that, we can look at some calculations for CH4 hydrate as verification of the model system.
In Figure 3a, the calculated pressure-temperature stability limits for hydrate formed from pure water and CH4, as well hydrate formed from water containing 0.0394 mole-fracion NaCL, are plotted.
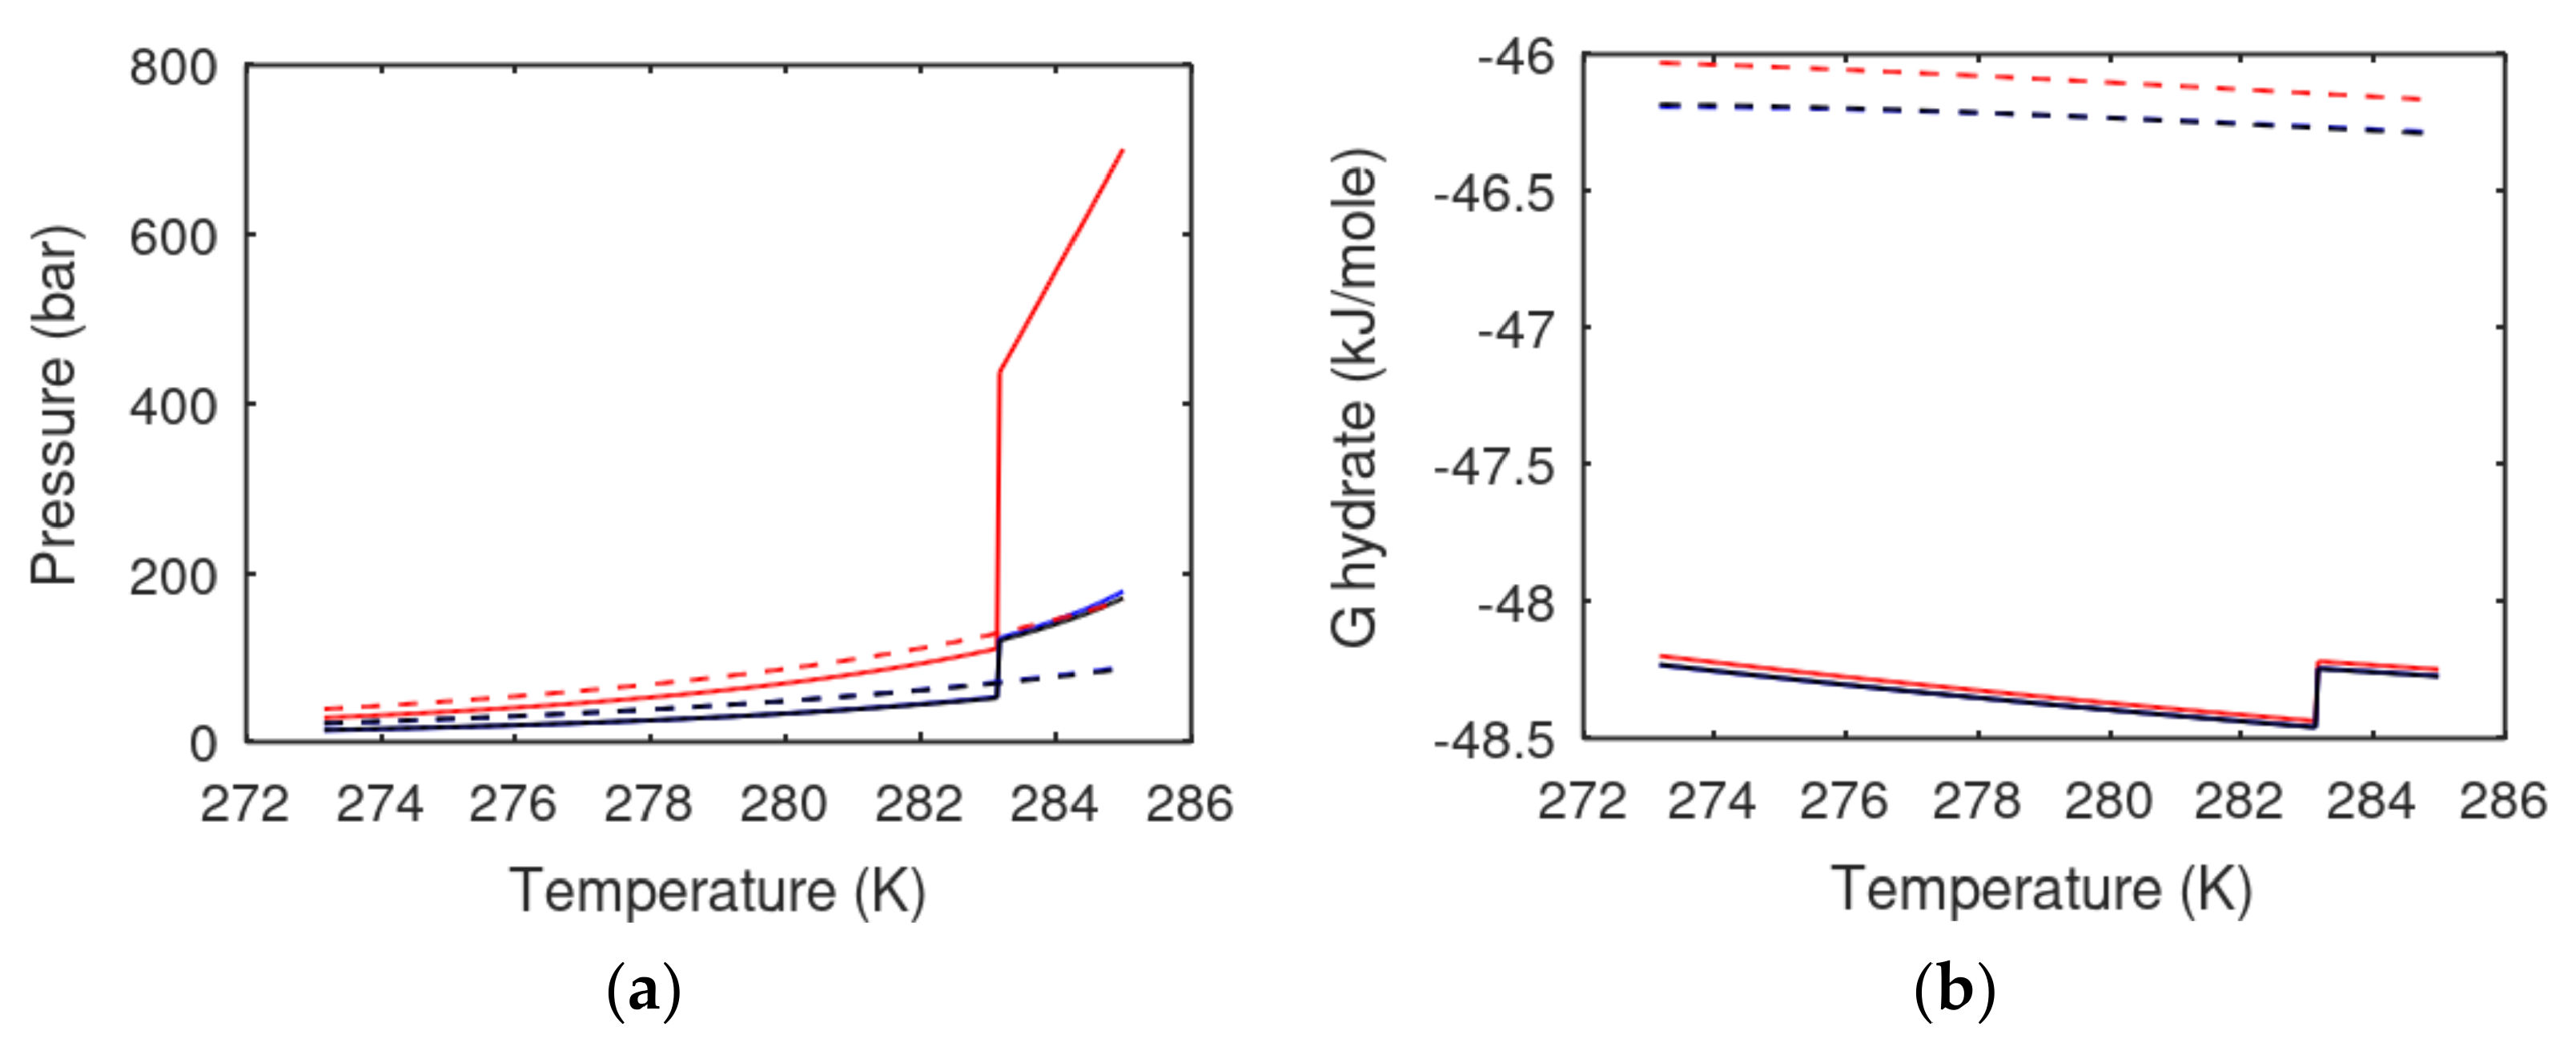
For evaluation of the CO2/CH4 swapping, it is very important to know more about the relative stability of CO2 hydrates versus CH4 hydrates. If there is a net increase in pore salinity during the dynamic of CO2 hydrate formation and CH4 dissociation, the hydrate of lowest stability (highest Gibbs free energy) will dissociate first.
There are even additional hydrates in the pores. Mineral surfaces act as hydrate promotors and can involve more than one route. This has been discussed elsewhere. It has already been discussed why water/gas-adsorbed phase has to be accounted for as an active phase with respect to hydrate formation. Adding also mineral surfaces and direct adsorption as well as indirect adsorption (trapping of guests in water structured by mineral surfaces) adds to the number of active phases with respect to the hydrate. Finally, as illustrated in Figure 4, there are several different hydrate phases in a real natural gas hydrate system. The question is then what replaces the equilibrium equations. Equilibrium conditions are derived from the combined first and second laws [9], and we basically have to step back and examine the system in terms of extensive Gibbs free energy, as follows:
where the line below G denotes the extensive property (unit: Joule), j is a phase index, and N is the number of moles in each phase. The total number of co-existing phases is p. The line under S and V denotes extensive properties, with the SI units being Joule/K and m3 respectively. The superscript j,s means the temperature acting on phase j from the surroundings.
where H is enthalpy, and the line below denotes extensive enthalpy in Joules. Qj is added heat to phase j from external sources and other phases. Now, as an example, I consider p equal to 3 with j = gas, liquid water, or hydrate. I consider minerals as external and initially skip the adsorbed phase. For heterogeneous hydrate formation on gas/liquid water interface, there is one temperature acting from the gas side, and there is potentially a different temperature acting from the liquid water side. Heat transport is very fast through the liquid water phase, slower through hydrate, and relatively slow through non-polar phases.
The usual assumption related to the pressure reduction method for producing natural gas hydrate is that the pressure reduction leads to a temperature difference between the hydrate-producing section and surrounding sediments. One problem is the low-temperature heat in the first term of Equation (8), which is also reflected in the combined first and second laws in Equation (7). Are the temperature gradients generated by the Joule–Thomson effect sufficient to break the hydrogen bonds in hydrate water and generate the entropy change over to liquid water and gas? At this stage, the question will be left without further discussion in the absence of data for specific hydrate-filled sediments.
The pressure reduction method is not an important focus in this work, but pumping out water from a hydrate-filled sediment with limited or almost no free gas might lead to a change in guest concentration in the surrounding water. This can lead to hydrate dissociation due to changes in the liquid water concentration of guest molecules. See the hydrate stability limits for CO2 hydrate as a function of CO2 concentration in liquid water plotted in Figure 1 as examples.
Based on the above, there are three possible effects that can dissociate in situ CH4 hydrate when CO2 or CO2/N2 mixtures are injected into CH4 hydrate-filled sediments:
- -
- Hydrate dissociation due to chemical work according to the last terms on the right-hand side of Equations (7) and (8) due to flow-induced changes of fluids surrounding the in situ CH4 hydrate.
- -
- CO2 hydrate is more stable than CH4 hydrate, as illustrated by Figure 4. Formation of a new hydrate from liquid pore water and injection gas will lead to increased salinity in the pore water. This can lead to dissociation of in situ CH4 hydrate.
- -
- Formation of a new hydrate from injection gas will release heat that can dissociate in situ CH4 hydrate.
As mentioned above, the first of these mechanisms can be relevant for pressure reduction method as well. Hydrate dissociation is controlled by the first law though Equation (8), the second law (level of temperature), and the combined law, Equation (7), which controls the directions of changes due to changes in the temperatures, pressures, and masses of all components in all co-existing phases. For these reasons, there is a need for a consistent thermodynamic concept. First of all, this implies that the thermodynamic model should be derived from the model for Gibbs free energy. Secondly, there is a need for the reference state of all components in all co-existing phases.
The first of these demands can be satisfied through application of the fundamental thermodynamic relationships, as follows:
where superscript H,Phasetransition denotes a hydrate phase transition (formation or dissociation along a variety of possible phase transition routes). The same relationship as in Equation (9) also applies to chemical potential differences and the following:
where the line above enthalpy denotes partial molar enthalpy, and subscript H2O denotes water. For guest molecules (subscript i):
A general formulation for Gibbs free energy change of hydrate formation for use in Equations (7), (9)–(11) can be expressed as follows:
where j is the phase that the hydrate former is coming from. In this paper, it is limited to j = separate guest phase for heterogeneous hydrate formation or j = guest molecules dissolved in water for homogeneous hydrate formation from dissolved guest molecules in water. In both of these cases, water (w) is coming from liquid. There are no limitations to other cases, such as adsorbed water on mineral surfaces creating hydrate with outside guest molecules or adsorbed guest molecules.
Residual thermodynamics for all phases, including hydrate phases, involves ideal gas being the reference state for all components in all phases. The thermodynamic models are briefly discussed in the next section, but finer details are given in published papers that are referred to. Keep in mind also that Equation (12) is zero at stability limits, such as those in Figure 3. Agreement between experimental data and calculated values in Figure 3a are examples of model validation. For CO2 hydrate, CH4 hydrate, and several relevant mixtures, model validations are published elsewhere. References are given in the next section.
To my knowledge, I am the only one that utilizes residual thermodynamics for all phases. For this reason, it is not relevant to refer to papers that discuss hydrate phase diagrams in independent thermodynamic variables such as temperature and pressure. That is far outside the scope of this work, which utilizes thermodynamic analysis based of fundamental thermodynamic laws.
3. Residual Thermodynamics
Residual thermodynamics has been utilized in the oil and gas industry for hydrocarbon systems for many decades. It actually started with van der Waals’ doctoral thesis [25], which received extra attention after his Nobel Prize lecture [26]. After that, there have been numerous modifications and extensions of his cubic equation of state. This has resulted in several hundred cubic equations of state. Some of these include simplified results from statistical mechanics for the repulsive term. The most industrially successful of these are the versions from Soave [27] and Peng and Robinson [28], which still retain the original term for the repulsive forces and empirical modifications of the terms that account for molecular attraction.
In molecular dynamics simulations, the residual chemical potential is obtained from thermodynamic integration of the sampled interaction energies. See, for instance, Kvamme et al. [29] and Kuznetsova and Kvamme [30,31,32] for some examples.
The chemical potential scheme does require molecular models. Development of molecular interaction models for relevant molecules, including water, has progressed rapidly over the last six decades. As a specific example, chemical potentials for water based on the TIP4P [33] water model were used for more than 25 years [34]. In Table 1, below, this is used to calculate the chemical potentials for pure water (row 3 in Table 1), as well as for water in empty hydrate (row 4 in Table 1).
The number of cavities is ν, with subscripts k for large and small cavities, respectively. For structure I, which is the main focus here, νøarge = 3/23 and νsmall = 1/23. Within the scope of this work, I will assume that only one guest molecule can enter a cavity.
The equation for water in hydrate in Table 1 is identical to the model from van der Waal and Platteeuw [35] for a rigid lattice. In the original formulation for a rigid lattice in the van der Waal and Platteeuw [35,36] model, the canonical partition function for guest molecules in rigid cavities were formulated based on fugacity instead of chemical potential for the guest molecules.
A rigid water lattice model based on MD can be formulated as follows:
where β is the inverse of Boltzmann constant time temperature in molecular units and the inverse of the universal gas constant times temperature in molar units. The rigid water lattice version of this derivation is as follows:
where mi is the molecular mass of guest molecule i, and is the Plank–Dirac constant.
In the calculation of the stability limits’ chemical potential in the cavities, Equations (13) and (14), the chemical potential for a component i in cavity k is set equal to chemical potential for component i in the phase j that the guest molecule comes from:
The difference between the hydrate model of Kvamme and Tanaka [34] and the older model from van der Waal and Platteeuw [35] is essentially in the treatment of the canonical partition functions for the cavities, and the utilization of MD simulations [34] for evaluation of these. The effects of non-rigid water lattice are evaluated [34] using a harmonic oscillator approach:
where is the chemical potential for molecule type i in cavity type k, and is the free energy of inclusion of the guest molecule i in cavity type k as sampled from MD. Large molecules relative to cavity size will lead to interference with water lattice movement frequencies and result in destabilization effects.
I will assume that small and large cavities are at equilibrium so that the following holds:
Table 1, below, summarizes the residual thermodynamic models used in this study.
The model for the enthalpy of hydrate formation (or dissociation) is trivially derived from Equation (9) using the appropriate chemical potentials from Table 1 in Equations (10) and (11). The consistent model for enthalpy according to Equation (9) was originally developed and published by Kvamme [37] and illustrated for heterogeneous hydrate formation on gas/liquid interface, as well as for homogeneous hydrate formation from dissolved guest molecules in water. Experimental measurements of enthalpies for hydrate formation and dissociation are complicated for many reasons, and a brief discussion of this, along with comparisons between calculated and experimental data, is given by Kvamme et al. [38]. Additional evaluation of the model is given by Aromada et al. [39,40] and Kvamme [10,15]. See also Kvamme [15] for a more detailed discussion on thermodynamic consistency and the importance of fulfilling Equation (9). Note also that there is nothing simple called fugacity for hydrate. Fugacity is uniquely defined on a component basis. Definition of hydrate fugacity is at best empirical, but also thermodynamically inconsistent. The use of Claussius or Claussius–Clapeyron for hydrates created from mixtures of hydrate formers is highly questionable. See Appendix B for a discussion of thermodynamic problems with defining a hydrate fugacity, and the empirical nature such a definition involves in terms of the formal definition of fugacity.
4. Hydrate Dissociation Due to Changes in Concentration of Guest Molecules in Water Surrounding Hydrate
Chemical work is the last term on the right-hand side of Equations (7) and (8). Chemical work dissociation of hydrate is a general mechanism for hydrate dissociation related to the inflow of seawater to hydrate-filled sediments through fracture systems connecting to the seafloor. Offshore hydrates are typically in a situation of hydrate dissociation due to the inflow of water from the top, and the formation of new hydrate due to fluxes of hydrate-forming molecules from below. This stationary balance is unique for each specific hydrate reservoir. If the supply of new hydrate-forming molecules is not able to supply enough new hydrate relative to the amount of hydrate that dissociates, then the hydrate reservoir will be naturally depleted over time.
Exchange of fluids surrounding in situ hydrate in a pressure reduction scenario or during injection of CO2 or CO2/N2 mixture is unique for each specific reservoir and production scenario. Within the focus of this work, I therefore limit myself to some illustrations of hydrate stability limits as a function of salinity. For comparison to the CO2 hydrate stability limits, I choose the same salinities as in the plots in Figure 1.
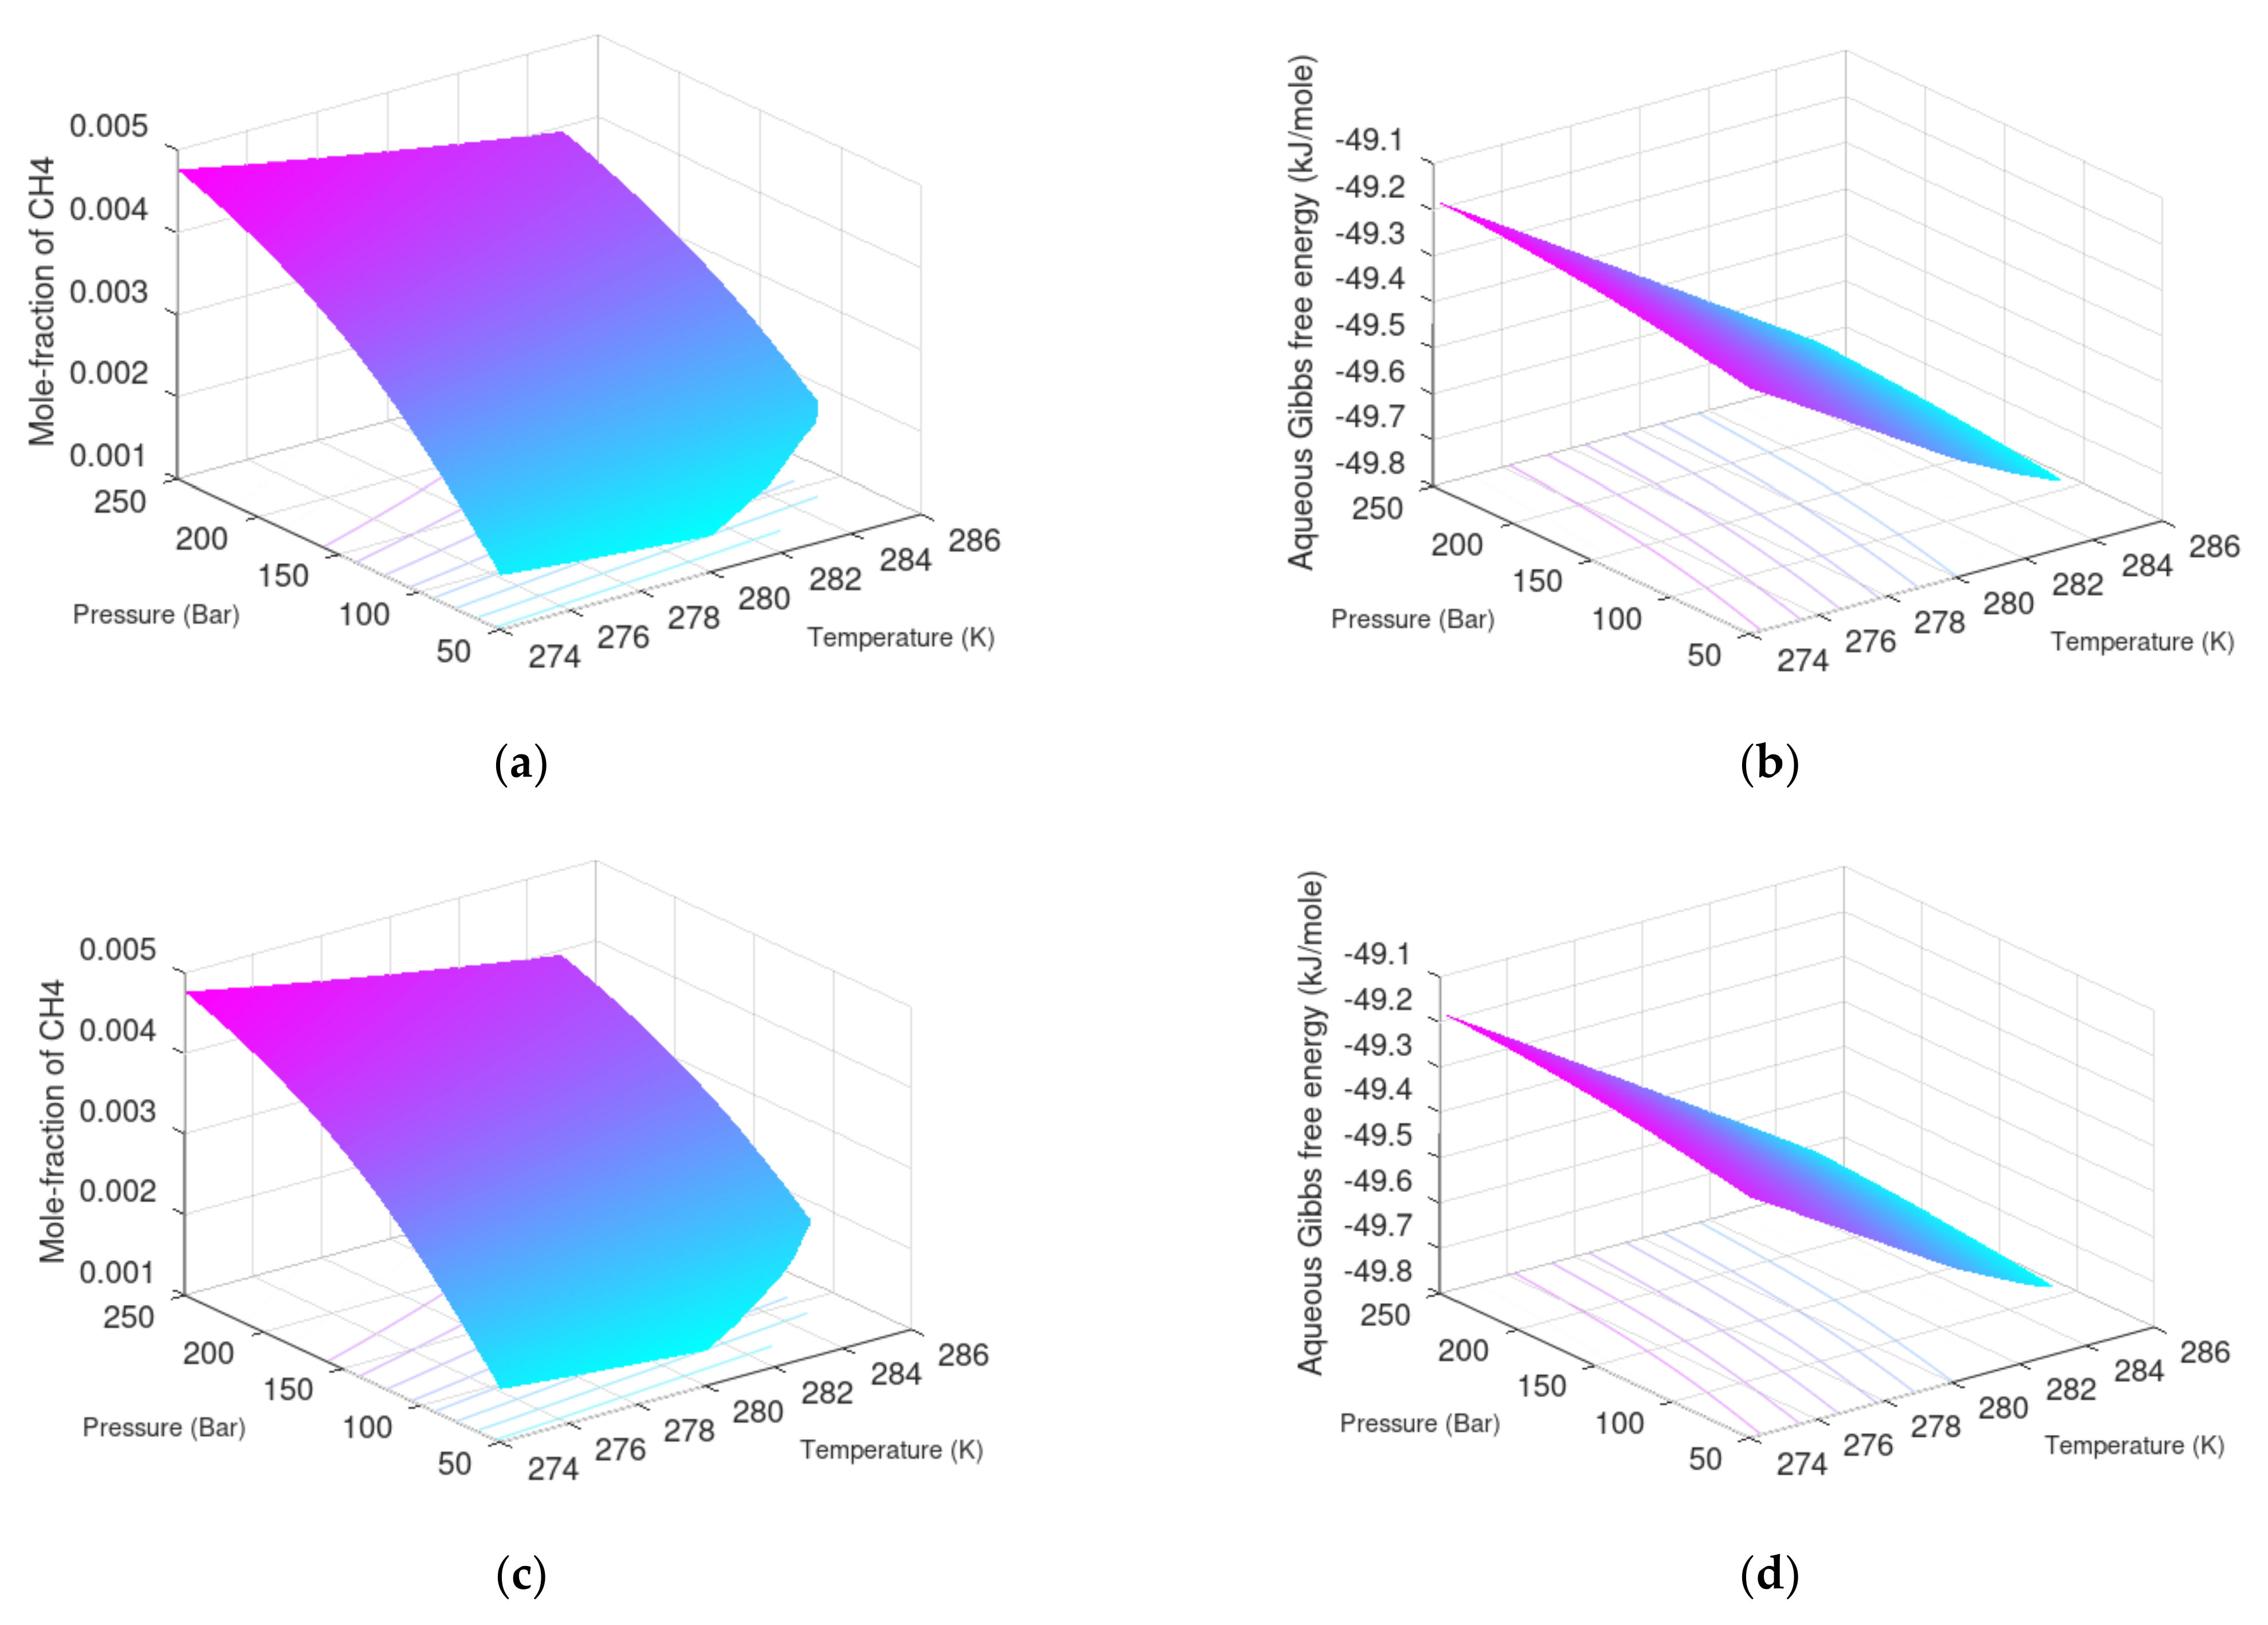
Minimum hydrate stability concentrations of CH4 surrounding water are plotted in Figure 5 together with Gibbs free energies for the formed hydrates. As expected, the hydrate stability decreases with increasing water salinity. Minimum CH4 concentration in the surrounding water increases with increasing salinity as expected. Differences between average seawater and pure water are limited.
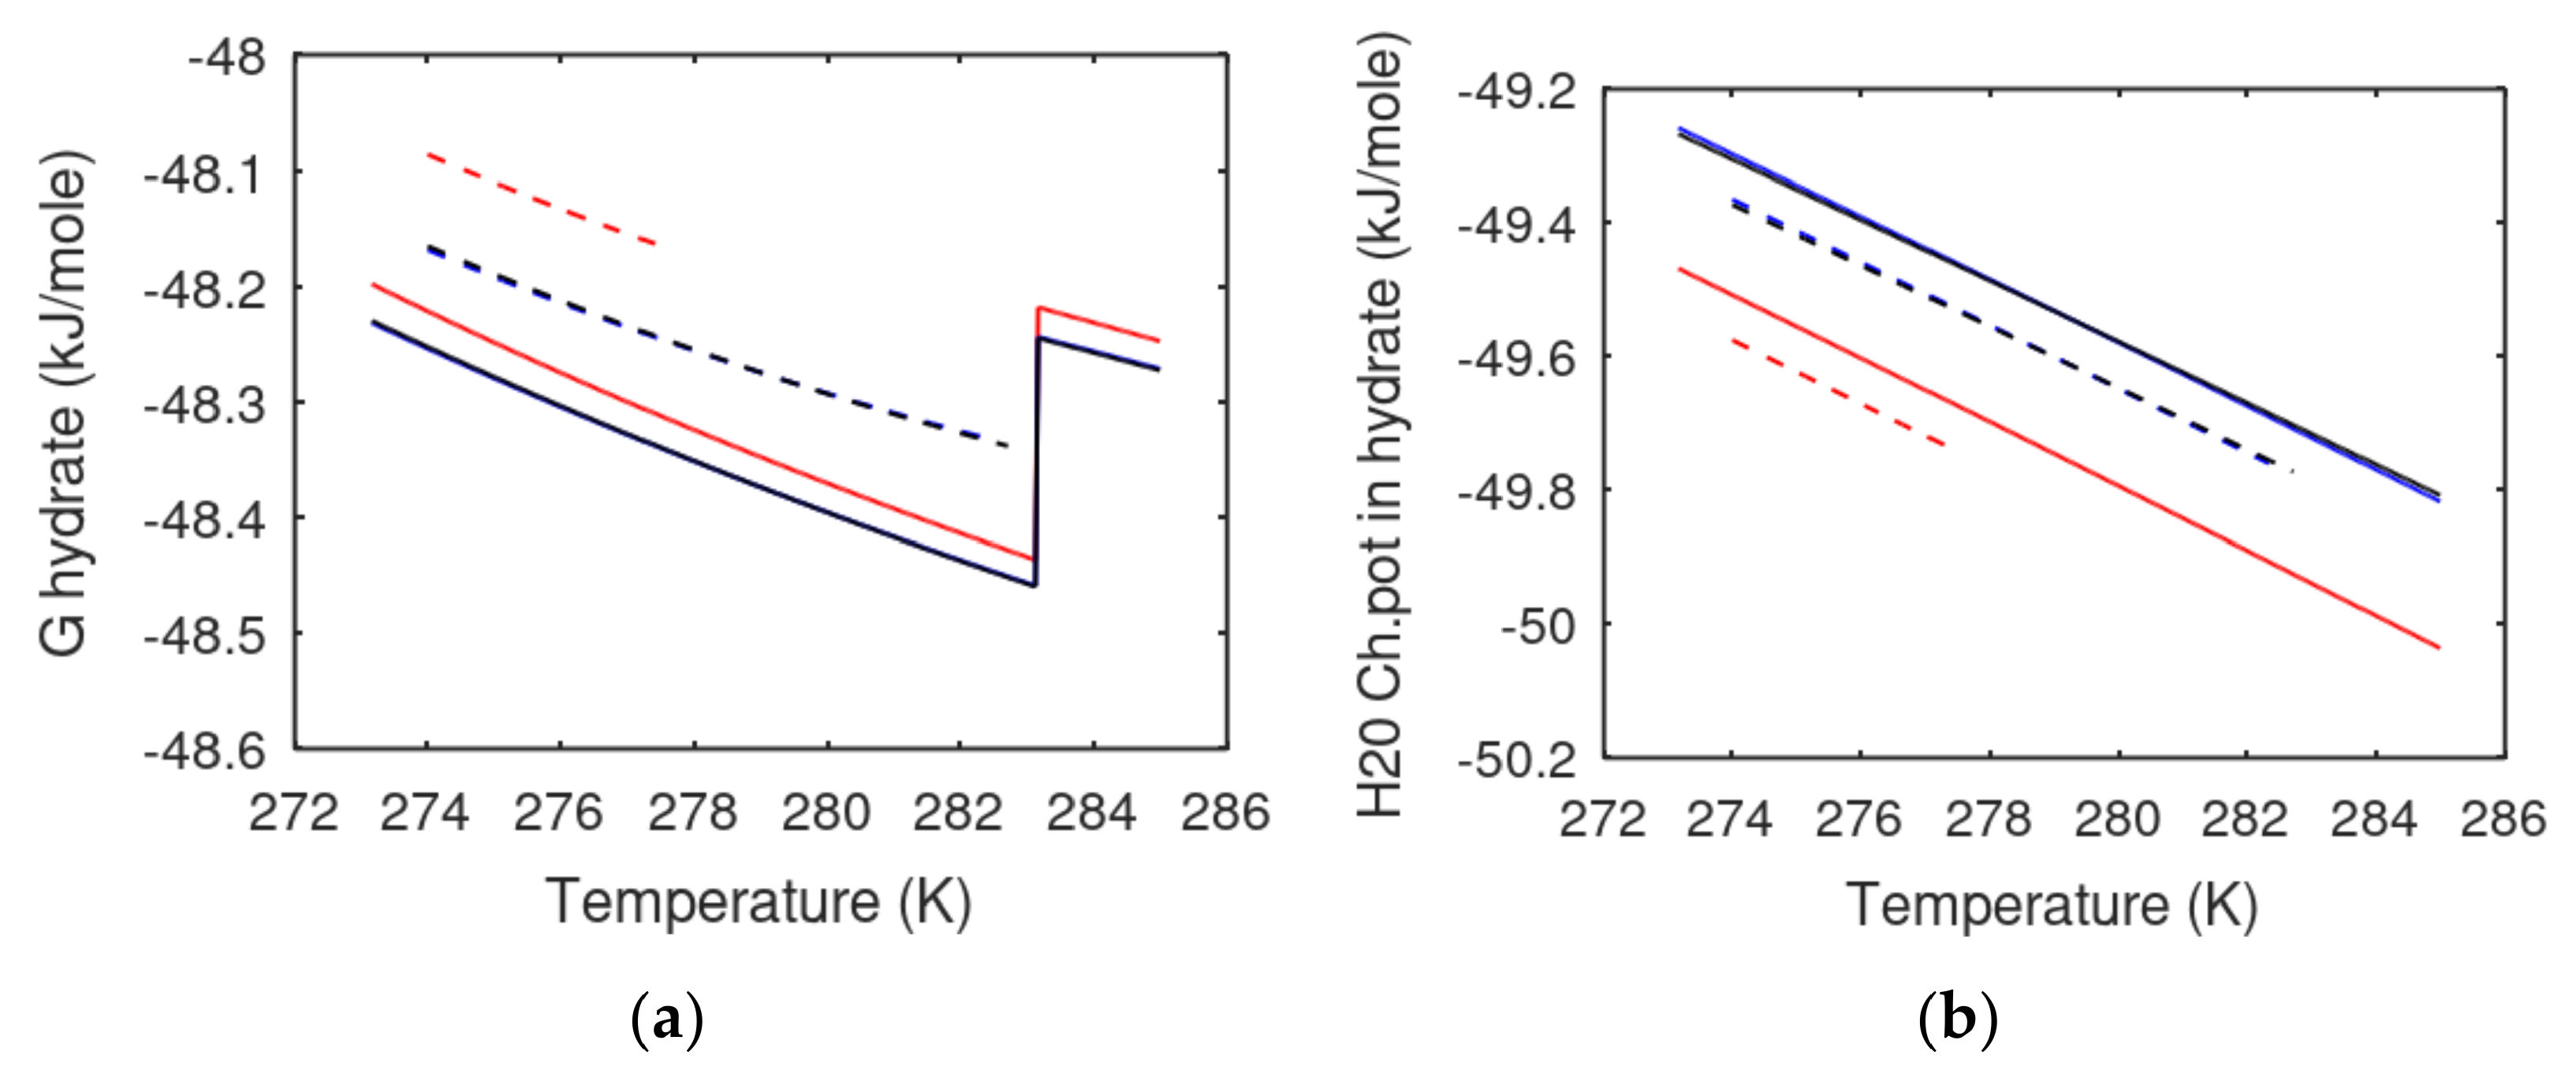
For situations of pressure reduction, the changes in liquid water surrounding the hydrate in the pores is water extracted from surrounding aquifers. As mentioned before, the existence of hydrate depends on a dynamic balance between hydrate dissociation due to incoming seawater and the formation of new hydrate from upcoming gas. The surrounding water concentration of CH4 can therefore range from liquid-water-saturated to zero. For this reason, I also plot liquid water solubility and Gibbs free energy for the water solutions. These Gibbs free energies are, of course, dominated by liquid water chemical potential, and variation between the three different salinities are small. Note also that the total Gibbs free energies for liquid water phase and total Gibbs free energy for the hydrate phase are not the measures for why hydrate will form and be stable at the stability limits. It is the partial molar values of these Gibbs free energies, that is, chemical potentials for water and guest, that matter for the phase transition. For a hydrate to form, there needs to be a chemical potential benefit for both water and guest to convert into hydrate. The chemical work involved is given by a difference in chemical work for the two phases, as given by the last term in Equations (7) and (8). For direct comparisons between liquid solubility and hydrate stability limit concentrations, Figure 5 is limited to the range of homogeneous hydrate formation conditions in Figure 6.
It is not easy to read and compare the differences between solubility concentrations in Figure 7 and minimum hydrate stability concentrations in Figure 5. I therefore also plot these differences along with the differences in water chemical potential between hydrate and liquid water in order to visualize the main thermodynamic driving force for hydrate formation from CH4-saturated water to hydrate.
In summary, pressure reduction can lead to an inflow of water from the surrounding sediments that can range from water saturated with CH4 to water with zero CH4. The highest limit will not lead to chemical-work-induced hydrate dissociation. The lowest limit, on the other hand, will lead to hydrate dissociation due to chemical work. Figure 8 below illustrates range of guest concentration for homogenous hydrate formation and associated guest chemical potentials that enters Equation (17).
Injection of CO2 or CO2/N2 mixtures will “push” pore-water. Since there is always a minimum of flow due to molecular diffusion in the pores, it is fair to assume that liquid water in the pore contains mole-fraction CH4 corresponding to minimum mole-fraction CH4 for hydrate stability. CH4 chemical-work-induced hydrate dissociation is not likely to be significant for CO2/CH4 swapping.
5. Effects of Changes in Salinity Due to Creation of New Hydrate from Injection Gas
It is already visualized in Figure 4b that CO2 hydrate is more stable than CH4 hydrate. Increase in pore salinity due to formation of CO2-dominated hydrate would therefore preferentially lead to dissociation of in situ CH4 hydrate.
Kinetically, hydrate formation and hydrate dissociation is limited by the slow transport of hydrate formers across a thin interface, unless the water hydrogen bonds are broken due to heating or chemicals. The formation of a new CO2-dominated hydrate releases heat that might be at sufficient temperatures to break hydrogen bonds. These aspects are discussed in Section 6.
So far, the impact of salinity on transport across the hydrate/liquid water interface have not been investigated. For pure water, readers are referred to Kvamme et al. [12] and references in that paper. Since heat transport in liquid water may be 2–3 orders of magnitudes faster than mass transport through liquid water [41], the differences in hydrate phase transition enthalpies is likely to dominate.
6. Differences in Enthalpies of Hydrate Formation as Driving Force for CO2/CH4 Swapping
Enthalpies of hydrate formation for CO2 hydrate and CH4 hydrate are plotted in Figure 9, below.
Based on the plotted hydrate formation enthalpies for CO2 hydrate and CH4 hydrate in Figure 9, it is clear that released heat from the formation of a new CO2 hydrate is sufficient to dissociate in situ CH4 hydrate. The models for enthalpy of hydrate formation have been extensively compared to the available experimental data for pure water, and I therefore consider the plots in Figure 8 as reliable.
7. Discussion
In this work, classical thermodynamic analysis has been utilized to examine how pore salinity affects hydrate stabilities according to the combined first and second laws of thermodynamics (Gibbs free energy), as well as energy balances according to the first law of thermodynamics and enthalpies of CH4 hydrate and hydrates from relevant injection fas mixtures of CO2 with N2. The importance of consistency between calculations of Gibbs free energies and enthalpies is stressed since the associated entropy changes (second law) during hydrate phase transition needs to be realistic for further thermodynamic analysis of further transport and processing. Unfortunately, there are no other hydrate research groups that utilize residual thermodynamics. This formalism has been available since I published the formalism [34] in a very easy format more than two decades ago. Attempts have been made to make entry to this concept easier, as documented through several papers and simple fits of reference properties and thermodynamic functions. See, for instance, Kvamme et al. [9] as one example. This does not even mean that other hydrate researchers would need to use my reference data based on the TIP4P model [34] for water. Molecular dynamics simulation using simple low-cost computers and graphical processors are extremely efficient and inexpensive. Any hydrate research group with some knowledge about molecular dynamics simulations can make their own residual thermodynamic models for hydrate systems. Unfortunately, hydrate modelling is still dominated by methods developed 50 years ago [36]. One fundamental problem of this is the empirical fitting of chemical potential for hydrate water. Even the idea of fitting such a fundamental property is thermodynamically unacceptable from a fundamental point of view. There are many papers that utilize this old method, but they basically only provide calculations of hydrate stability limits in temperature-pressure projection. What is even worse is that many of the papers contain a smoothed curve and physically wrong pressure-temperature curve for CO2 that does not account for the CO2 phase transition. Within the scope of this work (i.e., thermodynamic analysis in dependent real thermodynamic variables), it does not make any sense to refer to papers that report on projection of independent thermodynamic variables. There are very many such papers, and a substantial number of them are discussed by Sloan and Koh [42]. Hydrate is a very special phase and the range of salinities that are realistic here is far from any salt precipitation. This work is therefore totally irrelevant for shaling effects and other impacts of salinity.
There are some similarities between this paper and a recent one by Kvamme [43], for example, in Section 2. The content of that section is, however, also different in the sense that most of the non-equilibrium aspects are described in text, rather than by lists of variables and equations. The final results are very important and new for that paper [43], and for this paper, Equations (2)–(4) have never before been discussed. Some aspects of this were also discussed by Kvamme et al. [9], without these explicit consequences, in a coupled multiscale dynamic situation that ranges from nano-scale hydrate liquid water/hydrate interface dynamics, to liquid water/gas interface dynamics (including capillary wave effects), to couplings with hydrodynamics and the impact of several routes to hydrate formation and dissociation. Heterogeneous hydrate nucleation is favored on the liquid water [44,45,46,47,48,49] side of the gas/liquid water interface and will connect to homogeneous hydrate nucleation for liquid water and dissolved gas. In this respect, Figure 5 illustrates the changes in Gibbs free energy from what is characterized as heterogeneous hydrate formation, and homogeneous hydrate formation deeper down into the liquid water phase. The discussions in Section 4, Section 5 and Section 6 go far deeper into the reasons why CO2/N2 mixtures are efficient for producing CH4 hydrates compared to what can be found in [43], with particular emphasis on how varying salinity affects the thermodynamic needs.
8. Conclusions
Injection of CO2 into CH4 hydrate-filled sediments leads to the formation of a new hydrate. The released heat from this hydrate formation is sufficient to dissociate in situ CH4 hydrate. The extraction of pore water to the hydrate formation will potentially lead to increased pore salinity. CO2 hydrate is, however, thermodynamically more stable than CH4 hydrate. One possible effect of salinity increase on the stability of hydrates will therefore be that it leads to dissection of CH4 hydrate rather than dissociation of CO2 hydrate. Heat transport through liquid water is substantially faster than mass transport through liquid water. Transport of the released heat from the CO2 hydrate formation front to in situ hydrate in the pores will therefore lead to CH4 dissociation and release of liquid water. In view of the above, it is concluded that net increase in pore salinity due to formation of CO2 hydrate is unlikely. In summary, it can be concluded that released heat from CO2 hydrate formation is the totally dominating CO2/CH4 hydrate swapping mechanism.
Funding
The author is grateful for financial support through the 111 Project (No: D21025), National Key Research and Development Program (No: 2019YFC0312300), National Natural Science Foundation Item of China (No: U20B6005-05, 51874252 and 5177041544), and Open Fund Project of State Key Laboratory of Oil and Gas Reservoir Geology and Exploitation (No: PLN2021-02 and PLN2021-03). Financial support from Hyzenenergy is gratefully acknowledged.
Institutional Review Board Statement
Not relevant.
Informed Consent Statement
Not relevant.
Data Availability Statement
All calculated data are from the authors own Fortran program and experimental data are referred to in proper fashion.
Conflicts of Interest
The author declares no conflict of interest.
Appendix A. Activity Coefficients for Water Containing Some Polar Solutes or Sodium Chloride

Table A1.
Model and parameters for water activity coefficients (row 3, last column in Table 1).
Table A1.
Model and parameters for water activity coefficients (row 3, last column in Table 1).
| , , | ||||||
| ak | Methanol | Ethanol | ||||
| c0 | c1 | c2 | c0 | c1 | c2 | |
| a0 | 0.74821 | 0.52077 | −0.59936 | 0.73743 | 0.51369 | −0.58176 |
| a1 | 0.54174 | −0.47388 | 0.54721 | 0.53390 | −0.45996 | 0.53981 |
| a2 | −0.53859 | 0.56767 | −0.52552 | −0.52277 | 0.55995 | −0.51009 |
| a3 | 0.35068 | −0.53117 | 0.37324 | 0.34566 | −0.51558 | 0.36817 |
| ak | Ethylene Glycol (MEG) | Triethylene Glycol (TEG) | ||||
| c0 | c1 | c2 | c0 | c1 | c2 | |
| a0 | 0.59006 | 0.44750 | −0.49897 | 0.10473 | 0.19307 | −0.12389 |
| a1 | 0.47286 | −0.39499 | 0.47783 | 0.15496 | 0.17274 | −0.15457 |
| a2 | −0.44892 | 0.49855 | −0.43804 | 0.08770 | 0.08731 | 0.11456 |
| a3 | 0.37487 | −0.44859 | 0.36800 | 0.37947 | 0.80576 | −0.82038 |
| ak | Glycerol | NaCl | ||||
| c0 | c1 | c2 | c0 | c1 | c2 | |
| a0 | 0.10453 | 0.08003 | 0.35094 | 0.14486 | 0.15079 | 0.26256 |
| a1 | −0.00151 | 0.32200 | 0.21219 | 0.09071 | −0. 09709 | −0.63019 |
| a2 | 0.04988 | 0.04965 | 0.00515 | 0.13827 | −0.28171 | 0.57169 |
| a3 | 0.44152 | 0.56533 | −1.25419 | 0.13053 | 1.11504 | −0.55605 |
Appendix B. Relationship between Fugacity and Chemical Potential—Consequences for Hydrate Created from Mixed Guest Phase
Fugacity is defined on a component basis according to the following relationship:
For a fixed but freely chosen temperature the integration is as follows:
For components described by residual thermodynamics, the integration on the left-hand side from a pure component ideal gas to an ideal gas mixture is trivially given by the impact of entropy change for an ideal gas from pure component at T and P to a mixture in which the component is diluted in a mixture with other components. Pure component ideal gas chemical potential is uniquely defined from statistical mechanics and given as a function of translational and rotational momenta. For the right-hand side of Equation (A2), ideal gas fugacity is simply defined as pressure. If we assume that there is a simple integration constant that bridges the left- and right-hand sides, we can formulate the integrated form as follows:
Integration from ideal gas mixture to real fluid results in the following complete result:
Rearranging Equation (A4) and summing over all components in a gas mixture results in the following:
in which is a product over all components i, and exp denotes a natural number, while does not have any meaning in view of Equation (A1), but will serve as a definition along the empirical formulation of “hydrate fugacity”.
If we now move to hydrate, we have the following:
In which we have assumed that the chemical potential for each component in the gas is the same in hydrate as in gas. We also recognize a new integration constant bridging water fugacity in hydrate to the left-hand side chemical potential formulation. Rearranging the right-hand side of Equation (A9) could lead to something that might be called a hydrate fugacity. It is not even worthwhile doing the arrangement since there are several unclear factors of integration constants and relationships for mixtures. The message is that there is no “hydrate fugacity” simply because fugacity is defined on a component basis.
References
- Thomson, H.; Corbett, J.J.; Winebrake, J.J. Natural gas as a marine fuel. Energy Policy 2015, 87, 153–167. [Google Scholar] [CrossRef]
- Makogon, Y.; Holditch, S.; Makogon, T. Natural gas-hydrates—A potential energy source for the 21st Century. J. Pet. Sci. Eng. 2007, 56, 14–31. [Google Scholar] [CrossRef]
- Bybee, K. Natural Gas Technology/Monetization: Overview of the Mallik Gas-Hydrate Production Research Well. J. Pet. Technol. 2004, 56, 53–54. [Google Scholar] [CrossRef]
- Moridis, G.J.; Collett, T.S.; Dallimore, S.R.; Satoh, T.; Hancock, S.; Weatherill, B. Numerical studies of gas production from several CH4 hydrate zones at the Mallik site, Mackenzie Delta, Canada. J. Pet. Sci. Eng. 2004, 43, 219–238. [Google Scholar] [CrossRef]
- Konno, Y.; Fujii, T.; Sato, A.; Akamine, K.; Naiki, M.; Masuda, Y.; Yamamoto, K.; Nagao, J. Key Findings of the World’s First Offshore Methane Hydrate Production Test off the Coast of Japan: Toward Future Commercial Production. Energy Fuels 2017, 31, 2607–2616. [Google Scholar] [CrossRef]
- Boswell, R.; Collett, T.S. Current perspectives on gas hydrate resources. Energy Environ. Sci. 2011, 4, 1206–1215. [Google Scholar] [CrossRef]
- Yamamoto, K.; Wang, X.-X.; Tamaki, M.; Suzuki, K. The second offshore production of methane hydrate in the Nankai trough and gas production behavior from a heterogeneous methane hydrate reservoir. RSC Adv. 2019, 9, 25987–26013. [Google Scholar] [CrossRef]
- Kvamme, B.; Zhao, J.; Wei, N.; Sun, W.; Zarifi, M.; Saeidi, N.; Zhou, S.; Kuznetsova, T.; Li, Q. Why Should We Use Residual Thermodynamics for Calculation of Hydrate Phase Transitions? Energies 2020, 13, 4135. [Google Scholar] [CrossRef]
- Kvamme, B.; Zhao, J.Z.; Wei, N.; Sun, W.T.; Saeidi, N.; Pei, J.; Kuznetsova, T. Hydrate production philosophy and thermodynamic calculations. Energies 2020, 13, 672. [Google Scholar] [CrossRef]
- Kvamme, B. Consistent Thermodynamic Calculations for Hydrate Properties and Hydrate Phase Transitions. J. Chem. Eng. Data 2020, 65, 2872–2893. [Google Scholar] [CrossRef]
- Kvamme, B. Thermodynamic limitations of the CO2/N2 mixture injected into CH4 hydrate in the Ignik Sikumi field trial. J. Chem. Eng. Data 2016, 61, 1280–1295. [Google Scholar] [CrossRef]
- Kvamme, B.; Coffin, R.; Wei, N.; Zhou, S.; Zhao, J.; Li, Q.; Saeidi, N.; Chien, Y.-C.; Dunn-Rankin, D.; Sun, W.; et al. Stages in dynamics of hydrate formation and consequences for design of experiments for hydrate formation in sediments. Energies 2019, 12, 3399. [Google Scholar] [CrossRef]
- Kvamme, B.; Zhao, J.; Wei, N.; Saeidi, N. Hydrate—A Mysterious Phase or Just Misunderstood? Energies 2020, 13, 880. [Google Scholar] [CrossRef]
- Kvamme, B.; Wei, N.; Zhao, J.; Zhou, S.; Zhang, K.; Sun, W.; Saeidi, N. Routes to hydrate formation from water dissolved in gas and impact of mineral surfaces. Petroleum 2021, 7, 385–401. [Google Scholar] [CrossRef]
- Kvamme, B. Kinetics of hydrate formation, dissociation and reformation. Chem. Thermodyn. Therm. Anal. 2021, 1, 100004. [Google Scholar] [CrossRef]
- Kvamme, B.; Clarke, M. Hydrate Phase Transition Kinetic Modeling for Nature and Industry–Where Are We and Where Do We Go? Energies 2021, 14, 4149. [Google Scholar] [CrossRef]
- Kvamme, B. environmentally friendly production of methane from natural gas hydrate using carbon dioxide. Sustainability 2019, 11, 1964. [Google Scholar] [CrossRef]
- Kvamme, B. Small alcohols as hydrate promotors. Energy Fuels 2021, 35, 17663–17684. [Google Scholar] [CrossRef]
- Kvamme, B. Small Alcohols as surfactants and hydrate promotors. Fluids 2021, 6, 345. [Google Scholar] [CrossRef]
- Kvamme, B. Feasibility of simultaneous CO2 storage and CH4 production from natural gas hydrate using mixtures of CO2 and N2. Can. J. Chem. 2015, 93, 897–905. [Google Scholar] [CrossRef]
- Saeidi, N.; Dunn-Rankin, D.; Kvamme, B.; Chien, Y.-C. Experimental studies on combined production of CH4 and safe long-term storage of CO2 in the form of solid hydrate in sediment. Phys. Chem. Chem. Phys. 2021, 23, 23313–23324. [Google Scholar] [CrossRef]
- De Roo, J.L.; Peters, C.J.; Lichtenthaler, R.N.; Diepen, G.A.M. Occurrence of methane hydrate in saturated and unsaturated solutions of sodium chloride and water in dependence of temperature and pressure. AIChE J. 1983, 29, 651–657. [Google Scholar] [CrossRef]
- Sabil, K.M.; Nashed, O.; Lal, B.; Ismail, L.; Japper-Jaafar, A. Experimental investigation on the dissociation conditions of methane hydrate in the presence of imidazolium-based ionic liquids Thermodyn. J. Chem. 2015, 84, 7–13. [Google Scholar]
- Tumba, K.; Tumba, P.; Reddy, P.; Naidoo, D.; Ramjugernath, A.; Eslamimanesh, A.; Mohammadi, H.; Richon, D. Phase equilibria of methane and carbon dioxide clathrate hydrates in the presence of aqueous solutions of tributylmethyl- phosphonium methylsulfate ionic liquid. J. Chem. Eng. Data 2011, 56, 3620–3629. [Google Scholar] [CrossRef]
- Van der Waals, J.D. Over de Continuiteit Van Den Gas- En Vloeistoftoestand; Translated: About the Continuity of the Gas and Fluid States; University of Leiden: Leiden, The Netherlands, 1873. (In Dutch) [Google Scholar]
- Van der Waals, J.D. The equation of state for gases and liquids. Nobel Lect. Phys. 1910, 1, 254–265. [Google Scholar]
- Soave, G. Equilibrium constants from a modified Redlich-Kwong equation of state. Chem. Eng. Sci. 1972, 27, 1197–1203. [Google Scholar] [CrossRef]
- Peng, D.Y.; Robinson, D.B. A New two-constant equation of state. Ind. Eng. Chem. Fundam. 1976, 15, 59–64. [Google Scholar] [CrossRef]
- Kvamme, B.; Kuznetsova, T.; Kivelæ, P.-H. Adsorption of water and carbon dioxide on hematite and consequences for possible hydrate formation. Phys. Chem. Chem. Phys. 2012, 14, 4410–4424. [Google Scholar] [CrossRef]
- Kuznetsova, T.; Kvamme, B. Ergodicity range of nosé-hoover thermostat parameters and entropy-related properties of model water systems. Mol. Simul. 1999, 21, 205–225. [Google Scholar] [CrossRef]
- Kuznetsova, T.; Kvamme, B. Grand canonical molecular dynamics for TIP4P water systems. Mol. Phys. 1999, 97, 423–431. [Google Scholar] [CrossRef]
- Kuznetsova, T.; Kvamme, B. Thermodynamic properties and surface tension of model water-carbon dioxide systems. Phys. Chem. Chem. Phys. 2002, 4, 937–941. [Google Scholar] [CrossRef]
- Jorgensen, W.L.; Madura, J. Temperature and size dependence for Monte Carlo simulations of TIP4P water. Mol. Phys. 1985, 56, 1381–1392. [Google Scholar] [CrossRef]
- Kvamme, B.; Tanaka, H. Thermodynamic Stability of Hydrates for Ethane, Ethylene, and Carbon Dioxide. J. Phys. Chem. 1995, 99, 7114–7119. [Google Scholar] [CrossRef]
- Van der Waals, J.H.; Platteeuw, J.C. Clathrate Solutions. In Advances in Chemical Physics; Wiley: Hoboken, NJ, USA, 2007; pp. 1–57. [Google Scholar]
- Parrish, W.R.; Prausnitz, J.M. Dissociation Pressures of Gas Hydrates Formed by Gas Mixtures. Ind. Eng. Chem. Process Des. Dev. 1972, 11, 26–35. [Google Scholar] [CrossRef]
- Kvamme, B. Enthalpies of Hydrate Formation from Hydrate Formers Dissolved in Water. Energies 2019, 12, 1039. [Google Scholar] [CrossRef]
- Kvamme, B.; Aromada, S.A.; Gjerstad, P.B. Consistent Enthalpies of the Hydrate Formation and Dissociation Using Residual Thermodynamics. J. Chem. Eng. Data 2019, 64, 3493–3504. [Google Scholar] [CrossRef]
- Aromada, S.A.; Kvamme, B.; Wei, N.; Saeidi, N. Enthalpies of hydrate formation and dissociation from residual thermodynamics. Energies 2019, 12, 4726. [Google Scholar] [CrossRef]
- Aromada, S.A.; Kvamme, B. Modelling of Methane Hydrate Formation and Dissociation using Residual Thermodynamics. SNE Simul. Notes Eur. 2021, 31, 143–150. [Google Scholar] [CrossRef]
- Svandal, A.; Kvamme, B.; Granasy, L.; Pusztai, T. The influence of diffusion on hydrate growth. In Proceedings of the 1st International Conference on Diffusion in Solids and Liquids DSL-2005, Aveiro, Portugal, 6–8 July 2005. [Google Scholar]
- Sloan, E.D.; Koh, C.A. Clathrate Hydrates of Natural Gases, 3rd ed.; CRC Press: Boca Raton, FL, USA, 2007. [Google Scholar]
- Kvamme, B. Thermodynamics and kinetic mechanisms for CH4/CO2 swapping in natural sediments. Energy Fuels 2022, 36, 6374–6396. [Google Scholar] [CrossRef]
- Tegze, G.; Pusztai, T.; Tóth, G.; Gránásy, L.; Svandal, A.; Buanes, T.; Kuznetsova, T.; Kvamme, B. Multiscale approach to CO2 hydrate formation in aqueous solution: Phase field theory and molecular dynamics. Nucleation Growth J. Chem. Phys. 2006, 124, 234710. [Google Scholar] [CrossRef]
- Svandal, A. Modeling Hydrate Phase Transitions Using Mean–Field Approaches. Ph.D. Thesis, University of Bergen, Bergen, Norway, 2006. [Google Scholar]
- Buanes, T. Mean–Field Approaches Applied to Hydrate Phase Transition. Ph.D. Thesis, University of Bergen, Bergen, Norway, 2006. [Google Scholar]
- Qasim, M. Microscale Modeling of Natural Gas Hydrates in Reservoirs. Ph.D. Thesis, University of Bergen, Bergen, Norway, 2012. [Google Scholar]
- Baig, K. Nano to Micro Scale Modeling of Hydrate Phase Transition Kinetics. Ph.D. Thesis, University of Bergen, Bergen, Norway, 2017. [Google Scholar]
- Svandal, A.; Kuznetsova, T.; Kvamme, B. Thermodynamic properties and phase transtions in the H2O/CO2/CH4 system. Fluid Phase Equilibria 2006, 246, 177–184. [Google Scholar] [CrossRef]
Figure 1.
Hydrate stability limit mole-fractions of CO2 in liquid water for different mole-fractions of NaCl in water (a,c,e) and CO2 solubility as function of temperature and pressure for different mole-fractions of NaCl in water (b,d,f). (a,b) Mole-fraction NaCl in water 0; (c,d) mole-fraction NaCl in water 0.0108; and (e,f) mole-fraction NaCl in water 0.0384.

Figure 2.
Gibbs free energy for hydrates formed homogeneously from water and dissolved CO2 in water: (a) pure water and (b) NaCl mole-fraction in water 0.0384.
Figure 2.
Gibbs free energy for hydrates formed homogeneously from water and dissolved CO2 in water: (a) pure water and (b) NaCl mole-fraction in water 0.0384.

Figure 3.
(a) CH4 hydrate stability limits in temperature-pressure projection. Lower solid curve is calculated from pure water. Circles are experimental data from Sabil et al. [22] for hydrate from pure water. Diamonds are experimental data from Tumba et al. [23]. Upper solid curve is calculated for hydrate formed from CH4 and water containing 0.0394 mole-fraction NaCl. Squares are experimental data from deRoo et al. [24] for hydrate formed from CH4 and water containing 0.0394 mole-fraction. (b) Gibbs free energy for hydrate formed from CH4 and pure water (lower solid curve) and Gibbs free energy for hydrate formed from CH4 and water containing 0.0394 mole-fraction NaCl (upper solid curve).

Figure 4.
(a) CO2 (solid curves) and CH4 (dashed curves) hydrate stability limits in temperature pressure projection. Hydrates formed from pure water are in black, hydrates formed from average seawater (mole-fraction NaCl equal to 0.0108) are in blue, and hydrates formed from water containing 0.0394 mole-fraction NaCl are in red. (b) Calculated Gibbs free energies for the formed hydrates in (a).

Figure 5.
CH4 hydrate stability limits (a,c,e) as function of concentration of CH4 in surrounding liquid water and Gibbs free energy for the hydrate at stability limit (b,d,f). (a,b) are for pure water, (c,d) are for water with mole-fraction NaCl 0.0108, and (e,f) are for water with mole-fraction NaCl 0.0384.

Figure 6.
(a) Gibbs free energies for CO2 hydrates formed heterogeneously on gas/liquid interface (solid curves) and Gibbs free energies for CO2 hydrates formed homogeneously (dashed curves) at 50 bar and up to stability limit in concentration. Hydrates formed from pure water are in black, hydrates formed from average seawater (mole-fraction NaCl equal to 0.0108) are in blue, and hydrates formed from water containing 0.0394 mole-fraction NaCl are in red. (b) Calculated water chemical potentials for the same conditions and content of NaCl as in (a).

Figure 7.
CH4 solubility in water (a,c,e) as function of temperature and pressure and Gibbs free energy for the aqueous solution (b,d,f). (a,b) are for pure water, (c,d) are for water with mole-fraction NaCl 0.0108, and (e,f) are for water with mole-fraction NaCl 0.0384.
Figure 7.
CH4 solubility in water (a,c,e) as function of temperature and pressure and Gibbs free energy for the aqueous solution (b,d,f). (a,b) are for pure water, (c,d) are for water with mole-fraction NaCl 0.0108, and (e,f) are for water with mole-fraction NaCl 0.0384.


Figure 8.
Difference between mole-fraction for CH4 solubility and mole-fraction for minimum hydrate stability (a,c,e) as function of temperature and pressure and difference in water chemical potential between hydrate and liquid (b,d,f). (a,b) are for pure water, (c,d) are for water with mole-fraction NaCl 0.0108, and (e,f) are for water with mole-fraction NaCl 0.0384.


Figure 9.
(a) Enthalpy of hydrate formation along pressure temperature stability limits for CO2 hydrate. (b) Enthalpy of hydrate formation along pressure temperature stability limits for CH4 hydrate.
Figure 9.
(a) Enthalpy of hydrate formation along pressure temperature stability limits for CO2 hydrate. (b) Enthalpy of hydrate formation along pressure temperature stability limits for CH4 hydrate.

Table 1.
Residual thermodynamic integration scheme for chemical potentials. Superscript gas denotes a separate guest phase (gas, liquid, super-critical). Superscript aq for guest molecule type i denotes guest molecules dissolved in water. The reference state here is infinite dilution of the component in water as indicated on chemical potential as well as on activity coefficient (asymmetric convention). Superscript w denotes water phase (liquid water in this case). is symmetric convention, and a simple model for water activity coefficient as function of NaCl concentration in water is given in Appendix A. Superscript H denotes hydrate. The chemical potential for pure component ideal gas is trivially derived from the ideal gas canonical partition function. The CH4 model utilized in our study is a spherical mono-atomic model, and the integration of the translational Boltzmann factor is trivial and can be found in any textbook on physical chemistry. The same is true for the additional rotational contribution for the linear models of CO2 utilized. For ideal gas water, the moments of inertia needed for the rotational part are from the TIP4P [33] model, as used by Kvamme and Tanaka [34]. The fugacity coefficients are calculated from the SRK [27] equation of state.
| Property | Reference State | Ideal Mix T, P, | Real Fluid T, P, |
|---|---|---|---|
| Pure Component Ideal Gas at T, P | Ideal Gas Mix T, P, | ||
| Infinite dilution in water at T, P | Ideal Solution Mix T, P, | ||
| Pure liquid water at T, P | Ideal Solution Mix T, P, | ||
| Water in empty hydrate at T, P |
Publisher’s Note: MDPI stays neutral with regard to jurisdictional claims in published maps and institutional affiliations. |
© 2022 by the author. Licensee MDPI, Basel, Switzerland. This article is an open access article distributed under the terms and conditions of the Creative Commons Attribution (CC BY) license (https://creativecommons.org/licenses/by/4.0/).
Share and Cite
MDPI and ACS Style
Kvamme, B. Mechanisms for CH4/CO2 Swapping in Natural Sediments. Fluids 2022, 7, 260. https://doi.org/10.3390/fluids7080260
AMA Style
Kvamme B. Mechanisms for CH4/CO2 Swapping in Natural Sediments. Fluids. 2022; 7(8):260. https://doi.org/10.3390/fluids7080260
Chicago/Turabian StyleKvamme, Bjørn. 2022. "Mechanisms for CH4/CO2 Swapping in Natural Sediments" Fluids 7, no. 8: 260. https://doi.org/10.3390/fluids7080260