1. Introduction
Combined protective canister filters are widely used in the army and for the police, special antiterrorist search and rescue troops, fire-fighting services, employees in chemical food-processing and pharmaceutical manufacturing plants, foundries, paint shops and endangered populations in adjacent regions, hospitals, laboratories, as well as for electronic and foil’s industries. They combine the fibrous pleats to protect the respiratory organs of an individual from dust and fluid particles, aerosols, toxic fumes, biological solid and liquid aerosols, radioactive aerosols, bacteria and viruses and the absorbent cartridge to protect from solvents and organic, inorganic gases and vapors. They have a complex geometry of the canister (including its perforated screens) and a system of filtration pleats, which highly influences the flow of air inside the filter and the effectiveness of the filtration process, lifetime, or pressure losses for different flow rates. There are many reasons, why to optimize all parts of the filter together in one model; the complete combined filter must be compact, light and resistant against the damage, with the pressure drop low enough to allow using the filter for a long time of increased activity.
One of the most important parts of the design process is the selection of the optimal configuration of the pleated filter. Compared to the flat filter, it has a much higher surface resulting in (at the same flow rate) a much lower filter face velocity and inhalation resistance. To increase the surface of the pleated filter, the pleat height can be increased and the pitch/spacing can be decreased. However with a decreasing angle at the pleat sides, the boundary layer starts to block the flow through the pleat active surface and the inhalation resistance can increase again. There is also an influence of canister walls and the velocity evenness on the local pleated filter face velocity as well as velocity in the absorbent layer. So, it is very important to take into account the real 3D geometry of the zig-zag-shaped pleated filter, as well as the real topology of perforated screens and the inlet grille/lid.
To improve the performance of the gas mask canister with a complex inner structure and to reduce the inhalation resistance, the computational fluid dynamics (CFD) had been used by Li and Su [
1,
2]. In [
2], six different canister designs with rib-strip or honeycomb passages and six mass flow rates were considered. To simplify the computational domain, the pleated filter paper was replaced with a single homogenous filtration layer. For computational efficiency, one-quarter of the full 3D model was constructed. A similar approach for a pleated filter was used by Wood et al. [
3,
4] who studied numerically the flow through the respirator canisters with the activated carbon filter including the influence of canister walls on the porosity, as well as the influence of turbulence model on CFD results. In the 3D calculations, one-eighth of the canister geometry was used because of the application of the symmetry boundary conditions. Some of the calculations were performed as 2D axisymmetric simulations. Si et al. [
5] studied the flow in the gas filter with activated carbon plates and with or without explosion-proof plates by means of CFD. They used one-half of the full 3D model and also omitted the real shape of the pleated filter.
Full geometry of the pleats has been considered in references [
6,
7,
8] with different levels of computational complexity. Chen et al. [
6] studied one 2D half-pleat with simplified rectangular geometry. They have shown that the flow direction in the pleat is almost normal to the pleat surface and that for different pleat heights, there is a different optimal pleat count per inch. Theron et al. [
7] studied numerically three real geometries of 2D half-pleat and obtained a good agreement with experimental data. Two simple pleats have been modeled by Liu et al. [
8] who used CFD tools to verify an empirical model for pressure drop in a cabin filter or by Feng et al. [
9] who tried to assess various advanced turbulence models for predicting pressure drop through the pleated filter. To simulate the particle concentration field in the air zone and a pleated filter, Feng et al. [
10] used the Eulerian-Markov method utilized with a simple geometry of one pleat. 3D model of one half-pleat of a special cylindrical pleated filter was modeled numerically and experimentally validated by Subrenant et al. [
11]. More pleats (8 ones or full 3D geometry of the cylindrical pleated filter) have been required in the study by Velali et al. [
12], who tried to assess the influence of the pleat deterministic irregular design.
There are some experimental studies of pleat efficiency. Chen et al. [
13] studied triangular-shaped pleats with the same height and different numbers of pleats per one centimeter and have shown that there is a local minimum of the pressure drop curve, based on the angle of the pleat sides. Patil et al. [
14] experimentally studied nine triangular-shaped pleats and found similar pressure drop dependency. Resembling results can be found also in the experimental and numerical study by Tronville and Sata [
15]. The evolution of pleated filter overall pressure drop with the pleat density was also analyzed by Rebai et al. [
16] by means of a semi-analytical model of gas flow in pleated fibrous filters.
All previously mentioned references are based on a constant flow with an averaged mass-flow rate. Of course, in many applications, filters are loaded with a transient mass-flow profile. It can have the character of single or several pulses or could be regularly periodical in time. Typical pulse flow can be found during the pulse-jet cleaning of filter cartridges modeled by Lo et al. [
17], Chen et al. [
18] or Li et al. [
19] with a one-pleat geometry. A typical (nearly) periodical transient mass-flow profile can be associated with human breathing. In [
4] the transient periodic flow through the filter was considered to model representative breathing profiles inside the canister.
3. Calculation Methods and Setting Model Parameters
As a numerical tool, the ANSYS CFX package was used. The calculation is based on the Reynolds-Averaged Navier-Stokes equations (RANS). Because of the small velocities inside the combined filter, the effects of compressibility, as well as the thermal effects, could be omitted. Generally, for unsteady flows, the governing equations (URANS) can be expressed as
where
Ui are the Reynolds-averaged velocity components in the 3D Cartesian coordinate system,
P is the Reynolds-averaged static pressure,
ρ is the fluid density,
μ is the dynamic viscosity,
μt is the turbulent viscosity derived from the turbulence model and
SM is the general momentum source term.
The SST turbulence model, which combines advantages of both the high- and the low-Reynolds number turbulence models, has been applied. It combines the advantages of the standard k-ε and k-ω models using two blending functions (F1 and F2) dependent on the wall distance. The following governing equations can be applied:
where
is the turbulence production term,
k is the turbulent kinetic energy and
ω is the turbulent frequency. In this formulation, the turbulent viscosity is defined in the following way:
where
S is the strain rate. More details of the Menter’s SST model, including definition and discussion of the blending functions and all used constants (a, β, σ, γ), can be found in [
20,
21,
22]. When modeling the steady continuous flow, the time terms in Equations (1) and (2) can be omitted.
The calculations were performed with a full 3D geometry of all components of the filter, including a complex geometry of the pleats. The geometry and mesh creation of the pleats is fully parametric and completely automated. This allows easy generation of high-quality structured computational grids for a wide range of pleat heights and widths and employs the numerical shape optimization process. For the complex geometry of the mask canister, the unstructured grids with prism layers are used. The overall sizes of the grids are over 10 mil. nodes, which enables to preserve sufficiently low values of y+ calculated at the first grid point away from the solid walls.
Figure 3 shows a typical distribution of y+ values calculated on the canister lid and two perforated screens. These values are relevant only in the case of steady-state calculations.
The boundary conditions at the inlet are based on the prescribed uniform velocity (which corresponds to the prescribed mass flow rate), as well as the turbulent kinetic energy and its dissipation rate (estimated according to the turbulence intensity of 4% and the eddy length scale equal to 6% of the inlet diameter). The turbulence intensity and turbulence frequency are then derived as follows:
where
I is the turbulence intensity,
U is the velocity module and
L is the eddy length scale.
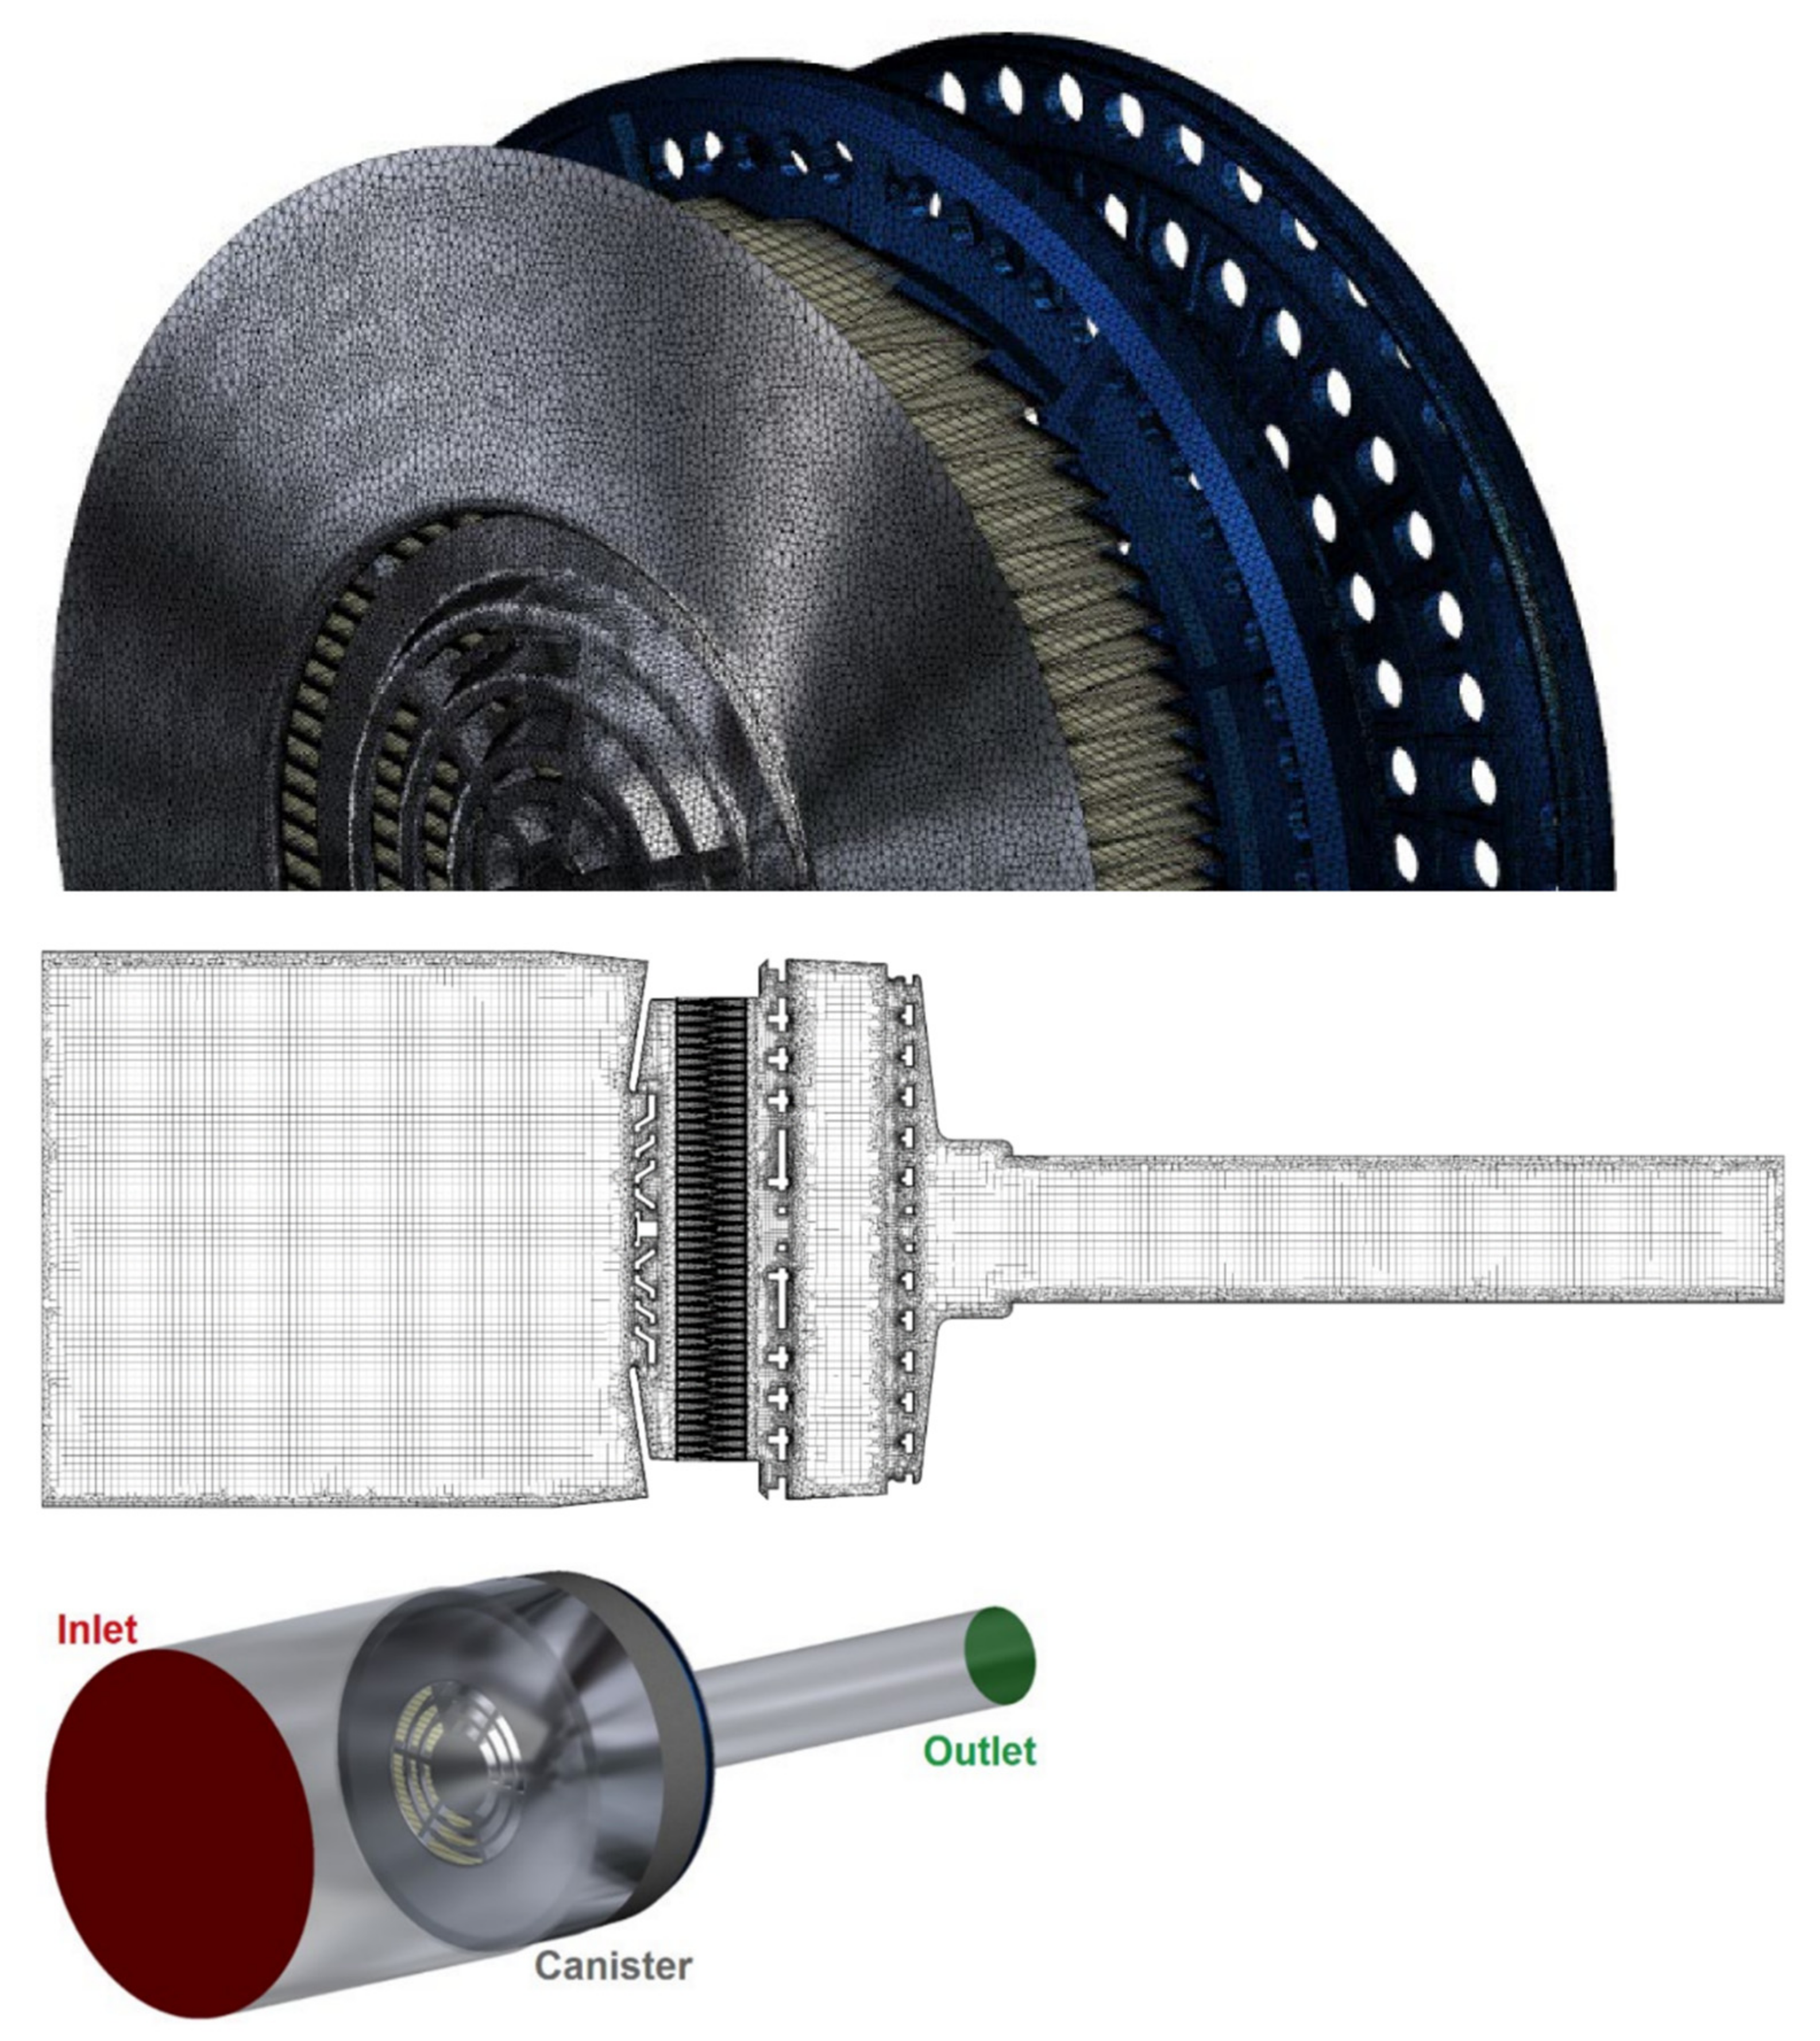
The relative (zero level) average static pressure was used at the outlet. To apply correctly the inlet and outlet boundary conditions, the computational domain has been extended with the cylindrical region with a diameter of 110 mm, 120 mm long in front of the filter inlet and the cylindrical region with a diameter of 29 mm, 150 mm long behind the filter outlet (
Figure 4). During the evaluations of the filter performance, pressure losses inside these cylindrical regions were subtracted from the overall losses. All plastic walls of the combined filter (canister body and its lid, perforated screens) were treated as the hydraulically smooth surfaces and employ automatic wall function treatment, which is natural for the SST turbulence model.
For numerical modeling of flow in the porous media, both the isotropic and the directional loss model can be used. To model the flow through the activated carbon cartridge, the isotropic loss model is fully matching the reality. Some discrepancy can be found when modeling flow through materials of the textile dividers as well as the filtration pleats. While these are fibrous materials, their thickness is very small compared to the other dimensions and the fluid tends to find the shortest way through the material, perpendicular to the sheet surface (which will be shown later on). Thus, the isotropic loss model is fully applicable when the coefficients can be well-calibrated by experimental data. The directional loss model is therefore frequently used to model the flow through the honeycombs or perforated plates forming the screens inside the filter canister. Nevertheless, in this paper, these perforated screens are modeled in full details of 3D geometry and do not need to use the porous medium equations.
So, both the absorbent filling and the textile dividers as well as the filtration pleats material are modeled as the porous media using the quadratic Forchheimer equation [
23]. In the ANSYS CFX software [
22], its implementation has the following generalized form of momentum source terms
|
U| represents the velocity module. The linear and the quadratic coefficients can be interpreted physically by permeability and loss coefficients
Kperm,
Kloss:
To set and calibrate these coefficients for every component, pressure losses have been measured inside a representative set of canister filters in the laboratory located at the SIGMA Research and Development Institute (
Figure 5). Pleats have 15 mm height and the pitch/spacing 2 mm, but also the flat filter without pleats has been considered for comparison. More information concerning the measurement equipment and methodology can be found in
Section 5.
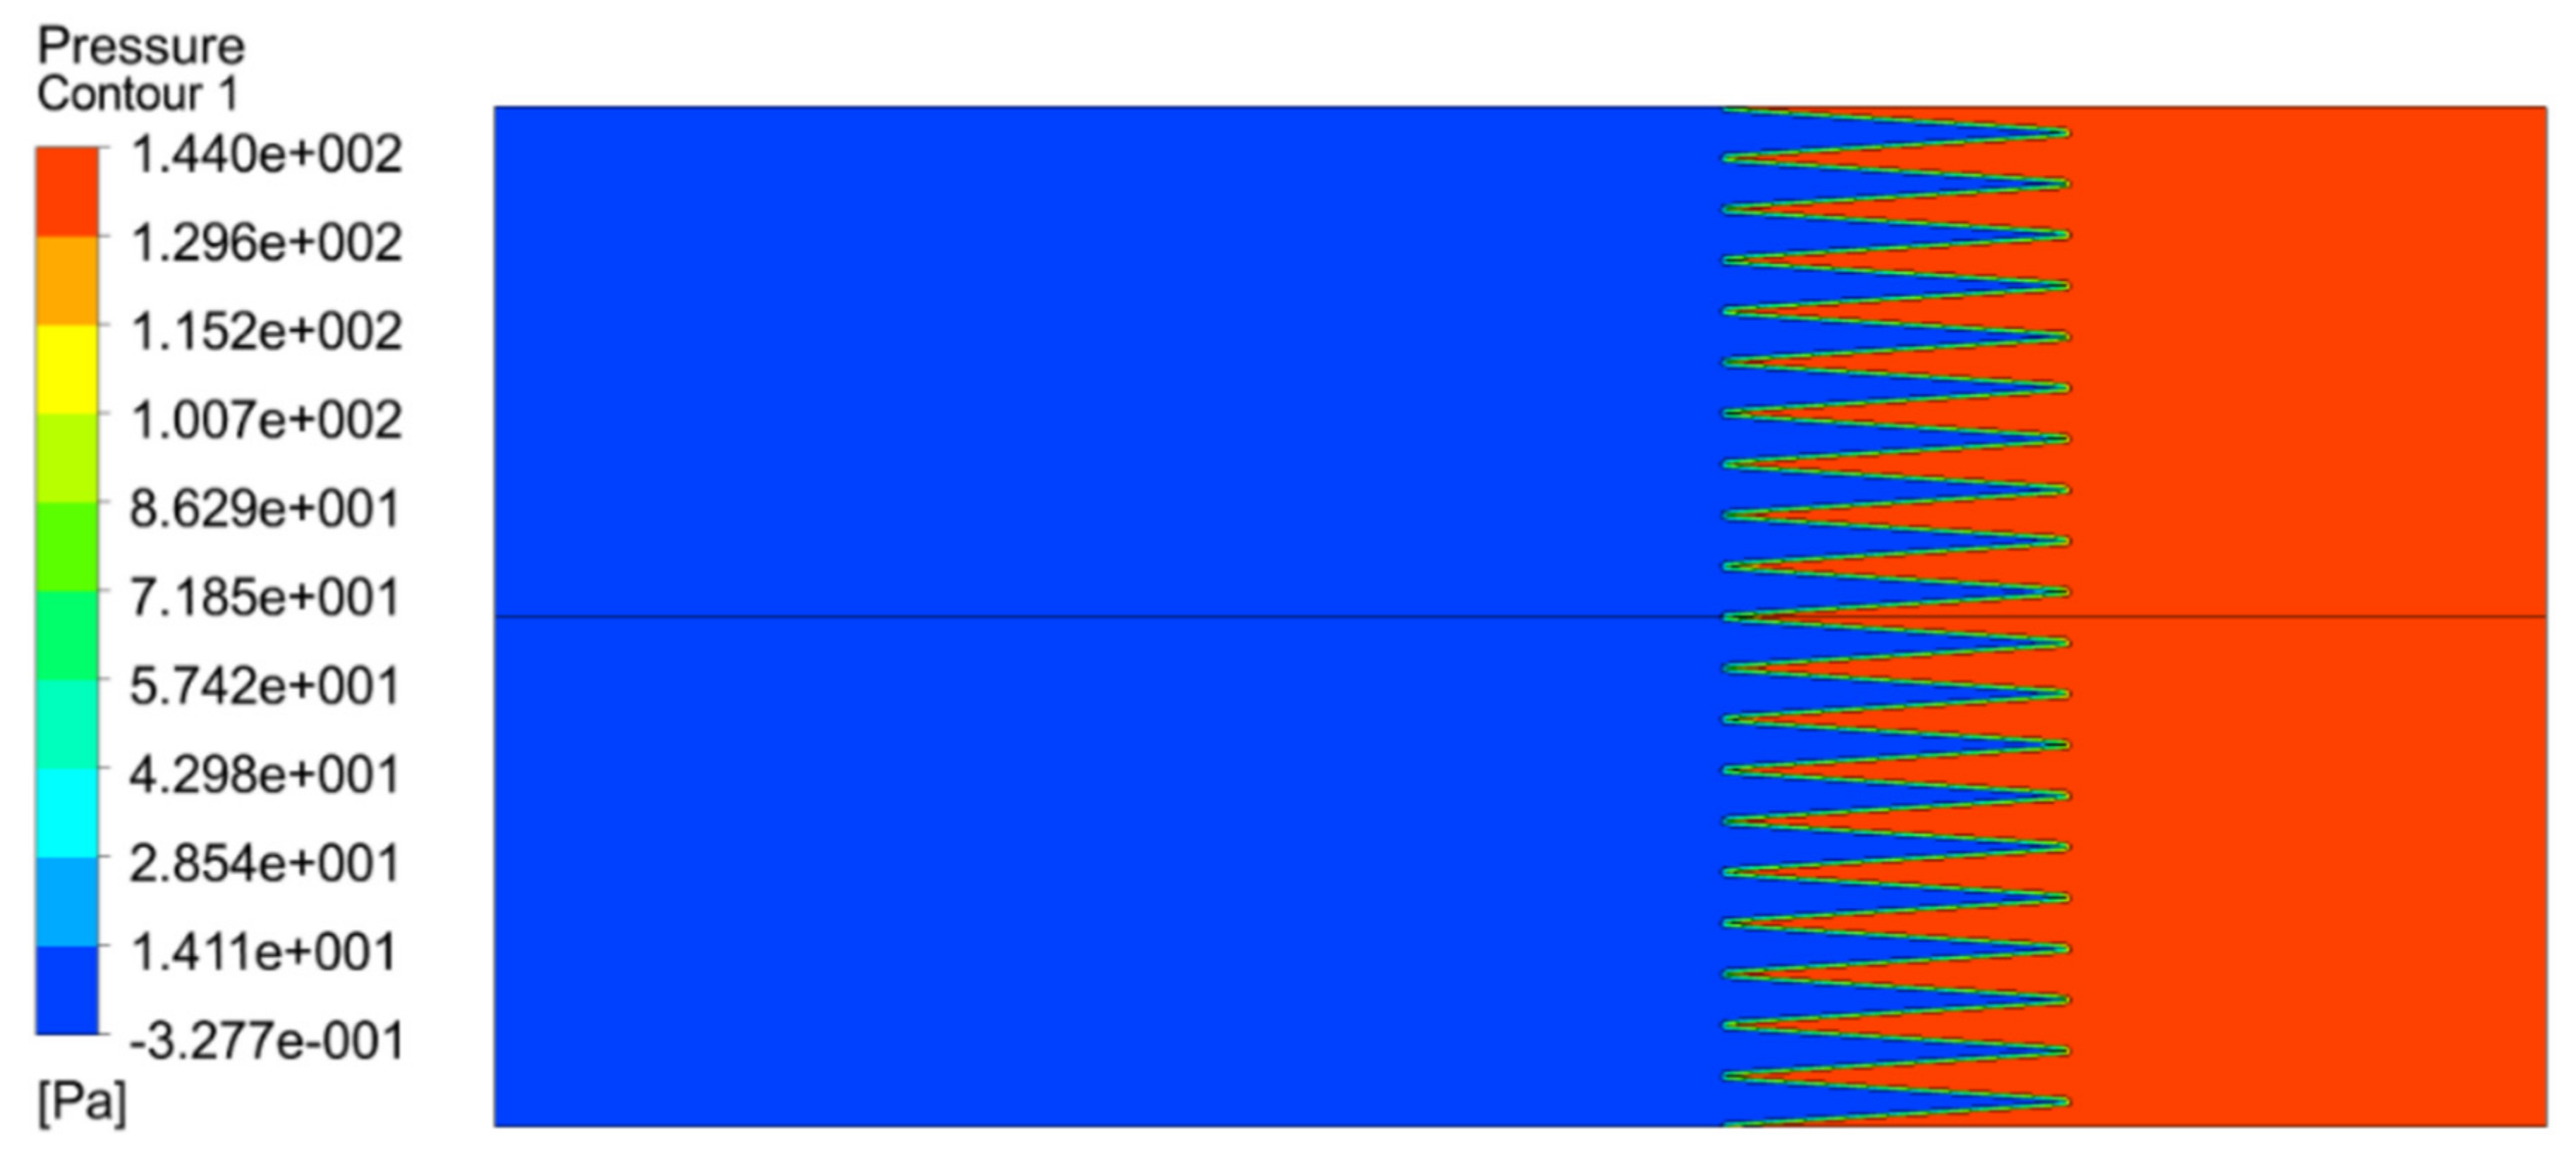
Also, comprehensive numerical modeling of flow inside the pleated filter section was carried out with a simplified test geometry, representing the rectangular computational domain, consisting of 20 pleats of 15 mm height and 2 mm pitch/spacing (
Figure 6).
Figure 7 shows the velocity distribution in the symmetry plane perpendicular to pleats and the detail of velocity streamlines passing through pleats. It can be seen that the air tends to find the shortest way through the material, perpendicular to the sheet surface (bottom). A sudden pressure drop behind the pleats can be seen in
Figure 8.
4. Optimization of Canister Lid
The canister lid is an inlet part of the combined filter. Different types of grille can be used for air input. The main role of the lid is to protect the pleated filter against damage and to ensure sufficiently uniform velocity distribution in front of the pleats. It is also desirable to have as low a pressure drop as possible. Four lid geometries were considered in this study (
Figure 9 and
Figure 10). Variant 1 represents the simplest geometrical shape with a large central part and three wide ring-shaped gaps. Only two simple conical ribs are used. Variant 2 represents an opposing concept with four well protecting bent ribs but with lower protection of the pleated filter against damage in the central part of the filter. Concerning Variants 3 and 4, they both use a small central cylindrical base and differ only in the number of the protecting bent ribs. They aim to protect well all the open inlet parts of the lid.
Figure 11 shows the velocity distribution in longitudinal sections of the combined filter. The pleat height is 13.5 mm and the spacing is 2 mm. The 3D streamlines in
Figure 12 show the complicated flow pattern inside the filter components.
Figure 13 shows the velocity distribution in the cross-sections perpendicular to the symmetry axis, 1 mm in front of the pleats and 1 mm behind the front pleat edges. When considering uniformity of the velocity distribution at the entry to the pleats, variants 2 and 4 are the best ones. Variant 2 seems to be even better than variant 4, but it offers less protection of the pleated filter against damage in the central part of the filter. The pressure loss of the variant 4 lid is about 0.5 Pa higher than that of the variant 2.
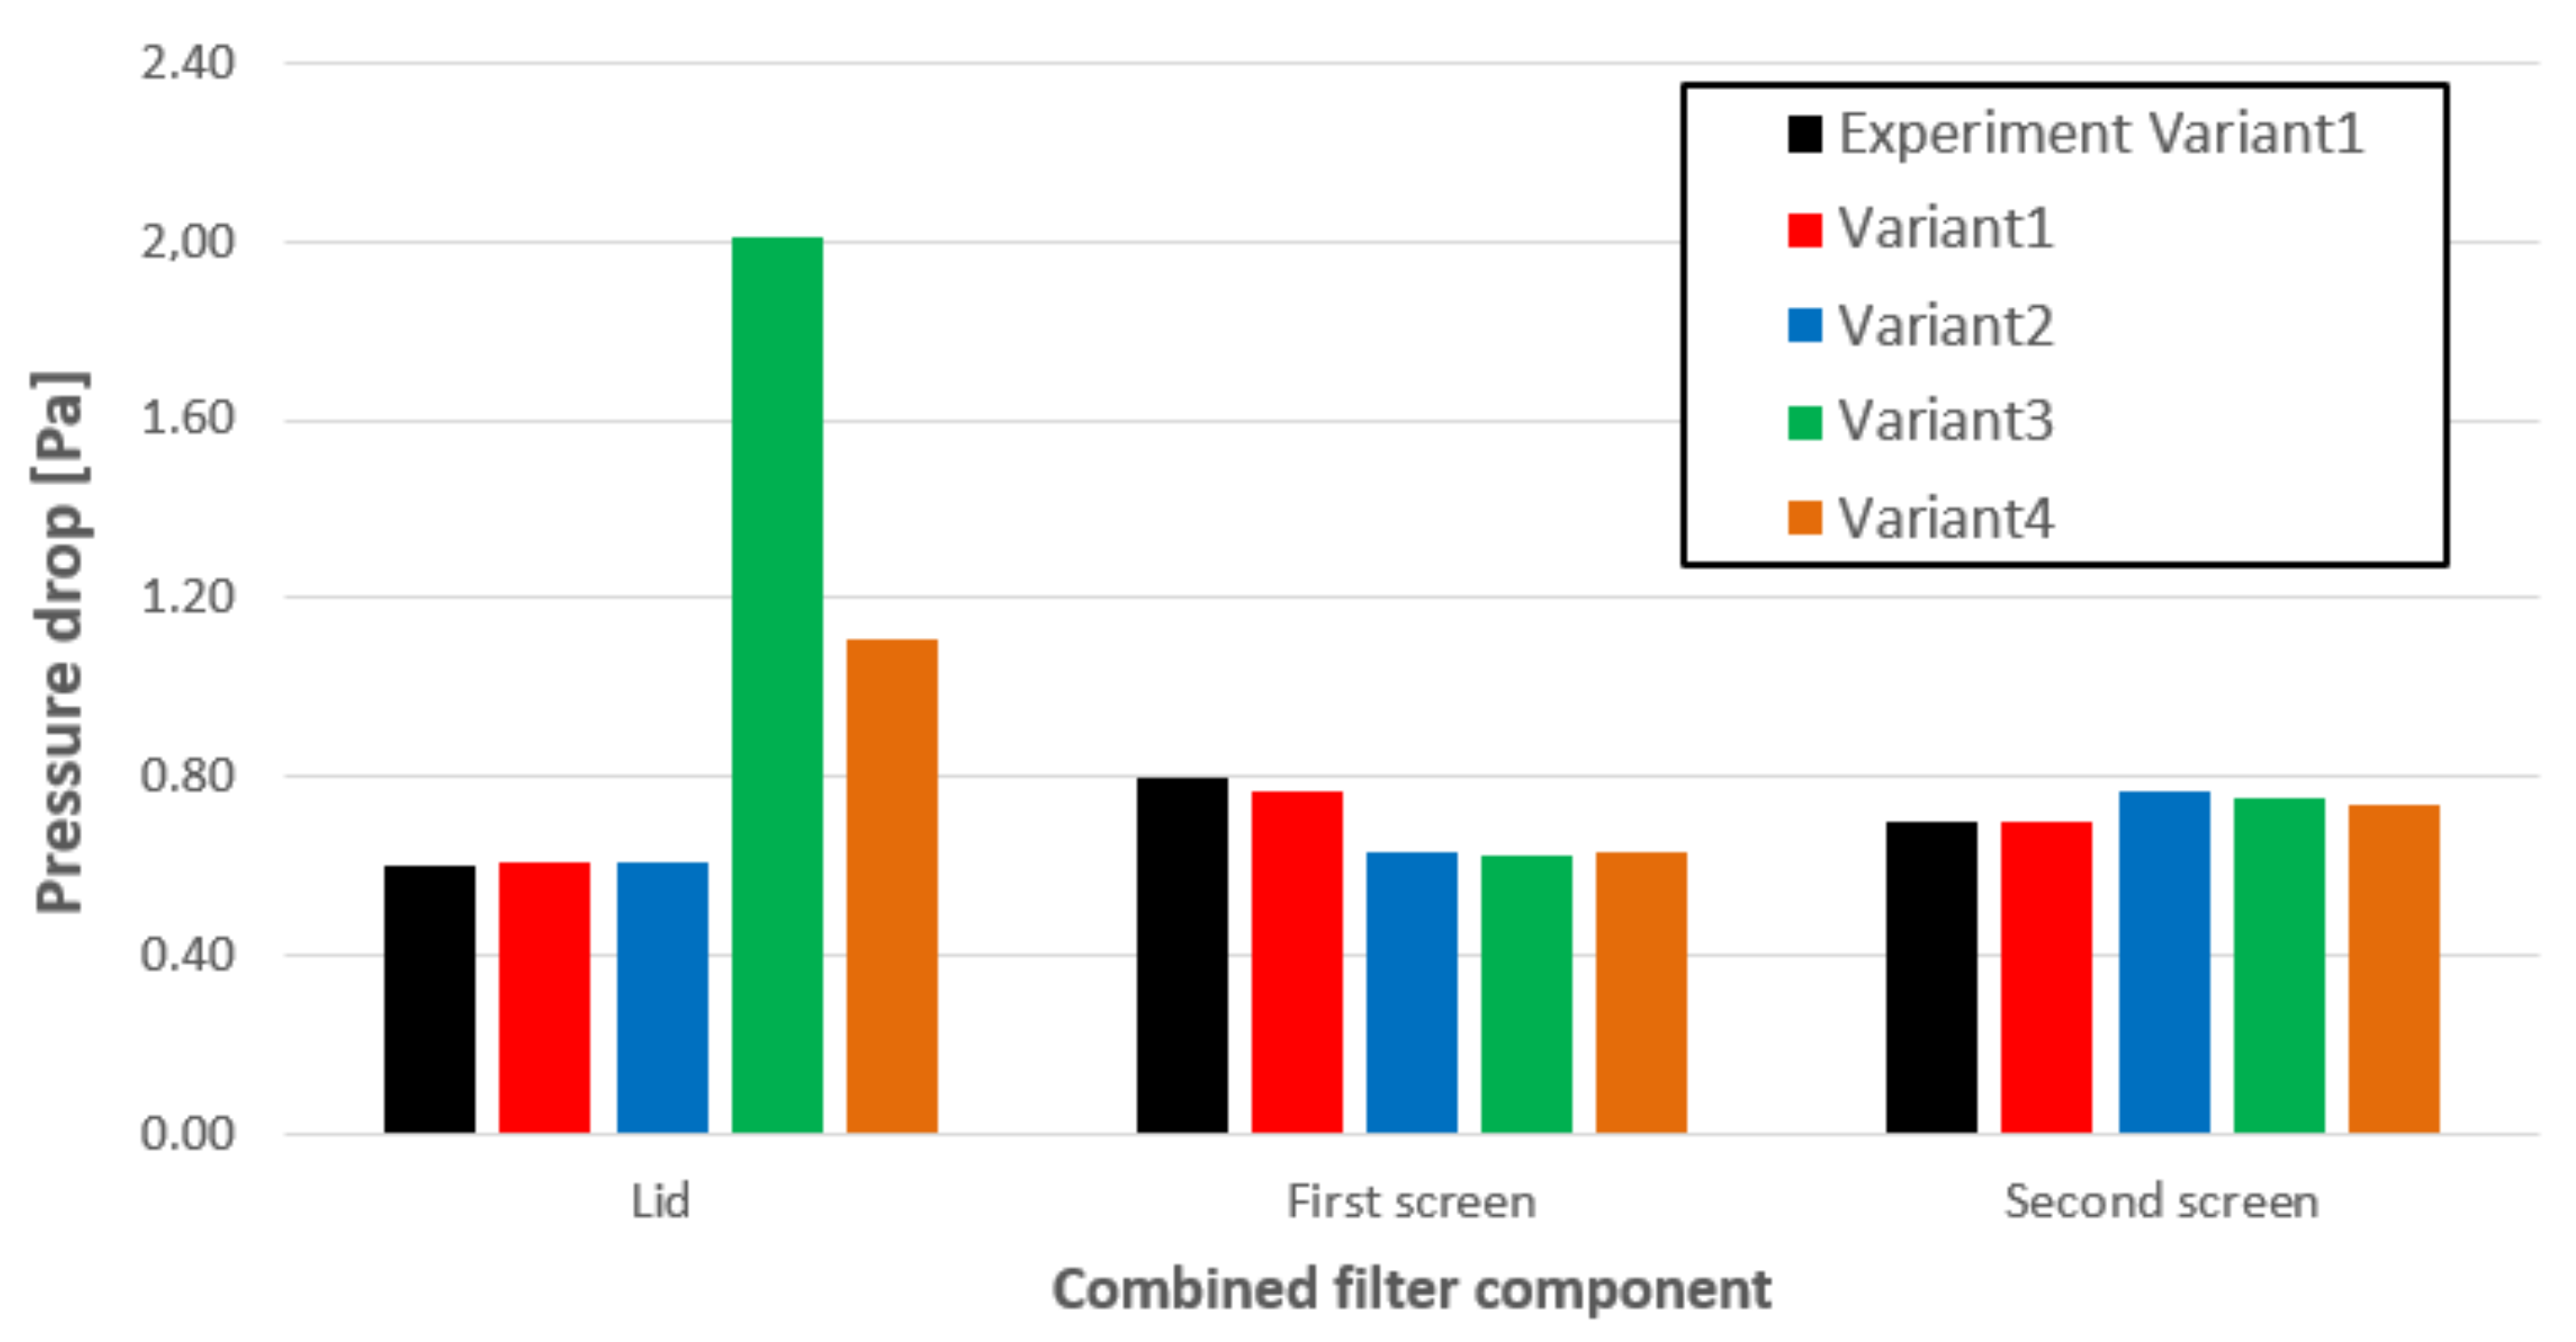
Figure 14 shows the pressure drop at the flow rate of 70 L/s, in the key components of the combined filter, which were modeled for complete 3D geometry. All the four variants of the lid were considered. Velocity distribution in cross-sections perpendicular to the axis of revolution inside key components of variant 4 is shown in
Figure 15. These cross-sections are located: 1 mm in front of the rear pleat edges, inside the first perforated screen, inside the first textile divider, inside the absorbent filling, inside the second textile divider and inside the second perforated screen.
5. Optimization of Pleated Filter
Setting the parameters of the absorbent cartridge does not represent a real problem, considering that its material is homogenous and uniformly packed in the whole volume of the filter cartridge. The linear and the quadratic coefficients of the Forchheimer equation can be identified based on several experiments with different mass flow rates. Of course, there can be some influence of the packing technology [
3,
12,
24,
25], on the porosity profile and pressure drop across the filter, but this influence is not considered in this paper due to a lack of relevant experiments. Similarly, for the flow through the textile dividers, this paper considers the material to be homogenous with the isotropic loss model.
A much more difficult question is how to model the flow through the zig-zag-shaped pleated filter. Here, the flow pattern depends not only on the loss model in the pleated material but also on the real geometry of the pleats. As already mentioned, multiple experimental studies [
13,
14,
15] on the pleat efficiency have shown that there is a local minimum of the pressure drop curve, based on the angle of the pleat sides. Considering that the air tends to find the shortest way through the material, perpendicular to the sheet surface, the pressure drop is the most important criterion of the pleated filter efficiency, more important than the geometric surface area. It shows the real, effective surface, which is used by the air to pass through the filter because, with the decreasing angle of the pleat sides, boundary layers can render an important part of the filter surface underutilized for the filtration process.
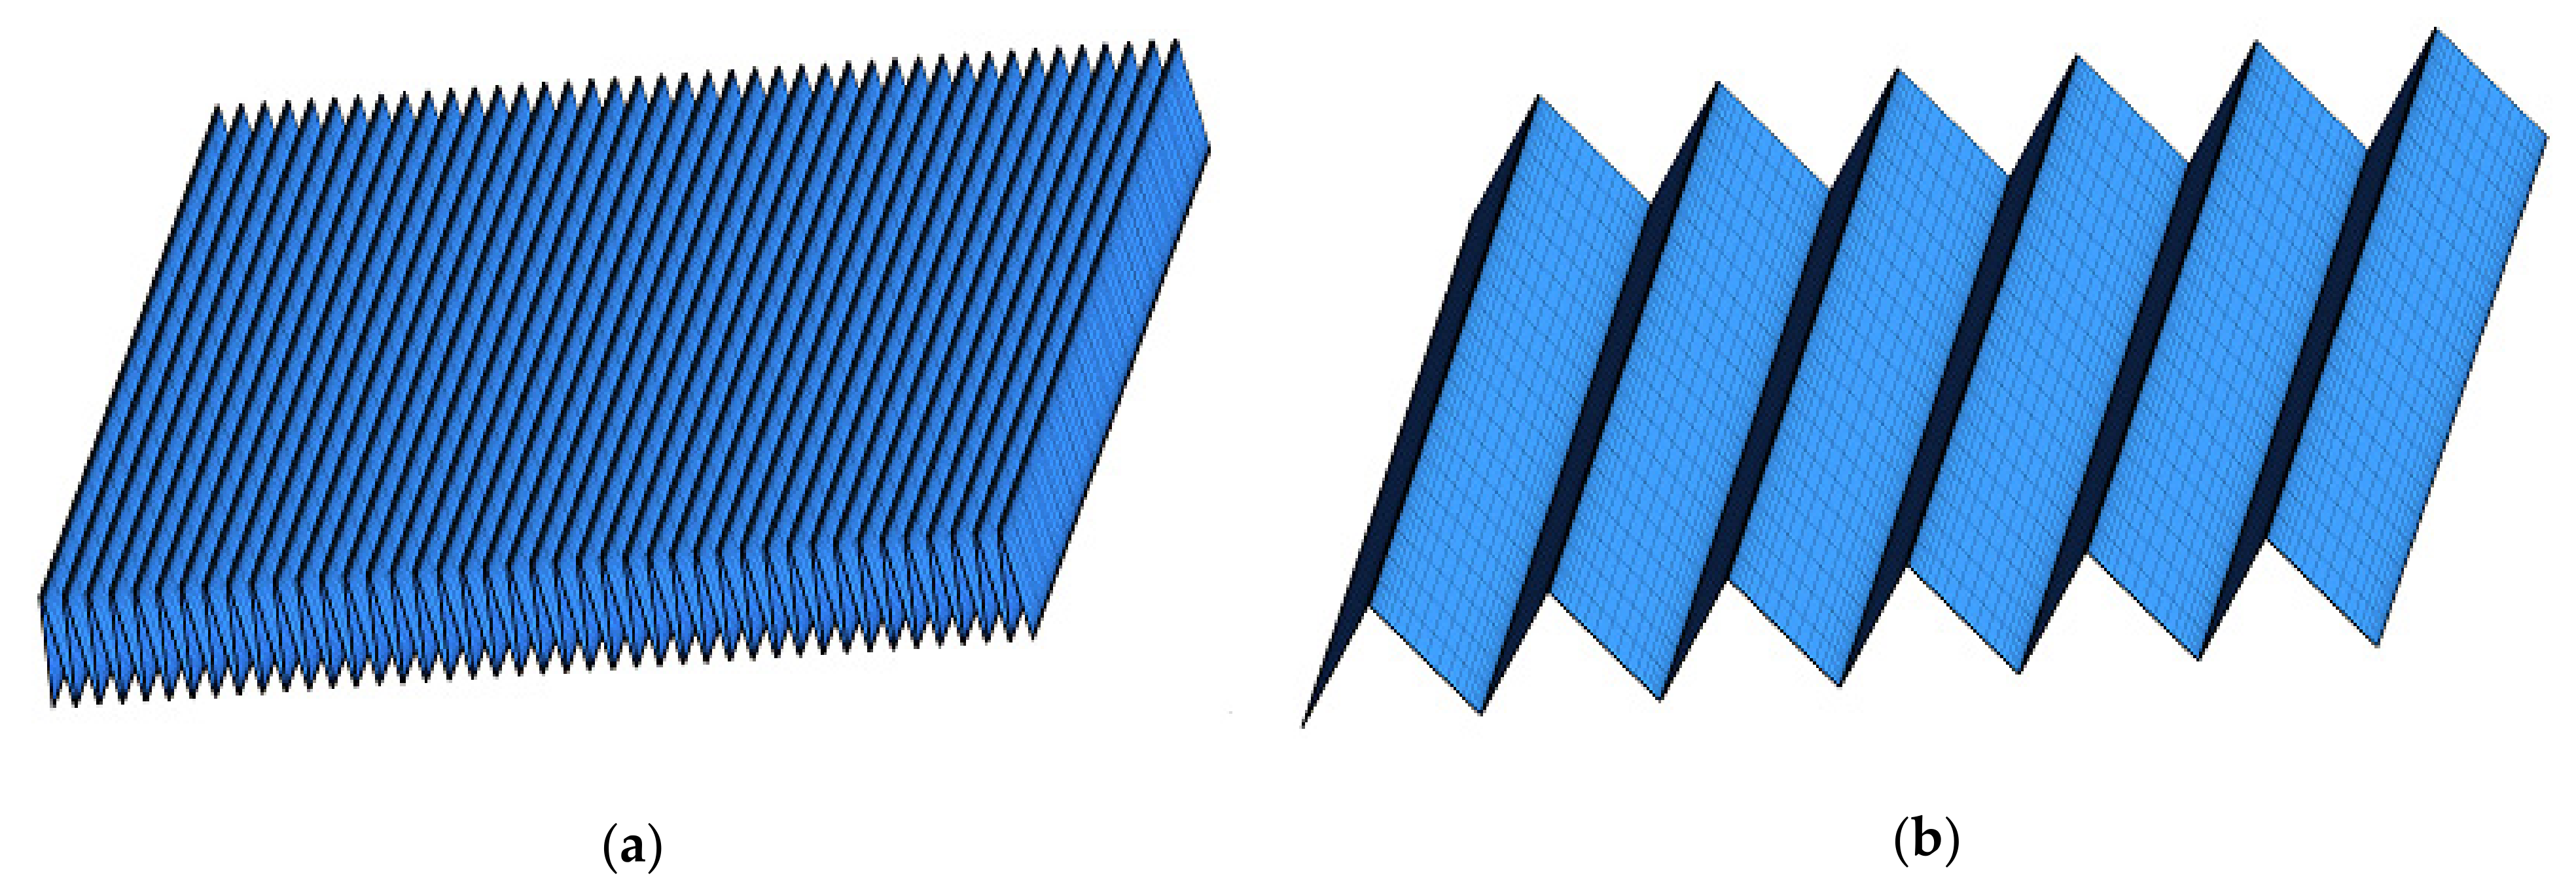
For the numerical investigation, a fully parametric model of the pleated filter was created (
Figure 16). A combination of Python and script-driven ANSYS ICEM software was used for both the geometry and the mesh generation. The process had the following steps:
Based on the parameters, compute the position of points for a single pleat. The thinnest part of the pleat is slightly modified. Instead of going to zero thickness, the minimum was artificially kept to 0.05 mm. With this change (which should have a negligible impact on the flow), it was possible to use a much higher quality O-grid mesh around the pleat.
Compute the position of the “helping” points for the blocking structure (O-grid vertices position etc.)
Insert the data into a premade ICEM rpl template file. Using Python for this part is much more reliable than ICEM innate scripts, which (apart from limited capabilities) often cause problems with inconsistent entities’ naming. Thus, with Python, it is possible to rely on premade scripts for the blocking.
Next, run the ICEM rpl script. It creates the necessary geometry structures, loads a premade block structure and fits it to the actual geometry and creates the mesh. Mesh density (number of edge nodes) is also set by a parameter during the process.
Then, the created mesh is copied in many instances, to meet the necessary dimensions.
Finally, the mesh is exported to CFX format.
Multimedia view of parametric changes of the pleated filter are included in the
Supplementary Materials of the paper.
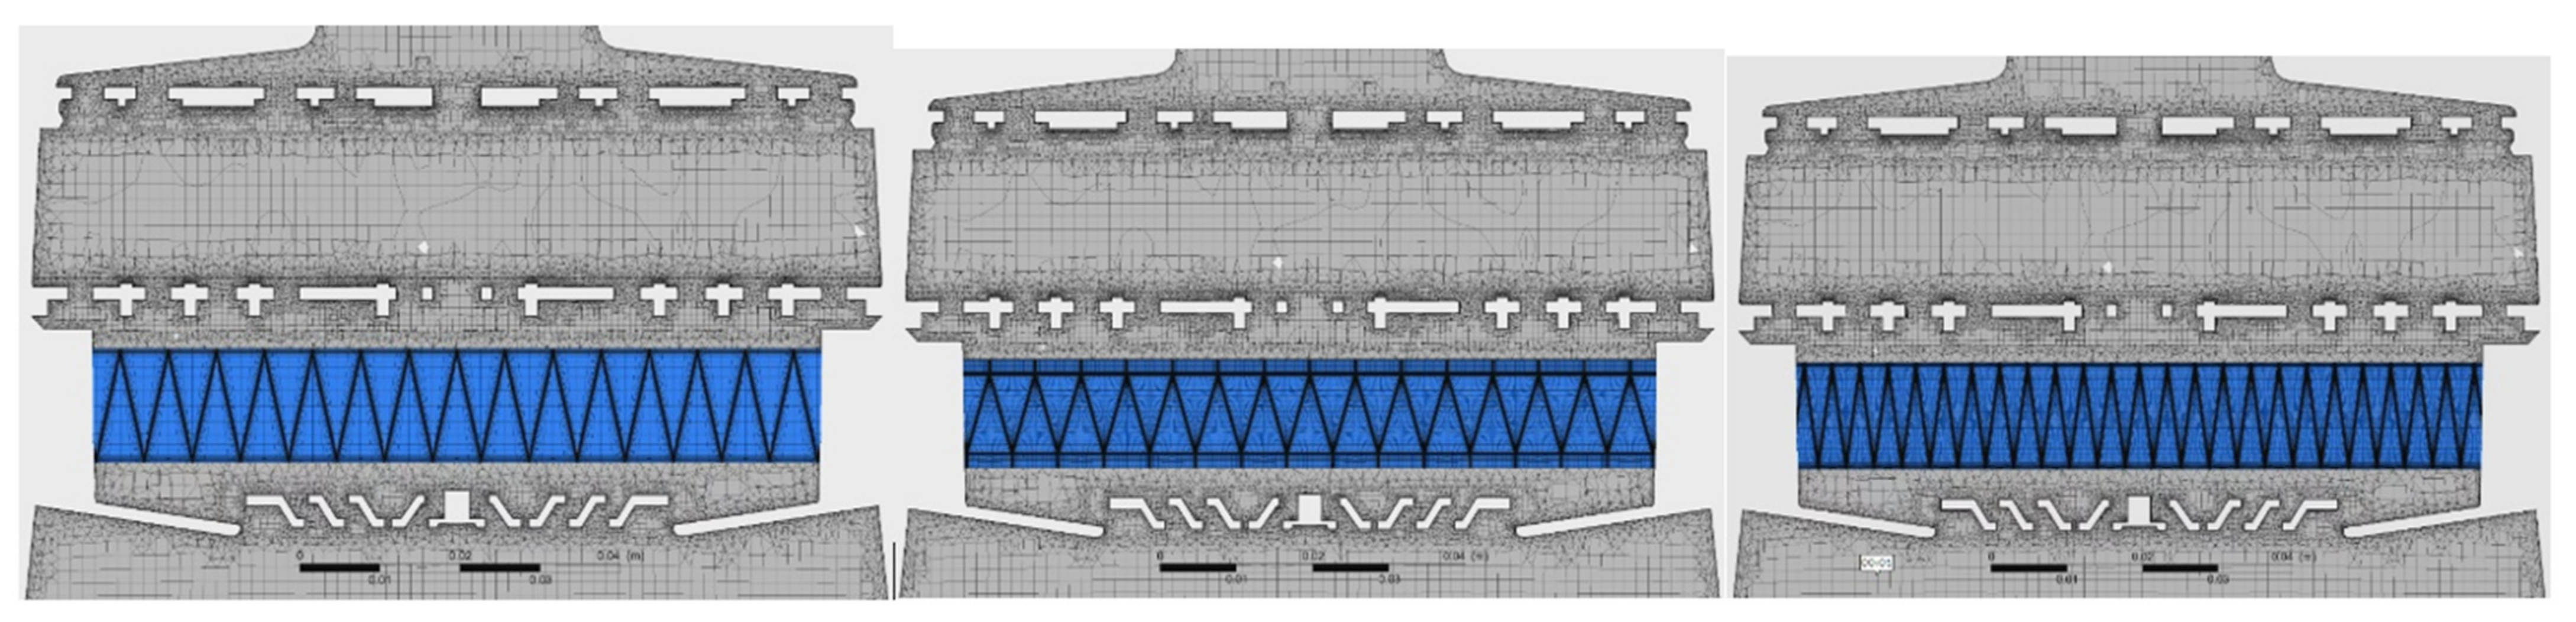
Due to limitations of ICEM scripting, the pleated filters were created with a rectangular shape (
Figure 17), as capturing the round shape would be extremely challenging. For simulation purposes, the realistic shape of the fluid domain was ensured by adding an impermeable solid domain with the needed shape in the CFD model. This way the active part of the pleated filter was effectively cropped to the desired shape. Next, for selected combinations of pleat height and spacing, the meshes were created and imported to a pre-made CFX model.
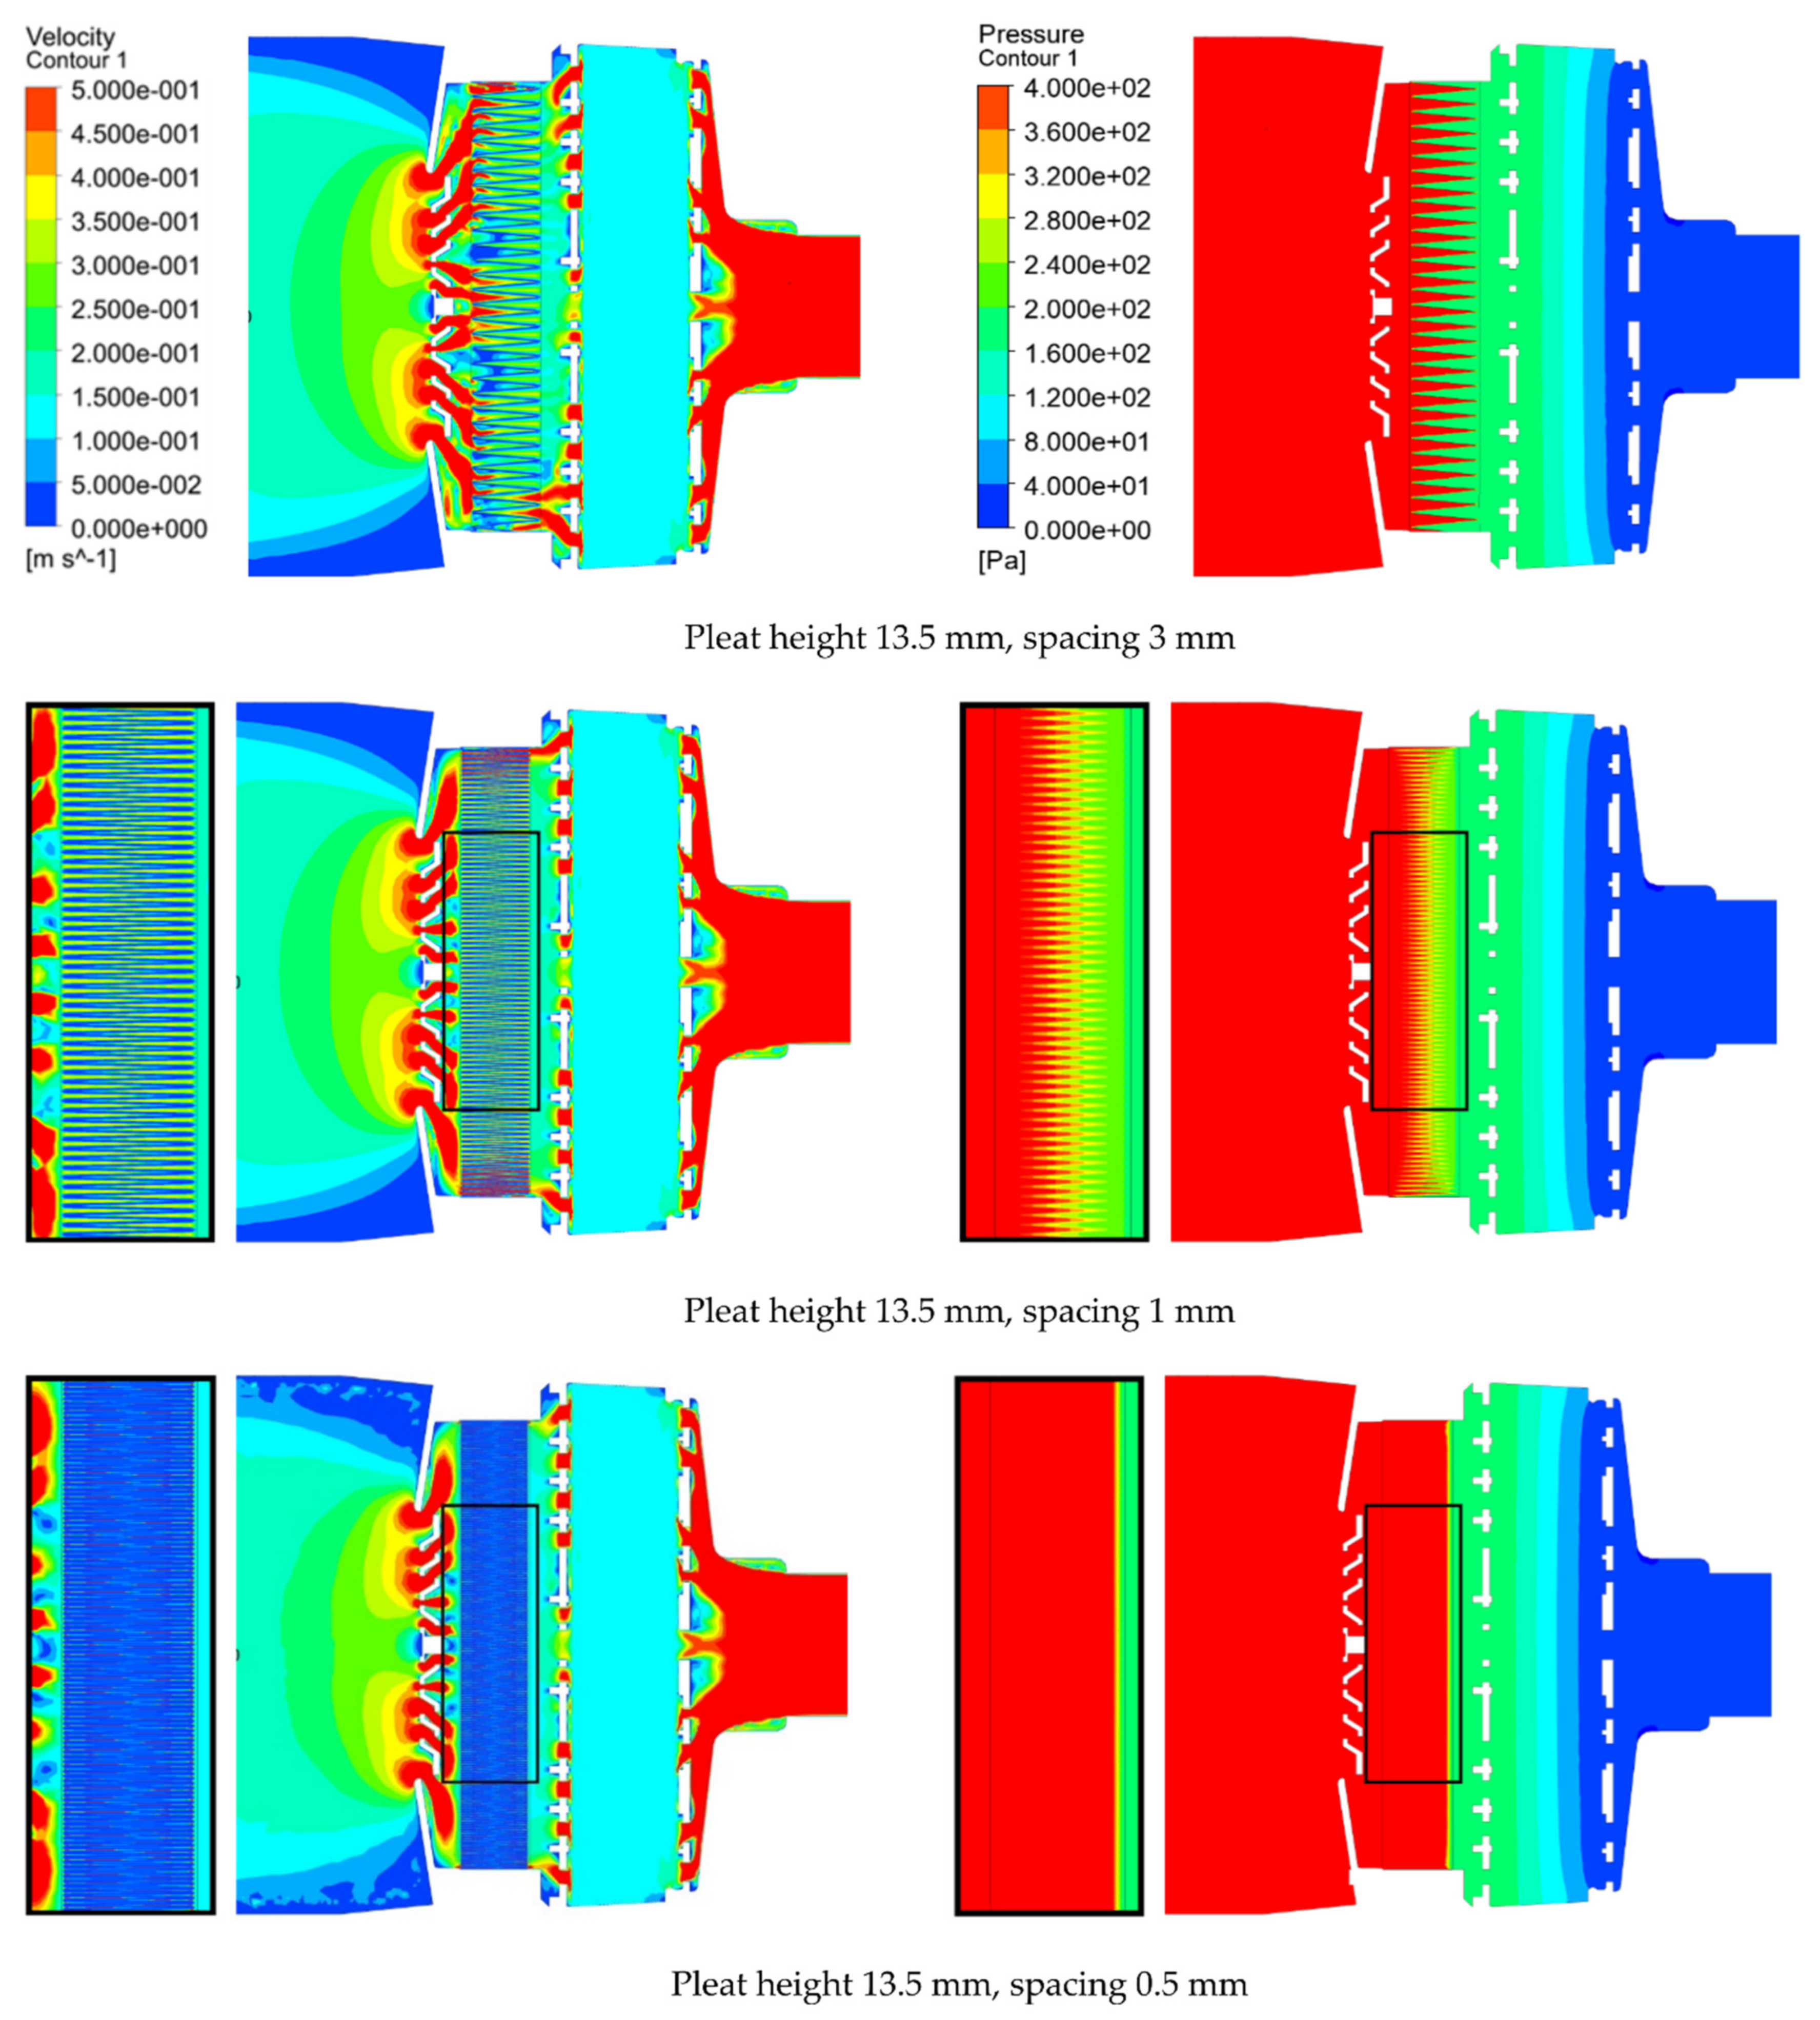
Figure 18 shows the velocity and the relative static pressure distribution in longitudinal sections for three different spacings of pleats at the flow rate of 70 L/s. For two smaller spacings, details of the pleats are shown for better clarity. The pleat height is 13.5 mm. When looking at the spacing of 3 mm (which corresponds to the angle of the pleat sides about 12.7°), all the pleats are working correctly, there is a sharp and uniform interface on the pleat surface both for velocity and pressure. In the case of the spacing of 1 mm (which corresponds to the angle of the pleat sides about 4.24°), the air flow starts to be blocked at the vertices of triangular pleats. In the case of the spacing of 0.5 mm (which corresponds to the angle of the pleat sides about 2.12°), the pleats completely lose their function and all of the pleated filter behaves like one compact thick resistance layer.
The left side of
Figure 19 shows the calculated pressure drop of the pleated filter at the flow rate of 70 L/s for the pleat height of 13.5 mm in a range of spacing from 0.5 mm up to 91 mm. The rapid increase of the pressure loss can be seen for very small spacing. Very small spacing pleats can work worse than the flat filter. The right side of
Figure 19 shows the calculated pressure drop of the pleated filter at the flow rate of 70 L/s for four pleat heights. For the height of 13.5 mm, the minimum pressure drop is reached at the spacing of about 1.4 mm, which corresponds to the angle of the pleat sides at about 6°. This optimal angle increases to about 8.6° in the case of the height of 9 mm. This is no surprise because, with decreasing pleat height, there is an increasing influence of the constant pleat material thickness.
The calculated results of the pressure drop in the pleated filter can be compared with the experimental data, obtained from the measurements carried out in the laboratory of the SIGMA Research and Development Institute. The single-purpose automatic measurement station SIGOD has been used, which provides data about the filter weight and the pressure drop for the air flow rates in the range of 25–150 L/min with a relative accuracy of 1%. Data about temperature and humidity of the working medium (air) and ambient air are continuously registered. All standard statistical values are generated in real time to ensure correct results, which fully comply with the European standards [
26].
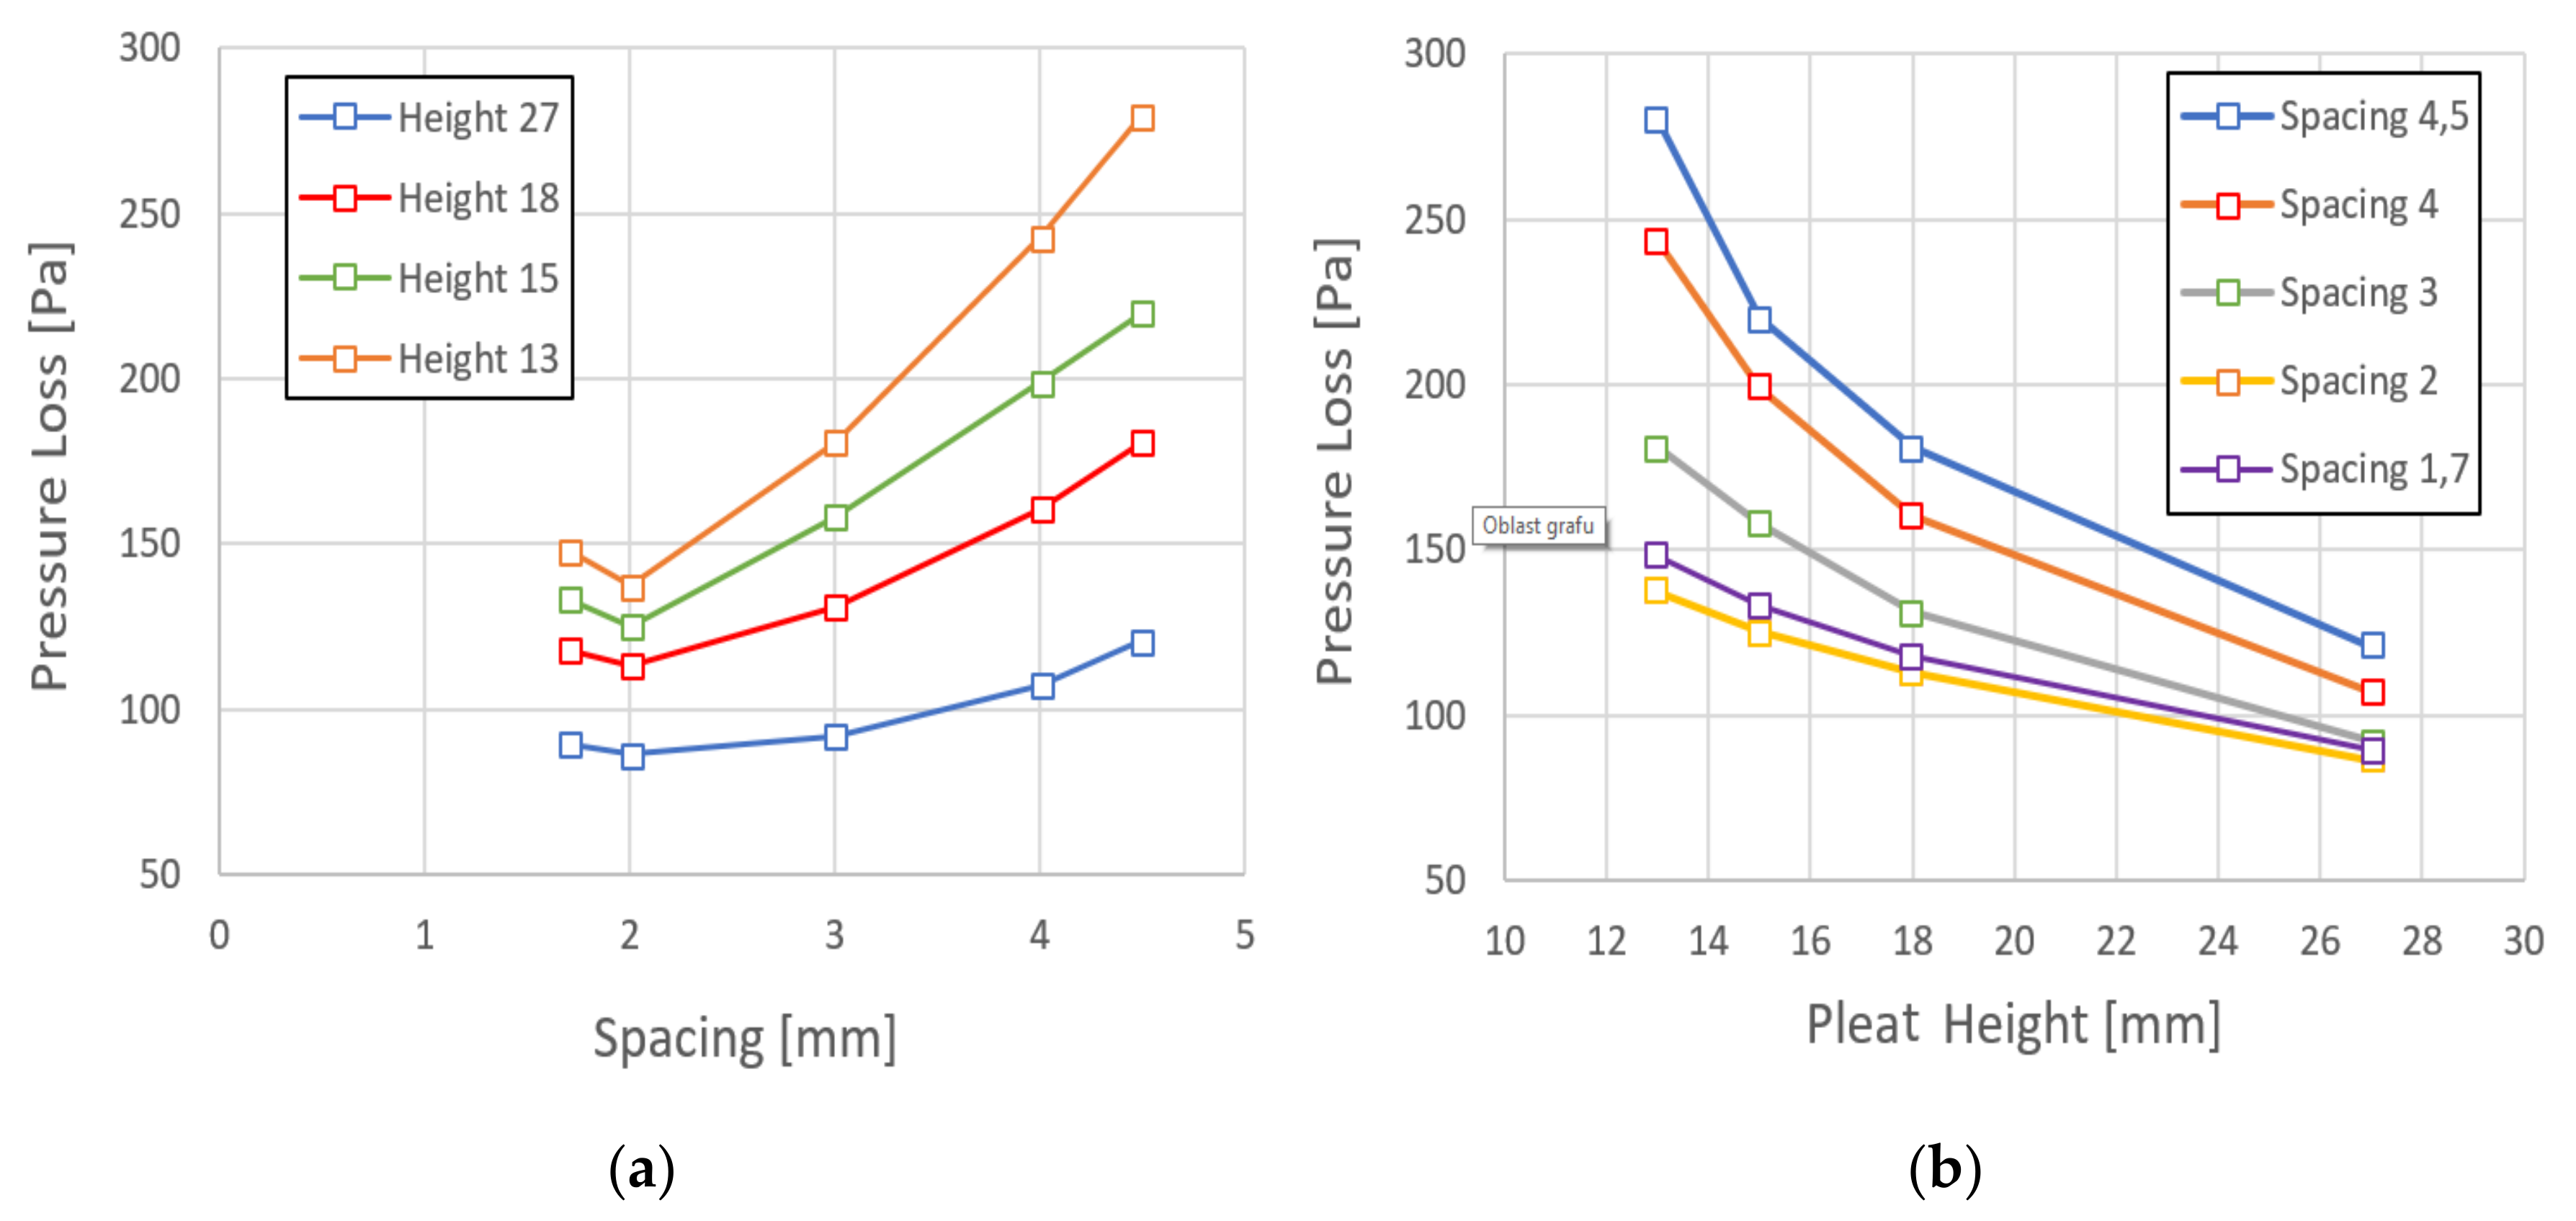
The results for four heights and five spacing values (
Figure 20 and
Figure 21) have been selected to create a response surface and to find a minimum pressure loss path. All points of the graphs in
Figure 20 represent the arithmetic mean of the data set from 10 filters. The deviation of values is below 4%.
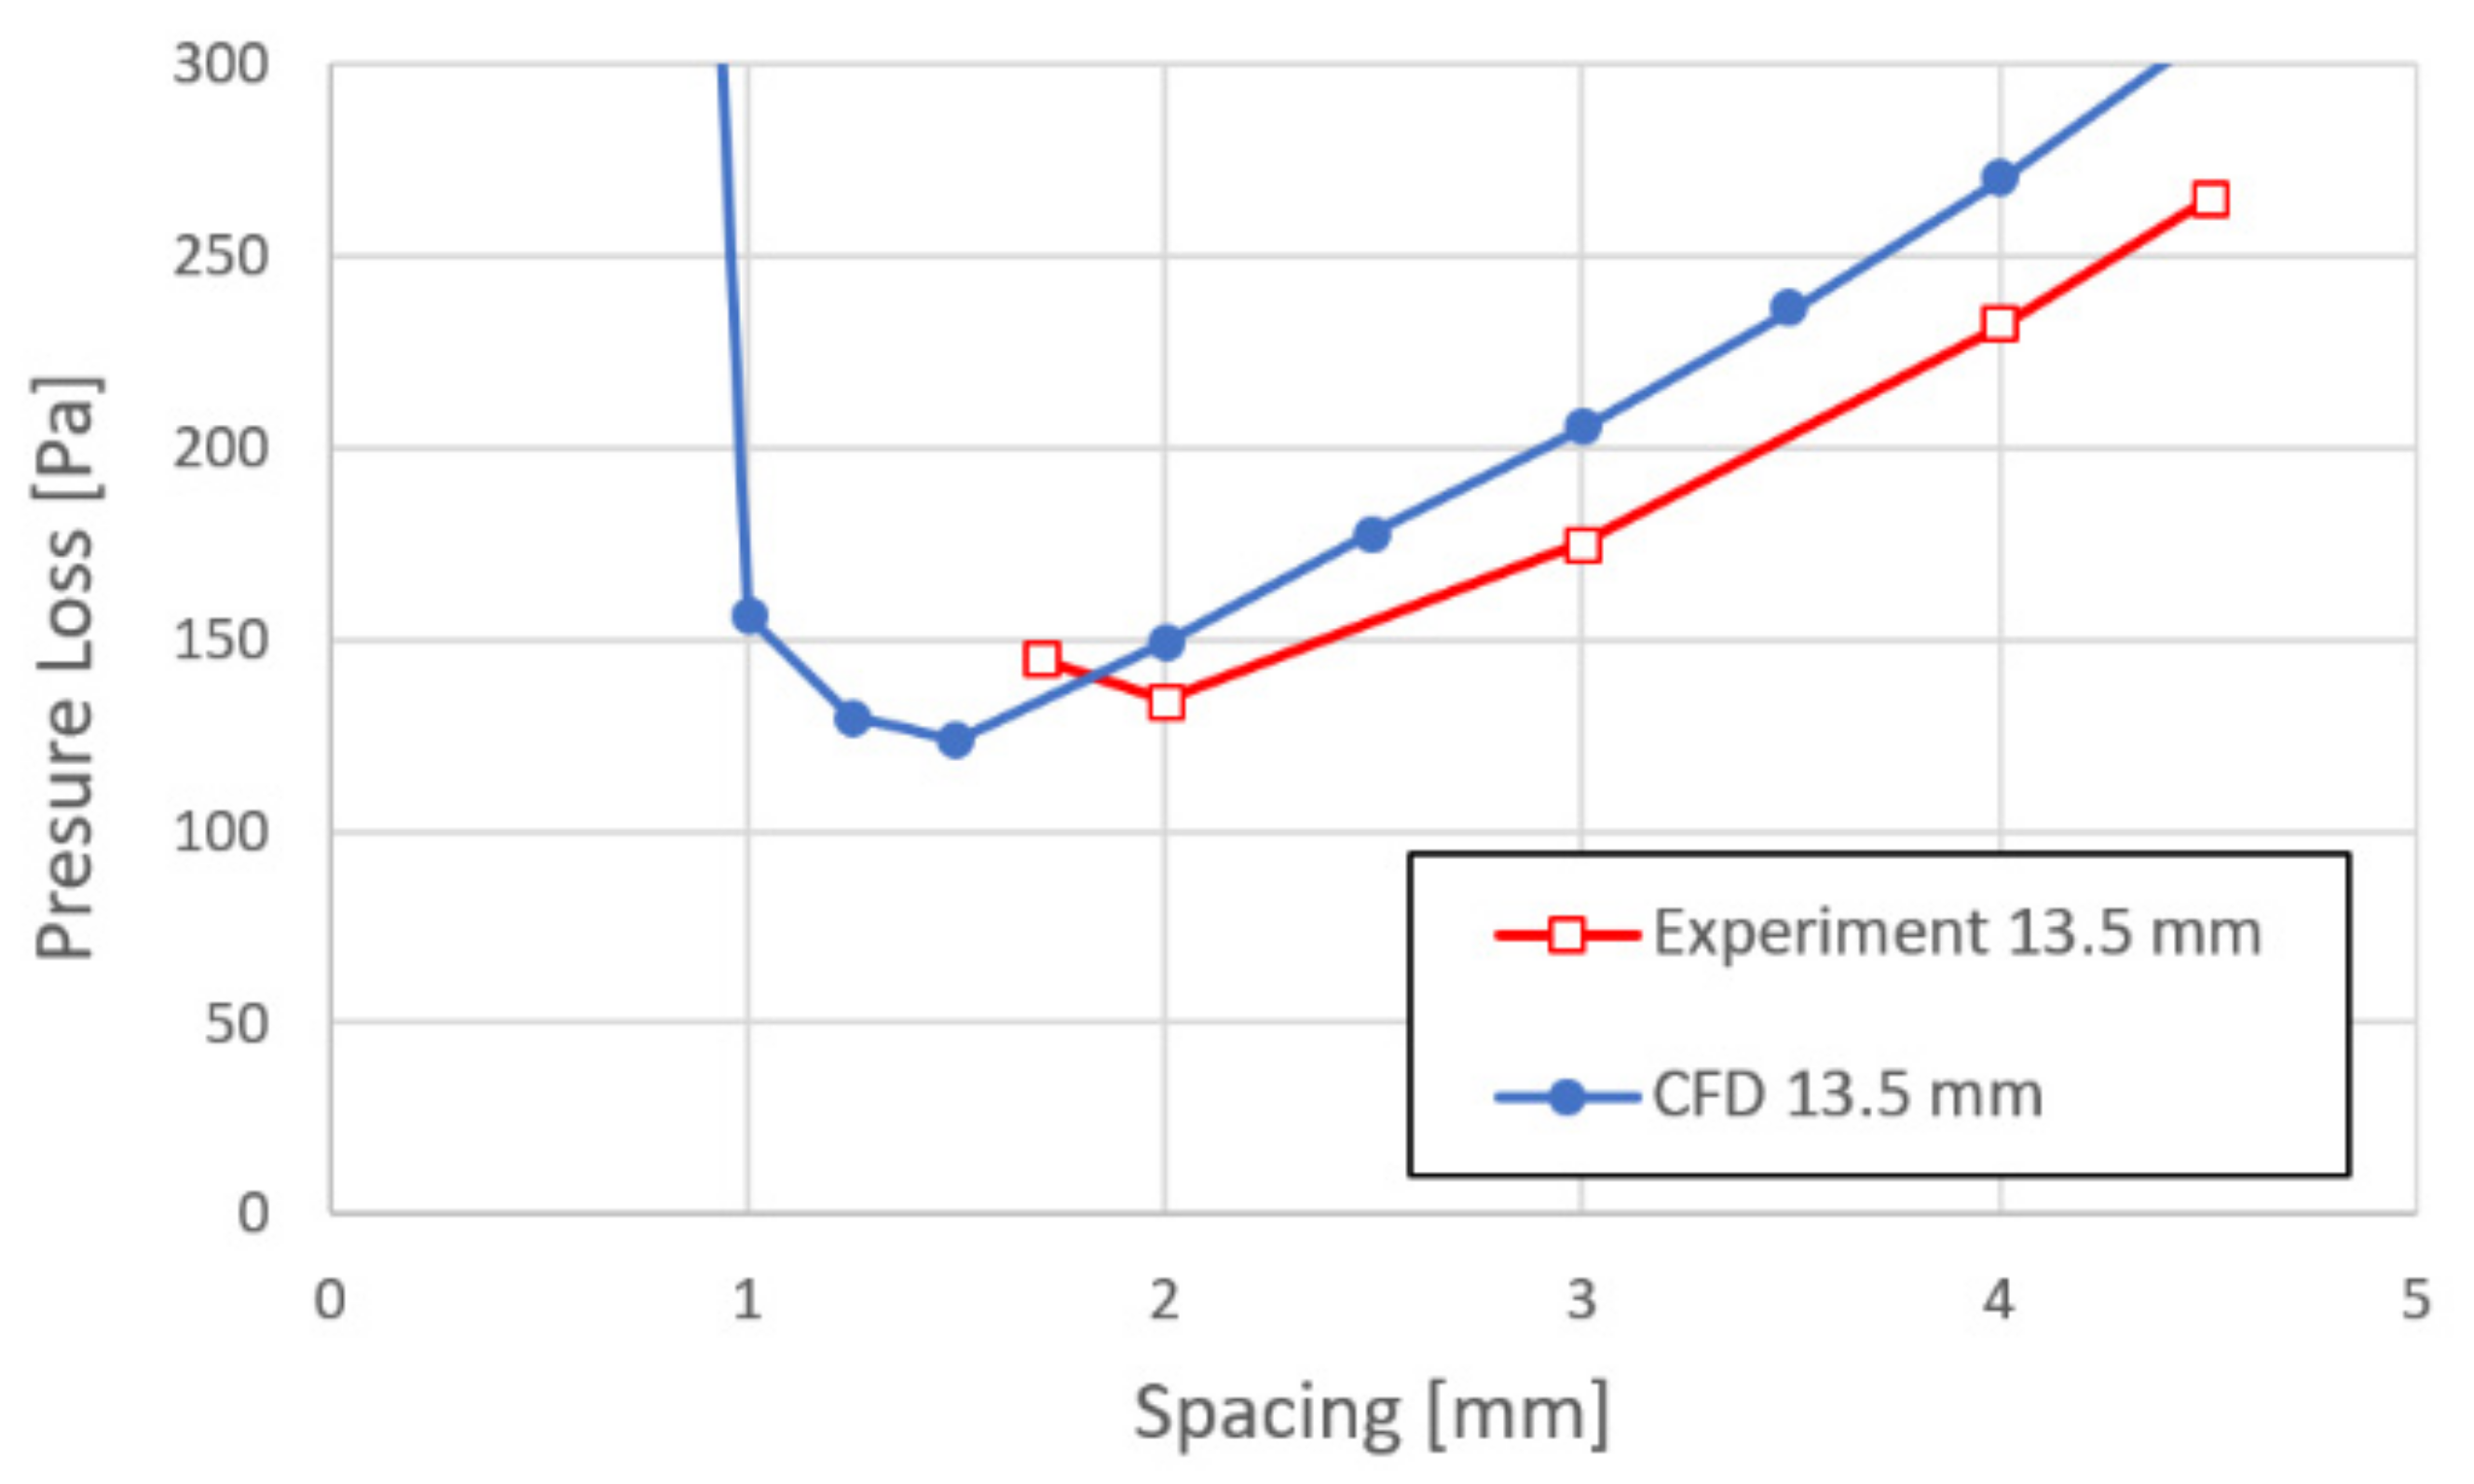
Figure 22 shows the comparison of the calculated pressure drop for the pleated filter with the height of 13.5 mm and the flow rate of 70 L/s with the values obtained from the experimental response surface. While the calculated minimum pressure drop is reached at the spacing of about 1.4 mm, which corresponds to the angle of the pleat sides of about 6°, experiments predict the minimum pressure drop at the spacing of about 1.9 mm, which corresponds to the angle of the pleat sides about 8°. It seems that the experimental results are (compared to CFD results) shifted about 0.5 mm to the right. The most probable explanation of this shift is based on the fact that the numerically modeled pleats are geometrically perfect, while in the experiments, it is not possible to avoid some imprecision of the pleat geometry, which decreases the effective surface close to the vertices of triangular pleats.
6. Modeling of Breath-Responsive Flow in Combined Filter
All previous results consider the steady continuous flow throughout the canister, mostly with the flow rate of 70 L/min, which corresponds to increased human activity. In fact, the flow in the combined filter will in most cases follow the human breathing pattern. The shape of the average breath curve was taken from Colby et al. [
27], which has been recalculated so as to represent 70 L of the inhaled air per minute (
Figure 23a). The breath has a 0.6 s period. The inhalation phase is shorter, it takes about 0.2 s and resembles a half-sinusoidal curve. When the flow starts to have the opposite direction, the non-return valve is closed and the air leaves via the valve in the mask. Multimedia view of velocity streamlines and the pressure distribution in the longitudinal section together with multimedia view of the longitudinal velocity distribution in the cross-section 1 mm behind the front pleat edges during the breath-responsive flow are included in the
Supplementary Materials of the paper.
These unsteady simulations are based on the unsteady Reynolds-Averaged Navier-Stokes equations (URANS), again with the SST turbulence model. The time step 0.00625 s has been used with five inner coefficient loops per time step. The initial conditions have been taken form the steady solution with the flow rate of 70 L/min.
Quite high peak values of pressure drop can be seen in
Figure 23b both in the pleated filter and in the absorbent cartridge. The pleat height is 13.5 mm and the spacing is 2 mm. The averaged values of the pressure drops can be compared with the steady continuous simulations. The average value of the pleats pressure drop in the graph is 158 Pa, which corresponds well with the value of 153 Pa during the steady continuous flow, with an increase of about 3%. The average value of the absorbent pressure drop in the graph is 210 Pa, which gives an increase of about 9%. The explanation can be in the faster response of the thin material of the pleated filter compared to a thick layer of the absorbent. Very important is the fact that during the simulations with different pleat heights, the values of the optimum spacing remained practically unchanged compared to the previous analysis based on the steady continuous flow throughout the canister.
7. Conclusions
The flow in the complex three-dimensional geometry of the combined protective canister filters has been investigated numerically using CFD tools and compared with the results of experiments. The main attention is focused on the prediction of the pressure drop and the sufficiently uniform velocity distribution in each component of the canister filter. All plastic parts including the lid grille and the perforated screen are modeled in full detail. Both the absorbent filling and the textile dividers as well as the pleats filtration material are modeled as the porous media using the quadratic Forchheimer equation. Still, the real geometry of the pleats is considered so as to capture the influence of boundary layers formed inside the pleated filter. The fully parametric description of the pleats enables the generation of high-quality structured computational grids for a wide range of pleat heights and widths and the use of a numerical shape optimization process. Such a grid gives relatively stable results for quite a wide range of grid point numbers. The blue line in
Figure 24 shows relative pressure loss inside the pleats for different numbers of grid points. The reference total grid number is related to the grid used for the calculations with the Variant 4, the pleat height is 13.5 mm and the spacing is 2 mm. It means that for this standard grid, the relative pressure loss is equal to 1. In this case (blue line), changes in the total grid number are linked just to the changes in the number of grid points inside the pleated filter. It can be seen that increasing the total number of grid points by about 37%, the pressure loss changes by about 0.3%.
The red line in
Figure 24 shows relative pressure loss inside the canister parts (canister body with the lid and perforated screens) for different numbers of grid points. In this case, changes in the total grid number are linked just to the changes in the number of grid points inside the canister parts. It can be seen that the unstructured grid of the complicated geometry of the lid and screens is much more sensitive and has its lover limit, related to the dimensions of the grilles and screen openings. So, decreasing the total number of grid points by about 10%, the pressure loss can change by more than 1%. From this point of view, the selected computational grid seems to be a good compromise between accuracy and computational demands. As it has been shown in
Figure 3, y+ values calculated on the canister lid and the perforated screens are below the value of 0.3 for the steady-state calculations. This enabled us to keep values of y+ close to 1 even during the unsteady simulations of breath-responsive flow during the inhalation phase.
All the calculations have been done with the 16-core-based workstation, with the typical computational time of about 10 h per one steady case. The convergence criteria for steady-state case respected both the residua of the RANS equation (10−5) and the pressure drop differences below 1%.
There are some concluding remarks:
The design of the lid grille highly influences the uniformity of flow at the entry to the pleated filter, as well as the level of protection it offers for the interior parts of the filter. As the pressure drop in the grille is very small, the flow uniformity and protection level should be the most important criteria for the lid grille optimization.
The pressure drop is the most important criterion of the pleated filter efficiency, more important than the geometric surface area. It shows the real, effective surface, which is utilized by air to pass through the filter. One of the most important parts of the optimization is the correct selection of pleats height and spacing. Both the calculations and the experiments show that for different pleat heights, there is a different optimal pleat count per centimeter. Pleats with very small spacing can work worse than the flat filter.
The unsteady simulations, which follow the human breathing pattern, show quite high peak values of pressure drop both in the pleated filter and in the absorbent cartridge. Compared with the steady continuous simulations the average value of the pleats pressure drop increased by about 3% and the average value of the absorbent pressure drop increased by about 9%, which could be explained by the faster response of the thin material of the pleated filter comparing with a thick layer of the absorbent.
Very important is the fact that during the simulations with different pleat heights, the values of the optimal pleat count per centimeter remained practically unchanged compared to the analysis based on the steady continuous flow. This approves the possibility of applying the mathematical shape optimization based on the steady calculations, which are much less time demanding.


