Article

Fluid Flow and Structural Numerical Analysis of a Cerebral Aneurysm Model

1
Instituto Politécnico de Bragança, ESTiG, C. Sta. Apolónia, 5300-253 Bragança, Portugal
2
Mechanical Engineering and Resource Sustainability Center (MEtRICs), University of Minho, Campus de Azurém, 4800-058 Guimarães, Portugal
3
ALGORITMI Research Centre, University of Minho, Campus de Azurém, 4800-058 Guimarães, Portugal
4
Transport Phenomena Research Center (CEFT), Faculdade de Engenharia da Universidade do Porto (FEUP), R. Dr. Roberto Frias, 4200-465 Porto, Portugal
5
Centro de Investigação de Montanha (CIMO), Instituto Politécnico de Bragança, 5300-252 Bragança, Portugal
*
Author to whom correspondence should be addressed.
Fluids 2022, 7(3), 100; https://doi.org/10.3390/fluids7030100
Submission received: 3 January 2022 / Revised: 22 February 2022 / Accepted: 28 February 2022 / Published: 7 March 2022
(This article belongs to the Special Issue Image-Based Computational and Experimental Biomedical Flows)

Abstract

:
Intracranial aneurysms (IA) are dilations of the cerebral arteries and, in most cases, have no symptoms. However, it is a very serious pathology, with a high mortality rate after rupture. Several studies have been focused only on the hemodynamics of the flow within the IA. However, besides the effect of the flow, the development and rupture of the IA are also associated with a combination of other factors such as the wall mechanical behavior. Thus, the objective of this work was to analyze, in addition to the flow behavior, the biomechanical behavior of the aneurysm wall. For this, CFD simulations were performed for different Reynolds numbers (1, 100, 500 and 1000) and for two different rheological models (Newtonian and Carreau). Subsequently, the pressure values of the fluid simulations were exported to the structural simulations in order to qualitatively observe the deformations, strains, normal stresses and shear stress generated in the channel wall. For the structural simulations, a hyperelastic constitutive model (5-parameter Mooney–Rivlin) was used. The results show that with the increase in the Reynolds number (Re), the recirculation phenomenon is more pronounced, which is not seen for Re = 1. The higher the Re, the higher the strain, displacement, normal and shear stresses values.

Graphical Abstract

1. Introduction

Intracranial aneurysms (IA) are local dilations of the intracranial arteries; their occurrence in the world population varies from 0.5% to 6% [1,2]. About 0.25% of these IAs rupture and present subarachnoid hemorrhage [3]. The mortality rate from these hemorrhages reaches 60% [4]. The literature indicates how a combination of multiple factors can lead to the onset and development of IA: genetic diseases, fungal infection, hypertension, cigarette smoke inhalation, alcohol intake and just aging [5,6]. These factors result in an alteration of the original arterial wall properties and flow behavior. Factors such as weakening of the vessel wall, hemodynamic changes and inflammatory processes can also trigger the appearance of the aneurysm, which can become a stable dilatation or rupture [7,8,9]. The interaction of these factors and complex processes that lead to aneurysm formation still need to be better understood. Thus, it is essential to study the biomechanical behavior of the blood vessel together with the behavior of blood flow to determine regions more susceptible to rupture.
An important characteristic of blood vessels is the existence of soft tissues, which have a behavior called hyperelasticity [10]. Hyperelastic materials have a mechanical behavior characterized by a high deformation before reaching the breaking strength [11,12]. Due to the risks involved, it is very difficult to analyze in vivo the biomechanical behavior of blood vessels, particularly in the region of the aneurysm [13]. However, it is possible to manufacture flow phantom biomodels for experimental tests with compatible properties and geometries [14,15]. Flow phantoms basically consist of models that mimic vascular geometry for flow analysis (rigid flow phantoms) and flow analysis and arterial wall deformation (flexible flow phantoms). These biomodels were produced in silicone rubber, as they allow optical access to the flow and also reproduce the physiological compliance of the artery [16,17]. In its manufacture, materials whose biomechanical behavior is close to the real biological material were used [18]. A frequently used material is polydimethylsiloxane (PDMS) [19,20]. PDMS has been widely used in different kinds of research fields [21,22,23,24,25,26,27] due to its excellent properties and ability to replicate reliable geometries, in addition to its high flexibility, low glass transition temperature, good chemical resistance, excellent thermal stability and biocompatibility [28].
In addition to the experimental approach, in recent years, there has been an increase in numerical hemodynamic studies using the computational fluid dynamics tool CFD [29,30,31,32,33,34]. This tool has been effective in investigating the relationship of vascular hemodynamics with the mechanisms of initiation, growth and rupture [9,35,36,37]. CFD is also used to evaluate endovascular treatments [38,39] and validate new endovascular devices [40,41]. Most of these studies use Newtonian flow models; however, blood flow does not have this type of behavior, and there is no consensus on which type of viscosity model should be adopted to model blood flow in IA [37,42]. Some studies consider that blood viscosity follows a Newtonian behavior in cerebral arteries, as shear rates are considered to be higher than the range necessary for non-Newtonian properties to become effective [37,43]. Other studies report that, for medium and large arteries, blood viscosity is practically constant, which justifies, in blood flow simulations, considering it as Newtonian [44]. However, some studies claim that Newtonian viscosity results in excessive predictions of aneurysm wall shear stress, which could compromise the effectiveness of predicting the risk of rupture [37]. Given these controversies about which type of viscosity to use, it is important to compare the type of regime for each application. In this study, numerical simulations were performed using different Reynold numbers (Re), and comparisons were made between Newtonian and non-Newtonian flow (Carreau fluid model).
Although the numerical study using the CFD tool has achieved some advances in the understanding of IAs, they have some limitations, most of these studies use rigid vessel wall aneurysm models, and in reality, there is an interaction of blood flow with the vessel wall. Endothelial cells present in vessel walls detect blood flow through a variety of mechanical cell surfaces and intracellular sensors, any change in blood flow. Endothelial cells initiate different biological processes [45,46] that lead to a dynamic cycle of wall degeneration and subsequent remodeling. Studies have also shown that endothelial cells respond to WSS [47]. Thus, recent studies reported the importance of taking into account the interaction between blood flow and the vessel wall in the model of IA formation, growth and rupture [18,48]. However, there are few studies that precisely characterize this phenomenon of interaction; as such, in order to fill the little information reported in scientific publications, the aim of this work was to numerically determine the state of displacement and stress on the IA wall caused by different flow conditions. Thus, in order to characterize the mechanical behavior of biological tissues under different flow conditions, numerical simulations were performed using the Mooney–Rivlin constitutive model that mathematically describes hyperelastic materials [49].
In this work, numerical simulations were performed by combining both fluid flow and structural analysis [50,51] using Ansys® software. The fluid flow analysis simulates the blood flow inside the vessels, and the resulting pressure in the vessel wall was analyzed for mechanical deformations occurring in the vessel wall as well as in the aneurysm. The existence or absence of the recirculation phenomenon in different Reynolds numbers (Re) was studied, and it was possible to visualize and analyze the development of the fluid recirculation phenomenon inside the aneurysm. Finally, the numerical characterization of the biomechanical behavior of aneurysms was carried out.

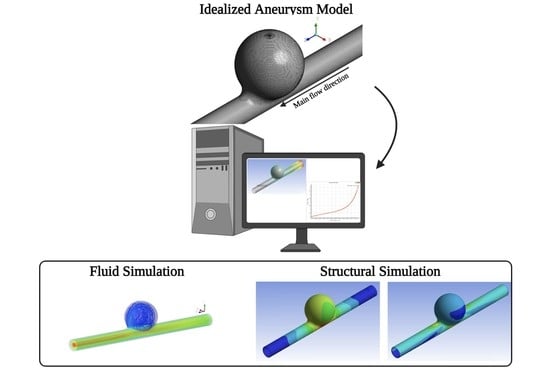
2. Problem Description

In the present study, numerical simulations of blood flow and biomechanical wall’s behavior of an in vitro channel with aneurysm, represented in Figure 1, were performed, resorting to Ansys® software. The geometry and dimensions of the idealized IA model are based on the work developed by Parlea et al. [52].
Initially, fluid dynamics simulations were performed in order to observe hemodynamic patterns such as flow recirculation inside the aneurysm and pressure gradients for different flow velocities. The fluid flow analysis also allows obtaining the pressure distribution on the channel walls, which are later used as boundary conditions in structural simulations. Structural simulations were carried out in order to analyze the biomechanical behavior of the wall through the values of displacement, strain and stress.

2.1. Fluid Flow Simulations

For flow simulations, both continuity and Navier–Stokes equations were solved using the finite volume commercial software Fluent, Ansys 2020 R2.
The steady and incompressible regime and rigid walls were prescribed. Simulations were carried out considering and discarding the non-Newtonian properties of blood, which permits evaluating the impact of non-Newtonian characteristics of blood in the properties of studied flows. As constitutive equations, Newtonian and Carreau models were used, the last one being described by Equation (1):
η = η + ( η 0 η ) [ 1 + ( λ γ ˙ ) 2 ] ( n 1 ) / 2
where η is the viscosity, η0 is the zero viscosity, η is the infinite viscosity, λ is the characteristic time (the inverse of the shear rate for which pseudoplastic behavior begins), n is the power index and γ ˙ is the shear rate. For blood, parameters of Equation (1) assume the values η0 = 0.056 Pa·s, η = 0.00345 Pa·s, λ = 3.313 s and n = 0.3568 [26]. In the case of the Newtonian model, blood viscosity considered was 0.00345 Pa s and the density 1050 kg/m3 [26].

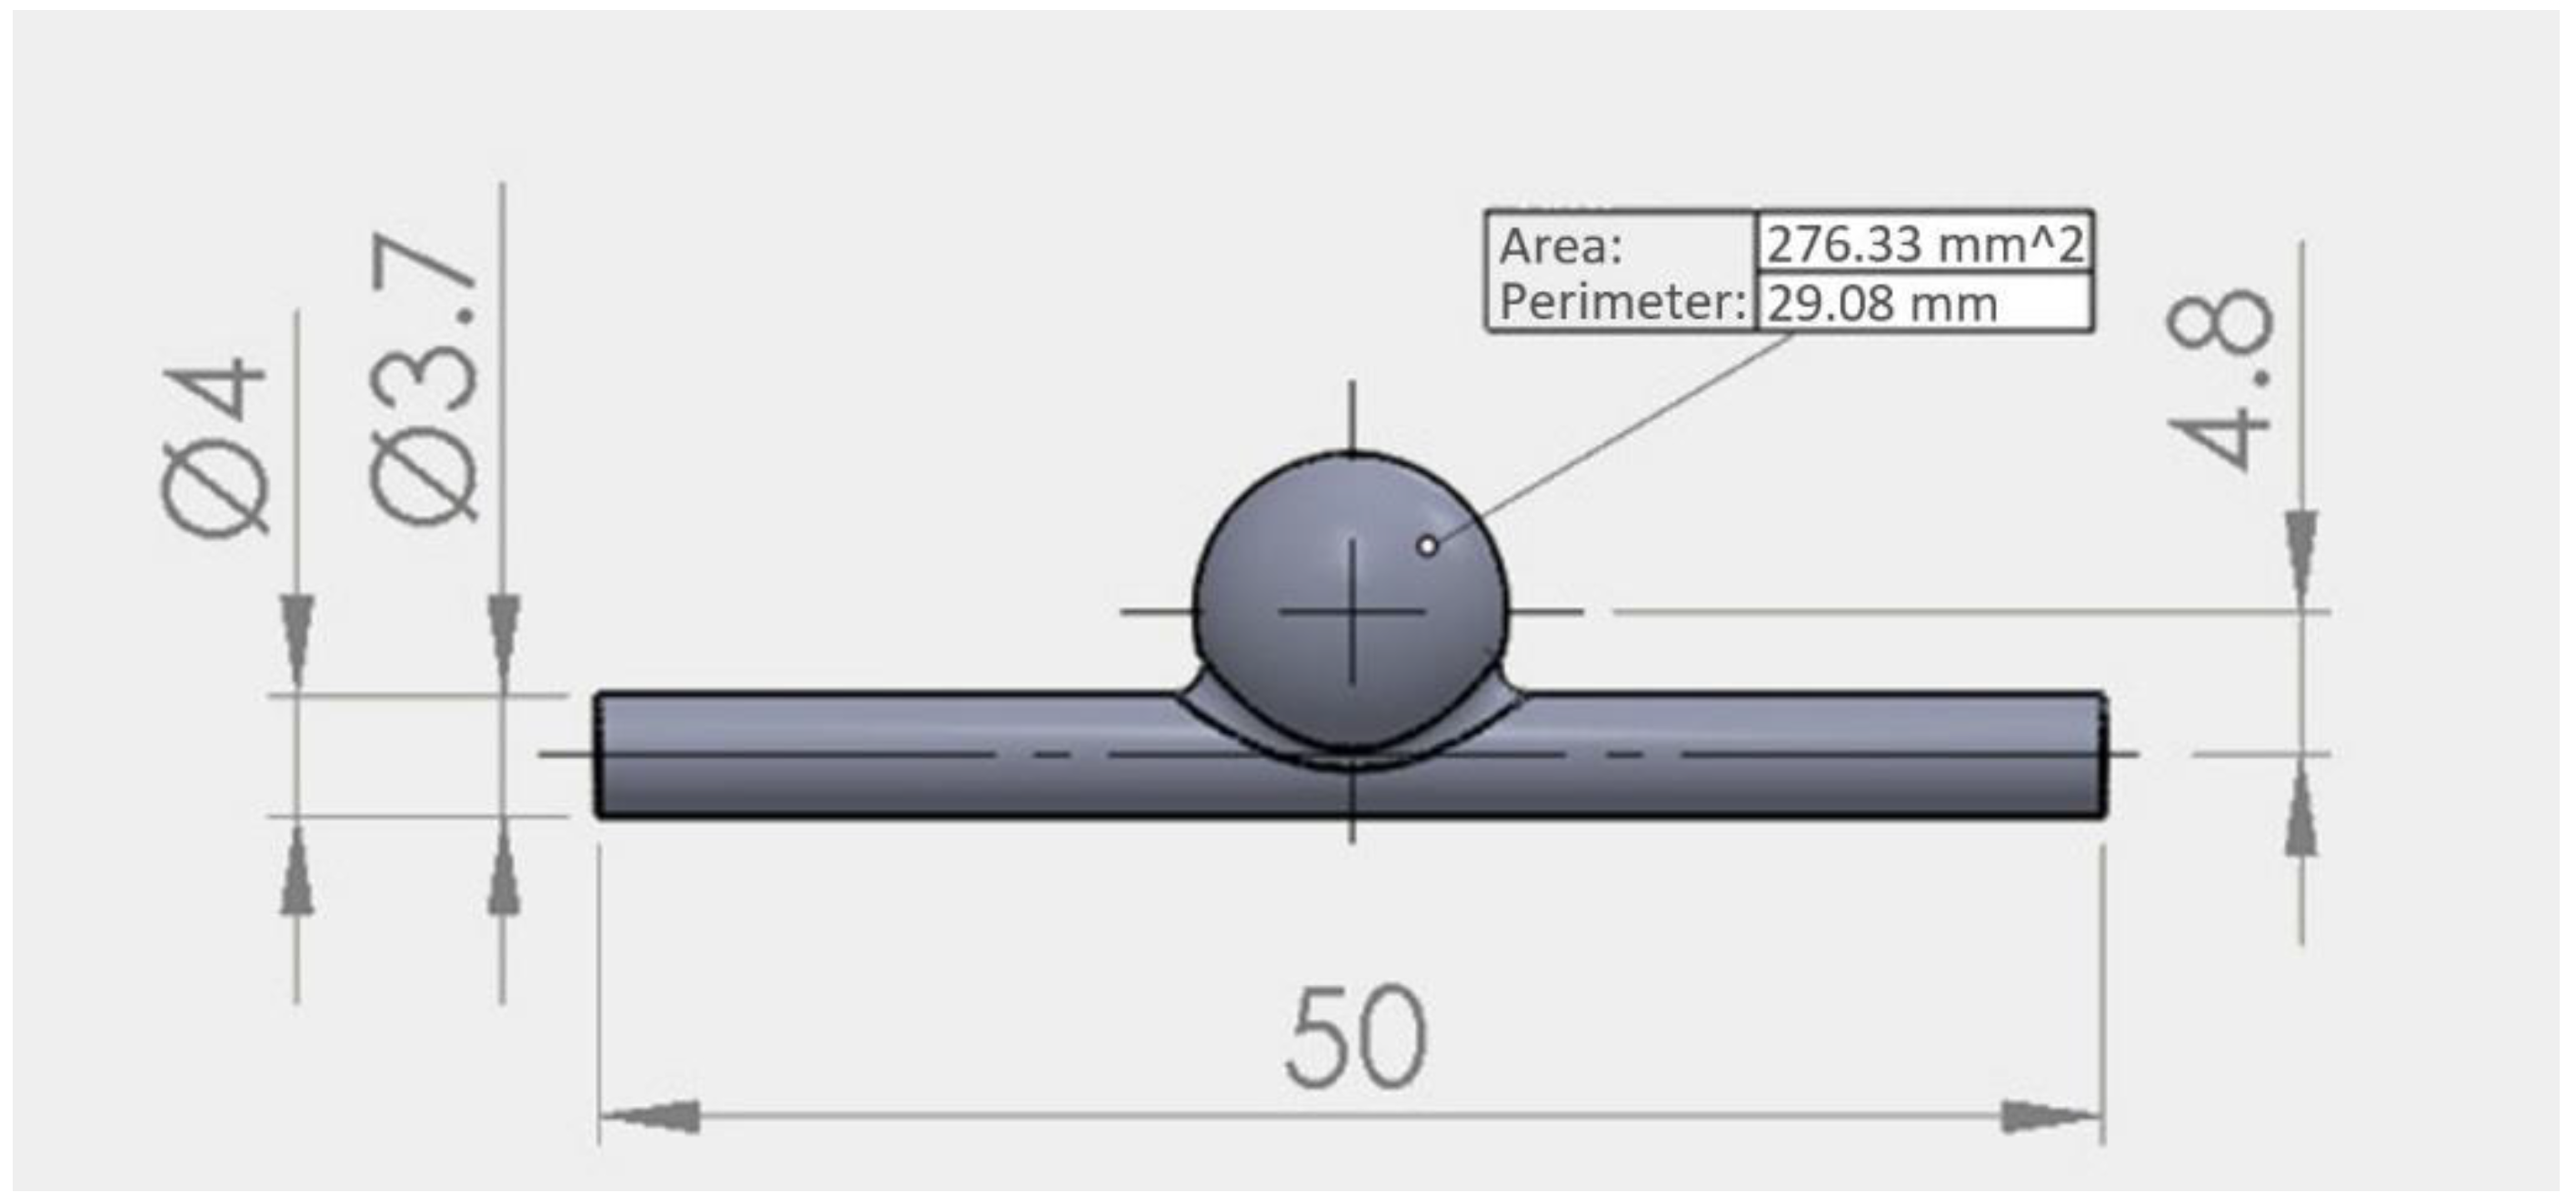
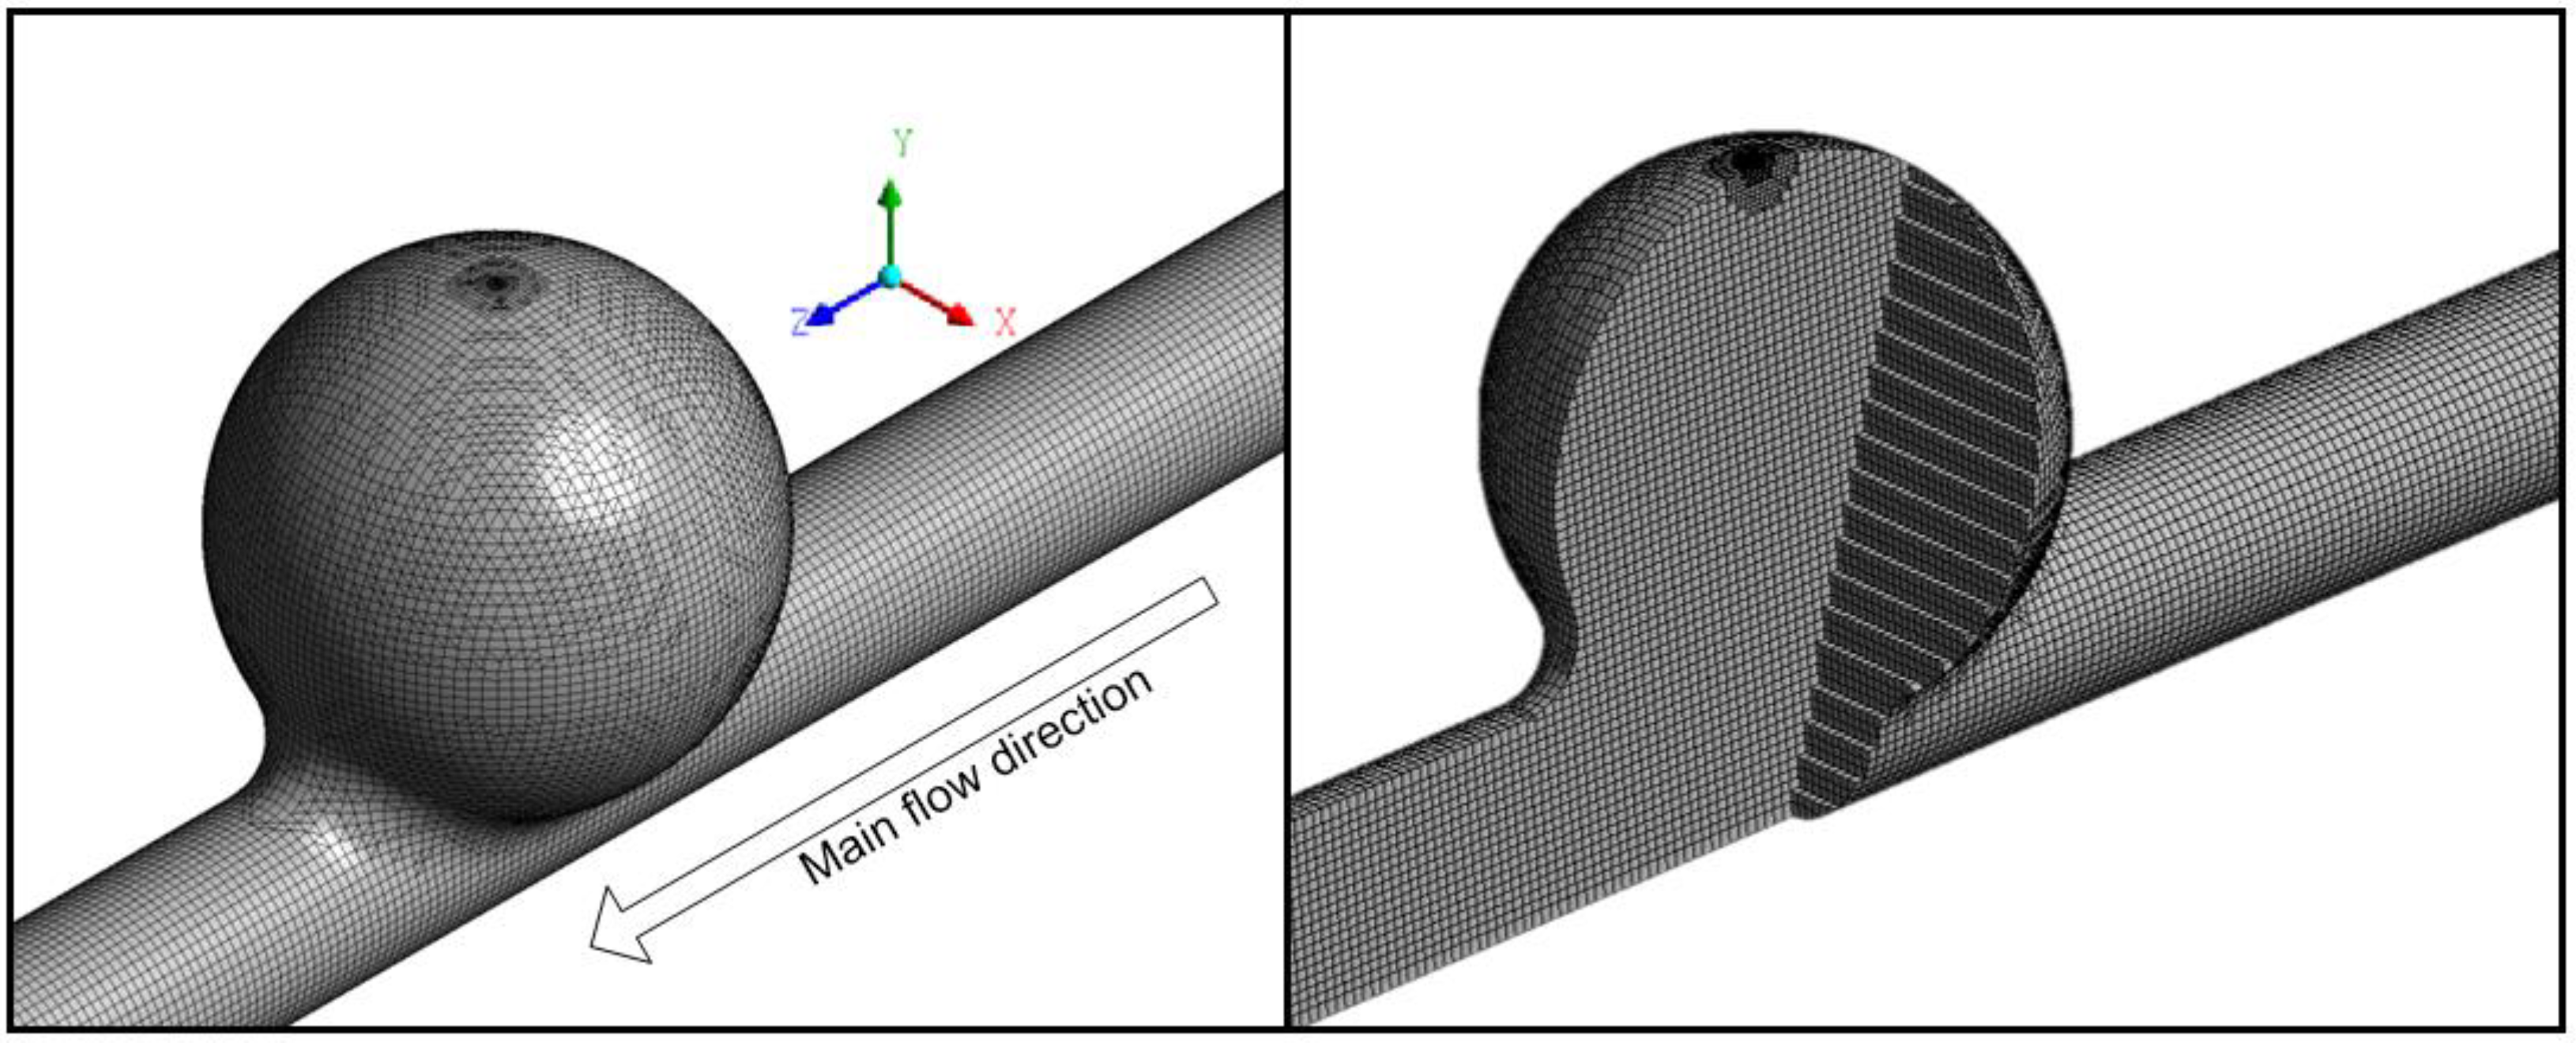
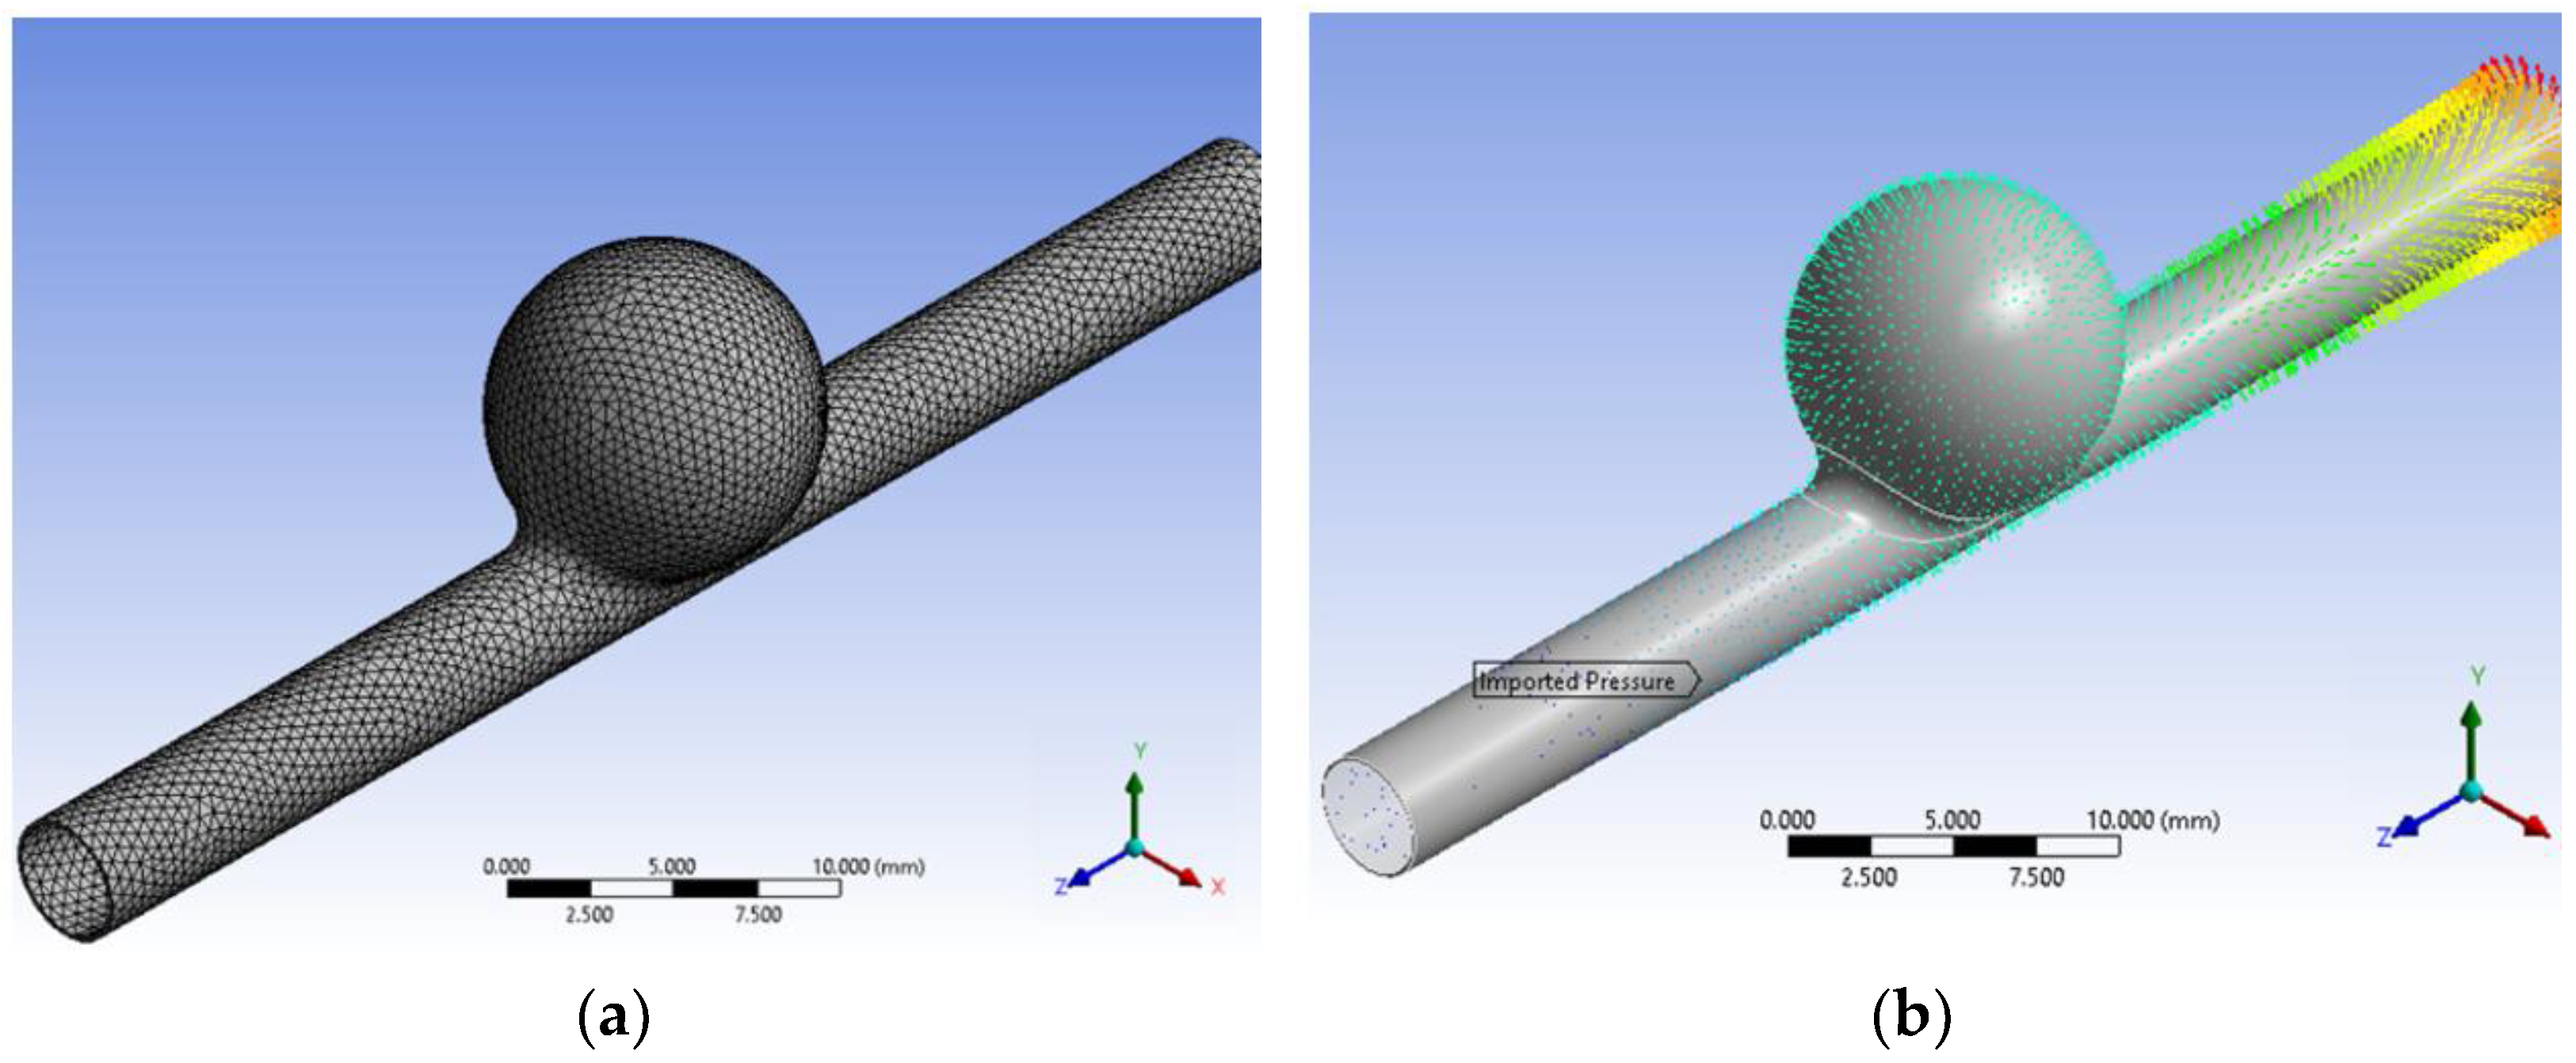
2.1.1. Geometrical Domain and Mesh

Initially, the idealized geometry of the aneurysm based on other studies [11] was drawn in the SolidWorks® CAD software, converted to Parasolid format (.x_t) and then exported to Ansys®.
For fluid flow simulation, only the fluid domain was considered (Figure 1). The analyzed geometry is a cylindrical channel with 3.7 mm in diameter and 50 mm in length, with a central sphere representing an artery and an aneurysm idealized saccular, respectively.
A mesh consisting predominantly of hexahedral elements was generated, with a total of 170,820 elements and 174,332 nodes (Figure 2). Before choosing the mesh, a preliminary mesh test was performed. A mesh with twice the number of elements was created, keeping the same spatial distribution, and then the simulations were performed. The maximum velocities values obtained by both meshes were observed, and a difference of less than 1% was found in the results, which shows that the results are independent of the mesh used.

2.1.2. Boundary Conditions and Solver

The simulations were carried out considering atmospheric pressure as the operating pressure. As boundary conditions, four distinct mean velocities were imposed in the inlet of the channel: 0.9 mm/s, 88.8 mm/s, 444 mm/s and 888 mm/s. These velocities were chosen in order to obtain the corresponding Reynolds numbers (Re): 1, 100, 500 and 1000, respectively, for Newtonian flows. These Re values were chosen in order to verify the occurrence or not of fluid recirculation and if this phenomenon would increase according to the growth of Re values. At the structural level, observe whether the deformations were proportional to the increase in Re.
The wall of the channel was assumed rigid, and as the wall velocity is zero, the non-slip condition was applied at the wall. Additionally, the gauge pressure (0 Pa) was imposed in the outlet of the channel.
The pressure-based solver was used to solve numerical integrations, as this is the most suitable for problems with incompressible fluids. Speed–pressure coupling was performed using the PISO scheme. The spatial discretization of the pressure equation was performed with the PRESTO! approximation, while the moment equations were discretized with the QUICK scheme.

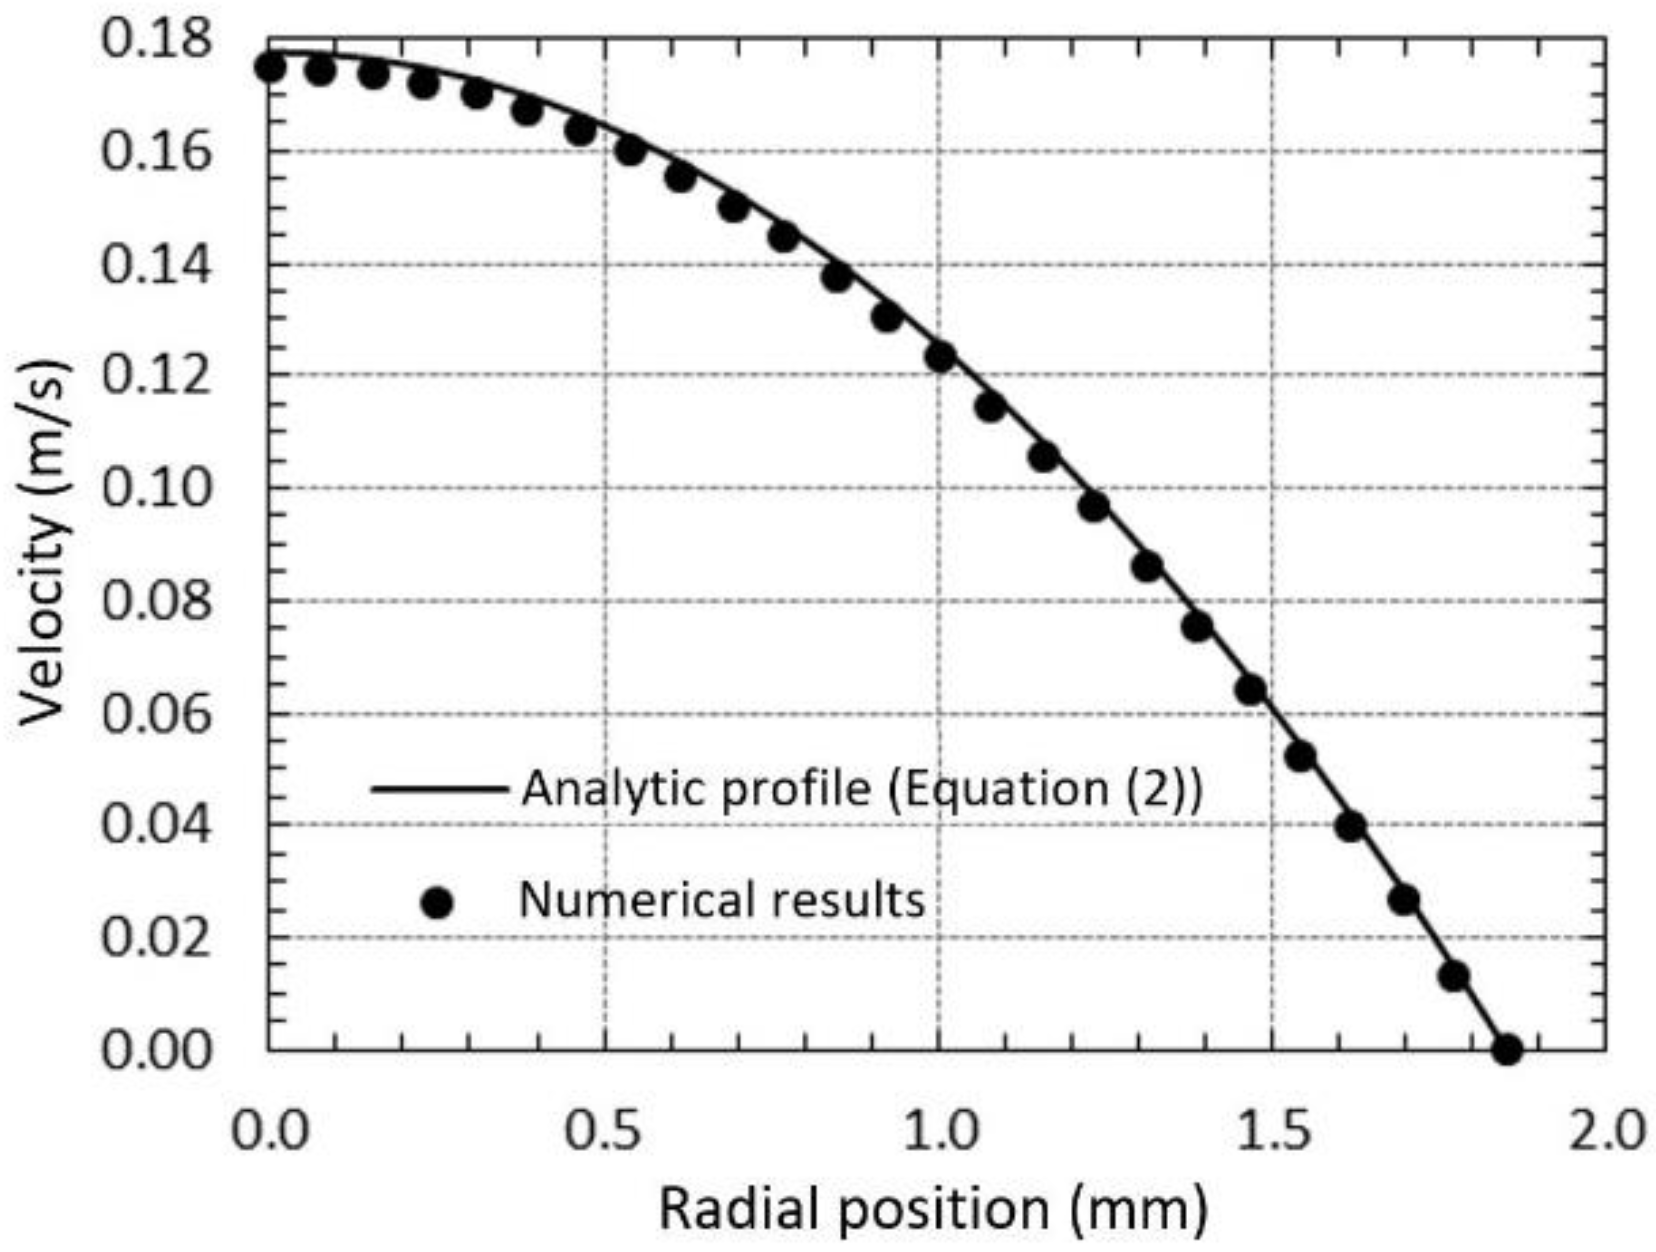
2.1.3. Model Validation

In order to validate CFD calculations, simulations were carried out for the conditions referred before in a channel similar to the one presented above but lengthier in the section before the aneurysm to guarantee a fully developed flow in that region. Two tests in that section were performed. First, velocity profiles were compared with the analytical solution for a Newtonian fully developed flow in a circular pipe which can be determined by [53]:
v ( r ) = 2 u ( 1 ( r R ) 2 )
where v is the velocity, u is the mean velocity, R is the radius of the channel and r is the radial position.
In Figure 3, it is possible to verify the good agreement between numerical results and analytic profile (mean relative error range between 2.4% and 2.6% for the three velocities), which concludes that the numerical model predicts the local properties of the studied flow well.
The second test consists of the comparison between the obtained pressure drops and predictions from the Haggen–Poiseuille equation [54]:
Δ P = 8 η L u R 2     Δ P L = 8 η u R 2
where ΔP represents the pressure drop and L is the channel length. Once again, a good agreement between pressure drop obtained by Equation (3) and numerical results was found, as shown in Table 1.

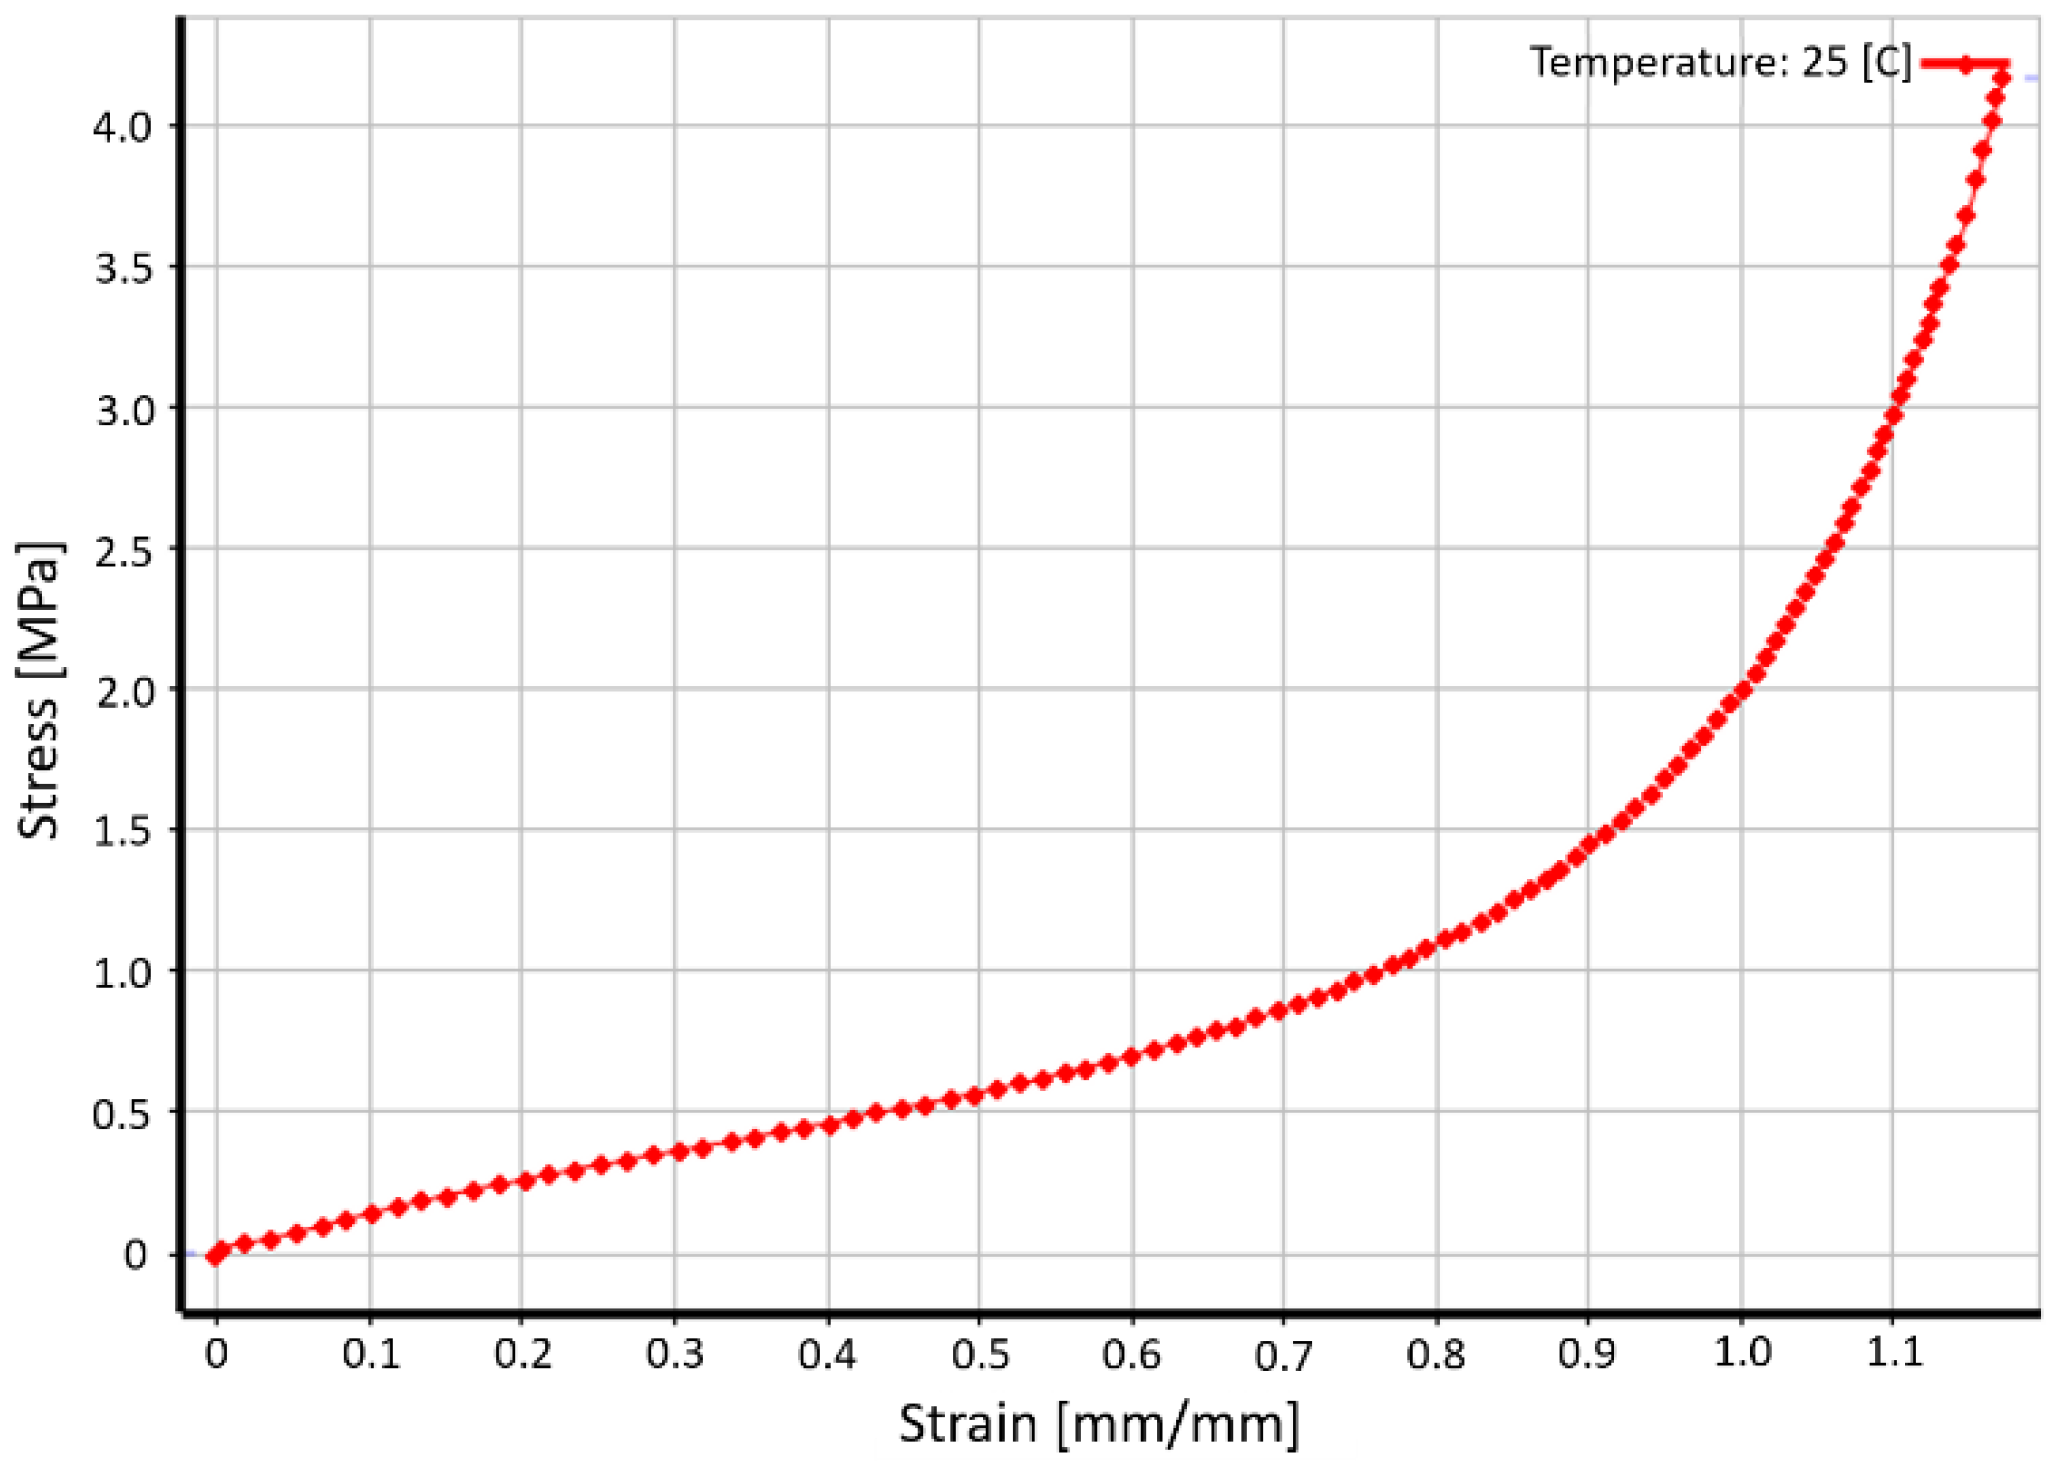
2.2. Structural Simulations

The structural simulations were performed using the static structure of the Ansys software. Initially, new material was inserted into the Engineering Data. The material considered was Polydimethylsiloxane (PDMS) Sylgard 184, as it is a hyperelastic material, as are the arteries. A stress/strain curve of the PDMS obtained by tensile testing was then inserted into the properties and approximated by a hyperelastic model previously defined in Ansys, Mooney–Rivlin parameter 5 model, which is a constitutive model adequate for this kind of simulation [55]. The Mooney–Rivlin constitutive law is described by Equation (4):
Ψ = C 10 ( I 1 3 ) + C 01 ( I 2 3 ) + C 20 ( I 1 3 ) 2 + C 11 ( I 1 3 ) ( I 2 3 ) + C 02 ( I 2 3 ) 2
where Ψ is the strain energy density function; I 1 and I 2 are the strain constants; and C 10 , C 01 , C 20 , C 11 and C 02 are the material parameters, which are determined using the data obtained experimentally by tensile test.
In Figure 4, the approximation of the mentioned curve can be seen.
The geometry for this simulation represents only the channel wall that has 0.15 mm of thickness.
As the geometry for the flow simulations, this geometry was previously drawn in Solidworks and later exported to Ansys. A tetrahedral mesh with an element size of 0.5 mm was generated, with a total of 48,931 nodes and 24,370 elements. This mesh can be seen in Figure 5a. Next, the boundary conditions were defined, fixed support was applied to the sides of the model, and then the pressure imported from fluid simulations in Fluent was applied to the inner wall of the channel. Figure 5b illustrates the pressure applied to the channel wall.
Finally, the software was configured to calculate the solutions for displacement, strain, the normal and shear stress.

3. Results

In this section, the results of the fluid flow simulations for different velocities and the results of the structural simulations are presented.

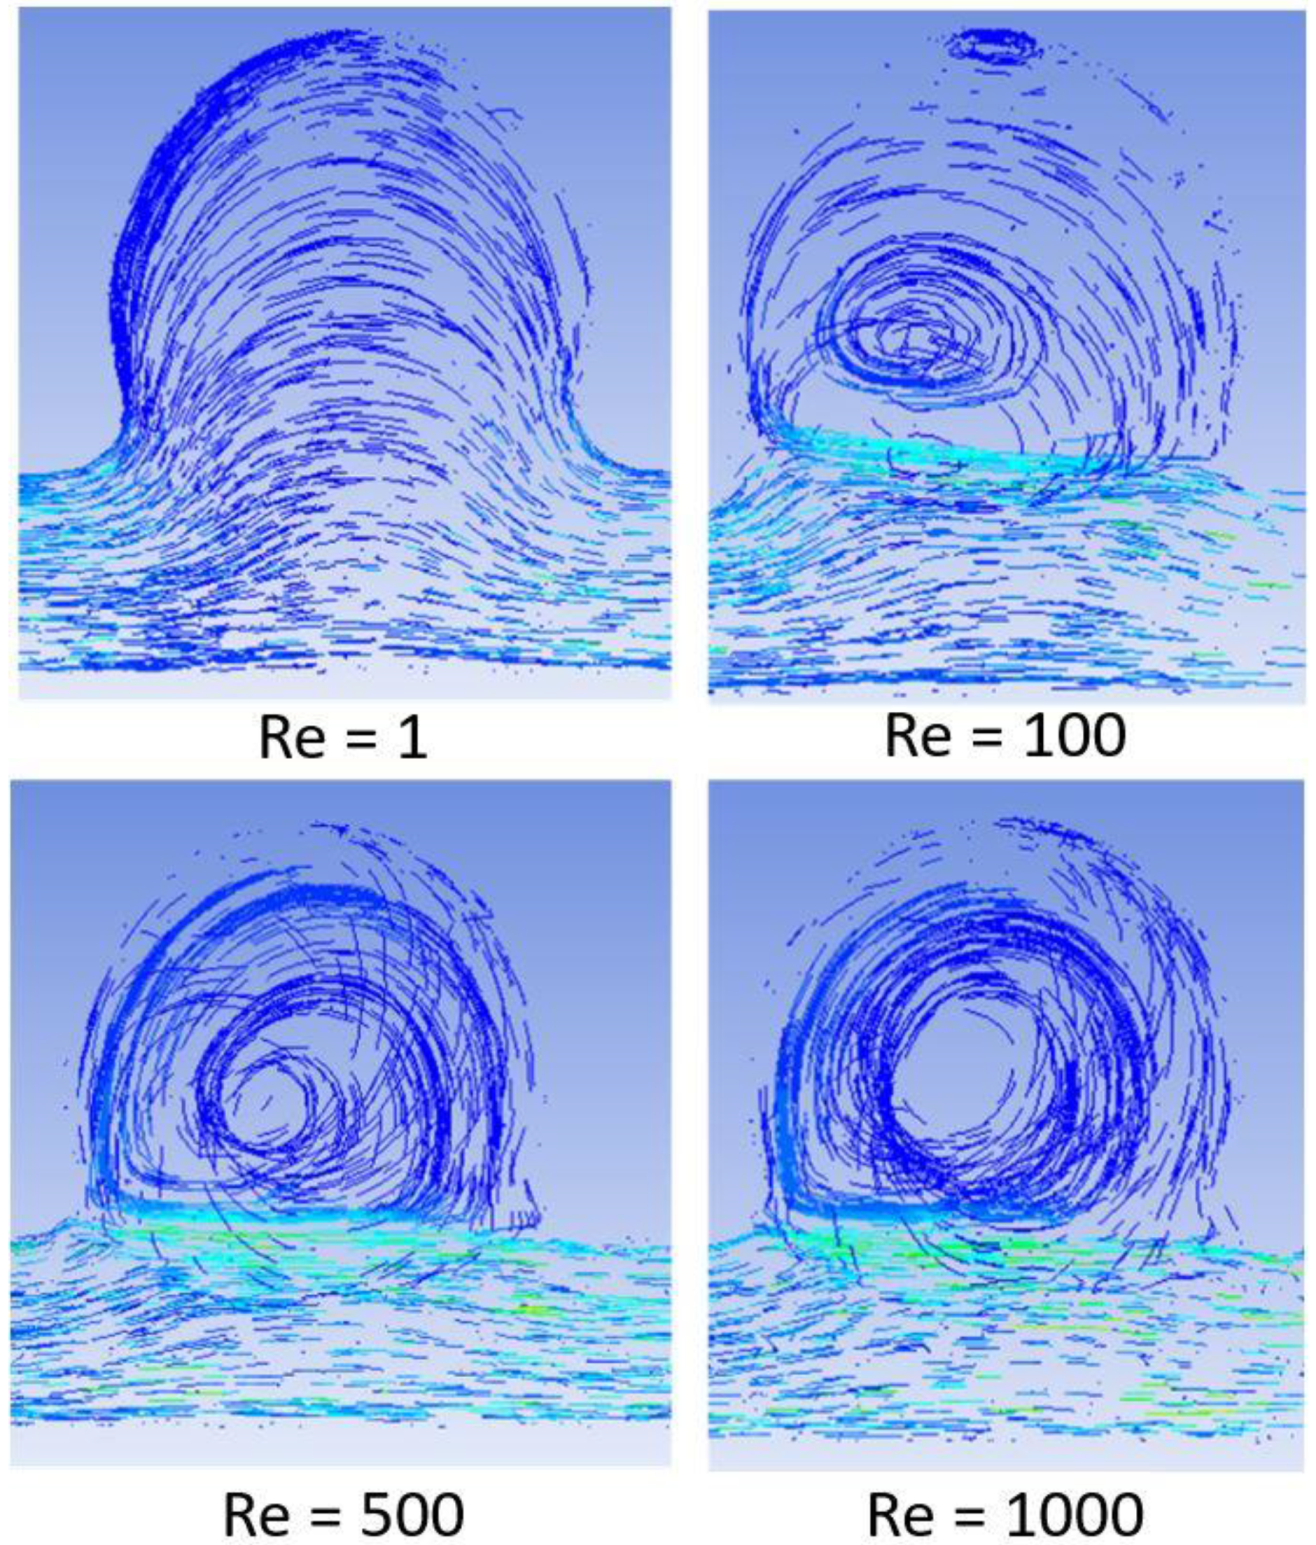
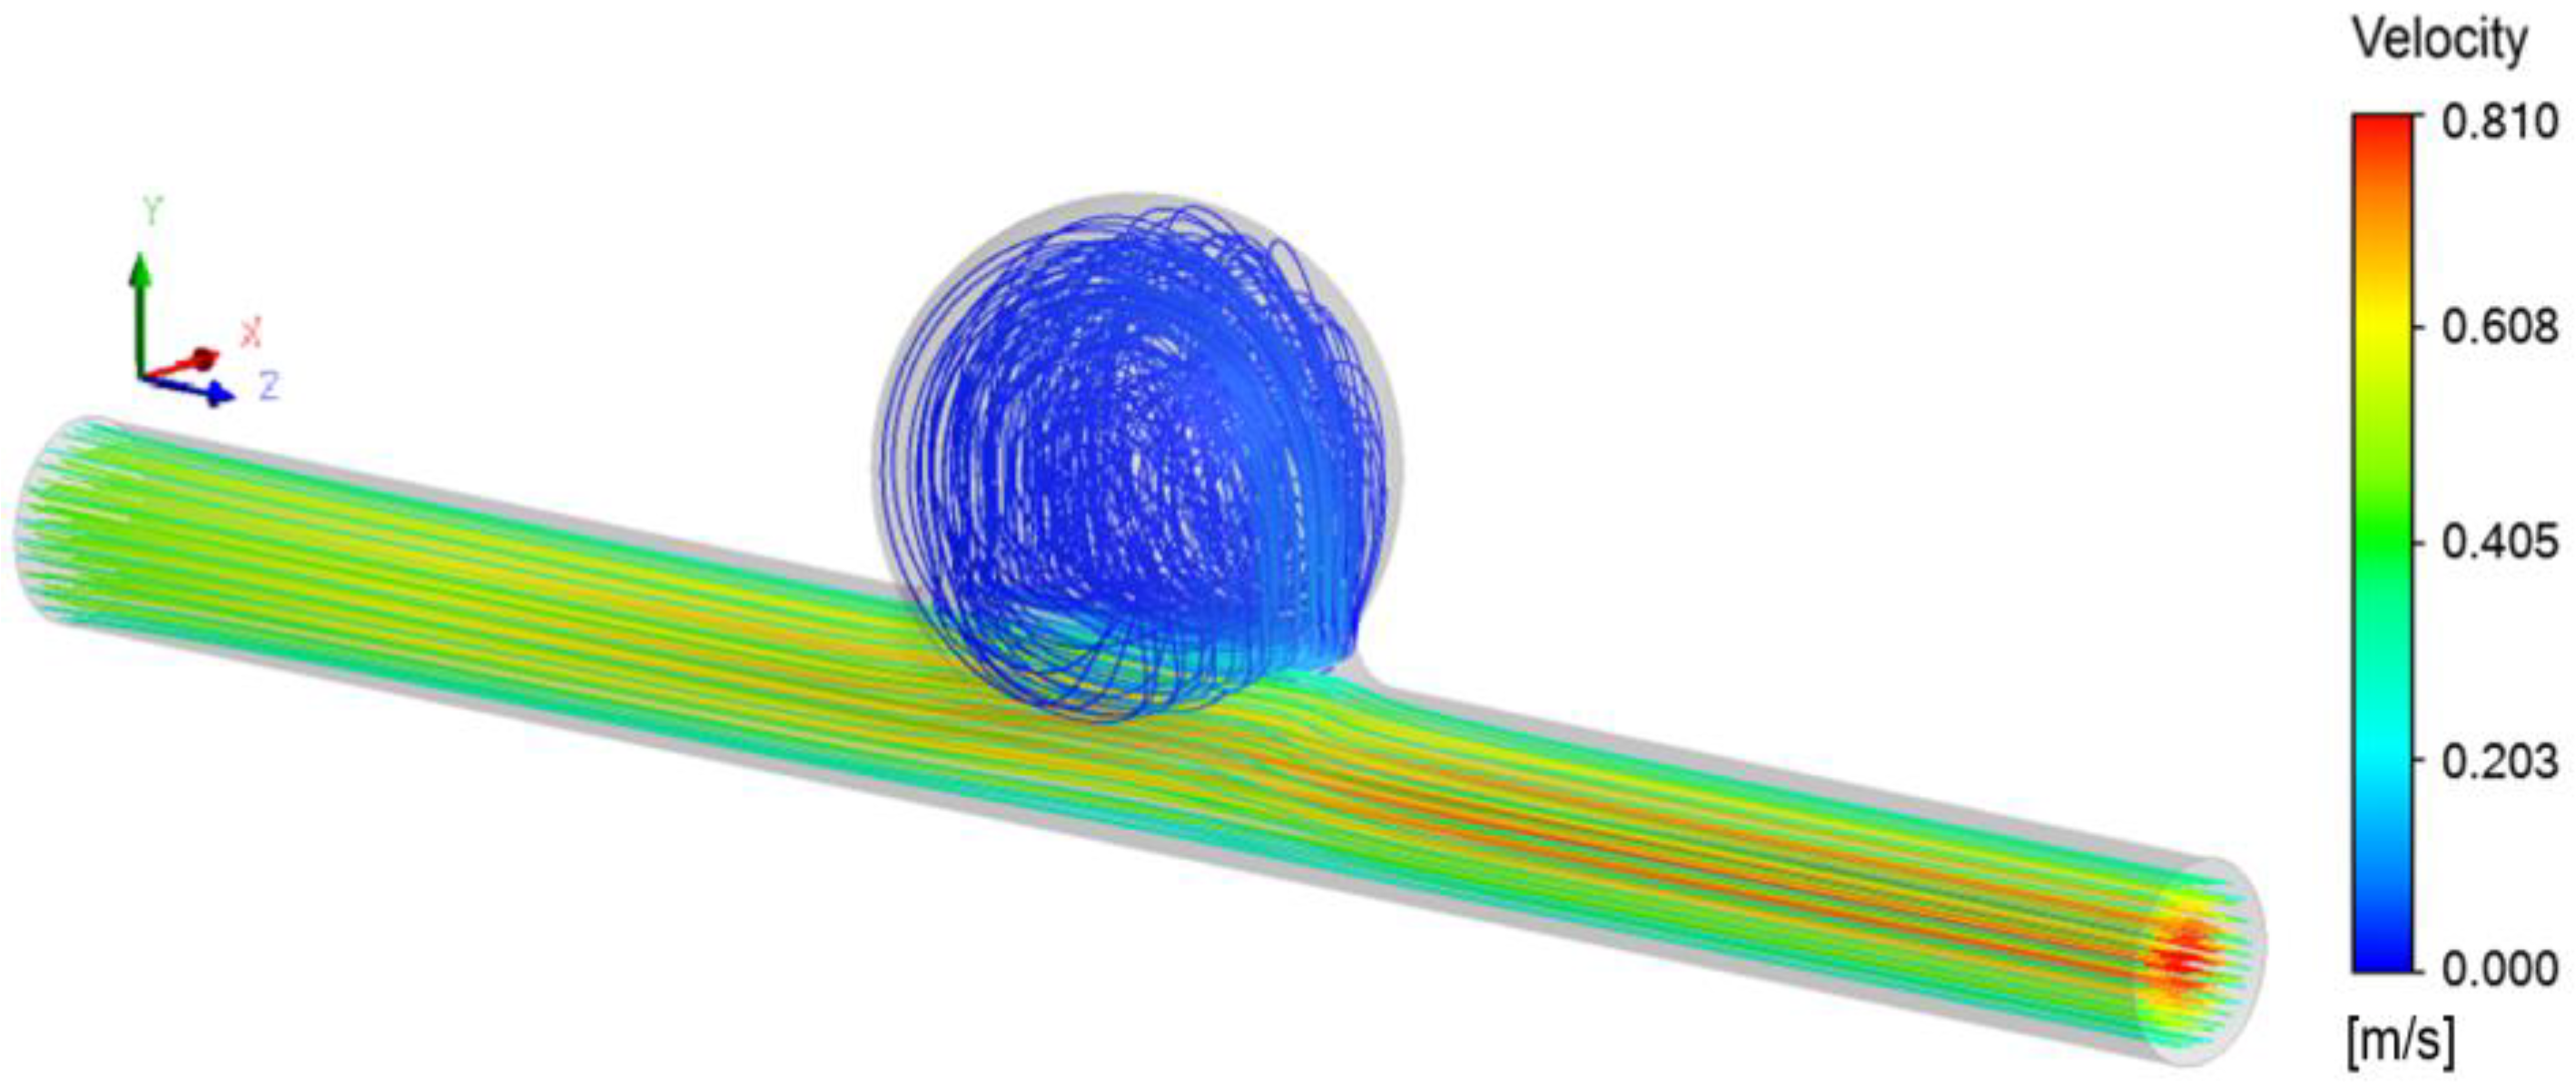
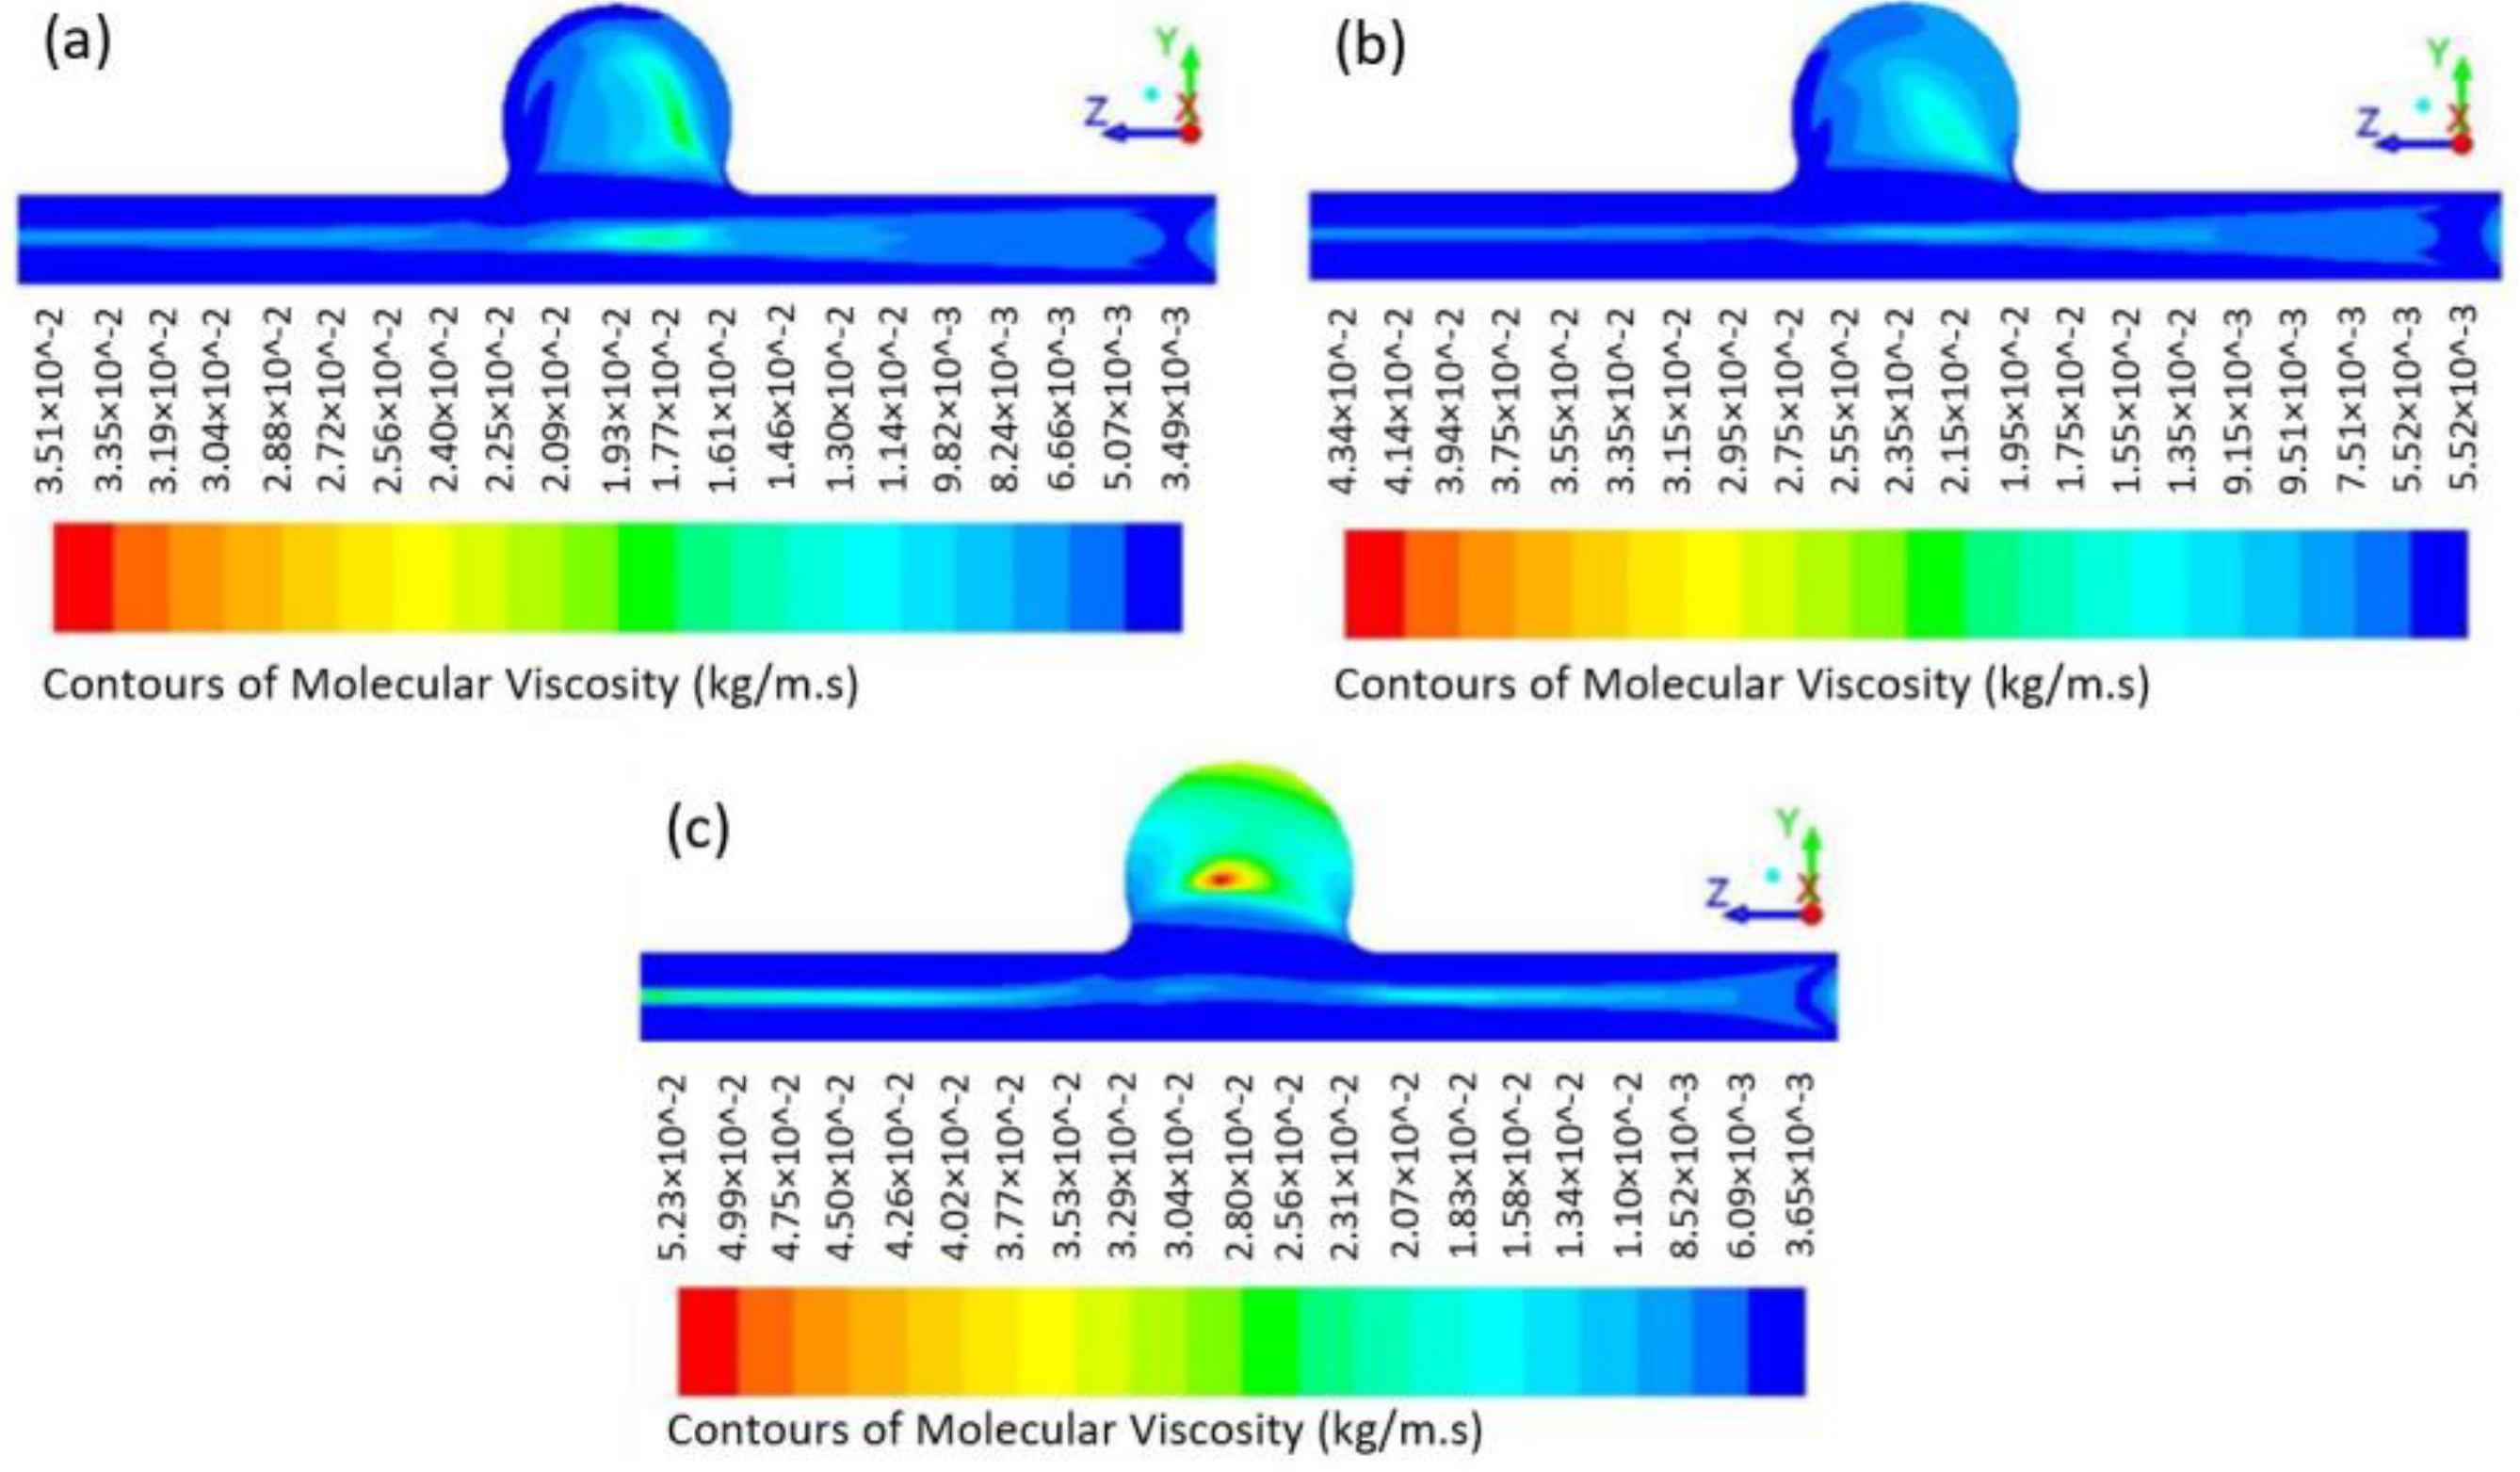
3.1. Fluid Flow Analysis

Fluid flow simulations were carried out considering the positive z-axis as the main flow direction, as shown in Figure 2.

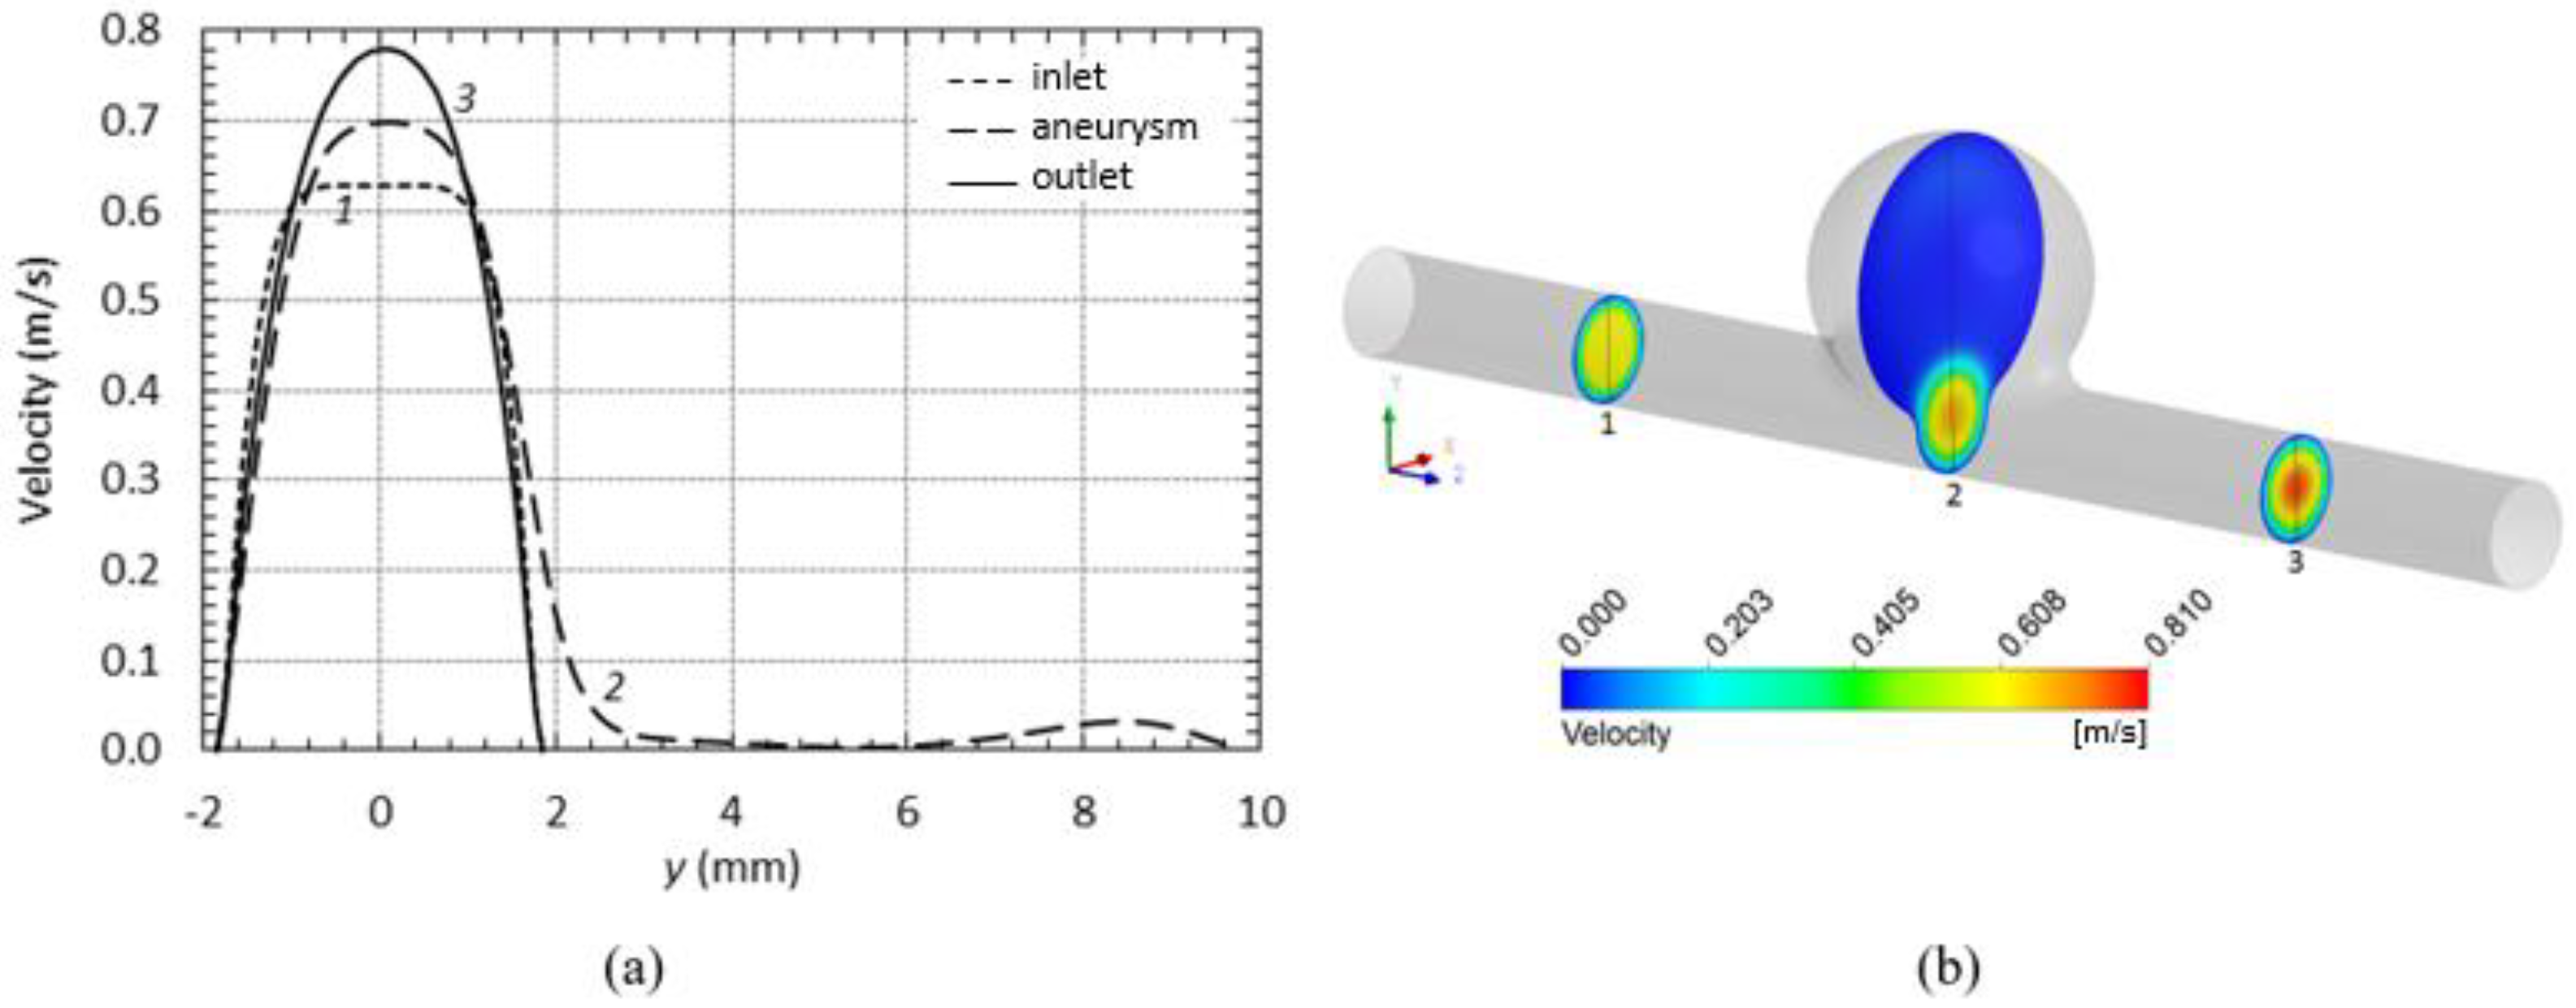
3.1.1. Flow Patterns
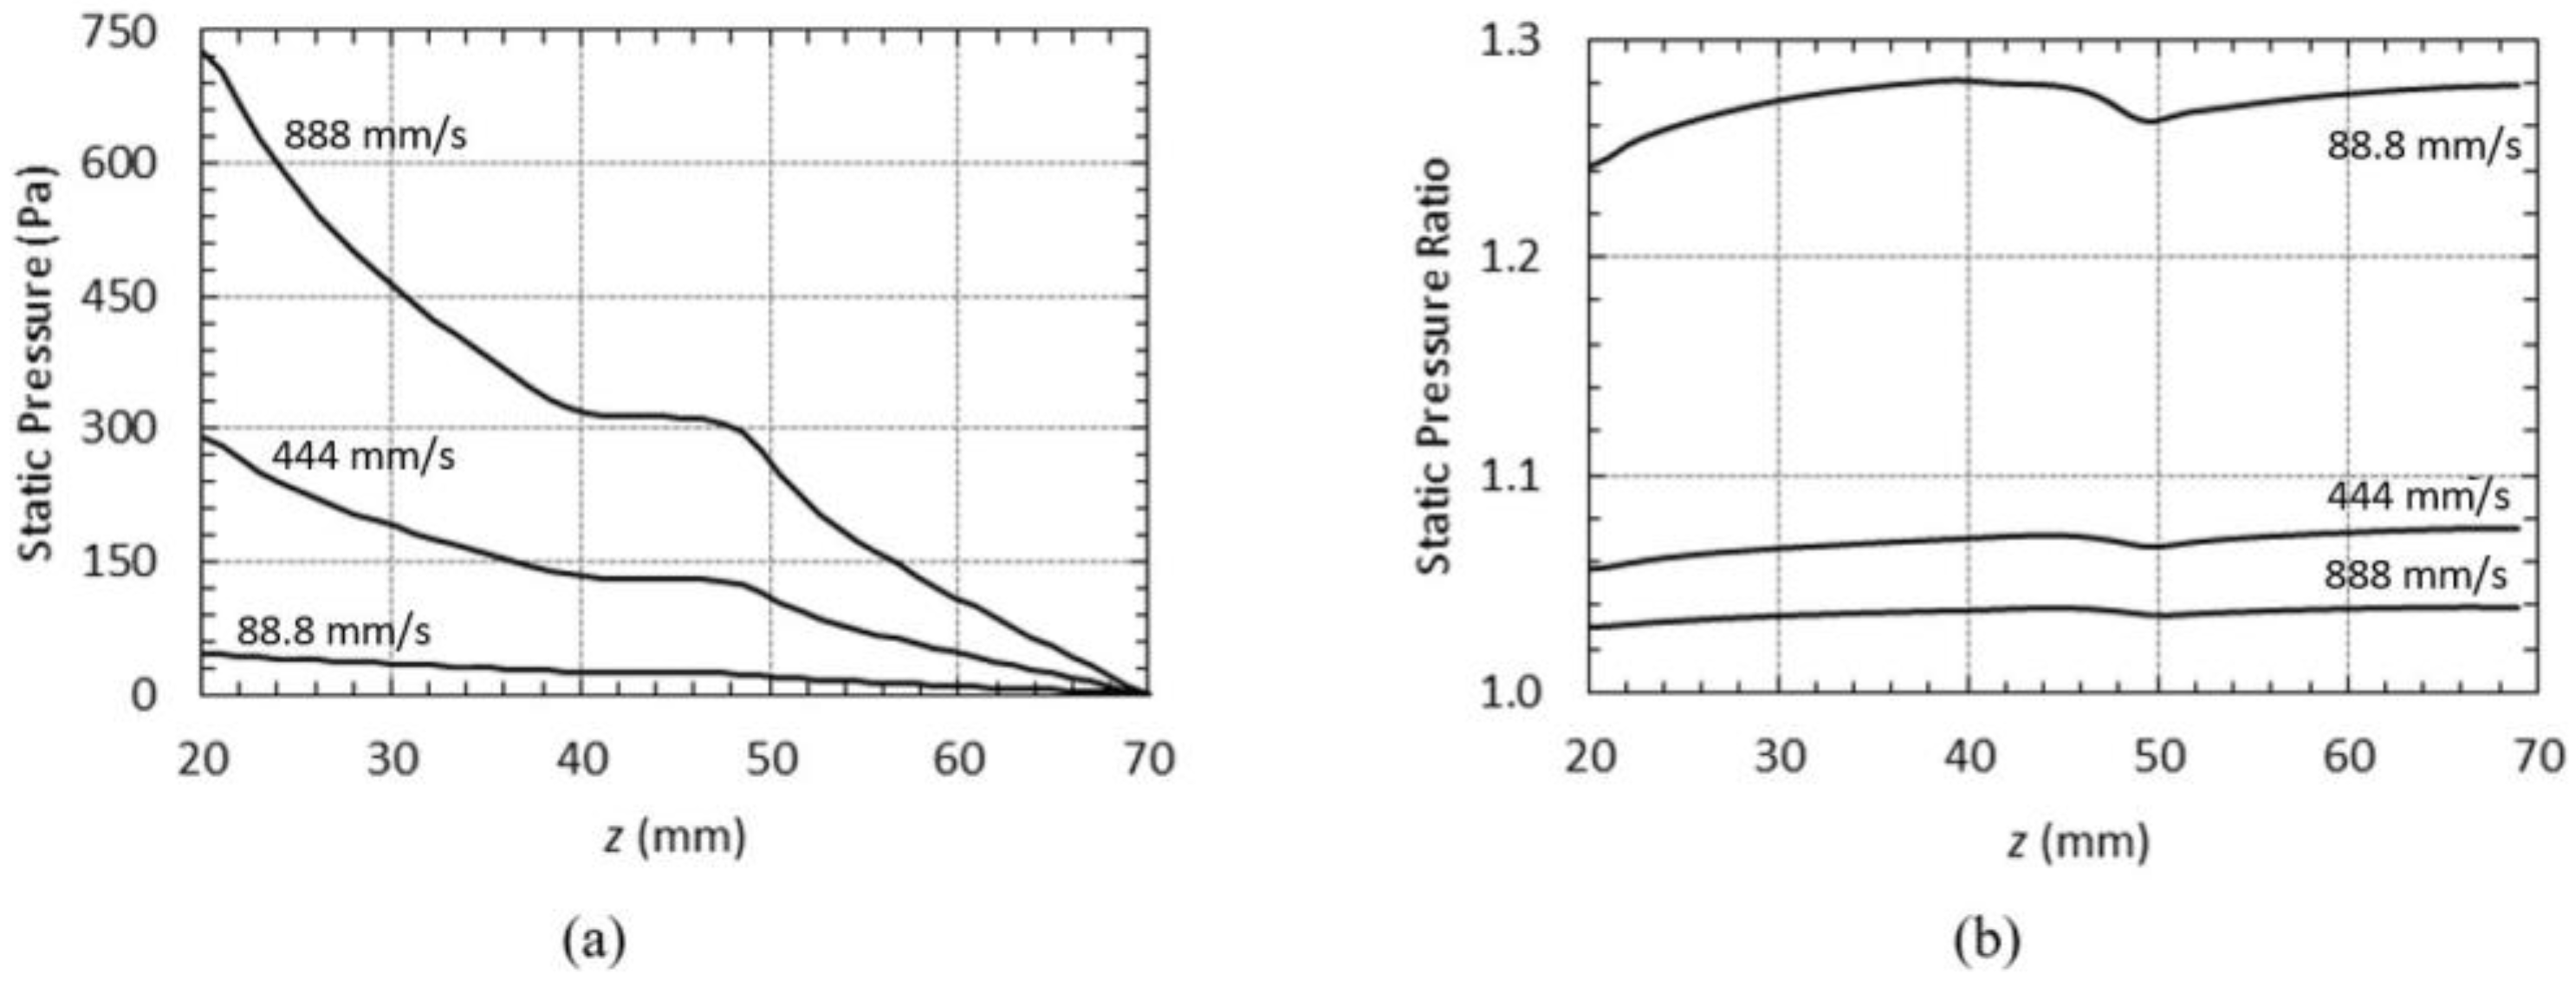
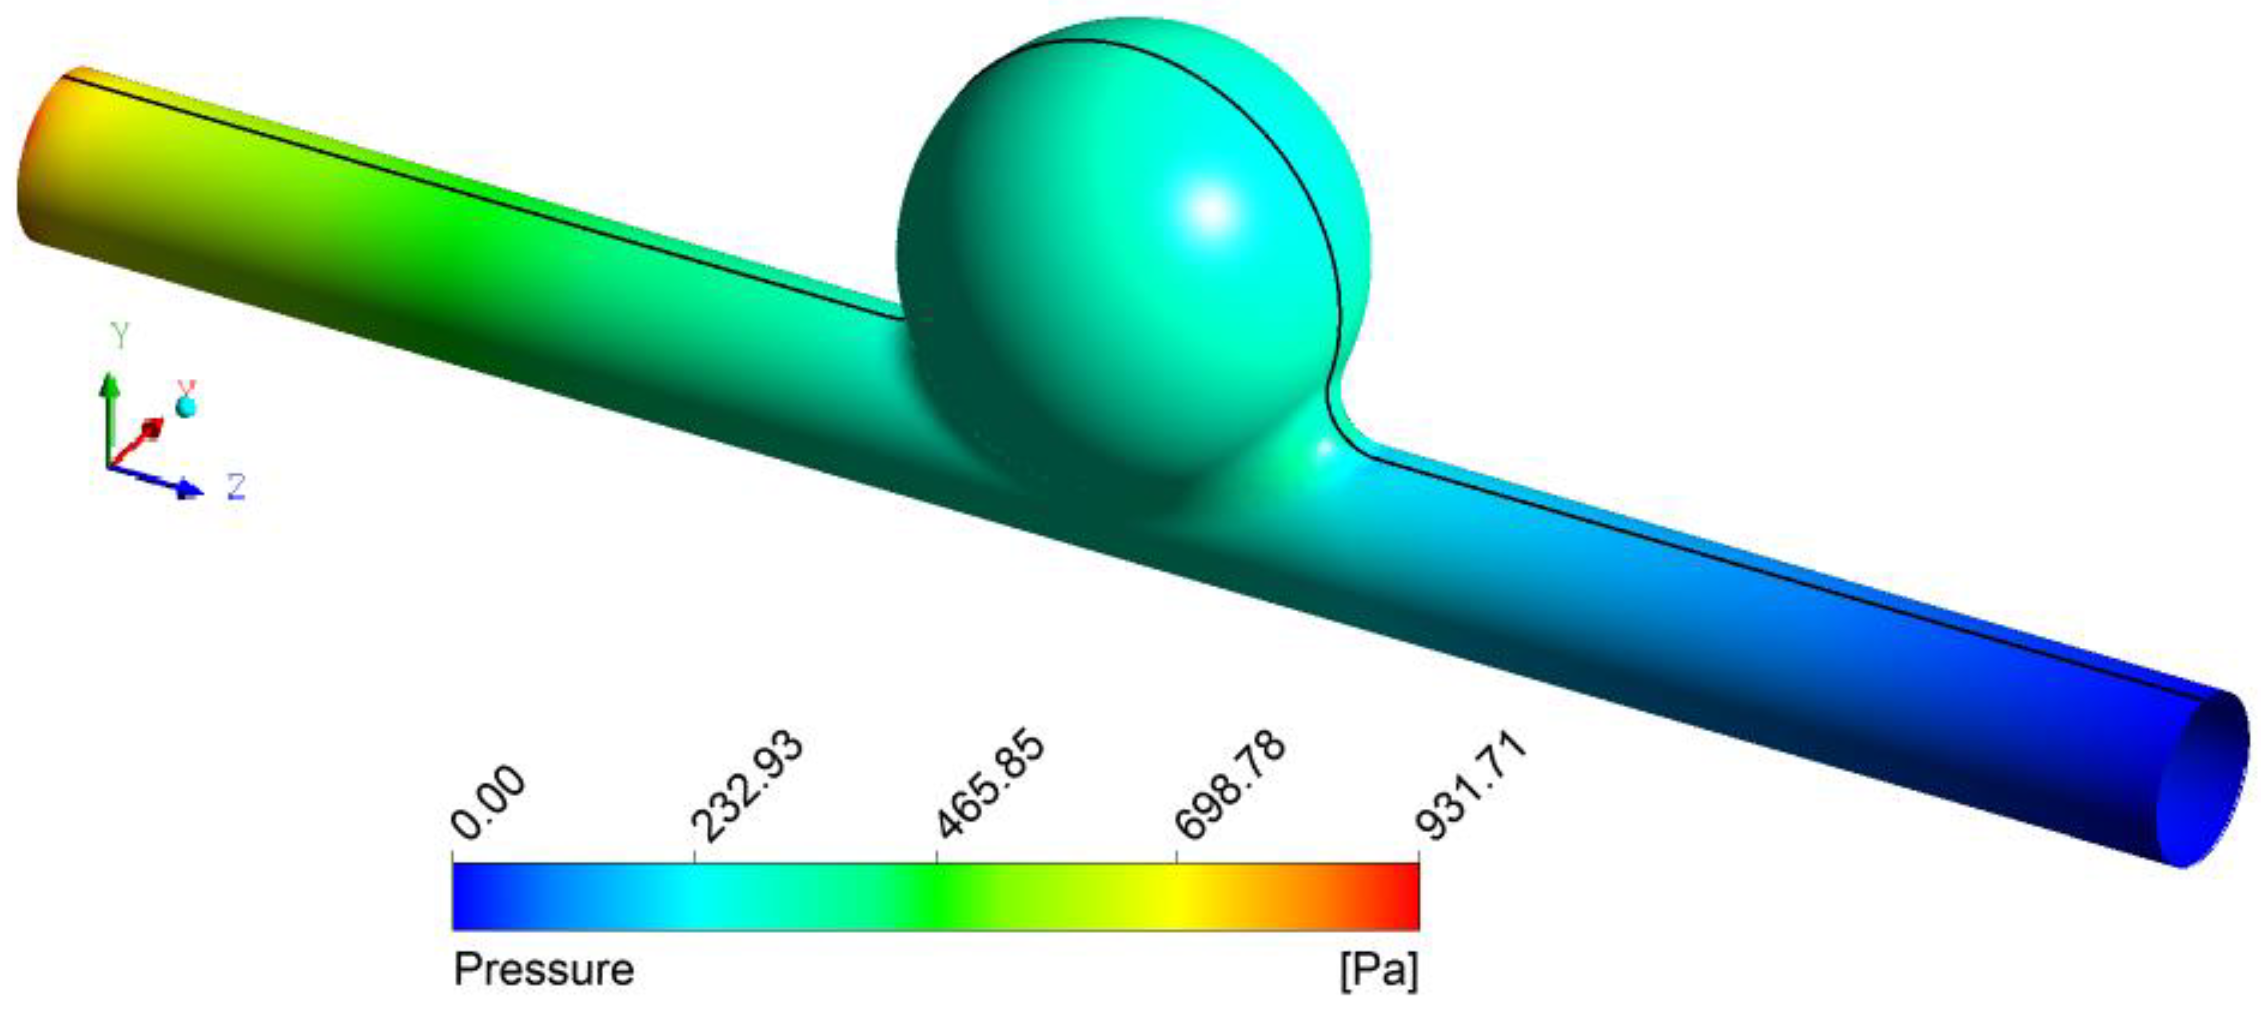
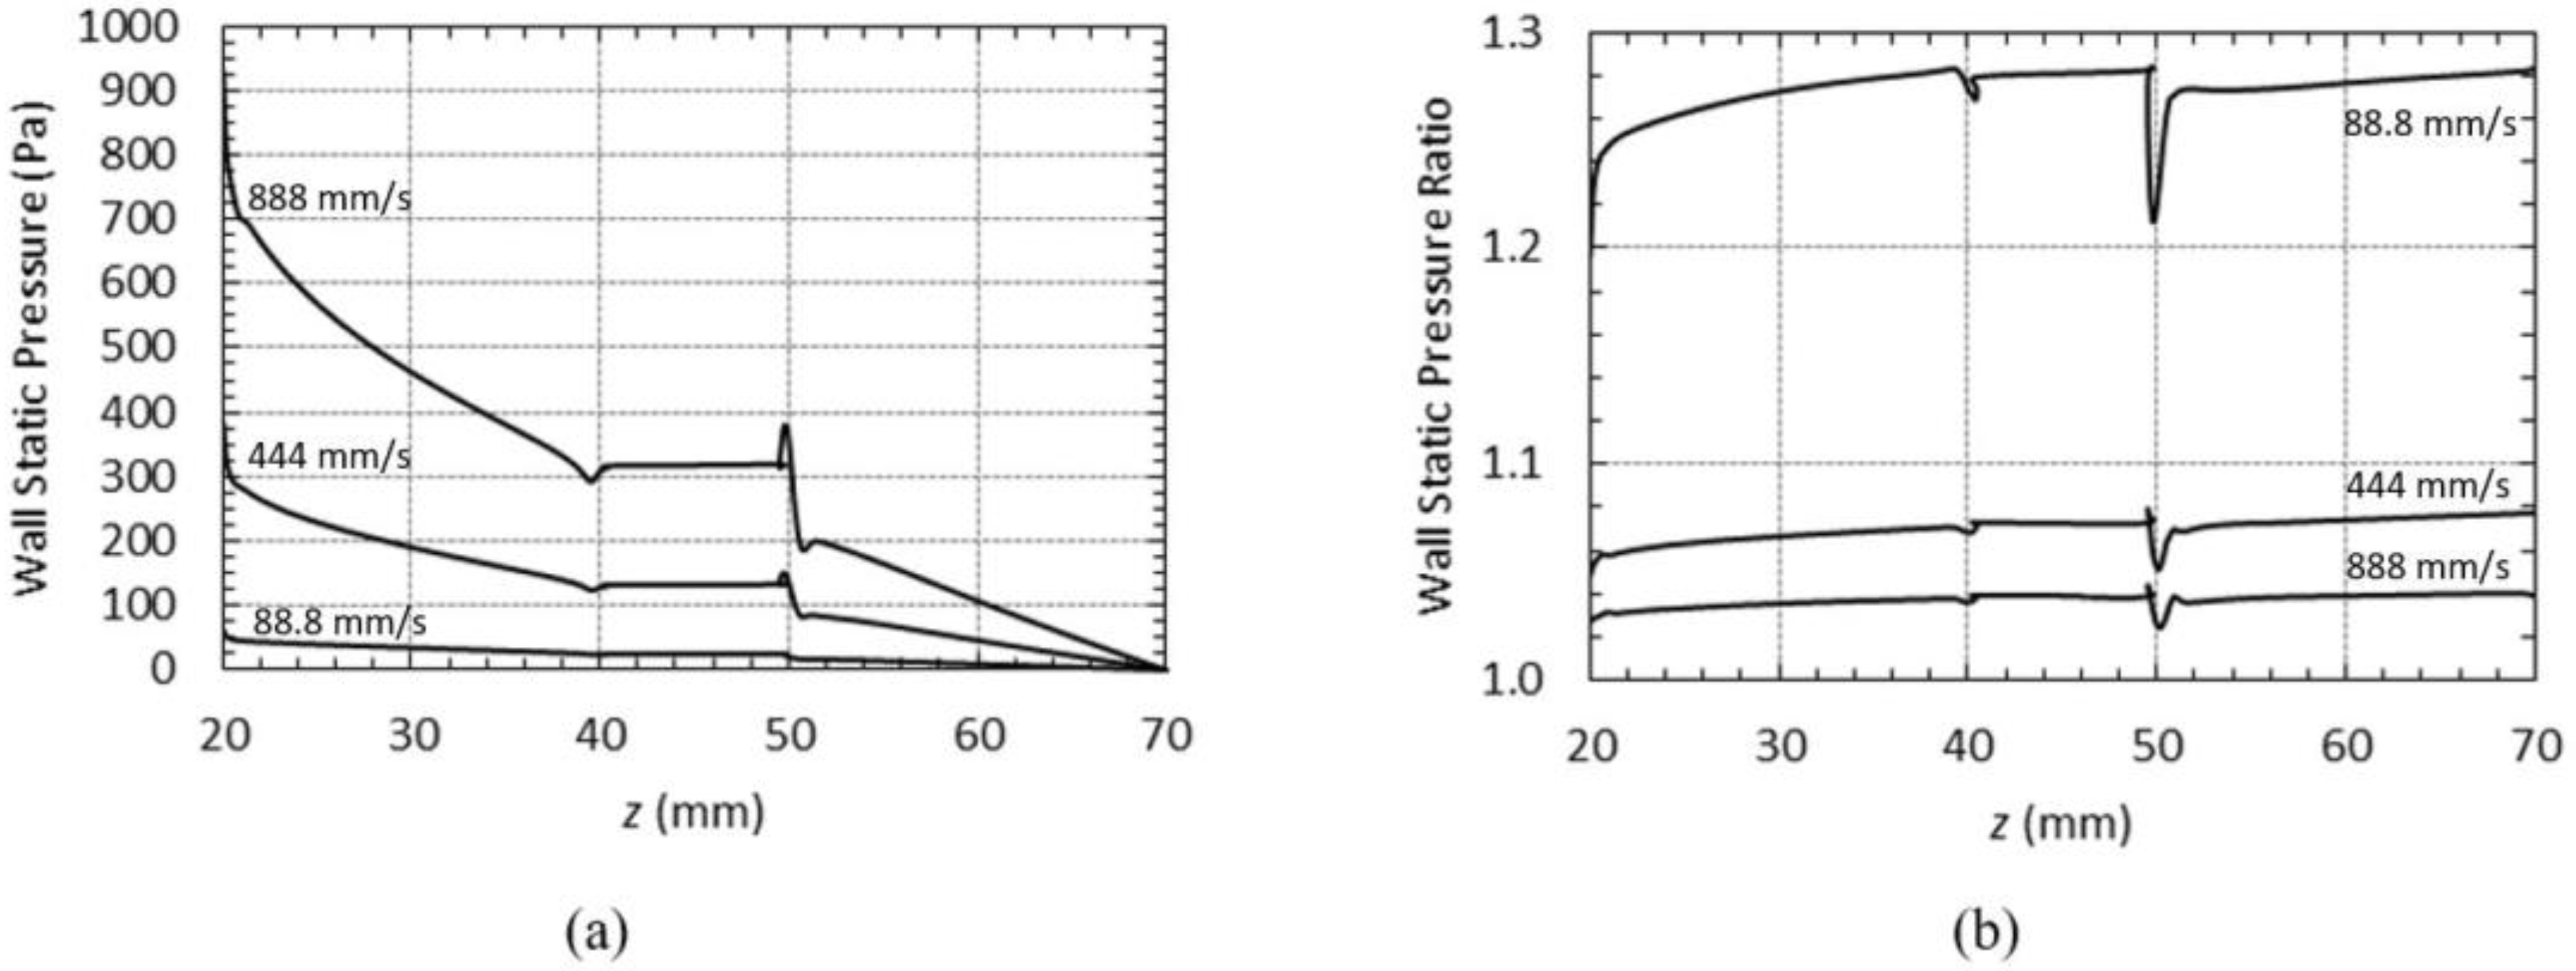
The hemodynamic pattern was analyzed, and similarities were found between all the studied flows (distinct inlet velocities and different rheological models). Figure 6 illustrates the flow behavior for the four Re analyzed in the central plane at x position (x = 0). It is clear that for Re = 1, the flow makes a smooth curvature, bypassing the geometry of the aneurysm wall; in this case, there is no recirculation. However, for the other Re, which has much higher flow velocities, recirculation inside the aneurysm is noted, which is more pronounced as the number of Re increases.
By observing the streamlines (Figure 7), two distinct sections can be considered concerning flow behavior. In a region close to the inlet and outlet of the channel, the typical behavior of laminar flow in a circular pipe was observed. However, when we move closer to the bulge, the flow suffers a deviation in the direction of protuberance and vortex formation inside it was observed. The last phenomenon is more pronounced for the higher velocities, as already shown.
In Figure 8, it is also possible to verify the behavior described before. Lines 1 and 3 exhibits the typical shape of velocity profiles in a circular pipe, that is, symmetric profiles about the center of the channel. The shape of these two profiles differs since the region before the aneurysm is clearly a region of developing flow, and after the aneurysm, the parabolic profile appears since flow is closer to a developed flow. This behavior is the reason for using a lengthier channel for the model validation. It should be noted that for lower velocity (88.8 mm/s), the difference presented and discussed in this paragraph was not found, and two parabolic profiles were observed.
The profile represented by line 2 in Figure 8 illustrates well the lower velocities in the aneurysm. Moreover, it is possible to verify a little shift of the maximum velocity in the bulge direction.
By comparing the obtained results for the same velocity inlet, considering and discarding the non-Newtonian properties of the blood, the differences observed in velocity’s magnitude could be neglected, which is the reason why the authors decide to present only an example of profiles and streamlines.

3.1.2. Pressure

As observed for velocity, pressure distribution was also revealed to be almost independent of non-Newtonian properties of the blood, as shown in Figure 9b. However, pressure is always higher when blood rheology is described by the Carreau model.
In Figure 9a, static pressure along the channel is presented for the Carreau model. As expected, pressure decrease in the flow direction, except in the region of the aneurysm where pressure remains almost constant due to the increase of the cross-section of the channel and velocity close to zero.
Pressure drop for all studied flows was determined and presented in Table 2. Analyzing the ratio between ΔP obtained, using Carreau model and Newtonian model as constitutive models, a reduction in this ratio with the increase in Re, although they are all very close to 1.
The influence of mean velocity in the ratios of pressure drop, as well as pressure, could be explained by blood viscosity obtained with the Carreau model. As shown in Figure 10, blood viscosity increase with the decrease in mean velocity and assume values higher than the Newtonian viscosity (0.00345 Pa.s), which leads to higher pressure drops.
As referred before, flow simulations were performed in order to find the blood pressure in the wall (Figure 11) and use it as a boundary condition in the wall structural analysis.
In Figure 12, static pressure obtained along the black line of Figure 11 is presented. Once again, the decrease in pressure in the main flow direction was observed, except in the region of the aneurysm. Here the pressure remains constant along with the bulge and exhibits pronounced increases/decreases in the transition of the circular channel to the aneurysm.
The minimums observed in Figure 12 are in the transition from the circular duct to the bulge, where blood viscosity obtained with the Carreau model moves closer to the Newtonian viscosity, as could be verified in Figure 10.

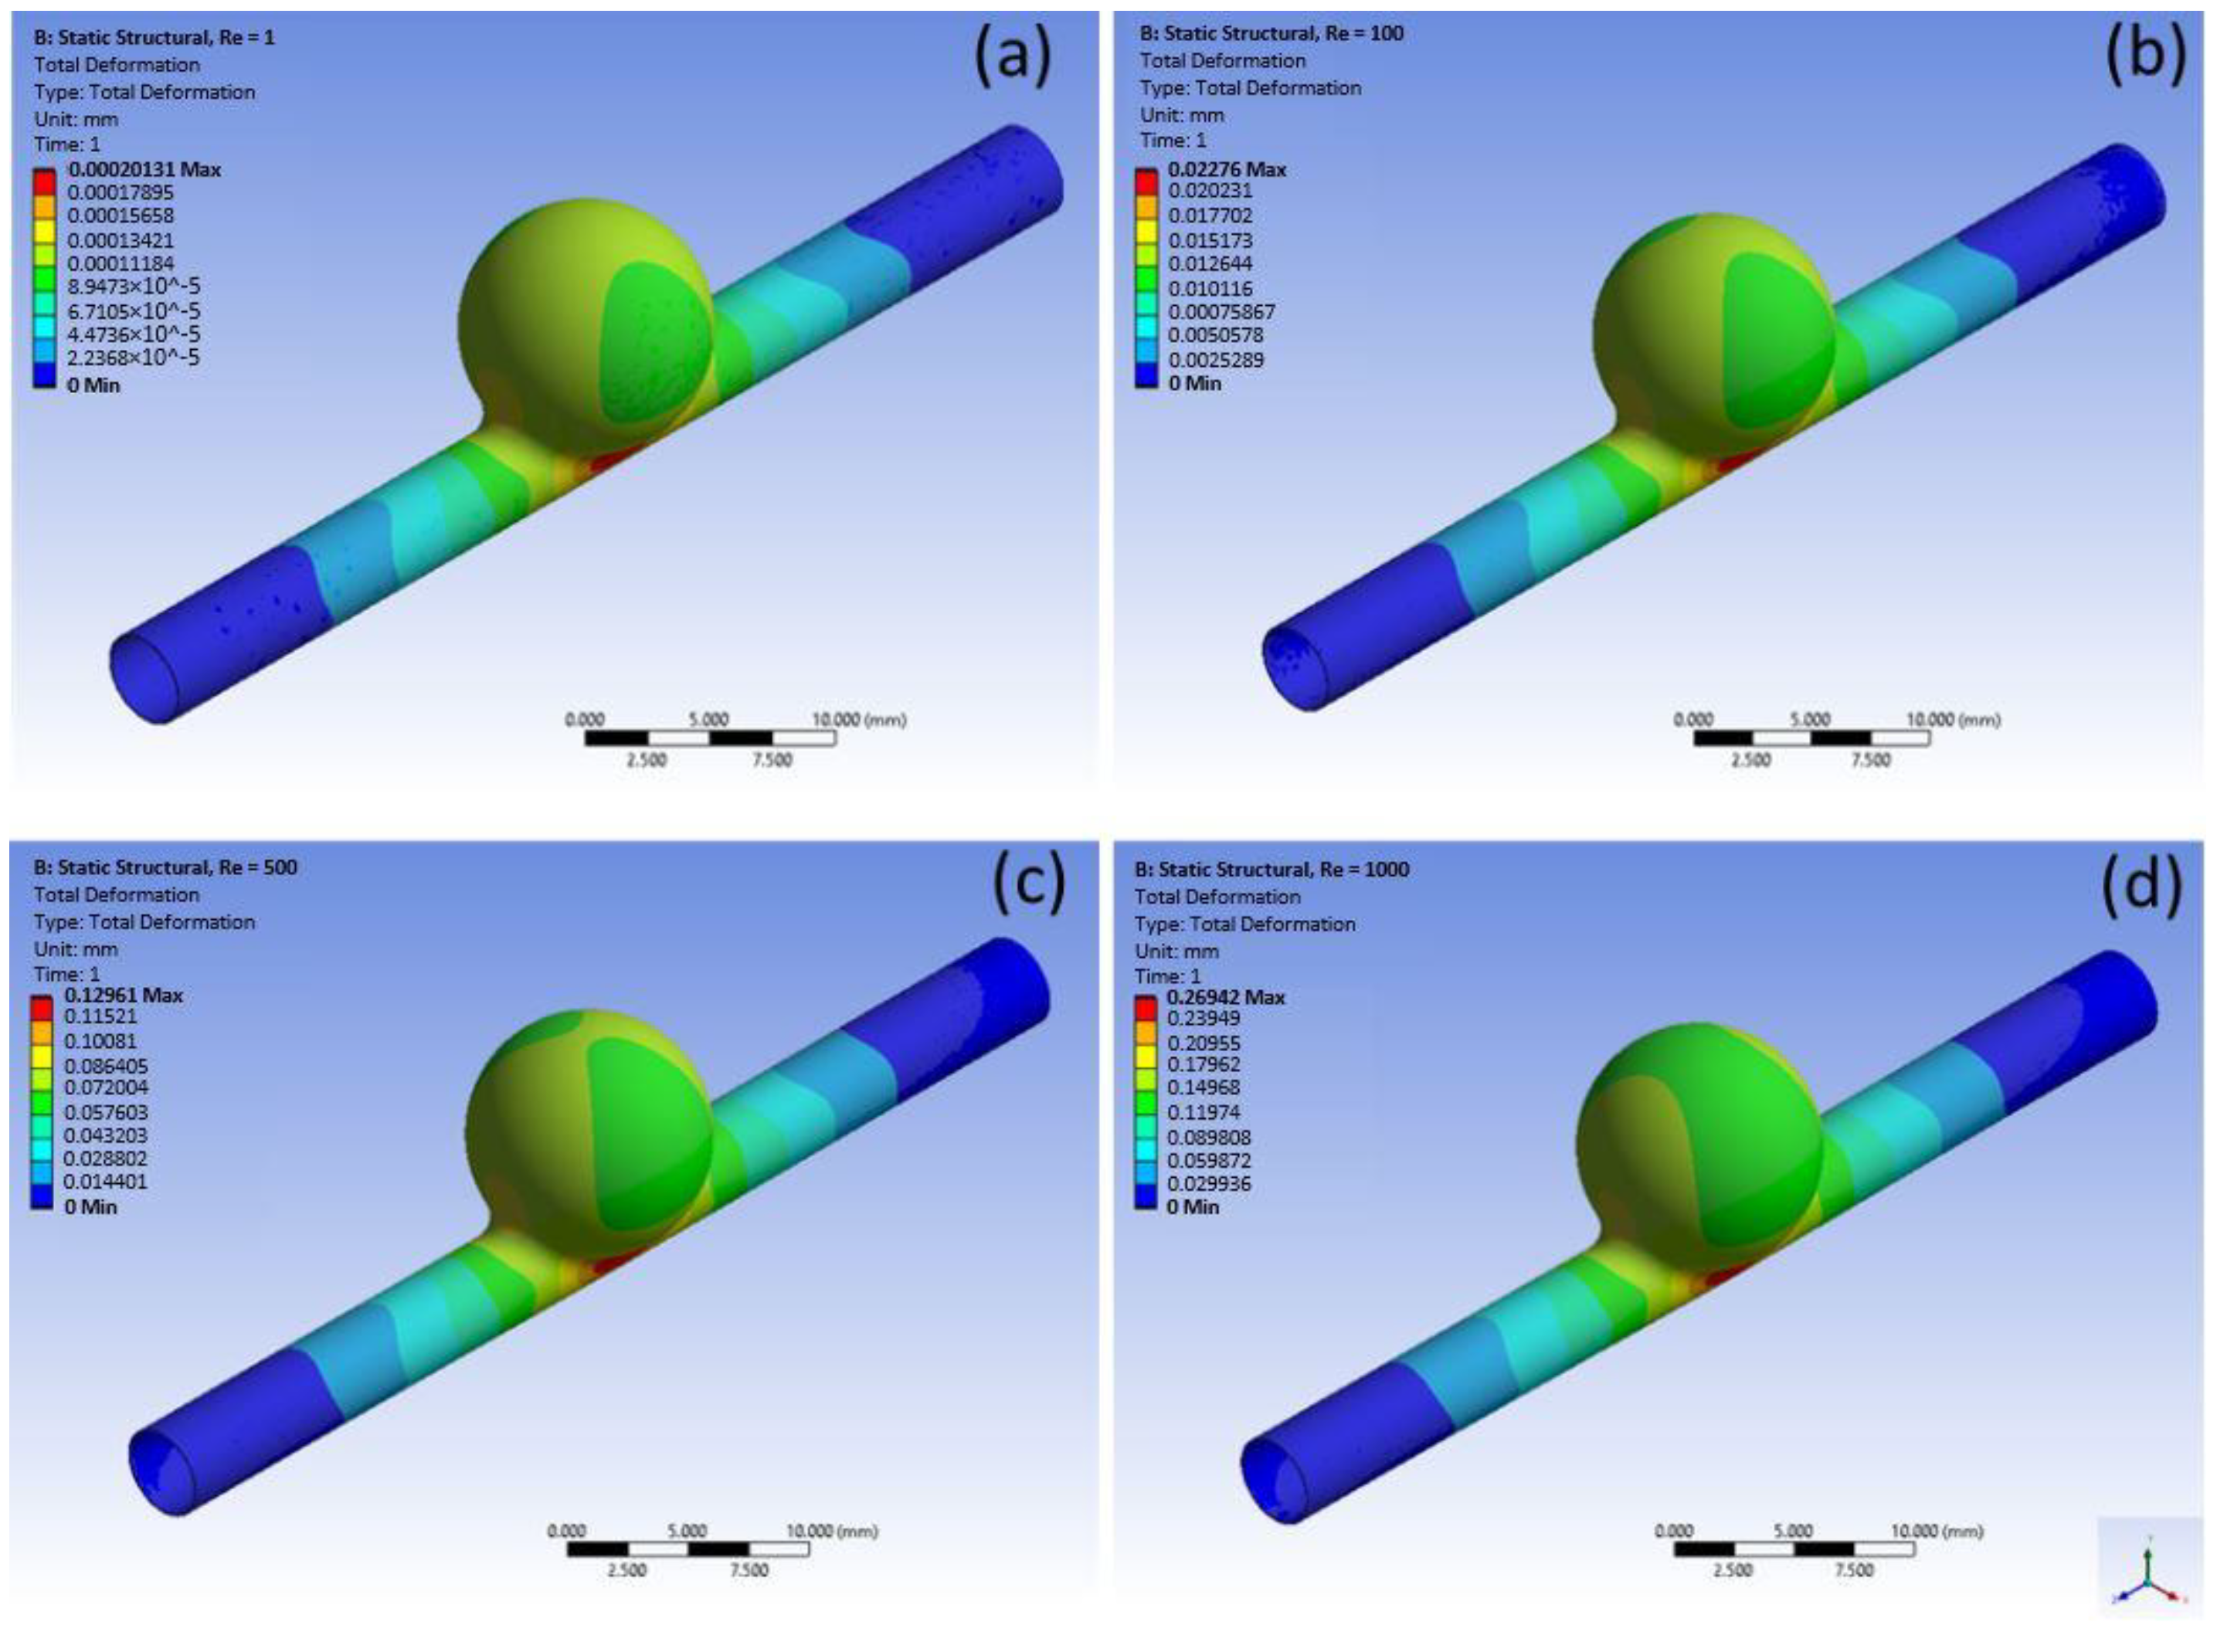
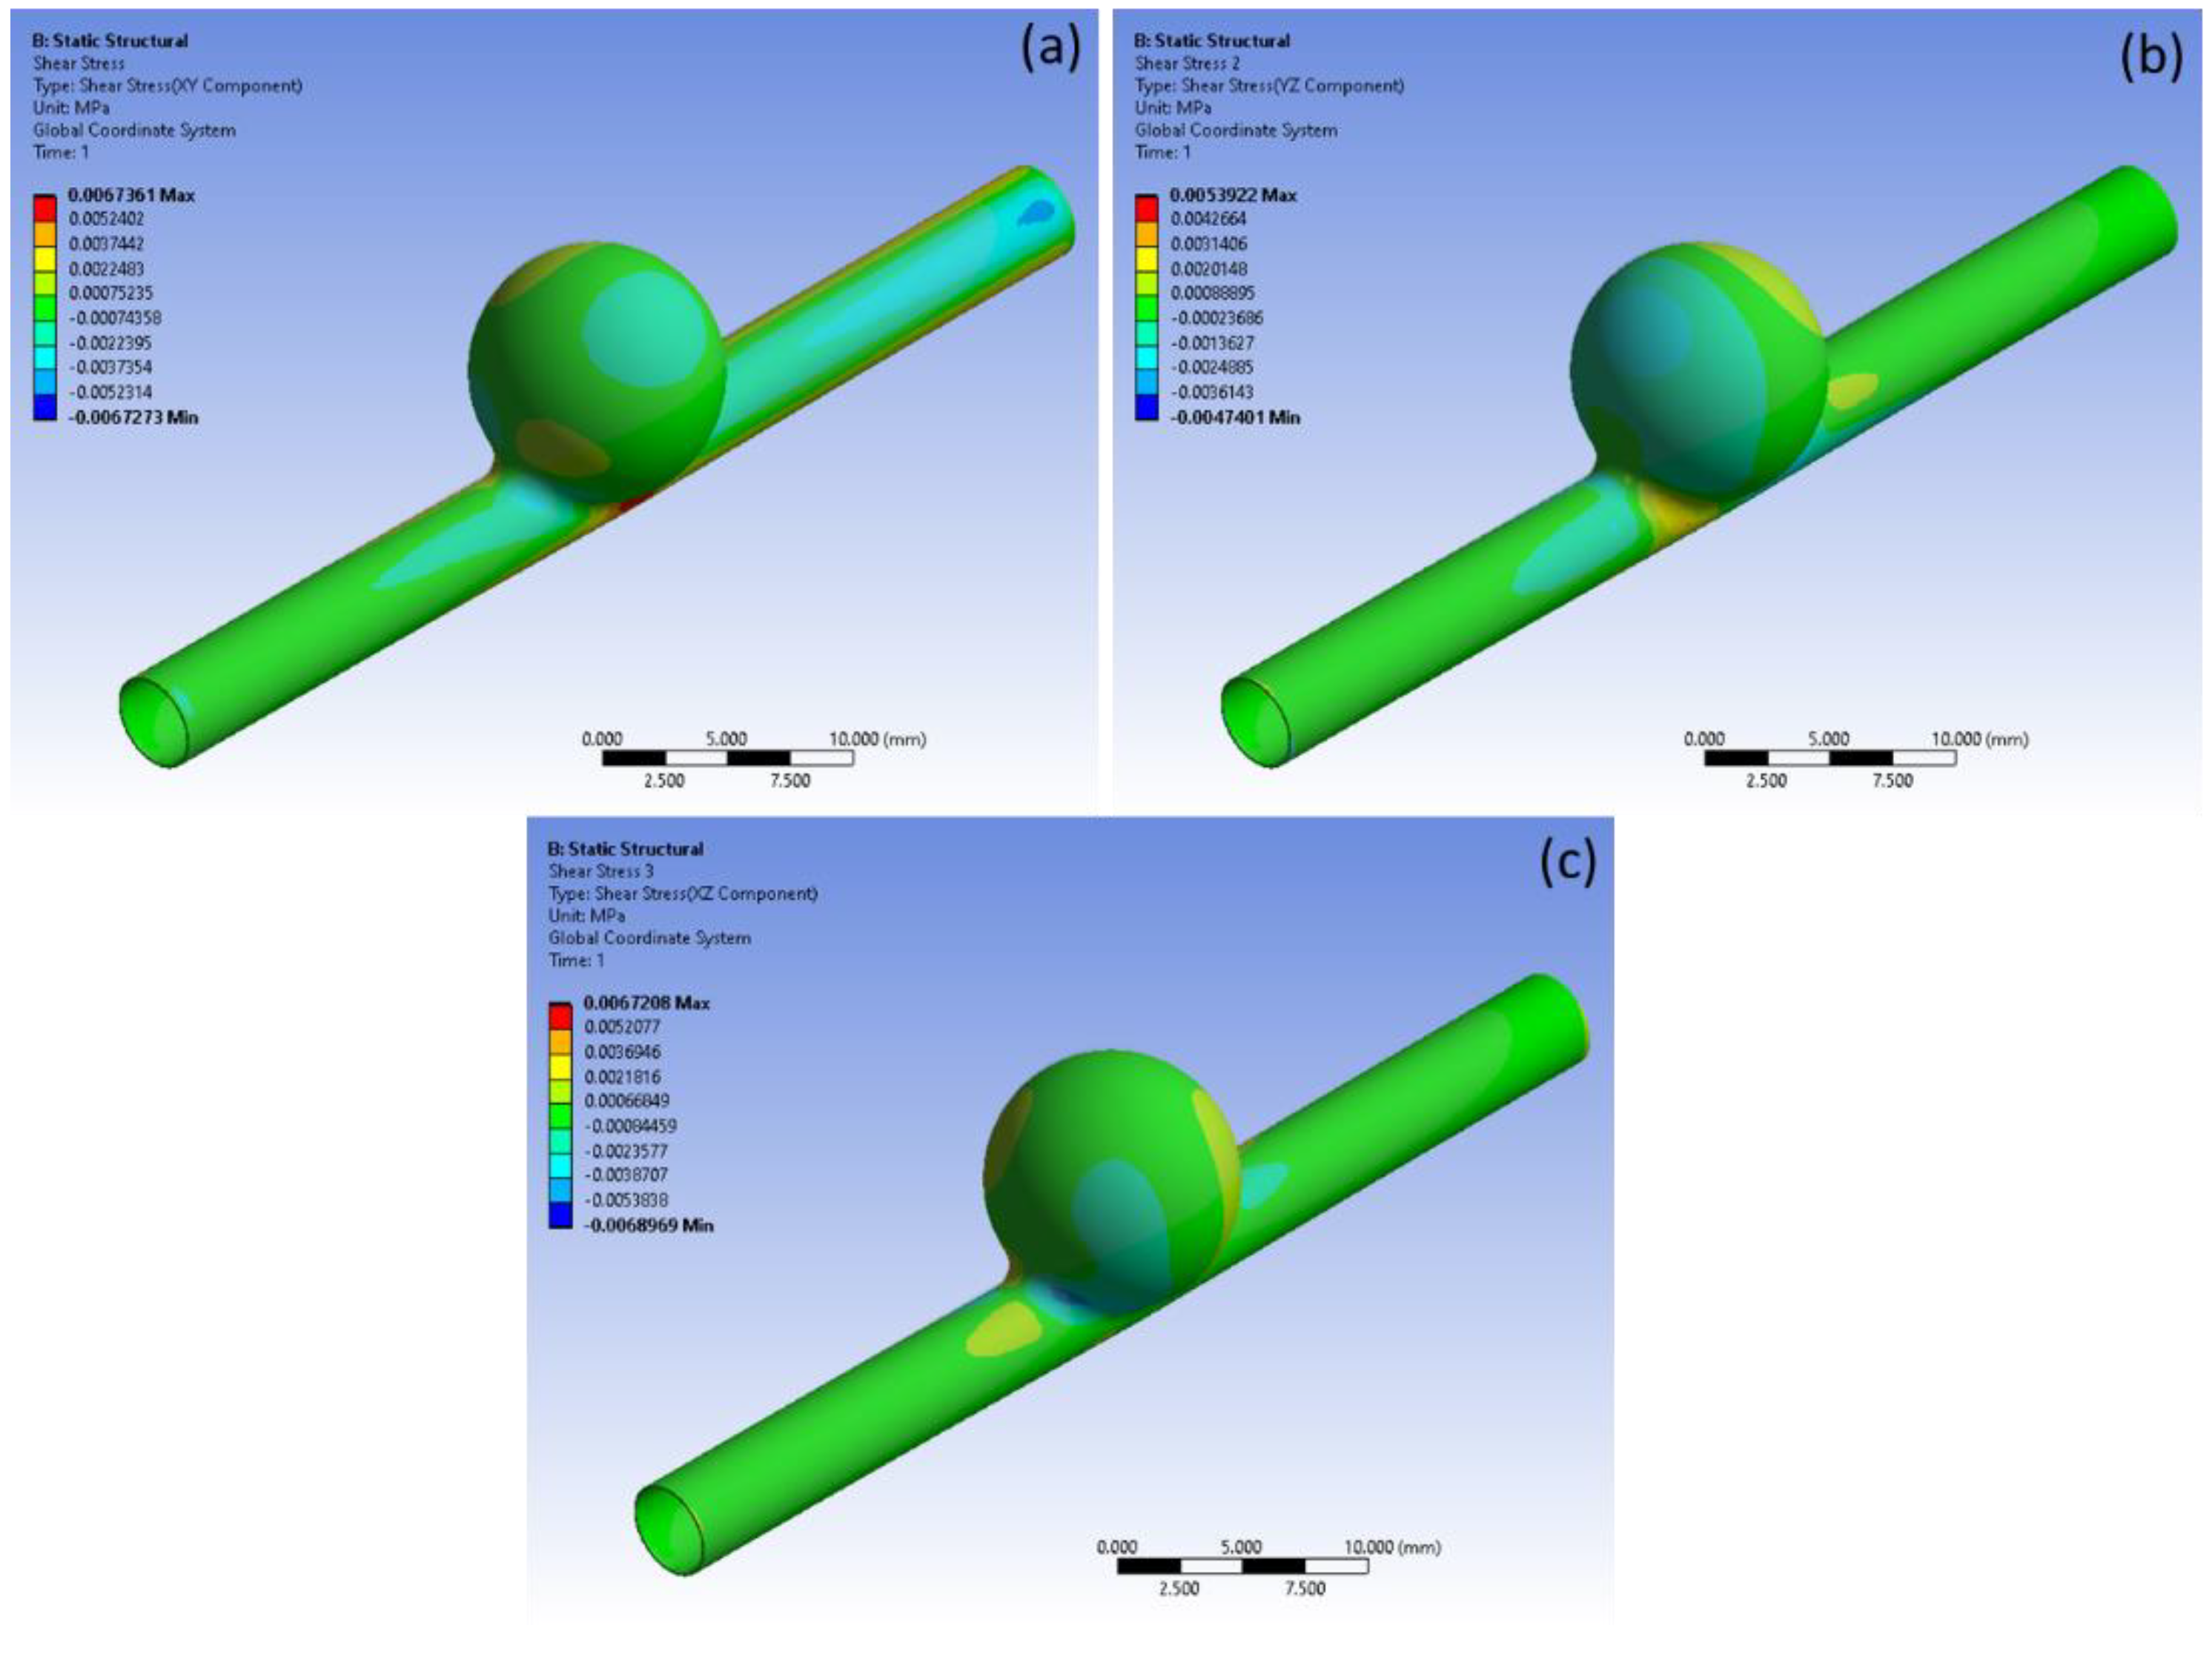
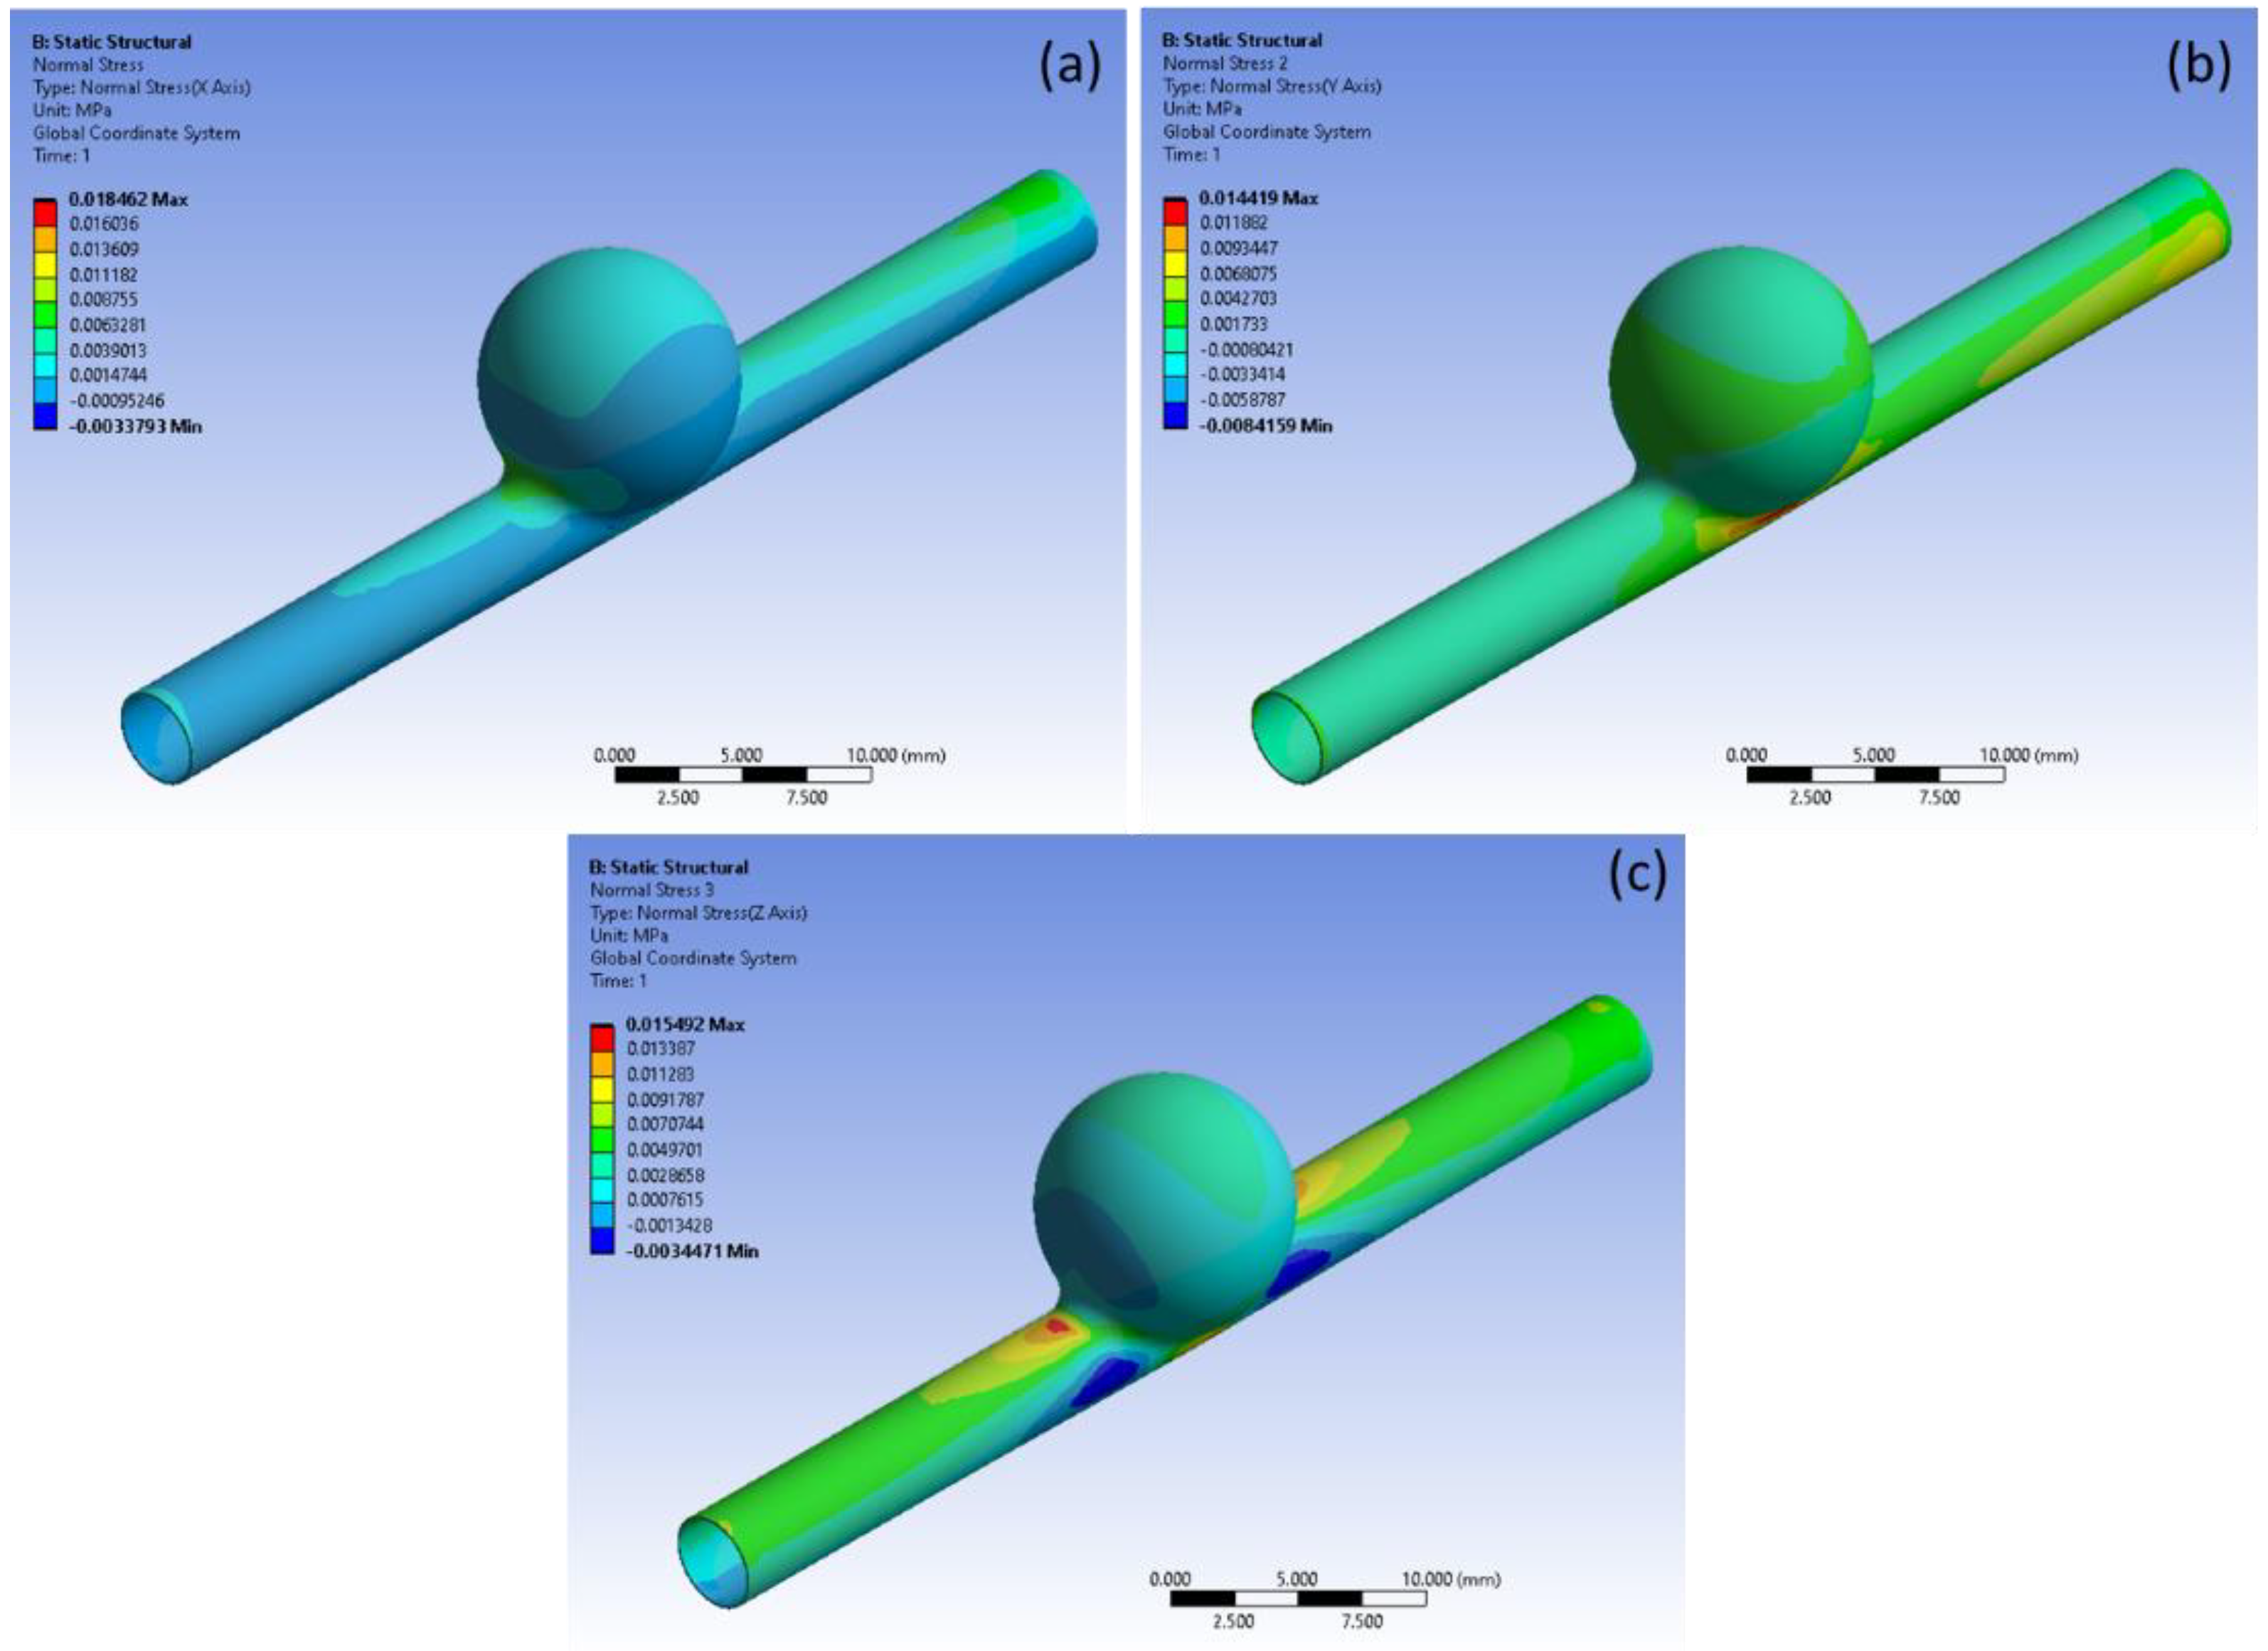
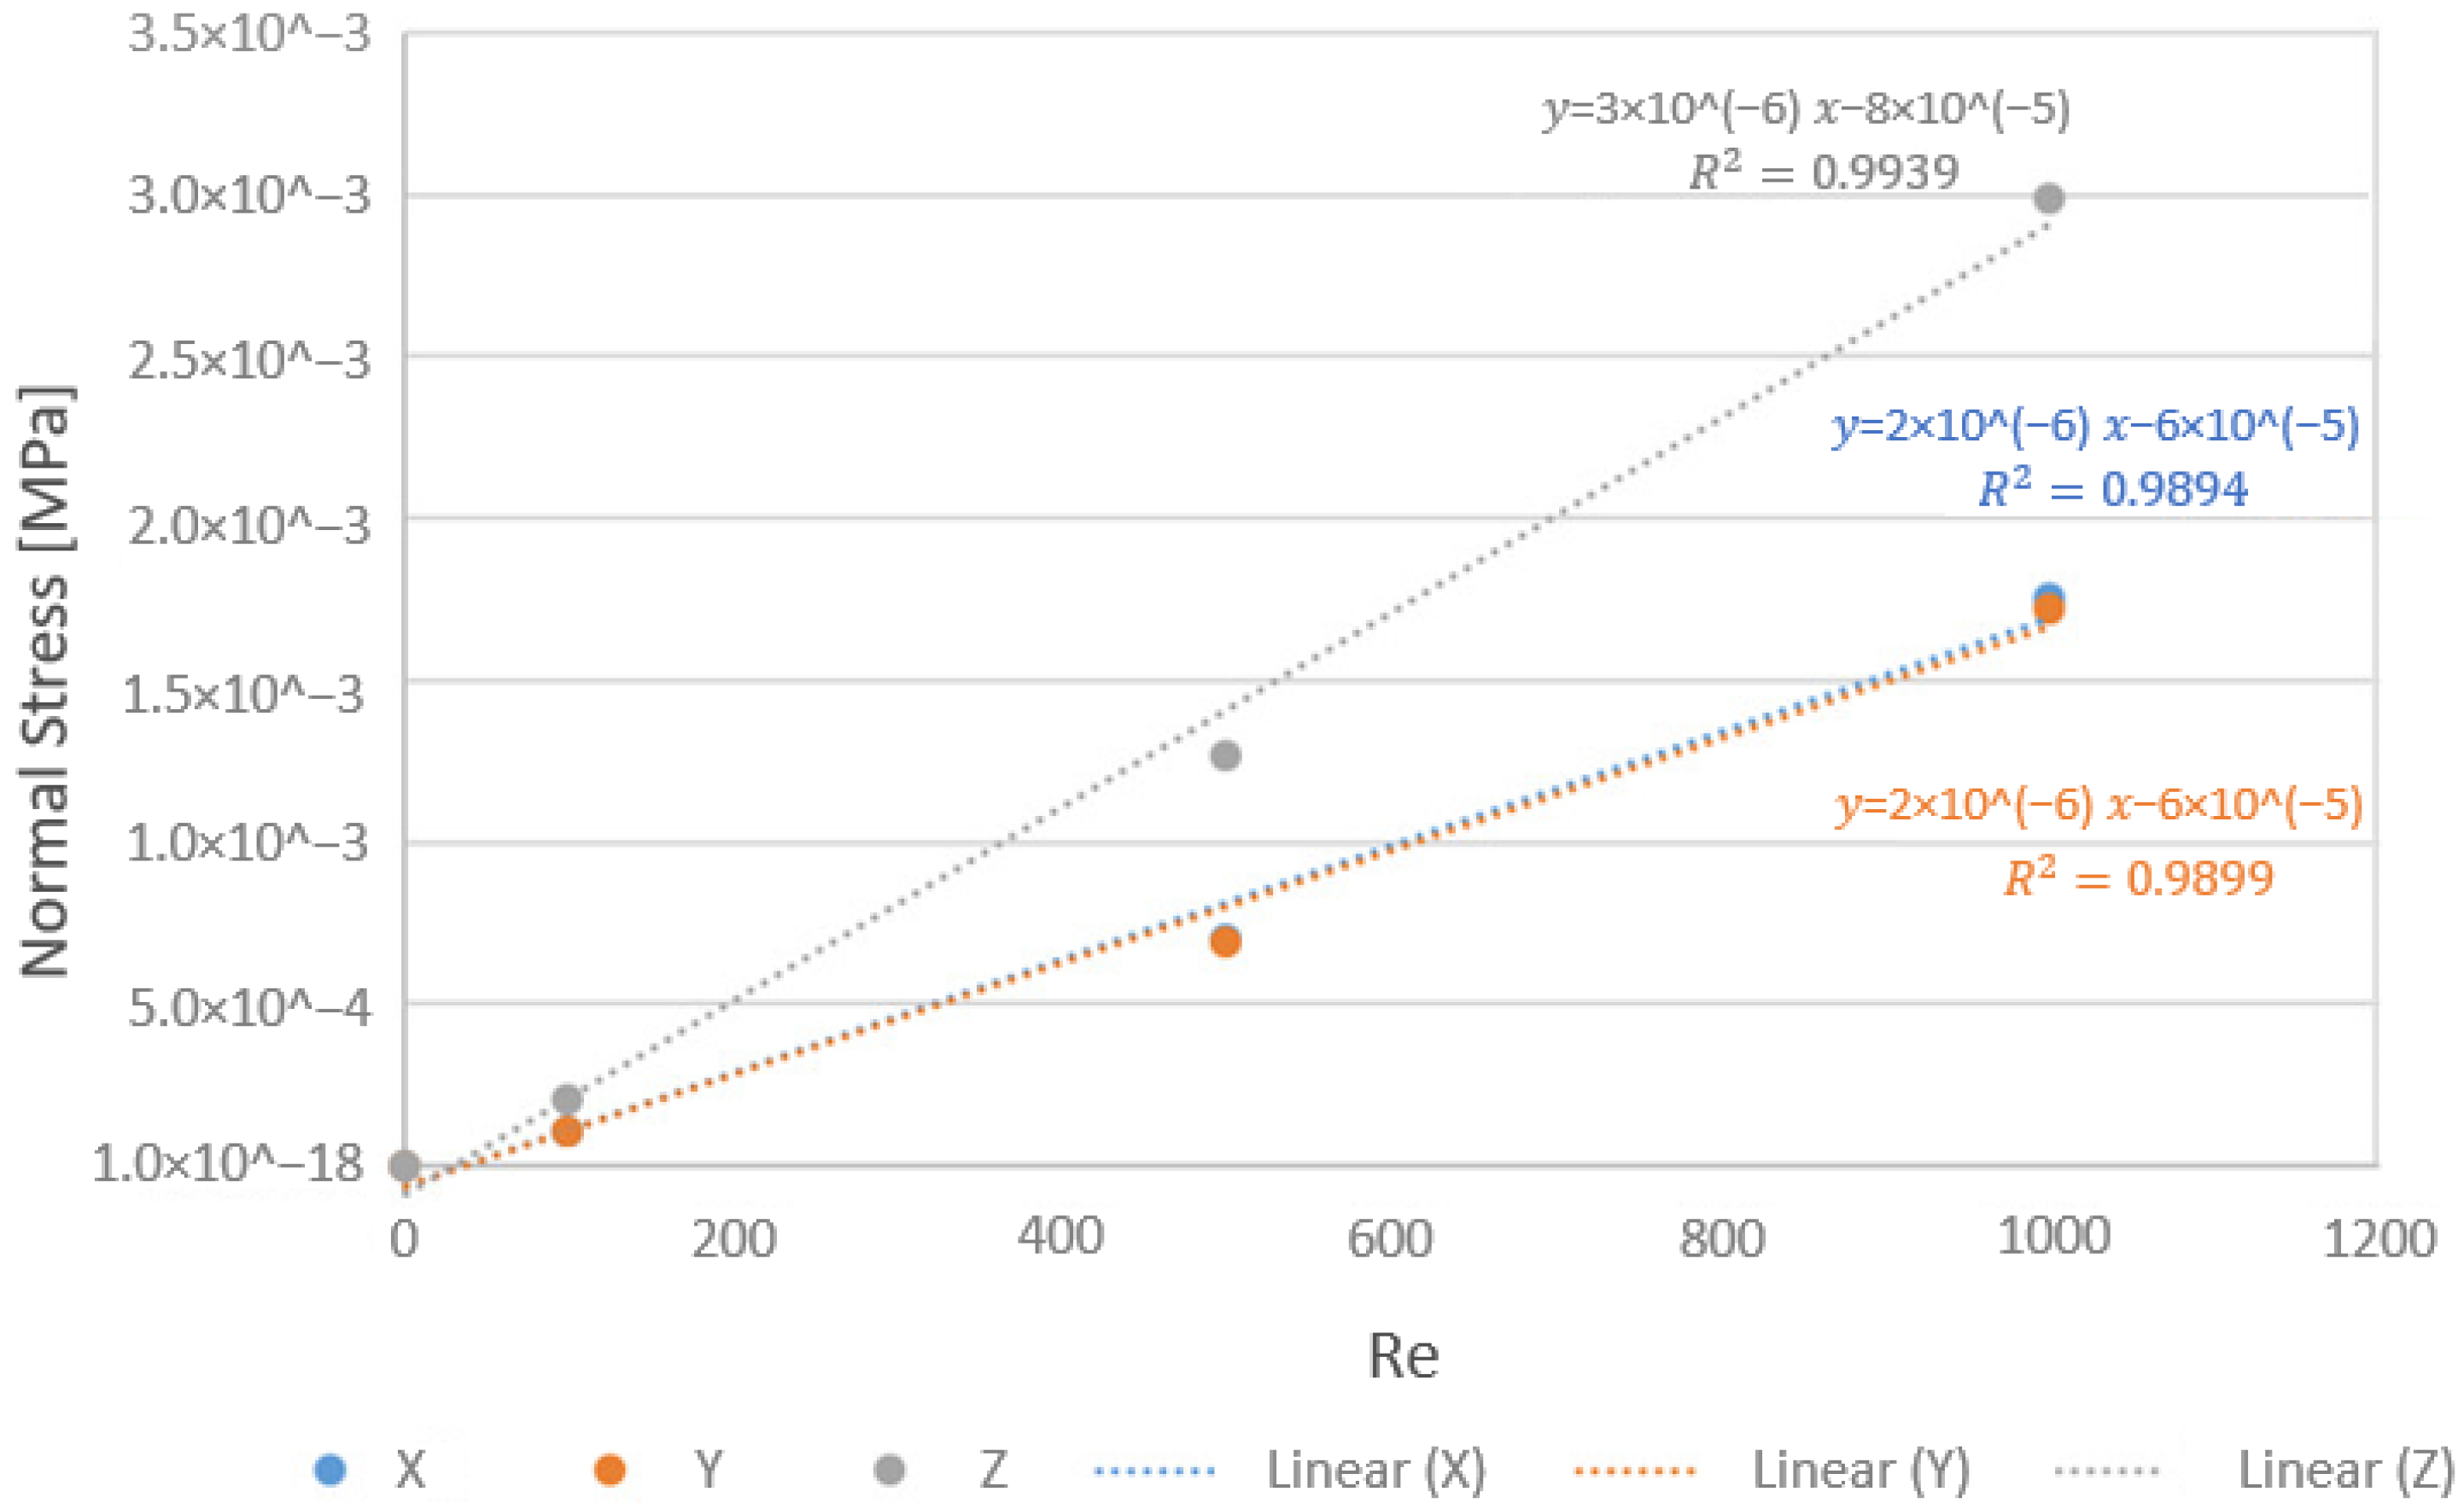
3.2. Structural Analysis

The results of the channel wall structural simulations are presented below.
By observing Figure 13 below, it is possible to observe that the displacement along the channel occurs in a similar way; in a qualitative perspective, this effect can also be justified by the fixation support applied on the sides of the geometry during the modeling of the problem, which causes that the total displacement values are null at the ends, but do not affect the results in the aneurysm. Displacement values increase as the Reynolds number increases.
However, it is clear that at the dome of the aneurysm, there is a change in the behavior of total displacement for each Re. The total displacement becomes more and more intense on the sides of the aneurysm (areas of great effort) and is reduced at the top of the aneurysm.
Figure 14 shows the strain values. For these results, it is notorious both in the channel and in the dome of the aneurysm the increase of strain as the inflow velocity is increased. The highest strain values are concentrated in the transition zones, from channel to aneurysm and from the aneurysm to channel.
In addition to displacement and strain, normal stress and shear stress values were also computed. Next, the images of shear stress (Figure 15) and normal stress (Figure 16) for the highest Re (Re = 1000) and the graph of normal stress for all analyzed Re (Figure 17) are presented.
The behavior of the shear stress changes according to the coordinates, with the change close to the aneurysm being more noticeable (Figure 15). For shear stresses analyzed in component XY, the highest stress values are in the channel zone below the aneurysm dome. In the YZ component, the highest shear stress values are found in the channel along the curvature of the aneurysm outlet. Additionally, in component XZ, the highest values are near the neck of the aneurysm. By analyzing the mean of the values in each direction, we have the highest mean shear stress in the YZ component, which is the flow direction within the channel.
Figure 16 shows the results for normal stress. As can be seen, the normal stress is more accentuated in the Z direction. The higher stress values are close to the aneurysm entrance and exit. When we analyze the graph in Figure 17, with the mean stress values, it is clear that the normal stress in Z, for all analyzed Re, has a greater relevance (higher values) when compared to the other directions (X and Y).

4. Conclusions

The present work aimed to observe the flow behavior in an ideal intracranial aneurysm using a Newtonian blood viscosity model and a non-Newtonian model (Carreau model). In addition, the biomechanical behavior of the wall was analyzed.
By analyzing the distribution of velocities in the two rheological models, it was observed that there was no significant difference in the magnitude of velocities. Regarding the pressure distribution, despite the values being higher in the blood rheology described by the Carreau model, this also proved to be almost independent of the non-Newtonian properties of the blood. Hence, this result indicates that assuming the characteristics of blood, being Newtonian fluid, is acceptable.
In order to obtain more insights into the hemodynamic behavior, different Re was compared, from Re = 1 (without physiological relevance) to Re = 1000, in order to observe the existence or not of recirculations inside the IA. With the obtained results, it was evident that the increase in the number of Re makes the phenomenon of blood recirculation more noticeable. There is only the formation of a vortex in the center of the aneurysm, which becomes increasingly accentuated closer to the wall. Nevertheless, there is no formation of additional vortex regions as the Re number increases. For Re = 1, the phenomenon of blood recirculation does not appear due to the extremely low flow velocities at the channel inlet.
Regarding the structural analysis, it was observed that the displacement was maximum on the sides of the aneurysm and in the passage from the channel to the aneurysm and from the aneurysm to the channel, which are the areas where there is an abrupt change in geometry. Likewise, an increase in the Re leads to an increment of both normal stress and shear stress values. However, for Re = 1, the stress was extremely low, with values close to zero.
The normal stresses have shown more accentuated values at the Z direction, and the shear stresses presented the highest values at the XY plane. Hence, the normal stresses were higher at the transition region from the vessel to the aneurysm. Additionally, the shear stresses were higher at the sides of the aneurysm. Note that the representation of the type of distribution of the normal and shear stresses was similar to the tested Reynolds numbers.
Although in the present work, a simplified vessel model was used, this does not withdraw the validity of results since the form and geometry of the blood vessel vary from patient to patient. The use of a more realistic vessel, for example, constructed from 2D medical images obtained by computed tomography, gives more precise information regarding this patient. In the near future, it is intended to perform this comparison.

Author Contributions

Conceptualization, M.S.S., A.S., J.R. and C.S.F.; methodology, M.S.S.; software M.S.S.; validation, J.R., A.S. and C.S.F.; formal analysis, A.S.; investigation, A.S.; resources, J.R., C.S.F.; data curation, M.S.S.; writing—original draft preparation, M.S.S., A.S. and V.C.; writing—review and editing, J.R., S.T. and R.L.; visualization A.S. and V.C.; supervision, J.R. and R.L.; project administration, J.R.; funding acquisition J.R. and R.L. All authors have read and agreed to the published version of the manuscript.

Funding

The authors acknowledge the financial support from the project EXPL/EME-EME/0732/2021, funded by the NORTE 2020 Portugal Regional Operational Programme, under the PORTUGAL 2020 Partnership Agreement, through the European Regional Development Fund (FEDER) and by Fundação para a Ciência e Tecnologia (FCT). This work was also supported by Fundação para a Ciência e a Tecnologia (FCT) under the strategic grants UIDB/04077/2020, UIDB/04436/2020, UIDB/00319/2020 and UIDB/00532/2020. Andrews Souza and Violeta Carvalho also acknowledge the financial support by FCT through the individual research grants 2021.07961.BD and UI/BD/151028/2021, respectively.

Institutional Review Board Statement

Not applicable.

Informed Consent Statement

Not applicable.

Data Availability Statement

Not applicable.

Conflicts of Interest

The authors declare no conflict of interest.

References

  1. Johnston, S.C.; Higashida, R.T.; Barrow, D.L.; Caplan, L.R.; Dion, J.E.; Hademenos, G.; Hopkins, L.N.; Molyneux, A.; Rosenwasser, R.H.; Vinuela, F.; et al. Recommendations for the endovascular treatment of intracranial aneurysms: A statement for healthcare professionals from the Committee on Cerebrovascular Imaging of the American Heart Association Council on Cardiovascular Radiology. Stroke 2002, 33, 2536–2544. [Google Scholar] [CrossRef] [PubMed] [Green Version]
  2. Schievink, W.I. Intracranial Aneurysms. N. Engl. J. Med. 1997, 336, 28–40. [Google Scholar] [CrossRef] [PubMed]
  3. Thompson, B.G.; Brown, R.D., Jr.; Amin-Hanjani, S.; Broderick, J.P.; Crokroft, K.M.; Connolly, E.S., Jr.; Duckwiler, G.R.; Harris, C.C.; Howard, V.J.; Johnston, S.C.C.; et al. Guidelines for the Management of Patients With Unruptured Intracranial Aneurysms: A Guideline for Healthcare Professionals From the American Heart Association/American Stroke Association. Stroke 2015, 46, 2368–2400. [Google Scholar] [CrossRef] [PubMed] [Green Version]
  4. Amenta, P.S.; Yadla, S.; Campbell, P.G.; Maltenfort, M.G.; Dey, S.; Ghosh, S.; Ali, M.S.; Jallo, J.I.; Tjoumakaris, S.I.; Gonzalez, L.F.; et al. Analysis of nonmodifiable risk factors for intracranial aneurysm rupture in a large, retrospective cohort. Neurosurgery 2012, 70, 693–701. [Google Scholar] [CrossRef] [PubMed]
  5. Lasheras, J.C. The Biomechanics of Arterial Aneurysms. Annu. Rev. Fluid Mech. 2007, 39, 293–319. [Google Scholar] [CrossRef] [Green Version]
  6. Tromp, G.; Weinsheimer, S.; Ronkainen, A.; Kuivaniemi, H. Molecular basis and genetic predisposition to intracranial aneurysm. Ann. Med. 2014, 46, 597–606. [Google Scholar] [CrossRef] [Green Version]
  7. Baratchi, S.; Khoshmanesh, K.; Woodman, O.L.; Potocnik, S.; Peter, K.; McIntyre, P. Molecular Sensors of Blood Flow in Endothelial Cells. Trends Mol. Med. 2017, 23, 850–868. [Google Scholar] [CrossRef]
  8. Hoskins, P.R.; Lawford, P.V.; Doyle, B.J. Cardiovascular Biomechanics; Springer: Cham, Switzerland, 2017. [Google Scholar]
  9. Cebral, J.R.; Raschi, M. Suggested connections between risk factors of intracranial aneurysms: A review. Ann. Biomed. Eng. 2013, 41, 1366–1383. [Google Scholar] [CrossRef]
  10. Gasser, T.C.; Ogden, R.W.; Holzapfel, G.A. Hyperelastic modelling of arterial layers with distributed collagen fibre orientations. J. R. Soc. Interface 2006, 3, 15–35. [Google Scholar] [CrossRef]
  11. Victor, A.; Ribeiro, J.; Araújo, F.F. Study of PDMS characterization and its applications in biomedicine: A review. J. Mech. Eng. Biomech. 2019, 4, 1–9. [Google Scholar] [CrossRef]
  12. Ariati, R.; Sales, F.; Souza, A.; Lima, R.A.; Ribeiro, J. Polydimethylsiloxane Composites Characterization and Its Applications: A Review. Polymers 2021, 13, 4258. [Google Scholar] [CrossRef] [PubMed]
  13. Roloff, C.; Stucht, D.; Beuing, O.; Berg, P. Comparison of intracranial aneurysm flow quantification techniques: Standard PIV vs. stereoscopic PIV vs. tomographic PIV vs. phase-contrast MRI vs. CFD. J. Neurointerv. Surg. 2019, 11, 275–282. [Google Scholar] [CrossRef] [PubMed]
  14. Doutel, E.; Viriato, N.; Carneiro, J.; Campos, J.B.L.M.; Miranda, J.M. Geometrical effects in the hemodynamics of stenotic and non-stenotic left coronary arteries—numerical and in vitro approaches. Int. J. Numer. Method. Biomed. Eng. 2019, 35, e3207. [Google Scholar] [CrossRef] [PubMed]
  15. Souza, A.; Souza, M.S.; Pinho, D.; Agujetas, R.; Ferrera, C.; Lima, R.; Puga, H.; Ribeiro, J. 3D manufacturing of intracranial aneurysm biomodels for flow visualizations: Low cost fabrication processes. Mech. Res. Commun. 2020, 107, 103535. [Google Scholar] [CrossRef]
  16. Querzoli, G.; Fortini, S.; Espa, S.; Costantini, M.; Sorgini, F. Fluid dynamics of aortic root dilation in Marfan syndrome. J. Biomech. 2014, 47, 3120–3128. [Google Scholar] [CrossRef] [PubMed] [Green Version]
  17. Querzoli, G.; Fortini, S.; Espa, S.; Melchionna, S. A laboratory model of the aortic root flow including the coronary arteries. Exp. Fluids 2016, 57, 1–9. [Google Scholar] [CrossRef]
  18. Tupin, S.; Saqr, K.M.; Ohta, M. Effects of wall compliance on multiharmonic pulsatile flow in idealized cerebral aneurysm models: Comparative PIV experiments. Exp. Fluids 2020, 61, 1–11. [Google Scholar] [CrossRef]
  19. Rodrigues, R.O.; Pinho, D.; Bento, D.; Lima, R.; Ribeiro, J. Wall expansion assessment of an intracranial aneurysm model by a 3D Digital Image Correlation System. Measurement 2016, 88, 262–270. [Google Scholar] [CrossRef] [Green Version]
  20. Carvalho, V.; Maia, I.; Souza, A.; Ribeiro, J.; Costa, P.; Puga, H.; Teixeira, S.; Lima, R.A. In vitro stenotic arteries to perform blood analogues flow visualizations and measurements: A Review. Open Biomed. Eng. J. 2020, 14, 87–102. [Google Scholar] [CrossRef]
  21. Carvalho, V.; Gonçalves, I.; Lage, T.; Rodrigues, R.O.; Minas, G.; Teixeira, S.F.C.F.; Moita, A.S.; Hori, T.; Kaji, H.; Lima, R.A. 3D printing techniques and their applications to organ-on-a-chip platforms: A systematic review. Sensors 2021, 21, 3304. [Google Scholar] [CrossRef]
  22. Souza, R.R.; Gonçalves, I.M.; Rodrigues, R.O.; Minas, G.; Miranda, J.M.; Moreira, A.L.N.; Lima, R.; Coutinho, G.; Pereira, J.E.; Moita, A.S. Recent advances on the thermal properties and applications of nanofluids: From nanomedicine to renewable energies. Appl. Therm. Eng. 2022, 201, 117725. [Google Scholar] [CrossRef]
  23. Sadek, S.H.; Rubio, M.; Lima, R.; Vega, E.J. Blood particulate analogue fluids: A review. Materials 2021, 14, 2451. [Google Scholar] [CrossRef] [PubMed]
  24. Pinho, D.; Carvalho, V.; Gonçalves, I.M.; Teixeira, S.; Lima, R. Visualization and measurements of blood cells flowing in microfluidic systems and blood rheology: A personalized medicine perspective. J. Pers. Med. 2020, 10, 249. [Google Scholar] [CrossRef] [PubMed]
  25. Faustino, V.; Rodrigues, R.O.; Pinho, D.; Costa, E.; Santos-Silva, A.; Miranda, V.; Amaral, J.S.; Lima, R. A microfluidic deformability assessment of pathological red blood cells flowing in a hyperbolic converging microchannel. Micromachines 2019, 10, 645. [Google Scholar] [CrossRef] [Green Version]
  26. Pinho, D.; Muñoz-Sánchez, B.N.; Anes, C.F.; Vega, E.J.; Lima, R. Flexible PDMS microparticles to mimic RBCs in blood particulate analogue fluids. Mech. Res. Commun. 2019, 100, 18–20. [Google Scholar] [CrossRef] [Green Version]
  27. Rodrigues, R.O.; Lima, R.; Gomes, H.T.; Silva, A.M.T. Polymer microfluidic devices: An overview of fabrication methods. U. Porto J. Eng. 2015, 1, 67–79. [Google Scholar] [CrossRef] [Green Version]
  28. Miranda, I.; Souza, A.; Sousa, P.; Ribeiro, J.; Castanheira, E.M.S.; Lima, R.; Minas, G. Properties and Applications of PDMS for Biomedical Engineering: A Review. J. Funct. Biomater. 2022, 13, 2. [Google Scholar] [CrossRef]
  29. Saalfeld, S.; Voß, S.; Beuing, O.; Preim, B.; Berg, P. Flow-splitting-based computation of outlet boundary conditions for improved cerebrovascular simulation in multiple intracranial aneurysms. Int. J. Comput. Assist. Radiol. Surg. 2019, 14, 1805–1813. [Google Scholar] [CrossRef]
  30. Hoi, Y.; Meng, H.; Woodward, S.H.; Bendok, B.R.; Hanel, R.A.; Guterman, L.R.; Hopkins, L.N. Effects of arterial geometry on aneurysm growth: Three-dimensional computational fluid dynamics study. J. Neurosurg. 2004, 101, 676–681. [Google Scholar] [CrossRef]
  31. Carvalho, V.; Pinho, D.; Lima, R.A.; Teixeira, J.C.; Teixeira, S. Blood Flow Modeling in Coronary Arteries: A Review. Fluids 2021, 6, 53. [Google Scholar] [CrossRef]
  32. Carvalho, V.; Arcipreste, B.; Soares, D.; Ribas, L.; Rodrigues, N.; Teixeira, S.F.C.F.; Teixeira, J.C. Numerical modeling of the wave soldering process and experimental validation. J. Electron. Packag.—ASME 2021, 144, 011011. [Google Scholar] [CrossRef]
  33. Carvalho, V.; Carneiro, F.; Ferreira, A.C.; Gama, V.; Teixeira, J.C.; Teixeira, S. Numerical study of the unsteady flow in simplified and realistic iliac bifurcation models. Fluids 2021, 6, 284. [Google Scholar] [CrossRef]
  34. Carvalho, V.; Rodrigues, N.; Lima, R.A.; Teixeira, S.F.C.F. Modeling blood pulsatile turbulent flow in stenotic coronary arteries. Int. J. Biol. Biomed. Eng. 2020, 14, 1998–4510. [Google Scholar] [CrossRef]
  35. Shimogonya, Y.; Ishikawa, T.; Imai, Y.; Matsuki, N.; Yamaguchi, T. Can temporal fluctuation in spatial wall shear stress gradient initiate a cerebral aneurysm? A proposed novel hemodynamic index, the gradient oscillatory number (GON). J. Biomech. 2009, 42, 550–554. [Google Scholar] [CrossRef]
  36. Rashad, S.; Sugiyama, S.; Niizuma, K.; Sato, K.; Endo, H.; Omodaka, S.; Matsumoto, Y.; Fujimura, M.; Tominaga, T. Impact of bifurcation angle and inflow coefficient on the rupture risk of bifurcation type basilar artery tip aneurysms. J. Neurosurg. 2018, 128, 723–730. [Google Scholar] [CrossRef]
  37. Saqr, K.M.; Rashad, S.; Tupin, S.; Niizuma, K.; Hassan, T.; Tominaga, T.; Ohta, M. What does computational fluid dynamics tell us about intracranial aneurysms? A meta-analysis and critical review. J. Cereb. Blood Flow Metab. 2019, 40, 1021–1039. [Google Scholar] [CrossRef]
  38. Hassan, T.; Ezura, M.; Timofeev, E.V.; Tominaga, T.; Saito, T. Computational Simulation of Therapeutic Parent Artery Occlusion to Treat Giant Vertebrobasilar Aneurysm. AJNR Am. J. Neuroradiol. 2004, 25, 63–68. [Google Scholar]
  39. Usmani, A.Y.; Patel, S. Hemodynamics of a cerebral aneurysm under rest and exercise conditions. Int. J. Energy Clean Environ. 2018, 19, 119–136. [Google Scholar] [CrossRef]
  40. Li, Y.; Verrelli, D.I.; Yang, W.; Qian, Y.; Chong, W. A pilot validation of CFD model results against PIV observations of haemodynamics in intracranial aneurysms treated with flow-diverting stents. J. Biomech. 2019, 100, 109590. [Google Scholar] [CrossRef]
  41. Janiga, G.; Daróczy, L.; Berg, P.; Thévenin, D.; Skalej, M.; Beuing, O. An automatic CFD-based flow diverter optimization principle for patient-specific intracranial aneurysms. J. Biomech. 2015, 48, 3846–3852. [Google Scholar] [CrossRef]
  42. Carvalho, V.; Rodrigues, N.; Lima, R.A.; Teixeira, S. Numerical simulation of blood pulsatile flow in stenotic coronary arteries: The effect of turbulence modeling and non-Newtonian assumptions. In Proceedings of the International Conference on Applied Mathematics & Computer Science, Chania, Greece, 19–22 July 2020; pp. 112–116. [Google Scholar]
  43. Appanaboyina, S.; Mut, F.; Löhner, R.; Putman, C.M.; Cebral, J.R. Computational fluid dynamics of stented intracranial aneurysms using adaptive embedded unstructured grids. Int. J. Numer. Methods Fluids 2008, 57, 475–493. [Google Scholar] [CrossRef]
  44. Xiang, J.; Natarajan, S.K.; Tremmel, M.; Ma, D.; Mocco, J.; Hopkins, L.N.; Siddiqui, A.H.; Levy, E.I.; Meng, H. Hemodynamic-morphologic discriminants for intracranial aneurysm rupture. Stroke 2011, 42, 144–152. [Google Scholar] [CrossRef] [Green Version]
  45. Dolan, J.M.; Kolega, J.; Meng, H. High wall shear stress and spatial gradients in vascular pathology: A review. Ann. Biomed. Eng. 2013, 41, 1411–1427. [Google Scholar] [CrossRef] [PubMed]
  46. Li, Y.S.J.; Haga, J.H.; Chien, S. Molecular basis of the effects of shear stress on vascular endothelial cells. J. Biomech. 2005, 38, 1949–1971. [Google Scholar] [CrossRef]
  47. Rashad, S.; Han, X.; Saqr, K.; Tupin, S.; Ohta, M.; Niizuma, K.; Tominaga, T. Epigenetic response of endothelial cells to different wall shear stress magnitudes: A report of new mechano-miRNAs. J. Cell. Physiol. 2020, 235, 7827–7839. [Google Scholar] [CrossRef] [PubMed]
  48. Xu, L.; Sugawara, M.; Tanaka, G.; Ohta, M.; Liu, H.; Yamaguchi, R. Effect of elasticity on wall shear stress inside cerebral aneurysm at anterior cerebral artery. Technol. Heal. Care. 2016, 24, 349–357. [Google Scholar] [CrossRef] [PubMed]
  49. Mooney, M. A theory of large elastic deformation. J. Appl. Phys. 1940, 11, 582–592. [Google Scholar] [CrossRef]
  50. Lawrence, K.L. ANSYS Workbench Tutorial Release 14; SDC Publications: Mission, KS, USA, 2012. [Google Scholar]
  51. Chen, X.; Liu, Y. Finite Element Modeling and Simulation with ANSYS Workbench; CRC Press: Boca Raton, FL, USA, 2014. [Google Scholar]
  52. Parlea, L.; Fahrig, R.; Holdsworth, D.W.; Lownie, S.P. An Analysis of the Geometry of Saccular Intracranial Aneurysms. AJNR Am. J. Neuroradiol 1999, 20, 1079–1089. [Google Scholar]
  53. Bird, R.B.; Armstrong, R.C.; Hassager, O. Dynamic of Polymeric Liquids; John Willey & Sons: New York, NY, USA, 1987; Volume 1. [Google Scholar]
  54. Çengel, Y.A.; Ghajar, A.J. Heat and Mass Transfer, 4th ed.; Mc. Graw Hill: New York, NY, USA, 2012. [Google Scholar]
  55. Cardoso, C.; Fernandes, C.S.; Lima, R.; Ribeiro, J. Biomechanical analysis of PDMS channels using different hyperelastic numerical constitutive models. Mech. Res. Commun. 2018, 90, 26–33. [Google Scholar] [CrossRef] [Green Version]
Figure 1. Studied IA model.
Fluids 07 00100 g001
Figure 2. Detail of the mesh used in CFD calculations.
Fluids 07 00100 g002
Figure 3. Velocity profile for fully developed Newtonian flow in the region before the aneurysm, u = 88.8 mm/s.
Fluids 07 00100 g003
Figure 4. Approximation of the curve stress/strain by the Mooney–Rivlin 5 Parameter model.
Fluids 07 00100 g004
Figure 5. (a) Mesh used for the outer part of the channel (wall); (b) pressure imported from fluent for the structural static.
Fluids 07 00100 g005
Figure 6. Streamlines for different Re.
Fluids 07 00100 g006
Figure 7. Streamlines for Newtonian flow and Re = 500.
Fluids 07 00100 g007
Figure 8. (a) Velocity profiles in three different regions of the channel for Newtonian model and u = 444 mm/s. (b) Three cutting planes corresponding to the curves of (a), respectively.
Fluids 07 00100 g008
Figure 9. (a) Static pressure along the channel for Carreau model and different velocities. (b) Ratio between static pressure for Carreau and Newtonian models.
Fluids 07 00100 g009
Figure 10. Viscosity in the central plane (x = 0) for non-Newtonian flows and distinct velocities. (a) u = 888 mm/s; (b) u = 444 mm/s; (c) u = 88.8 mm/s.
Fluids 07 00100 g010
Figure 11. Wall pressure distribution for Carreau model and u = 888 mm/s.
Fluids 07 00100 g011
Figure 12. (a) Static pressure along the wall for Carreau model and different velocities. (b) Ratio between wall’s static pressure for Carreau and Newtonian models.
Fluids 07 00100 g012
Figure 13. Total displacement: (a) Re = 1; (b) Re = 100; (c) Re = 500; (d) Re = 1000.
Fluids 07 00100 g013
Figure 14. Equivalent Elastic Strain: (a) Re = 1; (b) Re = 100; (c) Re = 500; (d) Re = 1000.
Fluids 07 00100 g014
Figure 15. Shear stress to Re = 1000. (a) XY, (b) YZ and (c) XZ component.
Fluids 07 00100 g015
Figure 16. Normal Stress to Re = 1000. (a) X, (b) Y and (c) Z axis.
Fluids 07 00100 g016
Figure 17. Normal stress as a function of Re.
Fluids 07 00100 g017
Table 1. Pressure drop for fully developed Newtonian flows in the region before the aneurysm.
ReP/L)Equation (3) (Pa/m)P/L)numerical (Pa/m)Relative Error (%)
100716.11713.790.33
5003580.543575.830.13
10007161.087364.602.84
Table 2. Pressure drop for both rheological models.
ReΔPCarreau (Pa)ΔPNewtonian (Pa)ΔPratio
10046.7337.641.24
500290.41274.811.06
1000726.12704.841.03
Publisher’s Note: MDPI stays neutral with regard to jurisdictional claims in published maps and institutional affiliations.

