
Turbulence Intensity Modulation by Micropolar Fluids


1
Department of Mechanical Engineering, University of Thessaly, Pedion Areos, 38221 Volos, Greece
2
Department of Mechanical Engineering, University of West Attica, Thivon 250, 12244 Aigaleo, Greece
*
Author to whom correspondence should be addressed.
Fluids 2021, 6(6), 195; https://doi.org/10.3390/fluids6060195
Submission received: 28 April 2021
/
Revised: 18 May 2021
/
Accepted: 20 May 2021
/
Published: 22 May 2021
(This article belongs to the Collection Non-Newtonian Fluid Mechanics)
Abstract
:Fluid microstructure nature has a direct effect on turbulence enhancement or attenuation. Certain classes of fluids, such as polymers, tend to reduce turbulence intensity, while others, like dense suspensions, present the opposite results. In this article, we take into consideration the micropolar class of fluids and investigate turbulence intensity modulation for three different Reynolds numbers, as well as different volume fractions of the micropolar density, in a turbulent channel flow. Our findings support that, for low micropolar volume fractions, turbulence presents a monotonic enhancement as the Reynolds number increases. However, on the other hand, for sufficiently high volume fractions, turbulence intensity drops, along with Reynolds number increment. This result is considered to be due to the effect of the micropolar force term on the flow, suppressing near-wall turbulence and enforcing turbulence activity to move further away from the wall. This is the first time that such an observation is made for the class of micropolar fluid flows, and can further assist our understanding of physical phenomena in the more general non-Newtonian flow regime.
1. Introduction
The turbulence generation mechanism is known to alter depending on the internal microstructure of the fluid flow. As a result, study of non-Newtonian turbulent flows has become of great importance not only from a physical point of view, but due to their many real life applications as well. A well-documented class of such fluid flows is polymer solutions, which have widespread industrial applications, as they tend to reduce drag and effectively pressure loss [1,2]. The first one to report this kind of behavior for polymer additives was Toms [3], while since then numerous studies have explored the effects of polymer fluid flows especially in the turbulent regime, with some recent reviews conducted by Graham [4] and White and Mungal [5]. In the majority of these studies, it has been shown that addition of polymeric particles to a Newtonian fluid flow leads to near-wall turbulence dampening.
Another class of fluid that presents an altered behavior in comparison with the classic turbulent Newtonian flow is that of dense suspensions. In a recent work of Picano et al. [6], it has been shown that the addition of a dispersed phase results in drag increase as well as near-wall turbulence intensification. The increased viscosity caused by dense suspensions leads to higher turbulence interaction as volume fraction increases. Studies of dense suspension fluid flows have also been concentrated at the transitional regime between laminar and turbulent flow, with some very interesting results. An experimental study of Matas, Moris and Guazzelli [7] reported that the transitional Reynolds number presents a non-monotonic behavior for particle laden flow. Depending on the particle phase volume fraction, critical Reynolds number first decreases and then increases, while these results have also been numerically extracted by Yu et al. [8].
Turbulent regime of the aforementioned particle laden flows induces even more complexities than the classic Newtonian one. Different approximations have been selected to study this area, while many parameters have also been considered towards their influence in the turbulence generation mechanism. The so-called two-way coupling approximation has been used among others by Zhao et al. [9], where it has been proven through numerical simulations that added spherical particles can also lead to drag reduction, a property previously known to be valid only for polymeric or fiber additives. Earlier, Gore and Growe [10] showed that particle diameter of the added phase plays a crucial role to the turbulence attenuation or enhancement of the fluid flow. Thus, it can be easily understood that turbulence modulation by suspensions is far from clear, with the set of parameters that affect the enhancement or attenuation still uncertain.
Micropolar theory, which was originally proposed by Eringen [11], is a generalization of the incompressible Navier–Stokes equation for fluids with internal microstructure, and has been previously reported to successfully describe a wide range of fluids with internal microstructure spanning from dense suspensions to liquid crystals, blood and other polymer-like fluids [11,12,13]. In addition, micropolar fluid theory is attractive as it includes an asymmetric and coupled stress tensor to describe the flow physics, in an Eulerian frame, with no need to treat a discrete phase.
In this article, the turbulent regime of suspensions is explored by employing the micropolar theory constitutive equations [11]. Three different Reynolds numbers are considered in the low Reynolds turbulent regime, while the ratio of micropolar to total viscosity has been varied as well, where micropolar viscosity is the one of the dispersed phase. Our findings support that both the Reynolds number, as well as the ratio of micropolar to total viscosity, affect turbulence modulation, which seems to alter its behavior for sufficiently high values of these parameters. Previous studies have also reported modulation of the turbulence activity in dilute suspensions [9,10,14,15], although the majority of these studies only considers the effect of particle diameter. They mostly report a turbulence attenuation when the particle diameter is less than the turbulent length scale.
2. Materials and Methods
Governing Equations
Direct numerical simulations (DNS) of a turbulent channel flow with internal microstructure have been performed. The set of equations that has been solved (1) and (2), together with the incompressibility condition, , has been properly non-dimensionalized as:
where, u and are the linear and angular velocity vectors, respectively, and t and P stand for time and pressure, respectively. At Equations (1) and (2) four non-dimensional quantities are recovered, i.e., the modified bulk Reynolds number, , with being the molecular and the micropolar fluid viscosities, the so-called vortex viscosity parameter, , the dimensionless microrotation parameter, , where j is the microinertia of the fluid, and the so-called spin gradient viscosity parameter, , where is the material coefficient of the fluid [16,17]. The linear and angular velocities, time and pressure at the above equations are made dimensionless by selecting the characteristic quantities , , , and , respectively, where is the constant mean velocity, is the height of the channel and is the density of the fluid, which is considered to be homogenous.
Throughout this study, the spin gradient viscosity and the microrotation parameters are kept constant at and that are usual magnitudes for biological flows [18], while m is varied between 0 and 0.9. This choice has been based on the straightforward connection between the linear and angular momentum equations through m. Fluids near behave similar to Newtonian ones, while when , a microstructure dominated fluid is considered. Increase of m in the present simulations, under constant bulk Reynolds number, implies simultaneously the reduction of molecular viscosity so that the total viscosity of the fluid remains the same. Bulk Reynolds numbers of and 13,800 are considered in the present study.
For the numerical simulations that are presented in this article, the open-source CFD platform OpenFoam has been used. A new in-house micropolar fluid solver that is based on the finite volume method has been implemented in the OpenFoam platform. This solver has already been found to accurately predict the analytical solutions of Couette and Poiseuille flows, as well as blood flow in a vessel under realistic conditions [19]. The numerical schemes that have been selected for the solution of the Equations (1) and (2), are second order accurate for all spatial derivatives. Time advance of the variables has been made possible with a second order accurate implicit backward scheme, while the usual pressure-implicit split-operator (PISO) method is used for coupling of momentum with pressure. The PISO algorithm is well-known for its robustness and accuracy, while it requires less CPU time in transient turbulent flow cases [20,21].
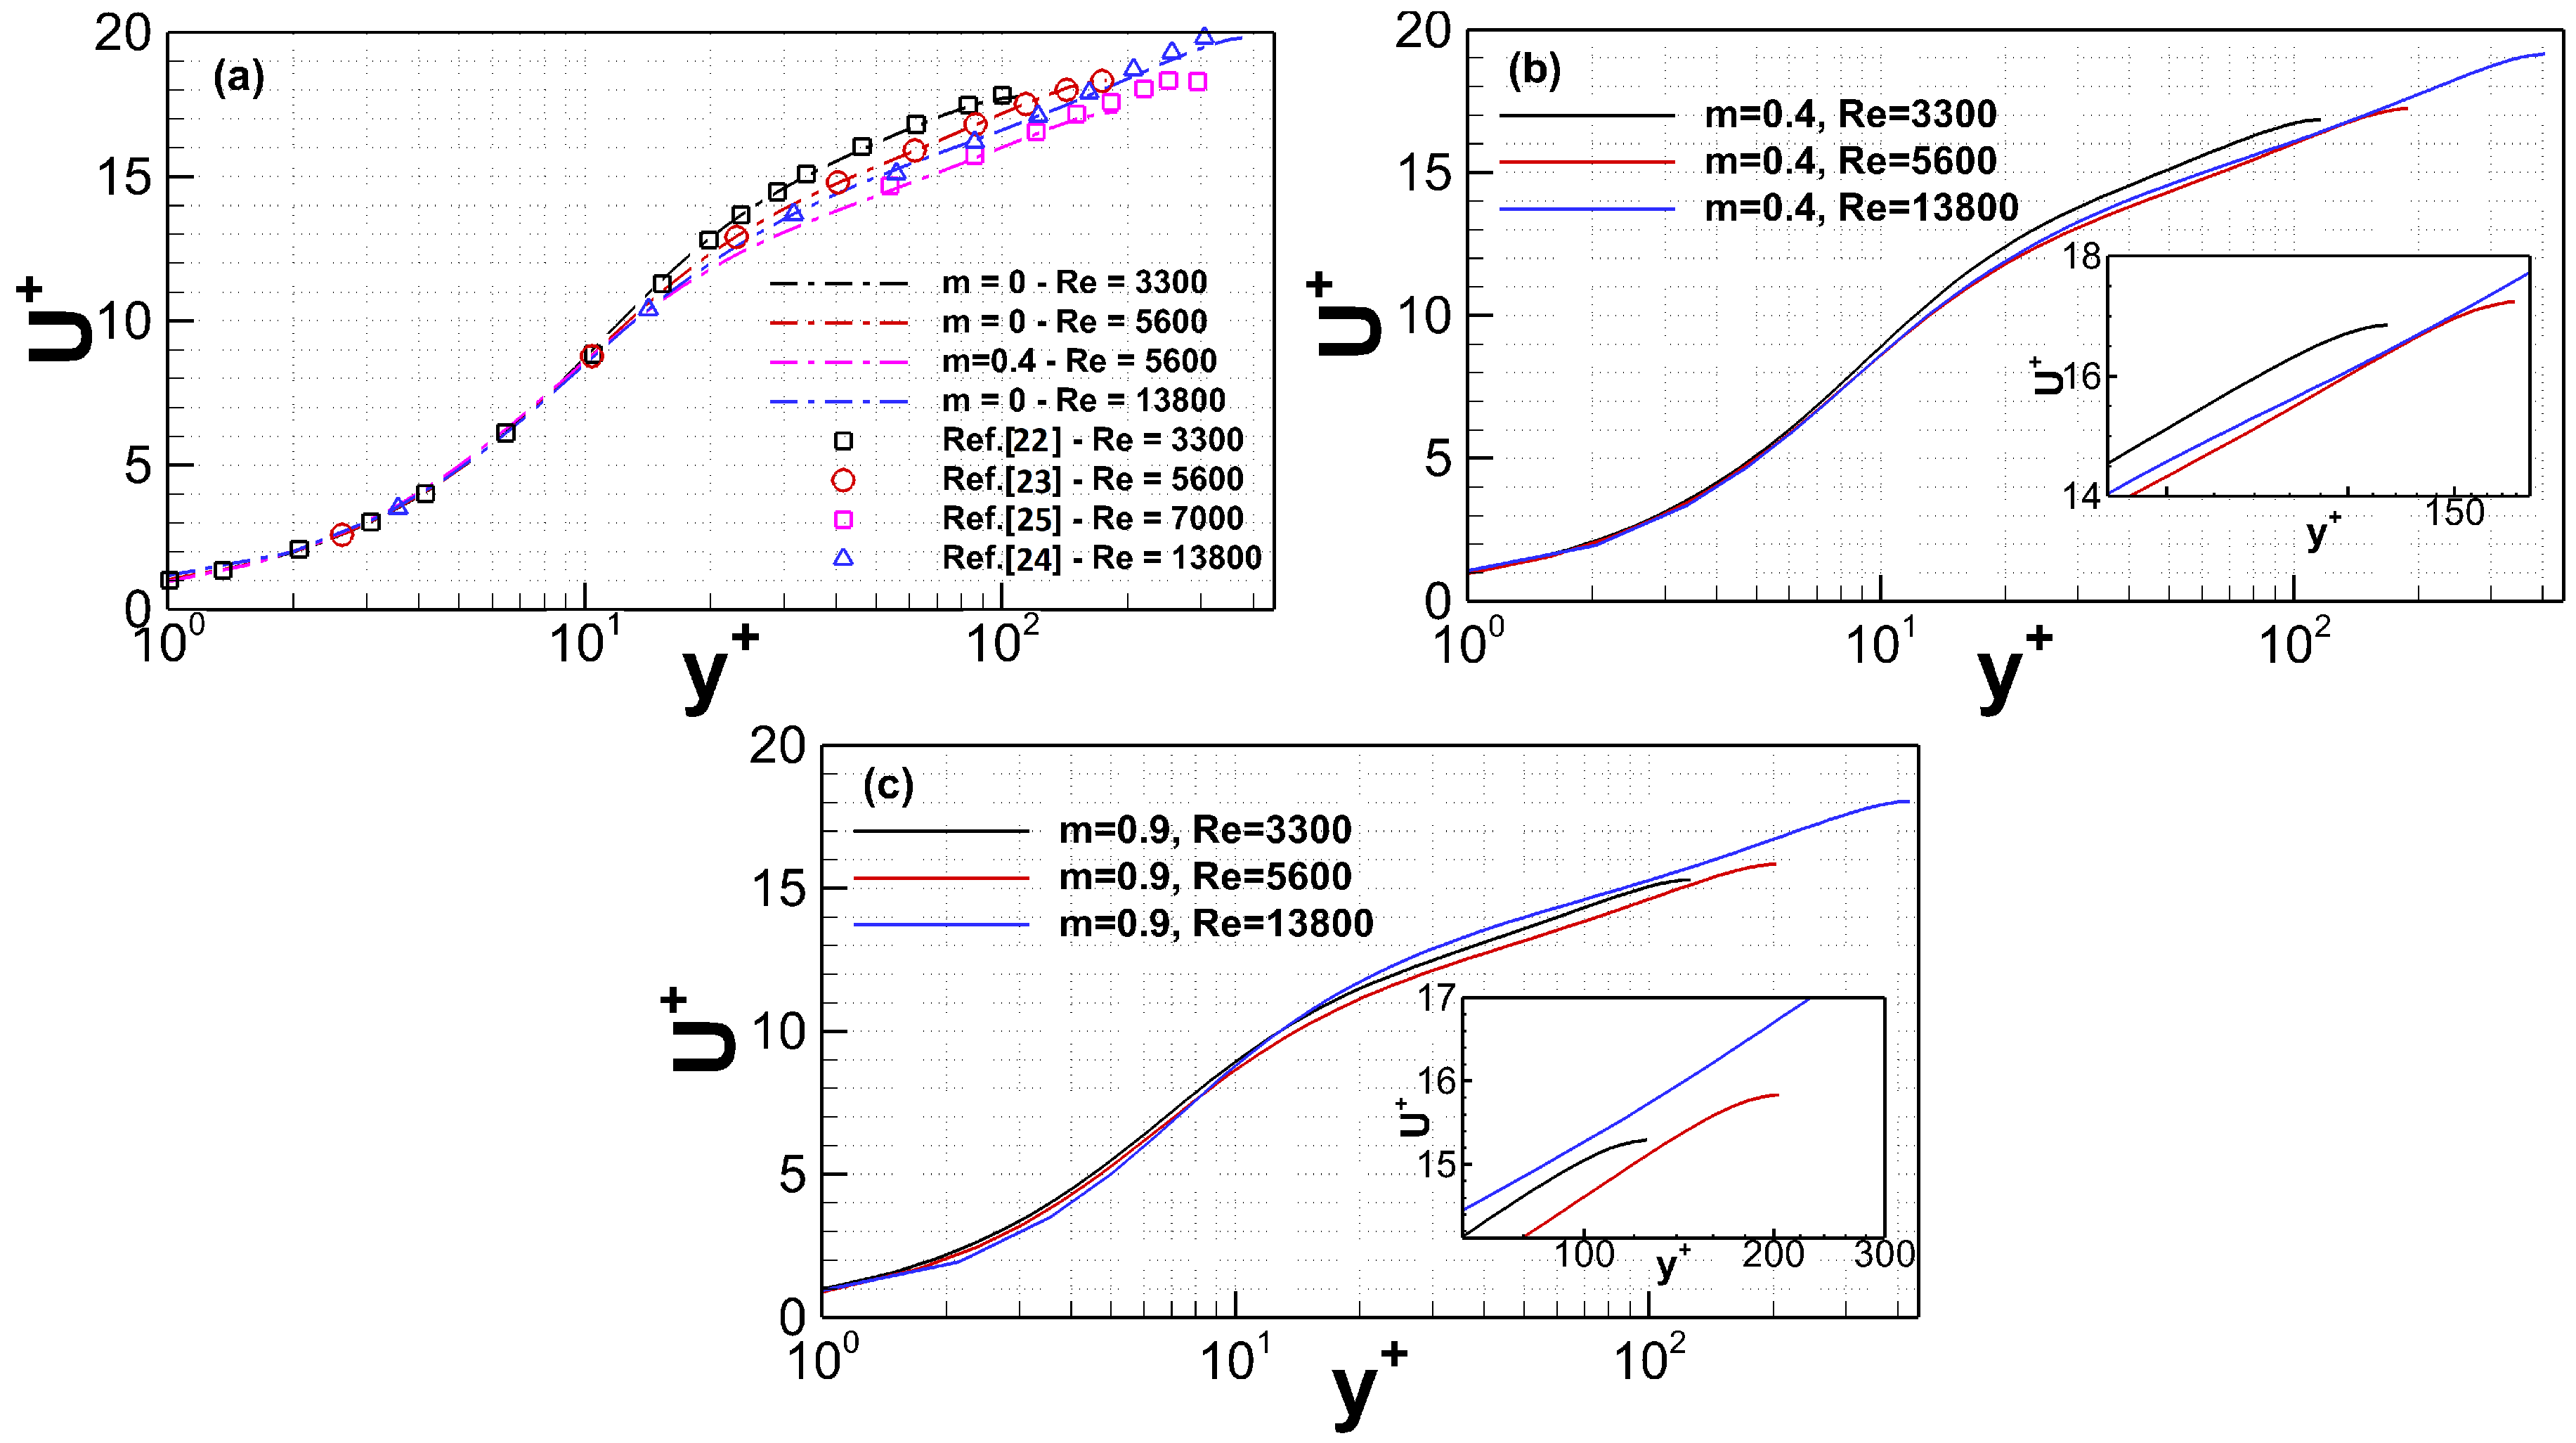
In order to assess the validity of results, our numerical facility has been compared against previous ones in the Newtonian regime () [22,23,24] and experimental results of particle-laden flows [25], as shown in Figure 1a, where excellent agreement between present and previous results throughout the turbulent regime occurs. Mean streamwise velocity, , as well as wall-normal direction, , have been normalized by the shear velocity , where is the shear stress and + indicates inner (wall) units.
3. Results and Discussion
In Figure 1a–c, curves of have been plotted along for all three cases of , while the viscosity ratio parameter, m, has been varied for and as well. Results of these cases present a particular interest, as two different trends can be detected. The first one concerns the comparison of cases with the same and different viscosity ratio m. By closely examining the results presented in Figure 1a–c, it is understood that the normalized streamwise velocity, , collapses to lower values as m increases, indicating higher turbulence activity. This observation holds true, according to the present results, for all three . In the latter case of constant viscosity ratio m and different , a peculiar behavior can be observed. When viscosity ratio , curves of collapse again to lower values as increases, as anticipated. On the opposite side, though, for higher values of m and more specifically when , curves of present a non-monotonic behavior, where they collapse to lower values as increases from to and then to higher ones for , indicating turbulence attenuation.
The behavior that has been described above is similar to turbulence attenuation phenomena observed by Zhao et al. [9], where higher profiles have been observed for the particle-laden channel flow case, compared to the unladen case, at approximately similar . In their case though, this was achieved by selecting appropriately small particles, which resulted in drag reduction. The departure, due to internal microstructure, of the drag mechanism is also explored in this study, through the percentage of drag increase or reduction, which is defined as:
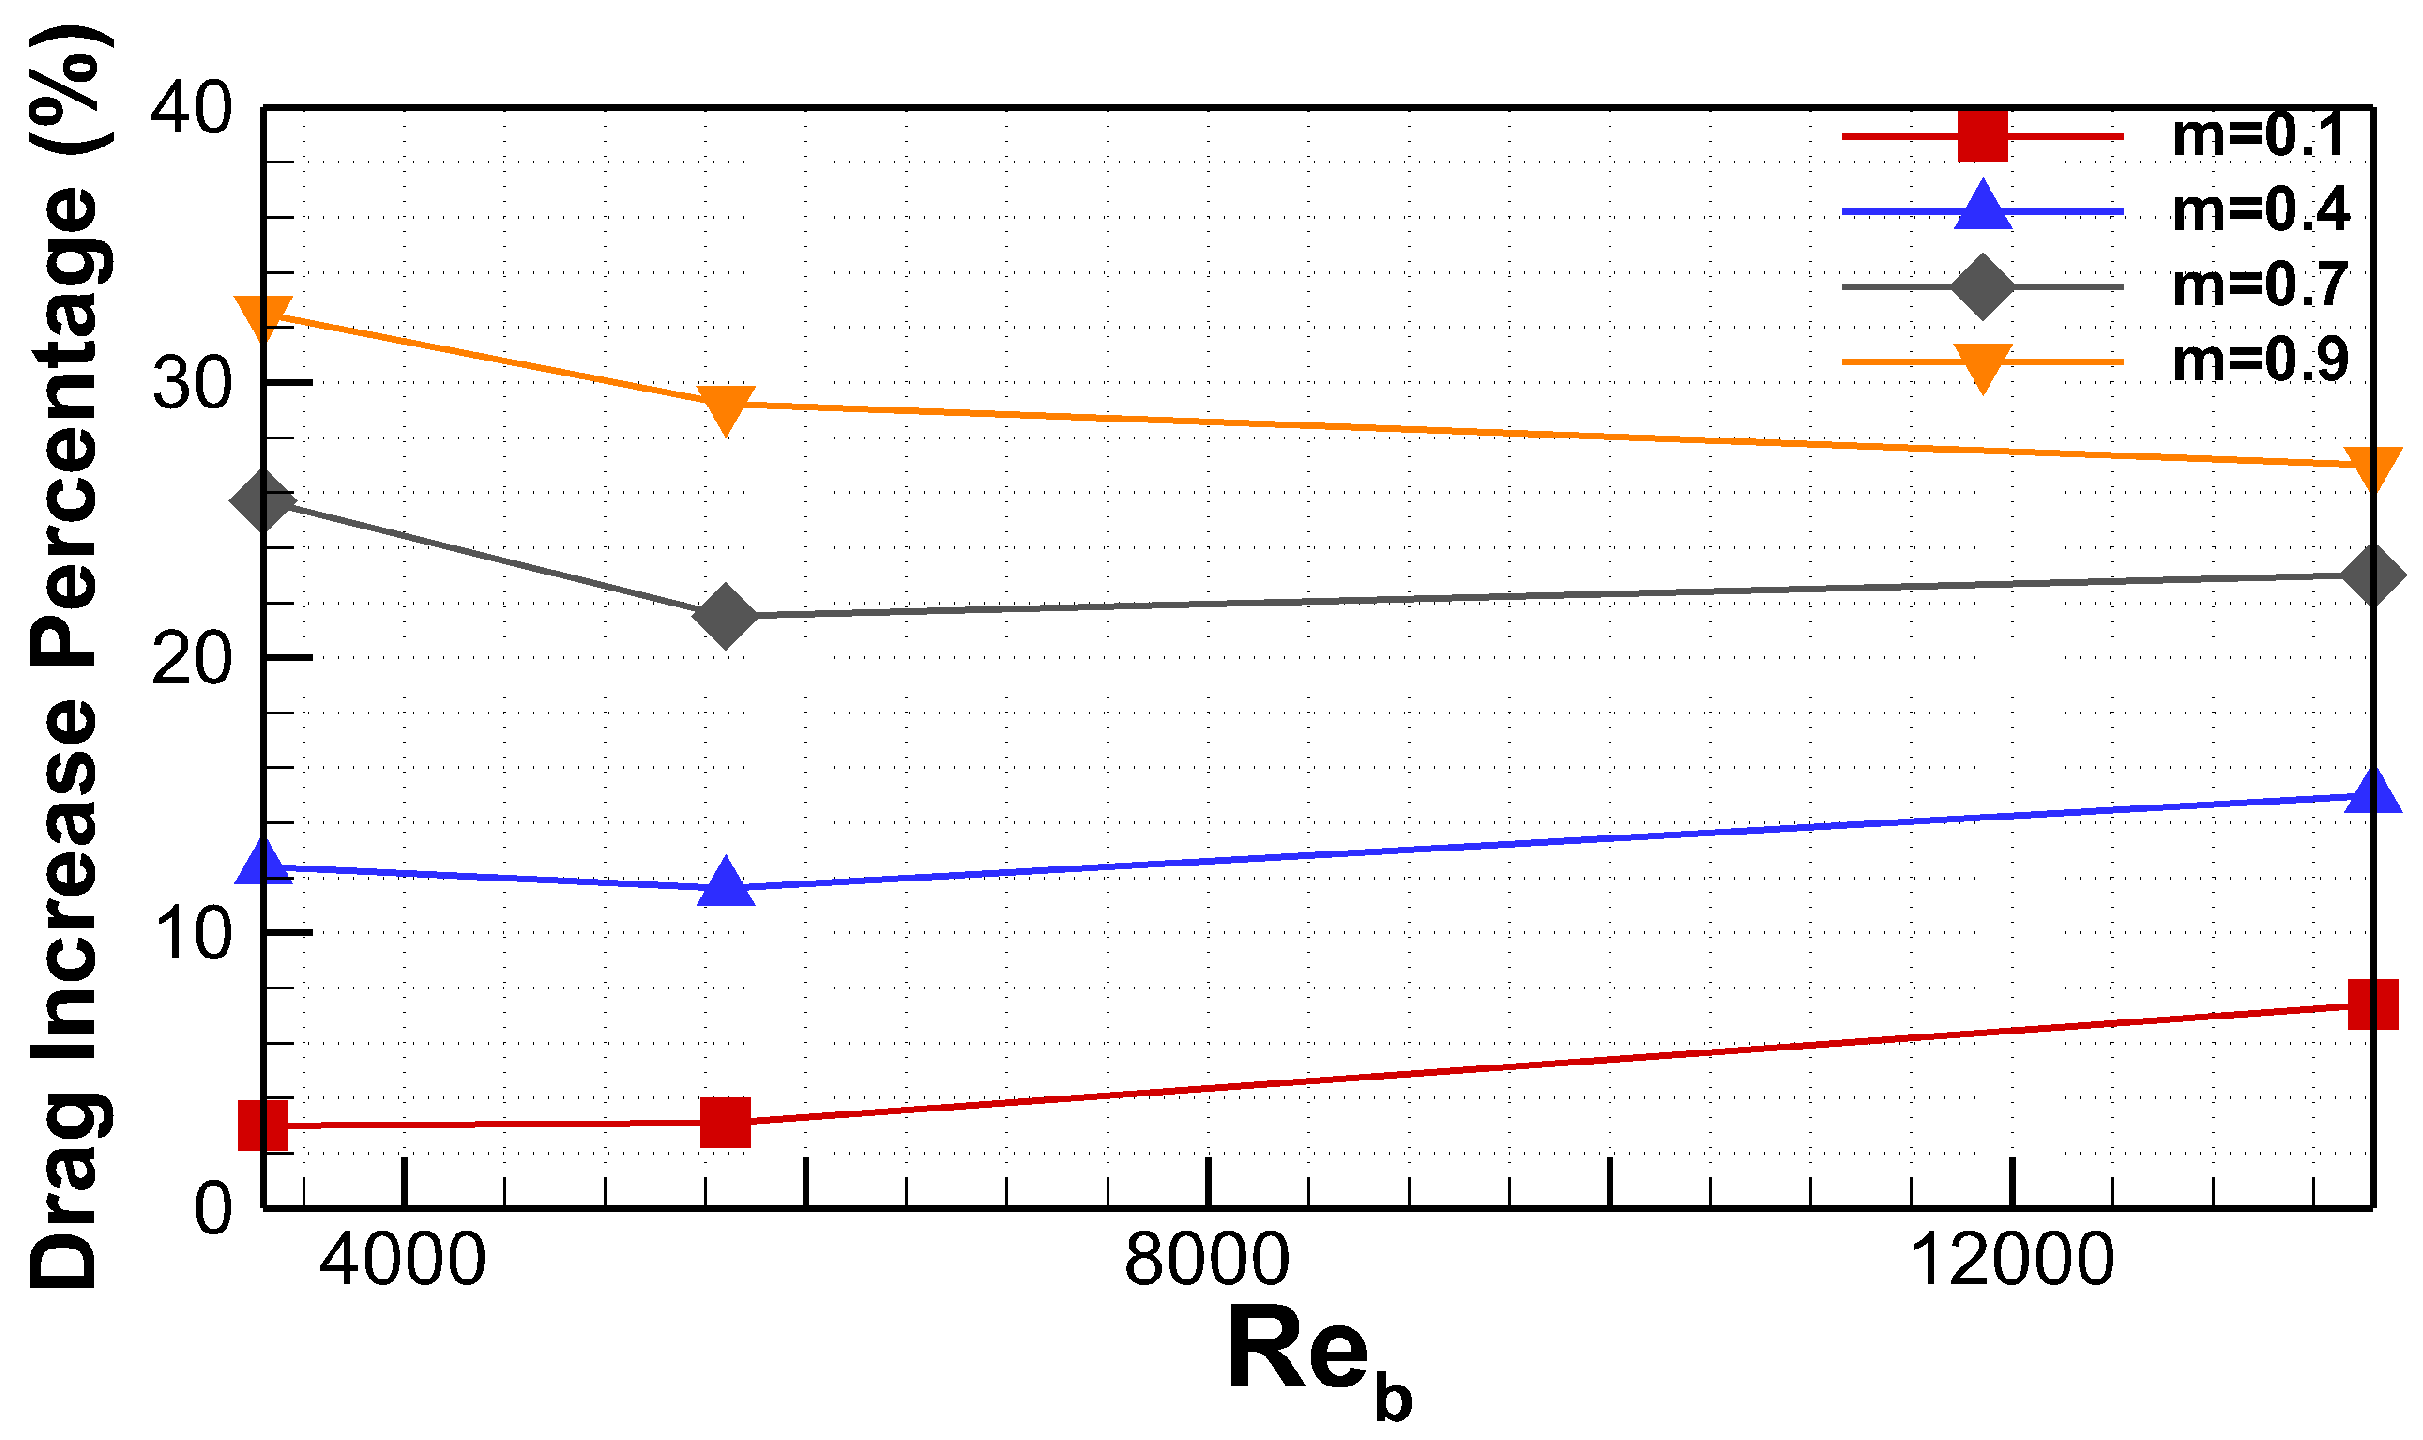
Variables in Equation (3) with subscript 0 refer to Newtonian values, while those without to micropolar. The strategy of analysis has been kept the same as in previous studies of non-Newtonian and polymer flows [2], by plotting results in terms of their drag increase percentage, in Figure 2, where two different trends can be detected depending on and viscosity ratio m.
For a relatively low values of viscosity ratio, , drag increase percentage reaches higher values as increases, a behavior similar to the Newtonian one. On the other hand, for a higher viscosity ratio, , the percentage of drag increase drops for higher . Even for this case though, there is no drag reduction as compared to the Newtonian case. Still, a reverse behavior exists in comparison with lower of same viscosity ratio, which would probably lead to even lower values of drag increment as increases. There seems to exist a certain threshold, connected with a combination of m and , above which no further drag increase is possible. In-between values of and , present a rather unstable behavior (more evident in the case), which probably marks the transition to the behavior that has been described before.
Findings in terms of drag modulation presented in Figure 2, are in alignment with those that have been found above in Figure 1. In similar reports of fluid flows with internal microstructure [26], drag and turbulence modulation have been connected to the solid-phase contribution to production and dissipation of turbulent kinetic energy (TKE) of the fluid phase. In this context, the investigation of the present model’s TKE budget is appropriate in order to further explain the observed behavior. The equation for the plane-averaged turbulence kinetic energy is , and the budget may be written as:
The terms of Equation (4) are, respectively, the production of kinetic energy due to velocity gradient, transport of kinetic energy by the turbulent velocity fluctuations, the viscous diffusion rate, the transport by pressure fluctuations p, production of kinetic energy due to micropolar velocity and the dissipation rate. We choose to focus on these terms that are directly connected to turbulence production or dissipation of the fluid flow. Usually, the main term that enhances turbulence is the production term calculated as:
Previous studies [27] in the Newtonian turbulent regime have shown that as increases, turbulence increases as well, through enhancement of the production term. The same also holds true for the dissipation term in Equation (6), which is responsible for loss of kinetic energy:
In the present case, as micropolar effects and increase, turbulence presents a non-monotonic behavior. Once again, energy loss through the dissipation term reaches higher values for the cases of higher turbulence. In contrast with what has been described above for Newtonian flows, the kinetic energy production term drops as m increases, a fact which indicates that an additional turbulence production mechanism should be present. This term comes from the micropolar velocity contribution to the turbulent kinetic energy balance and is given by:
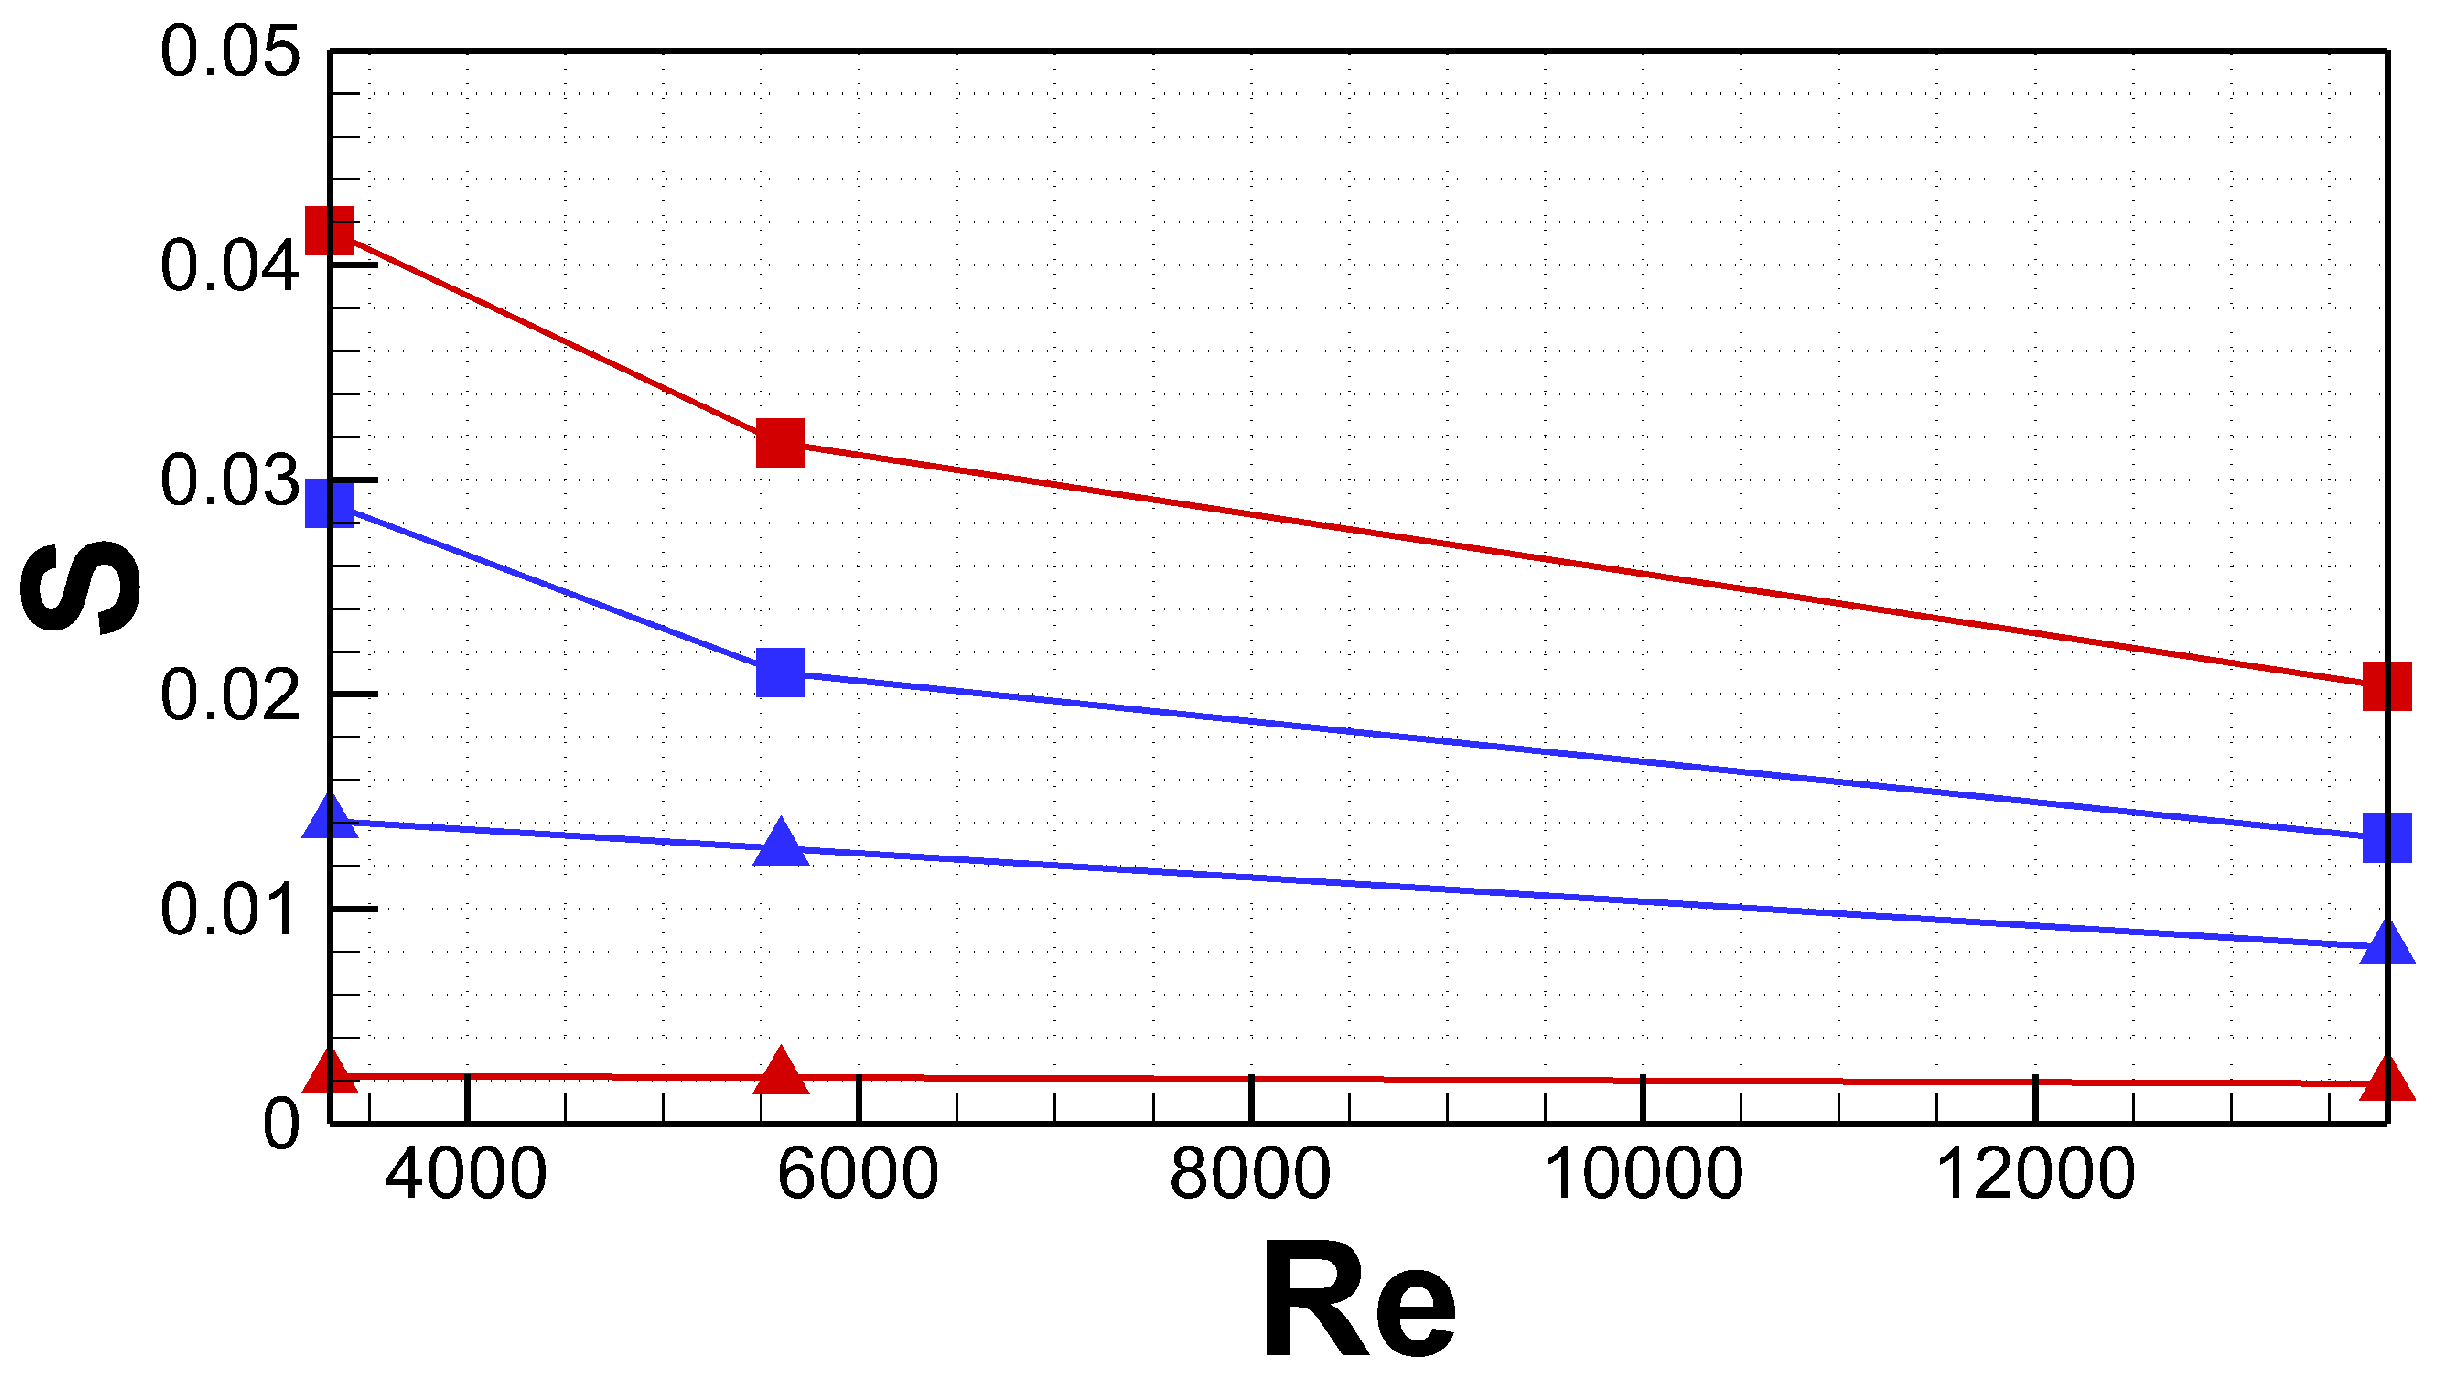
In order to present a better visualization of the and viscosity parameter effect on turbulence production, normalized micropolar () and velocity gradient production () terms have been integrated from 0 to h, and results are presented in Figure 3. Interestingly here it can be observed, that for both cases of micropolar viscosity, the integral of the velocity gradient production term drops to lower values as increases. On the other hand, the behavior of the micropolar production term integral varies for the different cases of m. More specifically, for the lower case of , there is almost no noticeable change as increases, while there is a sharp drop for the case of . Here lies the probable explanation of the behavior previously described in this letter. The micropolar production term provides the ability to the flow, to sustain higher turbulence and drag, this is also the reason why, compared to the Newtonian case, all micropolar cases present enhanced turbulence and drag. The attenuation of the micropolar production though, for the case of as increases, forces the normalized velocity profile to collapse to higher values as presented in Figure 1.
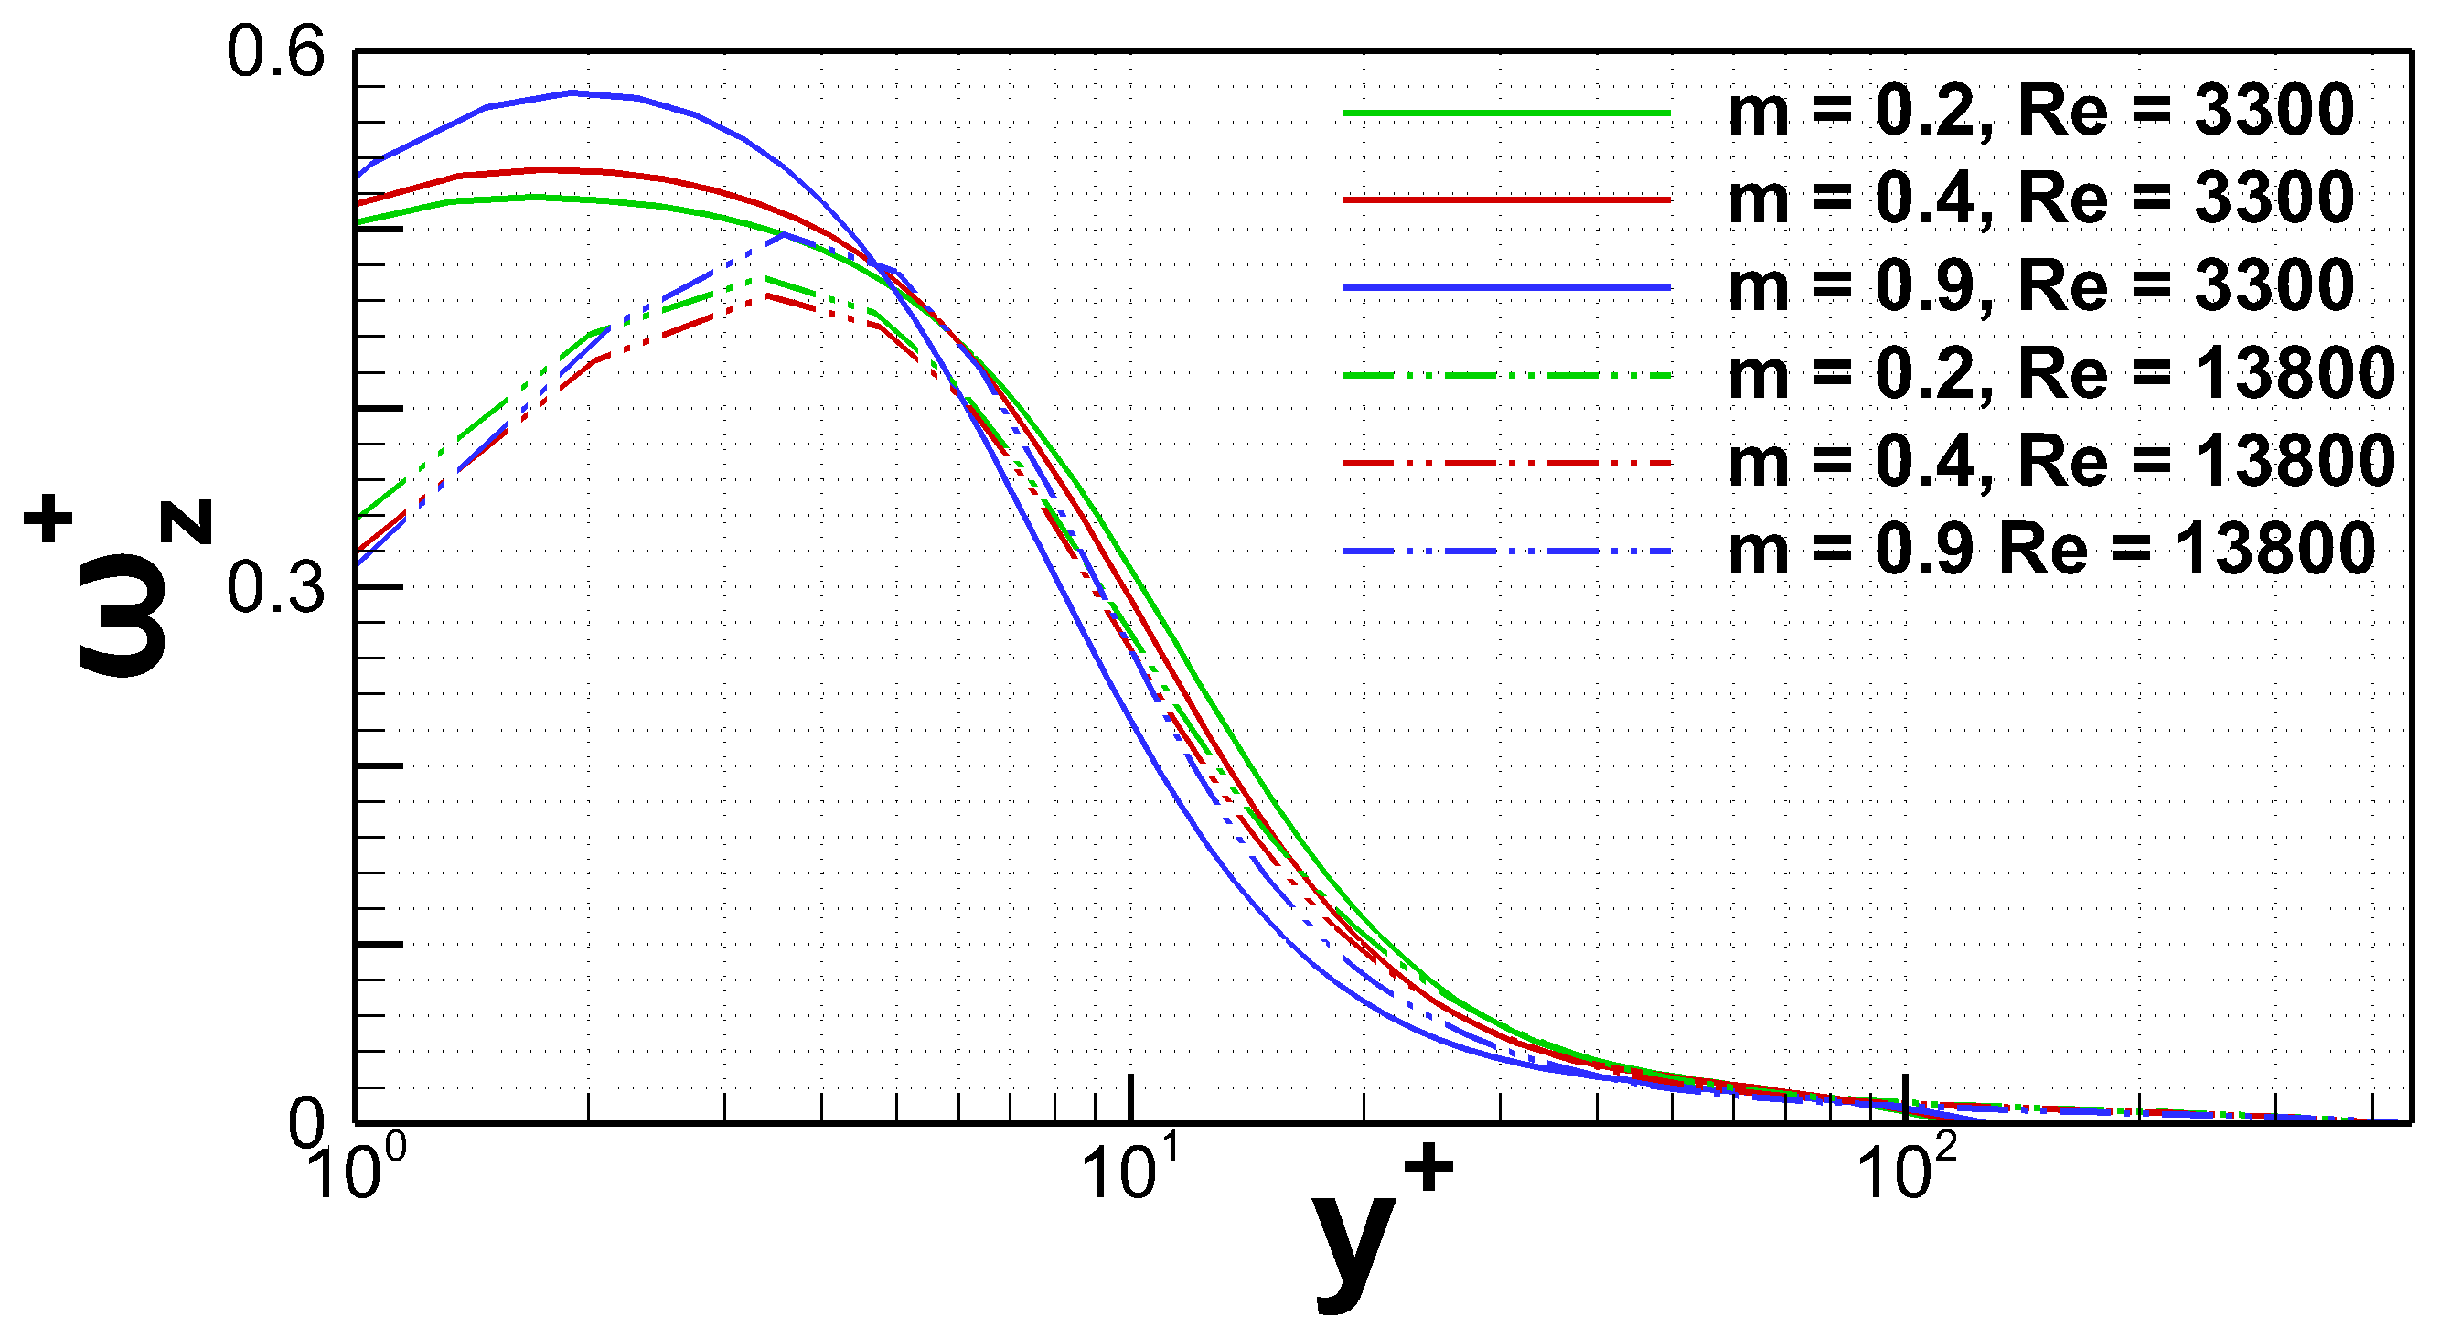
The observation above is further enhanced by examining results of the normalized micropolar velocity, , which has been plotted in Figure 4 along for various m and . In order to keep the results presentation comprehensible, only two values of have been selected to be presented here (), along with three different values of the viscosity parameter ( and ). Mean value of micropolar velocity survives only in the spanwise direction and is of the same nature as vorticity, but in an active way representing an additional force acting on the flow. The fact that for higher , normalized micropolar velocity drops to lower values, while at the same time moves away from the wall, not only enhances our previous findings, but also adds more information. Essentially, this leads to the conclusion that the additional micropolar force suppresses near-wall turbulence and leads turbulent activity away from the wall.
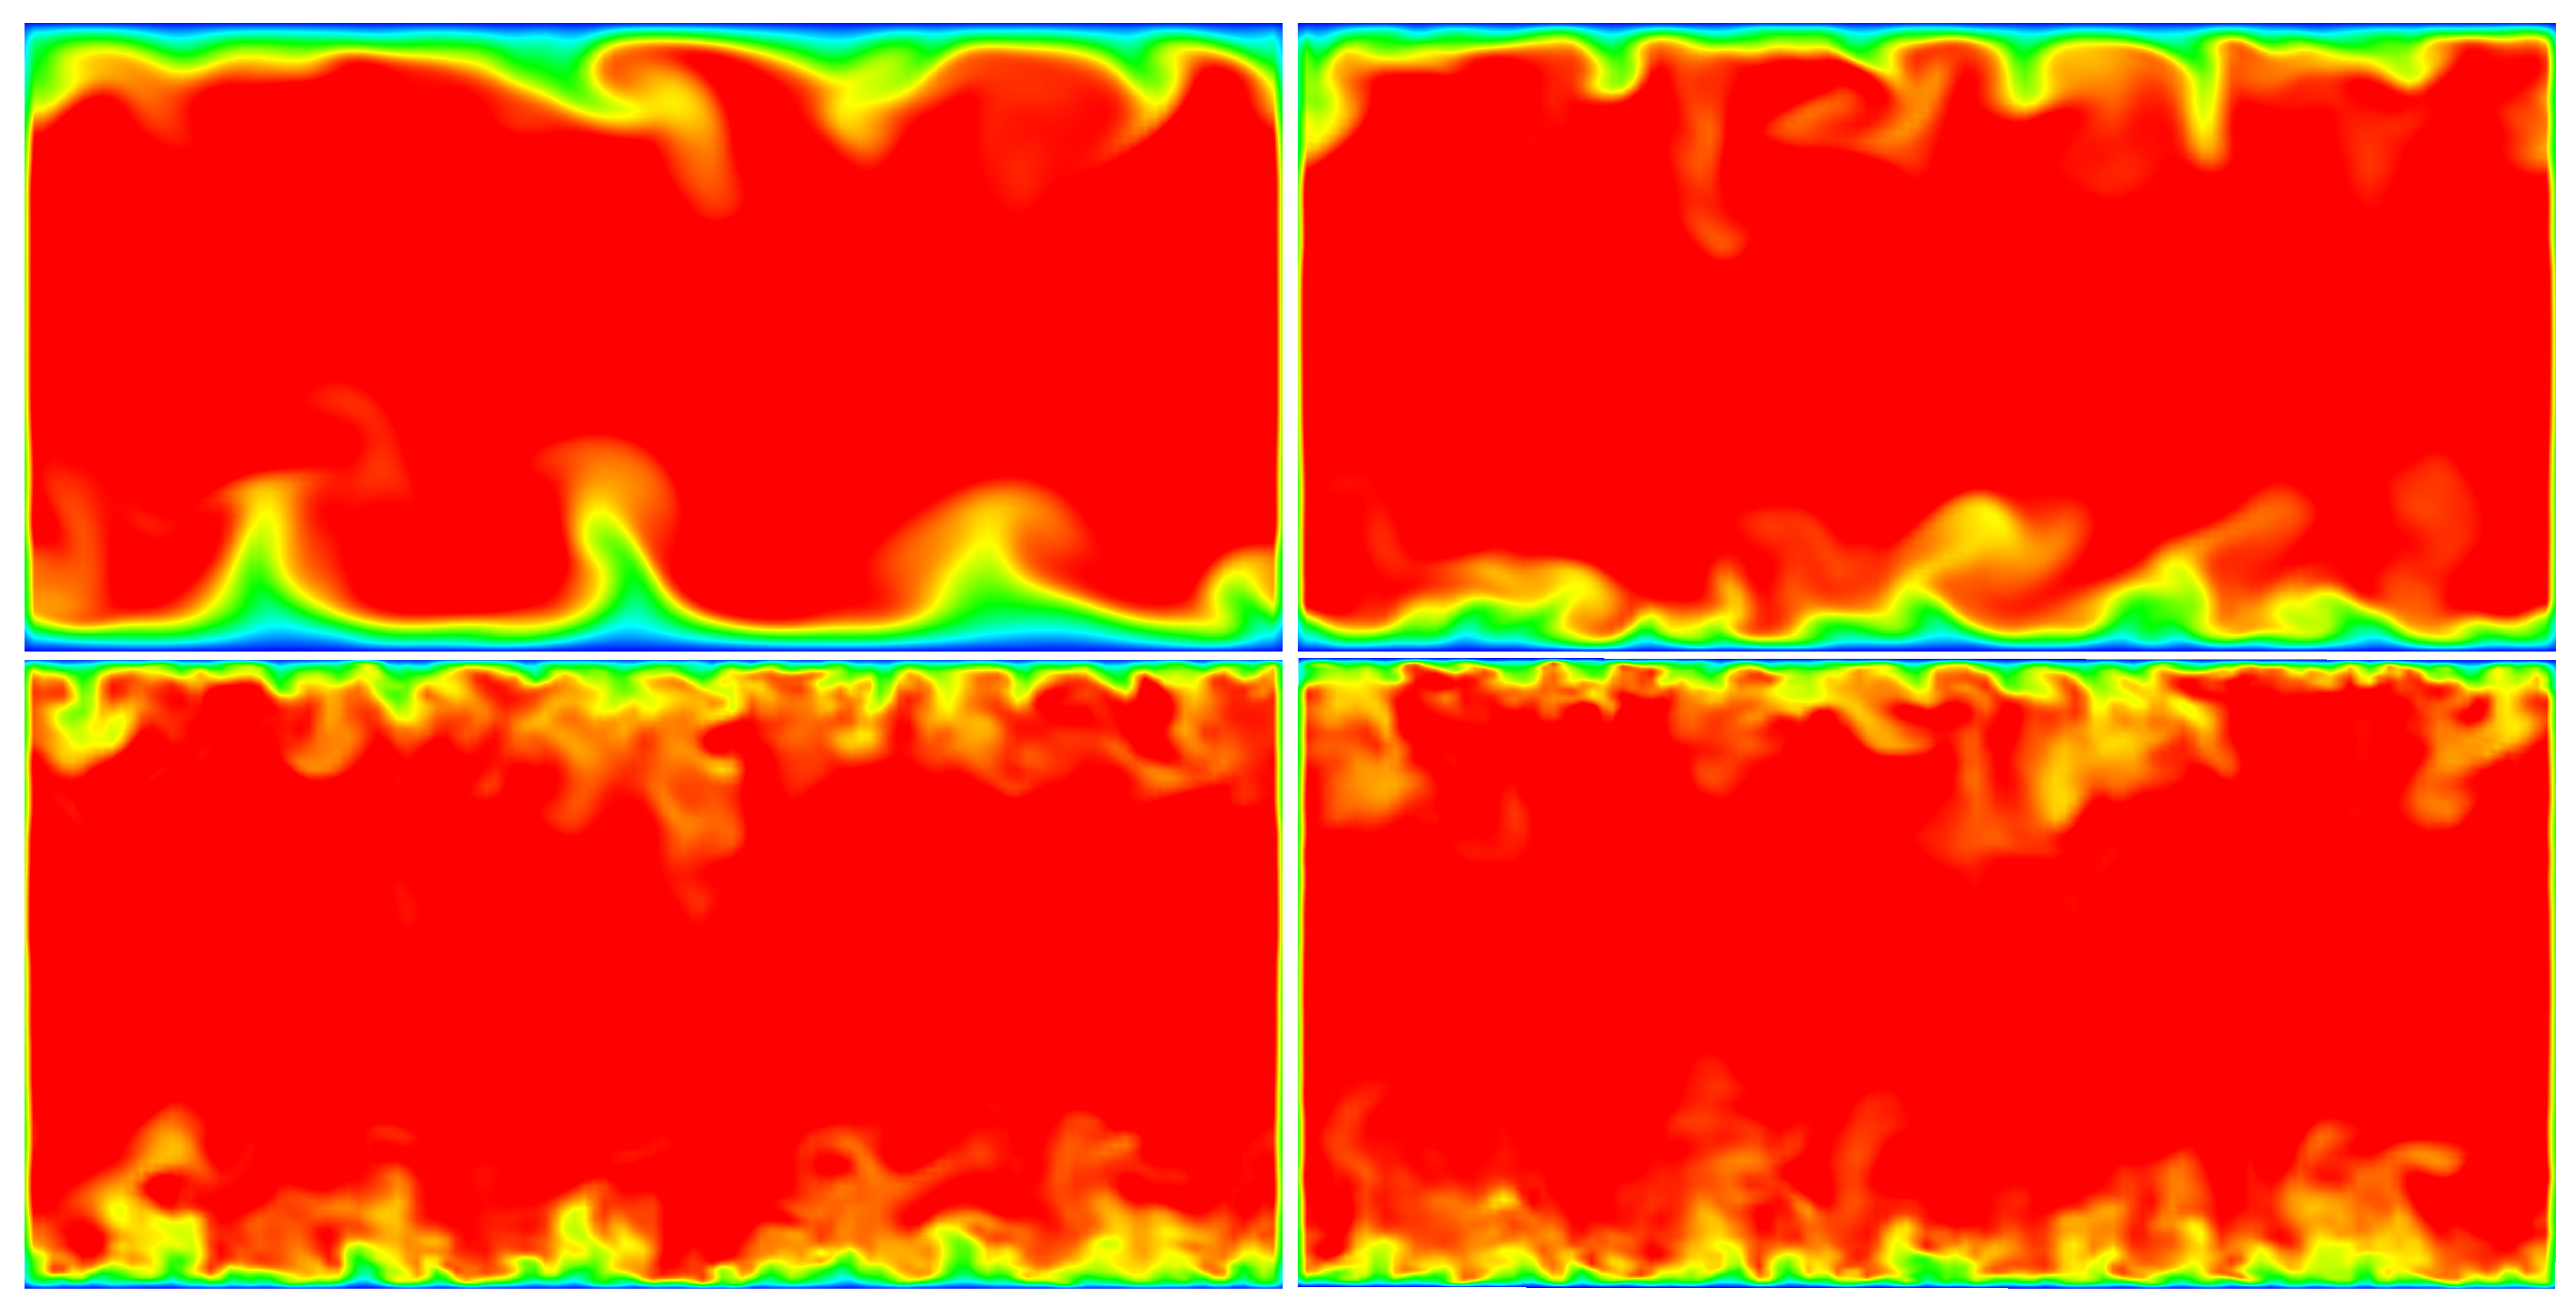
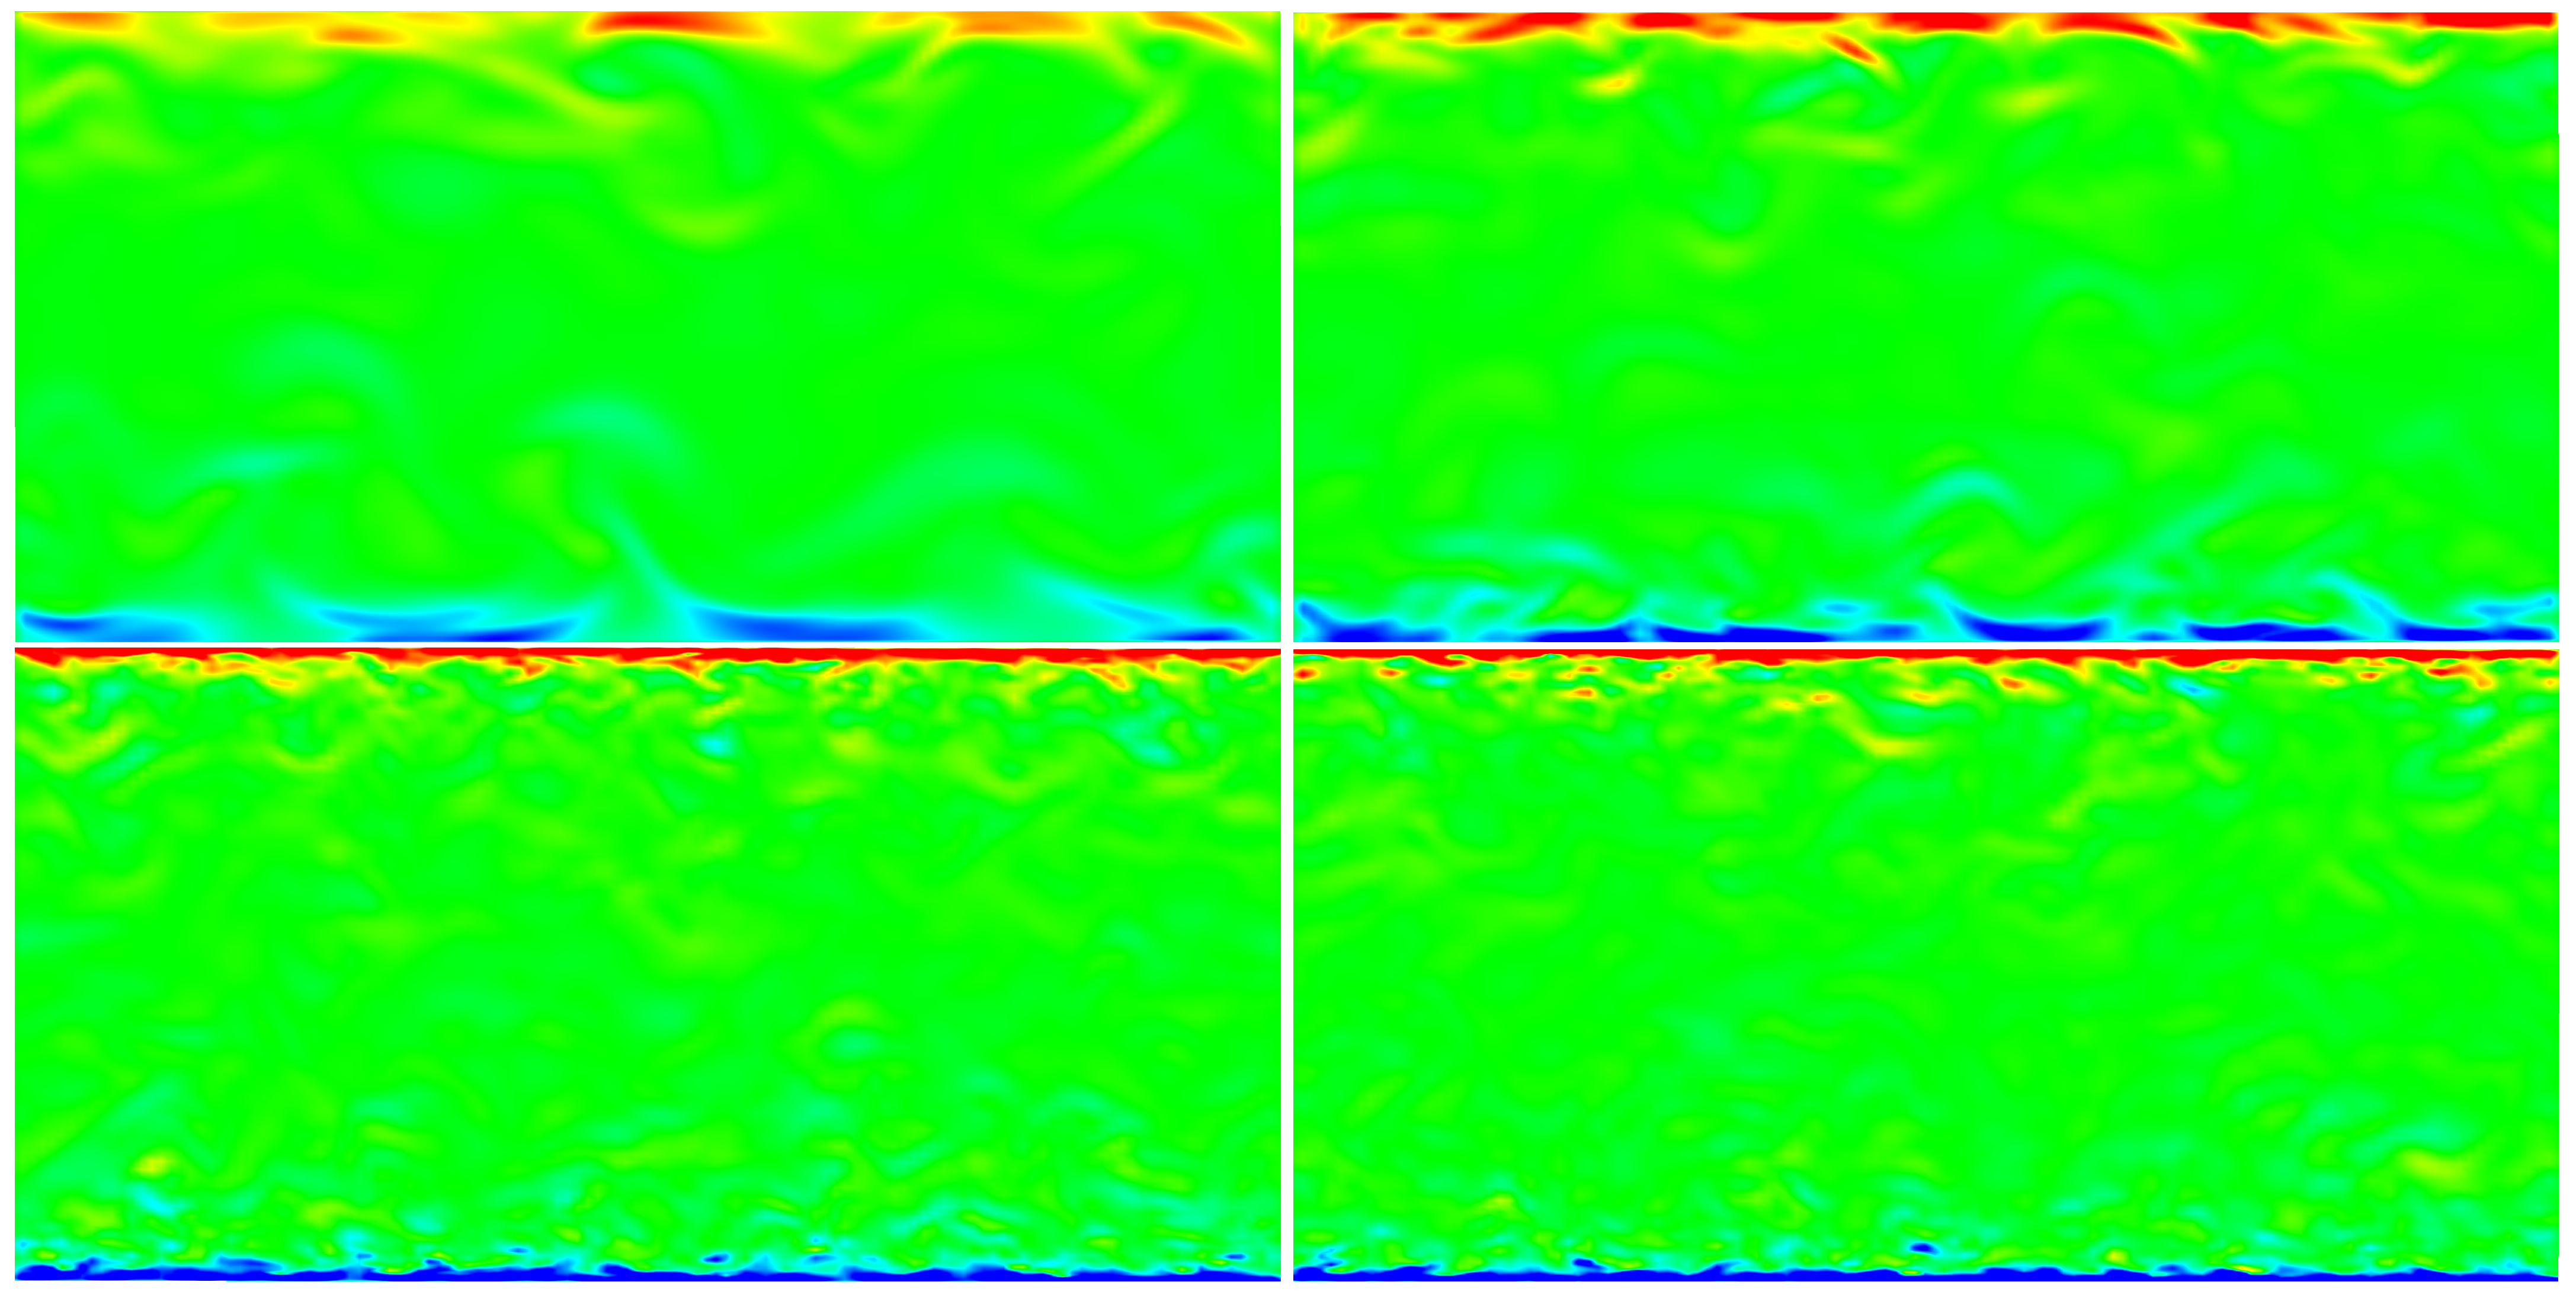
Finally, in order to have a better visualization of the physical phenomena that have been described above, 2D snapshots of the streamwise Newtonian and spanwise micropolar velocity have been plotted in Figure 5 and Figure 6. In Figure 5, the flow field reveals greater turbulence intensity as and viscosity parameter m increase, while turbulent phenomena become more intense closer to the wall. Furthermore, in Figure 6 for cases of higher and viscosity ratio m, micropolar velocity develops a thinner layer closer to the wall in contrast to the cases of lower . This observation confirms our previous claims that the additional micropolar force term suppresses near-wall turbulence and enforces the departure of turbulent activity from the walls.
4. Conclusions
Summarizing, the micropolar fluid model has been employed in order to explore the turbulent regime, as well as turbulence modulation, of channel fluid flows with internal microstructure. Direct numerical simulations have been used for the computational experiments, while constants and material parameters have been based on biological flow values in order to obtain more realistic results [18]. Three different bulk Reynolds numbers have been selected in order to explore the turbulent regime = 3300, 5600, 138,800, while the micropolar parameter m has been given values from 0 to 0.9, and the rest of the parameters have been kept constant. The selection to vary only m was based on the direct impact that this parameter has on the flow field equations.
Present study results have been compared against previous well established turbulent flow cases [22,23,24,25] and presented excellent agreement. In addition, they revealed a non-monotonic behavior of turbulence and drag depending on the viscosity ratio parameter m and . Thus, for sufficiently high values of m and , energy production due to the micropolar effect drops to lower values indicating lower turbulence intensity. Results have been further supported by the normalized mean micropolar velocity plot, where curves of higher collapse to lower values while they also move further away from the wall, indicating that near-wall turbulence is suppressed by the activity of the additional micropolar force term for high . Finally, 2D contours of the Newtonian and micropolar velocities have been presented, where the flow physics described above could be better visualized.
The present study reveals for the first time the turbulence modulation of a micropolar fluid flow, considering three different . The flow physics phenomena that have been revealed present a particular interest not only for the micropolar class of fluids, but also for the more general non-Newtonian flow field, where their behavior in the turbulent regime remains still not fully described. Thus, for the reasons stated above, this study is ranked among pioneer ones.
Author Contributions
Conceptualization, G.S. and I.S.; methodology, I.S.; software, G.S.; validation, G.S.; formal analysis, G.S. and I.S.; investigation, G.S.; resources, I.S.; data curation, G.S.; writing—original draft preparation, G.S.; writing—review and editing, I.S.; visualization, G.S.; supervision, I.S.; project administration, I.S. Both authors have read and agreed to the published version of the manuscript.
Funding
No external funding received.
Institutional Review Board Statement
Not applicable.
Informed Consent Statement
Not applicable.
Data Availability Statement
The data presented in this study are available in the displayed figures and tables within the article, but can also be obtained on request from the corresponding author within a reasonable time-frame.
Acknowledgments
The authors would like to acknowledge the support of the Greek Research and Technology Network (GRNET) for the computational time granted in the National HPC facility ARIS.
Conflicts of Interest
The authors declare no conflict of interest.
References
- Lumley, J.L. Drag reduction by additives. Annu. Rev. Fluid Mech. 1969, 1, 367. [Google Scholar] [CrossRef]
- Dallas, V.; Vassilicos, J.C.; Hewitt, G.F. Strong polymer-turbulence interactions in viscoelastic turbulent channel flow. Phys. Rev. E 2010, 82, 066303. [Google Scholar] [CrossRef] [Green Version]
- Toms, B.A. Some observations on the flow of linear polymer solutions through straight tubes at large Reynolds numbers. In Proceedings of the 1st International Congress on Rheology, North-Holland, Amsterdam, 1 January 1949; Volume 2, p. 135. [Google Scholar]
- Graham, M.D. Drag reduction in turbulent flow of polymer solutions. Rheol. Rev. 2004, 2, 143–170. [Google Scholar]
- White, C.M.; Mungal, G. Mechanics and prediction of turbulent drag reduction with polymer additives. Annu. Rev. Fluid Mech. 2008, 40, 235. [Google Scholar] [CrossRef]
- Picano, F.; Breugem, W.P.; Brandt, L. Turbulent channel flow of dense suspensions of neutrally buoyant spheres. J. Fluid Mech. 2015, 764, 463–487. [Google Scholar] [CrossRef] [Green Version]
- Matas, J.P.; Morris, J.F.; Guazzelli, E. Transition to turbulence in particulate pipe flow. Phys. Rev. Lett. 2003, 90, 014501. [Google Scholar] [CrossRef] [Green Version]
- Yu, Z.; Wu, T.; Shao, X.; Lin, J. Numerical studies of the effects of large neutrally buoyant particles on the flow instability and transition to turbulence in pipe flow. Phys. Fluids 2013, 25, 043305. [Google Scholar] [CrossRef]
- Zhao, L.H.; Andersson, H.I.; Gillisen, J.J.J. Turbulence modulation and drag reduction by spherical particles. Phys. Fluids 2010, 22, 081702. [Google Scholar] [CrossRef] [Green Version]
- Gore, R.A.; Crowe, C.T. Modulation of turbulence by a dispersed phase. Trans. ASME J. Fluids Eng. 1991, 113, 304. [Google Scholar] [CrossRef]
- Eringen, A.C. Theory of Micropolar Fluids; Technical Report; Purdue University: West Lafayette, Indiana, 1965; Volume 27. [Google Scholar]
- Mitarai, N.; Hayakawa, H.; Nakanishi, H. Collisional granular flow as a micropolar fluid. Phys. Rev. Lett. 2002, 88, 174301-1. [Google Scholar] [CrossRef] [Green Version]
- Lukaszewicz, G. Micropolar Fluids: Theory and Applications; Springer Science & Business Media: Berlin/Heidelberg, Germany, 1999. [Google Scholar]
- Kulick, J.D.; Fessler, J.R.; Eaton, J.K. Particle response and turbulence modification in fully developed channel flow. J. Fluid Mech. 1994, 277, 109–134. [Google Scholar] [CrossRef]
- Pan, Y.; Banerjee, S. Numerical simulation of particle interactions with wall turbulence. Phys. Fluids 1996, 8, 2733–2755. [Google Scholar] [CrossRef]
- Eringen, A.C. Theory of micropolar fluids. J. Math. Mech. 1966, 16, 1–18. [Google Scholar] [CrossRef]
- Cheikh, M.I.; Chen, J.; Wei, M. Small-scale energy cascade in homogeneous isotropic turbulence. Phys. Rev. Fluids 2019, 4, 104610. [Google Scholar] [CrossRef]
- Ariman, T.; Turk, M.A.; Sylvester, N.D. On steady and pulsatile flow of blood. J. Appl. Mech. 1974, 41. [Google Scholar] [CrossRef]
- Karvelas, E.G.; Tsiantis, A.; Papathanasiou, T.D. Effect of micropolar fluid properties on the hydraulic permeability of fibrous biomaterials. Comput. Methods Programs Biomed. 2020, 185, 105135. [Google Scholar] [CrossRef] [PubMed]
- Wanik, A.; Schnell, U. Some remarks on the PISO and SIMPLE algorithms for steady turbulent flow problems. Comput. Fluids 1989, 17, 555–570. [Google Scholar] [CrossRef]
- Barton, I.E. Comparison of SIMPLE-and PISO-type algorithms for transient flows. Int. J. Numer. Methods Fluids 1998, 26, 459–483. [Google Scholar] [CrossRef]
- Tsukahara, T.; Seki, Y.; Kawamura, H.; Tochio, D. DNS of turbulent channel flow at very low Reynolds numbers. In Fourth International Symposium on Turbulence and Shear Flow Phenomena; Begel House Inc.: Danbury, CT, USA, 2005. [Google Scholar]
- Kim, J.; Moin, P.; Moser, R. Turbulence statistics in fully developed channel flow at low Reynolds number. J. Fluid Mech. 1987, 177, 133–166. [Google Scholar] [CrossRef] [Green Version]
- Moser, R.D.; Kim, J.; Mansour, N.N. Direct numerical simulation of turbulent channel flow up to Reτ = 590. Phys. Fluids 1999, 11, 943–945. [Google Scholar] [CrossRef]
- Rashidi, M.; Hetsroni, G.; Banerjee, S. Particle-turbulence interaction in a boundary layer. Int. J. Multiph. Flow 1990, 16, 935–949. [Google Scholar] [CrossRef]
- Ardekani, M.N.; Brandt, L. Turbulence modulation in channel flow of finite-size spheroidal particles. J. Fluid Mech. 2019, 859, 887–901. [Google Scholar] [CrossRef] [Green Version]
- Abe, H.; Kawamura, H.; Matsuo, Y. Direct numerical simulation of a fully developed turbulent channel flow with respect to the Reynolds number dependence. J. Fluids Eng. 2001, 123, 382–393. [Google Scholar] [CrossRef]
Figure 1.
Normalized mean streamwise velocity distributions along , for: and cases plotted against results of [22,23,24,25].

Figure 2.
Drag increase percentage values () for: and 13,800 of the present: and cases.

Figure 3.
Integral values (S) of: (■) Velocity gradient production term, (▲) micropolar production term; (red line) , (blue line) plotted along and 13,800.
Figure 3.
Integral values (S) of: (■) Velocity gradient production term, (▲) micropolar production term; (red line) , (blue line) plotted along and 13,800.

Figure 4.
Normalized spanwise micropolar velocity () for: and 5600 of the present: and cases.

Figure 5.
Fluid flow snapshots of streamwise velocity via 2D graphs in the plane, from top to bottom: ; ; and . Contour levels: .
Figure 5.
Fluid flow snapshots of streamwise velocity via 2D graphs in the plane, from top to bottom: ; ; and . Contour levels: .

Figure 6.
Fluid flow snapshots of streamwise micropolar velocity via 2D graphs in the plane, from top to bottom: ; ; and . Contour levels: .
Figure 6.
Fluid flow snapshots of streamwise micropolar velocity via 2D graphs in the plane, from top to bottom: ; ; and . Contour levels: .

Publisher’s Note: MDPI stays neutral with regard to jurisdictional claims in published maps and institutional affiliations. |
© 2021 by the authors. Licensee MDPI, Basel, Switzerland. This article is an open access article distributed under the terms and conditions of the Creative Commons Attribution (CC BY) license (https://creativecommons.org/licenses/by/4.0/).
Share and Cite
MDPI and ACS Style
Sofiadis, G.; Sarris, I. Turbulence Intensity Modulation by Micropolar Fluids. Fluids 2021, 6, 195. https://doi.org/10.3390/fluids6060195
AMA Style
Sofiadis G, Sarris I. Turbulence Intensity Modulation by Micropolar Fluids. Fluids. 2021; 6(6):195. https://doi.org/10.3390/fluids6060195
Chicago/Turabian StyleSofiadis, George, and Ioannis Sarris. 2021. "Turbulence Intensity Modulation by Micropolar Fluids" Fluids 6, no. 6: 195. https://doi.org/10.3390/fluids6060195