
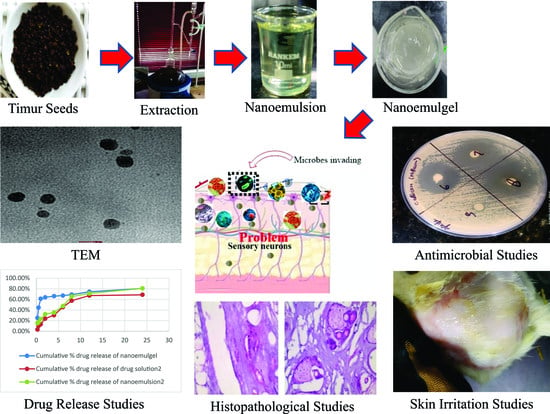
Development and Evaluation of Nanoformulations Containing Timur Oil and Rosemary Oil for Treatment of Topical Fungal Infections
 , ,
, ,  , and
, and
Abstract
:
1. Introduction
2. Results and Discussion
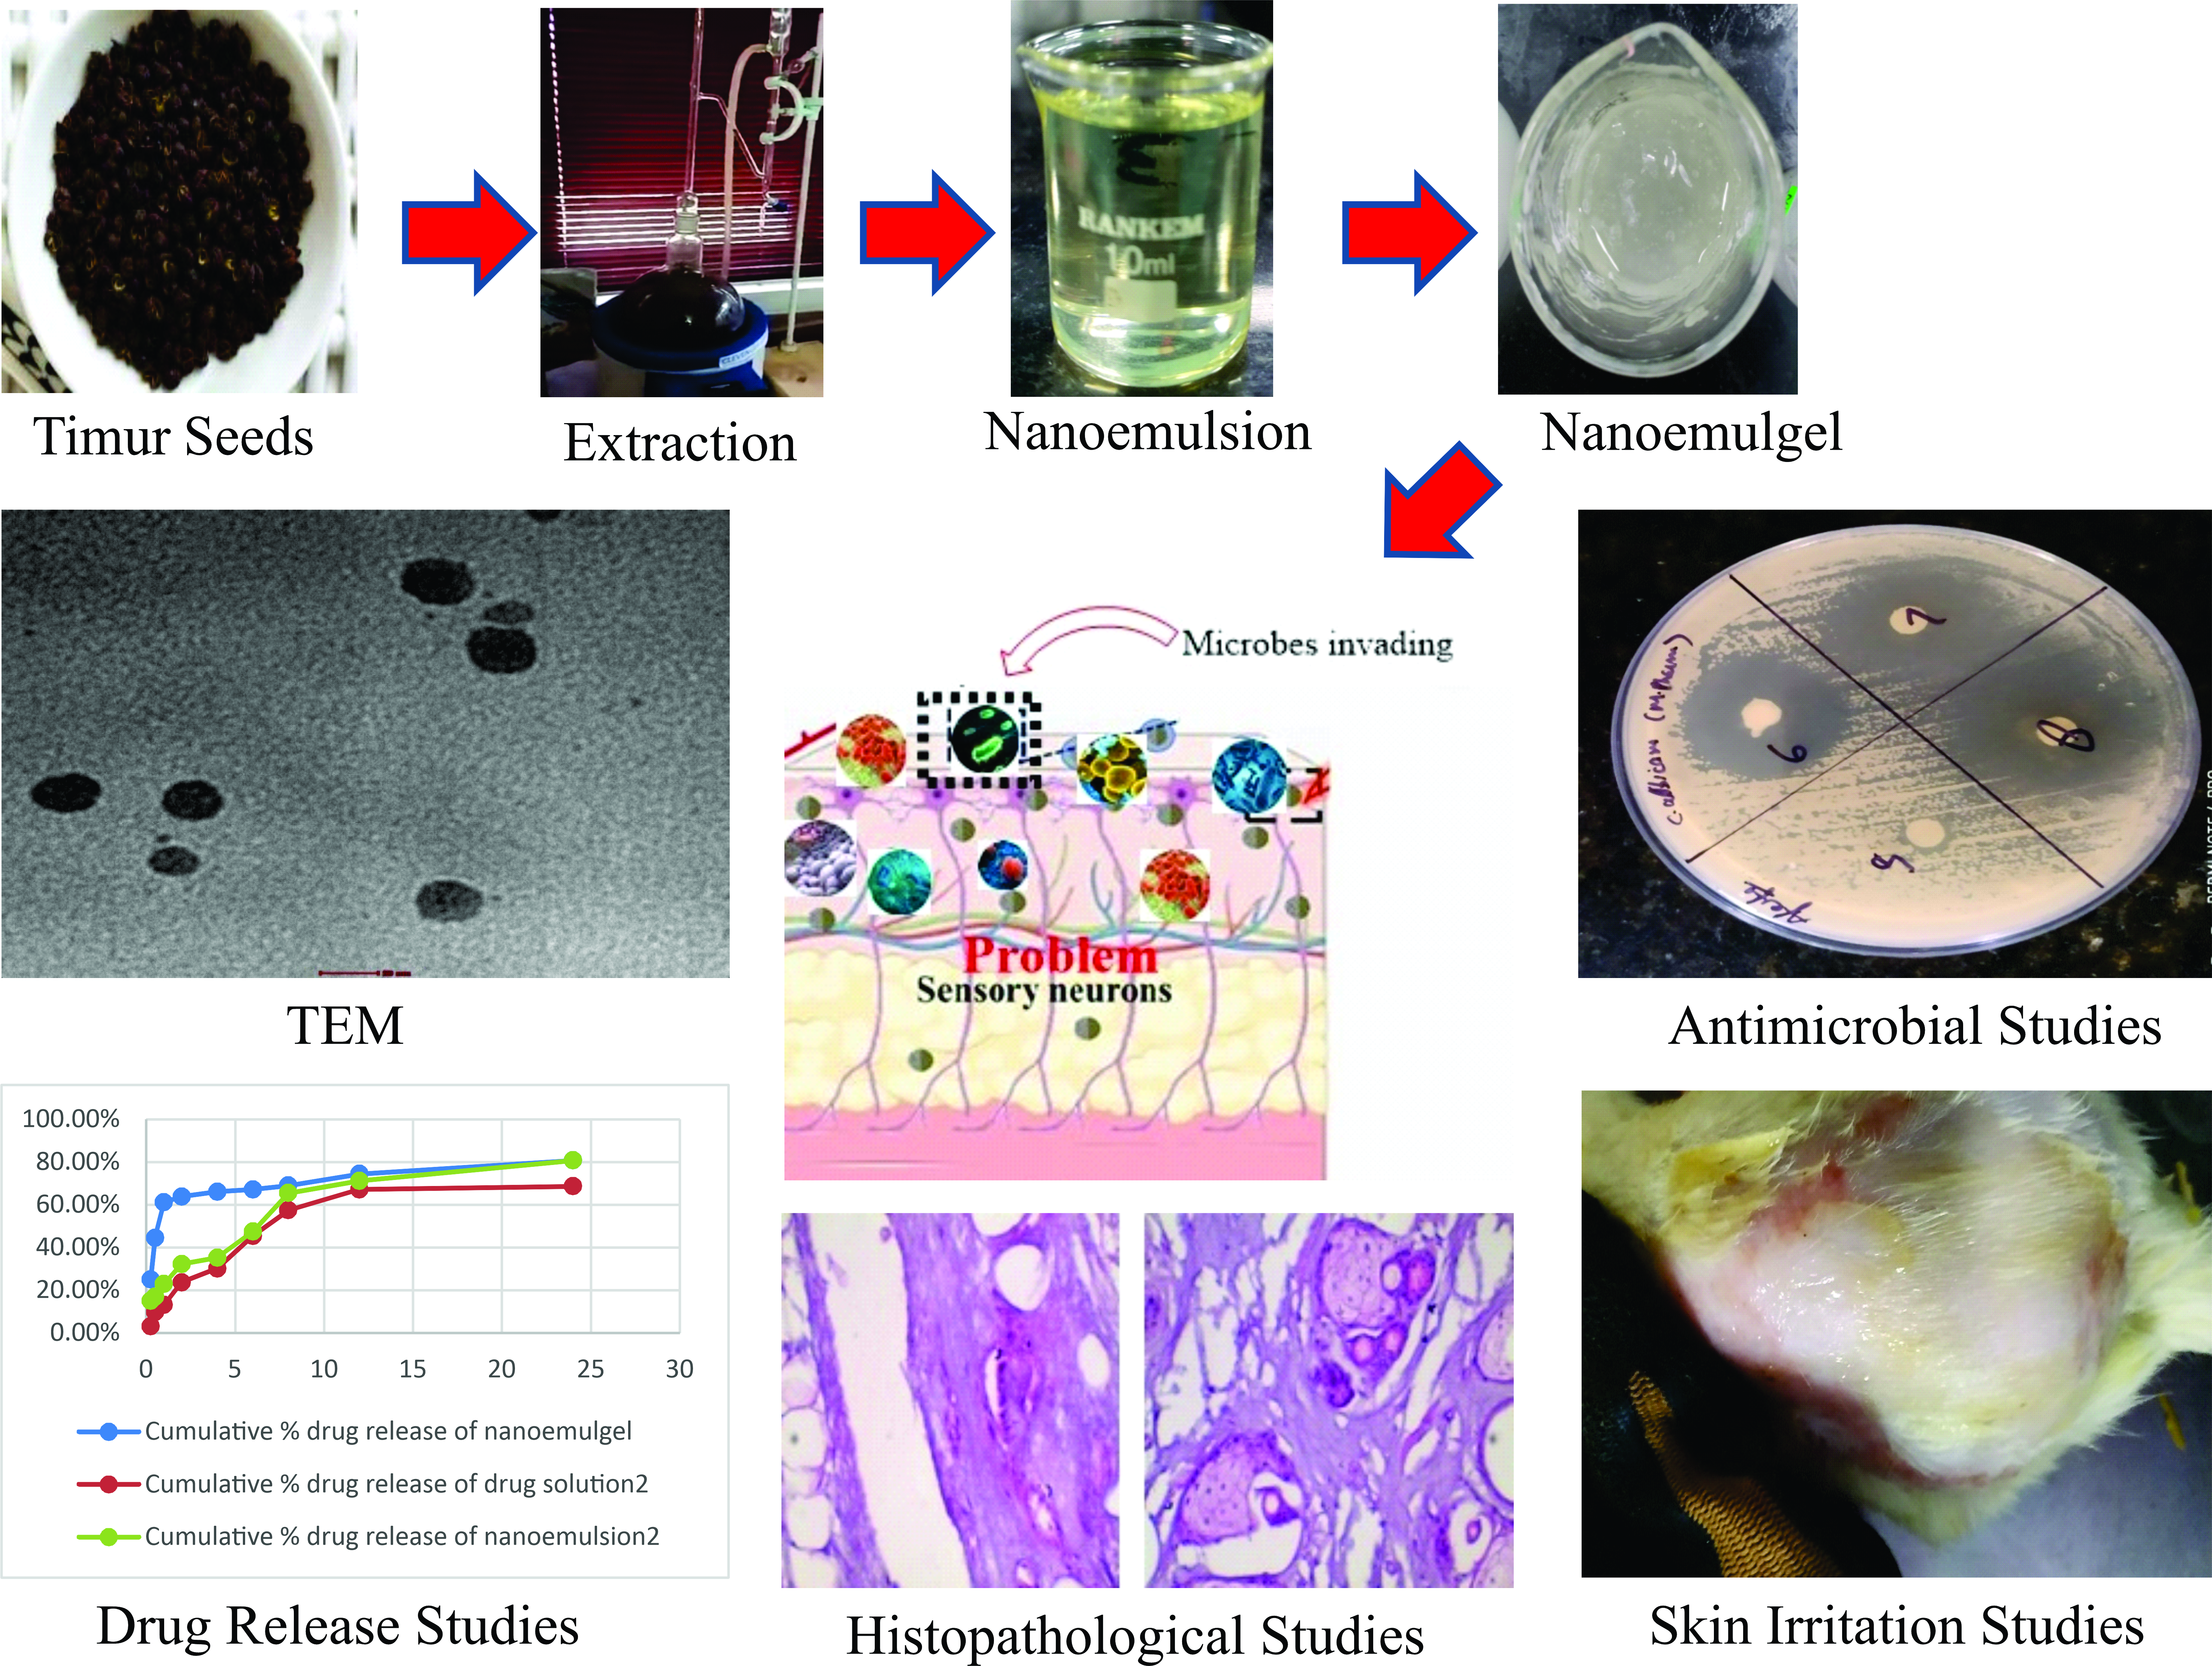
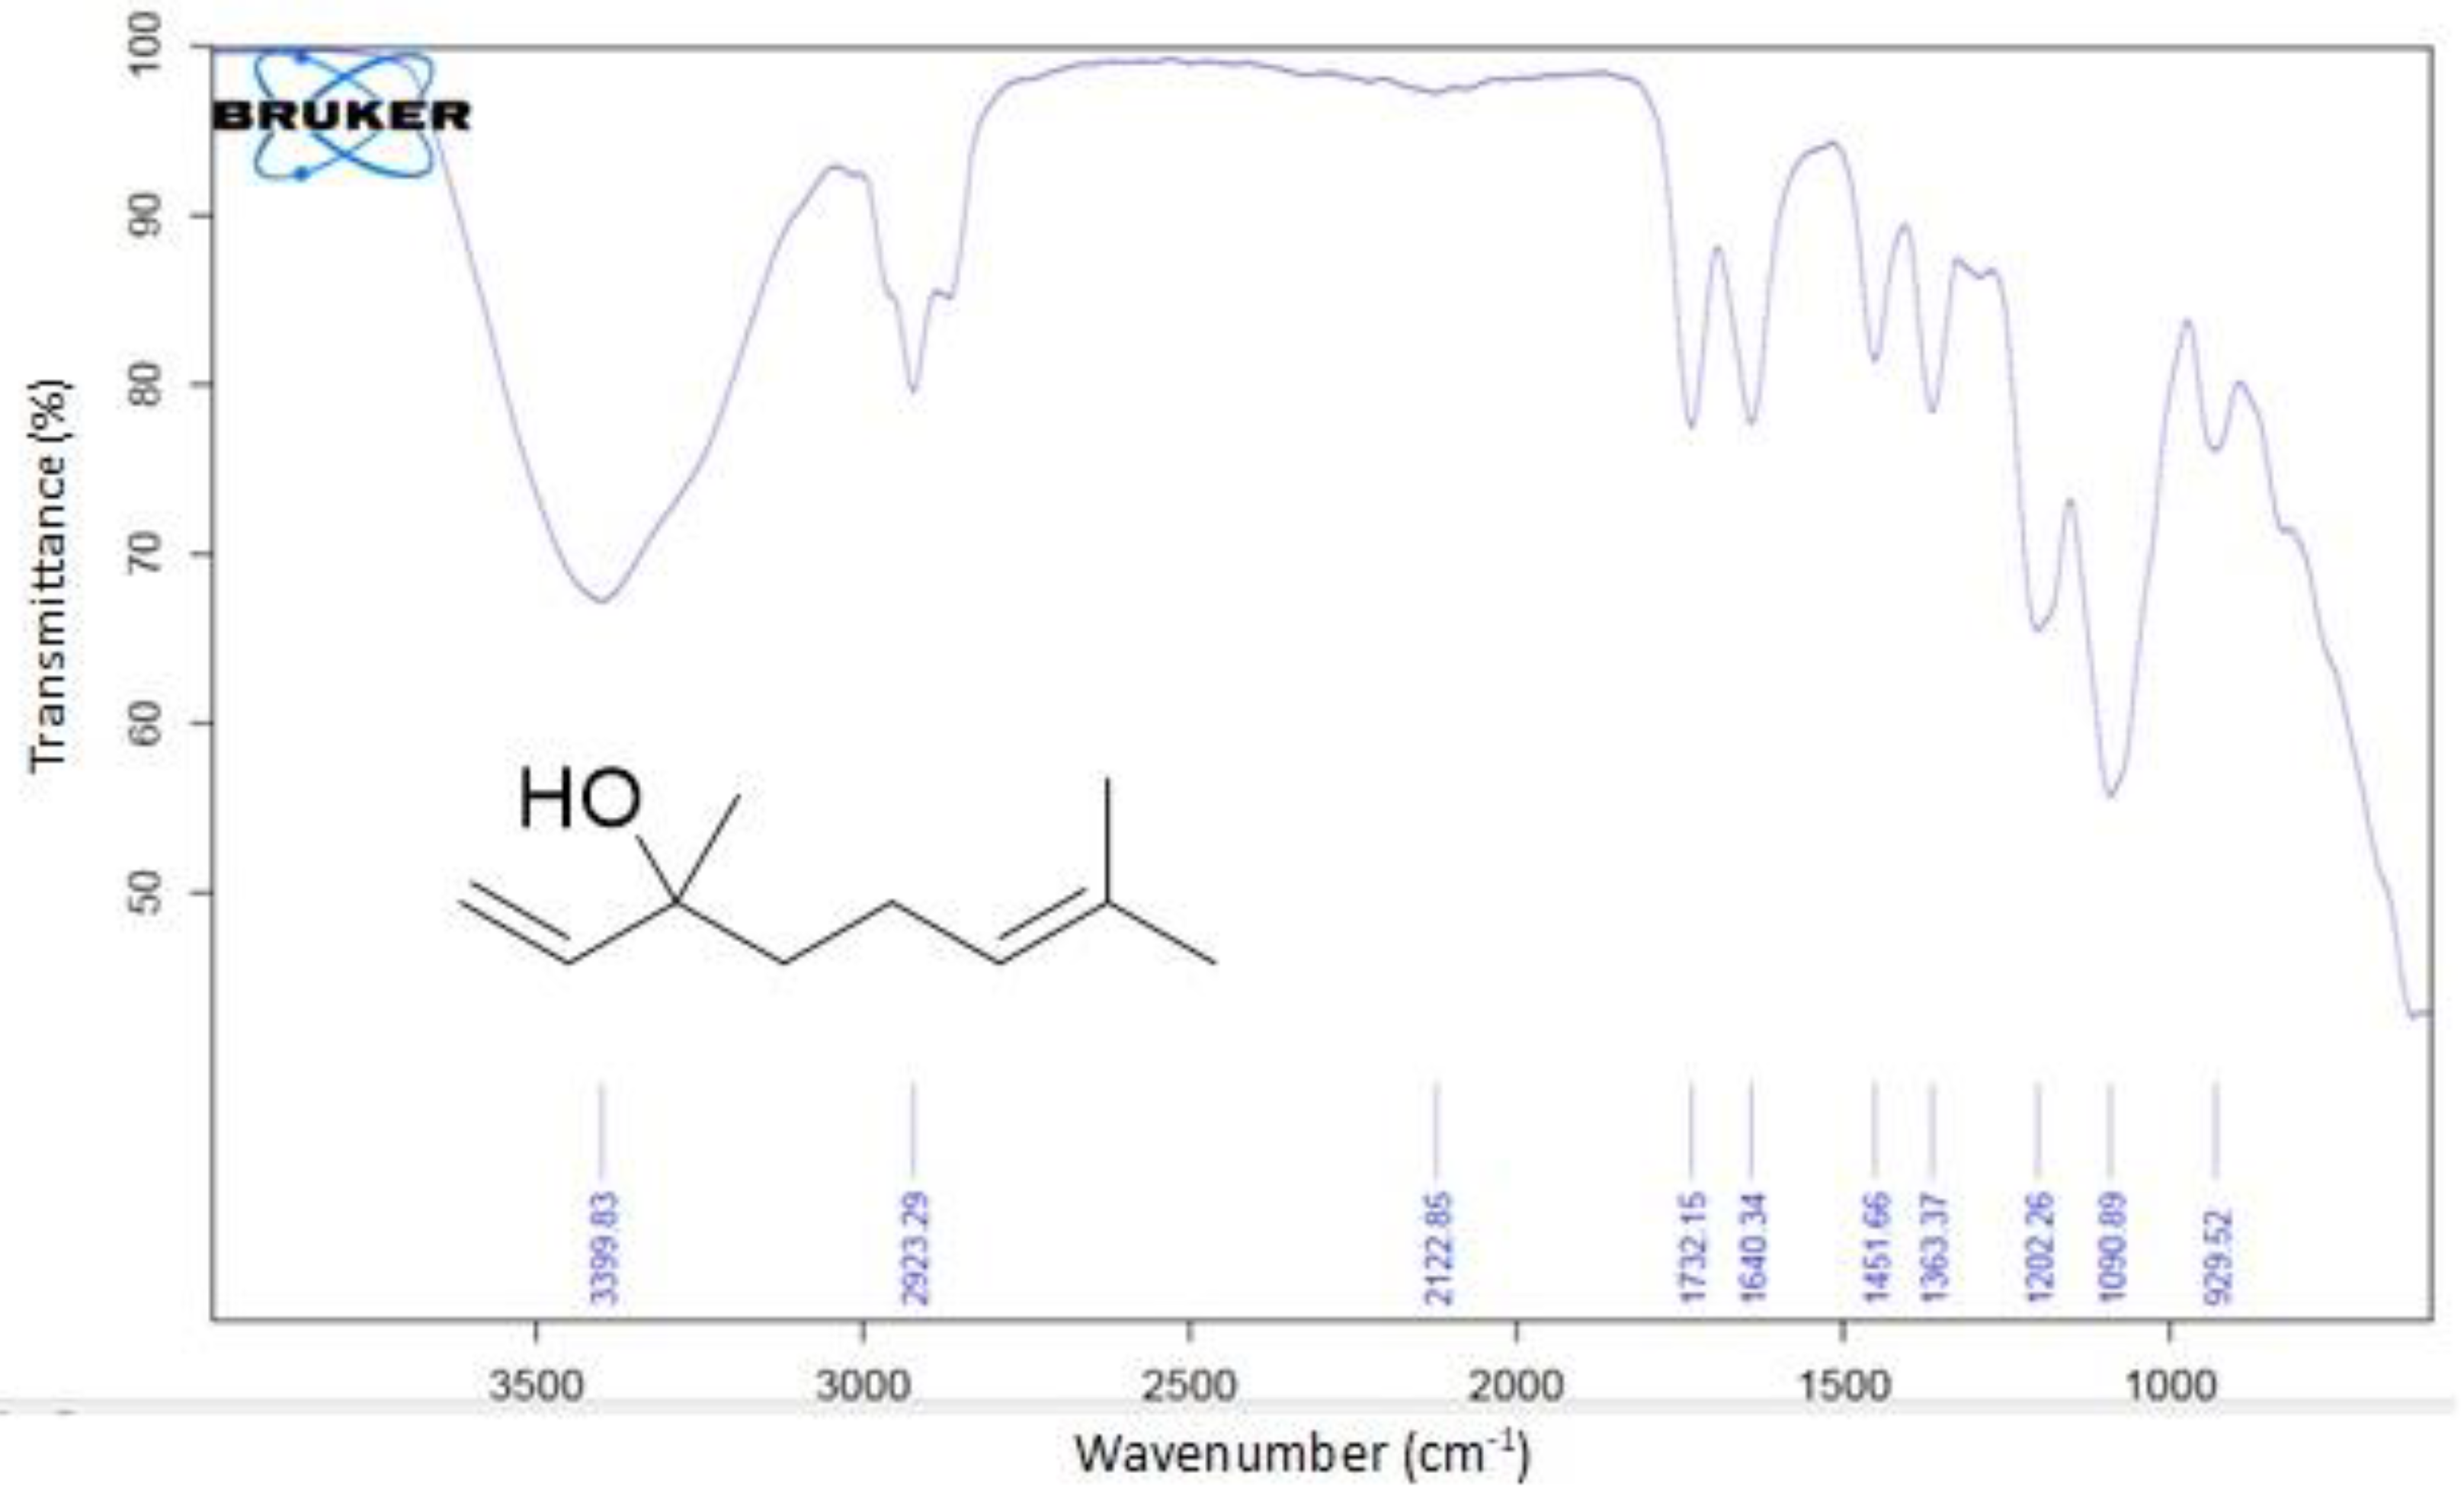
2.1. Extraction of Timur Oil and Characterization
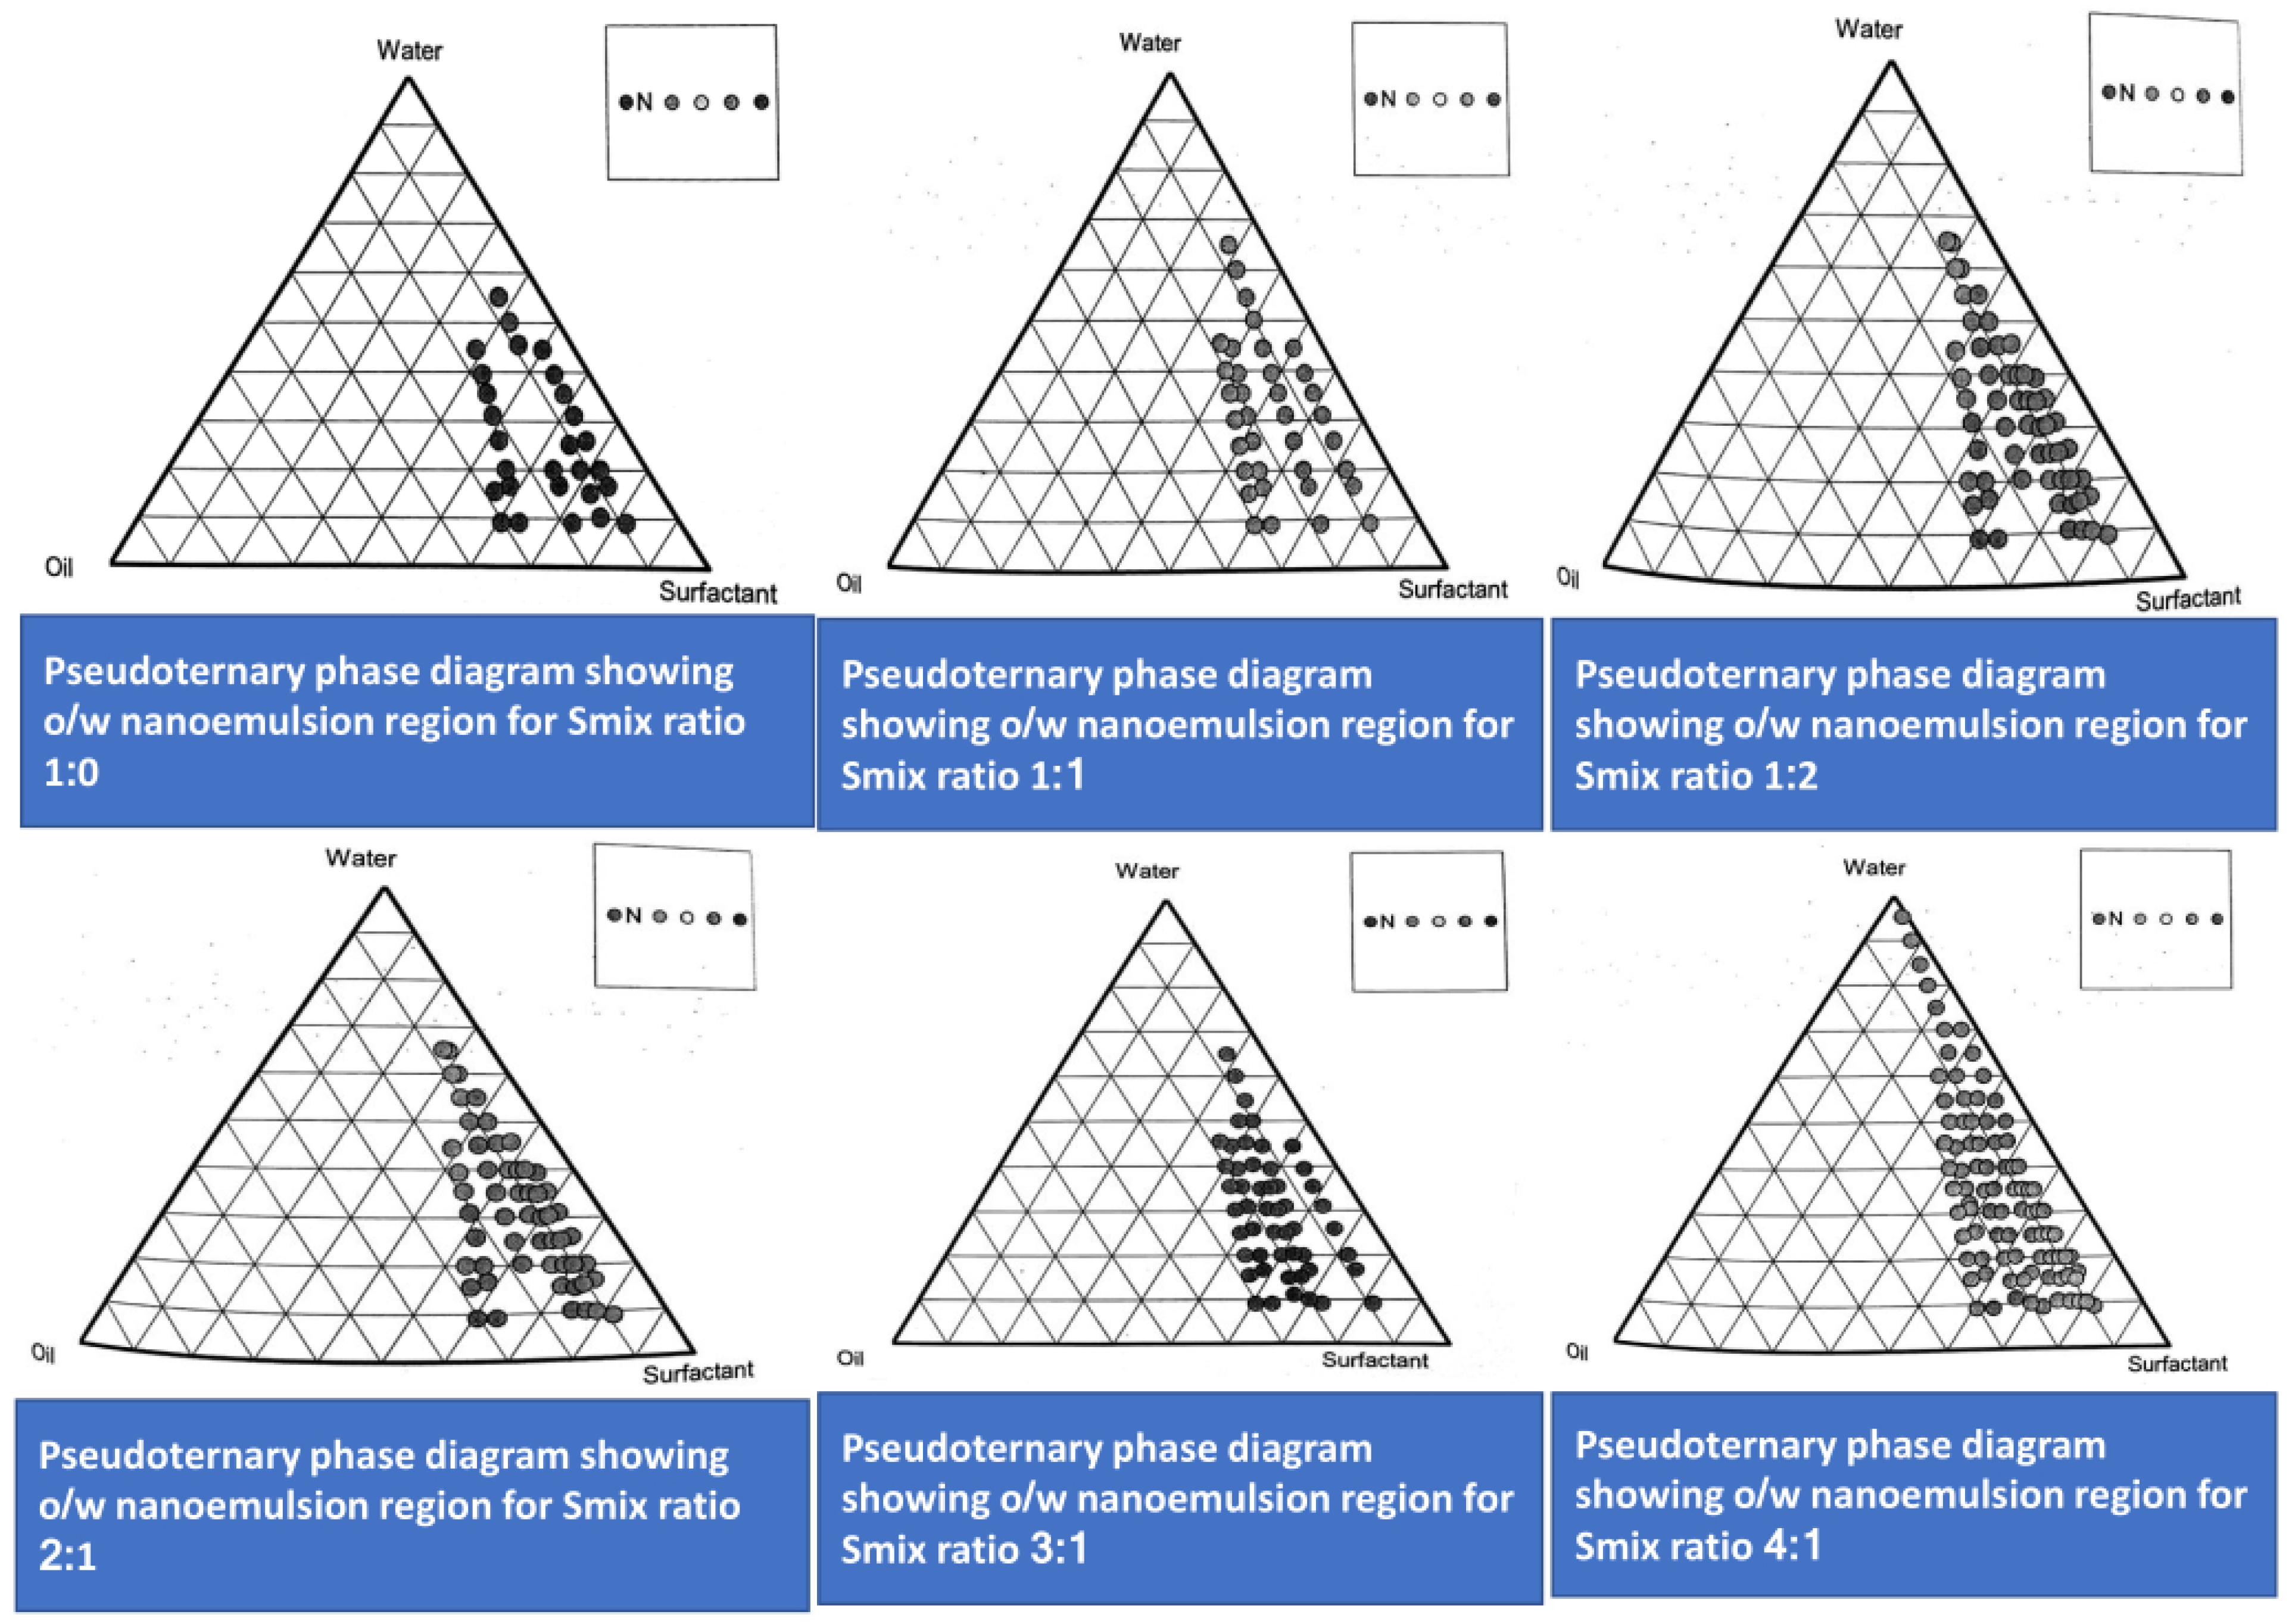
2.2. Construction of Pseudoternary Phase Diagram
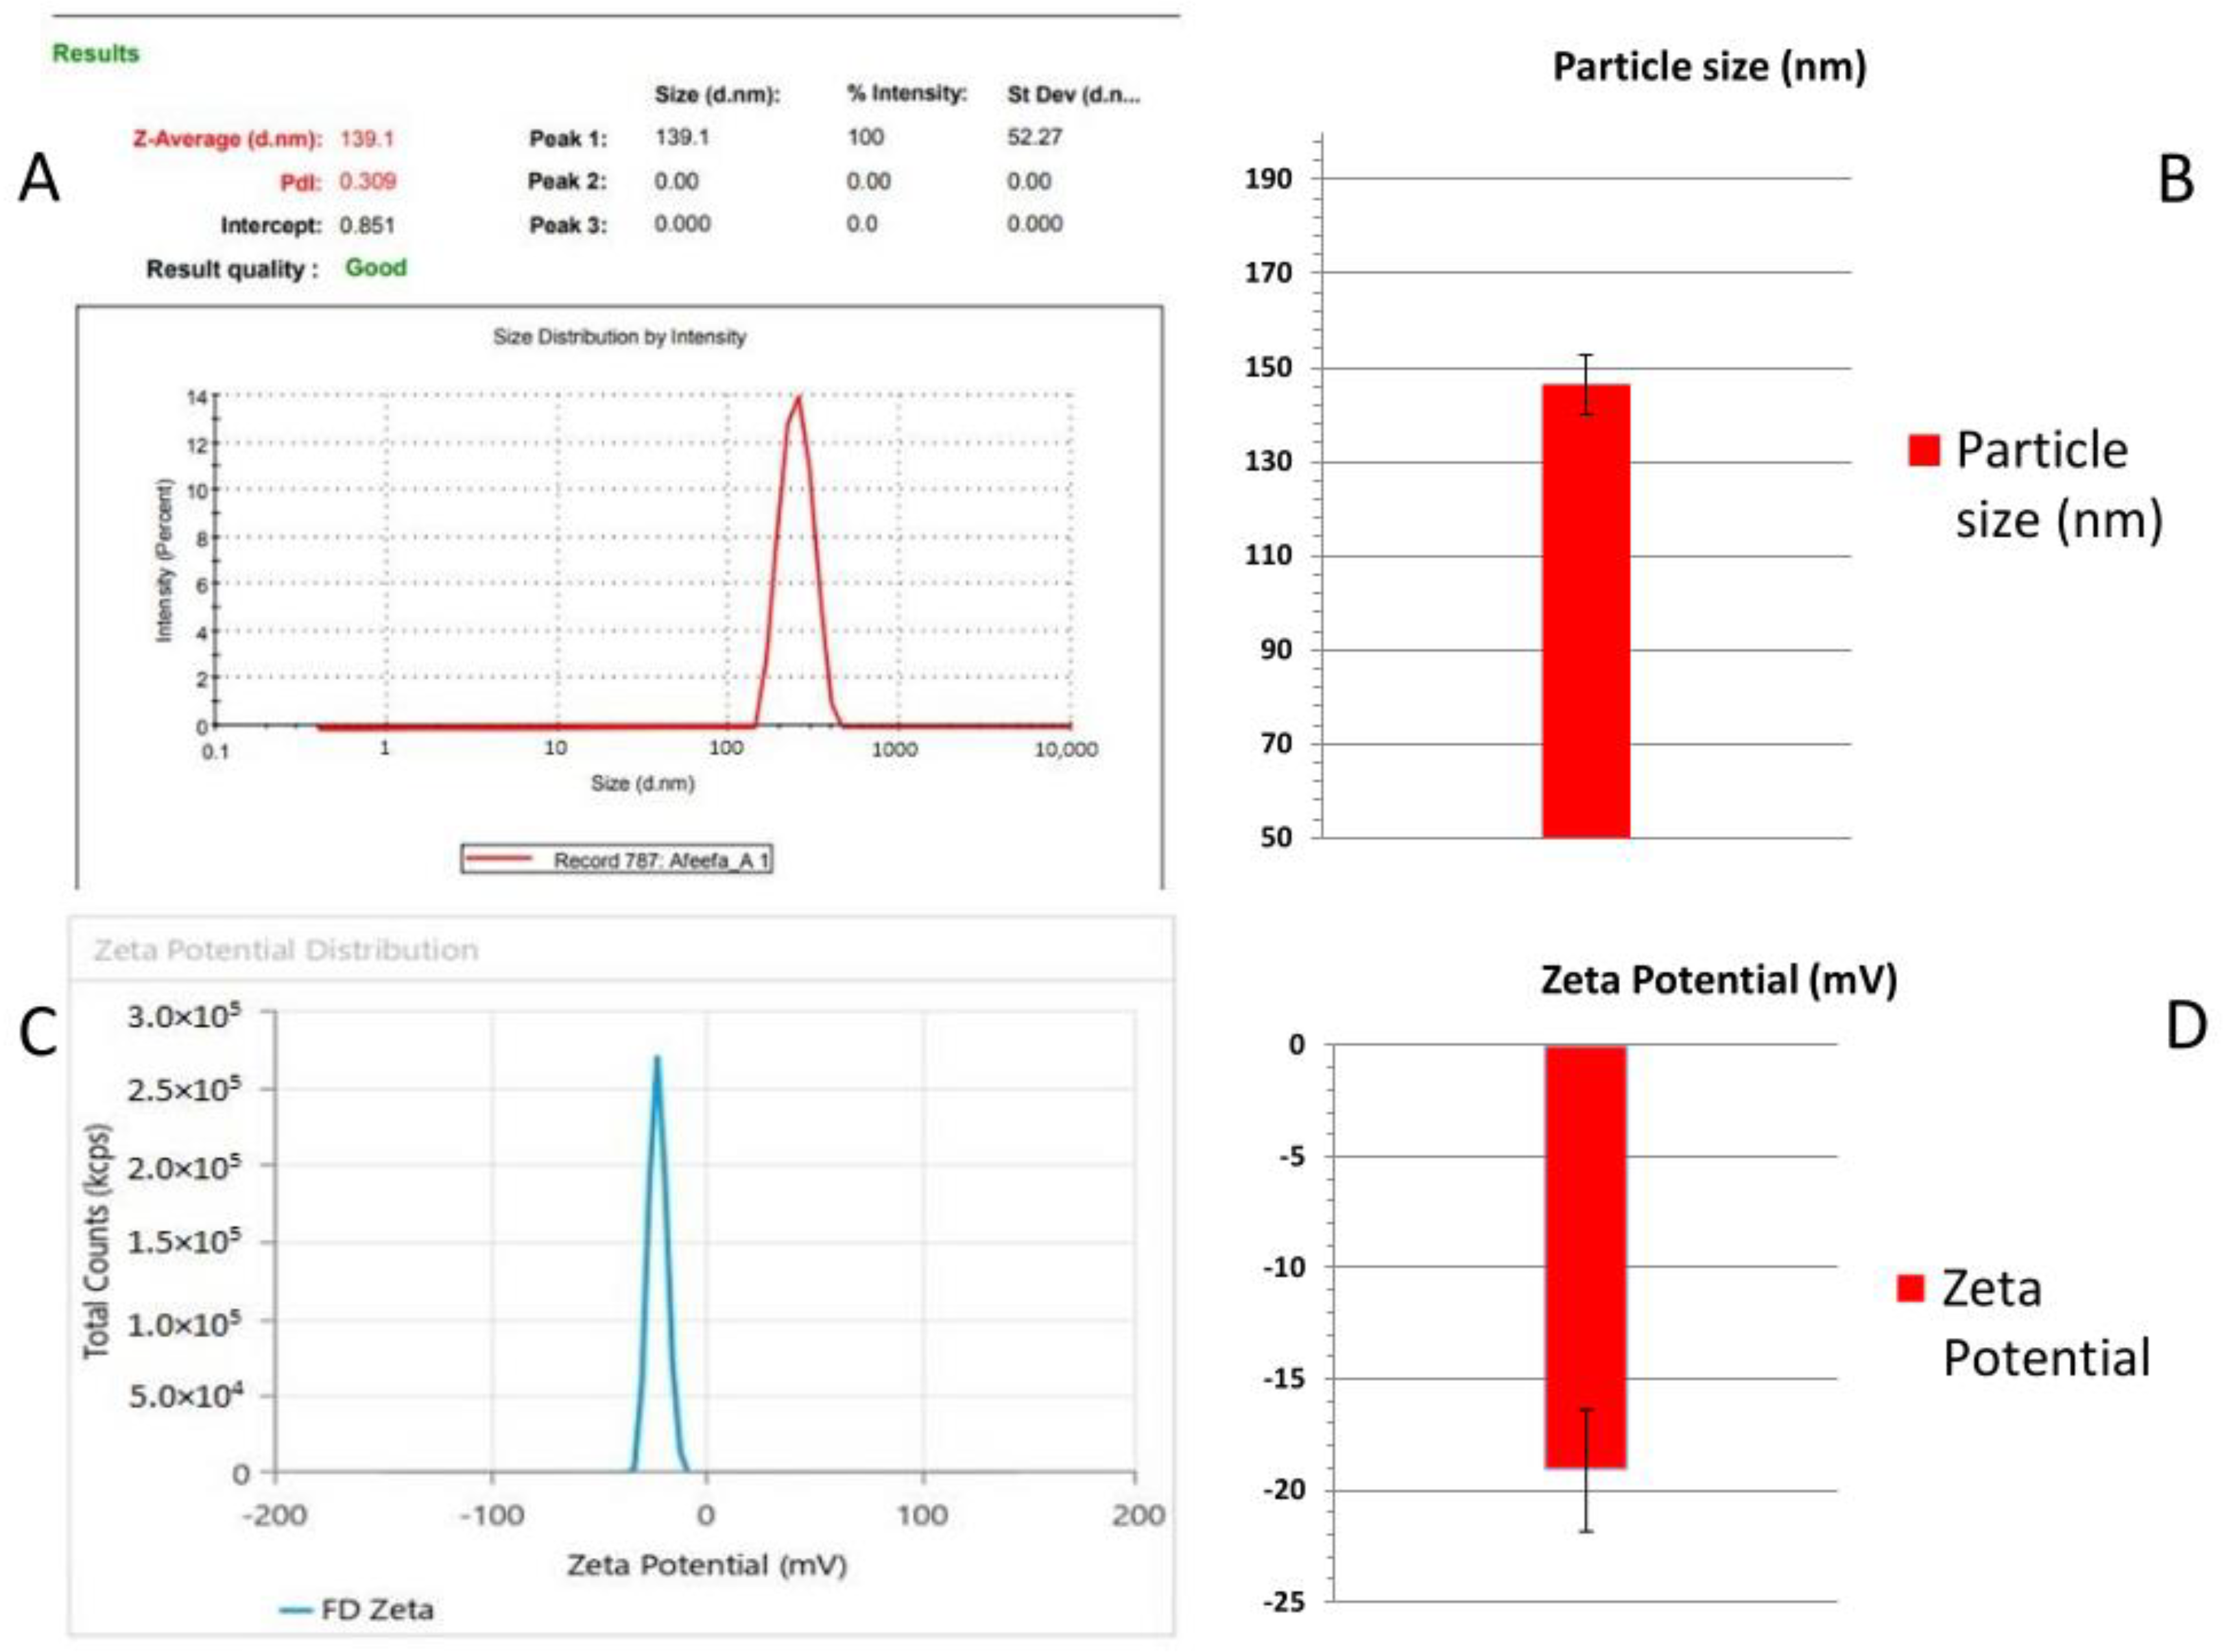
Physicochemical Characterization of Nanoemulsion
2.3. Fabrication of Timur Oil Nanoemulgel Formulation
2.3.1. Physicochemical characterization of Nanoemulgel
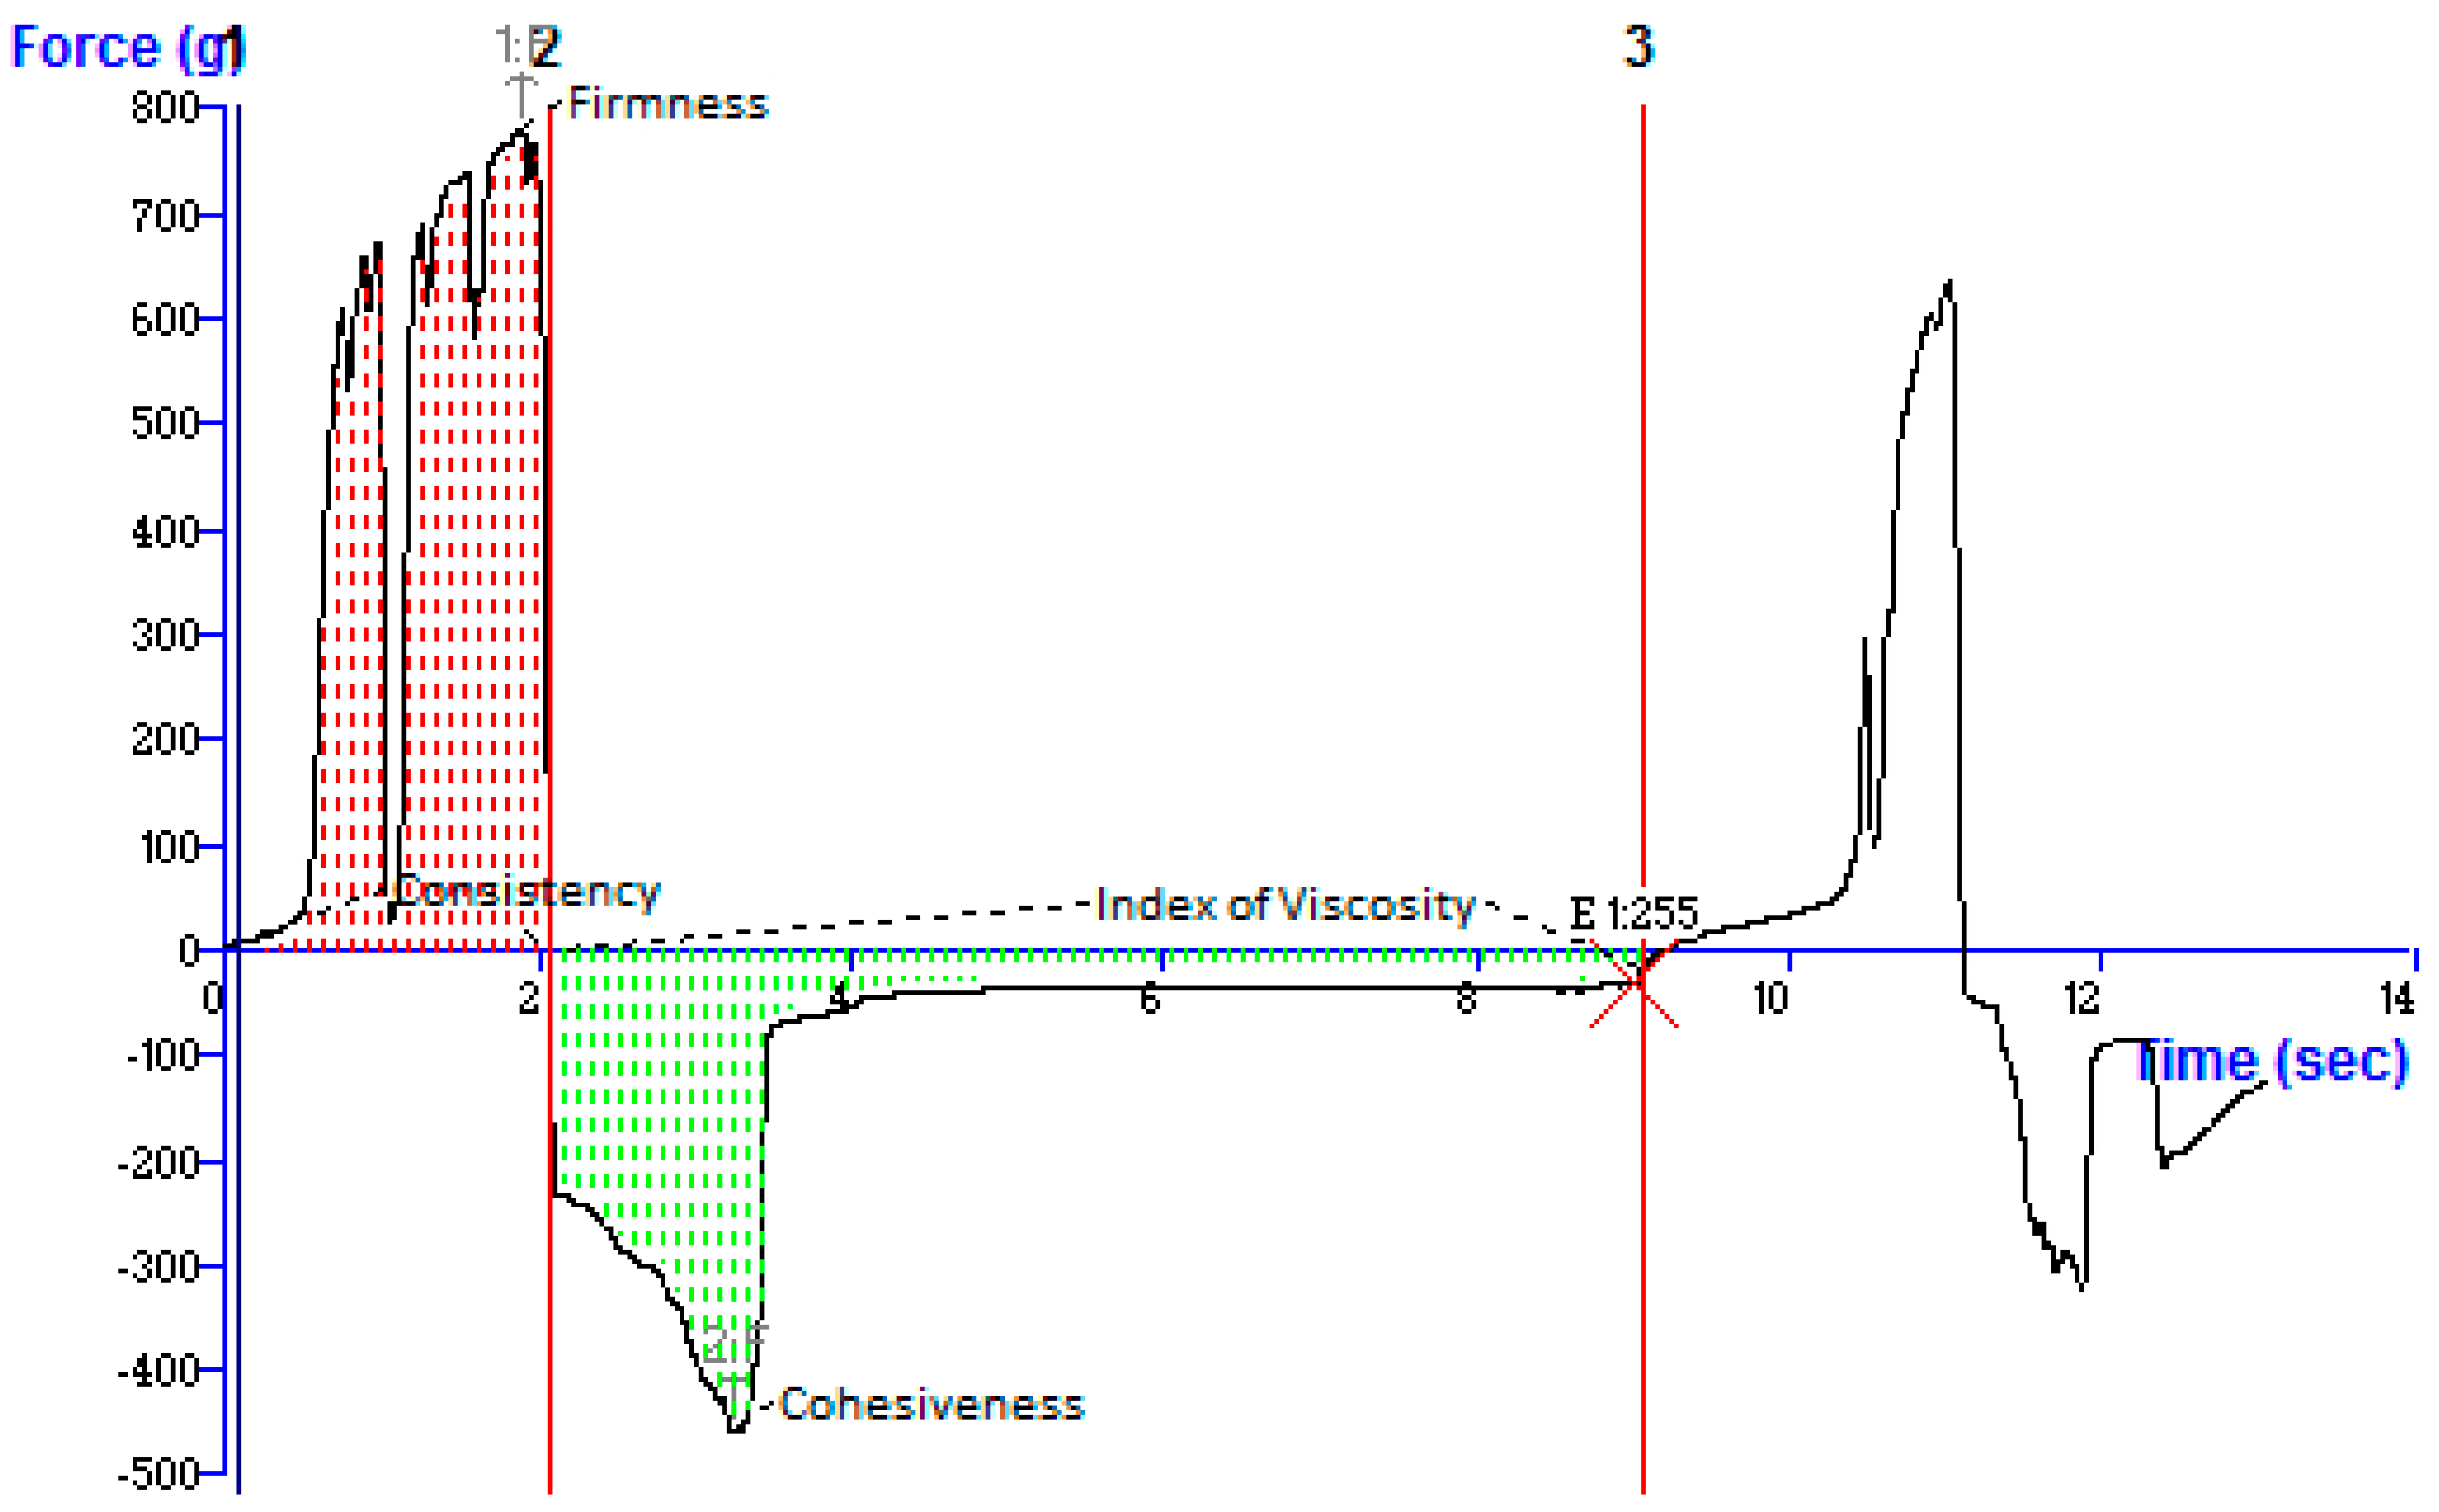
2.3.2. Mechanical Strength of NEG
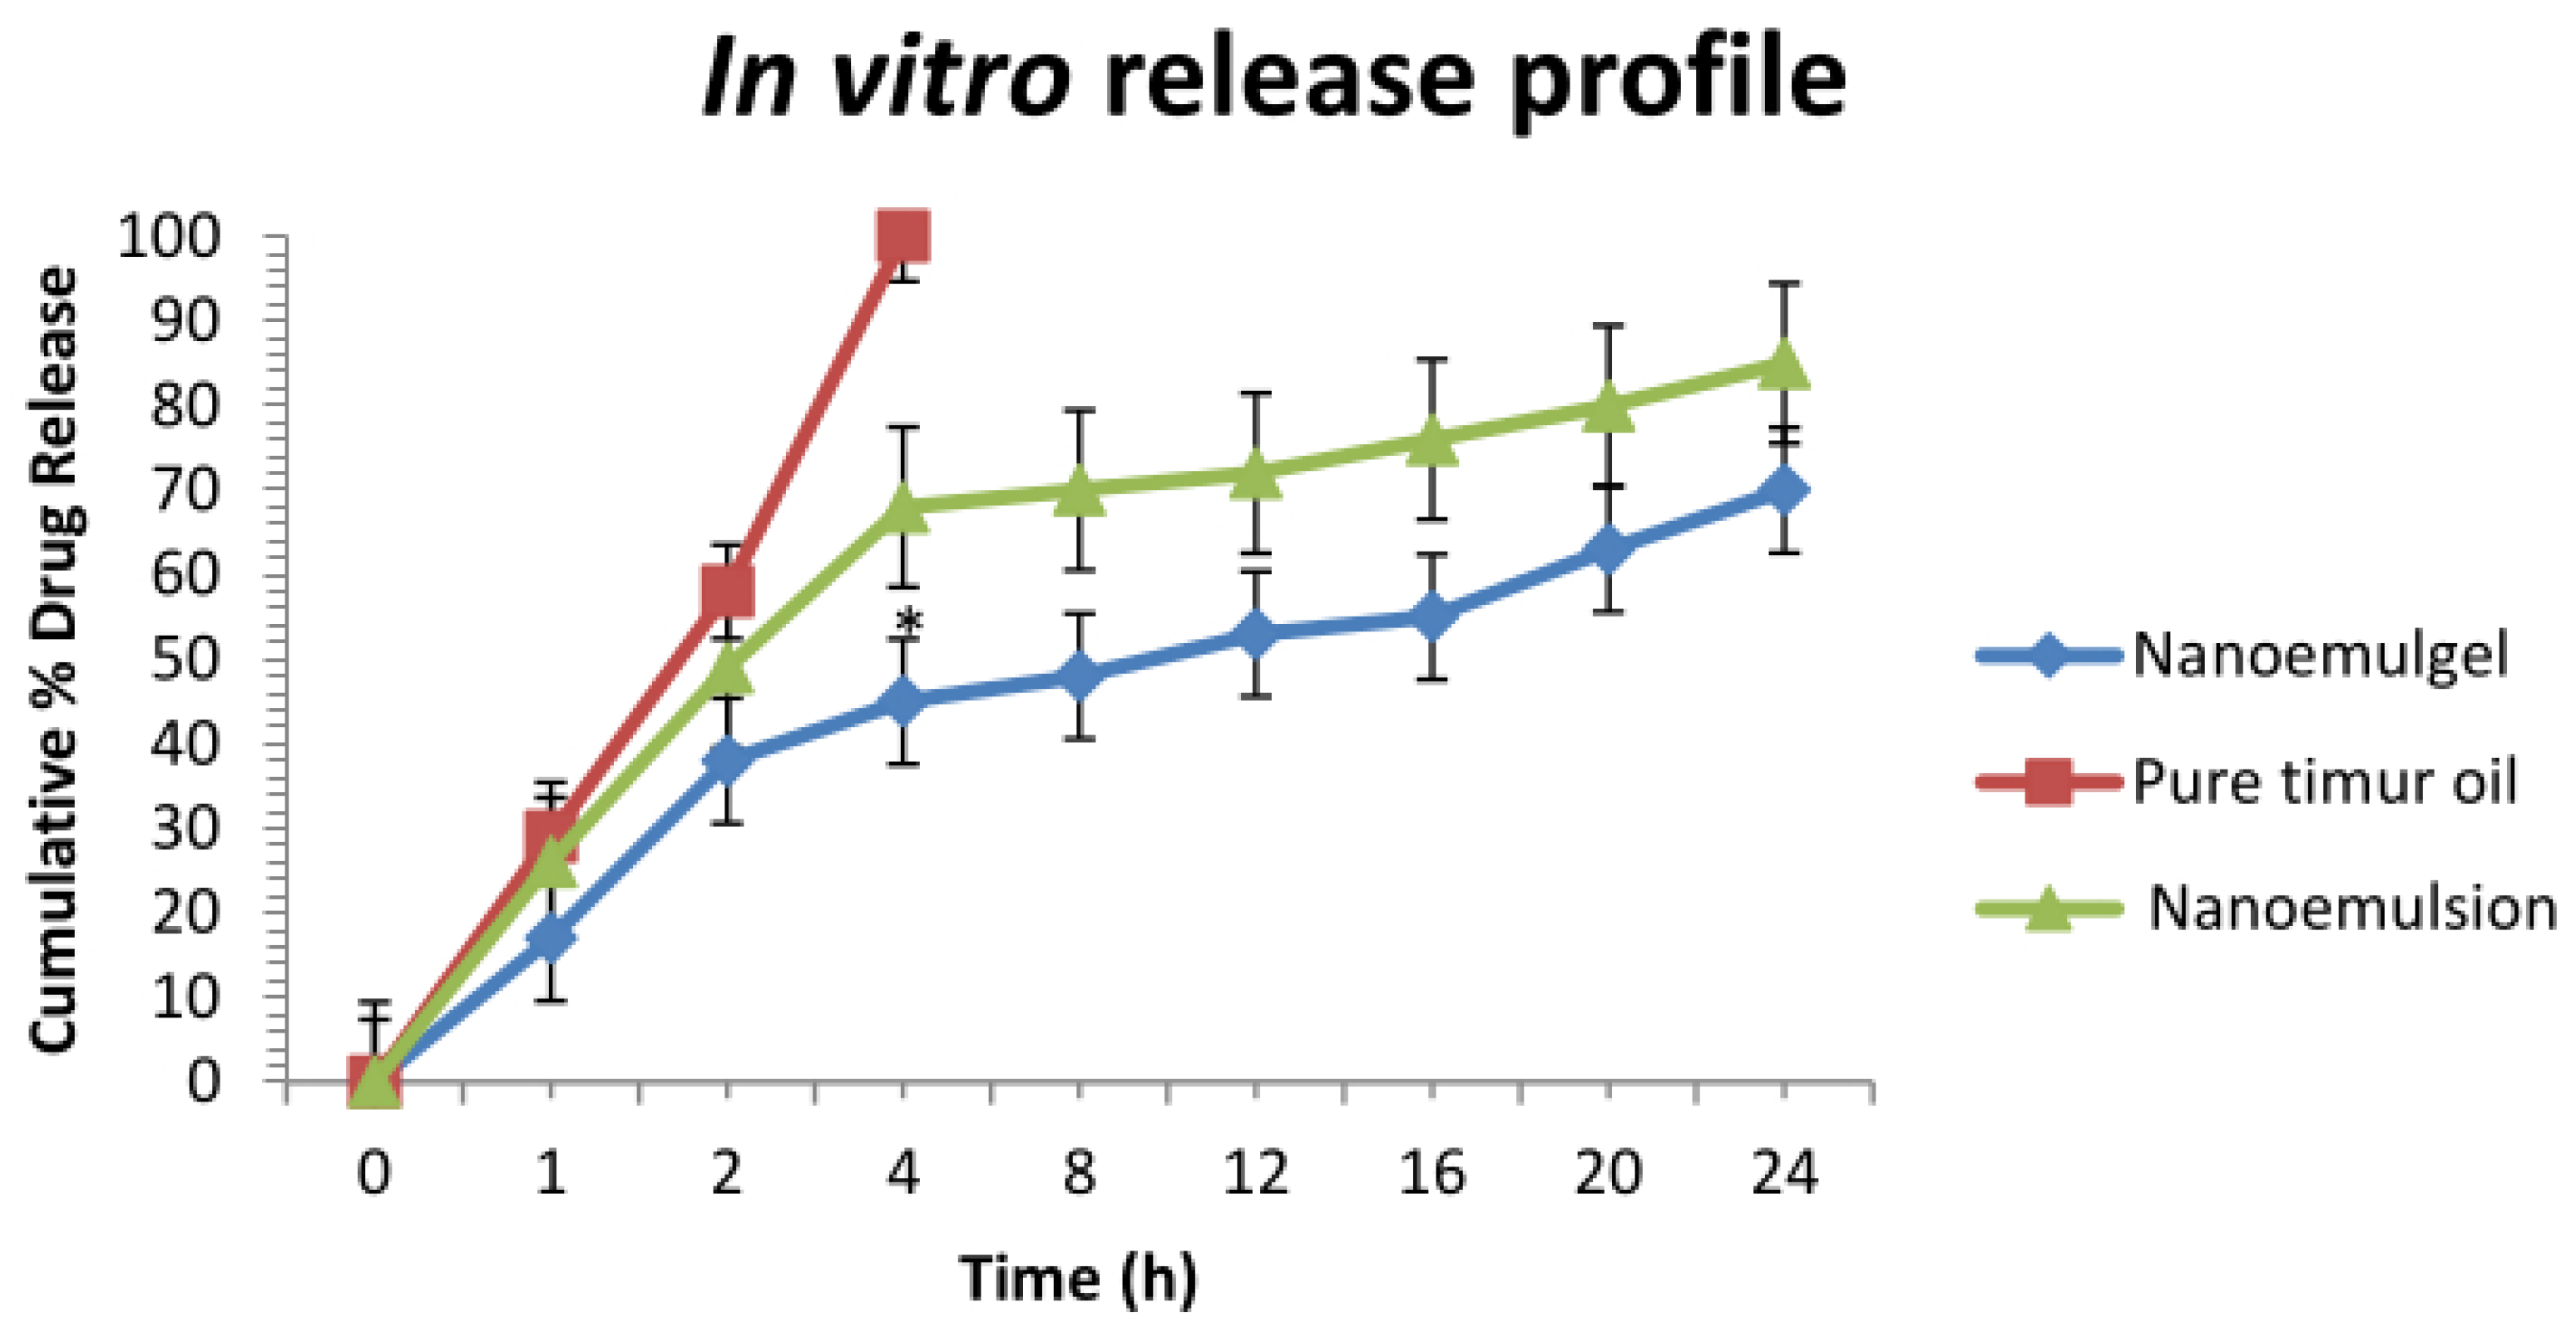
2.3.3. In Vitro Release Study
2.3.4. Release Kinetics
2.3.5. Drug Deposition Study
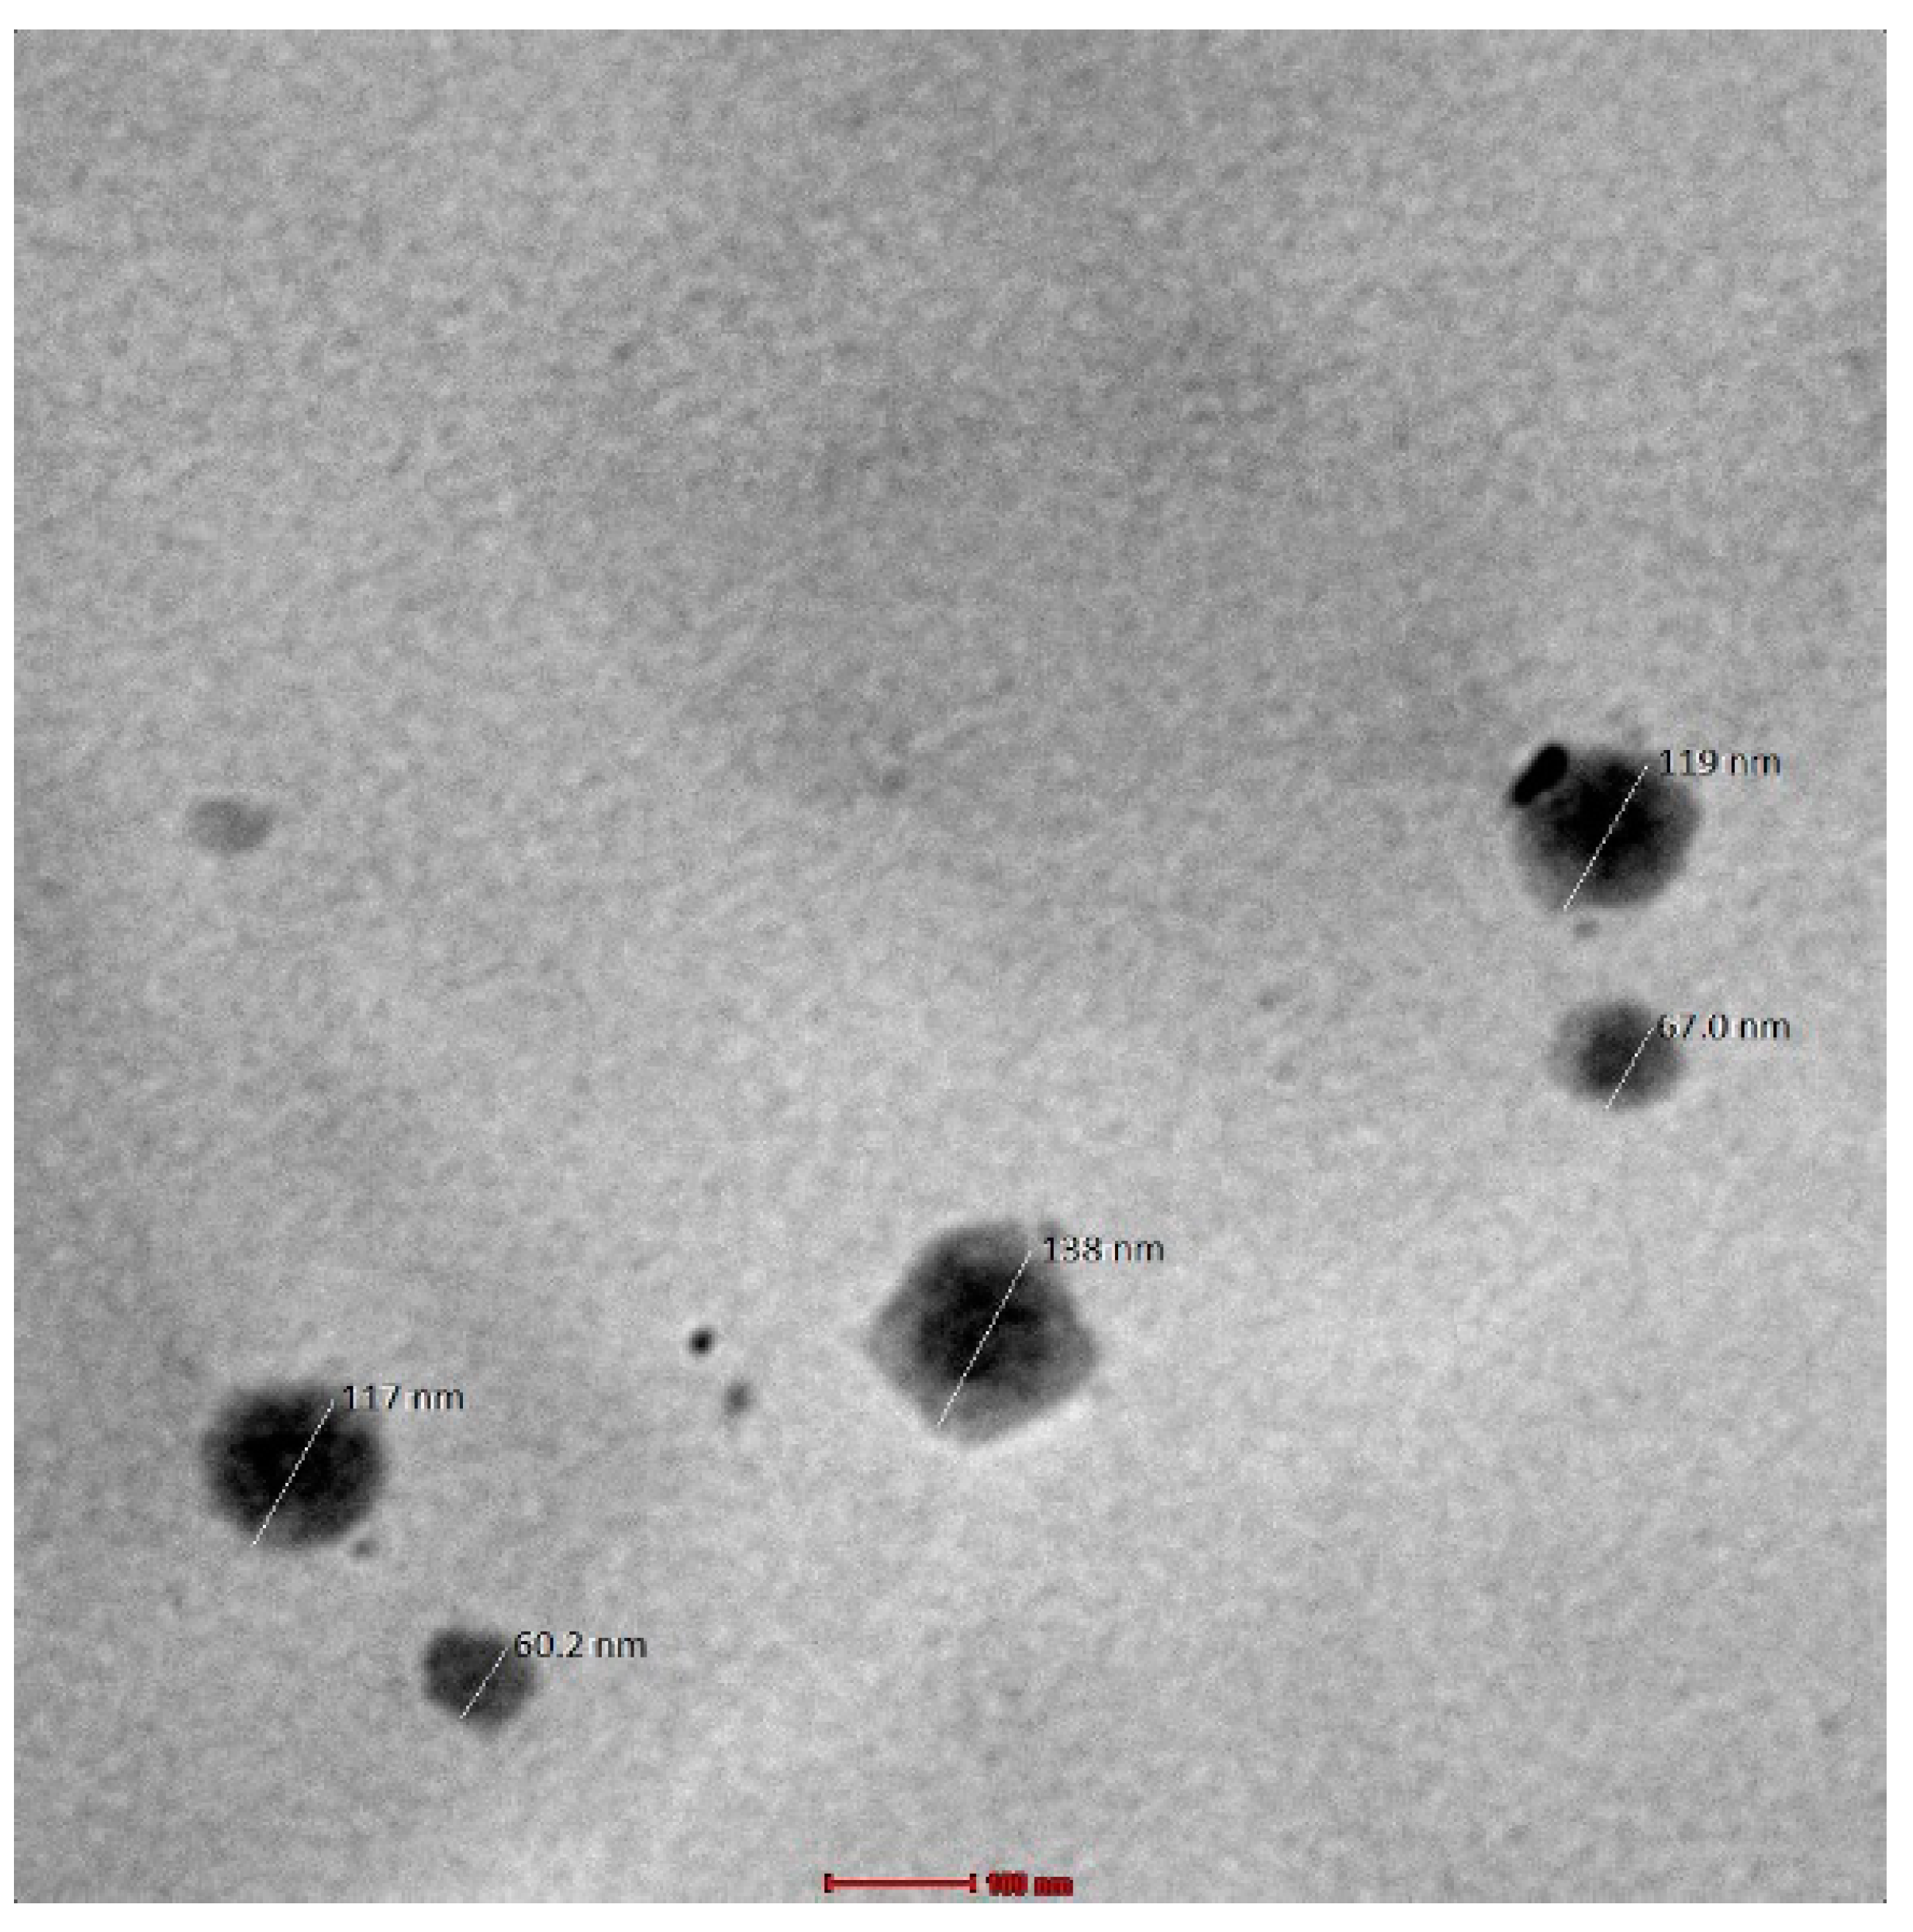
2.3.6. Morphological Studies/Internal Composition Study
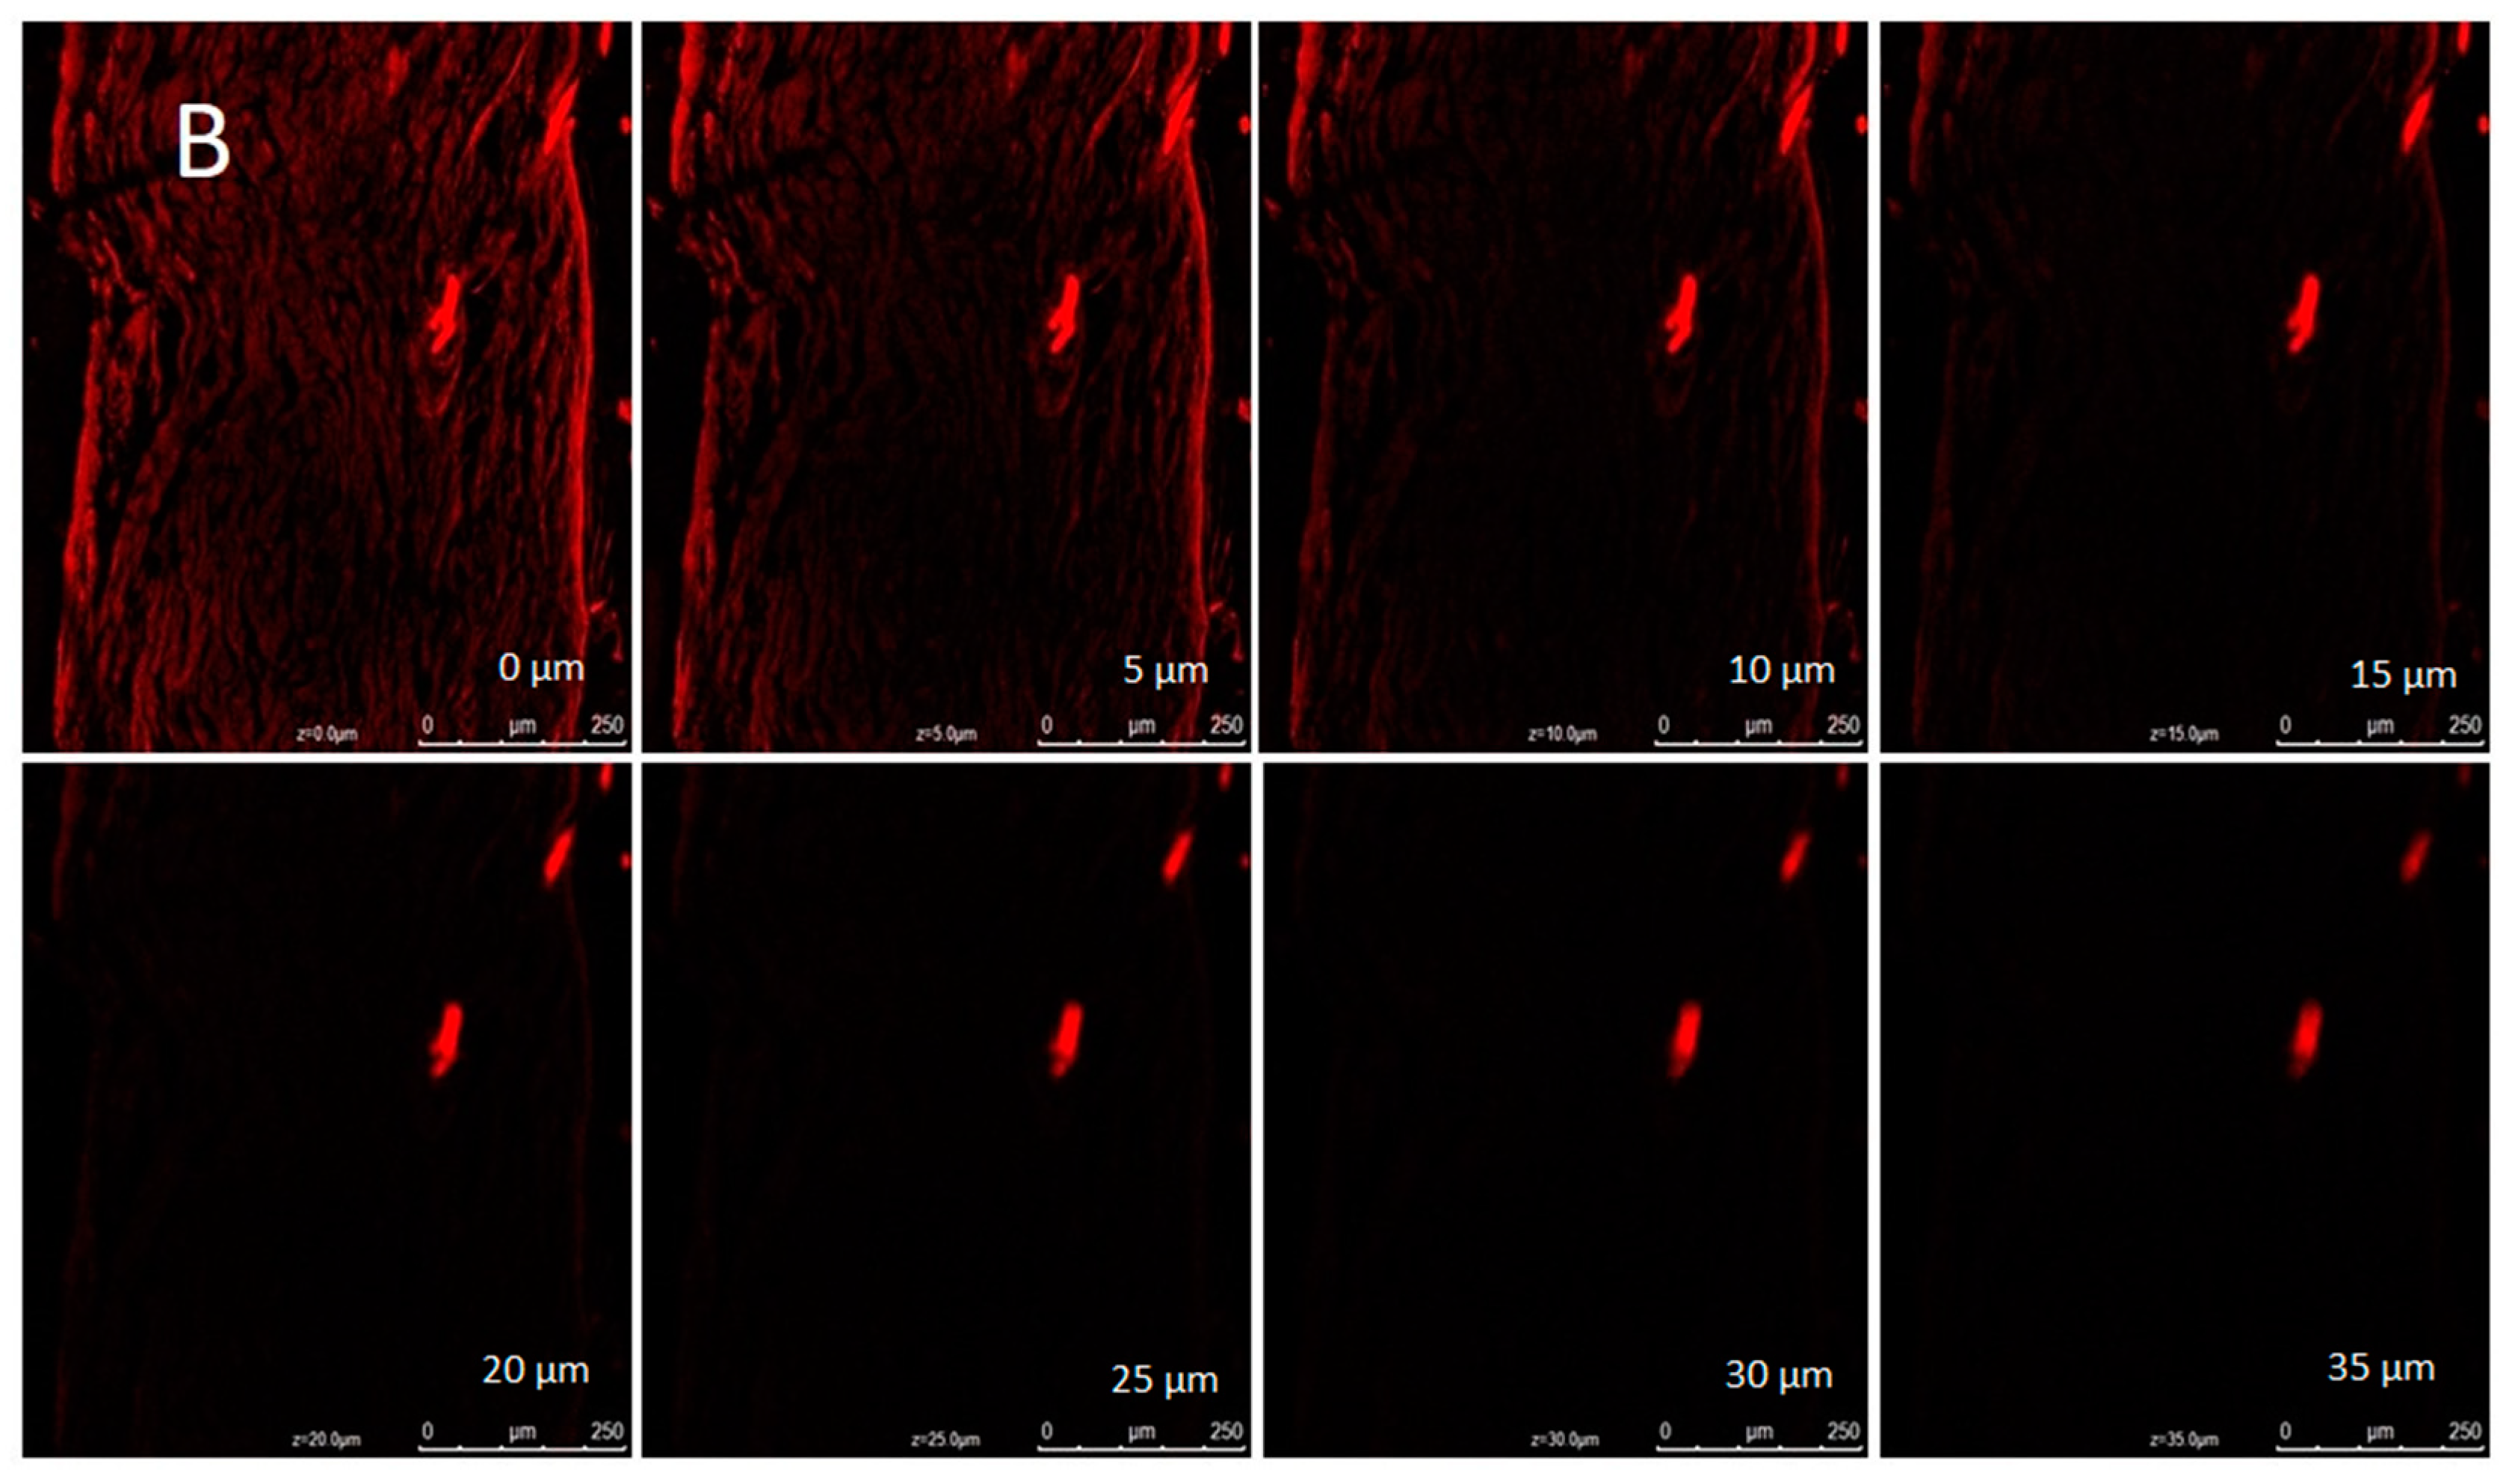
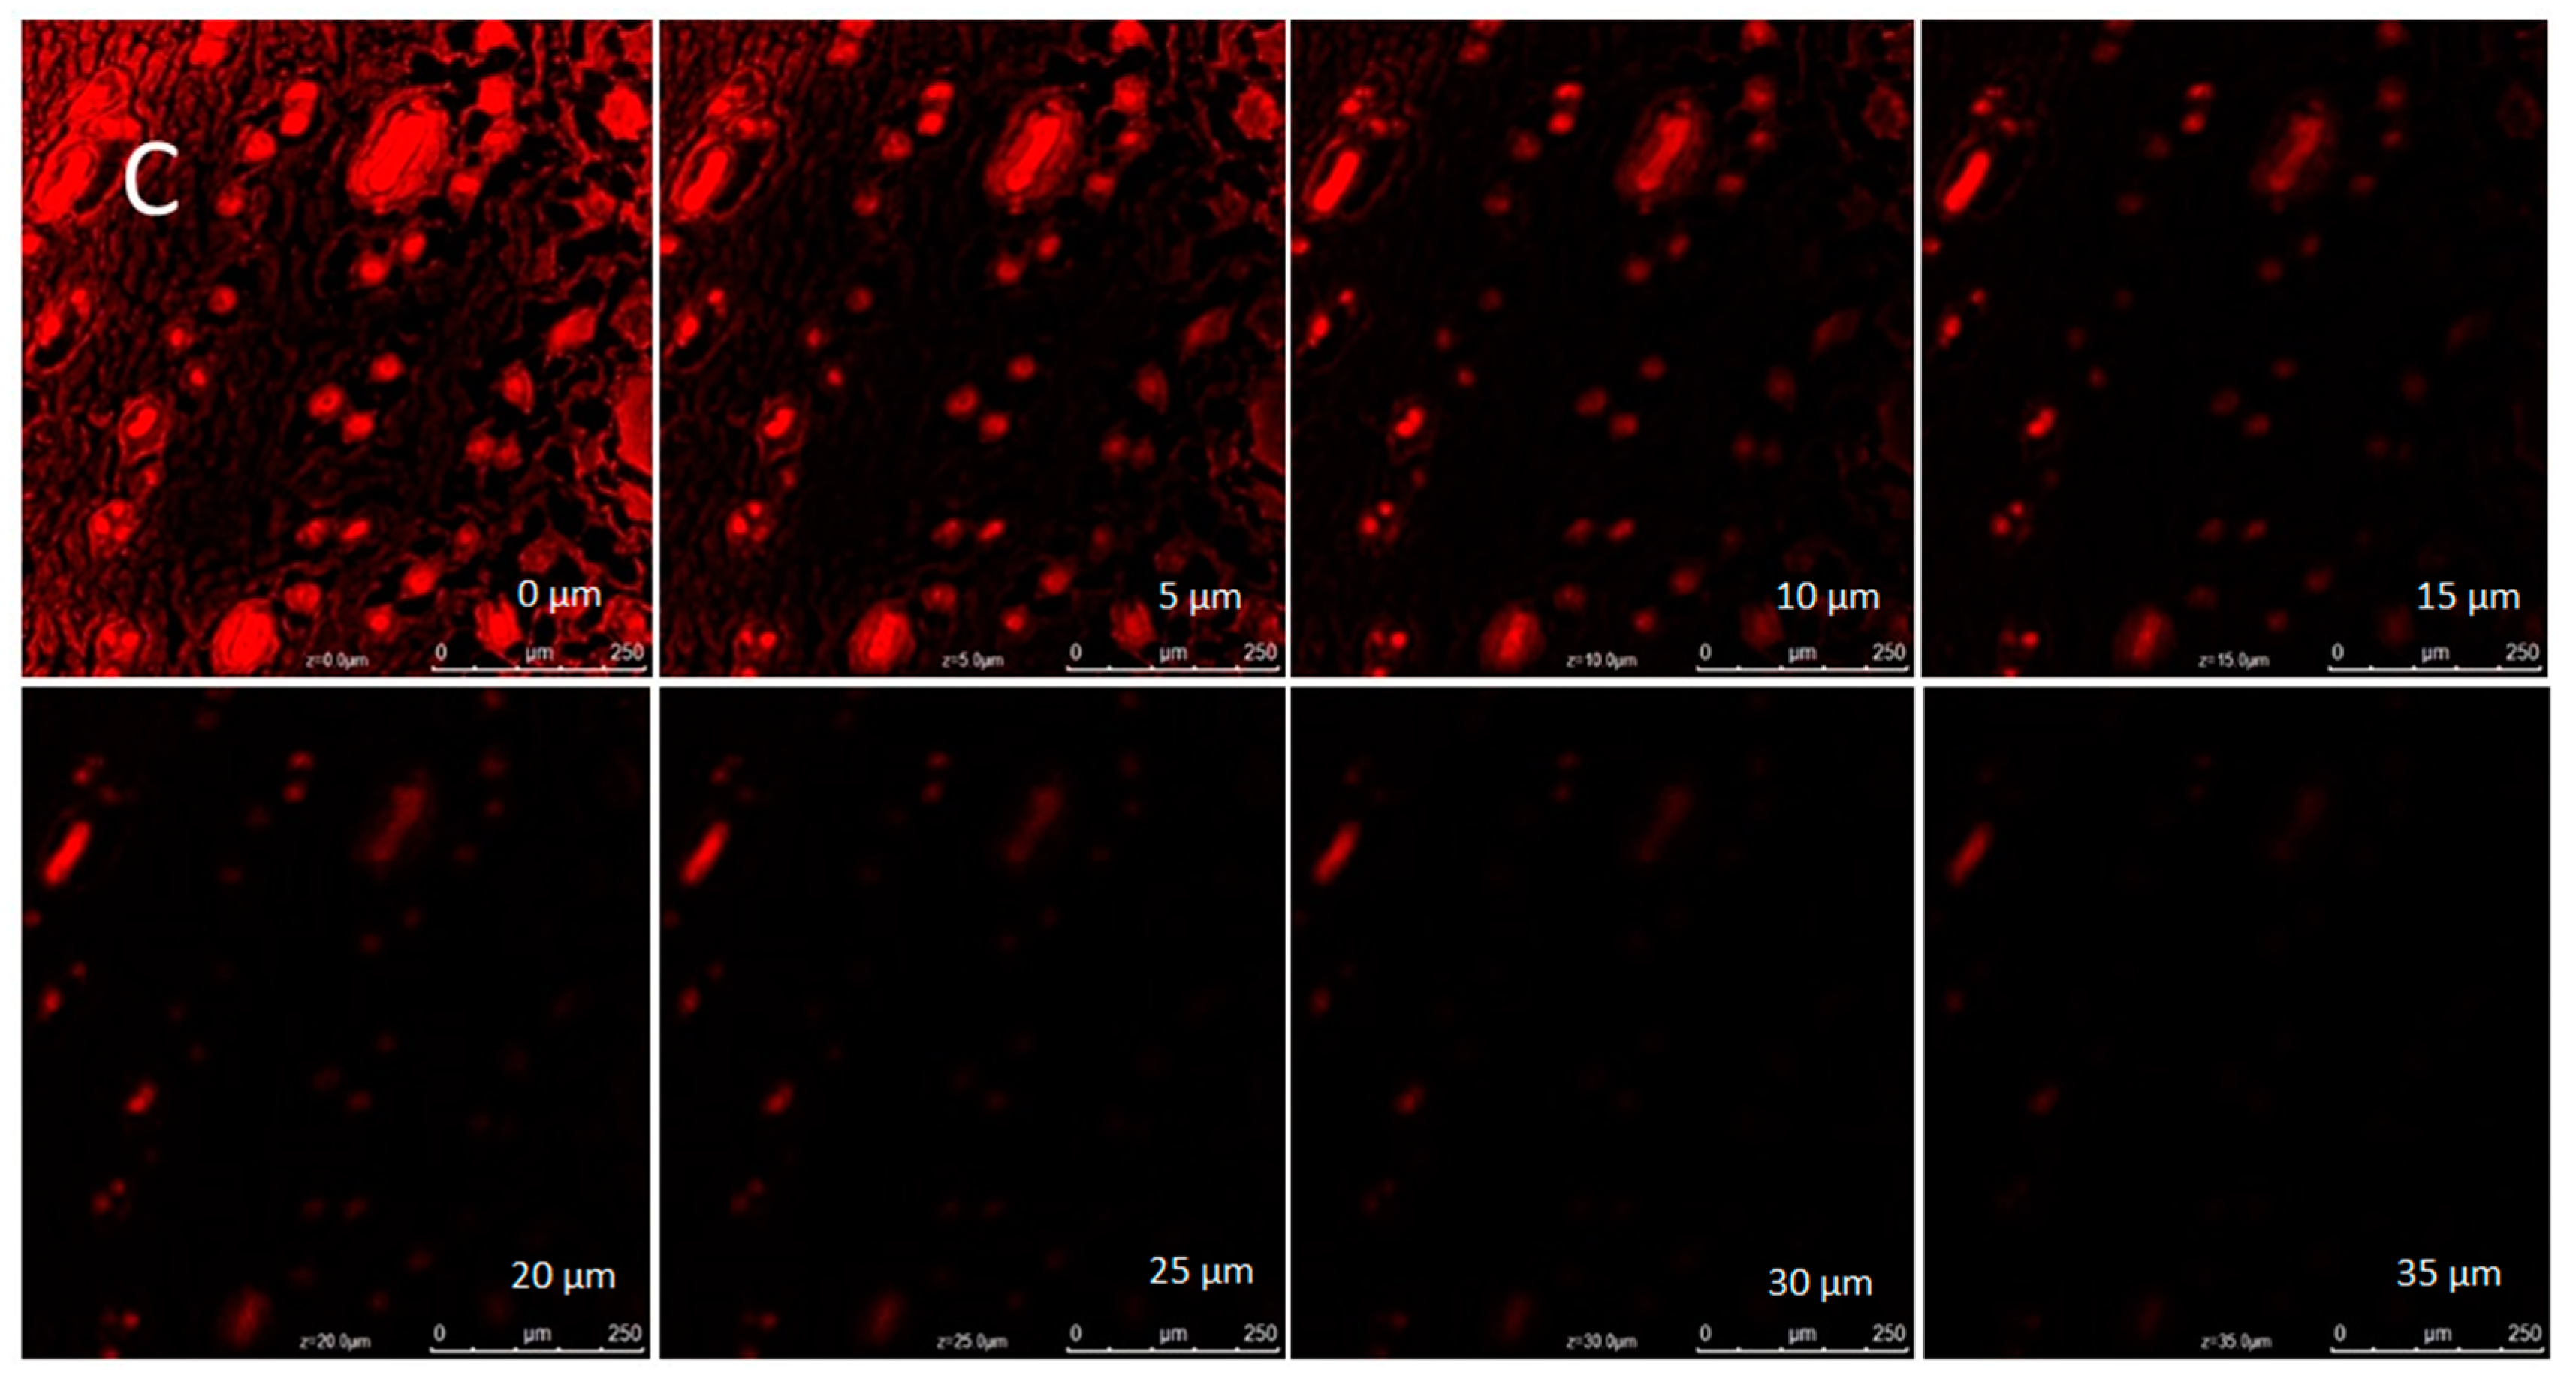
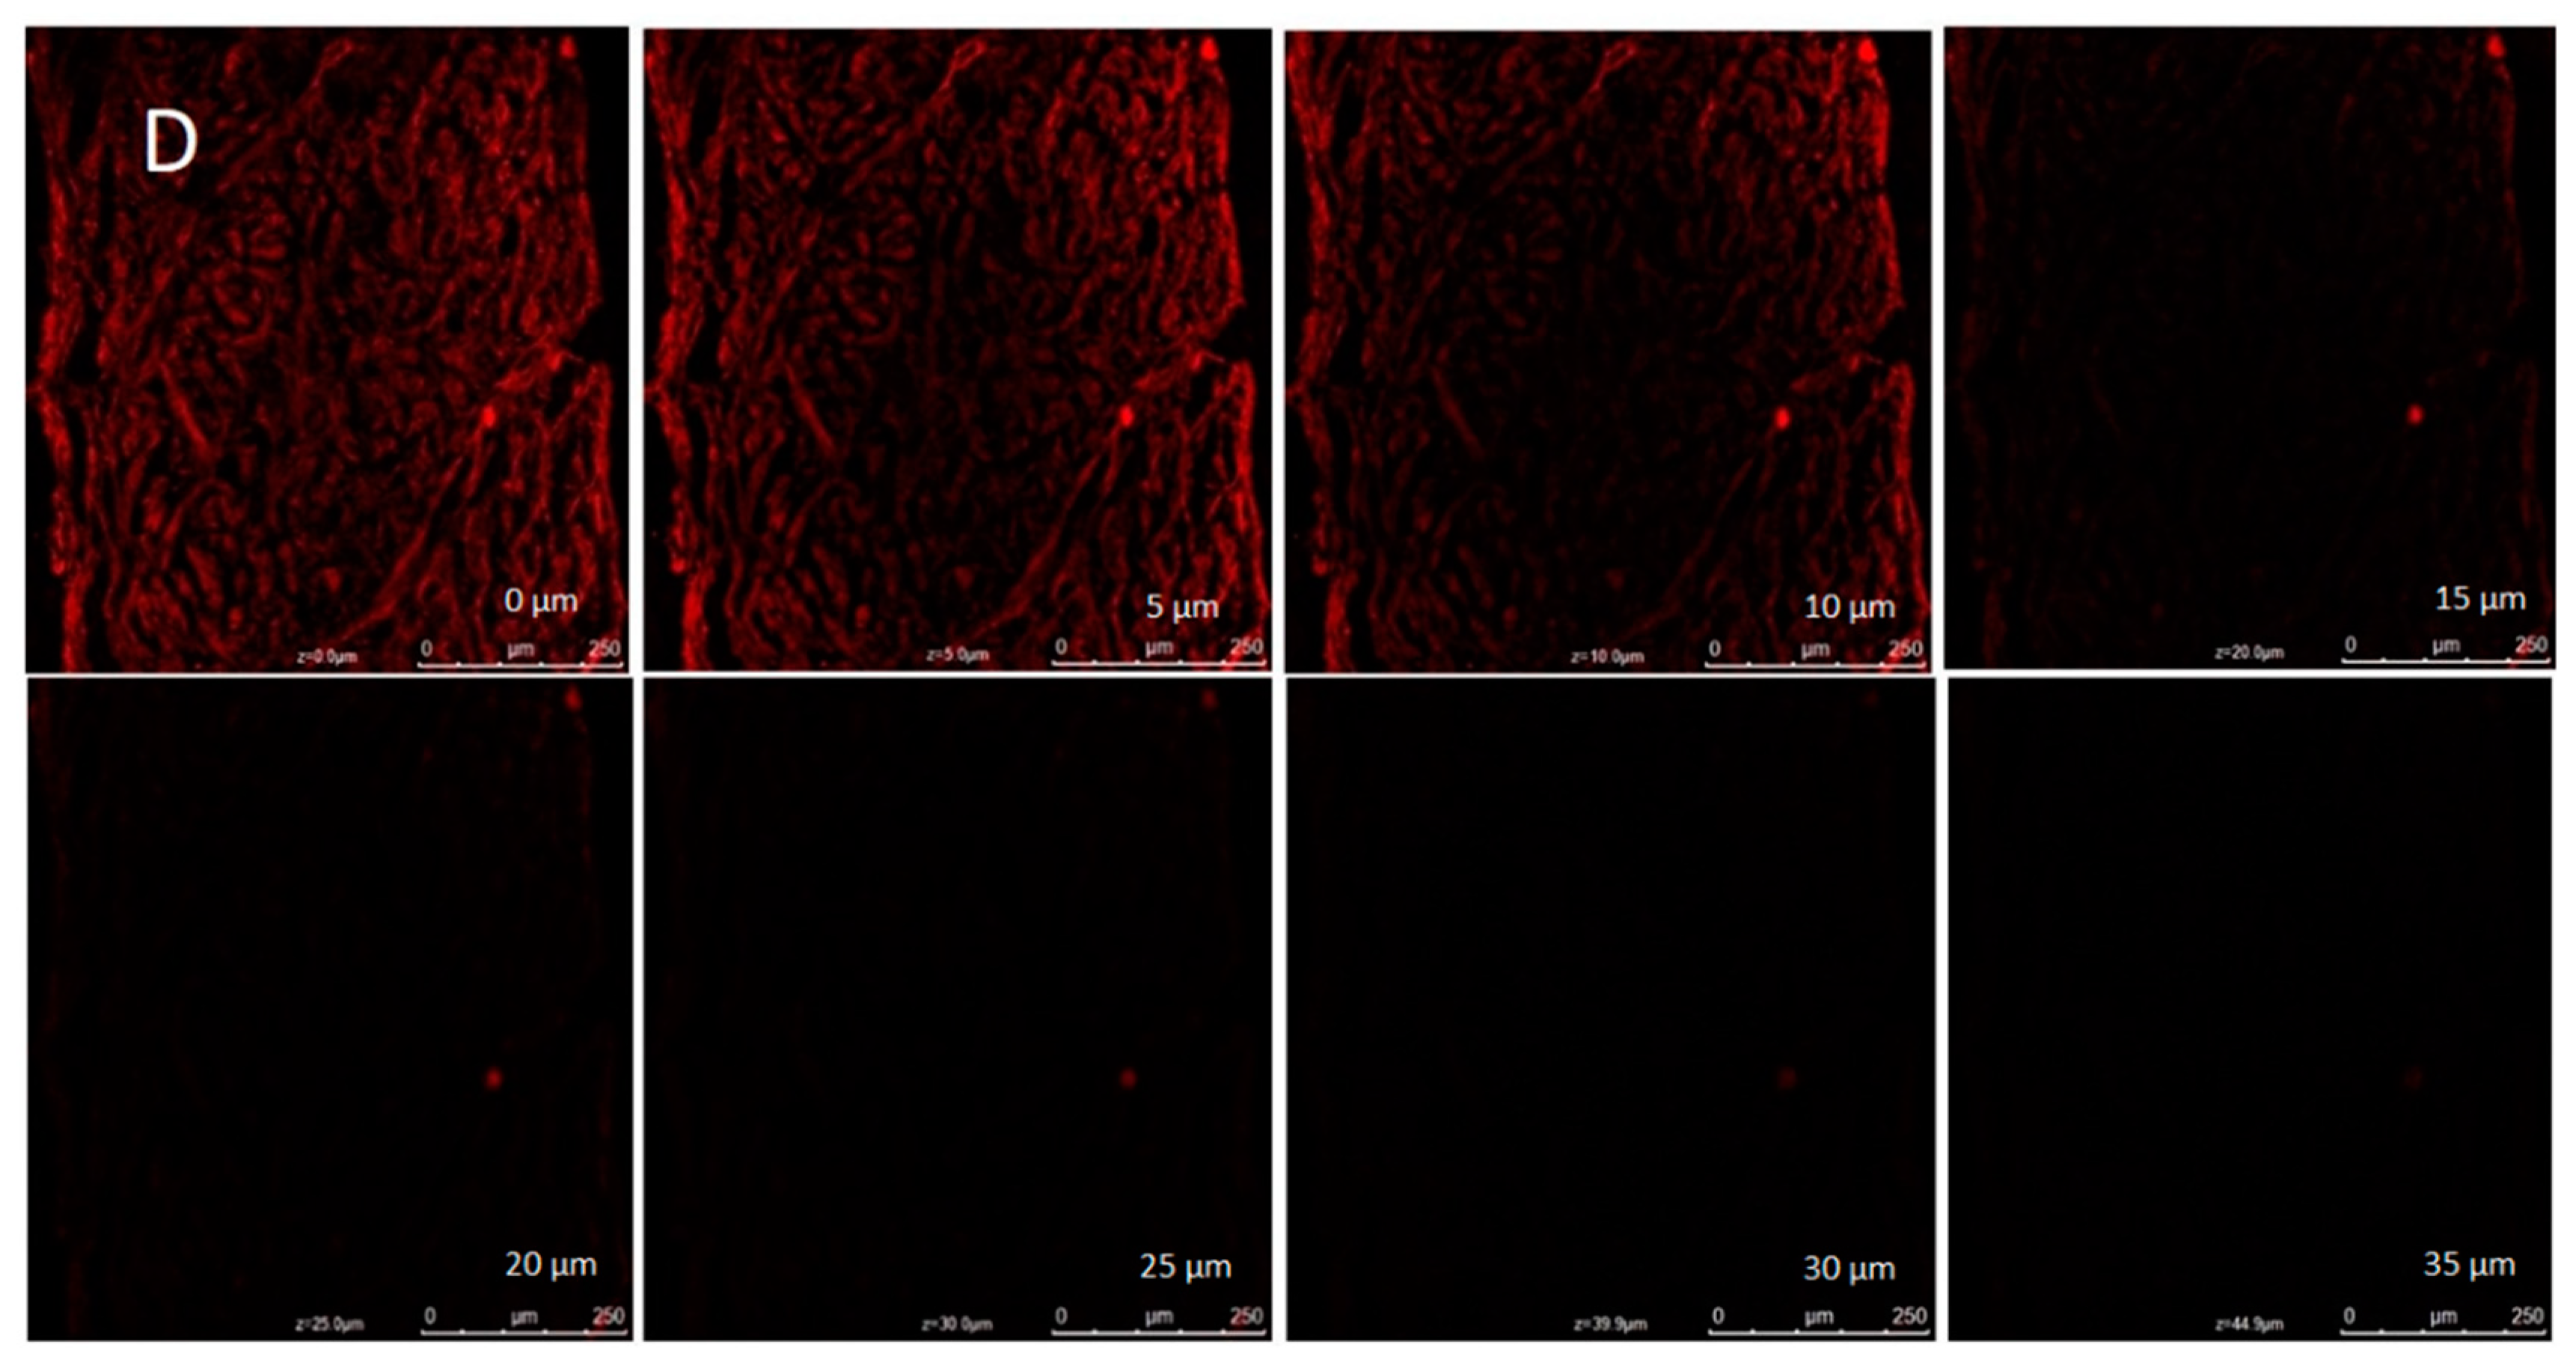
2.3.7. Confocal Laser Scanning Microscopy
2.3.8. Ex Vivo Skin Permeation Study
2.3.9. Skin Irritation Study
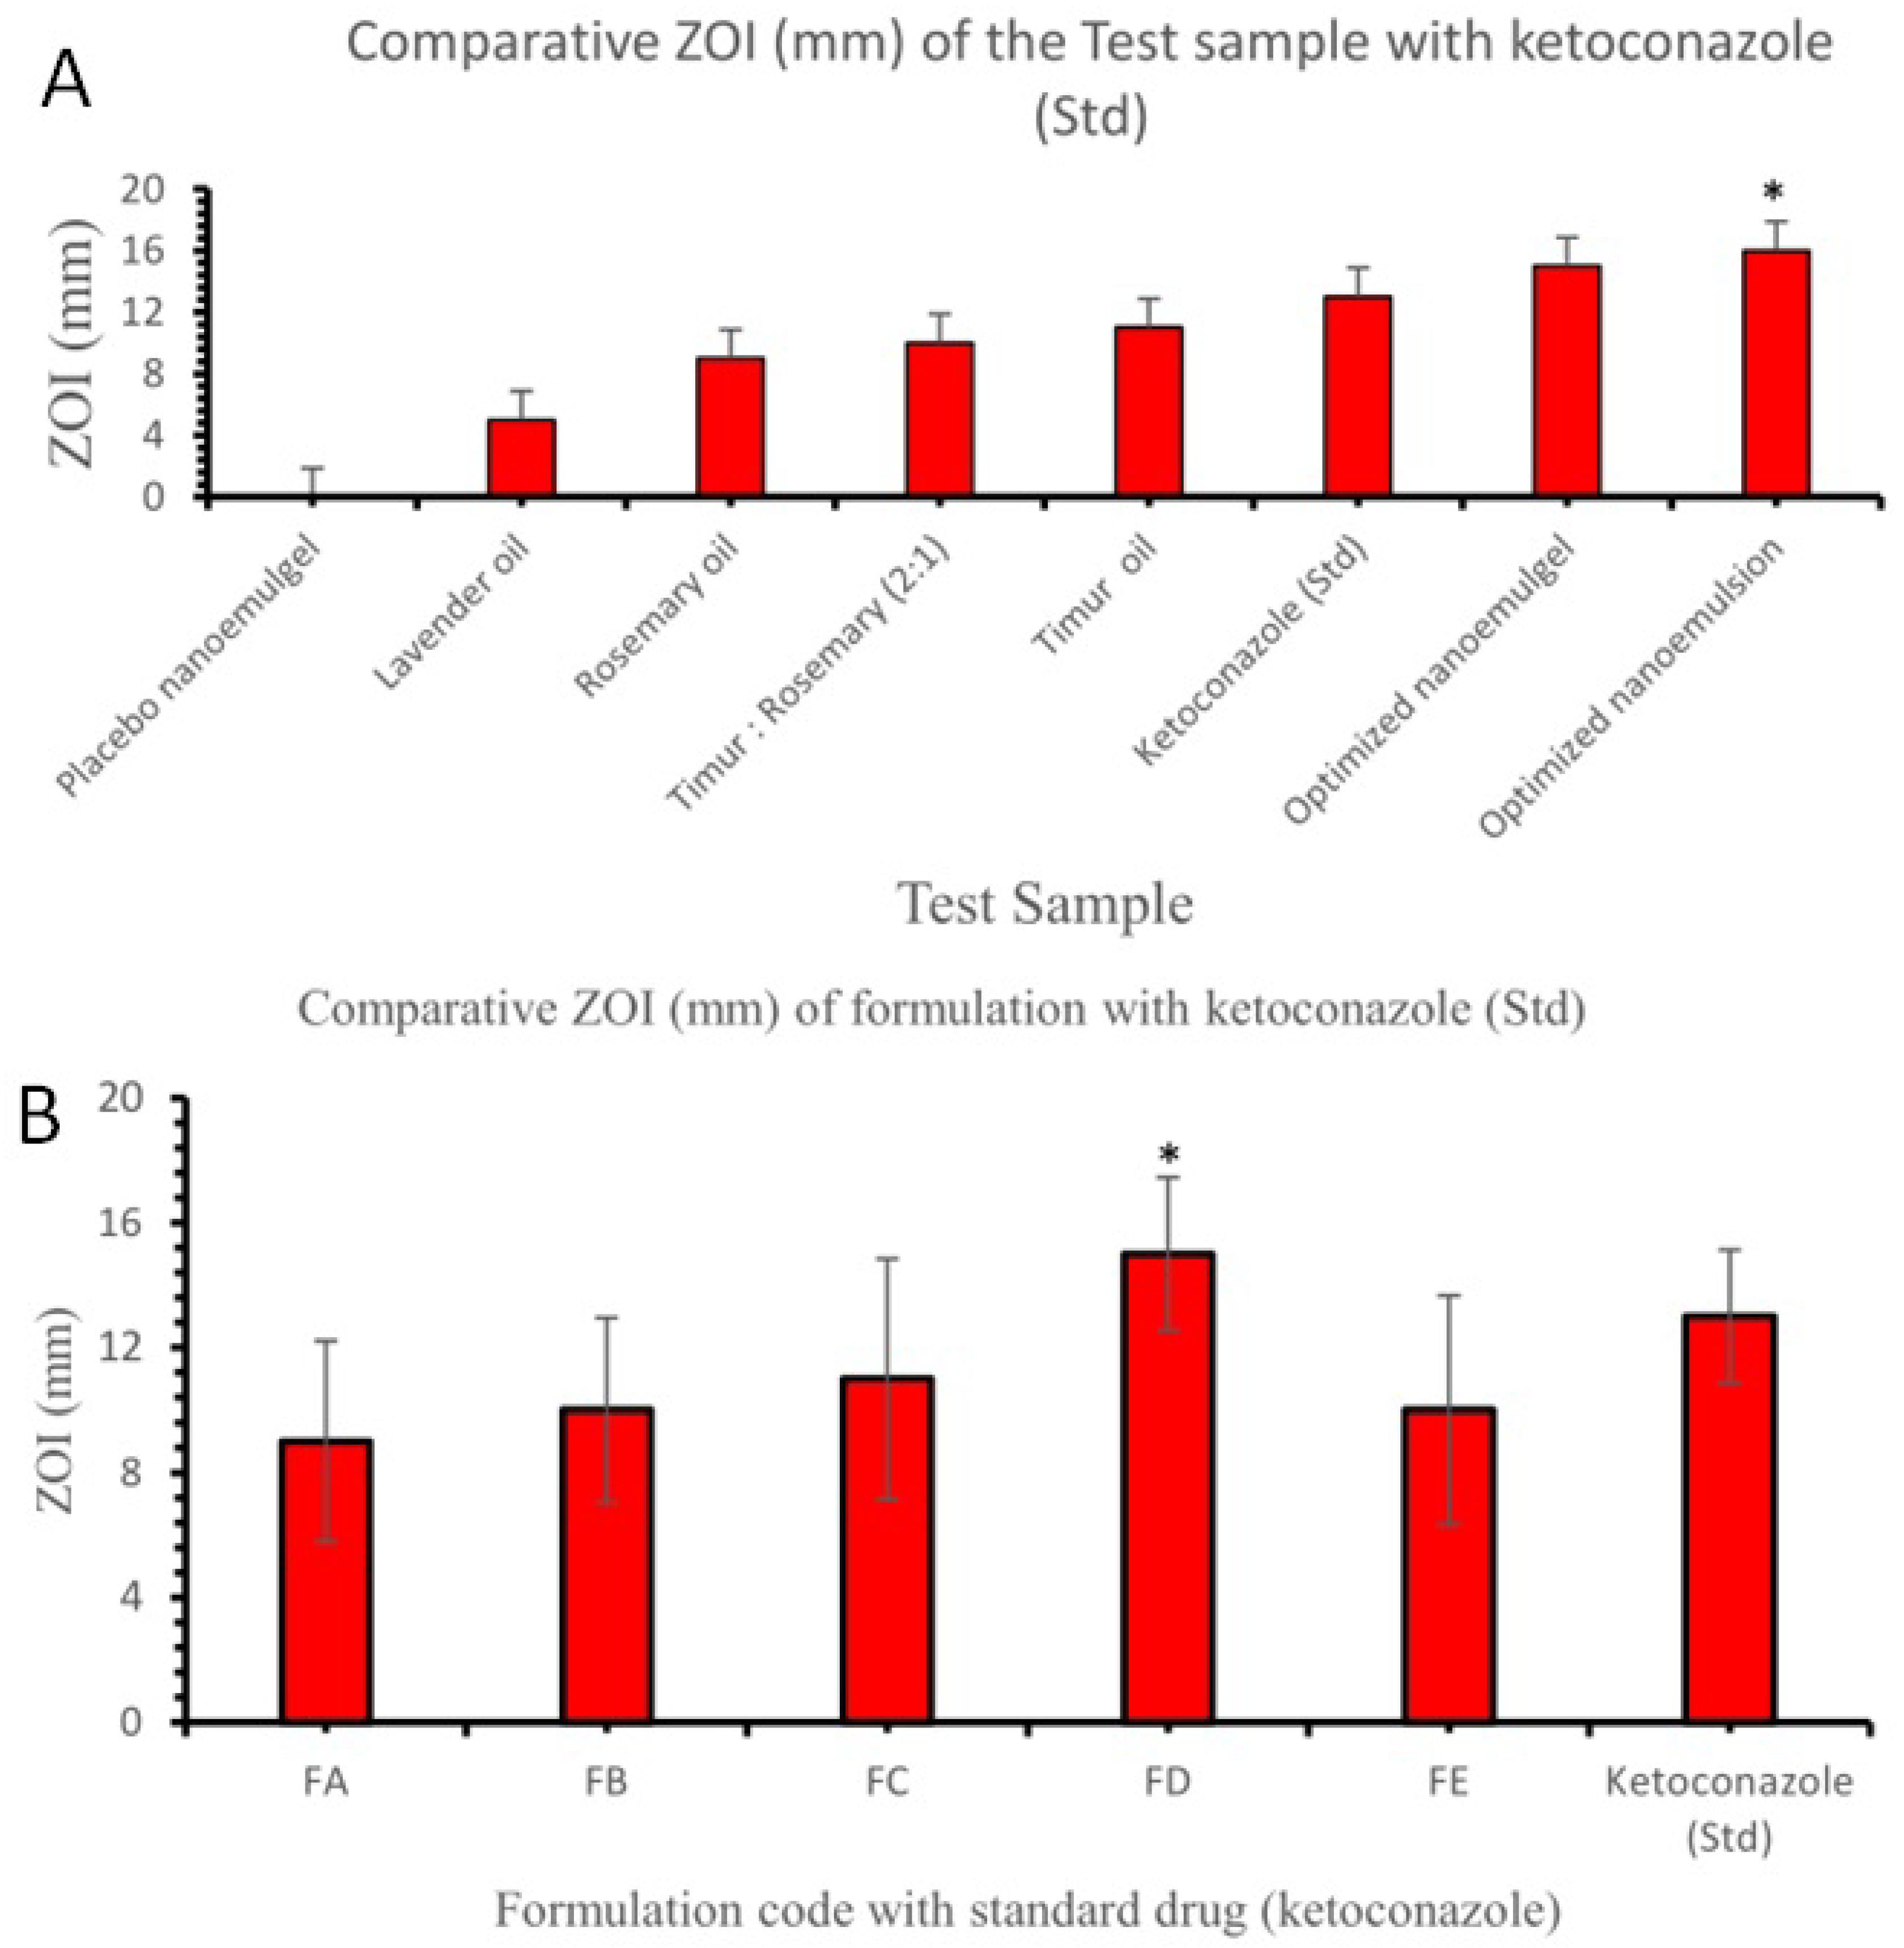
2.3.10. Antifungal Activity
2.3.11. Histopathological Study
3. Conclusions
4. Materials and Methods
4.1. Materials
4.2. Extraction of Timur Oil from Timur Seeds
4.2.1. Identification of Timur Oil
Fourier Transform Infrared (FTIR) Spectroscopy
HPTLC Analysis for Qualitative Estimation of linalool in Timur Oil (Indian Variety and Nepali Variety)
GC Analysis of Timur Oil, Marketed Timur Oil, and Nepali Timur Oil for Quantification of Linalool Content
4.3. Screening of Components for Preparation of Nanoemulsion
4.4. Construction of Pseudoternary Phase Diagram
4.5. Method for Preparation of the Phase Diagram (Aqueous Titration Method)
4.6. Preparation of the Nanoemulsion
Physicochemical Characterization of Nanoemulsion
4.7. Fabrication of Timur Oil Nanoemulgel Formulation
4.7.1. Physical Characterization of Timur Oil Nanoemulgel Formulation
Zeta Potential
Transmission Electron Microscopy (TEM)
Mechanical Properties of NEG
4.7.2. In Vitro Release Study
Release Kinetics
4.7.3. Antifungal Activity of Formulations
Calculation
4.7.4. Ex Vivo Permeation Study
Data Analysis
4.7.5. Drug Deposition Study
4.7.6. Confocal Laser Scanning Microscopy (CLSM)
4.7.7. Skin Irritation Studies
4.7.8. Histopathology of Skin
4.7.9. Statistical Assessment
Author Contributions
Funding
Institutional Review Board Statement
Informed Consent Statement
Data Availability Statement
Acknowledgments
Conflicts of Interest
References
- Garg, A.; Sharma, G.S.; Goyal, A.K.; Ghosh, G.; Si, S.C.; Rath, G. Recent Advances in Topical Carriers of Anti-Fungal Agents. Heliyon 2020, 6, e04663. [Google Scholar] [CrossRef] [PubMed]
- Kyle, A.A.; Dahl, M.V. Topical Therapy for Fungal Infections. Am. J. Clin. Dermatol. 2004, 5, 443–451. [Google Scholar] [CrossRef] [PubMed]
- Ullah, N.; Amin, A.; Farid, A.; Selim, S.; Rashid, S.A.; Aziz, M.I.; Kamran, S.H.; Khan, M.A.; Rahim Khan, N.; Mashal, S.; et al. Development and Evaluation of Essential Oil-Based Nanoemulgel Formulation for the Treatment of Oral Bacterial Infections. Gels 2023, 9, 252. [Google Scholar] [CrossRef] [PubMed]
- Ojha, P. Antifungal Property of Essential Oil Extracted from Zanthoxylum Armatum (Timur). J. Nutr. Health Food Eng. 2015, 3, 266–270. [Google Scholar] [CrossRef]
- Das, N.G.; Nath, D.R.; Baruah, I.; Talukdar, P.K.; Das, S.C. Field Evaluation of Herbal Mosquito Repellents. J. Commun. Dis. 1999, 31, 241–245. [Google Scholar]
- Tiwary, M.; Naik, S.N.; Tewary, D.K.; Mittal, P.K.; Yadav, S. Chemical Composition and Larvicidal Activities of the Essential Oil of Zanthoxylum Armatum DC (Rutaceae) against Three Mosquito Vectors. J. Vector Borne Dis. 2007, 44, 198–204. [Google Scholar]
- Soares, B.V.; Morais, S.M.; Dos Santos Fontenelle, R.O.; Queiroz, V.A.; Vila-Nova, N.S.; Pereira, C.M.C.; Brito, E.S.; Neto, M.A.S.; Brito, E.H.S.; Cavalcante, C.S.P.; et al. Antifungal Activity, Toxicity and Chemical Composition of the Essential Oil of Coriandrum sativum L. Fruits. Molecules 2012, 17, 8439–8448. [Google Scholar] [CrossRef] [Green Version]
- Prakash, B.; Singh, P.; Mishra, P.K.; Dubey, N.K. Safety Assessment of Zanthoxylum Alatum Roxb. Essential Oil, Its Antifungal, Antiaflatoxin, Antioxidant Activity and Efficacy as Antimicrobial in Preservation of Piper nigrum L. Fruits. Int. J. Food Microbiol. 2012, 153, 183–191. [Google Scholar] [CrossRef]
- Guleria, S.; Tiku, A.K.; Koul, A.; Gupta, S.; Singh, G.; Razdan, V.K. Antioxidant and Antimicrobial Properties of the Essential Oil and Extracts of Zanthoxylum Alatum Grown in North-Western Himalaya. Sci. World J. 2013, 2013, 790580. [Google Scholar] [CrossRef] [Green Version]
- Jiang, Y.; Wu, N.; Fu, Y.J.; Wang, W.; Luo, M.; Zhao, C.J.; Zu, Y.G.; Liu, X.L. Chemical Composition and Antimicrobial Activity of the Essential Oil of Rosemary. Environ. Toxicol. Pharmacol. 2011, 32, 63–68. [Google Scholar] [CrossRef]
- Cuvelier, M.; Richard, H.; Berset, C. Antioxidative Activity and Phenolic Composition of Pilot-Plant and Commercial Extracts of Sage and Rosemary. J. Am. Oil Chem. Soc. 1996, 73, 645–652. [Google Scholar] [CrossRef]
- Erkan, N.; Ayranci, G.; Ayranci, E. Antioxidant Activities of Rosemary (Rosmarinus officinalis L.) Extract, Blackseed (Nigella sativa L.) Essential Oil, Carnosic Acid, Rosmarinic Acid and Sesamol. Food Chem. 2008, 110, 76–82. [Google Scholar] [CrossRef]
- Xavier, C.P.R.; Lima, C.F.; Fernandes-Ferreira, M.; Cristina, M.; Pereira-Wilson, C. Salvia Fruticosa, Salvia Officinalis and Rosmarinic Acid Induce Apoptosis and Inhibit Proliferation of Human Colorectal Cell Lines: The Role in MAPK/ERK Pathway. Nutr. Cancer Int. J. 2009, 61, 564–571. [Google Scholar] [CrossRef] [Green Version]
- Almeida, R.; Maggi, F. Antioxidant and Antimicrobial Activities of Rosemary Extracts Linked to Their Polyphenol Composition Related Papers. Free. Radic. Res. 2006, 40, 223–231. [Google Scholar] [CrossRef]
- Radtke, O.A.; Yeap, L.; Lu, Y.; Kiderlen, A.F. Evaluation of Sage Phenolics for Their Antileishmanial Activity and Modulatory Effects on Interleukin-6, Interferon and Tumour Necrosis Factor- α -Release in RAW 264.7 Cells. Z. Naturforsch. C 2003, 58, 395–400. [Google Scholar] [CrossRef]
- Nejati, H.; Farahpour, M.R.; Nagadehi, M.N. Topical Rosemary Officinalis Essential Oil Improves Wound Healing against Disseminated Candida Albicans Infection in Rat Model. Comp. Clin. Path. 2015, 24, 1377–1383. [Google Scholar] [CrossRef]
- Eid, A.M.; Issa, L.; Al-Kharouf, O.; Jaber, R.; Hreash, F. Development of Coriandrum Sativum Oil Nanoemulgel and Evaluation of Its Antimicrobial and Anticancer Activity. BioMed Res. Int. 2021, 2021, 5247816. [Google Scholar] [CrossRef]
- Krishnamoorthy, R.; Gassem, M.A.; Athinarayanan, J.; Periyasamy, V.S.; Prasad, S.; Alshatwi, A.A. Antifungal Activity of Nanoemulsion from Cleome Viscosa Essential Oil against Food-Borne Pathogenic Candida Albicans. Saudi J. Biol. Sci. 2021, 28, 286–293. [Google Scholar] [CrossRef]
- Shafiq-un-Nabi, S.; Shakeel, F.; Talegaonkar, S.; Ali, J.; Baboota, S.; Ahuja, A.; Khar, R.K.; Ali, M. Formulation Development and Optimization Using Nanoemulsion Technique: A Technical Mote. AAPS PharmSciTech 2007, 8, 1–6. [Google Scholar] [CrossRef]
- Algahtani, M.S.; Ahmad, M.Z.; Ahmad, J. Nanoemulgel for Improved Topical Delivery of Retinyl Palmitate: Formulation Design and Stability Evaluation. Nanomaterials 2020, 10, 848. [Google Scholar] [CrossRef]
- Buya, A.B.; Ucakar, B.; Beloqui, A.; Memvanga, P.B.; Préat, V. Design and Evaluation of Self-Nanoemulsifying Drug Delivery Systems (SNEDDSs) for Senicapoc. Int. J. Pharm. 2020, 580, 119180. [Google Scholar] [CrossRef] [PubMed]
- Rajput, R.L.; Narkhede, J.S.; Mujumdar, A.; Naik, J.B. Synthesis and Evaluation of Luliconazole Loaded Biodegradable Nanogels Prepared by PH-Responsive Poly (Acrylic Acid) Grafted Sodium Carboxymethyl Cellulose Using Amine Based Cross Linker for Topical Targeting: In Vitro and Ex Vivo Assessment. Polym. Technol. Mater. 2020, 59, 1654–1666. [Google Scholar] [CrossRef]
- Kaur, R.; Sharma, N.; Tikoo, K.; Sinha, V.R. Development of Mirtazapine Loaded Solid Lipid Nanoparticles for Topical Delivery: Optimization, Characterization and Cytotoxicity Evaluation. Int. J. Pharm. 2020, 586, 119439. [Google Scholar] [CrossRef] [PubMed]
- Aggarwal, G.; Dhawan, B.; Harikumar, S. Enhanced Transdermal Permeability of Piroxicam through Novel Nanoemulgel Formulation. Int. J. Pharm. Investig. 2014, 4, 65. [Google Scholar] [CrossRef] [PubMed] [Green Version]
- Mao, Y.; Chen, X.; Xu, B.; Shen, Y.; Ye, Z.; Chaurasiya, B.; Liu, L.; Li, Y.; Xing, X.; Chen, D. Eprinomectin Nanoemulgel for Transdermal Delivery against Endoparasites and Ectoparasites: Preparation, in Vitro and in Vivo Evaluation. Drug Deliv. 2019, 26, 1104–1114. [Google Scholar] [CrossRef] [Green Version]
- Aman, R.M.; Hashim, I.I.A.; Meshali, M.M. Novel Clove Essential Oil Nanoemulgel Tailored by Taguchi’s Model and Scaffold-Based Nanofibers: Phytopharmaceuticals with Promising Potential as Cyclooxygenase-2 Inhibitors in External Inflammation. J. Nanomed. 2020, 15, 2171–2195. [Google Scholar] [CrossRef] [Green Version]
- Goel, S.; Sachdeva, M.; Agarwal, V. Nanosuspension Technology: Recent Patents on Drug Delivery and Their Characterizations. Recent Pat. Drug Deliv. Formul. 2019, 13, 91–104. [Google Scholar] [CrossRef]
- Goel, S.; Agarwal, V.; Sachdeva, M. Development and Characterization of Oral Nanosuspension Using Esomeprazole Magnesium Trihydrate. Nanosci. Nanotechnol.-Asia 2019, 10, 909–917. [Google Scholar] [CrossRef]
- Barhoum, A.; García-Betancourt, M.L.; Rahier, H.; Van Assche, G. Physicochemical Characterization of Nanomaterials: Polymorph, Composition, Wettability, and Thermal Stability. In Emerging Applications of Nanoparticles and Architectural Nanostructures: Current Prospects and Future Trends; Elsevier: Amsterdam, The Netherlands, 2018; pp. 255–278. ISBN 9780128135167. [Google Scholar]
- Talegaonkar, S.; Dutta, D.; Chaudhary, N.; Goel, S.; Singh, R. Metal Nanoparticles as a Surrogate Carrier in Drug Delivery and Diagnostics. In Micro- and Nanotechnologies-Based Product Development; CRC Press: Boca Raton, FL, USA, 2021; pp. 139–161. [Google Scholar] [CrossRef]
- Goel, S.; Agarwal, V.; Sachdeva, M. Nanocrystals: A Strategic Approach for the Development of Futuristic Nano-Formulations and Their Patenting Applicability. Curr. Nanosci. 2021, 18, 291–303. [Google Scholar] [CrossRef]
- Yaprak Karavana, S.; Güneri, P.; Ertan, G. Benzydamine Hydrochloride Buccal Bioadhesive Gels Designed for Oral Ulcers: Preparation, Rheological, Textural, Mucoadhesive and Release Properties. Pharm. Dev. Technol. 2009, 14, 623–631. [Google Scholar] [CrossRef]
- Cevher, E.; Taha, M.A.M.; Orlu, M.; Araman, A. Evaluation of Mechanical and Mucoadhesive Properties of Clomiphene Citrate Gel Formulations Containing Carbomers and Their Thiolated Derivatives. Drug Deliv. 2008, 15, 57–67. [Google Scholar] [CrossRef] [Green Version]
- Osmałek, T.; Milanowski, B.; Froelich, A.; Górska, S.; Białas, W.; Szybowicz, M.; Kapela, M. Novel Organogels for Topical Delivery of Naproxen: Design, Physicochemical Characteristics and in Vitro Drug Permeation. Pharm. Dev. Technol. 2017, 22, 521–536. [Google Scholar] [CrossRef]
- Mohapatra, S.; Mirza, M.A.; Ahmad, S.; Farooq, U.; Ansari, M.J.; Kohli, K.; Iqbal, Z. Quality by Design Assisted Optimization and Risk Assessment of Black Cohosh Loaded Ethosomal Gel for Menopause: Investigating Different Formulation and Process Variables. Pharmaceutics 2023, 15, 465. [Google Scholar] [CrossRef]
- Hasan, N.; Imran, M.; Nadeem, M.; Jain, D.; Haider, K.; Moshahid Alam Rizvi, M.; Sheikh, A.; Kesharwani, P.; Kumar jain, G.; Jalees Ahmad, F. Formulation and Development of Novel Lipid-Based Combinatorial Advanced Nanoformulation for Effective Treatment of Non-Melanoma Skin Cancer. Int. J. Pharm. 2023, 632, 122580. [Google Scholar] [CrossRef]
- Deng, Y.; Liu, Z.; Geng, Y. Anti-Allergic Effect of Artemisia Extract in Rats. Exp. Ther. Med. 2016, 12, 1130–1134. [Google Scholar] [CrossRef] [Green Version]
- Islam, N.; Irfan, M.; Zahoor, A.F.; Iqbal, M.S.; Syed, H.K.; Khan, I.U.; Rasul, A.; Khan, S.U.D.; Alqahtani, A.M.; Ikram, M.; et al. Improved Bioavailability of Ebastine through Development of Transfersomal Oral Films. Pharmaceutics 2021, 13, 1315. [Google Scholar] [CrossRef]
- Ojha, B.; Jain, V.K.; Gupta, S.; Talegaonkar, S.; Jain, K. Nanoemulgel: A Promising Novel Formulation for Treatment of Skin Ailments. Polym. Bull. 2022, 79, 4441–4465. [Google Scholar] [CrossRef]
- Sengupta, P.; Chatterjee, B. Potential and Future Scope of Nanoemulgel Formulation for Topical Delivery of Lipophilic Drugs. Int. J. Pharm. 2017, 526, 353–365. [Google Scholar] [CrossRef]
- Ma, Q.; Zhang, J.; Lu, B.; Lin, H.; Sarkar, R.; Wu, T.; Li, X. Nanoemulgel for Improved Topical Delivery of Desonide: Formulation Design and Characterization. AAPS PharmSciTech 2021, 22, 163. [Google Scholar] [CrossRef]
- Cecchini, M.E.; Paoloni, C.; Campra, N.; Picco, N.; Grosso, M.C.; Soriano Perez, M.L.; Alustiza, F.; Cariddi, N.; Bellingeri, R. Nanoemulsion of Minthostachys Verticillata Essential Oil. In-Vitro Evaluation of Its Antibacterial Activity. Heliyon 2021, 7, e05896. [Google Scholar] [CrossRef]
- Yeo, E.; Yew Chieng, C.J.; Choudhury, H.; Pandey, M.; Gorain, B. Tocotrienols-Rich Naringenin Nanoemulgel for the Management of Diabetic Wound: Fabrication, Characterization and Comparative in Vitro Evaluations. Curr. Res. Pharmacol. Drug Discov. 2021, 2, 100019. [Google Scholar] [CrossRef] [PubMed]
- Taleuzzaman, M.; Sartaj, A.; Kumar Gupta, D.; Gilani, S.J.; Mirza, M.A. Phytosomal Gel of Manjistha Extract (MJE) Formulated and Optimized with Central Composite Design of Quality by Design (QbD). J. Dispers. Sci. Technol. 2023, 44, 236–244. [Google Scholar] [CrossRef]
- Gao, M.; Shen, X.; Mao, S. Factors Influencing Drug Deposition in the Nasal Cavity upon Delivery via Nasal Sprays. J. Pharm. Investig. 2020, 50, 251–259. [Google Scholar] [CrossRef]
- Agarwal, V.; Bajpai, M. Stability Issues Related to Nanosuspensions: A Review: Ingenta Connect. Pharm. Nanotech. 2013, 1, 85–92. [Google Scholar] [CrossRef]
- Godwin, D.A.; Michniak, B.B.; Creek, K.E. Evaluation of Transdermal Penetration Enhancers Using a Novel Skin Alternative. J. Pharm. Sci. 1997, 86, 1001–1005. [Google Scholar] [CrossRef]
- Shin, S.C.; Choi, J.S. Enhanced Efficacy of Triprolidine by Transdermal Application of the EVA Matrix System in Rabbits and Rats. Eur. J. Pharm. Biopharm. 2005, 61, 14–19. [Google Scholar] [CrossRef]
- Datta, D.; Panchal, D.S.; Venuganti, V.V.K. Transdermal Delivery of Vancomycin Hydrochloride: Influence of Chemical and Physical Permeation Enhancers. Int. J. Pharm. 2021, 602, 120663. [Google Scholar] [CrossRef]
- Zhang, Y.; Lane, M.E.; Moore, D.J. An Investigation of the Influence of PEG 400 and PEG-6-Caprylic/Capric Glycerides on Dermal Delivery of Niacinamide. Polymers 2020, 12, 2907. [Google Scholar] [CrossRef]
- Sampathi, S.; Mankala, S.K.; Wankar, J.; Dodoala, S. Nanoemulsion Based Hydrogels of Itraconazole for Transdermal Drug Delivery. J. Sci. Ind. Res. 2015, 74, 88–92. [Google Scholar]
- Al Mentaji, H.N. Official Methods of Analysis of AOAC International, 18th ed.; Horwitz, D.W.L., Latimer, D.G.W., Eds.; AOAC International: Rockville, MD, USA, 2005; ISBN 0935584773. [Google Scholar]
- Sourmaghi, M.H.S.; Kiaee, G.; Golfakhrabadi, F.; Jamalifar, H.; Khanavi, M. Comparison of Essential Oil Composition and Antimicrobial Activity of Coriandrum sativum L. Extracted by Hydrodistillation and Microwave-Assisted Hydrodistillation. J. Food Sci. Technol. 2015, 52, 2452–2457. [Google Scholar] [CrossRef] [Green Version]
- Shafiq, S.; Shakeel, F.; Talegaonkar, S.; Ahmad, F.J.; Khar, R.K.; Ali, M. Development and Bioavailability Assessment of Ramipril Nanoemulsion Formulation. Eur. J. Pharm. Biopharm. 2007, 66, 227–243. [Google Scholar] [CrossRef]
- Eid, A.M.; Jaradat, N.A.; Al-Masri, M.; Issa, L.; Zubidat, F.; Asrawi, H.; Ahmad, S. Development and Antimicrobial Evaluation of Eruca Sativa Oil Nanoemulgel with Determination of the Oil Antioxidant, Sun Protection Factor and Elastase Inhibition. Curr. Pharm. Biotechnol. 2020, 21, 244–255. [Google Scholar] [CrossRef]
- Zakir, F.; Ahmad, A.; Farooq, U.; Mirza, M.A.; Tripathi, A.; Singh, D.; Shakeel, F.; Mohapatra, S.; Ahmad, F.J.; Kohli, K. Design and Development of a Commercially Viable in Situ Nanoemulgel for the Treatment of Postmenopausal Osteoporosis. Nanomedicine 2020, 15, 1167–1187. [Google Scholar] [CrossRef]
- Eid, A.M.; Istateyeh, I.; Salhi, N.; Istateyeh, T. Antibacterial Activity of Fusidic Acid and Sodium Fusidate Nanoparticles Incorporated in Pine Oil Nanoemulgel. Int. J. Nanomed. 2019, 14, 9411–9421. [Google Scholar] [CrossRef] [Green Version]
- Dordević, S.M.; Cekić, N.D.; Savić, M.M.; Isailović, T.M.; Randelović, D.V.; Marković, B.D.; Savić, S.R.; Stamenić, T.T.; Daniels, R.; Savić, S.D. Parenteral Nanoemulsions as Promising Carriers for Brain Delivery of Risperidone: Design, Characterization and in Vivo Pharmacokinetic Evaluation. Int. J. Pharm. 2015, 493, 40–54. [Google Scholar] [CrossRef] [Green Version]
- Vivo, E.; Assessment, I.V.; Barkat, A.; Ansari, M.J. Development of Natural Polysaccharid–Based Nanoparticles of Berberine to Enhance Oral Bioavailability: Formulation, Optimization, Ex Vivo, and In Vivo Assessment. Polymers 2021, 13, 3844. [Google Scholar]
- Mangla, B. Lipid-Nanopotentiated Combinatorial Delivery of Tamoxifen and Sulforaphane: Ex Vivo, in Vivo and Toxicity Studies. Nanomedicine 2020, 15, 2563–2583. [Google Scholar] [CrossRef]
- Singh, A.; Neupane, Y.R.; Panda, B.P.; Kohli, K. Lipid Based Nanoformulation of Lycopene Improves Oral Delivery: Formulation Optimization, Ex Vivo Assessment and Its Efficacy against Breast Cancer. J Microencapsul. 2017, 34, 416–429. [Google Scholar] [CrossRef]
- Hurler, J.; Engesland, A.; Kermany, B.P.; Skalko-Basnet, N. Improved Texture Analysis for Hydrogel Characterization: Gel Cohesiveness, Adhesiveness, and Hardness. J. Appl. Polym. Sci. 2012, 125, 180–188. [Google Scholar] [CrossRef]
- Jain, P.; Mirza, M.A.; Talegaonkar, S.; Nandy, S.; Dudeja, M.; Sharma, N.; Anwer, K.; Alshahrani, S.M.; Iqbal, Z. Design and in Vitro/in Vivo Evaluations of a Multiple-Drug-Containing Gingiva Disc For. RSC Adv. 2020, 10, 8530–8538. [Google Scholar] [CrossRef] [Green Version]
- Indian Pharmacopoeia Commission. Indian Pharmacopeia; IPC: Raknpa, India, 2007; Volume 2, ISBN 81-903436-0-3. [Google Scholar]
- Jain, P.; Taleuzzaman, M.; Kala, C.; Gupta, D.K.; Ali, A.; Aslam, M. Quality by Design (Qbd) Assisted Development of Phytosomal Gel of Aloe-Vera Extract for Topical Delivery. J. Liposome Res. 2021, 31, 381–388. [Google Scholar] [CrossRef]
- Sankar Kadimi, U.; Balasubramanian, D.R.; Ganni, U.R.; Balaraman, M.; Govindarajulu, V. In Vitro Studies on Liposomal Amphotericin B Obtained by Supercritical Carbon Dioxide-Mediated Process. Nanomed. Nanotechnol. Biol. Med. 2007, 3, 273–280. [Google Scholar] [CrossRef] [PubMed]
- Banjara, R.A.; Jadhav, S.K.; Bhoite, S.A. Antibacterial Activity of Di-2-Ethylaniline Phosphate Screened by Paper Disc Diffusion Method. J. Appl. Pharm. Sci. 2012, 2, 230–233. [Google Scholar] [CrossRef] [Green Version]
- Pillai, O.; Hamad, M.O.; Crooks, P.A.; Stinchcomb, A.L. Physicochemical Evaluation, in Vitro Human Skin Diffusion, and Concurrent Biotransformation of 3-O-Alkyl Carbonate Prodrugs of Naltrexone. Pharm. Res. 2004, 21, 1146–1152. [Google Scholar] [CrossRef] [PubMed]
- Elsayed, M.M.A.; Abdallah, O.Y.; Naggar, V.F.; Khalafallah, N.M. Lipid Vesicles for Skin Delivery of Drugs: Reviewing Three Decades of Research. Int. J. Pharm. 2007, 332, 1–16. [Google Scholar] [CrossRef] [PubMed]
- Dave, N.; Chan, M.Y.; Huang, P.J.J.; Smith, B.D.; Liu, J. Regenerable DNA-Functionalized Hydrogels for Ultrasensitive, Instrument-Free Mercury(II) Detection and Removal in Water. J. Am. Chem. Soc. 2010, 132, 12668–12673. [Google Scholar] [CrossRef] [Green Version]
- Hussain, T.; Tan, B.; Yin, Y.; Blachier, F.; Tossou, M.C.B.; Rahu, N. Oxidative Stress and Inflammation: What Polyphenols Can Do for Us? Oxid. Med. Cell. Longev. 2016, 2016, 7432797. [Google Scholar] [CrossRef] [Green Version]
- Suntharalingam, M.; Alcázar-Román, A.R.; Wente, S.R. Nuclear Export of the Yeast MRNA-Binding Protein Nab2 Is Linked to a Direct Interaction with Gfd1 and to Gle1 Function. J. Biol. Chem. 2004, 279, 35384–35391. [Google Scholar] [CrossRef] [Green Version]
- Draize, J.H.; Nelson, A.A.; Calvery, H.O. The Percutaneous Adsorption of DDT (2, 2,-Bis (p-Chlorophenyl) 1,1,1-Triehlorethane) to Laboratory Animals. J. Pharmacol. Exp. Ther. 1944, 82, 159–166. [Google Scholar]
- Patel, M.R.; Patel, R.B.; Parikh, J.R.; Patel, B.G. Novel Isotretinoin Microemulsion-Based Gel for Targeted Topical Therapy of Acne: Formulation Consideration, Skin Retention and Skin Irritation Studies. Appl. Nanosci. 2016, 6, 539–553. [Google Scholar] [CrossRef] [Green Version]
- Joshi, M.; Patravale, V. Formulation and Evaluation of Nanostructured Lipid Carrier (NLC)-Based Gel of Valdecoxib. Drug Dev. Ind. Pharm. 2006, 32, 911–918. [Google Scholar] [CrossRef]
- Pople, P.V.; Singh, K.K. Development and Evaluation of Topical Formulation Containing Solid Lipid Nanoparticles of Vitamin A. AAPS PharmSciTech 2006, 7, E63–E69. [Google Scholar] [CrossRef] [Green Version]
- Dammu, R.K.M.; Saileela, K. Clinico-Microbiological Study of Dermatophytosis in the Tertiary Care Hospital, KMC & H, Chinakondrupadu, Guntur. Indian J. Microbiol. Res. 2020, 7, 258–264. [Google Scholar] [CrossRef]


| Sample No. | Functional Group | Wavenumber (cm−1) | Observed (cm−1) |
|---|---|---|---|
| 1 | OH stretching | 3550–3200 | 3399.83 |
| 2 | C-H Stretching | 3000–2840 | 2923.29 |
| 3 | C=C Stretching | 1680–1630 | 1640.34 |
| 4 | C-H bending | 1600–1400 | 1451.66 |
| 5 | C-O stretching | 1124–1087 | 1090.89 |
| Parameter | Linalool Content in Timur Oil (Nepali Variety) | Standard (Linalool) |
|---|---|---|
| Area | 51,550,363 | 272,960,345 |
| Retention time | 15.531 | 15.583 |
| Formulation Code | Drug Concentration | Carbopol 940 (% w/v) Concentration | Particle Size (nm) | Resultant PDI | ZOI (mm) | |
|---|---|---|---|---|---|---|
| Timur Oil (%) | Rosemary Oil (%) | |||||
| FA | 1 | 2 | 0.5 | 255 | 0.590 | 9 |
| FB | 0.5 | 0.5 | 1.0 | 195 | 0.521 | 10 |
| FC | 1.0 | 1.0 | 1.5 | 166 | 0.412 | 11 |
| FD | 2.0 | 1.0 | 1.8 | 139 | 0.309 | 15 |
| FE | 1.0 | 0.5 | 2.0 | 172 | 0.389 | 10 |
| Test ID | Batch | Firmness (g) Force 1 | Consistency (g. s) Area F-T 1:2 | Cohesiveness (g) Force 2 | Index of Viscosity (g. s) Area F-T 2:3 | |
|---|---|---|---|---|---|---|
| Start Batch Force | Force | |||||
| Force 1 | Force | 783.01 | 898.34 | −459.81 | −688.84 | |
| End Batch Force | Force | |||||
| Average: | Force (F) | AVERAGE (“BATCH”) | 783.01 | 898.34 | −459.81 | −688.84 |
| S. D. | Force (F) | STDEVP (“BATCH”) | 0.00 | 0.00 | 0.00 | 0.00 |
| C. V. | Force (F) | STDEVP (“BATCH”)/AVERAGE(“BATCH”) ×100 | 0.00 | 0.00 | 0.00 | 0.00 |
| End of Test Data |
| The Dose Applied to the Skin | Drug Deposited (µg) |
|---|---|
| 1 g of nanoemulgel | 56.45 |
| 1 mL of pure Timur oil | 34.56 |
| Formulations | Erythyma Score (Total) | ||
|---|---|---|---|
| 24 h | 48 h | 72 h | |
| Control (Group I) | 0 | 0 | 0 |
| Aqueous formalin solution (Group II) | 3 | 4 | 4 |
| Developed nanoemulgel (1% rosemary oil + 2% Timur oil) (Group III) | 0 | 0 | 0 |
| Developed nanoemulsion (1% rosemary oil + 2% Timur oil) (Group IV) | 0 | 0 | 0 |
| Marketed gel (Group V) | 1 | 2 | 2 |
| S. No. | Disk Code | Formulations/Samples | Concentration (µg/mL) | ZOI (mm) |
|---|---|---|---|---|
| 1. | 5 a | Smix | 10 | 00 ± 00 |
| 2. | 6 a | Timur oil | 10 | 11 ± 0.7 |
| 3. | 7 a | Lavender oil | 10 | 5 ± 0.9 |
| 4. | 8 a | Rosemary oil | 10 | 9 ± 0.5 |
| 5. | 5 b | Placebo nanoemulgel | 10 | 0 ± 0.0 |
| 6. | 6 b | Timur:rosemary (2:1) | 10 | 10 ± 0.4 |
| 7. | 7 b | Timur oil | 10 | 11 ± 0.7 |
| 8. | 8 b | Developed Nanoemulsion | 10 | 16 ± 1.01 * |
| 9. | 5 c | Placebo nanoemulsion | 10 | 0 ± 0.0 |
| 10. | 6 c | Ketoconazole (standard) | 10 | 13 ± 0.8 |
| 11. | 7 c | Timur:rosemary (2:1) | 10 | 10 ± 0.4 |
| 12. | 8 c | 1.8% nanoemulgel | 10 | 15 ± 2.9 |
Disclaimer/Publisher’s Note: The statements, opinions and data contained in all publications are solely those of the individual author(s) and contributor(s) and not of MDPI and/or the editor(s). MDPI and/or the editor(s) disclaim responsibility for any injury to people or property resulting from any ideas, methods, instructions or products referred to in the content. |
© 2023 by the authors. Licensee MDPI, Basel, Switzerland. This article is an open access article distributed under the terms and conditions of the Creative Commons Attribution (CC BY) license (https://creativecommons.org/licenses/by/4.0/).
Share and Cite
Noor, A.; Jamil, S.; Sadeq, T.W.; Mohammed Ameen, M.S.; Kohli, K. Development and Evaluation of Nanoformulations Containing Timur Oil and Rosemary Oil for Treatment of Topical Fungal Infections. Gels 2023, 9, 516. https://doi.org/10.3390/gels9070516
Noor A, Jamil S, Sadeq TW, Mohammed Ameen MS, Kohli K. Development and Evaluation of Nanoformulations Containing Timur Oil and Rosemary Oil for Treatment of Topical Fungal Infections. Gels. 2023; 9(7):516. https://doi.org/10.3390/gels9070516
Chicago/Turabian StyleNoor, Afeefa, Shahid Jamil, Tariq Waece Sadeq, Muath Sheet Mohammed Ameen, and Kanchan Kohli. 2023. "Development and Evaluation of Nanoformulations Containing Timur Oil and Rosemary Oil for Treatment of Topical Fungal Infections" Gels 9, no. 7: 516. https://doi.org/10.3390/gels9070516