
Comparison of Different Aerogel Granules for Use as Aggregate in Concrete
 , and
, and
Abstract
:1. Introduction
2. Materials and Methods
2.1. Materials
2.2. Methods for the Characterization of Aerogels
2.3. Methods for the Determination of Fresh and Hardened Concrete Properties
3. Results and Discussion
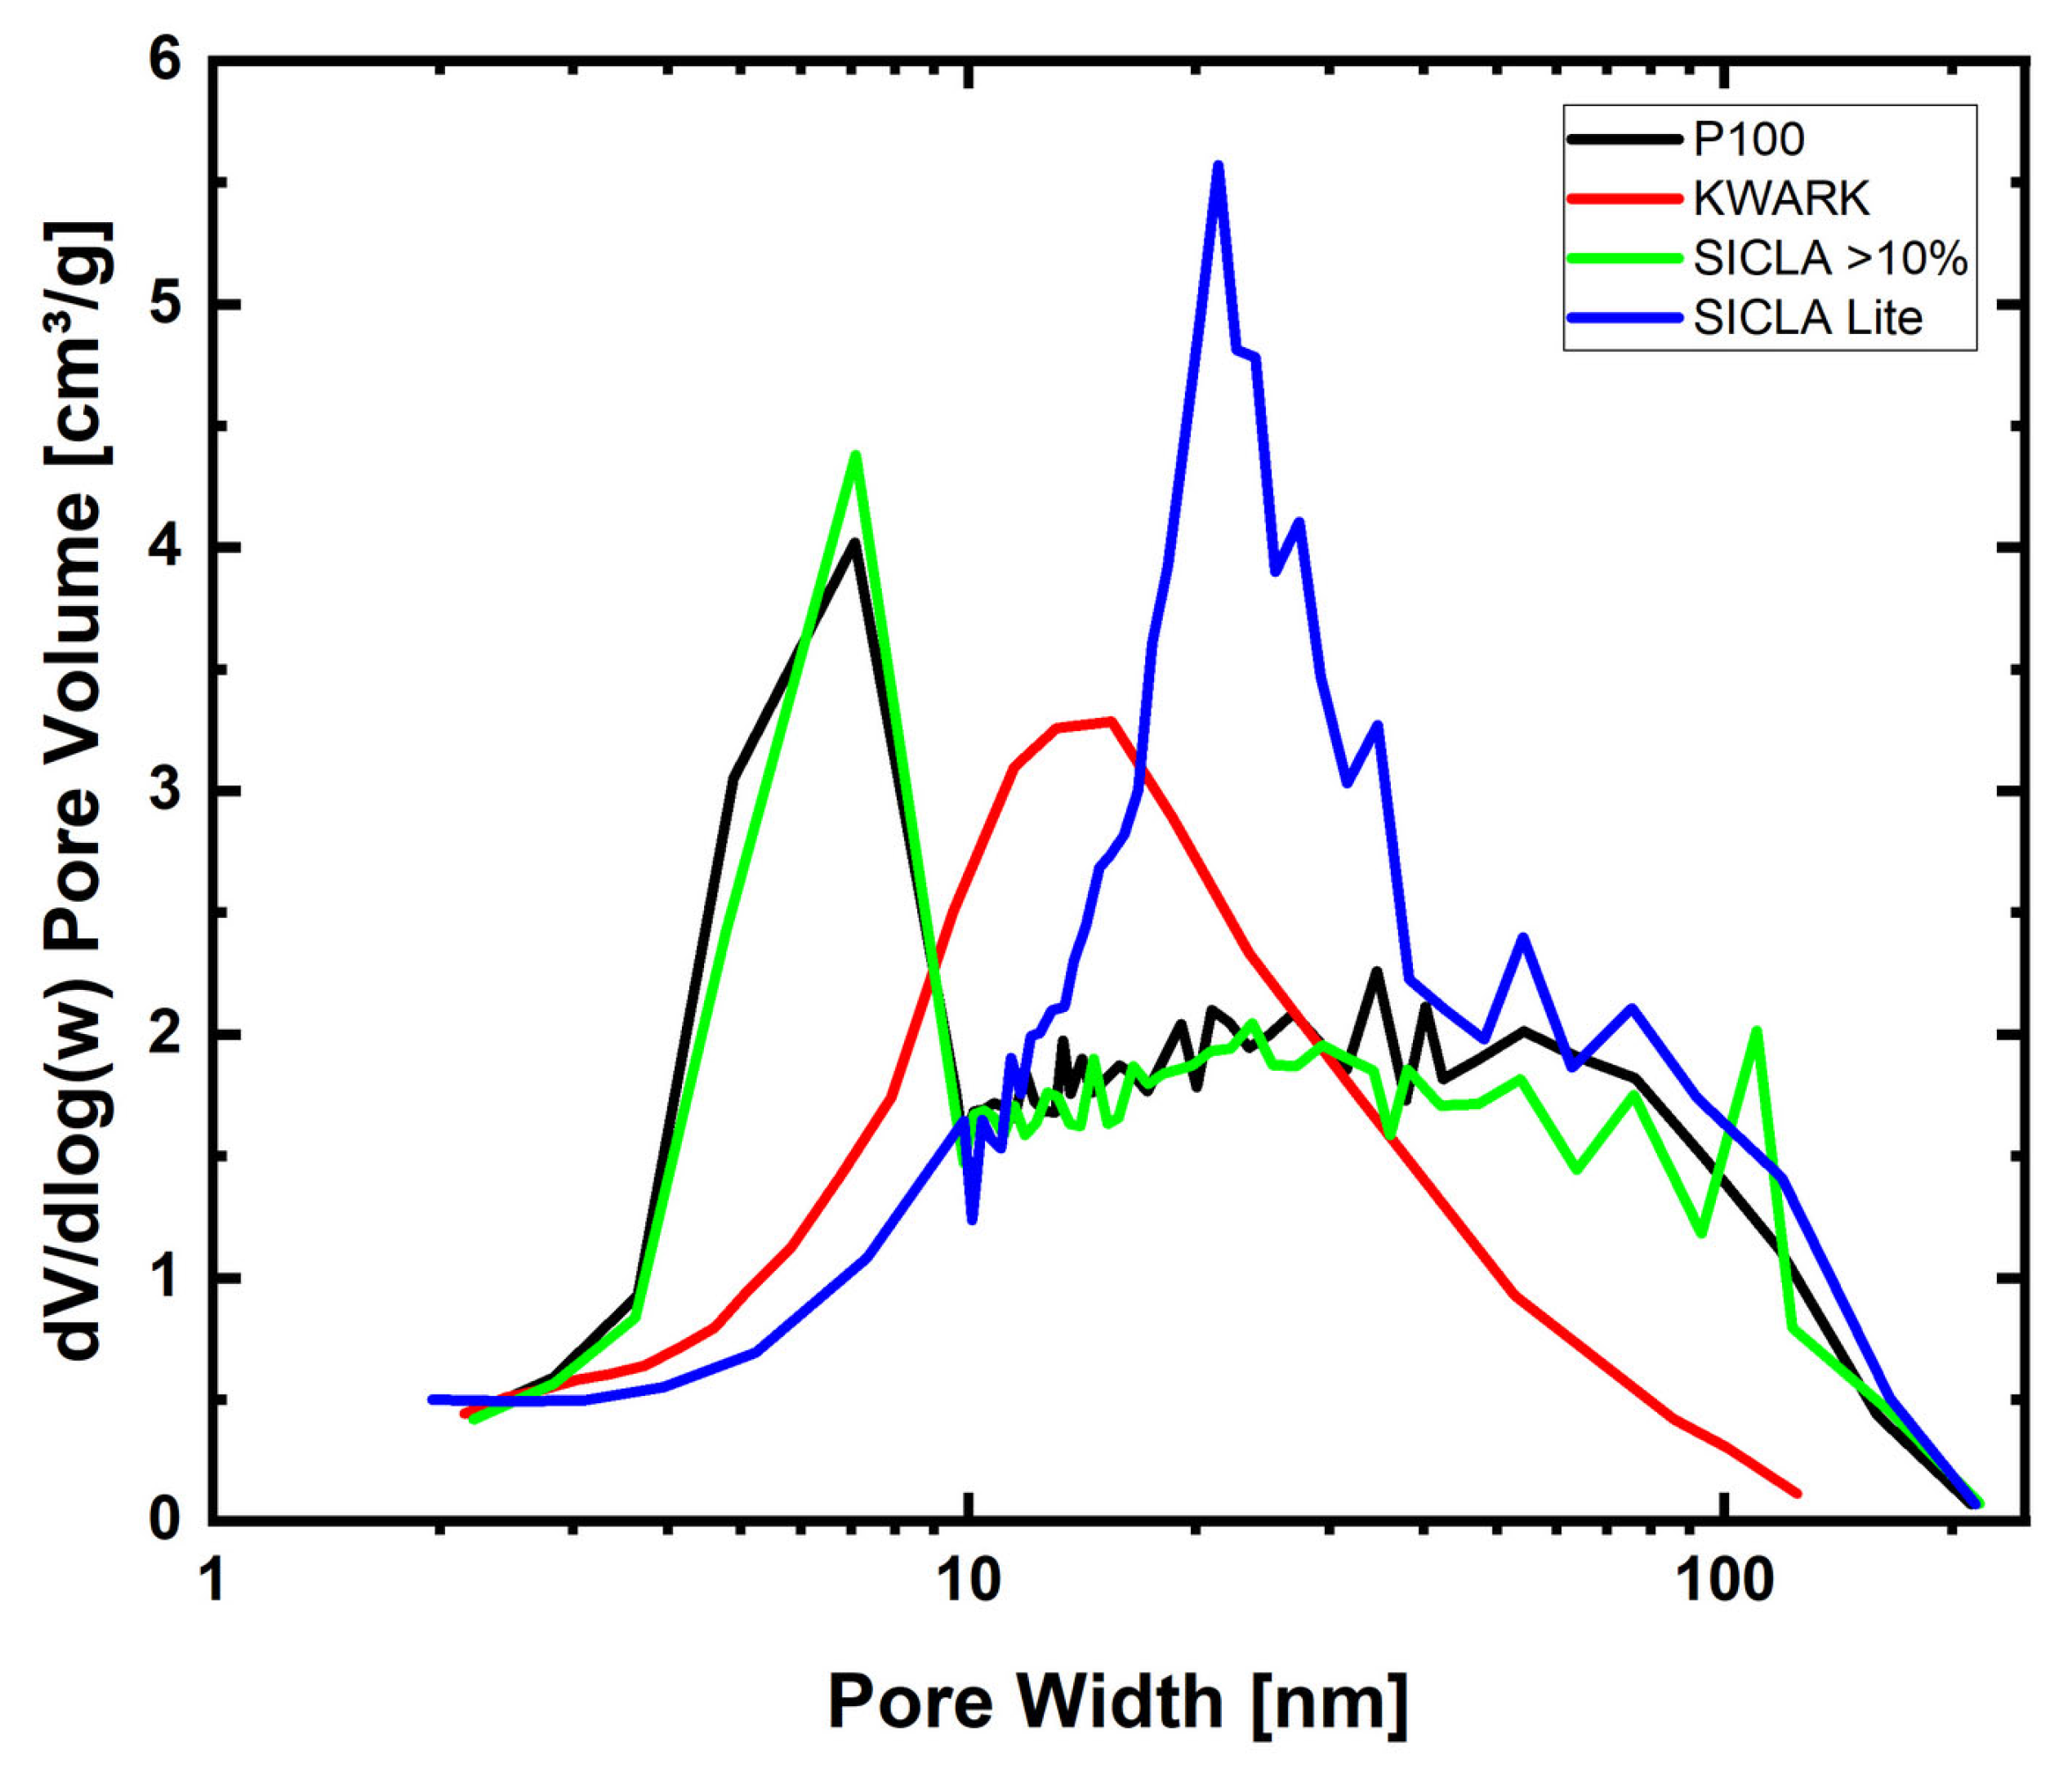
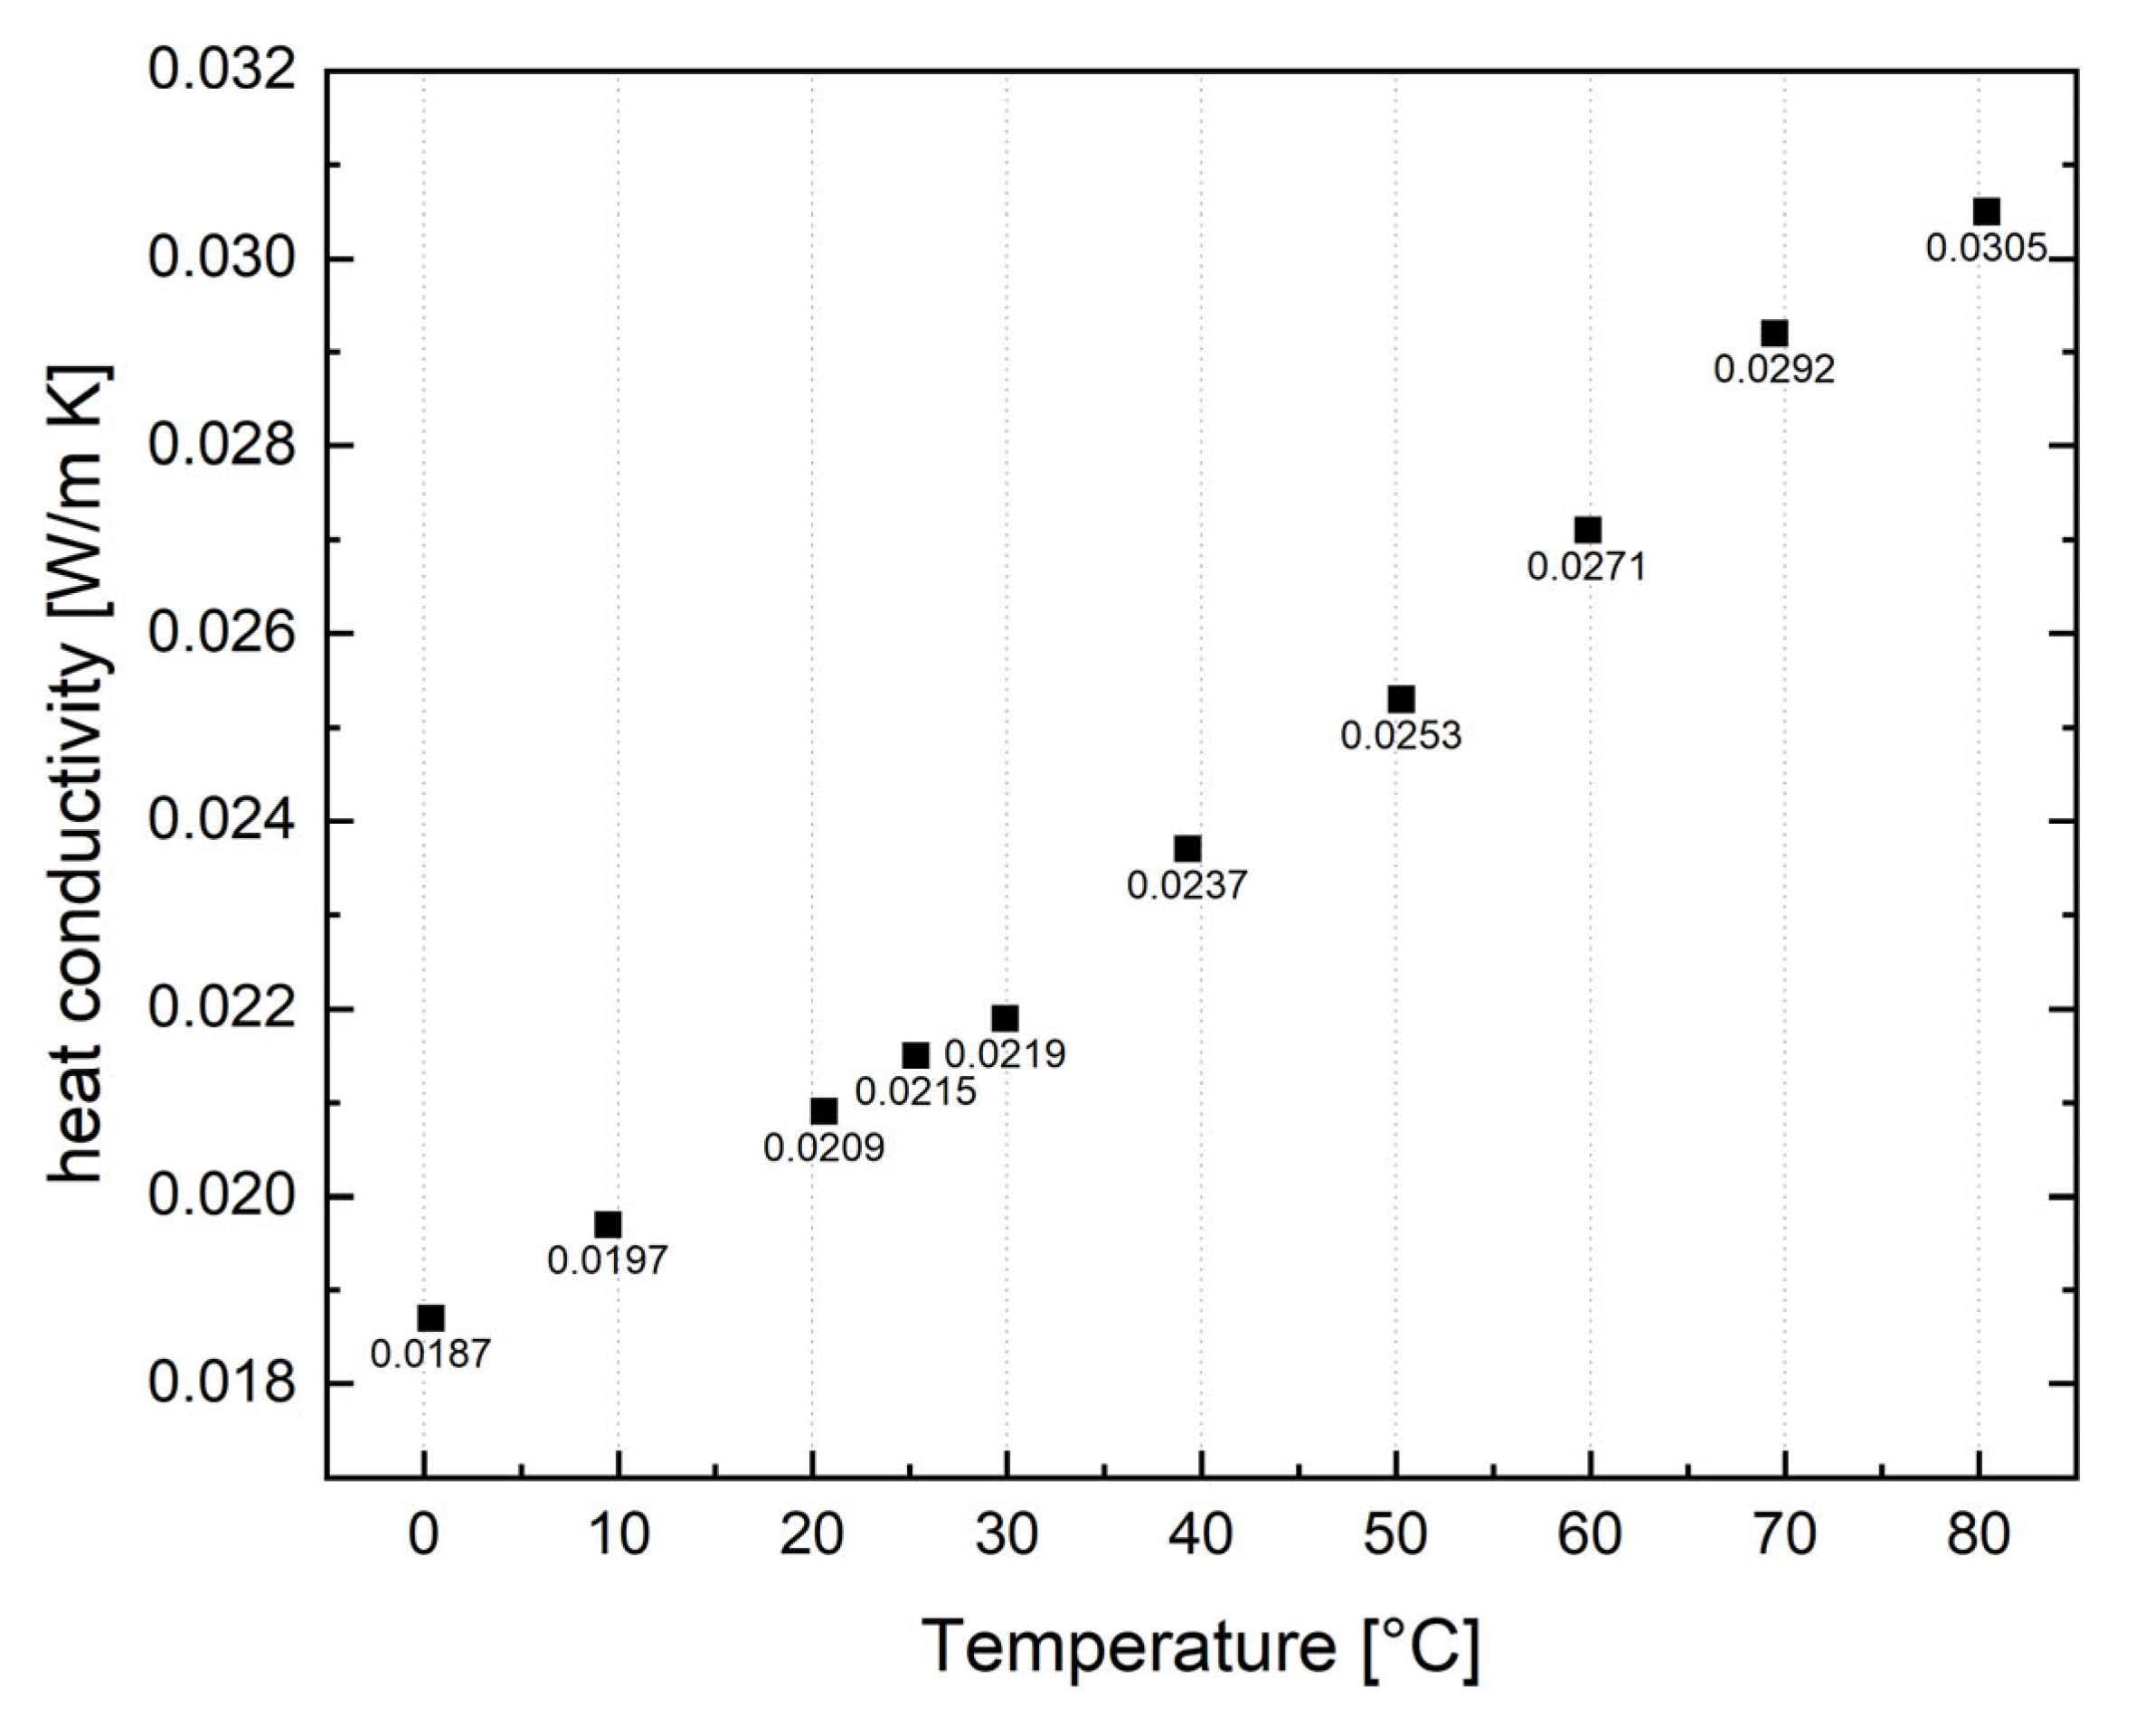
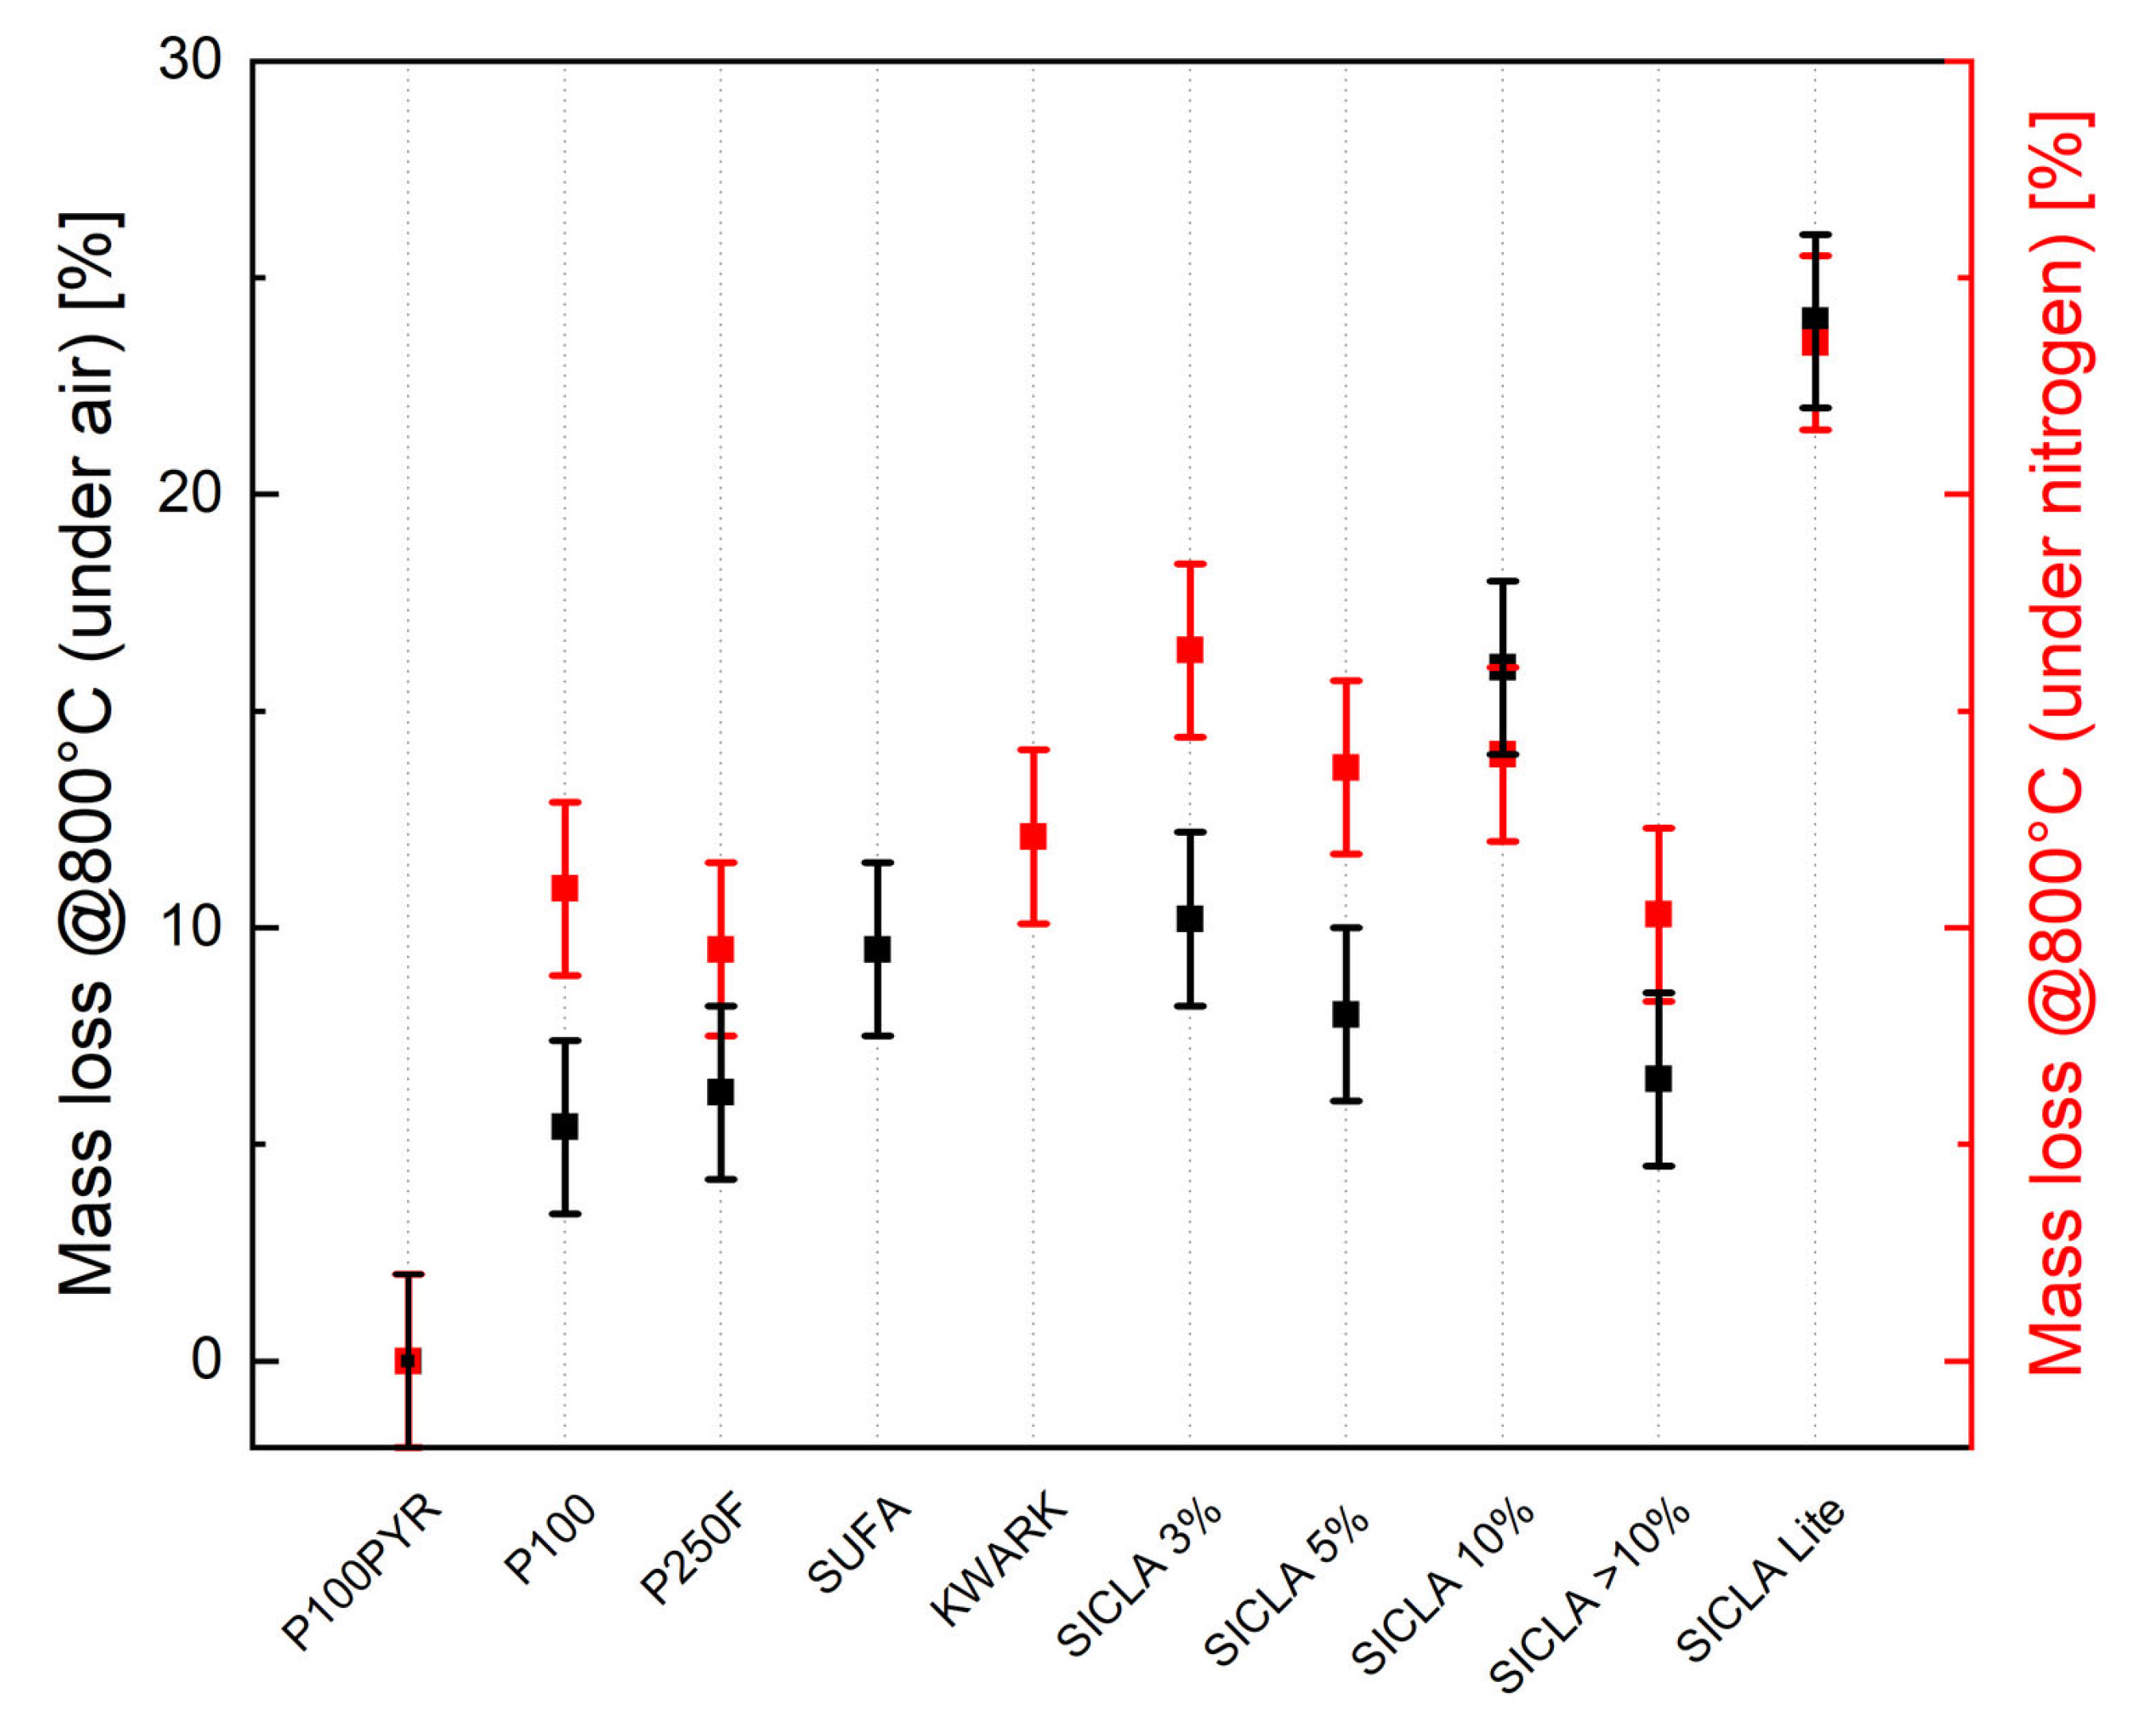
3.1. Properties of the Aerogels
3.2. Properties of Fresh Concrete
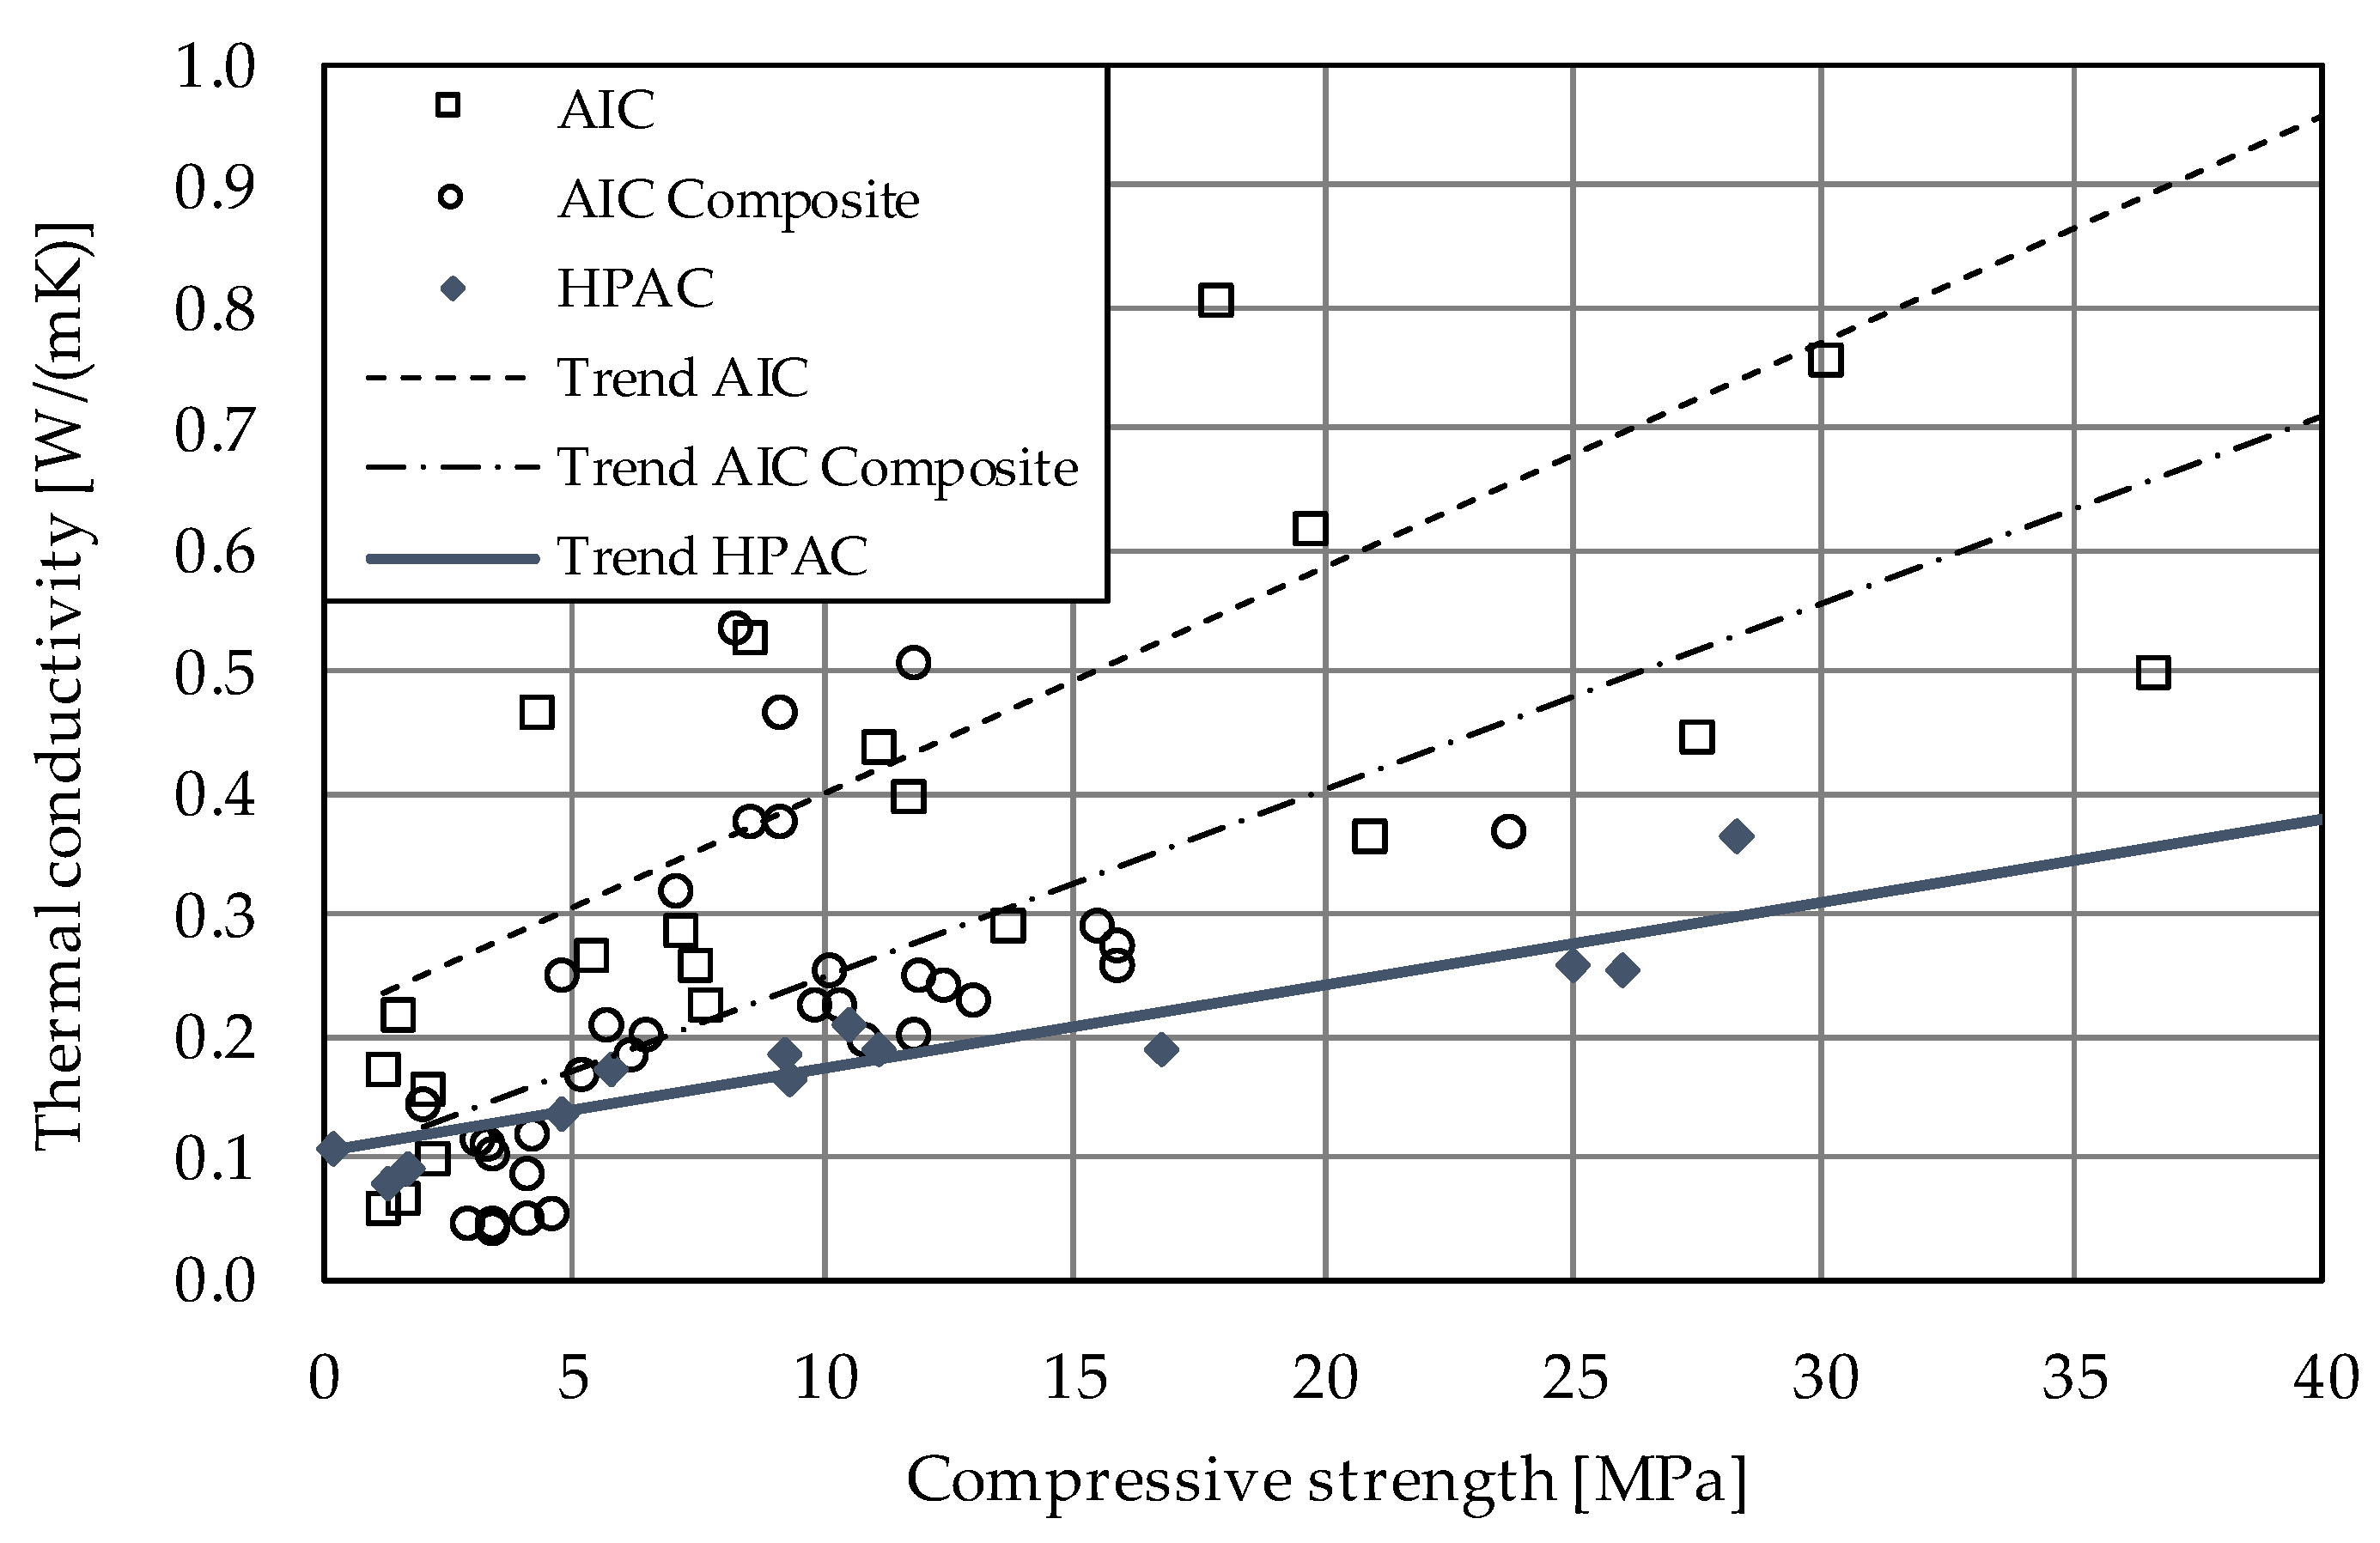
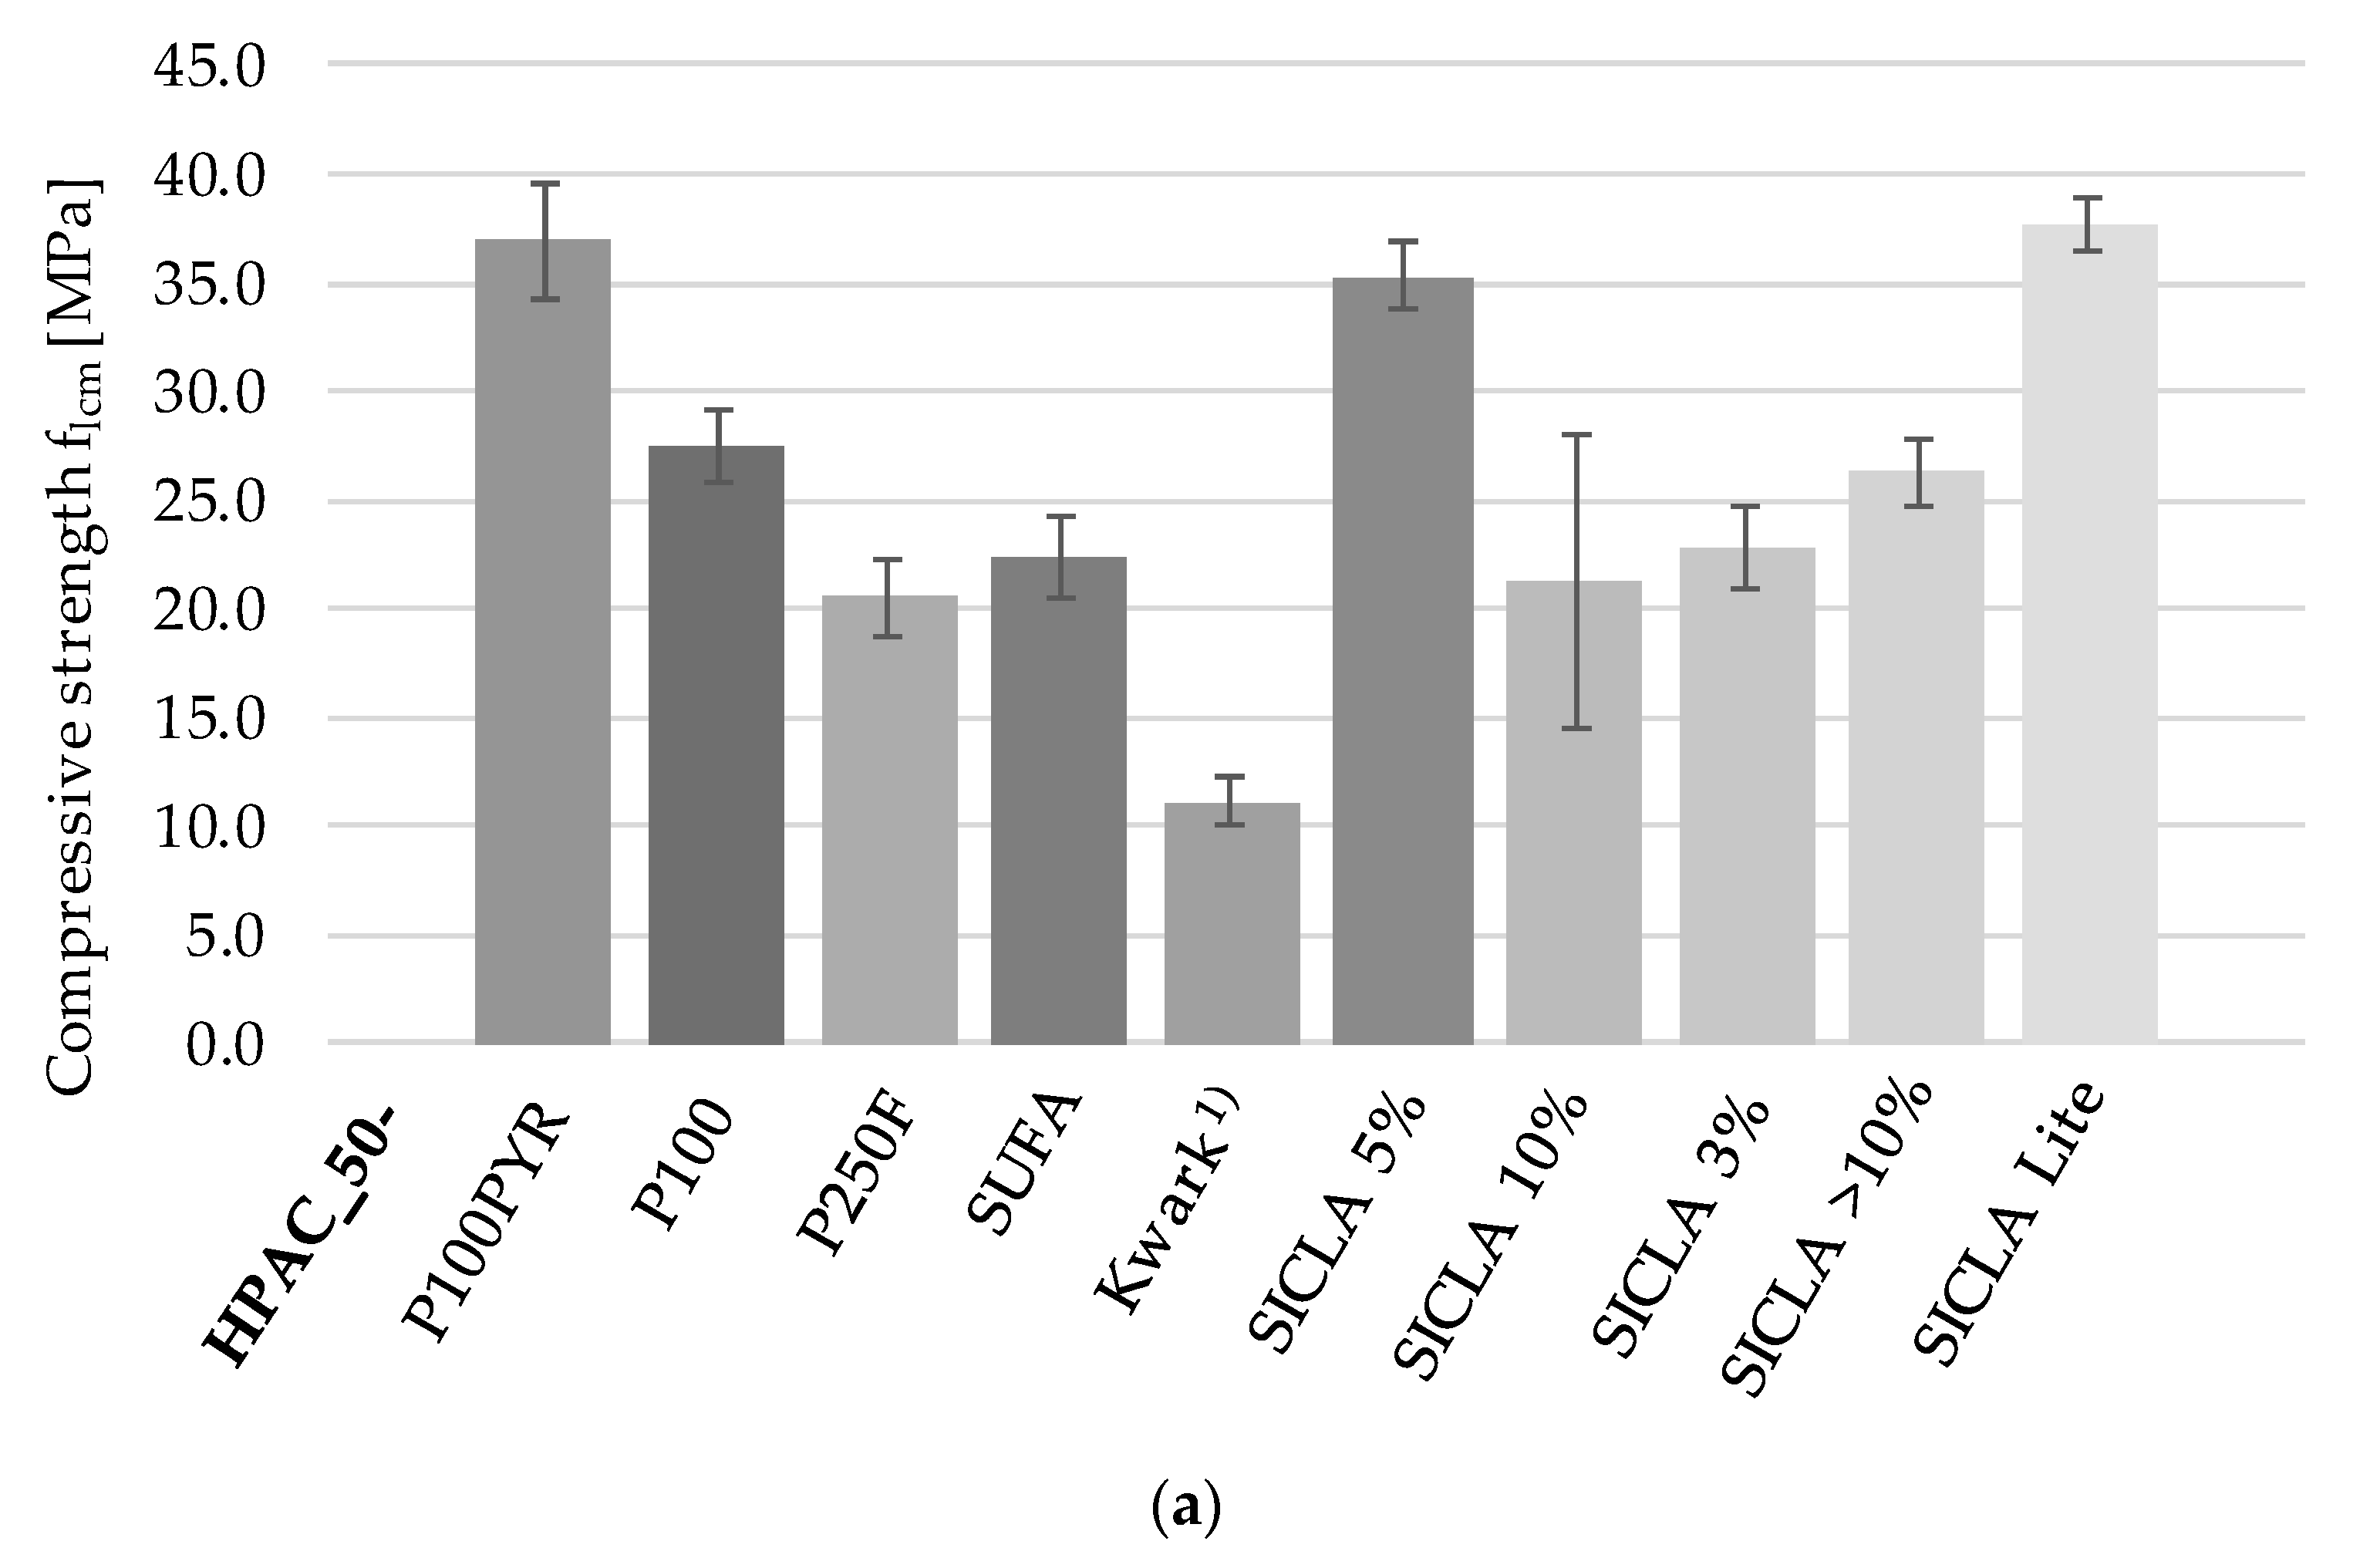
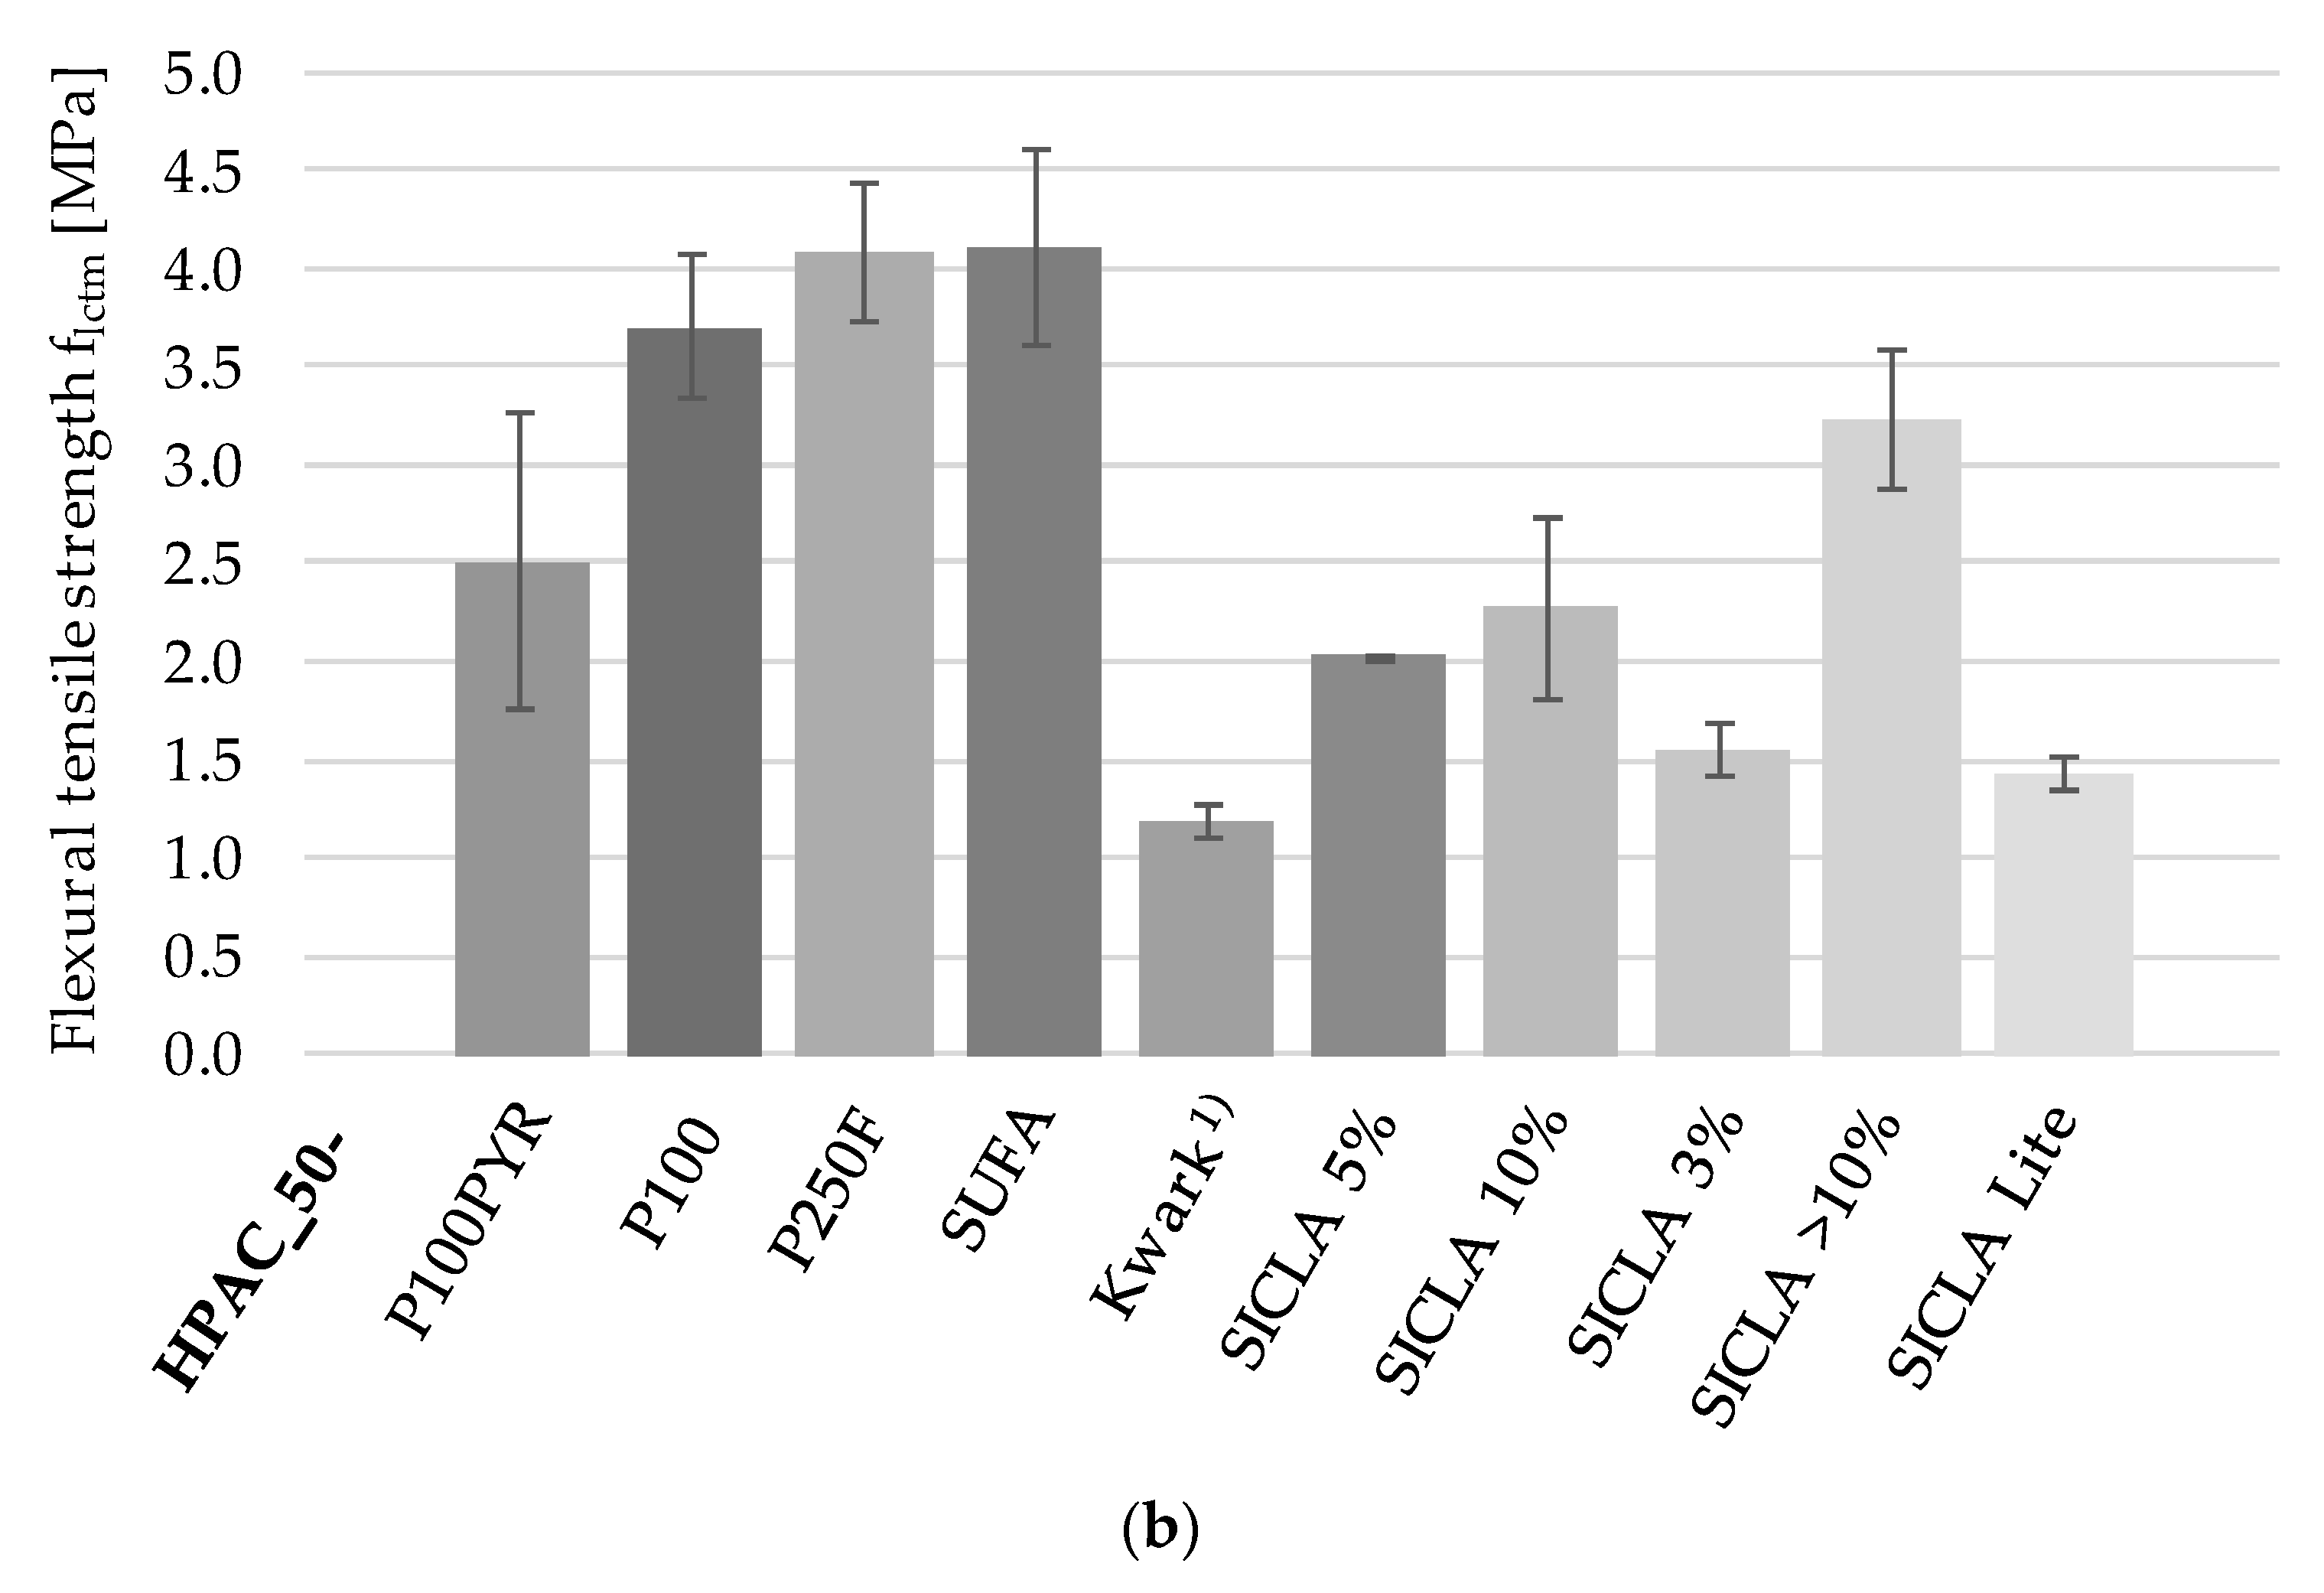
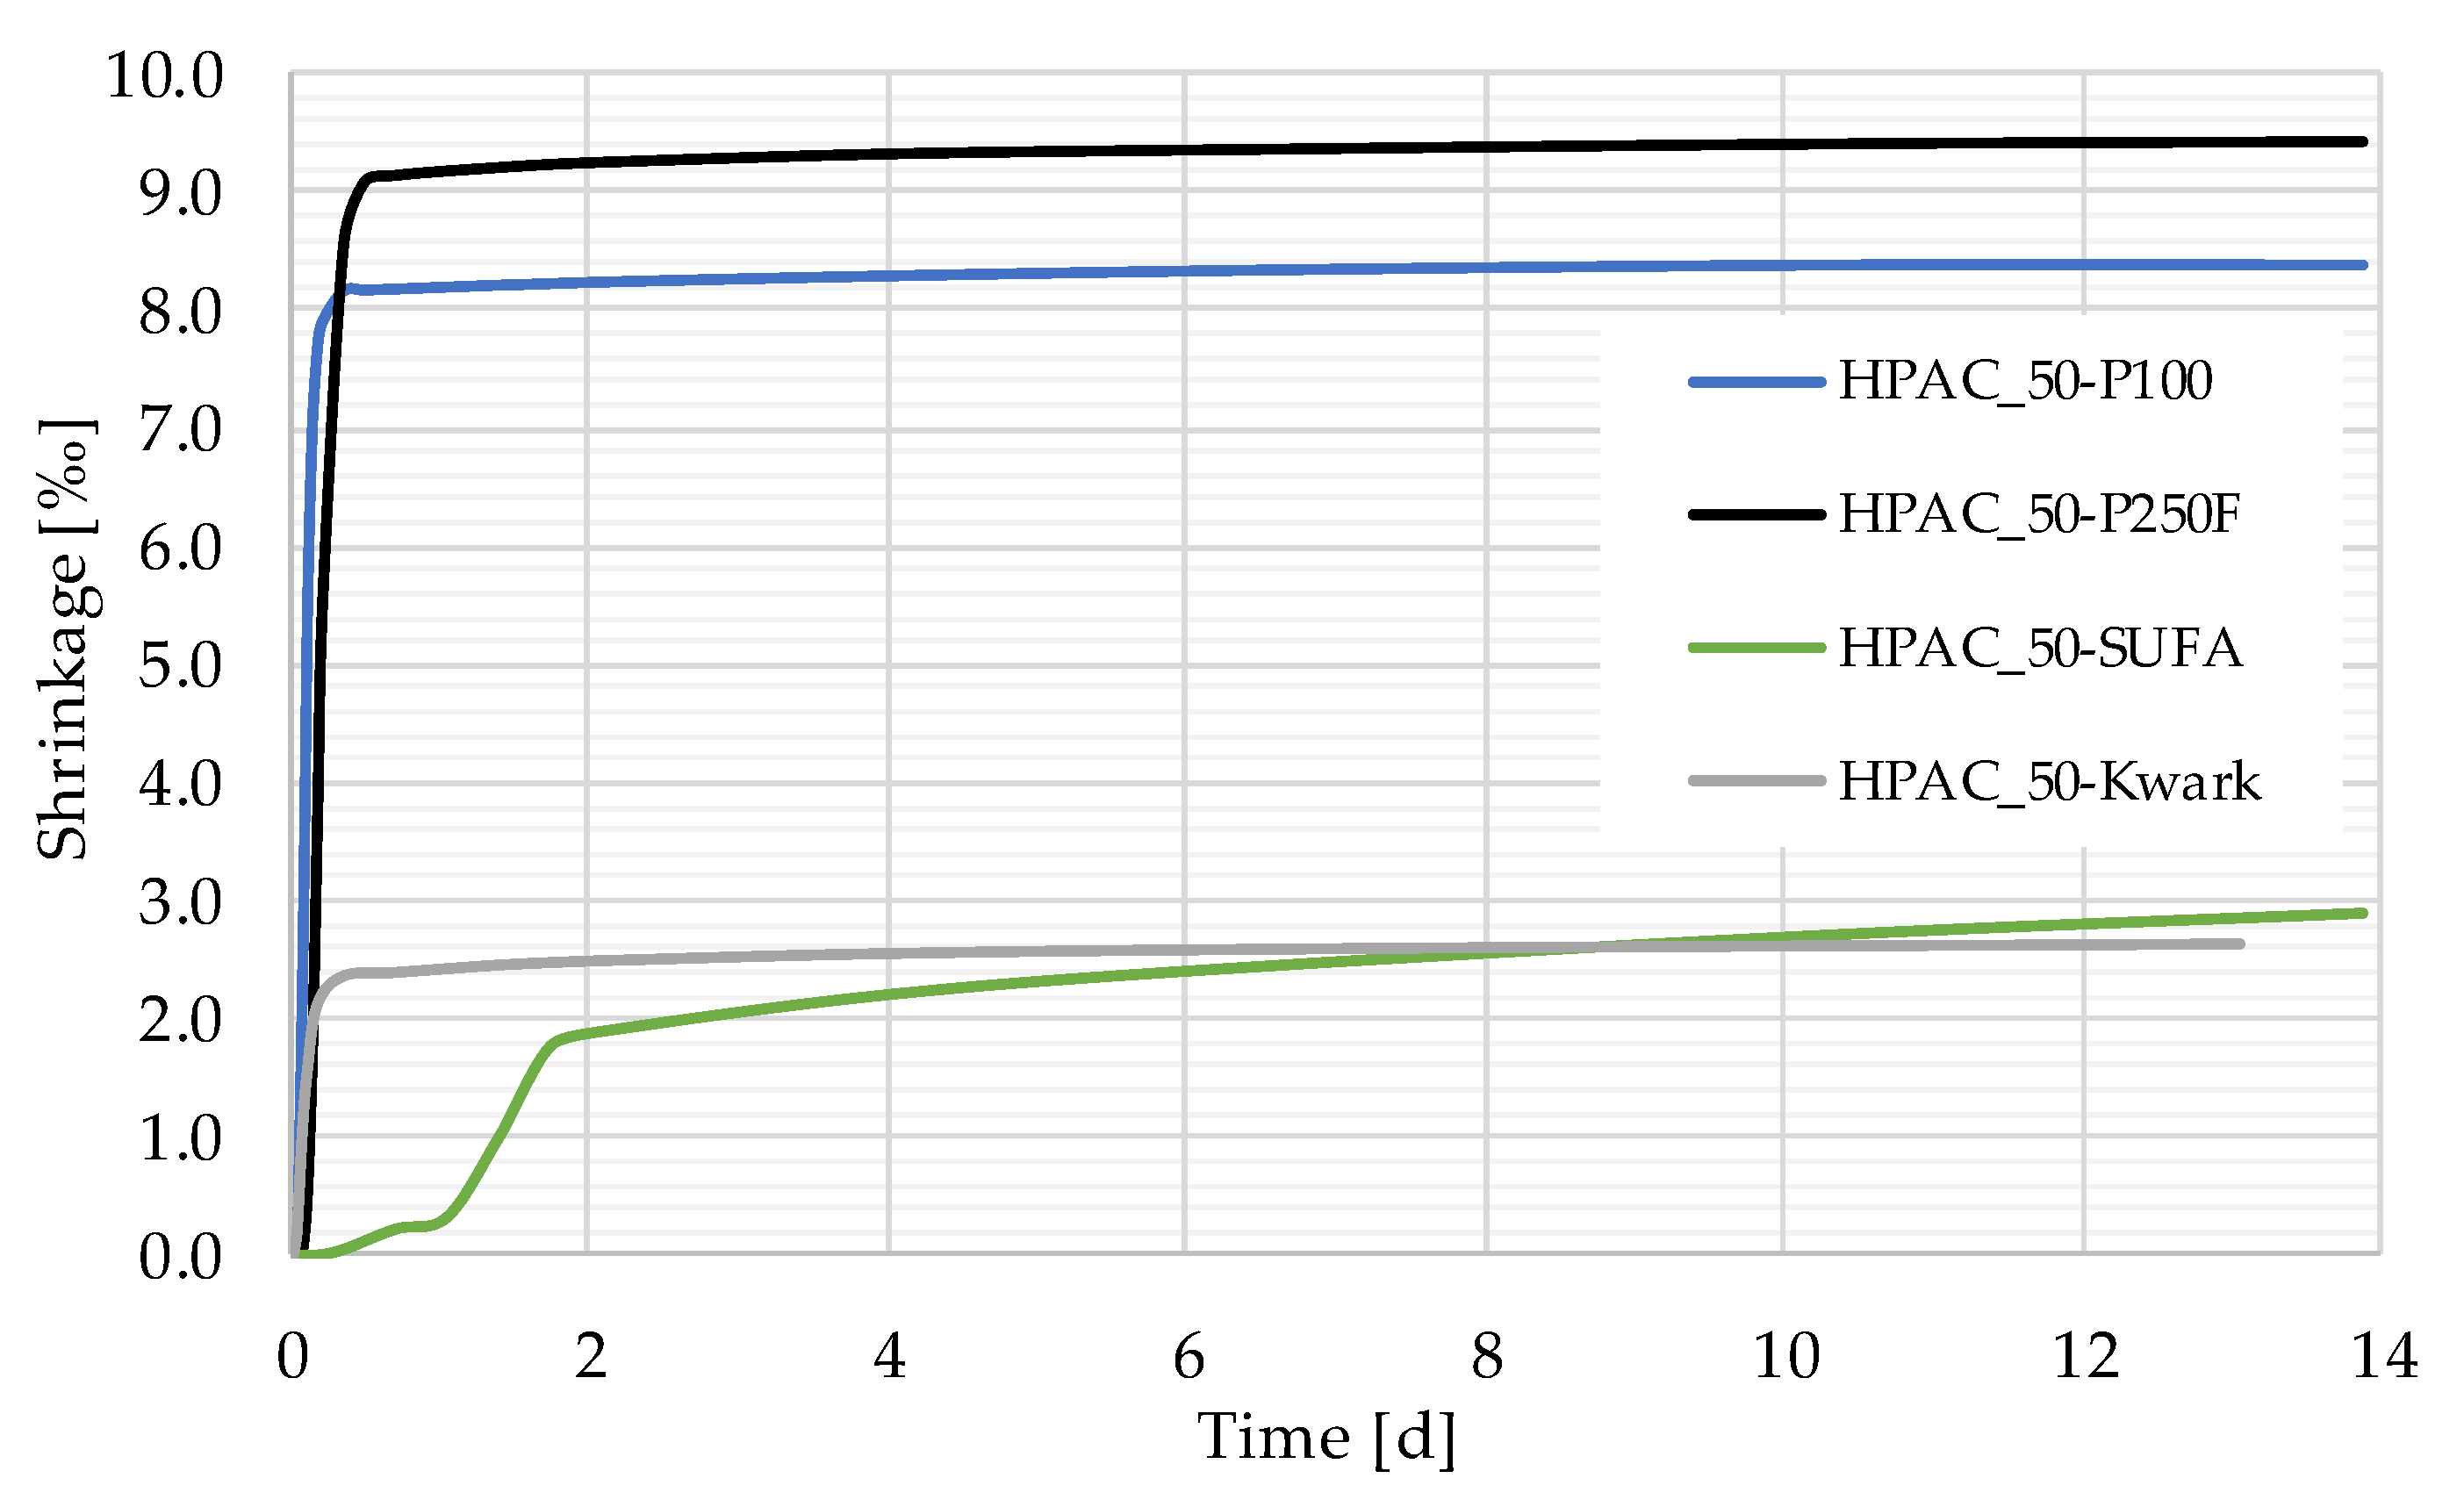
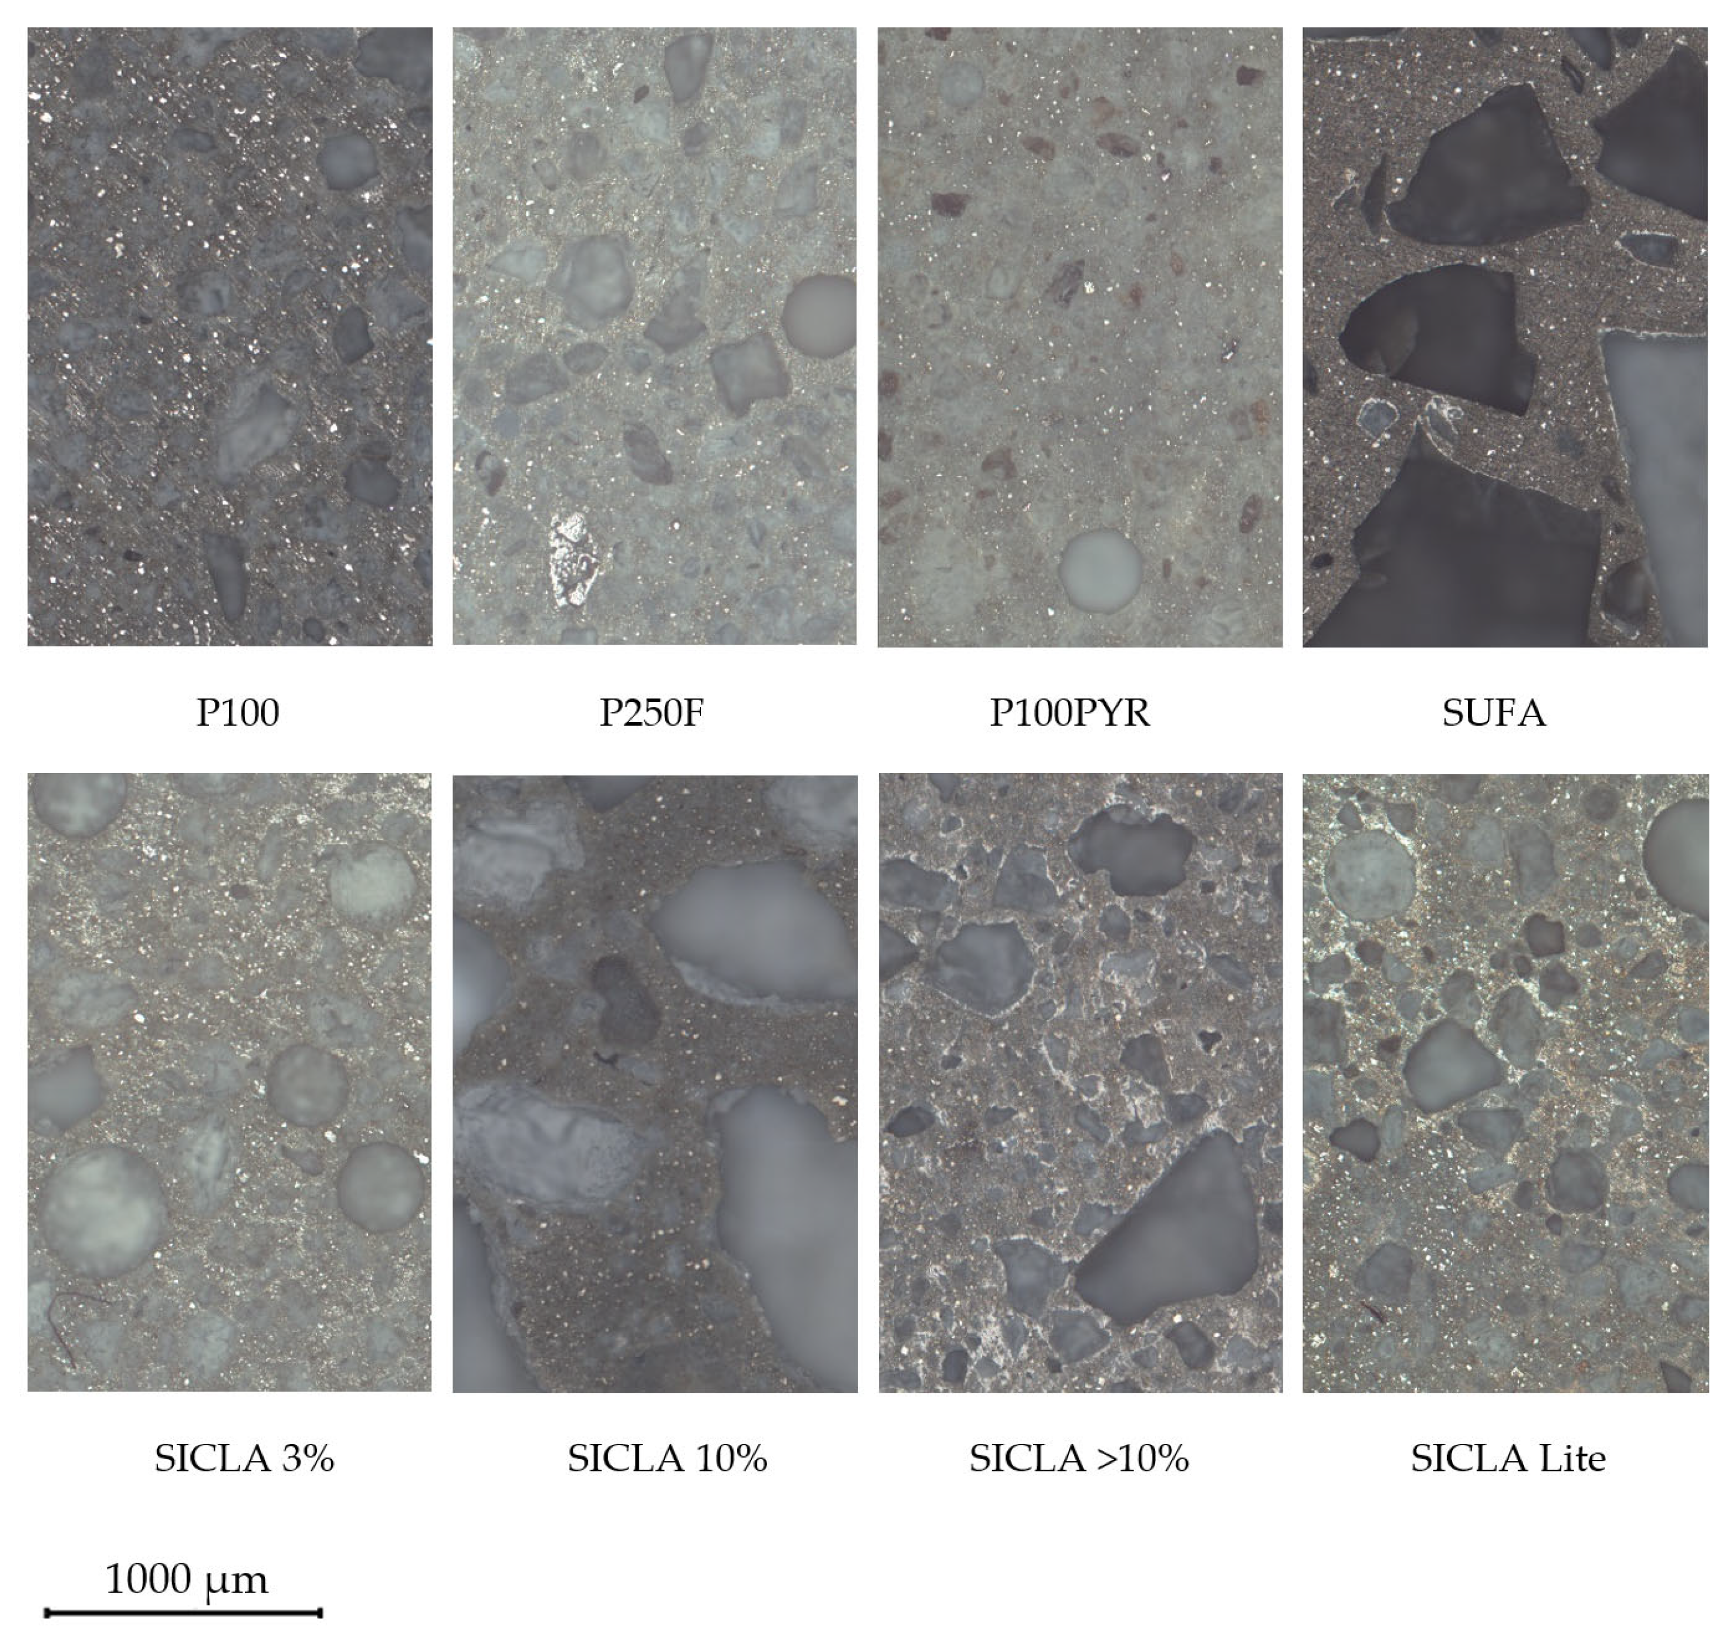
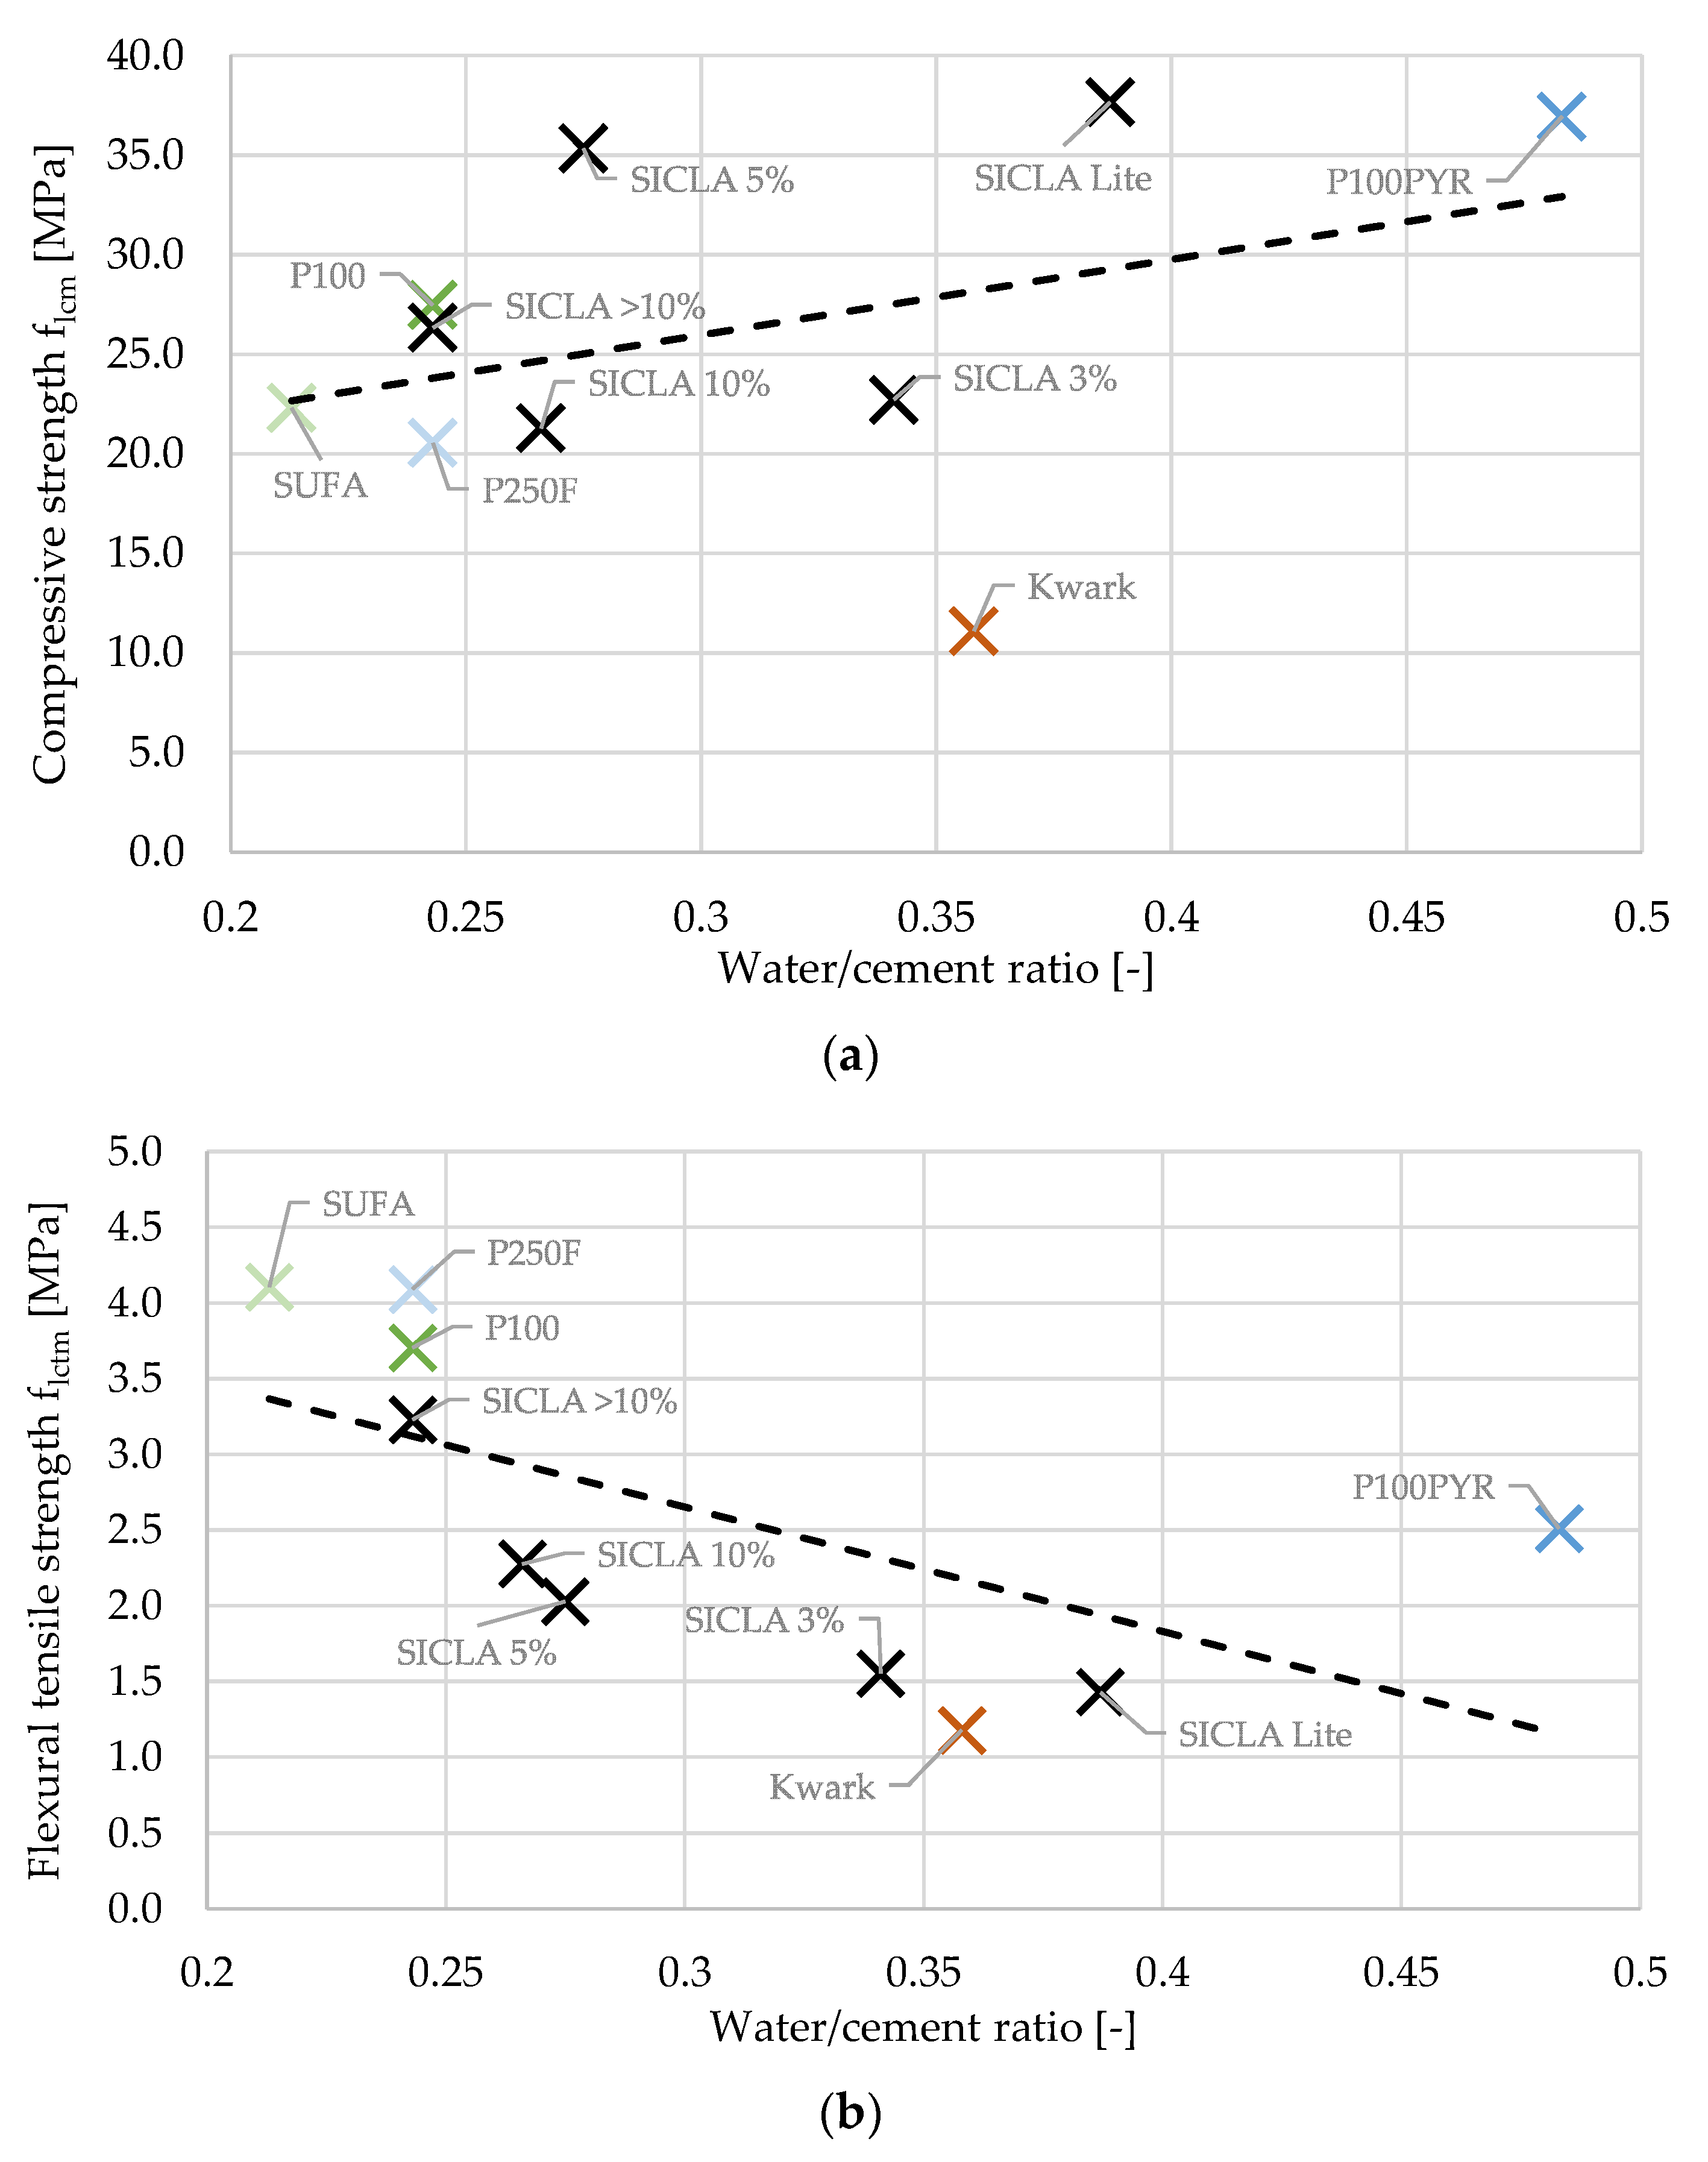
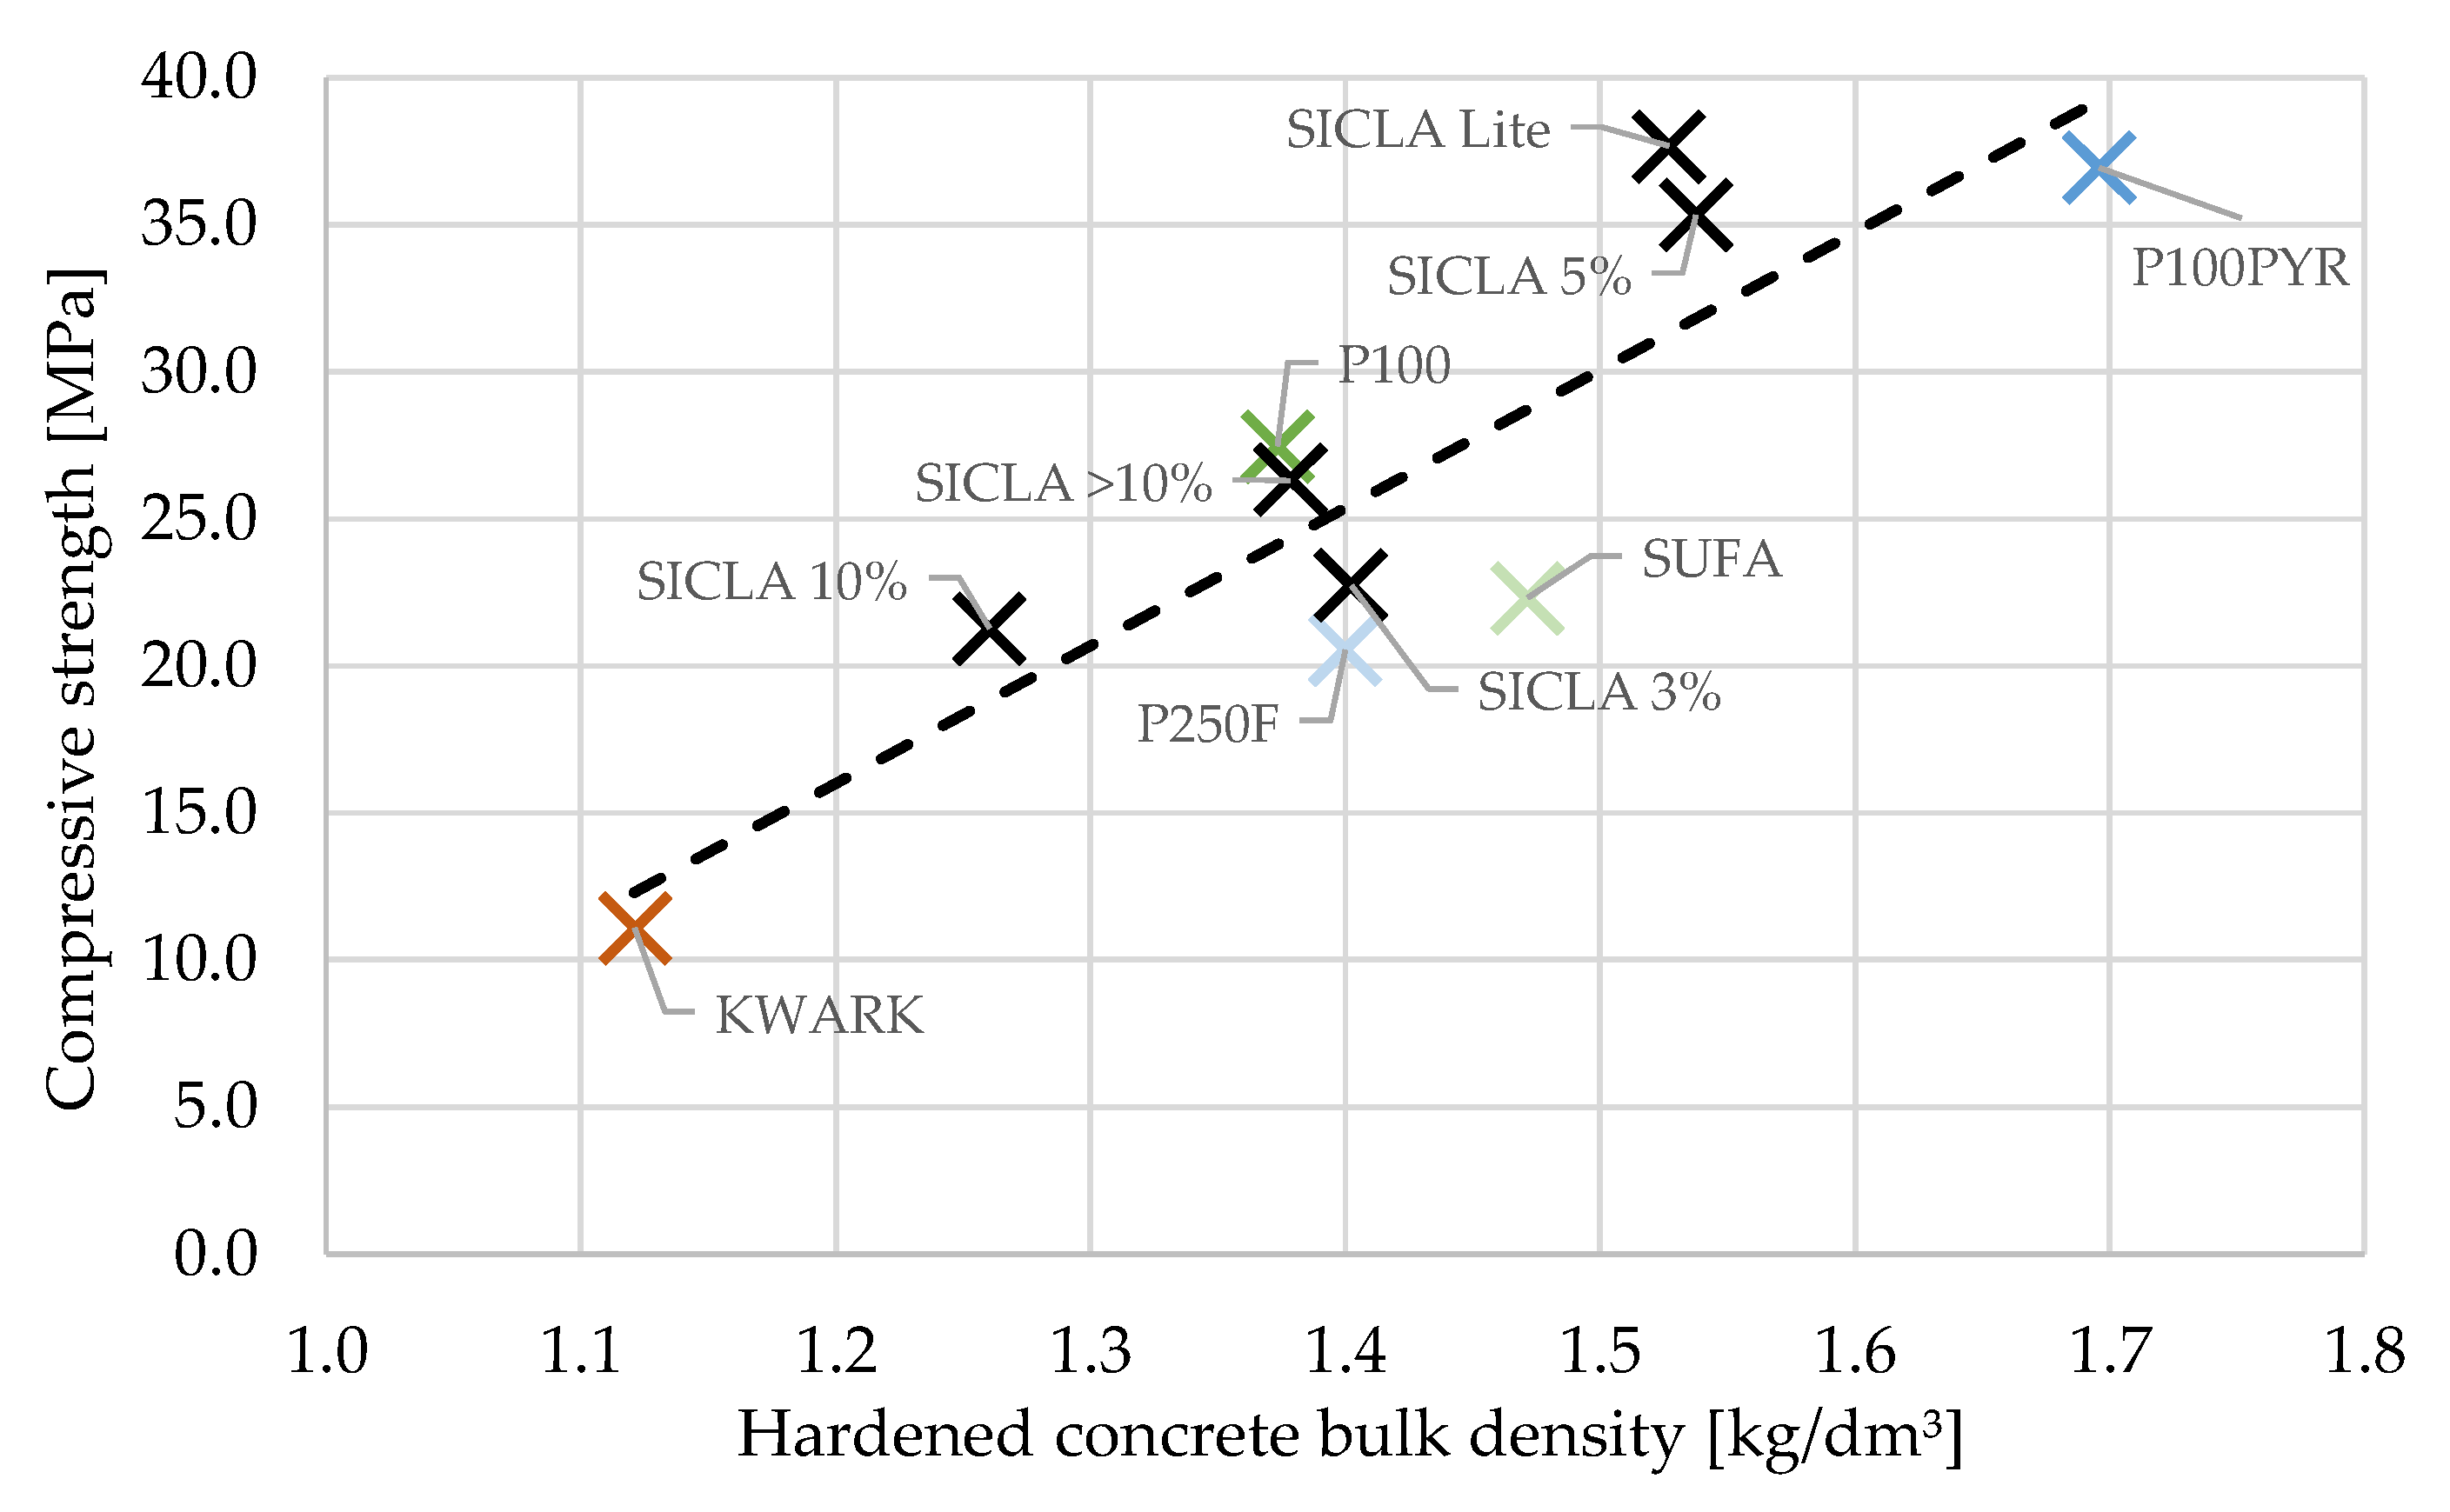
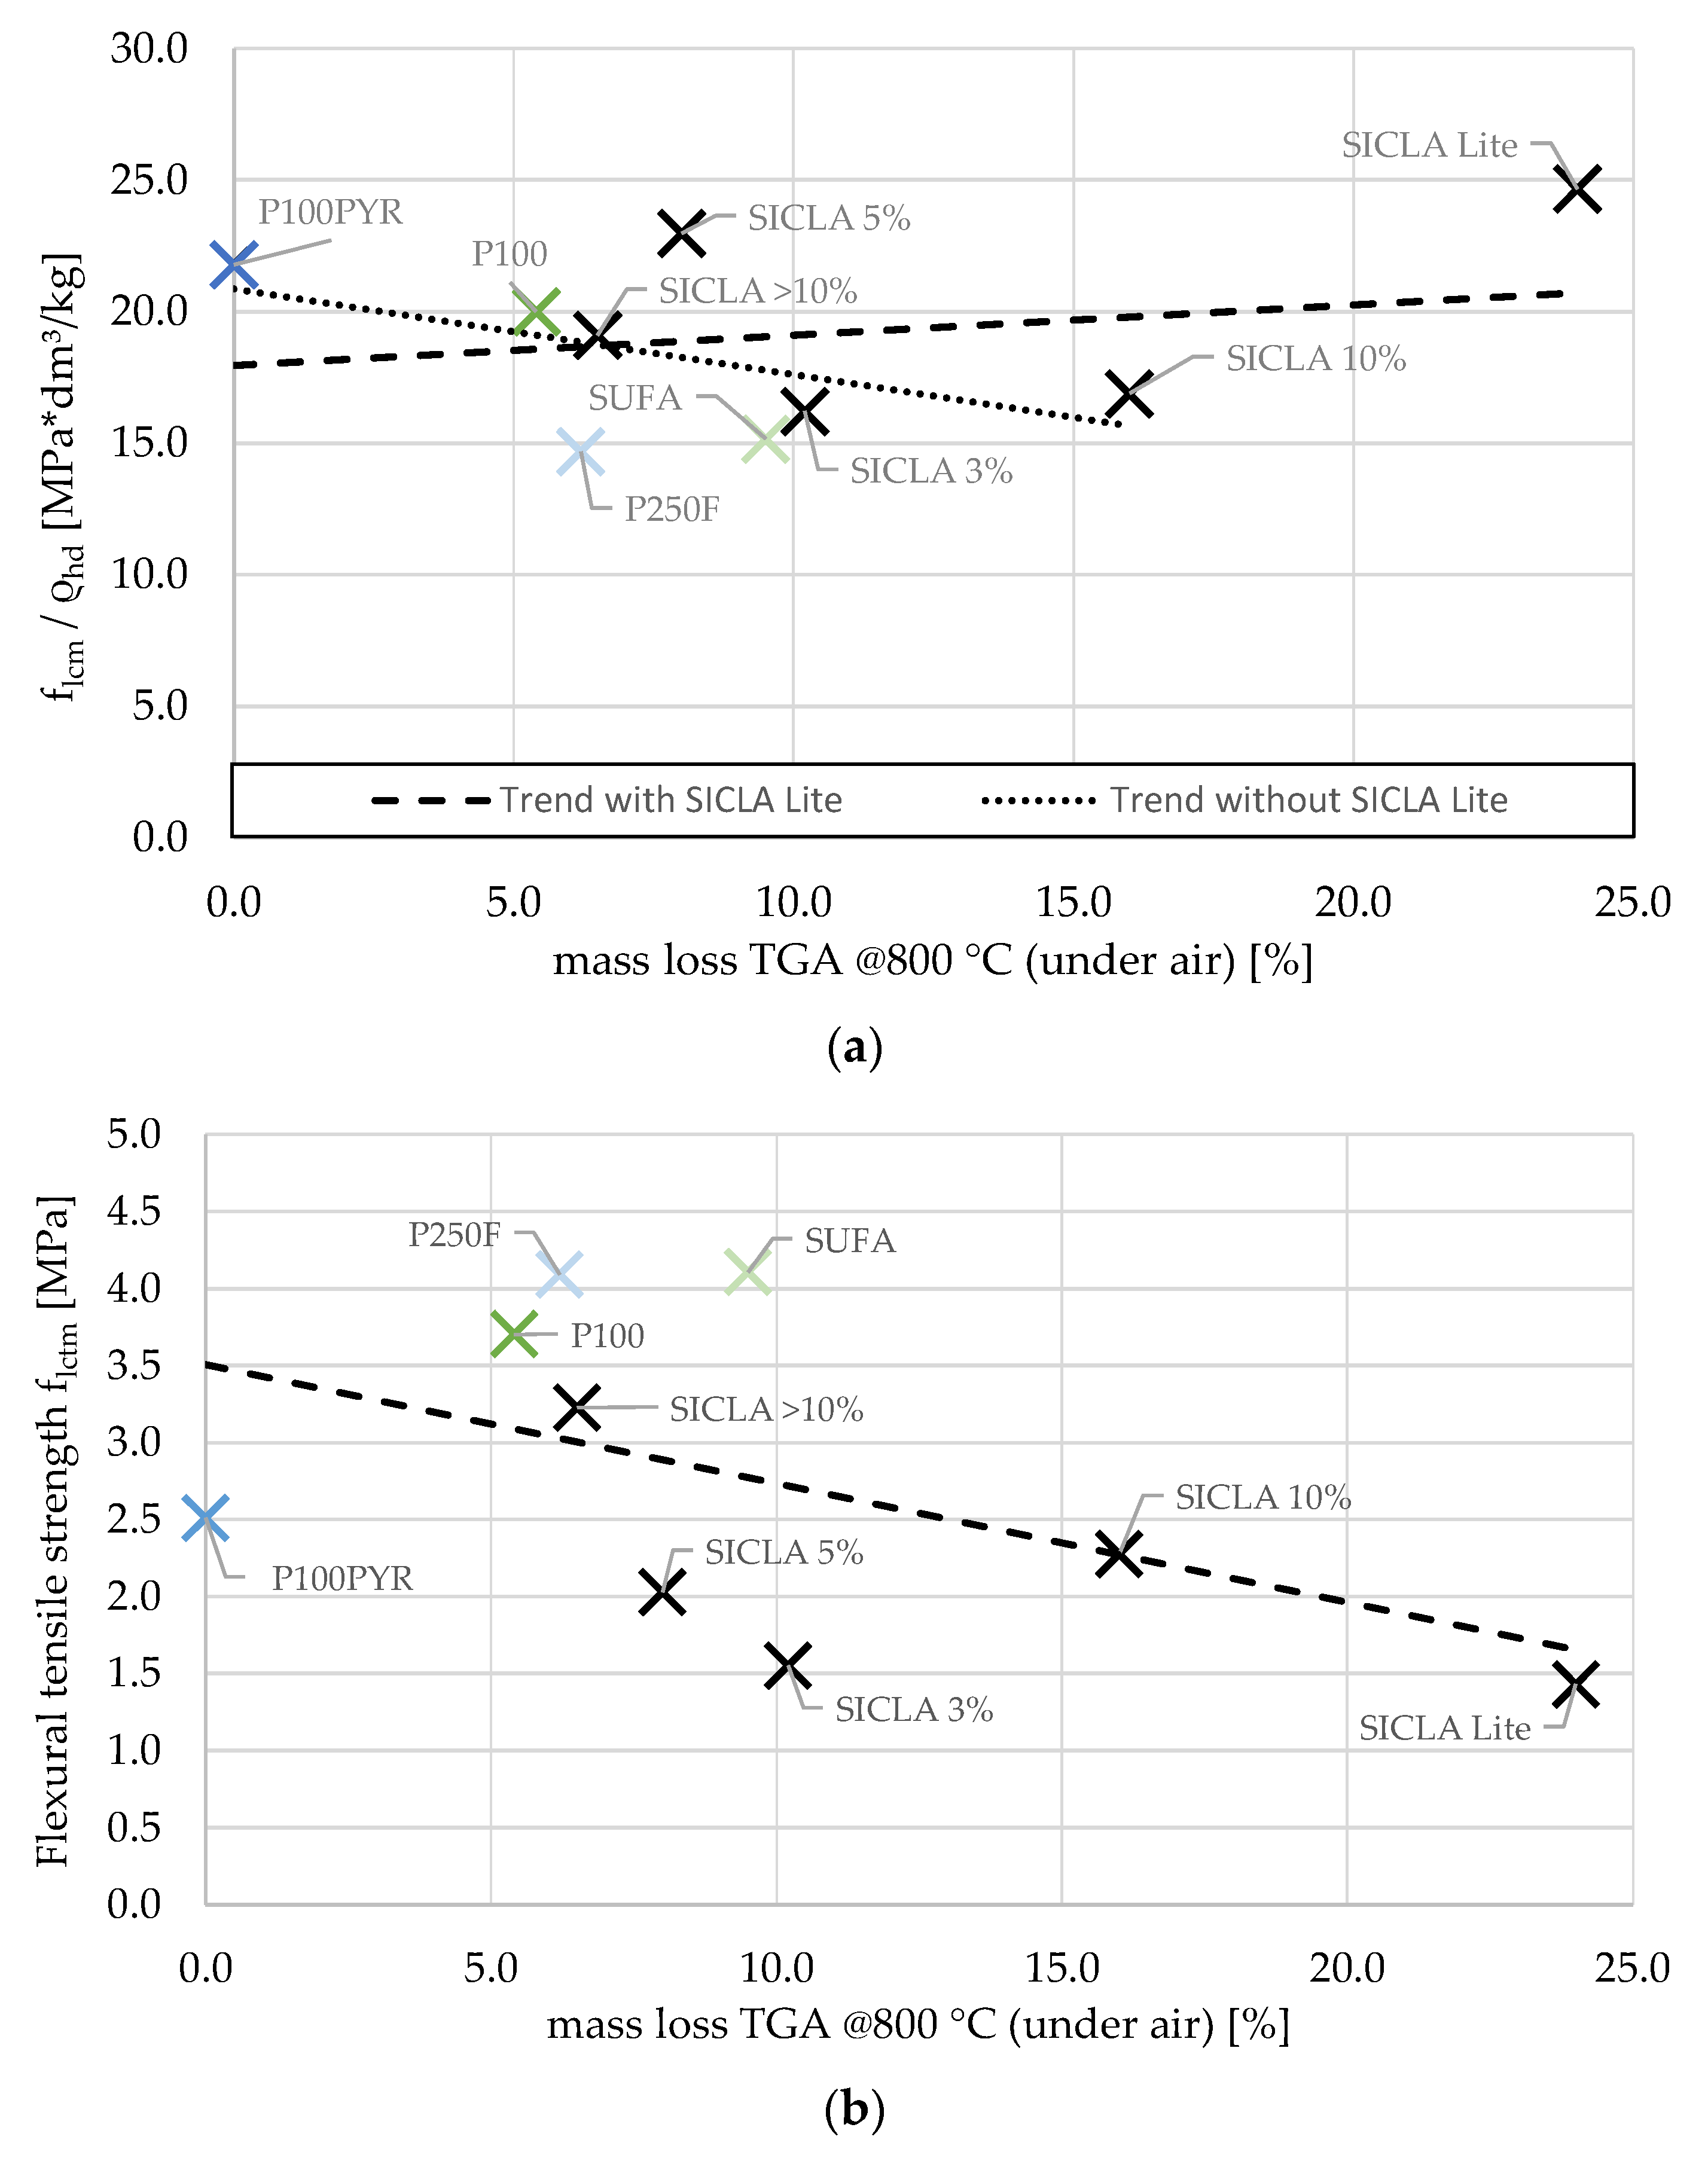
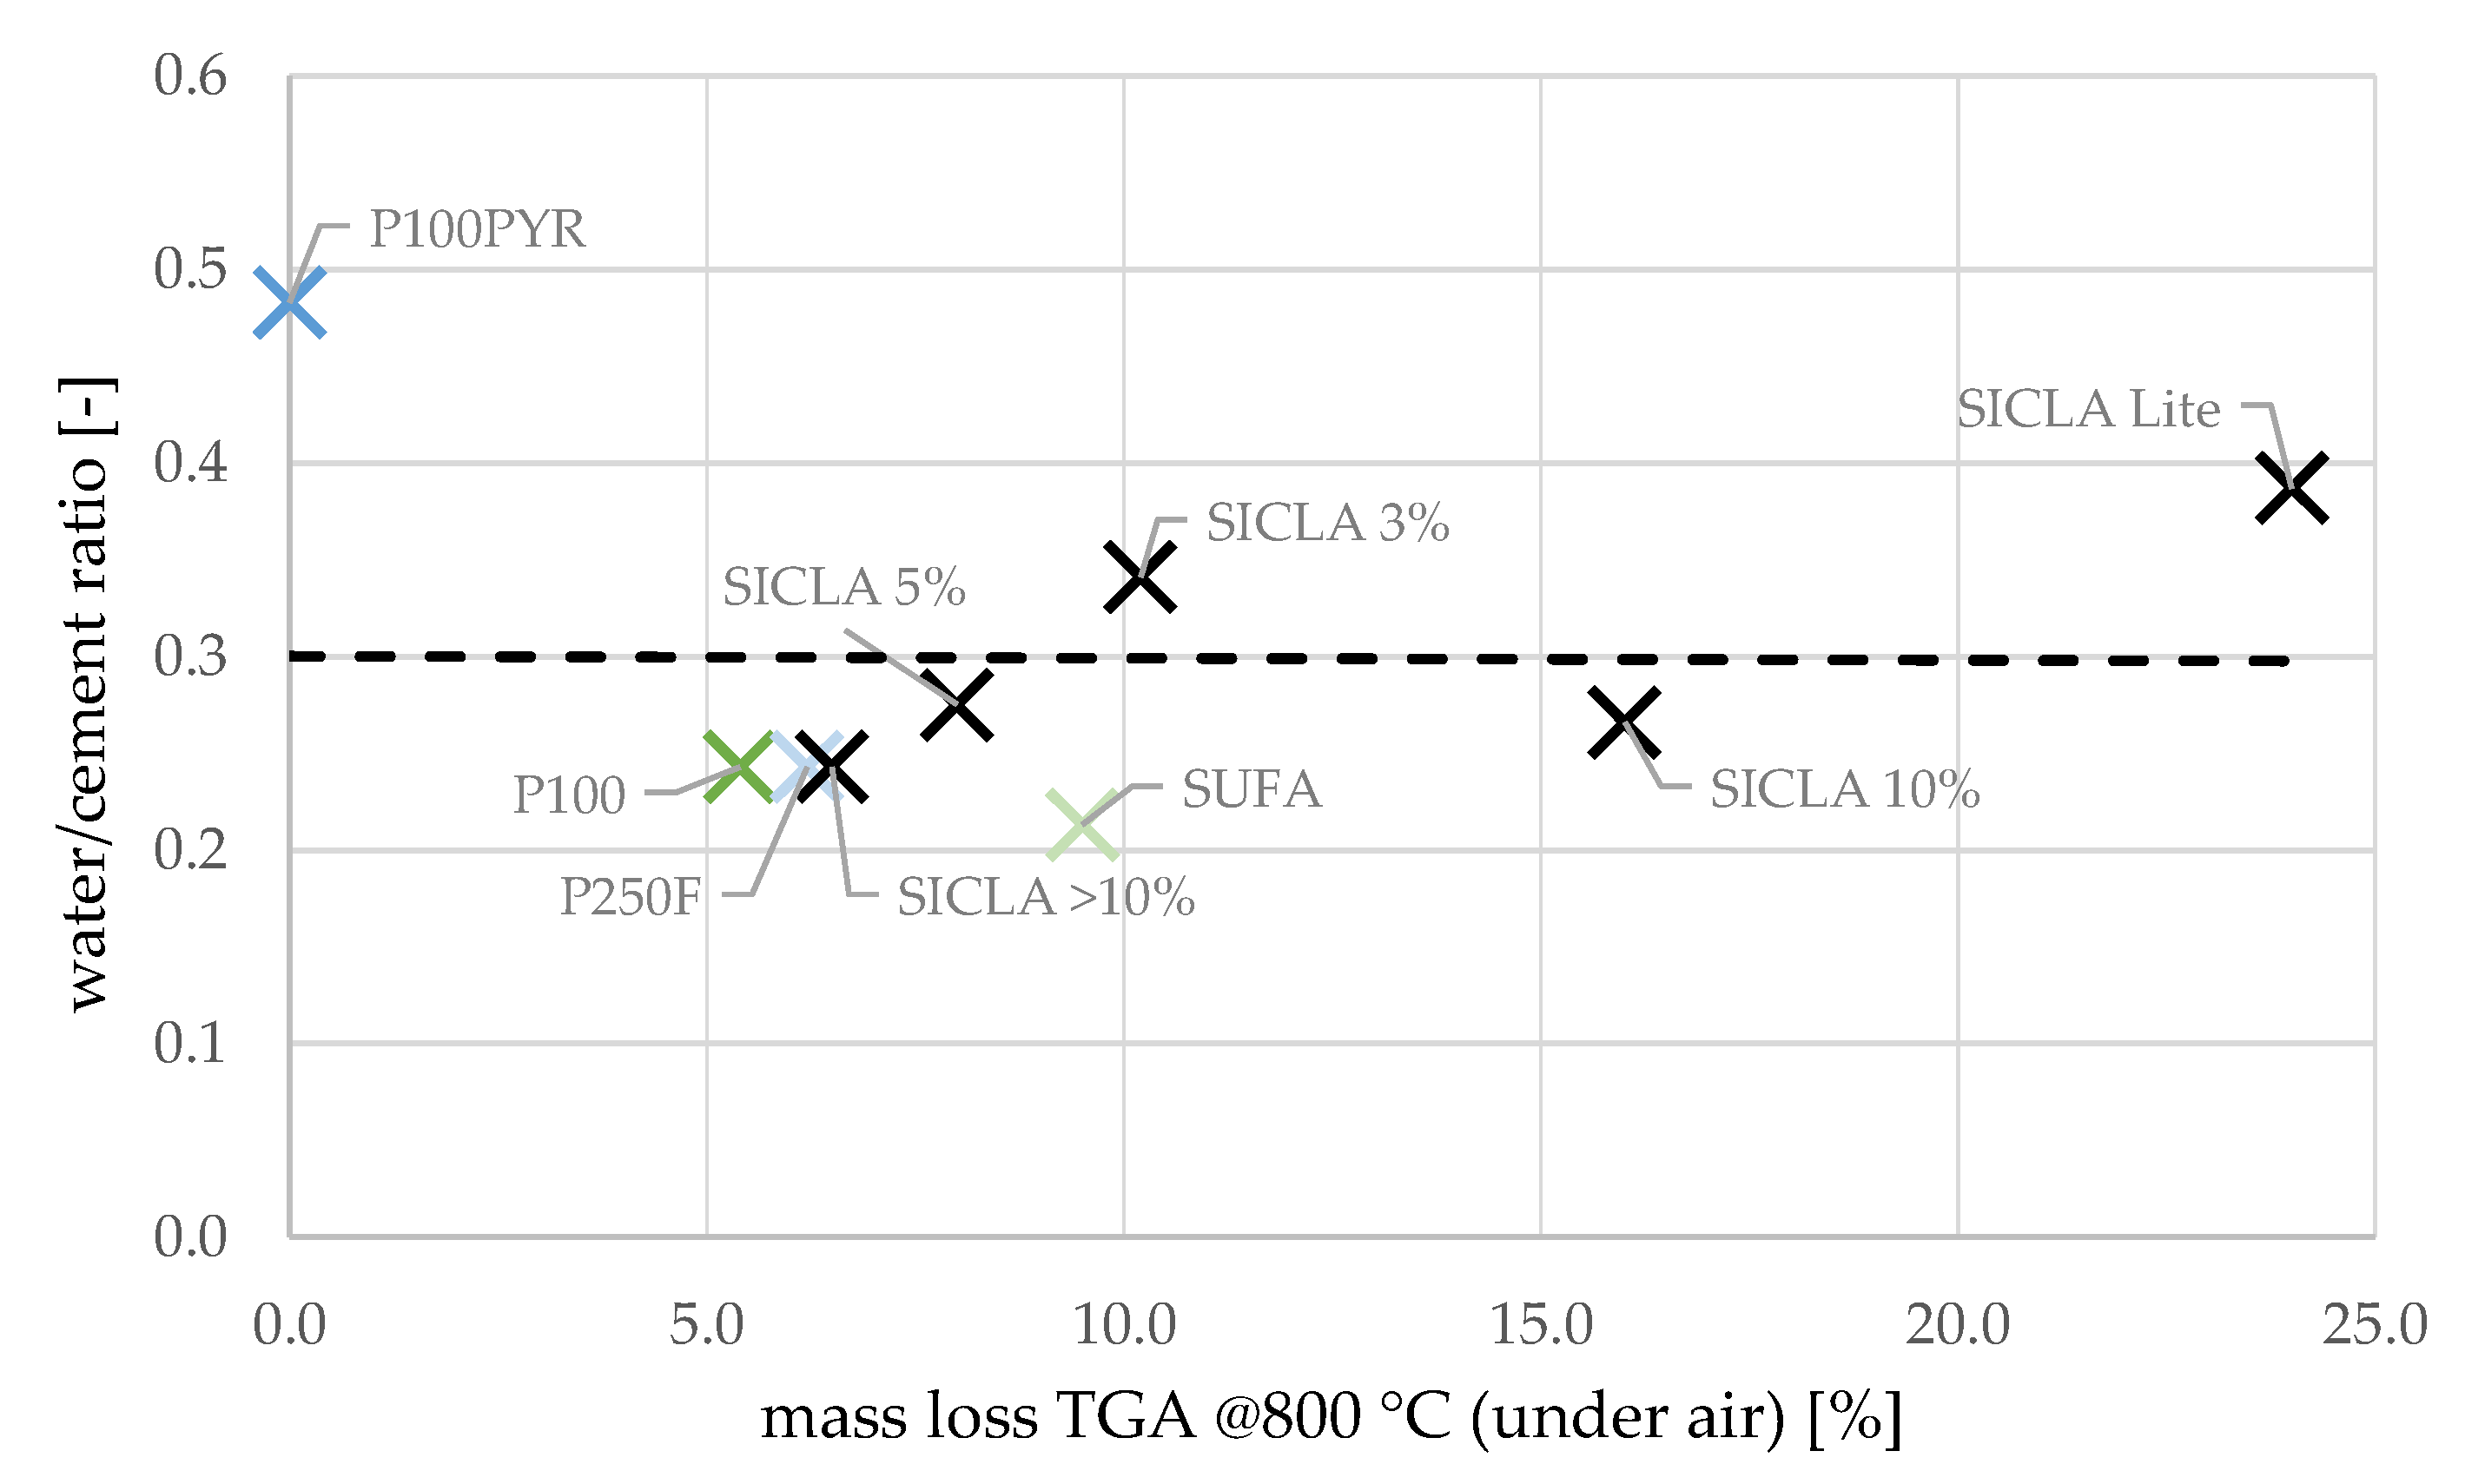
3.3. Properties of Hardened Concrete
3.4. Discussion
4. Conclusions
Author Contributions
Funding
Data Availability Statement
Acknowledgments
Conflicts of Interest
References
- Schnellenbach-Held, M.; Welsch, T.; Fickler, S.; Milow, B.; Ratke, L. Entwicklung von Hochleistungs Aerogelbeton. Beton Stahlbetonbau 2016, 111, 555–563. [Google Scholar] [CrossRef]
- Schnellenbach-Held, M.; Welsch, T. Advancements in high performance aerogel concrete. In Insights and Innovations in Structural Engineering, Mechanics and Computation; Zingoni, A., Ed.; CRC Press: Boca Raton, FL, USA, 2016; pp. 1577–1582. ISBN 978-1-138-02927-9. [Google Scholar]
- Fickler, S.; Milow, B.; Ratke, L.; Schnellenbach-Held, M.; Welsch, T. Development of High Performance Aerogel Concrete. Energy Procedia 2015, 78, 406–411. [Google Scholar] [CrossRef]
- Welsch, T.; Schnellenbach-Held, M. High Performance Aerogel Concrete. In High Tech Concrete: Where Technology and Engineering Meet: Proceedings of the 2017 Fib Symposium, Held in Maastricht, The Netherlands, 12–14 June 2017; Hordijk, M.L.D.A., Ed.; Springer International Publishing AG: Cham, Switzerland, 2017; pp. 117–124. ISBN 978-3-319-59470-5. [Google Scholar]
- Fickler, S.; Heidrich, T.; Welsch, T.; Schnellenbach-Held, M. Hochleistungsaerogelbeton—Optimierung, Tragverhalten, Festigkeit. Beton Stahlbetonbau 2022, 117, 498–509. [Google Scholar] [CrossRef]
- Ratke, L. Herstellung und Eigenschaften eines neuen Leichtbetons: Aerogelbeton. Beton Stahlbetonbau 2008, 103, 236–243. [Google Scholar] [CrossRef]
- Welsch, T. Beiträge zur Entwicklung Eines Multifunktionalen Hochleistungsleichtbetons auf Basis von Silica-Aerogelen. Postdoctoral Thesis, University of Duisburg-Essen, Essen, Germany.
- Wong, J.C.; Kaymak, H.; Brunner, S.; Koebel, M.M. Mechanical properties of monolithic silica aerogels made from polyethoxydisiloxanes. Microporous Mesoporous Mater. 2014, 183, 23–29. [Google Scholar] [CrossRef]
- Hayase, G.; Kanamori, K.; Nakanishi, K. New flexible aerogels and xerogels derived from methyltrimethoxysilane/dimethyldimethoxysilane co-precursors. J. Mater. Chem. 2011, 21, 17077. [Google Scholar] [CrossRef]
- Cabot Aerogel GmbH. P100, P200, & P300 Aerogel Particles; Cabot Aerogel GmbH: Frankfurt am Main, Germany, 2021. [Google Scholar]
- DIN EN 12664:2001-05; Thermal Performance of Building Materials and Products—Determination of Thermal Resistance by Means of Guarded Hot Plate and Heat Flow Meter Methods—Dry and Moist Products with Medium and Low Thermal Resistance. Beuth Verlag GmbH: Berlin, Germany, 2001.
- ASTM D 2854:2009; Standard Test Method for Apparent Density of Activated Carbon. ASTM International: West Conshohocken, PA, USA, 2019.
- DIN ISO 9277:2014-01; Determination of the Specific Surface Area of Solids by Gas Adsorption—BET Method (ISO 9277:2010). Beuth Verlag GmbH: Berlin, Germany, 2014.
- DIN 66135-2:2001-06; Particle Characterization—Micropore Analysis by Gas Adsorption—Part 2: Evaluation by Isotherms Comparison. Beuth Verlag GmbH: Berlin, Germany, 2001.
- DIN EN 12350-6:2019-09; Testing Fresh Concrete—Part 6: Density. Beuth Verlag GmbH: Berlin, Germany, 2019.
- DIN EN 12350-7:2022-05; Testing Fresh Concrete—Part 7: Air Content—Pressure Methods. Beuth Verlag GmbH: Berlin, Germany, 2022.
- DIN EN 12350-5:2019-09; Testing Fresh Concrete—Part 5: Flow Table Test. Beuth Verlag GmbH: Berlin, Germany, 2019.
- DIN EN 1015-3:2007-05; Methods of Test for Mortar for Masonry—Part 3: Determination of Consistence of Fresh Mortar (by Flow Table). Beuth Verlag GmbH: Berlin, Germany, 2007.
- DIN EN 12390-2:2019-10; Testing Hardened Concrete—Part 2: Making and Curing Specimens for Strength Tests. Beuth Verlag GmbH: Berlin, Germany, 2019.
- DIN EN 196-1:2016-11; Methods of Testing Cement—Part 1: Determination of Strength. Beuth Verlag GmbH: Berlin, Germany, 2016.
- Haynes, W.M.; Lide, D.R.; Bruno, T.J. CRC Handbook of Chemistry and Physics; CRC Press: Boca Raton, FL, USA, 2016; ISBN 9781315380476. [Google Scholar]
- Ayral, A.; Phalippou, J.; Woignier, T. Skeletal density of silica aerogels determined by helium pycnometry. J. Mater. Sci. 1992, 27, 1166–1170. [Google Scholar] [CrossRef]
- Woignier, T.; Phalippou, J. Skeletal density of silica aerogels. J. Non-Cryst. Solids 1987, 93, 17–21. [Google Scholar] [CrossRef]
- DIN EN ISO 10456:2010-05; Building Materials and Products—Hygrothermal Properties—Tabulated Design Values and Procedures for Determining Declared and Design Thermal Values (ISO 10456:2007 + Cor. 1:2009). Beuth Verlag GmbH: Berlin, Germany, 2010.
- DIN 4108-4:2020-11; Thermal Insulation and Energy Economy in Buildings—Part 4: Hygrothermal Design Values. Beuth Verlag GmbH: Berlin, Germany, 2010.


| Company & Location | Aerogel Samples |
|---|---|
| KEEY Aerogel, Habsheim, France | SICLA X% (classic): post-functionalized with different hydrophobic agent content SICLA Lite: different synthesis |
| Tiem Factory inc., Tokyo, Japan | SUFA: hydrophobic precursor |
| Cabot Corporation, Frankfurt, Germany | P100 and P250: different size ranges P100PYR: pyrolyzed Cabot P100 sample as unreactive hydrophilic reference |
| Enersens, Rochetoirin, France | Kwark: post-functionalized |
| HPAC_50-P100 | Density [kg/dm3] | Mass [kg] |
|---|---|---|
| CEM I 52.5 R | 3.10 | 798.32 |
| Silica suspension | 1.38 | 207.56 |
| Superplasticizer | 1.00 | 28.33 |
| Water | 1.00 | 90.20 |
| Stabilizer | 1.00 | 3.99 |
| Silica Aerogel Cabot P100 | 0.098 | 46.39 |
| Total | 1174.8 kg/m3 |
| Commercially Available Silica Aerogel Granulate | Skeletal Density [g/cm3] | Envelope Density [g/cm3] | Apparent Density [g/cm3] |
|---|---|---|---|
| P100PYR | 2.44 | - | - |
| P100 | 1.76 | 0.15 | 0.09 |
| P250F | 1.77 | - | 0.065–0.085 * |
| SUFA | 1.37 | - | - |
| Kwark | 1.63 | 0.086 | 0.06 |
| SICLA 3% | 1.8 | - | 0.09 |
| SICLA 5% | 1.55 | - | 0.09–0.105 |
| SICLA 10% | 1.6 | - | - |
| SICLA > 10% | 1.77 | - | 0.08 |
| SICLA Lite | 1.61 | - | 0.095–0.1 |
| Commercially Available Silica Aerogel Granulate | BJH Average Pore Diameter [nm] | BET Surface Area [m2/g] | Thermal Conductivity @25 °C [W/m K] |
|---|---|---|---|
| P100PYR | 23.37 | 763 | 0.022 |
| P100 | 12.23 | 730 | 0.023 |
| P250F | 11.7 | 704 | - |
| SUFA | 14.05 | 539 | - |
| Kwark | 10.28 | 736 | 0.021 |
| SICLA 3% | 12.42 | 871 | - |
| SICLA 5% | 9.85 | 925 | 0.0204 * |
| SICLA 10% | 8.51 | 992 | - |
| SICLA > 10% | 12.1 | 722 | 0.021 * |
| SICLA Lite | 19.73 | 701 | 0.021 * |
| Commercially Available Silica Aerogel Granulate | Beginning of Thermal Decomposition in Air/Nitrogen [°C] | Mass Loss at 800 °C in Air [wt.-%] * | Mass Loss at 800 °C in Nitrogen [wt.-%] * |
|---|---|---|---|
| P100PYR | --/-- | ~0.0 | ~0.0 |
| P100 | 345/395 | 5.4 | 10.9 |
| P250F | 345/400 | 6.2 | 9.5 |
| SUFA | 400/375 | 9.5 | 71.4–75.7 |
| Kwark | --/375 | / | 12.1 |
| SICLA 3% | 260/335 | 10.2 | 16.4 |
| SICLA 5% | 265/400 | 8.0 | 13.7 |
| SICLA 10% | 265/365 | 16.0 | 14.0 |
| SICLA > 10% | 350/410 | 6.5 | 10.3 |
| SICLA Lite | 200/475 | 24.0 | 23.5 |
| HPAC_50- | Water–Cement Ratio 1 [-] | Bulk Density [kg/dm3] | Flow Spread 2 [cm] | Air Void Content [%] |
|---|---|---|---|---|
| P100PYR | 0.483 | 1.785 | - 3 | 3.30 |
| P100 | 0.243 | 1.153 | 25.3/28.0 | 5.00 |
| P250F | 0.243 | 1.351 | 37.0/39.0 | 7.00 |
| SUFA | 0.213 | 1.578 | 29.3/31.8 | 4.8 |
| Kwark | 0.358 | - | - | - |
| SICLA 3% | 0.341 | - | - | - |
| SICLA 5% | 0.275 | 1.361 | 32.3/36.0 | 6.80 |
| SICLA 10% | 0.266 | - | - | - |
| SICLA > 10% | 0.243 | - | - | - |
| SICLA Lite | 0.387 | - | - | - |
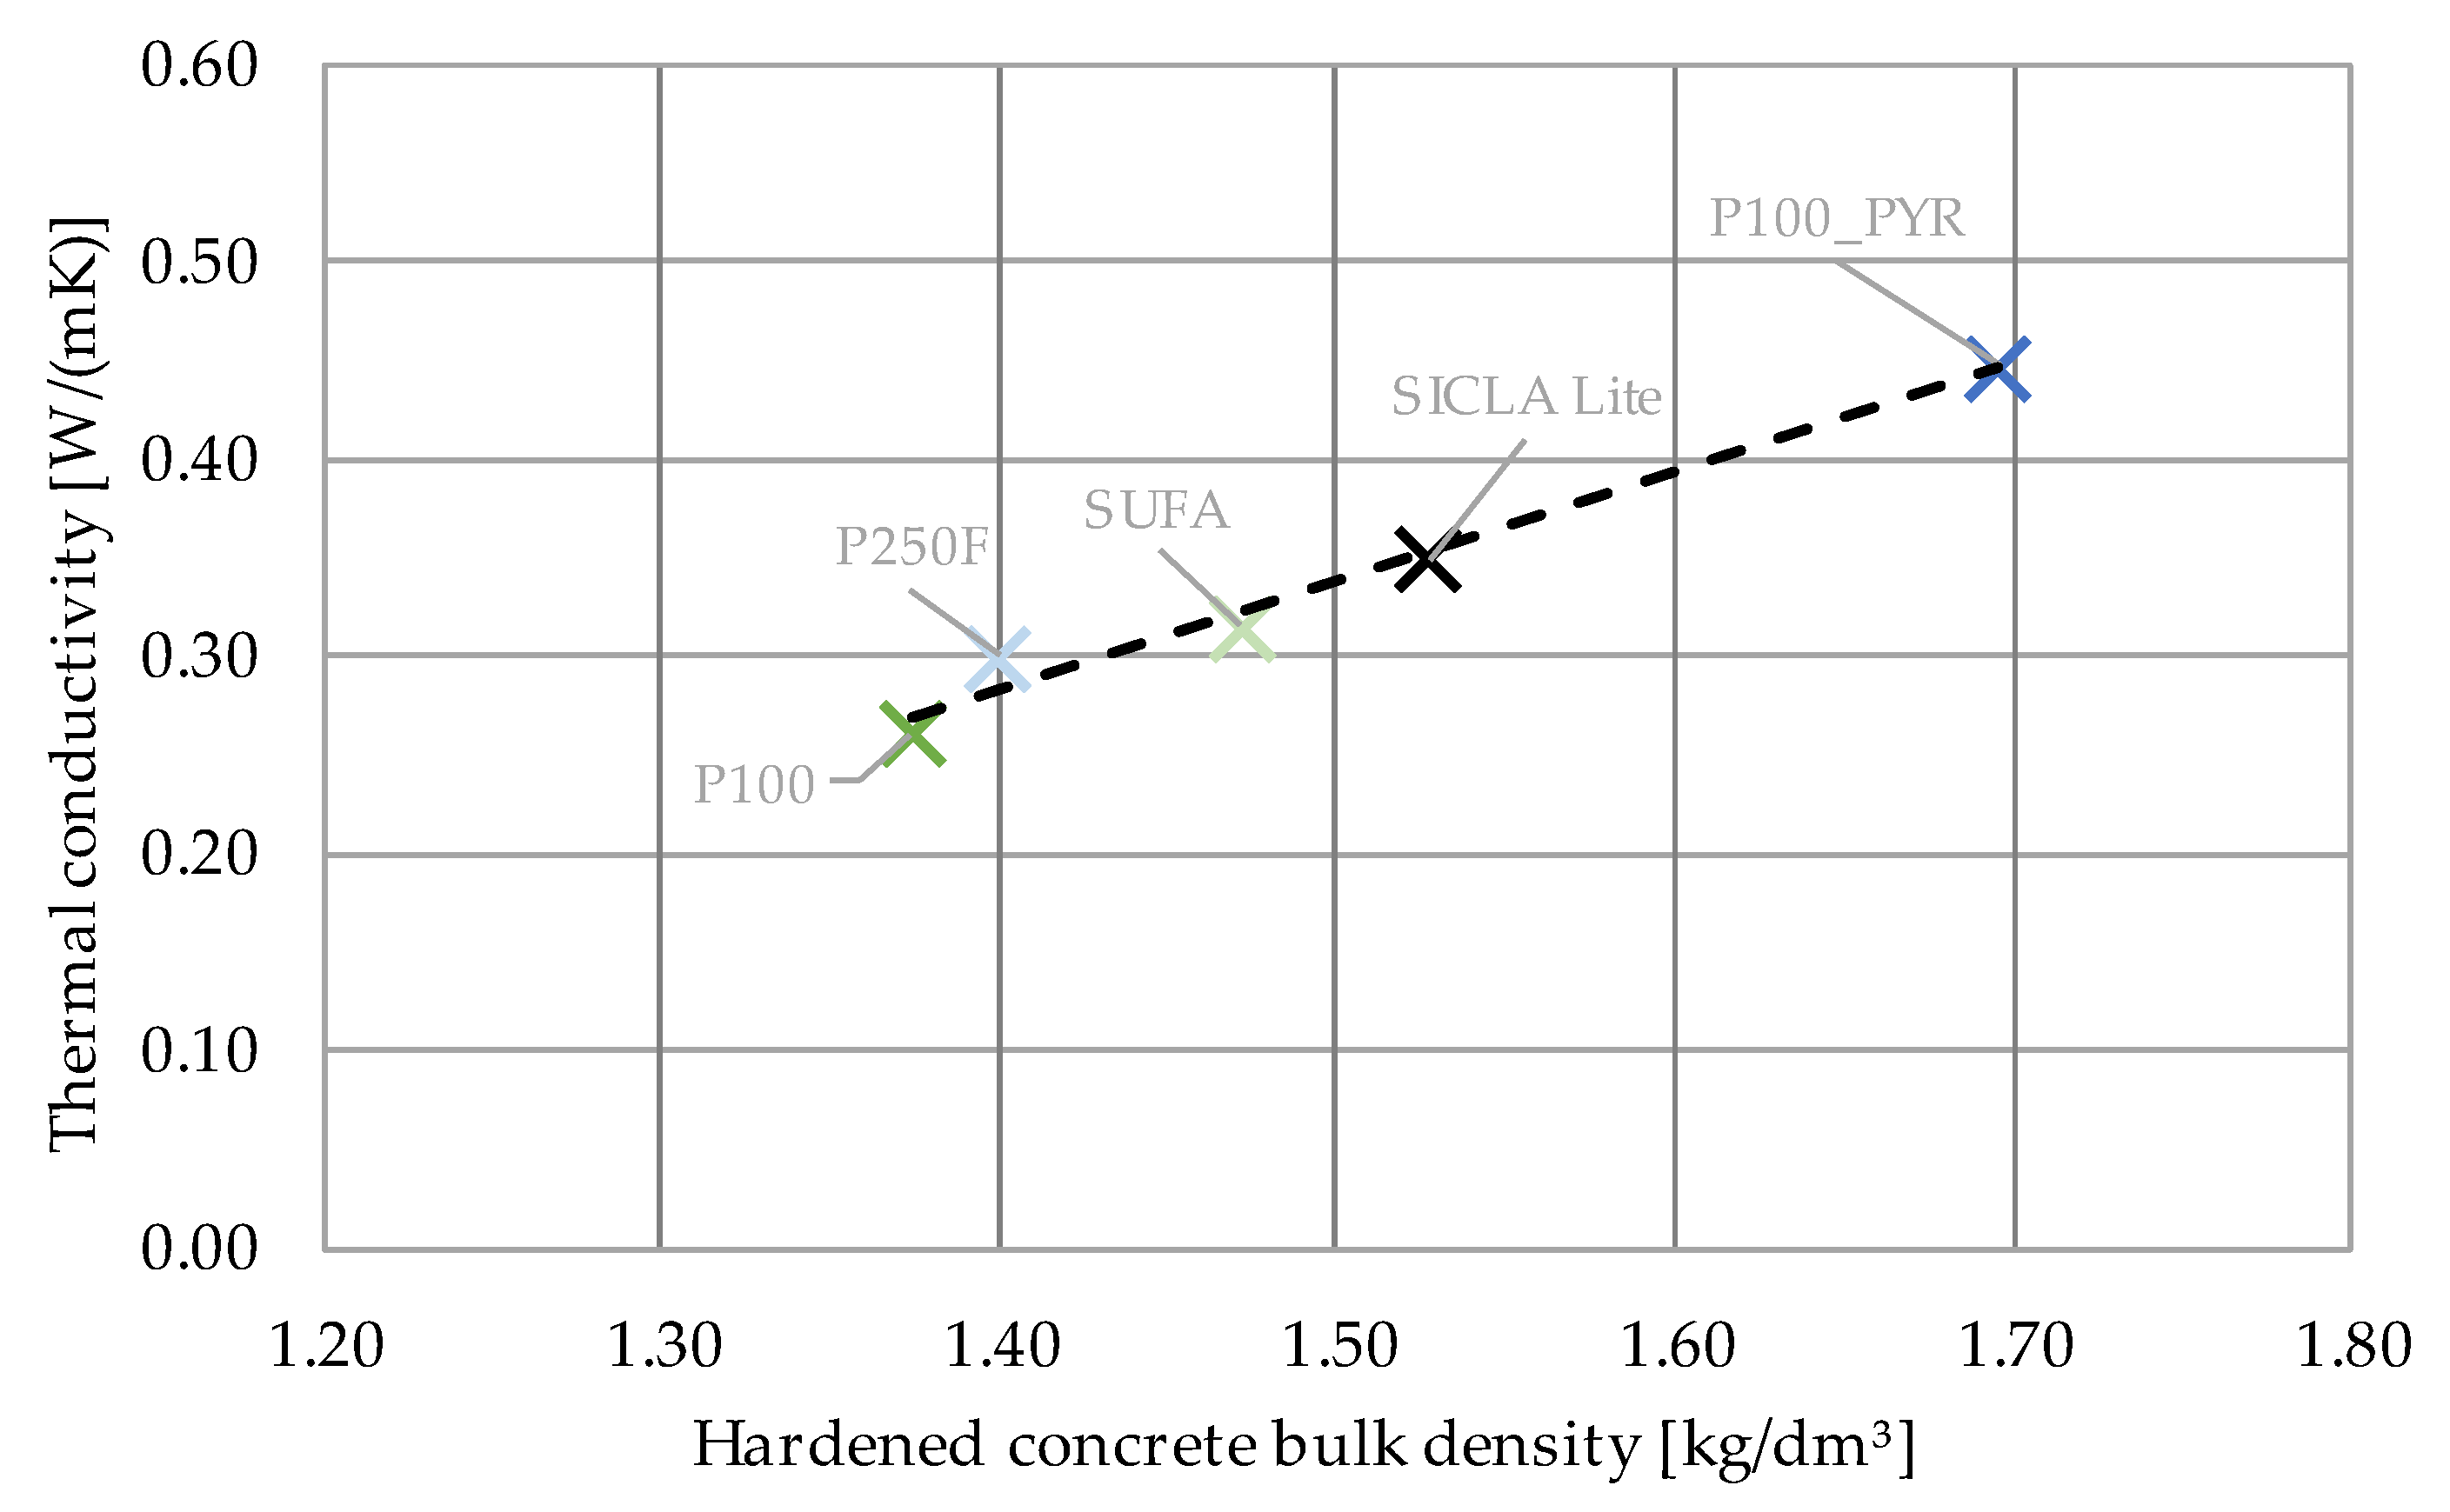
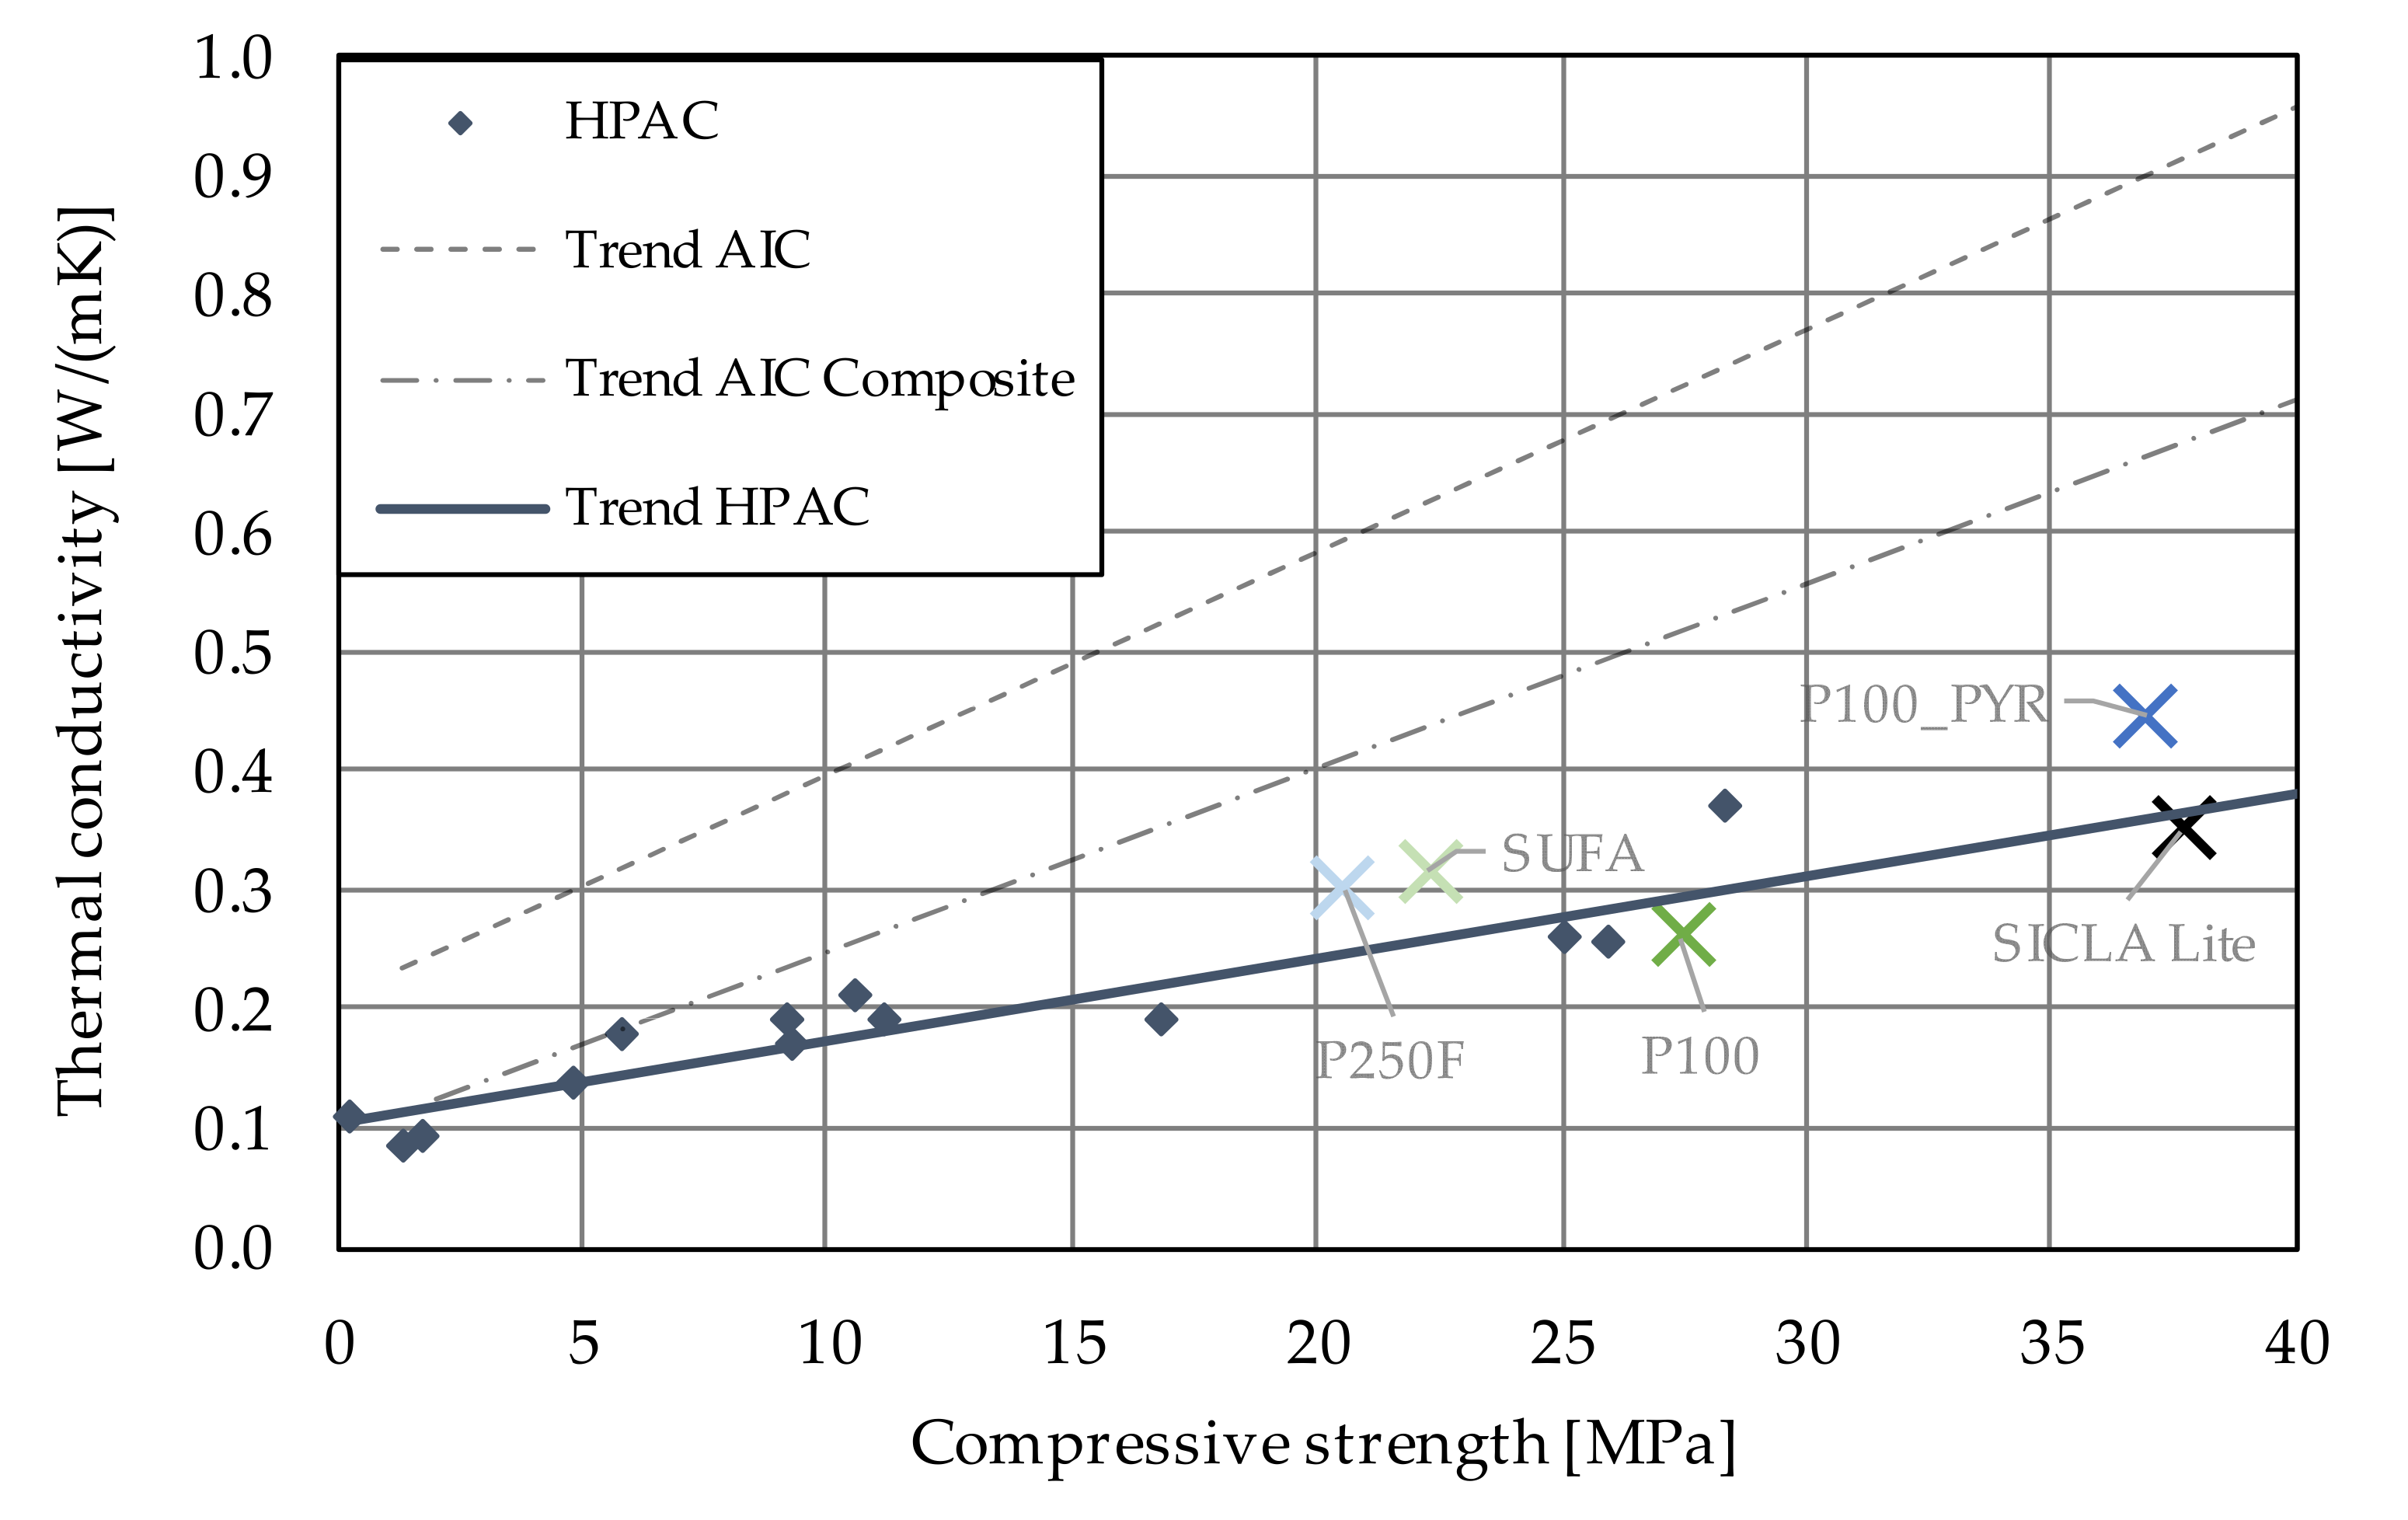
| HPAC_50- | P100PYR | P100 | P250F | SUFA | SICLA Lite |
|---|---|---|---|---|---|
| λ [W/mK] | 0.446 | 0.260 | 0.300 | 0.315 | 0.349 |
Disclaimer/Publisher’s Note: The statements, opinions and data contained in all publications are solely those of the individual author(s) and contributor(s) and not of MDPI and/or the editor(s). MDPI and/or the editor(s) disclaim responsibility for any injury to people or property resulting from any ideas, methods, instructions or products referred to in the content. |
© 2023 by the authors. Licensee MDPI, Basel, Switzerland. This article is an open access article distributed under the terms and conditions of the Creative Commons Attribution (CC BY) license (https://creativecommons.org/licenses/by/4.0/).
Share and Cite
Welsch, T.; Vievers, Y.; Schnellenbach-Held, M.; Bialuschewski, D.; Milow, B. Comparison of Different Aerogel Granules for Use as Aggregate in Concrete. Gels 2023, 9, 406. https://doi.org/10.3390/gels9050406
Welsch T, Vievers Y, Schnellenbach-Held M, Bialuschewski D, Milow B. Comparison of Different Aerogel Granules for Use as Aggregate in Concrete. Gels. 2023; 9(5):406. https://doi.org/10.3390/gels9050406
Chicago/Turabian StyleWelsch, Torsten, Yannick Vievers, Martina Schnellenbach-Held, Danny Bialuschewski, and Barbara Milow. 2023. "Comparison of Different Aerogel Granules for Use as Aggregate in Concrete" Gels 9, no. 5: 406. https://doi.org/10.3390/gels9050406