Article

Unveiling Cryptic Species Diversity and Genetic Variation of Lasiodiplodia (Botryosphaeriaceae, Botryosphaeriales) Infecting Fruit Crops in Taiwan

1
Department of Biological Sciences, National Sun Yat-sen University, Kaohsiung 804, Taiwan
2
Department of Agricultural Biology, Faculty of Agriculture, University of Ruhuna, Kamburupitiya 81100, Sri Lanka
3
Department of Nursing, Meiho University, Pingtung 912, Taiwan
4
Kaohsiung District Agricultural Research and Extension Station, Ministry of Agriculture, Pingtung 908, Taiwan
5
Research Center, Faculty of Medicine Ramathibodi Hospital, Mahidol University, Bangkok 73170, Thailand
6
Department of Biomedical Science and Environment Biology, Kaohsiung Medical University, Kaohsiung 807, Taiwan
7
The Multidisciplinary and Data Science Research Center (MDSRC), National Sun Yat-sen University, Kaohsiung 804, Taiwan
*
Authors to whom correspondence should be addressed.
These authors contributed equally to this work.
J. Fungi 2023, 9(9), 950; https://doi.org/10.3390/jof9090950
Submission received: 24 August 2023 / Revised: 15 September 2023 / Accepted: 19 September 2023 / Published: 20 September 2023
(This article belongs to the Special Issue Plant-Associated Fungi)

Abstract

:
The genus Lasiodiplodia, a member of the family Botryosphaeriaceae, is an important fungal disease genus in agriculture. However, the Lasiodiplodia species survey and genetic diversity in Taiwan remain unclear. This study aimed to investigate the Lasiodiplodia species associated with various fruit species to explore the cryptic Lasiodiplodia species diversity, validate species delimitation, and unveil cryptic genetic diversity. Overall, six Lasiodiplodia species were identified, with several new records of infection identified. Additionally, phylogenetic analyses indicated that the relations of all isolates of L. theobromae might be paraphyletic. They were grouped with L. brasiliense based on Automatic Barcode Gap Discovery (ABGD), Automatic Partitioning (ASAP) and structure-based clustering analyses. These analyses did not provide conclusive evidence for L. brasiliensis as a stable species. It may be necessary to gather more information to clarify the species delineation. The multiple new records of Lasiodiplodia species with high genetic diversity and differentiation revealed that the diversity of Lasiodiplodia in Taiwan was underestimated in the past. We found that L. theobromae has the highest number of haplotypes but the lowest number of haplotype and nucleotide diversities, indicating a recent population expansion. This was supported by the significant negative Tajima’s D and Fu and Li’s D* tests. The high genetic diversity, low gene flow, and host-associated differentiation of Lasiodiplodia species indicate that they might harbour powerful evolutionary potential in Taiwan. This study provided critical insights into genetic variation, host-associated differentiation, and demography of Lasiodiplodia species, which would be helpful for disease management of related pathogens.

1. Introduction

The genus Lasiodiplodia belongs to the family Botryosphaeriaceae, with more than 80 species reported in the MycoBank database (https://www.mycobank.org/, accessed on 18 June 2023). The genus was widely studied due to its pathogenic nature to many important agricultural plants in tropical and subtropical areas, with thousands of plant hosts recorded [1,2]. Out of all the host plants that have been documented, mango, cocoa, and grape have the most comprehensive records of coexisting infections with various Lasiodiplodia species [3,4,5,6]. More than 70 Lasiodiplodia species have been reported and described since 2004 based on morphological characteristics and molecular data. However, many Lasiodiplodia species have overlapping morphological characteristics [7,8] or lack morphological character descriptions, such as L. endophytica [9]. Furthermore, out of all legitimate Lasiodiplodia species, only five of them have sexual morphs described [8,10,11,12,13].
Accurate and prompt diagnosis of plant fungal pathogens is crucial for disease management [14]. However, correct identification of the species in the genus Lasiodiplodia remains difficult for several reasons. First, identifying species based on morphological characteristics alone is unreliable, as the characteristics may vary within a species at different developmental stages or may be influenced by environmental factors [9,15]. Second, even if the species can be identified using the spore characteristics, obtaining single spore colonies is time consuming and requires specialized techniques, which are not easily applied in the field. Third, the symptoms caused by different Lasiodiplodia species are mostly indistinguishable, which include rots in various organs of the host plants (seeds, fruit, stem-end, panicle, neck), necrotic lesions, foliage yellowing; decline, branch dieback, gummosis and stem canker [3,6,7,16,17,18,19,20,21,22,23]. Additionally, these symptoms may be mistaken for those of other Botryosphaeriaceae species diseases [6,20,24,25,26,27]. Lastly, the coexisting infections by different species in this genus are commonly seen and may have a synergistic effect, which increases the complexities in disease management [3,4,5,6,17].
Molecular markers provide advantages in studying species diversity and evolution and contribute significantly to accurately identifying intricate fungal species [28,29]. The massive increase in molecular marker sequences and related phylogenetic analysis has dramatically influenced the systematics and taxonomy of many important plant pathogenic fungi, such as the genus Lasiodiplodia [24,30,31,32,33]. Several molecular markers have been used in identifying species in the genus Lasiodiplodia, including the internal transcribed spacer (ITS) of genomic rDNA, the nuclear ribosomal small subunit ribosomal RNA (SSU) gene, nuclear ribosomal large subunit ribosomal RNA (LSU) gene, translation elongation factor 1-alpha (TEF1), β-tubulin 2 gene (TUB2) and the mitochondrial ribosomal small subunit ribosomal RNA (mtSSU) gene [8,24,26]. The combination of using ITS and EF1 sequences provided sufficient resolution in identification at the species level in many genera of Botryosphaeriaceae [33]. However, it is insufficient for a robust phylogenetic identification for Diplodia, Neofusicoccum, and Lasiodiplodia. Additional loci, i.e., RPB2 and TUB2, must be considered for more robust analysis [33]. It is essential to use at least four loci to determine the uniqueness of each species to avoid questionable or unreliable identification of closely related species in the genus Lasiodiplodia [30].
Studies of Lasiodiplodia in Taiwan have been reported in several agricultural hosts, including guava [34], mango [35], papaya [36], avocado [37], jackfruit [38], kumquat [39], Aquilaria sinensis [40], Araucariaceae [41], lima bean [42], Malabar chestnut [43], and Passiflora edulis [41]. It is crucial to highlight that previous identifications of Lasiodiplodia in Taiwan were primarily based on morphological characteristics, and molecular information was very limited. As a result, the phylogenetic diversity of Lasiodiplodia in Taiwan is likely underestimated. A better understanding of pathogenic fungi will provide more insights into future disease management and prevention in agricultural fruit plants. Thus, this study aimed to investigate cryptic species of the genus Lasiodiplodia and their genetic diversity in Taiwan by (i) investigating Lasiodiplodia species in infected host plants to understand the prevalence and pathogen distribution; (ii) identifying the phylogenetic relations and species diversity of Lasiodiplodia species and its close related genus using a panel of molecular markers, i.e., combined SSU, ITS, TEF1, and TUB2; and (iii) evaluating the diversity, recombination, and demographics of the species.

2. Materials and Methods

2.1. Sample Collection and Single Spore Colony Isolation

The collected samples were surface sterilized with 70% ethanol for 2 min. Small samples were then taken from the interface between healthy and diseased tissue using a sterile scalpel and washed twice with sterile distilled water. The cut sample block was placed on potato dextrose agar (PDA, Difco) medium and incubated at 25 °C for seven days. After the cultured diseased tissue grew hyphae, the single hyphae were cut out at the colony’s edge and transferred to fresh media. The isolates were cultured in 2% water agar (WA) covered with sterilized sprigs of Casuarina equisetifolia on the surface as a substrate at 25 °C for four weeks to induce pycnidia formation. After sporulation, a single spore culture was obtained and transferred to fresh PDA plates. Morphological characteristics, such as the isolate’s shape, size, and colour, were observed under the microscope to assist in identifying the species of isolates. The conidia length and width were measured from different isolates, and 20 measurements were performed for each isolate to calculate the average, standard deviation, and 95% confidence interval.
Each fungal species’ isolation frequency (IF; %) was calculated as the number of collected tissues infected by each fungal confirmed by molecular identification divided by the total number of collected tissues incubated. A one-way ANOVA statistical analysis was performed using the aov() function in R version 4.3.1 software [44]. When F values were significant (p < 0.05), a post hoc Tukey test function TukeyHSD() from the {stats} package was used. A p-value was considered significant when lower than 0.01 to evaluate significant differences (p < 0.001) in isolation frequency among different Botryosphaeriaceae species for each host plant separately. Figures were created using the ggplot2 package in R version 4.3.0 software to draw a plot with error bars [45].

2.2. DNA Extraction and Sequencing of Four Markers

The mycelium was grown on PDA cultured at 25 °C and harvested for four weeks. A sterile scalpel was used to scrape mycelium to obtain a sample of 0.5 g. Then stainless steel beads, glass sand and 80 µL of 0.5 N NaOH were added to grind the samples at 4.0 m/s for 15 s using the FastPrep®-24 homogenizer (MP Biomedicals, Illkirch, France). The process was repeated twice to ensure that samples were homogenized entirely. The genomic DNA samples were extracted using the Genomic DNA Extraction Kit (RBC Bioscience, Taipei, Taiwan) from the paste-like mycelium preparations aforementioned. All extracted genomic DNA quality was examined using 1% agarose gel electrophoresis and the Lambda marker (200 µg/mL, Promega, Madison, WI, USA) as the standard to compare the extracted DNA concentration. Finally, the sterile water was used to adjust the extracted DNA concentration to 20 ng/µL for subsequent experiments and stored at −80 °C until further analysis.
A 50 µL PCR mix containing 1.5 µL of template DNA, 5 µL of 10 × reaction buffer, 5 µL of dNTP Mix (2 mM), 5 µL of each forward and reverse primers (2 mM), 1 µL of Taq polymerase (0.2 U µL-1; Promega), and 27.5 µL of sterile water was used for PCR. The ITS, TEF1, SSU and TUB2 regions were amplified with primer pairs ITS1 (5′-TCCGTAGGTGAACCTGCGG-3′) and ITS4 (5′-TCCTCCGCTTATTGATATGC-3′) [46], EF1-728F (5′-CATCGAGAAGTTCGAGAAGG-3′) and EF1-986R (5′-TACTTGAAGGAACCCTTACC-3′) [47], NS1 (5′-GTAGTCATATGCTTGTCTC-3′) and NS4 (5′-CTTCCGTCAATTCCTTTAAG-3′) [46], and Bt2a (5′-GGTAACCAAATCGGTGCTGCTTTC-3′) and Bt2b (5′-ACCCTCAGTGTAGTGACCCTTGGC-3′) [48]. PCR amplification reaction conditions: 95 °C for 5 min, followed by 35 cycles of 1 min at 94 °C, 1 min at 50–54 °C, 1 min at 72 °C, and the final extension of 10 min at 72 °C. All PCR fragments were purified with the HiYield™ Gel/PCR DNA Fragments Extraction Kit (RBC Bioscience). Both strands of the PCR fragments were sequenced using the ABI PRISM 3730XL DNA sequencer (Applied Biosystems, Foster City, CA, USA). The GenBank accession numbers are as follows: OR534007-OR534219 for ITS region; OR552184–OR552396 for TEF1 region, OR534310-OR534522 for SSU region and OR551773–OR551985 for TUB2.

2.3. Phylogenetic Analysis and Cryptic Species Analyses

The forward and reverse primer sequence data obtained from sequencing were aligned into contigs using the SeqMan software from the DNASTAR package (DNASTAR Inc., Madison, WI, USA). The alignments were edited and adjusted manually as needed. The resulting consensus sequence data were compared with the National Center for Biotechnology Information (NCBI) database using the BLASTN algorithm (http://www.ncbi.nlm.nih.gov/BLAST/, accessed on 18 June 2023)), with a query cover of 99–100% and an identity of 98–100% for species identification. Multiple sequences were aligned and retrieved from the GenBank dataset using MEGA 11 [49] for subsequent phylogenetic analyses.
The four phylogenetic analysis methods (Neighbor-Joining, Maximum Parsimony, Maximum Likelihood, and Bayesian inference) were used to perform phylogenetic classification based on multilocus sequence data. The best-fit nucleotide substitution model was determined using jModelTest v 2.1.7 [50] with the Akaike information criterion (AIC). The model was found to be HKY + G and was used in the Maximum Likelihood (ML) and Bayesian Inference (BI) analyses.
The Neighbor-Joining tree (NJ) was constructed using MEGA 11 [49] with the Kimura-two-parameter nucleotide substitution model for estimating genetic differences [51]. The bootstrap value was calculated based on 5000 resamplings. The NJ trees were generated for each locus alignment to evaluate the species resolution ability of loci.
The consensus Maximum Parsimony tree (MP) was inferred using the program SEQBOOT, DNAPARS, and CONSENSUS from PHYLIP v.3.698 [52]. A 1000 bootstrap replicates were performed with the SEQBOOT. DNAPARS produced the multiple Maximum Parsimony trees using a heuristic algorithm. CONSENSUS summarized to receive a consensus tree with the majority rule method.
The Maximum Likelihood (ML) analysis was carried out using RAxML v.8.2.10 [53], with a standard non-parametric bootstrap evaluation under the HKY + G nucleotide substitution model of evolution. The robustness of the analysis was evaluated by bootstrap support (MLBS) using the number of replicates automatically. The non-parametric bootstrap validation was set to 10 runs and 1000 replicates. Nodes with bootstrap values ≥ 50 were considered supported.
The Bayesian Inference (BI) analysis was conducted by MrBayes 3.2.7a [54]. With two independent runs of four chains for 40 million generations and sampling tree topologies every 100,000 generations. These values had accepted after 25% of the generations were discarded from each run as the burn-in phase. Convergence was ascertained by examining the average standard deviation of split frequencies (ASDSF) as well as the potential scale reduction factor (PSRF). PSRF values were accepted as close to 1.0 for all parameter estimates. ASDSF values dropping below 0.01 is a good convergence indication [55]. The tree topologies information of branch rates, node heights, and other statistics were visualized in Figtree v.1.4.4 [56].
To further validate species delimitation and unveil the cryptic species diversity of Lasiodiplodia, this study employed two DNA-based species delimitation methods: Automatic Barcode Gap Discovery (ABGD) and Automatic Partitioning (ASAP), as described by Puillandre et al. (2012) and (2020) [57,58], respectively.
ABGD approach sorts the multiple alignment sequences into hypothetical species based on the detection of breaks in the distribution of pairwise genetic distances (barcode gaps), which can be observed when the nucleotide divergence among the isolates belonging to the same species is smaller than the nucleotide divergence among the isolates from different species. Barcode gaps were detected and used to partition the data. Gaps detection and limit were inferred and then recursively applied to prior obtained groups to obtain the maximum number of groups [57]. This study used the combined four loci dataset, with the default setting, and genetic distances were calculated using the p distance model with minimum gap width set X = 1.5.
On the other hand, the ASAP method utilizes a hierarchical clustering algorithm that does not require prior knowledge of distance thresholds or phylogeny reconstruction [58]. Instead, it computes the p-value and relative barcode gap width and combines them into an ASAP score that ranks the partitions. The study utilized the p-distance model with default settings for the combined dataset.

2.4. Assessment of Nucleotide Diversity, Recombination, Linkage Disequilibrium and Demographic History

The genetic diversity and polymorphism were estimated using DnaSP v.6.12.03 [59]. Genetic diversity among Lasiodiplodia species was estimated by computing the number of haplotypes (h), segregating sites (S), haplotype diversity (Hd), and nucleotide diversity (π) [60]. Haplotype diversity (gene diversity) means the probability that two stochastically sampled alleles are different. Nucleotide diversity means the average number of nucleotide differences per site between randomly pairwise comparisons of DNA sequences [60].
The minimum number of recombination events (RM) values in the history for the Lasiodiplodia samples was further obtained using the four-gamete test [61] by DnaSP v.6.12.03. The linkage disequilibrium for the whole data was calculated by DnaSP v.6.12.03. Kelly’s ZnS statistic [62] for linkage disequilibrium is the average of r2 of the allelic identity over all pairwise comparisons between two loci [63]. The range of ZnS values is from 0 to 1, with higher values denoting stronger linkage disequilibrium [64]. Rozas’ ZZ [65] is the comparison between ZnS and ZA (ZZ = ZAZnS), where ZA is the average of r2 of the allelic identity between adjacent polymorphic sites overall pairwise comparisons.
To assess the past population expansion, two statistical tests were performed for each gene using the DnaSP v.6.12.03 software [59]: Tajima’s D test [66] and Fu and Li’s D* test [67]. Demographic and spatial expansion null hypotheses were tested by mismatch distribution analysis using 1000 parametric bootstraps [68], and the sum of squared deviations (SSD) and the Harpending’s raggedness index (HRag) were applied to appraise the goodness-of-fit for each expansion mode [69]. In addition, to test for demographic processes, we used a pairwise mismatch distribution with the DnaSP v.6.12.03 software [59]. Mismatch curves were created for each Lasiodiplodia species and compared with the expected curves for the constant population size model and the population growth–decline model. An unimodal distribution indicates sudden population expansion [70], while a multimodal mismatch distribution indicates recent demographic expansion following population size reduction due to population subdivision [71].

2.5. Genetic Differentiation and Genetic Structure Analysis

The hierarchical analysis of molecular variance (AMOVA) via the Arlequin v.3.5 programs [72] was employed to examine variance partitioning into components derived from different levels and to assess the F-statistics significance using 999 permutations. The F-statistics can assess the degree of genetic differentiation [73]. F-statistics provide a basis for studying gene flow by comparing allele frequencies of polymorphic loci to detect subdivisions [74]. The FST value can reflect the degree of genetic differentiation among populations. FST = 1/(1 + 4 Nm for diploids; 1 + 2 Nm for haploids) [75], N is the effective population size, and m is the migration rate between populations. Nm is the haploid number of migrants coming into the population per generation.
The model-based clustering method in STRUCTURE v.2.3.4 [76] is used to calculate allele frequencies and assign related individuals to source populations based on likelihood. STRUCTURE applies a Bayesian iterative algorithm using Markov Chain Monte Carlo (MCMC) estimation to analyze differences in genetic variation distribution among defined populations and group individuals with similar variations. The MCMC process randomly assigns individuals to a predetermined number of K genetically ancestry clusters, estimates the variant frequency in each cluster, and reassigns individuals. The posterior probabilities of K clusters are calculated for each individual using 105 burn-in periods followed by 106 Monte Carlo Markov Chain (MCMC) replicates collected after burn-in to receive accurate parameter estimates. Twenty independent runs of the Markov chain were performed to verify the convergence of the chain and the consistency across each prior K run and ΔK was used to evaluate the actual K value [77]. The output file of STRUCTURE analysis was integrated and evaluated using the STRUCTURE HARVESTER program to visualize and evaluate the likelihood values across multiple K values and multiple iterations [78]. The most suitable K value was selected where CLUMPP aligns the multiple replicates of the choice K cluster in the STRUCTURE analysis results to help solve the multimodality problems [79]. The POPHELPER v.2.3.1 R package creates bar plots to present STRUCTURE output [80].

3. Results

3.1. Species Identification from Single Spore Colonies

We collected infected stems from Mangifera indica (mango), Psidium guajava (guava), and Cordia dichotoma. Infected fruit samples were taken from mango, Syzygium samarangense (wax apple), Carica papaya (papaya), Theobroma cacao (cocoa), Annona squamosa (sugar apple), Musa basjoo (banana), and Syzygium taiwanicum, and infected flowers were taken from Alpinia (Figure 1, Table 1 and Table S1). The infected parts exhibited symptoms such as fruit rot, necrotic lesions, or neck rot.
From selected woollen mycelium cultures showing similar morphological characteristics of Botryosphaeriaceae, a total of 391 isolates were obtained using the single hyphae method. All isolates were cultured for four weeks to be able to select single spores. The microscopic morphological characteristics of the isolates, such as shape, size, and colour, were observed under the microscope to assist in identifying the species of isolates (Figure 2). Single spores were successfully isolated from a total of 213 samples, including 91 from wax apple (Syzygium samarangense), 42 from guava (Syzygium samarangense), 43 from mango (Mangifera indica), 8 from papaya (Carica papaya), 11 from sugar apple (Annona squamosa), 9 from cocoa (Theobroma cacao), 1 from Cordia dichotoma, 2 from banana (Musa spp.), 1 from Alpinia, and 5 from Syzygium taiwanicum (Table 1 and Table S1). To ensure an accurate assessment of the genetic diversities in this study, we only used samples form single spore cultures for subsequent genetic analysis.
Of the 213 isolated single spores, there were 145 and 68 isolates belong to the genus Lasiodiplodia and other genus in the family Botryosphaeriaceae, respectively (Table 1 and Table S1). The 145 isolates from the Lasiodiplodia species showed typical morphologies of the genus: matured, single septate spore and melanin deposits on the interior surface of the wall arranged longitudinally. These Lasiodiplodia isolates were obtained successfully from almost all the host species except Syzygium taiwanicum. Out of the 145 Lasiodiplodia species, the highest number of isolates were obtained from L. theobromae (63 isolates), which accounted for approximately 43.4% and were collected from 19 different locations. The second-highest number of isolates (26 isolates), which accounted for about 17.9%, were obtained from L. rubropurpurea and were collected from 10 different locations.
Additionally, the 68 isolates from species of the family Botryosphaeriaceae, including Neofusicoccum mangiferae, N. parvum, and Botryosphaeria ramose, were isolated from wax apple, guava, mango, and Syzygium taiwanicum. We included all 213 isolates from the genus Lasiodiplodia and other genera in the family Botryosphaeriaceae in the following analyses due to the similarity in colony morphological characteristics and sharing of agricultural hosts between Lasiodiplodia and other species (Figure S1). It is worth mentioning that we have identified several novel infection records of Lasiodiplodia and Neofusicoccum species in the host plants that were not reported before, such as the infection of L. theobromae in Cordia dichotoma and Alpinia (Table 1 and Table S1).

3.2. Isolation Frequency (IF) Revealed That L. theobromae Has the Highest IF among Lasiodiplodia Species

Isolation frequency (IF) was calculated mainly in three host plants, i.e., wax apple, mango and guava, as a sufficient amount of fungal spores were isolated from the three species but not the others (Figure 3). A total of seven fungal species were isolated in wax apples, with the highest percentage of IF of 55% and 17% from N. parvum and L. theobromae, respectively. A total of eight fungal species were identified in mango, with the highest IF from L. theobromae (IF = 37%) and L. iranensis (IF = 18%). A total of six fungal species were identified in guava, with the highest IF observed in L. rubropurpurea (IF = 38%) and L. theobromae (IF = 29%). Based on our findings, it appears that L. theobromae has the highest IF among all three fruits in comparison to the Lasiodiplodia species (Figure 3 and Table S1).
We further asked whether the percentage of the fungal species was different in each host plant by performing different statistical analyses (Figure S2). The results of ANOVA tests showed that the IF of fungal pathogens in wax apples was significantly different (p < 0.01) but not in mango and guava (p > 0.05). Tukey tests for differences of means for pathogen isolation frequency further showed that the IF of N. parvum was significantly different from other fungal species in wax apples (p < 0.001).

3.3. Single Molecular Marker Does Not Provide Enough Resolution to Identify Species

Gene genealogies were generated independently for each molecular marker, i.e., ITS, SSU, TEF1, and TUB2, using the Neighbor-Joining method to address the phylogenetic incongruence of Lasiodiplodia species. The lengths of each marker are 566 bps of ITS, 1010 bps of SSU, 458 bps of TUB2, and 654 bps of TEF1 (Figures S3–S6). We obtained sequences from GenBank, including 25 ITS from 10 species, 18 SSU from 11 species, 19 TEF1 sequences from 10 species, and 26 TUB2 from 11 species to assist in identifying species at the molecular level.
An overview of the gene genealogies found that only TEF1 sequence fragments could distinguish L. brasiliensis from L. theobromae and L. pseudotheobromae from L. iranensis (Figure S5). However, L. iranensis could not be separated from the same groupings regardless of which gene genealogy was used. Notably, L. hormozganensis was distinguished only in the gene genealogies of TUB2 sequence fragments (Figure S6). Only part of the L. hormozganensis samples in the ITS and TEF1 gene genealogy could be separated into a monophyletic group. Upon inspection of the GenBank data (accession number: KP822969.1 and JX464077.1), it was discovered that the ITS sequence data of L. hormozganensis published online were also divergent in the Neighbor-Joining tree (Figure S3).
Therefore, we have concluded that using a single molecular marker is insufficient to elucidate the phylogenetic relations of all the species we collected. Using a combined dataset may improve the identification of the phylogenies of the species.

3.4. Phylogenetic Analysis Using Combined Molecular Markers Confirmed the Deep Species Identification

In order to achieve the purpose of in-depth species identification, we constructed phylogenetic trees using the four-loci dataset of 213 isolates from Lasiodiplodia, Neofusicoccum and Botryosphaeria. Phylogenetic trees using different algorithms, i.e., Maximum Parsimony (MP), Maximum Likelihood (ML), Neighbor-Joining (NJ), and Bayesian inference (BI), found that all produced similar results. A representative phylogenetic tree based on Maximum Parsimony is shown in Figure 4A.
The results showed that using the four-loci dataset provided a much better resolution of species identification than using one locus alone. We confirmed that N. parvum, N. mangiferae, and B. ramose were outgroups of the Lasiodiplodia species. All the Lasiodiplodia species together formed a monophyletic clade (node 5), which includes the monophyletic clade of L. rubropurpurea (node 10) at the basal of the cluster and the monophyletic clade other the Lasiodiplodia species (node 6). Under node 6, four monophyletic clades were identified: L. iranensis (node 14), L. brasiliensis (node 13), L. hormozganensis (node 9), and L. pseudotheobromae (node 8). All the monophyletic clades mentioned above were supported by at least 60% bootstrap values from MP, ML and NJ methods and over 0.95 probability from Bayesian inference. This means that the identified clades have strong support from the sequence data. It is worth mentioning that L. rubropurpurea was identified as a stable and distinct monophyletic group in both gene genealogies using the single marker and the phylogenetic tree using four-loci markers (Figure 4A and Figures S3–S6).
Unlike other species, isolates of L. theobromae species were paraphyletic (Figure 4A). Several isolates (11 out of 62) of L. theobromae were clustered with L. iranensis and L. brasiliensis with low support of statistic values (<60% bootstrap value) (node 12). The majority of the isolates of this species (49 out of 62) were further clustered to form a larger clade (node 11). Paraphyletic of the species indicated a possible deep genetic differentiation and diversity within the species. As seen in L. theobromae, we observed that N. parvum isolates were also paraphyletic, while N. mangiferae and B. ramose formed two independent monophyletic clades (Figure 4A). Based on these results, we hypothesize that deep genetic differentiation and diversity within L. theobromae and N. parvum species may exist.
There has been an observation that certain Lasiodiplodia species exhibit host-associated clustering of isolates. For instance, isolates from wax apples (host species symbol: SS) of L. rubropurpurea were clustered independently from the isolates of the other two hosts, despite being collected from distant locations. Other examples of this phenomenon include L. iranensis isolates from cocoa (TC), L. hormozganensis isolates from wax apples (SS) and bananas (MB), and N. mangiferae isolates from mangoes (MI) (Figure 4A). This highlights the necessity for further analysis of fine-scale genetic clustering.
Taken together, we concluded that utilizing combined four-loci markers provided sufficient resolution in species identification. However, possible deep population structures may exist in L. theobromae, requiring further analyses to elucidate the issues fully.

3.5. Species Diversity Revealed in Lasiodiplodia Species

We conducted ABGD analysis at two levels (Figure 4B,C and Figure S7). The first level included all species we analyzed (Figure 4B and Figure S7A), while the second level only considered Lasiodiplodia species (Figure 4C and Figure S7B). Interestingly, we obtained different results from the two levels, possibly due to gaps between species in different genera. We discovered that most Lasiodiplodia species were grouped into one hypothetical species (represented by the red bar) except L. rubropurpurea if samples from other genera were included. Within L. rubropurpurea, we identified two groups, indicating population divergence (represented by the light orange bars) (Figure 4B). Overall, 11 distinct groups among all species were identified (p = 0.001) (Figure 4B and Figure S7A). We further analyzed detailed differentiation within Lasiodiplodia species (Figure 4C and Figure S7B). Conversely, more hypothetical species were assigned, resulting in a total of 10 distinct groups being identified within Lasiodiplodia species (p = 0.001). We observed that L. iranensis and L. hormozganensis were each assigned as hypothetical species without subgroups in the species. However, multiple groups were identified in L. rubropurpurea (three groups) and L. pseudotheobromae (four groups). In addition, L. brasiliensis and L. theobromae were still grouped together.
We further conducted ASAP analysis on the Lasiodiplodia clade to confirm the species differentiation identified from ABGD analysis. The results were similar to the ABGD analysis. Other than L. iranensis and L. hormozganensis, ASAP identified L. pseudotheobromae as an independent species without differentiation. However, differentiation was still observed in L. rubropurpurea (two groups were identified). Lastly, L. brasiliensis and L. theobromae were still grouped. Taken together, we concluded that the clade of L. brasiliensis is likely not a monophyletic clade as they were suggested to be clustered with L. theobromae from both ABGD and ASAP analyses. In addition, a certain degree of differentiation may exist in L. rubropurpurea species.

3.6. Genetic Diversity and Recombination Events in Lasiodiplodia Species

The genetic diversity data for the four gene regions and the combined dataset were summarized in Table 2. The number of haplotypes (h) in the combined dataset ranged from 7 to 27, with the most haplotypes identified in L. theobromae (h = 27) and the least identified in L. brasiliensis (h = 7). Haplotype diversity (Hd) across all samples ranged from 0.87 to 0.99, with the highest diversity identified in L. iranensis (Hd = 0.99) using the combined dataset. Nucleotide diversity was found to be highest in L. rubropurpurea (π = 6.11 × 10⁻³) and lowest in L. theobromae (π = 1.36 × 10⁻³) using the combined dataset. The highest nucleotide diversity was found in TEF1 loci in L. rubropurpurea (π = 13.90 × 10⁻³), while the lowest nucleotide diversity was detected in ITS loci in L. theobromae (π = 0.24 × 10⁻³).
It is worth mentioning that L. theobromae has the most haplotypes identified; however, it has the lowest haplotype (Hd = 0.87) and nucleotide diversity (π = 1.36 × 10⁻³) among all the species using a combined dataset. In particular, ITS in this species showed the lowest diversities for haplotype (Hd = 0.12) and nucleotide (π = 0.24 × 10⁻³). This indicates a possible population expansion of the species recently. Furthermore, the highest nucleotide diversity of L. rubropurpurea may contribute to the multiple groups of the species based on ABGD and ASAP analyses.
We also identified recombination events in Lasiodiplodia species. The RM (minimum number of recombination events, Table 2) values varied between 0 and 2 times for individual genes and between 1 and times for the combined dataset. The combined dataset of L. theobromae (RM = 3) and L. rubropurpurea (RM = 4) showed relatively high numbers of recombination events.

3.7. Significant Population Expansion Detected in L. theobromae

We first tested that all four loci were selectively neutral in the genome by examining the degree of linkage disequilibrium (LD), which was evaluated through ZnS and ZZ statistics (Table 2). The significant LD values resulted from fewer recombination events than expected, indicated a possible selection force to link two or more loci together. Our results showed that LD, measured by ZnS, varied between the lowest value of 0.07 (L. theobromae) and the highest of 0.36 (L. rubropurpurea). However, the only significant value was observed in L. brasiliensis (0.32) using a combined dataset. The ZZ values ranged from 0.14 (L. hormozganensis) to 0.38 (L. brasiliensis) without significant values detected. We then concluded that the loci used in this study were primarily neutral in all the species.
As the four loci were night tightly linked and affected by selection force, we further performed Tajima’s D and Fu and Li’s D* tests to assess the neutrality of genomic regions by comparing the observed nucleotide diversity to the expected diversity. These tests assume that all polymorphisms are selectively neutral when the population size remains constant. In other words, the population size change may be reflected by the significant change of test values, indicating the away from the neutrality of the genomic loci. Negative values of the two tests indicate a possible population expansion of the samples. The results of this study indicate that Tajima’s D values for each gene fragment ranged from −2.51 to 0.17, while the combined dataset had values ranging from −2.41 to −0.90 (Table 2). Significantly negative Tajima’s D values were observed for Lasiodiplodia species across various gene fragments and the combined dataset. Fu and Li’s D* values ranged from −4.76 to 1.49 for each gene fragment. When the dataset was combined, the values ranged from −2.66 to −0.16. Based on the combined dataset, both tests provide strong evidence for the population expansion of L. theobromae. This is consistent with the species having the highest haplotype numbers and the lowest haplotype and nucleotide diversities observed, as previously mentioned.
Mismatch distribution was used to examine demographic changes by calculating the sum of squared deviations (SSD) and the Harpending’s raggedness index (HRag) (Table S2). Based on the spatial expansion model, none of the Lasiodiplodia species showed significant values for SSD and HRag (p > 0.05). On the other hand, under the demographic expansion model, HRag values were also insignificant (p > 0.05). In addition, the mismatch distribution did not indicate a rapid demographic expansion, with multimodal mismatch frequency distribution curves for each Lasiodiplodia species (Figure S8).

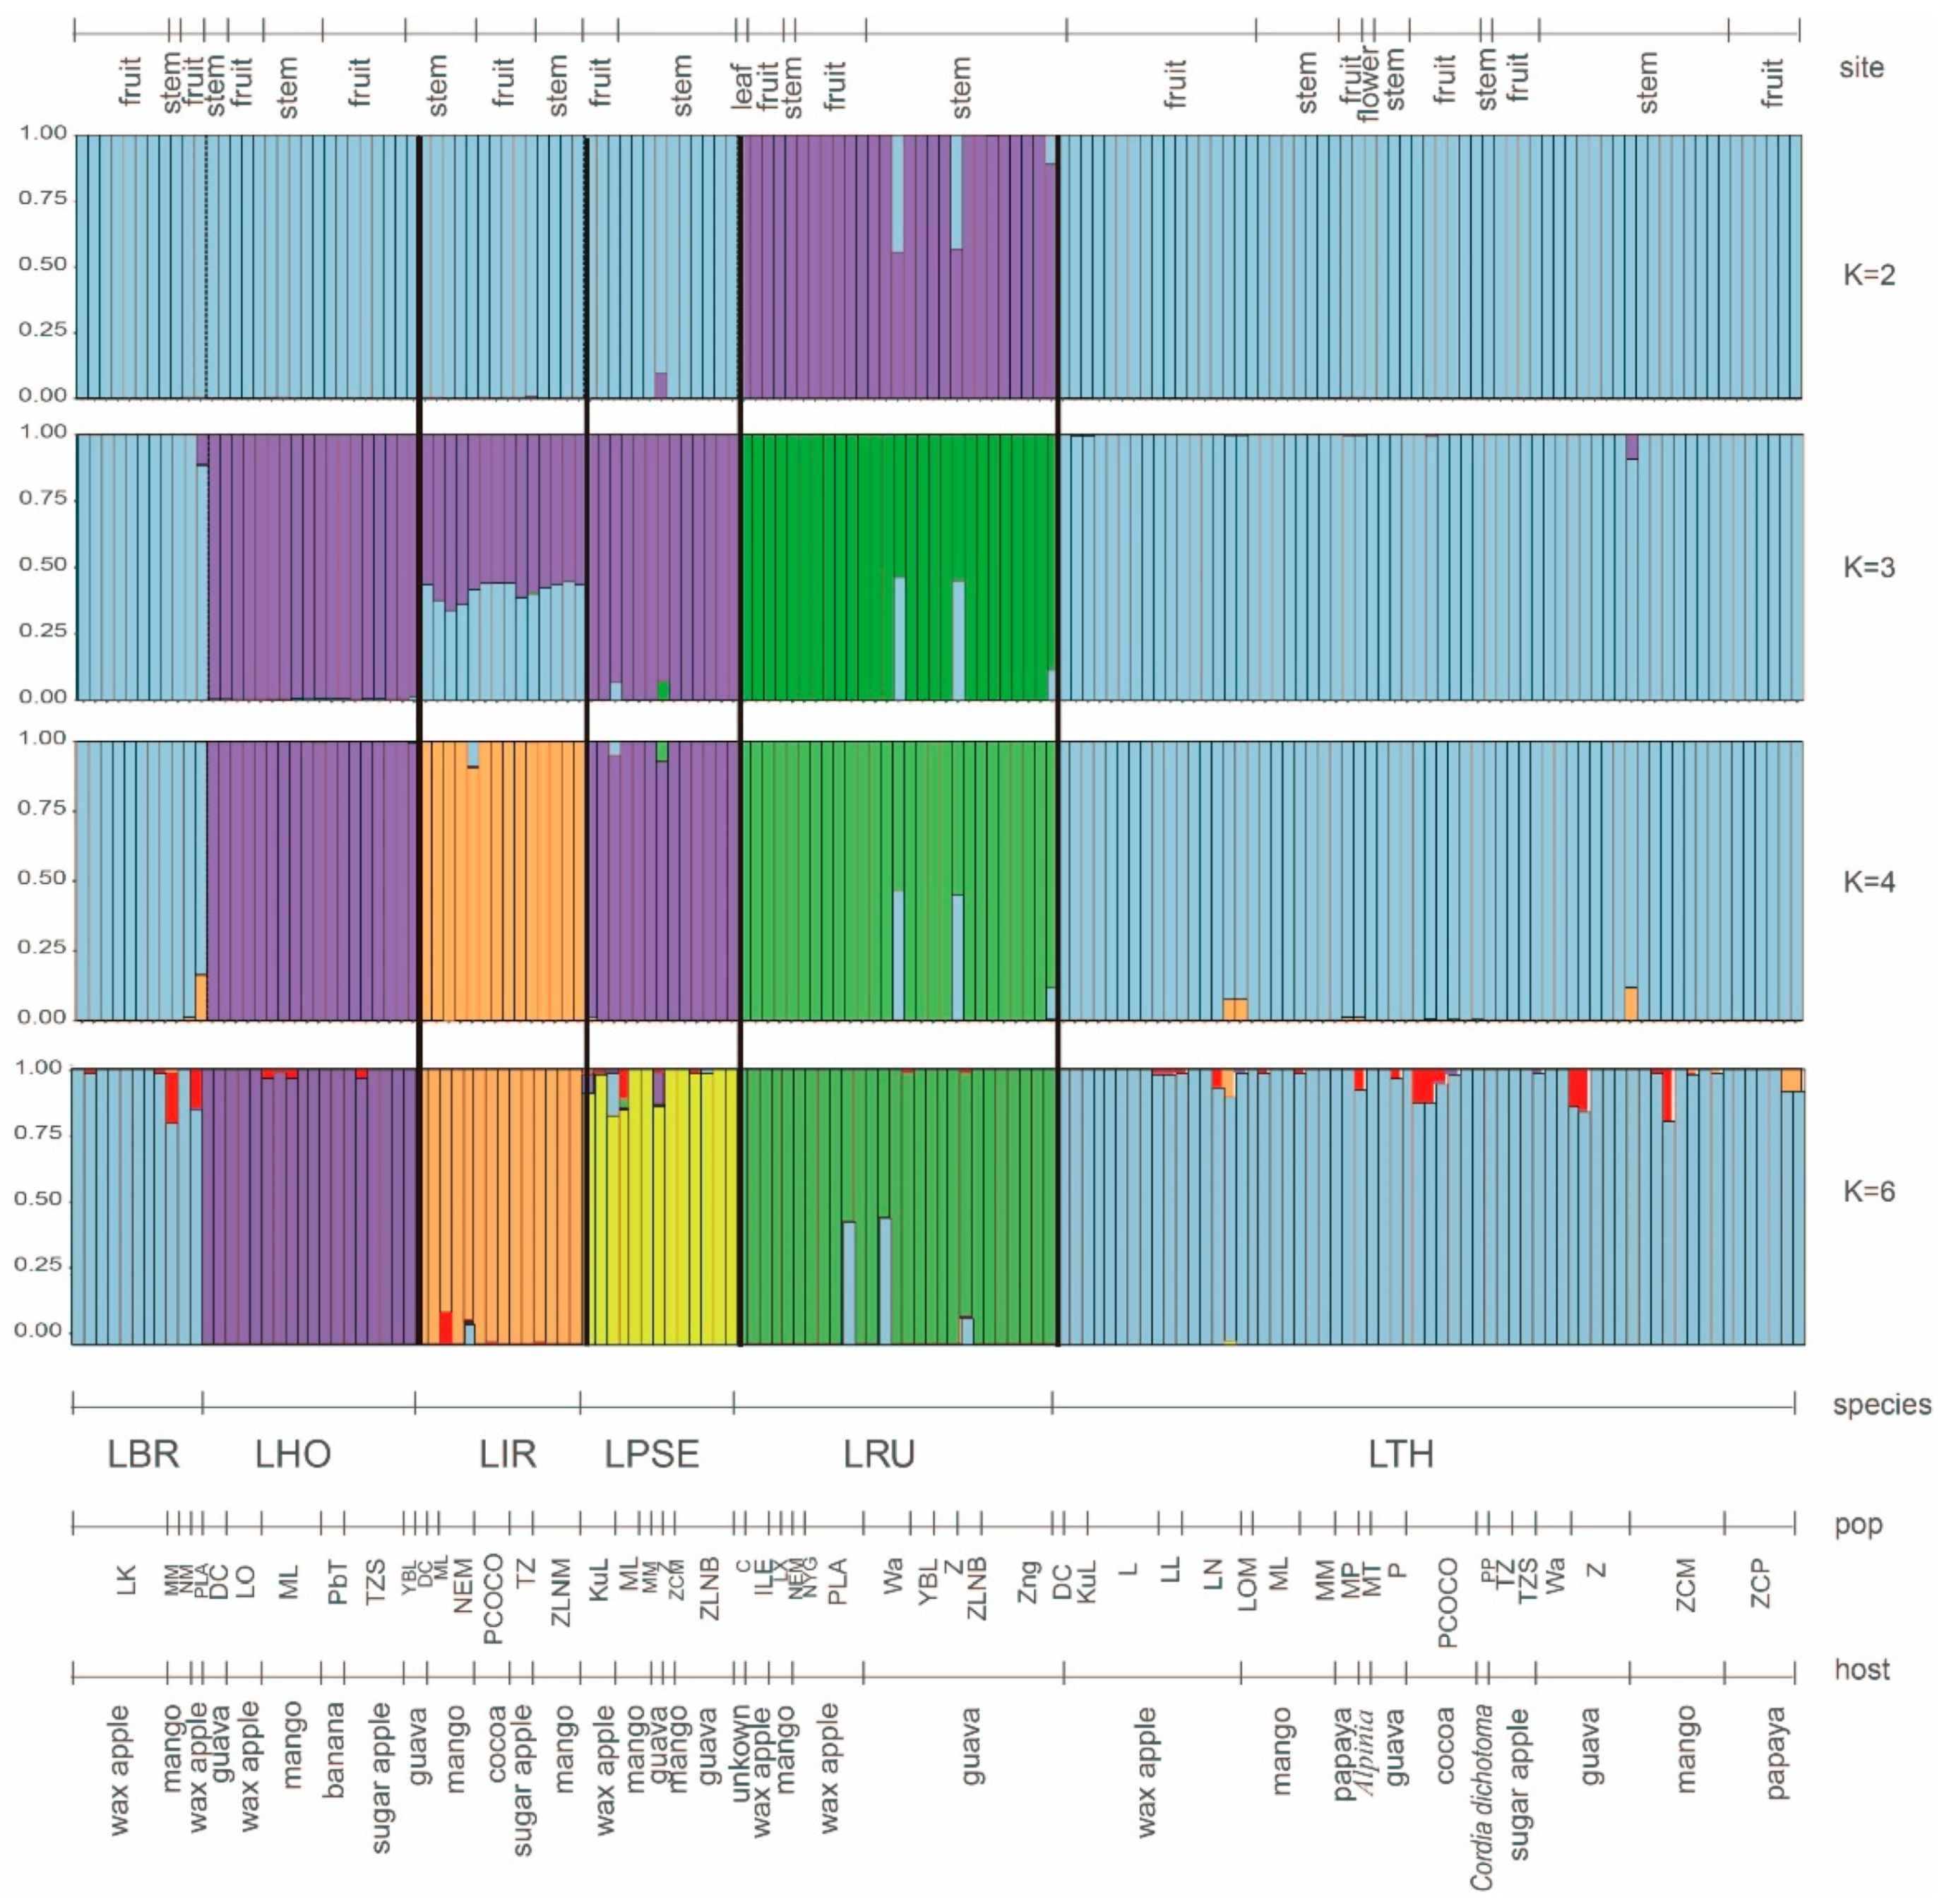
3.8. Genetic Differentiation and Genetic Structure in Lasiodiplodia Species

We conducted genetic differentiation analysis at various levels. First, we employed molecular variance (AMOVA) to classify the overall variations among species, among populations, or within populations (Table 3). The accumulated genetic variation of different classes suggested that the genetic variation primarily accumulated among the Lasiodiplodia species (89.18%). The high variability among Lasiodiplodia species was significant (FCT = 0.89). The fixation index among populations within species (FSC) and the fixation index within populations (FST) were significantly higher (FSC = 0.33; FST = 0.93). These results showed that the genetic differentiations are significant at all levels, i.e., among species, among populations and within populations.
Second, pairwise genetic differentiation was assessed by genetic distance values (FST) between each of the two Lasiodiplodia species (Table S3). FST values ranged from 0.26 to 0.87. The lowest value was observed between L. brasiliensis and L. theobromae (FST = 0.26), which was consistent with the results of ABGD and ASAP analyses—the two species were grouped together (Figure 4B–D). The highest FST was observed between L. rubropurpurea and L. theobromae (FST = 0.87).
Next, we specifically analyzed pairwise genetic differentiation between host groups within each species (Table S4). Within L. theobromae, minimal differentiation was found between guava (PG) and mango (MI) groups (FST = 0.01), while the highest differentiation was observed between sugar apple (AS) and wax apple (SS) groups (FST = 0.34). The highest genetic differentiation was found in L. rubropurpurea between mango (MI) and wax apple (SS) groups (FST = 0.92). No differentiation was found among host groups of L. pseudotheobromae. Lasiodiplodia hormozganensis displayed moderate to high genetic differentiation among most host groups (FST = 0.09–0.67), except for the guava and wax apple groups.
Lastly, cluster analysis was performed to investigate the population structure of Lasiodiplodia species. The optimal value for K clusters (no. of optimal grouping for the populations) was determined based on the magnitude of ΔK. The best value for K was found to be two, followed by three and four clusters (Figure S9). Lasiodiplodia rubropurpurea was clearly distinguished from the other species at K = 2. Lasiodiplodia pseudotheobromae and L. hormozganensis were grouped together, while L. brasiliensis and L. theobromae were grouped at K = 4. Lasiodiplodia iranensis had a mixed genetic composition at K = 3 but was clearly distinguished at K = 4 (Figure 5). Upon examining K = 6 (analysis result not supported), the grouping situation roughly corresponds to the current species nomenclature, with L. brasiliensis and L. theobromae being considered the same group, which was consistent with species divergence and genetic differentiation analyses (Figure 4C,D and Table S3).

4. Discussion

4.1. Genetic Differentiation and Genetic Structure in Lasiodiplodia Species

From the literature, only mango had relatively complete records of Botryosphaeriaceae-related infections in Taiwan and worldwide [26,35,81,82]. The records of infections in other host plants were relatively insufficient in Taiwan. In this study, we reported novel infection records for three species of Lasiodiplodia in wax apples, three species in guava and one species each in cocoa and banana (Table 1). These are all important economic fruit plants in Taiwan. Our data also indicated that the isolation frequency varied significantly among host plants. Additionally, the culture morphology of all isolates displayed variability within Lasiodiplodia species, and the culture morphology of Neofusicoccum species resembled that of Lasiodiplodia species. Plants affected by Botryosphaeriaceae species displayed similar disease symptoms but with varying levels of aggressiveness [6,20,24,25,26,27]. This increases the complexity of disease management. Notably, our study revealed genetic differences in pathogens among different infected crops. It is essential to consider these genetic differences when developing disease management strategies.
The intraspecific variation in ITS sequences of Lasiodiplodia was generally low, as described by Alves et al. (2008) [83]. Conversely, TEF1 sequences exhibited relatively high intraspecific variation. This makes it a suitable marker for identifying different Lasiodiplodia species except for L. hormozganensis, which could only be clearly identified in the TUB2 gene segment. Different Lasiodiplodia species showed varying levels of nucleotide diversity across different sequence data. L. rubropurpurea had the highest diversity in TEF1 and four-gene fragment data, L. iranensis in TUB2 and SSU, and L. brasiliensis in ITS. Surprisingly, the most widespread L. theobromae did not display the highest diversity in any of the examined sequence data. The haplotype diversity and nucleotide diversity values of L. theobromae were similar to previous studies [84]. The high genetic diversity of Lasiodiplodia species in Taiwan may indicate a strong evolutionary potential and long-standing possibilities. Furthermore, the high haplotype and nucleotide diversity can be attributed to a secondary contact between differentiated lineages or a lack of ancient population bottleneck or founder effect. Similarly, high genetic diversity can be attributed to a large population maintained over evolutionary time due to habitat stability [85,86].

4.2. Phylogenetic Relationships and Species Delimitation within the Lasiodiplodia Genus

Phylogenetic reconstructions revealed that L. iranensis, L. brasiliensis, and L. theobromae had the closest phylogenetic relationship. Further analyses using ABGD, ASAP, and STRUCTURE showed that L. brasiliensis and L. theobromae were more closely related. The close phylogenetic relationship between L. brasiliensis and L. theobromae agrees with other phylogenetic studies [26,87,88,89,90,91,92,93,94,95]. The analysis of MP, ML, and BI trees showed that L. pseudotheobroma had the closest relationship with L. hormozganensis, while L. iranensis was closely related to L. brasiliensis and L. theobromae. This pattern was consistent with some previous phylogenetic studies [18,26,89,91,92,96] but contrary to other studies [30,93,95,97].
It is speculated that the discrepancies in phylogenetic relationship patterns may be due to the differences in the number and types of Lasiodiplodia species included in phylogenetic analyses of different studies. This indicates that the lack of comprehensive sampling of genetic diversity can affect the construction of phylogenetic relationships for the genus Lasiodiplodia. Insufficient sampling and too few gene analyses may cause discrepancies in phylogenetic relationship patterns. Therefore, it is essential to conduct extensive sampling of Lasiodiplodia species and use different genetic markers to examine phylogeny, genetic diversity, and genetic structure, which can help to solve the uncertain taxonomic status of this complex group. Furthermore, given the close relationship among Lasiodiplodia species, incomplete lineage sorting and introgression may pose problems, resulting in false signals and turbulence in species discrimination and phylogenetic relationship patterns. This speculation is supported by the inconsistent results of the gene trees based on different gene fragments in our study. The individual gene genealogies and combined dataset displayed inconsistent phylogenetic patterns, especially the relationship among L. pseudotheobromae, L. hormozganensis, and L. iranensis species. These observed incongruences confirm that the loci might involve distinct evolutionary histories [98]. The inconsistency of the gene genealogies was a signal that indicated the existence of incomplete lineage sorting and introgression. Other previous studies also mentioned the inconsistency of the gene genealogies of the Lasiodiplodia species [30,89]. The construction of the phylogenetic relationships of the most recently diverged species is challenging, as incomplete lineage sorting predominates at shallow time depths. The difficulties arising from incomplete lineage sorting have been extensively described [99,100,101,102]. The instability in constructing phylogenetic relationships also highlights the importance of using other genetic markers to clarify the relationship of each Lasiodiplodia species.
DNA sequence analysis is essential for defining species boundaries in the genus Lasiodiplodia. However, discrepancies between phylogenetic loci have made it challenging to delimit species accurately. Applying various species delimitation methods and consistently estimating species diversity can increase credibility, and inconsistent results imply varying delineation powers of multiple methods. In the case of inconsistent findings, it is recommended that species should be designated conservatively so that they can genuinely represent evolutionary metapopulation lineages [103].
This study showed that L. rubropurpurea harboured more than one distinct group with high support based on ABGD and ASAP analyses, proving that L. rubropurpurea might be a multiple-species complex. In the phylogenetic analysis of the combined four-loci dataset, L. brasiliensis was found to be a separate group from L. theobromae, but with low support. ABGD and ASAP analyses and structure-based clustering did not provide evidence for L. brasiliensis as a stable species. The original identification report for L. brasiliensis also lacked strong support for its classification, with overlapping morphological characteristics with L. theobromae [104,105]. The high-haplotype and low-nucleotide diversity in L. brasiliensis and L. theobromae demonstrate that this group should be recognized as a distinct lineage rather than a single species. Previous studies identified L. brasiliensis as a distinct species based on concatenating a few genes [104] without examining incongruences between gene genealogies. This study suggests that L. brasiliensis is mainly attributed to the intraspecific variability in L. theobromae, causing the clade to be incorrectly recognized as a unique lineage.

4.3. Signs of Population Expansion, Subdivision, and Cryptic Sex in Lasiodiplodia Species

Lasiodiplodia theobromae exhibited significant negative Tajima’s D and Fu and Li’s D* values, which may indicate either positive selection (selective sweeps) or a population expansion. The presence of recombination suggested that this species complex might have recently expanded by producing many offspring. Furthermore, the mismatch distribution analysis showed a multimodal mismatch frequency distribution with nonsignificant values in all the Lasiodiplodia species, suggesting the population has experienced a recent demographic expansion that followed a decrease in population size due to the subdivisions of each Lasiodiplodia species. This subdivision was also supported by the presence of host-associated differentiation in other genetic analyses.
The sexual structure of Lasiodiplodia species has rarely been observed in nature, and only a few species have had their sexual stages described [8,10,11,12,13]. These species are generally considered to reproduce primarily through asexual reproduction mainly. However, cryptic sex evidence could be inferred from the phylogenetic tree pattern, proving that some species had long been considered asexual but underwent cryptic sex [106,107,108]. For sexual fungi, the phylogenetic tree of combined multigene sequence data was expected to be poorly resolved compared with the respective gene tree since each gene has a different evolutionary history and presents different topologies due to the recombination of sexual fungi. However, a branch with high support in the combined phylogenetic tree indicated genetic isolation [74]. Most ascomycetes have both sexual and asexual reproductive systems, and wholly cloned fungi were rare. Even in species whose sexual stages were unknown, molecular markers could often reveal a certain degree of recombination [106,107,109]. This study analyzed the minimum number of recombination events (RM) and showed that Lasiodiplodia species presented cryptic recombination events, even though the values were not high, indicating the possibility of cryptic sex reproduction.

4.4. Intraspecies Variations and Host-Associated Genetic Differentiation

The study found that multiple isolates of the L. theobromae species were separated into diverse groups with low bootstrap values. The fixation index also suggested that the Lasiodiplodia species presented significant genetic differentiation within the species level despite the low genetic variation. The FCT was significantly higher than FSC, indicating a strong population genetic structure at the group scale [110]. This aspect might imply that the present cryptic species or genetic structure in L. theobromae has not yet been discovered due to a few samples used in previous studies. Other studies have also presented a similar state that the L. theobromae clade could not form a single group with low posterior probability support among internal branches [6,90]. It indicated a considerable intraspecific diversity and might hide several cryptic species in L. theobromae [18,19,22,83,111,112,113,114].
Fungi often had descriptions of cryptic species or host races. With the development of multilocus phylogenetic analysis, many cryptic species of Lasiodiplodia have been discovered and defined [18,22,111,114,115]. This study’s phylogenetic trees and genetic differentiation analysis illustrated that L. theobromae and other Lasiodiplodia species revealed intraspecies variations related to the host differences. Different host species had a robust disruptive selection, and these systems continue to respond in coevolutionary dynamics. The disruptive selection caused by host variation can drive the parasite population to differentiate, even in symbiotics, and yield new host races or sibling species. This situation is easy to find in fungi that are primarily asexual [116,117]. Genetic differentiation and specialists on one or a few related hosts of generalist fungal pathogen have been reported in the Botryosphaeriaceae [25,32]. This study demonstrated that the L. theobromae complex is an ongoing evolutionary lineage and had recently diverged into unique clades, such as L. brasiliensis, and genetic groups presented a host-association genetic differentiation pattern. The findings of this study validated the inferences of Slippers et al. (2013) and De Wet et al. (2008) studies.

5. Conclusions

This study examined the genetic diversity and cryptic species structure of Lasiodiplodia fungi that infect fruit trees in Taiwan. The results showed various species of Lasiodiplodia present in fruit crops, often coinfecting with other Botryosphaeriaceae species. The phylogenetic diversity of Lasiodiplodia in Taiwan was underestimated, and the inconsistent phylogeny of Lasiodiplodia species indicated incomplete lineage sorting and introgression. The study also identified L. rubropurpurea as a multiple-species complex and did not support that L. brasiliensis was an excellent species delineation. The study suggested that the species identification in Lasiodiplodia had been largely overestimated due to the lack of integrated and accurate species delineation analysis for such a genus with complex evolutionary patterns and high intraspecific variability.
Host-associated differentiation was also observed, with some Lasiodiplodia species exhibiting high specificity towards certain host plants. The study detected evidence of recent sudden population growth and cryptic sex reproduction in Lasiodiplodia species. Although Lasiodiplodia species, especially L. theobromae, caused sporadic fruit tree diseases in Taiwan, and pesticides usually had inhibitory effects, this study denoted that some Lasiodiplodia species had a high evolutionary capacity. Therefore, future pesticide control experiments should take note of this. Overall, this study provides new insights into the genetic diversity and taxonomy of Lasiodiplodia fungi infecting fruit trees in Taiwan. It highlights the importance of using multiple gene regions for species delimitation and that can aid the development of Lasiodiplodia species management strategies in Taiwan that emphasize the importance of monitoring different hosts of Lasiodiplodia species.

Supplementary Materials

The following supporting information can be downloaded at: https://www.mdpi.com/article/10.3390/jof9090950/s1, Table S1: Lists of isolate number, location, host and population code of Lasiodiplodia, Neofusicoccum and Botryosphaeria species. Bold text indicates new host records; Table S2: Estimated demographic parameters using the mismatch distribution analysis of Lasiodiplodia species; Table S3: List of pairwise genetic distance values (FST) among Lasiodiplodia species based on sequence data; Table S4: List of pairwise genetic distance values (FST) values among different host species of Lasiodiplodia species based on sequence data. The grey area represents FST values among different host species within the same species. Note: [Species code] LTH: L. theobromae; LBR: L. brasiliensis; LHO: L. hormozganensis; LPSE: L. pseudotheobromae; LRU: L. rubropurpurea; LIR: L. iranensis. [Host species code] SS: Syzygium samarangense (wax apple); PG: Psidium guajava (guava); MI: Mangifera indica (mango); CP: Carica papaya (papaya); AS: Annona squamosa (sugar apple); TC: Theobroma cacao (cocoa); MB: Musa basjoo (banana); Figure S1: Lasiodiplodia and Neofusicoccum, species colony morphology, grew on PDA after four weeks at 25 °C; Figure S2: The average isolation frequencies (%) belonging to the Botryosphaeriaceae family in wax apple, guava, and mango hosts. The data presented show the mean ± standard error. The significance level was determined using one-way ANOVA and Tukey simultaneous tests to compare the means. p < 0.01 indicates statistical significance. Species codes: LTH: L. theobromae; LBR: L. brasiliensis; LHO: L. hormozganensis; LPSE: L. pseudotheobromae; LRU: L. rubropurpurea; LIR: L. iranensis; NM: N. mangiferae; NP: Neofusicoccum parvum; BR: Botryosphaeria ramose; Figure S3: The phylogenetic relationships of the Lasiodiplodia and Neofusicoccum species isolated from fruit plants in Taiwan were constructed based on ITS sequence data and integration with the NCBI database. Bootstrap values by the Neighbor-Joining method were above branches; Figure S4: The phylogenetic relationships of the Lasiodiplodia and Neofusicoccum species isolated from fruit plants in Taiwan were constructed based on SSU sequence data and integration with the NCBI database. Bootstrap values by the Neighbor-Joining method were above branches; Figure S5: The phylogenetic relationships of the Lasiodiplodia and Neofusicoccum species isolated from fruit plants in Taiwan were constructed based on TEF1 sequence data and integration with the NCBI database. Bootstrap values by the Neighbor-Joining method were above branches; Figure S6: The phylogenetic relationships of the Lasiodiplodia and Neofusicoccum species isolated from fruit plants in Taiwan were constructed based on TUB2 sequence data and integration with the NCBI database. Bootstrap values by the Neighbor-Joining method were above branches; Figure S7: Automatic Barcode Gap Discovery (ABGD) results presented the number of partitions obtained in each prior threshold for (A), including six Lasiodiplodia, two Neofusicoccum, and one Botryosphaeria species. (B) included six Lasiodiplodia species; Figure S8: Mismatch distribution analysis in Lasiodiplodia species using sequence data from combined four-loci. The X-axis displays the observed and expected pairwise differences in nucleotides, while the Y-axis displays their frequencies; Figure S9: The number of groups K was detected using the delta K values and mean LnP(K) (mean log-likelihood values) by STRUCTURE for six Lasiodiplodia species based on DNA sequence data.

Author Contributions

Conceptualization, Y.-Z.K., M.-N.T. and Y.-C.C.; methodology, Y.-Z.K., W.K.L., M.-S.S. and Y.-C.C.; software, Y.-Z.K. and Y.-C.C.; validation, Y.-Z.K., H.-C.S. and Y.-C.C.; formal analysis, Y.-Z.K., W.K.L. and H.-C.S.; investigation, Y.-Z.K., H.-C.S., M.-S.S. and Y.-C.C.; resources, Y.-Z.K., M.-N.T. and Y.-C.C.; data curation, Y.-Z.K. and Y.-C.C.; writing—original draft preparation, Y.-Z.K.; writing—review and editing, Y.-Z.K., M.-S.S. and Y.-C.C.; visualization, Y.-Z.K., M.-N.T., M.-S.S. and Y.-C.C.; supervision, M.-N.T., M.-S.S. and Y.-C.C.; project administration, Y.-Z.K., M.-N.T. and Y.-C.C.; funding acquisition, Y.-C.C. All authors have read and agreed to the published version of the manuscript.

Funding

This research was funded by the National Science and Technology Council, Taiwan, grant number MOST 108-2621-B-110-003-MY3, MOST 109-2313-B-110-005, MOST 111-2621-B-110-001 and NSTC 112-2621-B-110-001-MY3, and by partial financing the Higher Education Sprout Project of NSYSU to Y.C.C.

Institutional Review Board Statement

Not applicable.

Informed Consent Statement

Not applicable.

Data Availability Statement

The GenBank accession numbers are as follow: OR534007-OR534219 for ITS region; OR552184–OR552396 for TEF1 region, OR534310-OR534522 for SSU region and OR551773–OR551985 for TUB2.

Acknowledgments

We thank Xiao-Lei Jin for her assistance in fungal species identification.

Conflicts of Interest

The authors declare no conflict of interest.

References

  1. Punithalingam, E. Plant diseases attributed to Botryodiplodia theobromae Pat. In Biblioteca Mycologica; J. Cramer: Berlin, Germany, 1980; p. 113. [Google Scholar]
  2. MYCOBANK Database. Available online: http://www.mycobank.org (accessed on 18 June 2023).
  3. Correia, K.C.; Silva, M.A.; de Morais, M.A., Jr.; Armengol, J.; Phillips, A.J.; Cômara, M.; Michereff, S.J. Phylogeny, distribution and pathogenicity of Lasiodiplodia species associated with dieback of table grape in the main Brazilian exporting region. Plant Pathol. 2016, 65, 92–103. [Google Scholar] [CrossRef]
  4. Savant, N.V.; Raut, S.P. Studies on symptomatology of die-back of mango stone grafts. Acta Hort. 2000, 509, 823–832. [Google Scholar] [CrossRef]
  5. Sharma, I. A note on population dynamics and etiology of die back of mango in Himachal Pradesh. New Agricult. 1993, 2, 229–230. [Google Scholar]
  6. Ali, S.S.; Asman, A.; Shao, J.; Balidion, J.F.; Strem, M.D.; Puig, A.S.; Meinhardt, L.W.; Bailey, B.A. Genome and transcriptome analysis of the latent pathogen Lasiodiplodia theobromae, an emerging threat to the cacao industry. Genome 2020, 63, 37–52. [Google Scholar] [CrossRef] [PubMed]
  7. Costa, V.D.O.; Michereff, S.J.; Martins, R.B.; Gava, C.T.; Mizubuti, E.S.G.; Câmara, M.P.S. Species of Botryosphaeriaceae associated on mango in Brazil. Eur. J. Plant Pathol. 2010, 127, 509–519. [Google Scholar] [CrossRef]
  8. Phillips, A.J.L.; Alves, A.; Abdollahzadeh, J.; Slippers, B.; Wingfield, M.J.; Groenewald, J.Z.; Crous, P.W. The Botryosphaeriaceae: Genera and species known from culture. Stud. Mycol. 2013, 76, 51–167. [Google Scholar] [CrossRef]
  9. de Silva, N.I.; Phillips, A.J.; Liu, J.-K.; Lumyong, S.; Hyde, K.D. Phylogeny and morphology of Lasiodiplodia species associated with Magnolia forest plants. Sci. Rep. 2019, 9, 14355. [Google Scholar] [CrossRef]
  10. Dou, Z.P.; He, W.; Zhang, Y. Lasiodiplodia chinensis, a new holomorphic species from China. Mycosphere 2017, 8, 521–532. [Google Scholar] [CrossRef]
  11. Tennakoon, D.S.; Phillips, A.J.L.; Phookamsak, R.; Ariyawansa, H.A.; Bahkali, A.H.; Hyde, K.D. Sexual morph of Lasiodiplodia pseudotheobromae (Botryosphaeriaceae, Botryosphaeriales, Dothideomycetes) from China. Mycosphere 2016, 7, 990–1000. [Google Scholar] [CrossRef]
  12. Trakunyingcharoen, T.; Lombard, L.; Groenewald, J.Z.; Cheewangkoon, R.; To-Anun, C.; Crous, P.W. Caulicolous Botryosphaeriales from Thailand. Pers. Mol. Phylogeny Evol. 2015, 34, 87–99. [Google Scholar] [CrossRef]
  13. Liu, J.K.; Phookamsak, R.; Doilom, M.; Wikee, S.; Li, Y.M.; Ariyawansha, H.; Boonmee, S.; Chomnunti, P.; Dai, D.Q.; Bhat, J.D. Towards a natural classification of Botryosphaeriales. Fungal Divers. 2012, 57, 149–210. [Google Scholar] [CrossRef]
  14. Wingfield, M.J.; De Beer, Z.W.; Slippers, B.; Wingfield, B.D.; Groenewald, J.Z.; Lombard, L.; Crous, P.W. One fungus, one name promotes progressive plant pathology. Mol. Plant Pathol. 2012, 13, 604–613. [Google Scholar] [CrossRef] [PubMed]
  15. Shah, M.D.; Verma, K.S.; Singh, K.; Kaur, R. Morphological, pathological and molecular variability in Botryodiplodia theobromae (Botryosphaeriaceae) isolates associated with die-back and bark canker of pear trees in Punjab, India. Genet. Mol. Res. 2010, 9, 1217–1228. [Google Scholar] [CrossRef] [PubMed]
  16. Munirah, M.; Azmi, A.; Yong, S.; Nur Ain Izzati, M. Characterization of Lasiodiplodia theobromae and L. pseudotheobromae causing fruit rot on pre-harvest mango in Malaysia. Plant Pathol. Quar. 2017, 7, 202–213. [Google Scholar] [CrossRef]
  17. Urbez-Torres, J.R.; Peduto, F.; Striegler, R.; Urrea-Romero, K.; Rupe, J.; Cartwright, R.; Gubler, W. Characterization of fungal pathogens associated with grapevine trunk diseases in Arkansas and Missouri. Fungal Dive. 2012, 52, 169–189. [Google Scholar] [CrossRef]
  18. Abdollahzadeh, J.; Javadi, A.; Goltapeh, E.M.; Zare, R.; Phillips, A.J.L. Phylogeny and morphology of four new species of Lasiodiplodia from Iran. Pers. Mol. Phylogeny Evol. 2010, 25, 1–10. [Google Scholar] [CrossRef]
  19. Ismail, A.M.; Cirvilleri, G.; Polizzi, G.; Crous, P.W.; Groenewald, J.Z.; Lombard, L. Lasiodiplodia species associated with dieback disease of mango (Mangifera indica) in Egypt. Australas. Plant Pathol. 2012, 41, 649–660. [Google Scholar] [CrossRef]
  20. Marques, M.W.; Lima, N.B.; de Morais, M.A.; Barbosa, M.A.G.; Souza, B.O.; Michereff, S.J.; Phillips, A.J.; Câmara, M.P. Species of Lasiodiplodia associated with mango in Brazil. Fungal Divers. 2013, 61, 181–193. [Google Scholar] [CrossRef]
  21. Sakalidis, M.L.; Ray, J.D.; Lanoiselet, V.; Hardy, G.E.S.; Burgess, T.I. Pathogenic Botryosphaeriaceae associated with Mangifera indica in the Kimberley region of Western Australia. Eur. J. Plant Pathol. 2011, 130, 379–391. [Google Scholar] [CrossRef]
  22. Damm, U.; Crous, P.W.; Fourie, P.H. Botryosphaeriaceae as potential pathogens of Prunus species in South Africa, with descriptions of Diplodia africana and Lasiodiplodia plurivora sp. nov. Mycologia 2007, 99, 664–680. [Google Scholar] [CrossRef]
  23. Machado, A.R.; Pinho, D.B.; Pereira, O.L. Phylogeny, identification and pathogenicity of the Botryosphaeriaceae associated with collar and root rot of the biofuel plant Jatropha curca s in Brazil, with a description of new species of Lasiodiplodia. Fungal Divers. 2014, 67, 231–247. [Google Scholar] [CrossRef]
  24. Crous, P.W.; Slippers, B.; Wingfield, M.J.; Rheeder, J.; Marasas, W.F.; Philips, A.J.; Alves, A.; Burgess, T.; Barber, P.; Groenewald, J.Z. Phylogenetic lineages in the Botryosphaeriaceae. Stud. Mycol. 2006, 55, 235–253. [Google Scholar] [CrossRef] [PubMed]
  25. De Wet, J.; Slippers, B.; Preisig, O.; Wingfield, B.D.; Wingfield, M.J. Phylogeny of the Botryosphaeriaceae reveals patterns of host association. Mol. Phylogenet. Evol. 2008, 46, 116–126. [Google Scholar] [CrossRef] [PubMed]
  26. Rodríguez-Gálvez, E.; Guerrero, P.; Barradas, C.; Crous, P.W.; Alves, A. Phylogeny and pathogenicity of Lasiodiplodia species associated with dieback of mango in Peru. Fungal Biol. 2017, 121, 452–465. [Google Scholar] [CrossRef] [PubMed]
  27. Yan, J.Y.; Xie, Y.; Zhang, W.; Wang, Y.; Liu, J.K.; Hyde, K.D.; Seem, R.C.; Zhang, G.Z.; Wang, Z.Y.; Yao, S.W. Species of Botryosphaeriaceae involved in grapevine dieback in China. Fungal Divers. 2013, 61, 221–236. [Google Scholar] [CrossRef]
  28. Lücking, R.; Aime, M.C.; Robbertse, B.; Miller, A.N.; Ariyawansa, H.A.; Aoki, T.; Cardinali, G.; Crous, P.W.; Druzhinina, I.S.; Geiser, D.M. Unambiguous identification of fungi: Where do we stand and how accurate and precise is fungal DNA barcoding? IMA Fungus 2020, 11, 14. [Google Scholar] [CrossRef]
  29. Lücking, R.; Hawksworth, D. Formal description of sequence-based voucherless Fungi: Promises and pitfalls, and how to resolve them. IMA Fungus 2018, 9, 143–165. [Google Scholar] [CrossRef] [PubMed]
  30. Cruywagen, E.M.; Slippers, B.; Roux, J.; Wingfield, M.J. Phylogenetic species recognition and hybridization in Lasiodiplodia: A case study on species from baobabs. Fungal Biol. 2017, 121, 420–436. [Google Scholar] [CrossRef] [PubMed]
  31. Hawksworth, D.L.; Lücking, R. Fungal diversity revisited: 2.2 to 3.8 million species. Microbiol. Spectr. 2017, 5, 10-1128. [Google Scholar] [CrossRef]
  32. Slippers, B.; Wingfield, M.J. Botryosphaeriaceae as endophytes and latent pathogens of woody plants: Diversity, ecology and impact. Fungal Biol. Rev. 2007, 21, 90–106. [Google Scholar] [CrossRef]
  33. Yang, T.; Groenewald, J.Z.; Cheewangkoon, R.; Jami, F.; Abdollahzadeh, J.; Lombard, L.; Crous, P.W. Families, genera, and species of Botryosphaeriales. Fungal Biol. 2016, 121, 322–346. [Google Scholar] [CrossRef] [PubMed]
  34. Wang, C.L.; Hsieh, H.Y. Occurrence and pathogenicity of stem canker of guava in Taiwan caused by Botryosphaeria rhodina. Plant Pathol. Bull. 2006, 15, 219–230. [Google Scholar]
  35. Ni, H.F.; Yang, H.R.; Chen, R.S.; Liou, R.F.; Hung, T.H. New Botryosphaeriaceae fruit rot of mango in Taiwan: Identification and pathogenicity. Bot. Stud. 2012, 53, 467–478. [Google Scholar]
  36. Wang, H.L.; Chen, P.H.; Ni, H.F.; Chen, R.S. Physiological characterization and screen of control chemicals for Lasiodiplodia theobromae of papaya. Plant Pathol. Bull. 2007, 16, 71–77. [Google Scholar]
  37. Ni, H.F.; Chuang, M.F.; Hsu, S.L.; Lai, S.Y.; Yang, H.R. Survey of Botryosphaeria spp., causal agents of postharvest disease of avocado, in Taiwan. J. Taiwan Agric. Res. 2011, 60, 157–166. [Google Scholar]
  38. Ni, H.F.; Chen, R.S.; Chang, S.F.; Yang, H.R. First report of Lasiodiplodia fruit rot of jackfruit in Taiwan. Plant Dis. 2008, 92, 1137. [Google Scholar] [CrossRef]
  39. Ko, W.H.; Wang, I.T.; Ann, P.J. Lasiodiplodia theobromae as a causal agent of kumquat dieback in Taiwan. Plant Dis. 2004, 88, 1383. [Google Scholar] [CrossRef]
  40. Patrice, N.D.J.; Alain, H.; Nourou, K.N.A.; Bertrand, M.S.; Christine, A.D.B.; Brice, T.T.D.; Zachee, A. Dieback of cashew (Anacardium occidentale) in Cameroon. Pakistan J. Phytopathol. 2020, 32, 231–239. [Google Scholar] [CrossRef]
  41. Huang, C.; Chang, Y.; Chao, J.; Huang, J. Fruit rot of passion fruit caused by Lasiodiplodia theobromae in Taiwan. J. Taiwan Agric. Res. 2019, 68, 333–340. [Google Scholar]
  42. Guo, Z. Stem blight of mung bean caused by Botryodiplodia theobromae. Plant Prot. Bull. 1998, 40, 315–327. [Google Scholar]
  43. Su, J.F.; Ann, P.J.; Yang, C.W.; Hsu, Z.H.; Chern, L.L.; Tsay, H.C.; Huang, C.C.; Hsieh, T.F. Black rot of braided seedlings of Malabar chestnut caused by Lasiodiplodia theobromae in Taiwan. Plant Pathol. Bull. 2014, 23, 263–269. [Google Scholar]
  44. R Core Team. R: A Language and Environment for Statistical Computing; R Foundation for Statistical Computing: Vienna, Austria, 2017; Available online: https://www.R-project.org (accessed on 18 June 2023).
  45. Villanueva, R.A.M.; Chen, Z.J. ggplot2: Elegant Graphics for Data Analysis (2nd ed.). Meas. Interdiscip. Res. Perspect. 2019, 17, 160–167. [Google Scholar] [CrossRef]
  46. White, T.J.; Bruns, T.; Lee, S.; Taylor, J. Amplification and direct sequencing of fungal ribosomal RNA genes for phylogenetics. PCR Protoc. A Guide Methods Appl. 1990, 18, 315–322. [Google Scholar]
  47. Phillips, A.; Alves, A.; Correia, A.; Luque, J. Two new species of Botryosphaeria with brown, 1-septate ascospores and Dothiorella anamorphs. Mycologia 2005, 97, 513–529. [Google Scholar] [CrossRef]
  48. Glass, N.L.; Donaldson, G.C. Development of primer sets designed for use with the PCR to amplify conserved genes from filamentous ascomycetes. Appl. Environ. Microbiol. 1995, 61, 1323–1330. [Google Scholar] [CrossRef] [PubMed]
  49. Kumar, S.; Stecher, G.; Li, M.; Knyaz, C.; Tamura, K. MEGA X: Molecular evolutionary genetics analysis across computing platforms. Mol. Biol. Evol. 2018, 35, 1547–1549. [Google Scholar] [CrossRef]
  50. Darriba, D.; Taboada, G.L.; Doallo, R.; Posada, D. jModelTest 2: More models, new heuristics and parallel computing. Nat. Methods. 2012, 9, 772. [Google Scholar] [CrossRef]
  51. Kimura, M. A simple method for estimating evolutionary rates of base substitutions through comparative studies of nucleotide sequences. J. Mol. Evol. 1980, 16, 111–120. [Google Scholar] [CrossRef]
  52. Felsenstein, J. PHYLIP (Phylogeny Inference Package) Version 3.6. Distributed by the Author; Department of Genome Sciences, University of Washington: Seattle, WA, USA, 2005. [Google Scholar]
  53. Stamatakis, A. RAxML version 8: A tool for phylogenetic analysis and post-analysis of large phylogenies. Bioinformatics 2014, 30, 1312–1313. [Google Scholar] [CrossRef]
  54. Ronquist, F.; Teslenko, M.; Van Der Mark, P.; Ayres, D.L.; Darling, A.; Höhna, S.; Larget, B.; Liu, L.; Suchard, M.A.; Huelsenbeck, J.P. MrBayes 3.2: Efficient Bayesian phylogenetic inference and model choice across a large model space. Syst. Biol. 2012, 61, 539–542. [Google Scholar] [CrossRef]
  55. Drummond, A.J.; Rambaut, A. BEAST: Bayesian evolutionary analysis by sampling trees. BMC Evol. Biol. 2007, 7, 214. [Google Scholar] [CrossRef] [PubMed]
  56. Rambaut, A. FigTree v1.4.4. Available online: http://tree.bio.ed.ac.uk/software/figtree (accessed on 18 June 2023).
  57. Puillandre, N.; Brouillet, S.; Achaz, G. ASAP: Assemble species by automatic partitioning. Mol. Ecol. Resour. 2021, 21, 609–620. [Google Scholar] [CrossRef]
  58. Puillandre, N.; Lambert, A.; Brouillet, S.; Achaz, G. ABGD, Automatic Barcode Gap Discovery for primary species delimitation. Mol. Ecol. 2012, 21, 1864–1877. [Google Scholar] [CrossRef] [PubMed]
  59. Rozas, J.; Ferrer-Mata, A.; Sánchez-DelBarrio, J.C.; Guirao-Rico, S.; Librado, P.; Ramos-Onsins, S.E.; Sánchez-Gracia, A. DnaSP 6: DNA sequence polymorphism analysis of large data sets. Mol. Biol. Evol. 2017, 34, 3299–3302. [Google Scholar] [CrossRef]
  60. Nei, M. Molecular Evolutionary Genetics; Colombia University Press: New York, NY, USA, 1987. [Google Scholar]
  61. Hudson, R.R.; Kaplan, N.L. Statistical properties of the number of recombination events in the history of a sample of DNA sequences. Genetics 1985, 111, 147–164. [Google Scholar] [CrossRef] [PubMed]
  62. Kelly, J.K. A test of neutrality based on interlocus associations. Genetics 1997, 146, 1197–1206. [Google Scholar] [CrossRef]
  63. Hill, W.G.; Robertson, A. Linkage disequilibrium in finite populations. Theor. Appl. Genet. 1968, 38, 226–231. [Google Scholar] [CrossRef]
  64. Pennings, P.S.; Hermisson, J. Soft sweeps III: The signature of positive selection from recurrent mutation. PLoS Genet. 2006, 2, e186. [Google Scholar] [CrossRef]
  65. Rozas, J.; Gullaud, M.; Blandin, G.; Aguadé, M. DNA variation at the rp49 gene region of Drosophila simulans: Evolutionary inferences from an unusual haplotype structure. Genetics 2001, 158, 1147–1155. [Google Scholar] [CrossRef]
  66. Tajima, F. Statistical method for testing the neutral mutation hypothesis by DNA polymorphism. Genetics 1989, 123, 585–595. [Google Scholar] [CrossRef]
  67. Fu, Y.-X.; Li, W.-H. Statistical tests of neutrality of mutations. Genetics 1993, 133, 693–709. [Google Scholar] [CrossRef] [PubMed]
  68. Schneider, S.; Excoffier, L. Estimation of past demographic parameters from the distribution of pairwise differences when the mutation rates vary among sites: Application to human mitochondrial DNA. Genetics 1999, 152, 1079–1089. [Google Scholar] [CrossRef] [PubMed]
  69. Harpending, H.C. Signature of ancient population growth in a low-resolution mitochondrial DNA mismatch distribution. Hum. Biol. 1994, 66, 591–600. [Google Scholar] [PubMed]
  70. Rogers, A.R.; Harpending, H. Population growth makes waves in the distribution of pairwise genetic differences. Mol. Biol. Evol. 1992, 9, 552–569. [Google Scholar]
  71. Ray, N.; Currat, M.; Excoffier, L. Intra-deme molecular diversity in spatially expanding populations. Mol. Biol. Evol. 2003, 20, 76–86. [Google Scholar] [CrossRef]
  72. Excoffier, L.; Lischer, H.E. Arlequin suite ver 3.5: A new series of programs to perform population genetics analyses under Linux and Windows. Mol. Ecol. Resour. 2010, 10, 564–567. [Google Scholar] [CrossRef]
  73. Wright, S. Genetical structure of populations. Nature 1950, 166, 247–249. [Google Scholar] [CrossRef]
  74. Taylor, J.W.; Geiser, D.M.; Burt, A.; Koufopanou, V. The evolutionary biology and population genetics underlying fungal strain typing. Clin. Microbiol. Rev. 1999, 12, 126–146. [Google Scholar] [CrossRef]
  75. Wright, S. Evolution in mendelian populations. Genetics 1931, 16, 97–159. [Google Scholar] [CrossRef]
  76. Pritchard, J.K.; Stephens, M.; Donnelly, P. Inference of population structure using multilocus genotype data. Genetics 2000, 155, 945–959. [Google Scholar] [CrossRef]
  77. Evanno, G.; Regnaut, S.; Goudet, J. Detecting the number of clusters of individuals using the software STRUCTURE: A simulation study. Mol. Ecol. 2005, 14, 2611–2620. [Google Scholar] [CrossRef] [PubMed]
  78. Earl, D.A.; VonHoldt, B.M. STRUCTURE HARVESTER: A website and program for visualizing STRUCTURE output and implementing the Evanno method. Conserv. Genet. Resour. 2012, 4, 359–361. [Google Scholar] [CrossRef]
  79. Jakobsson, M.; Rosenberg, N.A. CLUMPP: A cluster matching and permutation program for dealing with label switching and multimodality in analysis of population structure. Bioinformatics 2007, 23, 1801–1806. [Google Scholar] [CrossRef] [PubMed]
  80. Francis, R.M. pophelper: An R package and web app to analyze and visualize population structure. Mol. Ecol. Resour. 2017, 17, 27–32. [Google Scholar] [CrossRef]
  81. Ni, H.F.; Liou, R.F.; Hung, T.H.; Chen, R.S.; Yang, H.R. First report of fruit rot disease of mango caused by Botryosphaeria dothidea and Neofusicoccum mangiferae in Taiwan. Plant Dis. 2010, 94, 128. [Google Scholar] [CrossRef]
  82. Slippers, B.; Johnson, G.I.; Crous, P.W.; Coutinho, T.A.; Wingfield, B.D.; Wingfield, M.J. Phylogenetic and morphological re-evaluation of the Botryosphaeria species causing diseases of Mangifera indica. Mycologia 2005, 97, 99–110. [Google Scholar] [CrossRef]
  83. Alves, A.; Crous, P.W.; Correia, A.; Phillips, A. Morphological and molecular data reveal cryptic speciation in Lasiodiplodia theobromae. Fungal Divers. 2008, 28, 1–13. [Google Scholar]
  84. Santos, P.H.D.; Carvalho, B.M.; Aguiar, K.P.; Aredes, F.A.S.; Poltronieri, T.P.S.; Vivas, J.M.S.; Dias, V.M.; Bezerra, G.A.; Pinho, D.B.; Pereira, M.G. Phylogeography and population structure analysis reveals diversity by mutations in Lasiodiplodia theobromae with distinct sources of selection. Genet. Mol. Res. 2017, 16, 1–14. [Google Scholar] [CrossRef]
  85. Grant, W.A.S.; Bowen, B.W. Shallow population histories in deep evolutionary lineages of marine fishes: Insights from sardines and anchovies and lessons for conservation. J. Hered. 1998, 89, 415–426. [Google Scholar] [CrossRef]
  86. Hobbs, J.-P.A.; Van Herwerden, L.; Jerry, D.R.; Jones, G.P.; Munday, P.L. High genetic diversity in geographically remote populations of endemic and widespread coral reef angelfishes (genus: Centropyge). Diversity 2013, 5, 39–50. [Google Scholar] [CrossRef]
  87. Slippers, B.; Crous, P.W.; Jami, F.; Groenewald, J.Z.; Wingfield, M.J. Diversity in the Botryosphaeriales: Looking back, looking forward. Fungal Biol. 2017, 121, 307–321. [Google Scholar] [CrossRef] [PubMed]
  88. Wang, Y.; Lin, S.; Zhao, L.; Sun, X.; He, W.; Zhang, Y.; Dai, Y.-C. Lasiodiplodia spp. associated with Aquilaria crassna in Laos. Mycol. Prog. 2019, 18, 683–701. [Google Scholar] [CrossRef]
  89. Custódio, F.A.; Machado, A.R.; Soares, D.J.; Pereira, O.L. Lasiodiplodia hormozganensis causing basal stem rot on Ricinus communis in Brazil. Australas. Plant Dis. Notes 2018, 13, 25. [Google Scholar] [CrossRef]
  90. Coutinho, I.B.L.; Freire, F.C.O.; Lima, C.S.; Lima, J.S.; Gonçalves, F.J.T.; Machado, A.R.; Silva, A.M.S.; Cardoso, J.E. Diversity of genus Lasiodiplodia associated with perennial tropical fruit plants in northeastern Brazil. Plant Pathol. 2017, 66, 90–104. [Google Scholar] [CrossRef]
  91. Dissanayake, A.J.; Phillips, A.J.L.; Li, X.H.; Hyde, K.D. Botryosphaeriaceae: Current status of genera and species. Mycosphere 2016, 7, 1001–1073. [Google Scholar] [CrossRef]
  92. Hyde, K.D.; Tennakoon, D.S.; Jeewon, R.; Bhat, D.J.; Maharachchikumbura, S.S.N.; Rossi, W.; Leonardi, M.; Lee, H.B.; Mun, H.Y.; Houbraken, J. Fungal diversity notes 1036–1150: Taxonomic and phylogenetic contributions on genera and species of fungal taxa. Fungal Divers. 2019, 96, 1–242. [Google Scholar] [CrossRef]
  93. Jayasiri, S.C.; Hyde, K.D.; Jones, E.B.G.; McKenzie, E.H.C.; Jeewon, R.; Phillips, A.J.L.; Bhat, D.J.; Wanasinghe, D.N.; Liu, J.K.; Lu, Y.Z. Diversity, morphology and molecular phylogeny of Dothideomycetes on decaying wild seed pods and fruits. Mycosphere 2019, 10, 1–186. [Google Scholar] [CrossRef]
  94. Meng, C.R.; Zhang, Q.; Yang, Z.F.; Geng, K.; Zeng, X.Y.; Chethana, K.T.; Wang, Y. Lasiodiplodia syzygii sp. nov.(Botryosphaeriaceae) causing post-harvest water-soaked brown lesions on Syzygium samarangense in Chiang Rai, Thailand. Biodivers. Data J. 2021, 9, e60604. [Google Scholar] [CrossRef]
  95. Zhang, W.; Groenewald, J.Z.; Lombard, L.; Schumacher, R.K.; Phillips, A.J.L.; Crous, P.W. Evaluating species in Botryosphaeriales. Pers. Mol. Phylogeny Evol. Fungi 2021, 46, 63–115. [Google Scholar] [CrossRef]
  96. Trakunyingcharoen, T.; Cheewangkoon, R.; To-anun, C. Phylogeny and pathogenicity of fungal species in the family Botryosphaeriaceae associated with mango (Mangifera indica) in Thailand. Int. J. Agric. Technol. 2013, 9, 1535–1543. [Google Scholar]
  97. van der Linde, J.A.; Six, D.L.; Wingfield, M.J.; Roux, J. Lasiodiplodia species associated with dying Euphorbia ingens in South Africa. South. For. 2011, 73, 165–173. [Google Scholar] [CrossRef]
  98. Kubatko, L.S.; Degnan, J.H. Inconsistency of phylogenetic estimates from concatenated data under coalescence. Syst. Biol. 2007, 56, 17–24. [Google Scholar] [CrossRef] [PubMed]
  99. Avise, J.C.; Shapira, J.F.; Daniel, S.W.; Aquadro, C.F.; Lansman, R.A. Mitochondrial DNA differentiation during the speciation process in Peromyscus. Mol. Biol. Evol. 1983, 1, 38–56. [Google Scholar] [PubMed]
  100. Maddison, W.P.; Knowles, L.L. Inferring phylogeny despite incomplete lineage sorting. Syst. Biol. 2006, 55, 21–30. [Google Scholar] [CrossRef] [PubMed]
  101. Pamilo, P.; Nei, M. Relationships between gene trees and species trees. Mol. Biol. Evol. 1988, 5, 568–583. [Google Scholar]
  102. Rosenberg, N.A. The probability of topological concordance of gene trees and species trees. Theor. Popul. Biol. 2002, 61, 225–247. [Google Scholar] [CrossRef] [PubMed]
  103. Haelewaters, D.; De Kesel, A.; Pfister, D.H. Integrative taxonomy reveals hidden species within a common fungal parasite of ladybirds. Sci. Rep. 2018, 8, 15966. [Google Scholar] [CrossRef]
  104. Netto, M.S.B.; Assunção, I.P.; Lima, G.S.A.; Marques, M.W.; Lima, W.G.; Monteiro, J.H.A.; de Queiroz Balbino, V.; Michereff, S.J.; Phillips, A.J.L.; Câmara, M.P.S. Species of Lasiodiplodia associated with papaya stem-end rot in Brazil. Fungal Divers. 2014, 67, 127–141. [Google Scholar] [CrossRef]
  105. Netto, M.S.B.; Lima, W.G.; Correia, K.C.; Da Silva, C.F.B.; Thon, M.; Martins, R.B.; Miller, R.N.G.; Michereff, S.J.; Câmara, M.P.S. Analysis of phylogeny, distribution, and pathogenicity of Botryosphaeriaceae species associated with gummosis of Anacardium in Brazil, with a new species of Lasiodiplodia. Fungal Biol. 2017, 121, 437–451. [Google Scholar] [CrossRef]
  106. Burt, A.; Carter, D.A.; Koenig, G.L.; White, T.J.; Taylor, J.W. Molecular markers reveal cryptic sex in the human pathogen Coccidioides immitis. Proc. Natl. Acad. Sci. USA 1996, 93, 770–773. [Google Scholar] [CrossRef]
  107. Lee, S.C.; Ni, M.; Li, W.; Shertz, C.; Heitman, J. The evolution of sex: A perspective from the fungal kingdom. Microbiol. Mol. Biol. Rev. 2010, 74, 298–340. [Google Scholar] [CrossRef]
  108. Schurko, A.M.; Neiman, M.; Logsdon, J.M. Signs of sex: What we know and how we know it. Trends. Ecol. Evol. 2009, 24, 208–217. [Google Scholar] [CrossRef] [PubMed]
  109. Billiard, S.; López-Villavicencio, M.; Hood, M.E.; Giraud, T. Sex, outcrossing and mating types: Unsolved questions in fungi and beyond. J. Evol. Biol. 2012, 25, 1020–1038. [Google Scholar] [CrossRef] [PubMed]
  110. Boyd, O.F.; Philips, T.K.; Johnson, J.R.; Nixon, J.J. Geographically structured genetic diversity in the cave beetle Darlingtonea kentuckensis Valentine, 1952 (Coleoptera, Carabidae, Trechini, Trechina). Subterr. Biol. 2020, 34, 1–23. [Google Scholar] [CrossRef]
  111. Burgess, T.I.; Barber, P.A.; Mohali, S.; Pegg, G.; de Beer, W.; Wingfield, M.J. Three new Lasiodiplodia spp. from the tropics, recognized based on DNA sequence comparisons and morphology. Mycologia 2006, 98, 423–435. [Google Scholar] [CrossRef] [PubMed]
  112. Linaldeddu, B.T.; Deidda, A.; Scanu, B.; Franceschini, A.; Serra, S.; Berraf-Tebbal, A.; Zouaoui Boutiti, M.; Ben Jamâa, M.L.; Phillips, A.J.L. Diversity of Botryosphaeriaceae species associated with grapevine and other woody hosts in Italy, Algeria and Tunisia, with descriptions of Lasiodiplodia exigua and Lasiodiplodia mediterranea sp. nov. Fungal Divers. 2015, 71, 201–214. [Google Scholar] [CrossRef]
  113. Pavlic, D.; Slippers, B.; Coutinho, T.A.; Gryzenhout, M.; Wingfield, M.J. Lasiodiplodia gonubiensis sp. nov., a new Botryosphaeria anamorph from native Syzygium cordatum in South Africa. Stud. Myco. 2004, 50, 313–322. [Google Scholar]
  114. Pavlic, D.; Wingfield, M.J.; Barber, P.; Slippers, B.; Hardy, G.E.S.J.; Burgess, T.I. Seven new species of the Botryosphaeriaceae from baobab and other native trees in Western Australia. Mycologia 2008, 100, 851–866. [Google Scholar] [CrossRef]
  115. Begoude, B.A.D.; Slippers, B.; Wingfield, M.J.; Roux, J. Botryosphaeriaceae associated with Terminalia catappa in cameroon, south africa and madagascar. Mycol. Prog. 2010, 9, 101–123. [Google Scholar] [CrossRef]
  116. Kawecki, T.J. Red queen meets Santa Rosalia: Arms races and the evolution of host specialization in organisms with parasitic lifestyles. Am. Nat. 1998, 152, 635–651. [Google Scholar] [CrossRef]
  117. Giraud, T.; Enjalbert, J.; Fournier, E.; Delmotte, F.; Dutech, C. Population genetics of fungal diseases of plants. Parasite 2008, 15, 449–454. [Google Scholar] [CrossRef] [PubMed]
Figure 1. Disease symptoms of fruit rot and stem canker associated with Botryosphaeriaceae infection on different host species. (A) Fruit rot symptom on wax apple infected with L. brasiliensis. (B,C) Fruit rot symptom on wax apple infected with L. theobromae. (D) Fruit rot symptom on wax apple infected with Neofusicoccum parvum. (E) Canker symptom and internal tissue necrosis on the stem of guava infected with L. theobromae. (F) Linear canker symptom on the stem of guava infected with L. theobromae. (G) L. theobromae causes the charcoal pod rot of cocoa. (H) The symptom of fruit rot on mango infected with L. theobromae.
Jof 09 00950 g001
Figure 2. Micrographs of conidial morphology and morphological culture structure on PDA. (A) Brown immature conidia of L. brasiliensis. Scale bar = 50 µm. (B) Pycnidia of L. hormozganensis were releasing immature conidia. Scale bar = 50 µm. (C) Immature conidia of L. hormozganensis. Scale bar = 50 µm. (D,E) Sporulation of L. hormozganensis and L. pseudotheobromae on PDA on the four-week colony. (F) Mature conidia of L. theobromae with dark-brown, one-septate with conspicuous vertical striations. Scale bar = 50 µm. (G) The appearance of pycnidia of L. theobromae on the surface of PDA with rich sporulation.
Jof 09 00950 g002
Figure 3. Isolation frequency (IF; %) of fungal species of the family Botryosphaeriaceae isolated from symptomatic fruit plants in Taiwan.
Jof 09 00950 g003
Figure 4. (A) The Phylogenetic tree was constructed using Maximum Parsimony of the Lasiodiplodia and Neofusicoccum species isolated from different fruit species in Taiwan based on DNA sequence data for four loci (SSU, ITS, TEF1, TUB2). Branches were marked with the Maximum Parsimony bootstrap values, Maximum Likelihood bootstrap values, Neighbor-Joining bootstrap values, and Bayesian posterior probabilities, respectively. The red spots indicated that the sample was isolated from the stem. (B) ABGD results included six Lasiodiplodia, two Neofusicoccum, and one Botryosphaeria species. (C) ABGD results, including six Lasiodiplodia species. (D) ASAP results included six Lasiodiplodia species. [The host species codes] SS: Syzygium samarangense (wax apple); PG: Psidium guajava (guava); MI: Mangifera indica (mango); CP: Carica papaya (papaya); AS: Annona squamosa (sugar apple); TC: Theobroma cacao (cocoa); MB: Musa basjoo (banana); CD: Cordia dichotoma; AL: Alpinia; ST: Syzygium taiwanicum. The nodes were labeled with numbers (1–14) encircled by circles.
Jof 09 00950 g004
Figure 5. Bar plots for the genetic structure of Lasiodiplodia species based on DNA sequence data generated by STRUCTURE. A vertical colour line represents each individual, the same colour indicates that the individual belongs to the same cluster, and black lines separate different species. [Species code] LTH: L. theobromae; LBR: L. brasiliensis; LHO: L. hormozganensis; LPSE: L. pseudotheobromae; LRU: L. rubropurpurea; LIR: L. iranensis. Refer to Table 1 for detailed information on population codes.
Jof 09 00950 g005
Table 1. Lists of Lasiodiplodia species isolated in Taiwan. Hosts and numbers of isolates were listed for each species. Bold text indicates new host records. Common name for each species is as follows: Syzygium samarangense (wax apple), Psidium guajava (guava), Mangifera indica (mango), Carica papaya (papaya), Annona squamosa (sugar apple), Theobroma cacao (cocoa), and Musa spp. (banana). The detailed locations, isolates and population codes are listed in Table S1.
TaxonHostNo. of Isolates
(No. of Locations)
Lasiodiplodia theobromaeSyzygium samarangense (wax apple) 15 (4)
Psidium guajava (guava)12 (4)
Mangifera indica (mango)16 (4)
Carica papaya (papaya)8 (2)
Annona squamosa (sugar apple)4 (2)
Theobroma cacao (cocoa)6 (1)
Cordia dichotoma1 (1)
Alpinia1 (1)
Lasiodiplodia brasiliensisSyzygium samarangense (wax apple)9 (2)
Mangifera indica (mango)2 (2)
Lasiodiplodia hormozganensisSyzygium samarangense (wax apple)3 (1)
Mangifera indica (mango)5 (1)
Psidium guajava (guava)3 (2)
Annona squamosa (sugar apple)5 (1)
Musa spp. (banana)2 (1)
Lasiodiplodia pseudotheobromaeSyzygium samarangense (wax apple)3 (1)
Psidium guajava (guava)6 (2)
Mangifera indicnga (mango)4 (3)
Lasiodiplodia rubropurpureaSyzygium samarangense (wax apple)8 (3)
Psidium guajava (guava)16 (5)
Mangifera indica (mango)2 (2)
Lasiodiplodia iranensisMangifera indica (mango)8 (3)
Psidium guajava (guava)1 (1)
Annona squamosa (sugar apple)2 (1)
Theobroma cacao (cocoa)3 (1)
Total 145
Table 2. An estimate of genetic variability and neutrality indices of Lasiodiplodia species. S: The number of segregating sites, h: The number of haplotypes, Hd: The haplotype diversity, π: Nucleotide diversity. RM: the minimum number of recombination events, ZnS: Kelly’s ZNs [62], ZZ: Rozas’ ZZ [65]. Statistical significance: * p < 0.05; ** p < 0.01.
ShHdπ (×10−3)ZnSZZRMFu and Li’s D *Tajima’s D
L. theobromae
ITS230.120.240.000.0000.72−1.19
SSU18110.290.660.110.220−4.76 *−2.51 **
EF131120.703.990.170.132−1.22−2.08 *
TUB660.240.700.070.130−0.63−1.84 *
Combined dataset57270.871.360.070.243−2.66 *−2.41 **
L. brasiliensis
ITS660.803.730.540.121−0.44−0.23
SSU1130.351.980.820.080−2.43 *−2.01 *
EF1620.181.851.000.000−2.21 *−1.85 *
TUB220.180.811.000.000−1.66−1.43
Combined dataset2570.872.110.32 **0.381−2.12 *−1.70
L. hormozganensis
ITS660.863.460.13−0.0601.260.09
SSU660.492.300.150.140−3.03 *−2.15 **
EF1220.110.381.000.000−1.99−1.51
TUB650.663.060.170.150−0.10−0.70
Combined dataset22130.951.680.100.141−1.23−1.30
L. pseudotheobromae
ITS220.150.60NDND0−1.78−1.47
SSU1570.733.120.310.050−1.37−1.45
EF11570.733.120.310.050−1.37−1.45
TUB320.151.031.000.000−2.02−1.65
Combined dataset26100.952.040.190.211−1.91−1.65
L. rubropurpurea
ITS120.140.28NDND00.61−0.73
SSU1360.401.210.480.221−3.20 *−2.16 *
EF14480.8413.900.610.1811.49 *−1.12
TUB230.150.330.00 **0.000−2.22−1.51
Combined dataset60160.906.110.360.3540.16−1.48
L. iranensis
ITS1
SSU1360.401.210.480.221−3.20 *−2.16 *
EF11850.679.590.37−0.040−0.99−0.61
TUB890.916.580.22−0.0510.020.17
Combined dataset37130.993.720.180.202−1.29−0.90
Table 3. Summary of molecular variance (AMOVA) of Lasiodiplodia species on the sequence data. *, p < 0.05.
Sum of Squaresd.f.Variance ComponentsPercentage of VariationFixation Indices
Among species2629.35524.0289.18FCT = 0.89 *
Among populations within species207.57460.973.60FSC = 0.33 *
Within populations182.76941.947.22FST = 0.93 *
Disclaimer/Publisher’s Note: The statements, opinions and data contained in all publications are solely those of the individual author(s) and contributor(s) and not of MDPI and/or the editor(s). MDPI and/or the editor(s) disclaim responsibility for any injury to people or property resulting from any ideas, methods, instructions or products referred to in the content.

