Article

Fungistatic Activity Mediated by Volatile Organic Compounds Is Isolate-Dependent in Trichoderma sp. “atroviride B”

by
Eline van Zijll de Jong
1,2,
Janaki Kandula
1,
Michael Rostás
1,3,
Diwakar Kandula
1,4,
John Hampton
1,4,* and
Artemio Mendoza-Mendoza
1,4,*
1
Bio-Protection Research Centre, Lincoln University, Lincoln 7647, New Zealand
2
Linnaeus Laboratory Ltd., Gisborne 4010, New Zealand
3
Agricultural Entomology, Department of Crop Sciences, University of Göttingen, 37077 Göttingen, Germany
4
Faculty of Agriculture and Life Sciences, Lincoln University, Lincoln 7647, New Zealand
*
Authors to whom correspondence should be addressed.
J. Fungi 2023, 9(2), 238; https://doi.org/10.3390/jof9020238
Submission received: 20 January 2023 / Revised: 3 February 2023 / Accepted: 6 February 2023 / Published: 10 February 2023

Abstract

:
Trichoderma spp. produce multiple bioactive volatile organic compounds (VOCs). While the bioactivity of VOCs from different Trichoderma species is well documented, information on intraspecific variation is limited. The fungistatic activity of VOCs emitted by 59 Trichoderma sp. “atroviride B” isolates against the pathogen Rhizoctonia solani was investigated. Eight isolates representing the two extremes of bioactivity against R. solani were also assessed against Alternaria radicina, Fusarium oxysporum f. sp. lycopersici and Sclerotinia sclerotiorum. VOCs profiles of these eight isolates were analyzed using gas chromatography–mass spectrometry (GC-MS) to identify a correlation between specific VOCs and bioactivity, and 11 VOCs were evaluated for bioactivity against the pathogens. Bioactivity against R. solani varied among the fifty-nine isolates, with five being strongly antagonistic. All eight selected isolates inhibited the growth of all four pathogens, with bioactivity being lowest against F. oxysporum f. sp. lycopersici. In total, 32 VOCs were detected, with individual isolates producing between 19 and 28 VOCs. There was a significant direct correlation between VOC number/quantity and bioactivity against R. solani. 6-pentyl-α-pyrone was the most abundant VOC produced, but 15 other VOCs were also correlated with bioactivity. All 11 VOCs tested inhibited R. solani growth, some by >50%. Some of the VOCs also inhibited the growth of the other pathogens by >50%. This study demonstrates significant intraspecific differences in VOC profiles and fungistatic activity supporting the existence of biological diversity within Trichoderma isolates from the same species, a factor in many cases ignored during the development of biological control agents.

1. Introduction

Filamentous fungi of the Trichoderma genus are cosmopolitan organisms existing from marine to desert ecosystems [1,2,3,4,5]. Trichoderma spp. are either free-living or establish associations with other organisms, including bacteria, nematodes, other fungi, plants, and marine sponges [6,7,8,9,10,11]. These associations embrace diverse lifestyles ranging from mutualistic to parasitic [6,11]. This diversity in Trichoderma lifestyles might be related to their capacity to secrete a vast range of secondary metabolites and cellulolytic enzymes [11,12,13]. The capacity to produce these molecules, in addition to their ease of propagation, has made Trichoderma one of the most extensively used fungi in agriculture, where they are used as biofertilizers, biocontrol agents or plant protectants [14].
Currently, 375 Trichoderma species distributed worldwide have been described [15]. In New Zealand of 71 species identified, Trichoderma sp. “atroviride B”, a sister species to T. atroviride s.s., was the most commonly recovered species [16]. Contrary to the extensive distribution of T. atroviride s.s., isolates of T. sp. “atroviride B” have to date only been discovered in the southern hemisphere, including New Zealand, Australia, South Africa and South America [16]. T. sp. “atroviride B” has been isolated from diverse environments and hosts, including wood, soil, the rhizosphere and other fungi. Several T. sp. “atroviride B” isolates protect plants by direct and indirect mechanisms [13,17]. These attributes have been used in agriculture to control soil-borne fungal pathogens (e.g., Rhizoctonia solani [18], and Sclerotinia cepivorum [19]), or foliar pathogens (e.g., Botrytis cinerea [20]). T. sp. “atroviride B isolates also have plant growth promotion activity [21] and induce systemic resistance against foliar bacterial pathogens such as Pseudomonas syringae [22].
Microbial volatile organic compounds (VOCs) are chemically diverse small molecules with a low evaporation point. Due to their physical properties, VOCs are chemical signals that have an action far from the place of production [23,24,25,26]. Trichoderma spp. produce multiple VOCs with solid activity for plant growth promotion, fungistatic activity and abiotic stress protection [13,27,28,29,30,31]. The blend of VOCs released by twelve different Trichoderma species in Arabidopsis seedlings suggested a diversity in plant growth responses ranging from positive to no effect to negative [28]. Trichoderma isolates from the same species showed differences in plant growth induction, a mechanism linked with the blend of VOCs released by the fungi [13,32]. For example, VOCs released by Trichoderma asperellum IsmT5 had a negative impact on plant growth [32], while VOCs emitted by T. asperellum LU1370 resulted in a positive plant growth induction [13]. Similarly, some species of Trichoderma showed different VOCs profiles and antagonism toward the ectomycorrhiza Laccaria bicolor [33]. However, a systematic analysis of the fungistatic activity controlled by VOCs emitted by isolates from the same Trichoderma species is lacking. The information generated in this study will be relevant for understanding the mechanisms and molecules linked to the diversity in activity mediated by VOCs in Trichoderma. To develop a Trichoderma-based generic bio-inoculant, isolates from the same Trichoderma species from various locations within New Zealand were screened. A cohort of four isolates belonging to T. sp. “atroviride B provided promising biological control and/or growth promotion when tested in a range of host/pathogen systems [34,35].
Here we report a systematic analysis of the fungistatic activity of VOCs emitted by fifty-nine T. sp. “atroviride B” isolates, and the ability of VOC blends of eight of these isolates showing distinctive fungistatic activity against R. solani. We also evaluated the effect of these individual VOCs on R. solani, Sclerotinia sclerotiorum, Alternaria radicina and Fusarium oxysporum f. sp. lycopersici.

2. Materials and Methods

2.1. Biological Materials

The 59 isolates of T. sp. “atroviride B” were from the Lincoln University Culture Collection and are of New Zealand origin [16]. Four of these isolates, referred to as the patented strains in Table 1, are patented for the biological control of soil-borne plant pathogens and for promoting plant growth. Sporulating agar discs of each isolate were cultured on prune extract agar [36] at 20 °C under blue light, then stored at 4 °C in sterile reverse osmosis water. Rhizoctonia solani RsS73 isolate (hereafter referred to as R. solani) from perennial ryegrass and Sclerotinia sclerotiorum from oilseed rape are New Zealand isolates and were obtained from the Lincoln University Culture Collection. Alternaria radicina (ICMP 10124) and Fusarium oxysporum f. sp. lycopersici (ICMP 5204) were obtained from the International Collection of Microorganisms from Plants (Landcare Research, Lincoln, New Zealand). These pathogens were maintained at 4 °C after sub-culture every 1–4 weeks at 25 °C in the dark on 2.4% (w/v) potato dextrose agar (PDA; Difco, BD, Franklin Lakes, NJ, USA).

2.2. Inverted Plate Assays

Aliquots (10 μL) of spore suspension from each Trichoderma isolate were grown in separate 90 × 15 mm vented polystyrene (PS) Petri dishes (Thermo Fisher Scientific Inc. Waltham, MA, USA) containing 15 mL of 2.4% (w/v) PDA at 25 °C in the dark for 2 days. The pathogens were grown similarly from a mycelial disc (6 mm diameter); S. sclerotiorum for 2 days, R. solani for 3 days, F. oxysporum f. sp. lycopersici for 9 days, and A. radicina for 11 days. Occasionally the cultures were stored at 4 °C for 1–3 days before inoculation of the assays.
The inverted plate assays were carried out in 90 × 25 mm vented PS Petri dishes containing 15 mL of 2.4% (w/v) PDA. A mycelial disc (6 mm diameter) was transferred from the periphery of the Trichoderma culture to the center of a Petri dish. After 0 or 48 h at 25 °C in the dark, a mycelial disc was transferred from the periphery of the pathogen culture to a new Petri dish and placed inverted over the Trichoderma culture. The Petri dishes were sealed together with a triple layer of plastic film and incubated at 25 °C in the dark. The controls were prepared in a similar manner except that a disc of PDA was used to inoculate the lower Petri dish in the positive control and both Petri dishes in the negative control.

2.3. Evaluation of Trichoderma Isolates

Two experiments were conducted to investigate the bioactivity of the fifty-nine isolates of T. sp. “atroviride B” in the inverted plate assays. R. solani was introduced at the same time as Trichoderma in the first experiment, and the assays were arranged as a randomized complete block (RCB) design with three blocks at 25 °C in the dark. The positive control was replicated eight times in each block, as were the four patented strains of T. sp. “atroviride B”, to minimize the variance of the difference between these and the other treatments. The second experiment was carried out similarly, except there were five blocks, and the pathogen was introduced 48 h after Trichoderma.
Twenty-one days after the pathogen was introduced, Trichoderma was removed and replaced with a Petri dish lid. After sealing with a triple layer of plastic film, the cultures of R. solani were incubated for a further 14 days to determine whether the effect of Trichoderma was fungicidal or fungistatic.
The diameter of R. solani colonies was recorded at their widest point every day from 0 to 6 or 7 days post-inoculation (DPI) and thereafter weekly up to 21 or 35 DPI, respectively. Due to the upward curve of the PDA at the edge of the Petri dish, it was not possible to accurately measure the diameter of the colony beyond 80 mm; hence this measurement was taken as the maximum colony diameter. The measurements were used to calculate the percentage inhibition of pathogen growth by the Trichoderma treatments compared to the positive control. The average inhibition of pathogen growth was determined by calculating the area under the curve following the trapezoid rule and dividing by the number of days between the first and last assessment. The first appearance of spores or sclerotia or spores were recorded for Trichoderma and R. solani, respectively, at the same time intervals that the diameters were measured.
ANOVA was performed on the percentage inhibition of pathogen growth on average and at each time point and the number of inhibition days. Chi-squared tests were conducted to test for significant differences in the occurrence of sclerotia between treatments and the positive control. These, together with the days of inhibition, were transformed before analysis using the base 10 logarithm to reduce the differences in variance between those with scores occurring when assays were assessed daily and those when assays were assessed weekly. Treatments with means equal or close to the minimum or maximum value were omitted from the analysis to avoid violating the assumption of equal variance, and the treatment structure was adjusted accordingly. These treatments were statistically compared to the variable treatments using the least significant effect (LSEffect 5%), that is the least significant difference (LSD 5%) divided by the square root of 2.
The bioactivity of eight isolates of T. sp. “atroviride B” (LU132, LU140, LU521, LU583, LU584, LU633, LU657, and LU661) was also evaluated in the inverted plate assays against three other pathogens; A. radicina, F. oxysporum f. sp. lycopersici and S. sclerotiorum and compared to R. solani in duplicate experiments following a randomized complete block design with four blocks. The positive controls for each pathogen were replicated three times in each block. The assays were conducted at 25 °C in the dark, and the pathogens were introduced 48 h after Trichoderma.
The maximum colony diameter and colony diameter perpendicular to the maximum were recorded for each pathogen when they were, on average, ≥65 mm in the positive control (1–2 DPI for S. sclerotiorum, 2 DPI for R. solani, 7 DPI for F. oxysporum f. sp. lycopersici and 14 DPI for A. radicina). The percentage inhibition of pathogen growth was calculated based on the average of these two measurements. ANOVA was performed for a randomized complete block design with four blocks and a factorial treatment structure of 4 (pathogen) × 8 (Trichoderma). A combined analysis was also performed using the data means from the two experiments.

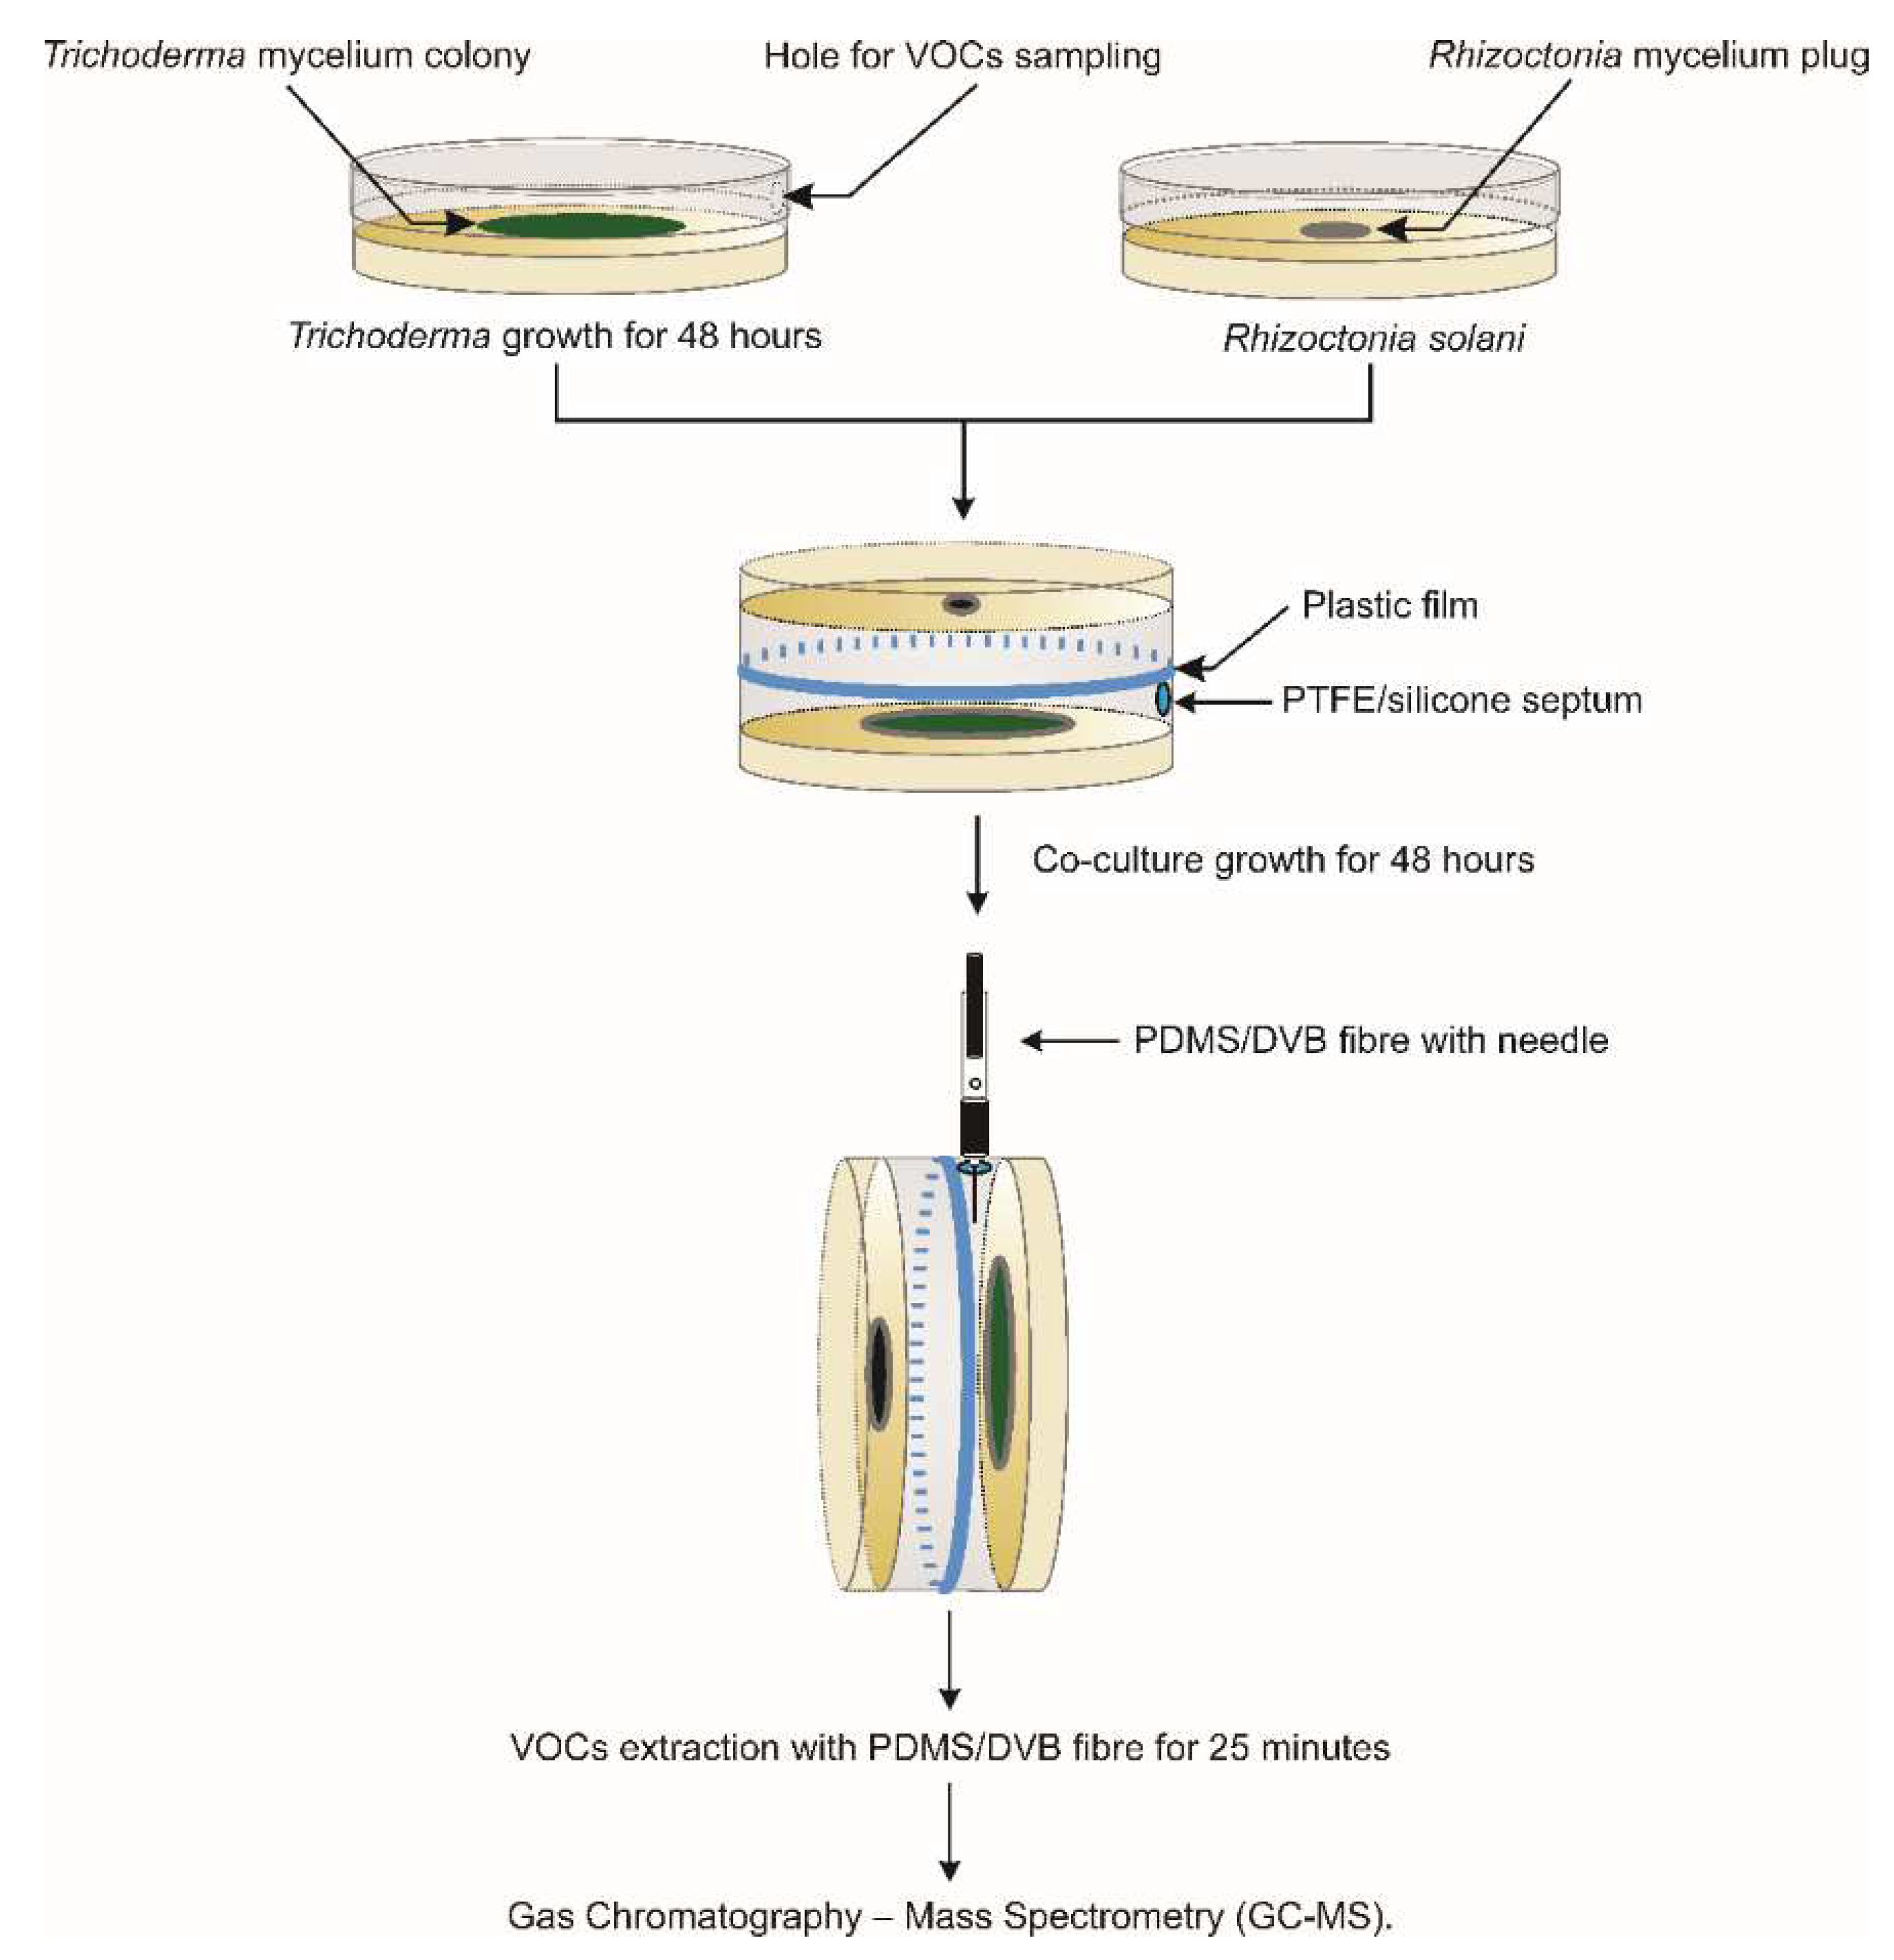
2.4. Analysis of VOCs

The VOC profiles of eight isolates of T. sp. “atroviride B” (LU132, LU140, LU521, LU583, LU584, LU633, LU657, LU661) were analyzed in the inverted plate assays by gas-chromatography–mass spectrometry (GC-MS). The assays were carried out at 25 °C in the dark. R. solani was introduced 48 h after Trichoderma, and a blue PTFE silicone septum (MicroAnalytix NZ Ltd, Auckland, New Zealand) was placed over a hole (3 mm diameter) present along the top edge of the Petri dish with Trichoderma before the Petri dishes were sealed together with five layers of plastic film (Figure 1). The experiment was carried out as an RCB design with five blocks. Each block was prepared on a different day. The set-up of each treatment within a block was staggered to take into account the run-time on the GC-MS so that the VOCs were sampled from each treatment at the same stage of growth.
The VOCs were extracted 48 h after R. solani inoculation from the headspace by solid-phase micro-extraction (SPME) using 10 mm of a 65 μm polydimethylsiloxane/divinylbenzene (PDMS/DVB) fiber with 23 gauge needle (Supelco, Sigma-Aldrich New Zealand Co., Auckland, New Zealand ) at 25 °C for 25 min. The Petri dishes were clamped perpendicularly for sampling. The diameter of the pathogen colony was recorded at its widest point immediately after sampling and used to calculate the percentage inhibition of pathogen growth (Figure 1).
The VOCs were analyzed on a GCMS-QP2010 Ultra (Shimadzu Scientific Instruments, Auckland, New Zealand) using an Rtx-5MS column (diphenyl dimethylpolysiloxane, 30 m × 0.25 mm i.d., 0.25 μm film thickness, Restek). They were desorbed from the fiber by splitless injection at 250 °C for 2 min, and after an additional 8 min, the fiber was removed. Helium was used as the carrier gas at a flow rate of 1.0 mL/min. The column oven temperature was held at 40 °C for 2 min before being raised to 200 °C at a rate of 10 °C/min and then to 260 °C at a rate of 25 °C/min, where it was held for 5 min. The interface temperature was 260 °C and the ion source was 230 °C. The detector voltage was 0.85 kV, and the scanning range was 33–500 m/z. An aliquot (5 μL) of alkane mix (C8–C20, Sigma-Aldrich) was placed in a 20 mL amber glass headspace vial and sealed with a screw cap containing a blue PTFE/silicone septum (Sigma-Aldrich) which was sampled and analyzed as described above. Standards (2 mg/L) were sampled by liquid injection and analyzed on the GC-MS as described above.
Compounds with a peak with a minimum slope of 300/min were identified by comparison of their mass spectra with those in the NIST11 and Wiley10 databases using the software GCMSsolution (version 4.11, Shimadzu). Those compounds with identity to siloxane were removed. Likewise, compounds present in the negative (uninoculated PDA plates) and positive (PDA plates inoculated with R. solani) controls were also removed unless the peak areas in ≥5 treatments were significantly higher (p < 0.05) than the controls. The percentage similarity to the compound was recorded for the peak with the highest peak area in each block. The retention index (RI) was determined for these peaks using the software MassFinder (version 4.26, Dr Hochmuth Scientific Consulting). The identity of those with a retention index that did not match the published retention index for the compound (accessed on 15 May 2018, NIST Chemistry WebBook: http://webbook.nist.gov/chemistry/) was amended to unknown. The base peak chromatogram was also examined, and those with more than one base peak were de-convoluted using the software AMDIS (version 2.71, http://chemdata.nist.gov/mass-spc/amdis/downloads/, accessed on 15 May 2018). Compounds were then matched within and between the five blocks in the RCB design based on their identity and retention index or retention time. Only those that occurred in at least one treatment across ≥3 blocks were included in the statistical analysis.
To estimate the linear range of VOCs, a calibration curve from five compounds that occurred in the fungal headspaces was calculated according to Bartelt (1997). The VOCs 2-heptanone, 6-pentyl-α-pyrone, (+)-limonene, undecane and tridecane (for purity, see below) were dissolved in n-hexane. Each mixture was added to a 20 mL SPME glass vial in four concentrations (1, 2.5, 10, and 25 µg L−1) and analyzed in four technical replicates by GC-MS as described above.
ANOVA was performed on the percentage inhibition of pathogen growth and peak area of a compound. The correlation between the total number of VOCs or peak area of VOCs and the percentage inhibition of pathogen growth was tested by linear regression using the treatment means. Likewise, a linear regression was performed for each VOC using the treatment means for the peak area and percentage inhibition of pathogen growth to identify those displaying a significant positive correlation with bioactivity.

2.5. Bioactivity Assays of Pure Compounds

A total of eleven VOCs identified from GC-MS analysis were evaluated for bioactivity against R. solani and three other pathogens (A. radicina, F. oxysporum f. sp. lycopersici and S. sclerotiorum) in inverted plate assays. The compounds farnesene (mixture of isomers), geranylacetone (≥97%, CAS no. 689-67-8), (+)-limonene (97%, CAS no. 5989-27-5), (-)-limonene (96%, CAS no. 5989-54-8), nerolidol (mixture of cis and trans, ≥97%, CAS no. 7212-44-4), 6-pentyl-α-pyrone (≥96%, CAS no. 27593-23-3), tridecane (≥99%, CAS no. 629-50-5), undecane (≥99%, CAS no. 1120-21-4) and 2-undecanone (≥98%, CAS no. 112-12-9) were obtained from Sigma-Aldrich, bisabolene (CAS no. 17627-44-0) from Indukern, and β-curcumene (CAS no. 451-56-9) from Extrasynthese.
The inverted plate assays were carried out as described previously [27]. The compounds (0.32, 1.6, 8, 40, 200 or 1000 μmol) were applied together with hexane (hexane (95%, Thermo Fisher Scientific) in 50 μL volumes to 1–5 antibiotic assay discs (13 mm diameter, Whatman, GE Healthcare Life Sciences, Auckland, New Zealand) adhered around the center of a Petri dish lid with dichloromethane (5 μL/disc, Applied Biosystems, Waltham, MA, USA). The Petri dish with the pathogen was placed inverted over the discs and sealed with plastic film. The positive control was exposed to 50 μL of hexane. The assays for each VOC were placed in separate incubators at 25 °C in the dark.
Each VOC was evaluated in duplicate experiments as a randomized complete block design with four blocks. The only exception was β-curcumene which, due to the cost of this compound, was only evaluated once. The highest quantity of each VOC (1000 μmol) was tested against all four pathogens, whereas the other quantities (0.32–200 μmol) were only tested against R. solani. For the latter pathogen, there were two positive controls per block.
The mean colony diameter was recorded for the four pathogens as described in Section 2.3 ANOVA was performed for each experiment using the base 10 logarithms of the mean colony diameters of the positive control over the treatment. A combined analysis was also performed using the data means from the two experiments.
Additional experiments were conducted with 6-pentyl-α-pyrone and the two stereoisomers of limonene to determine the quantity required for 50% growth inhibition of R. solani. These VOCs were tested in duplicate experiments against R. solani at quantities of 200, 360, 520, 680, 840 and 1000 μmol as described above.

3. Results

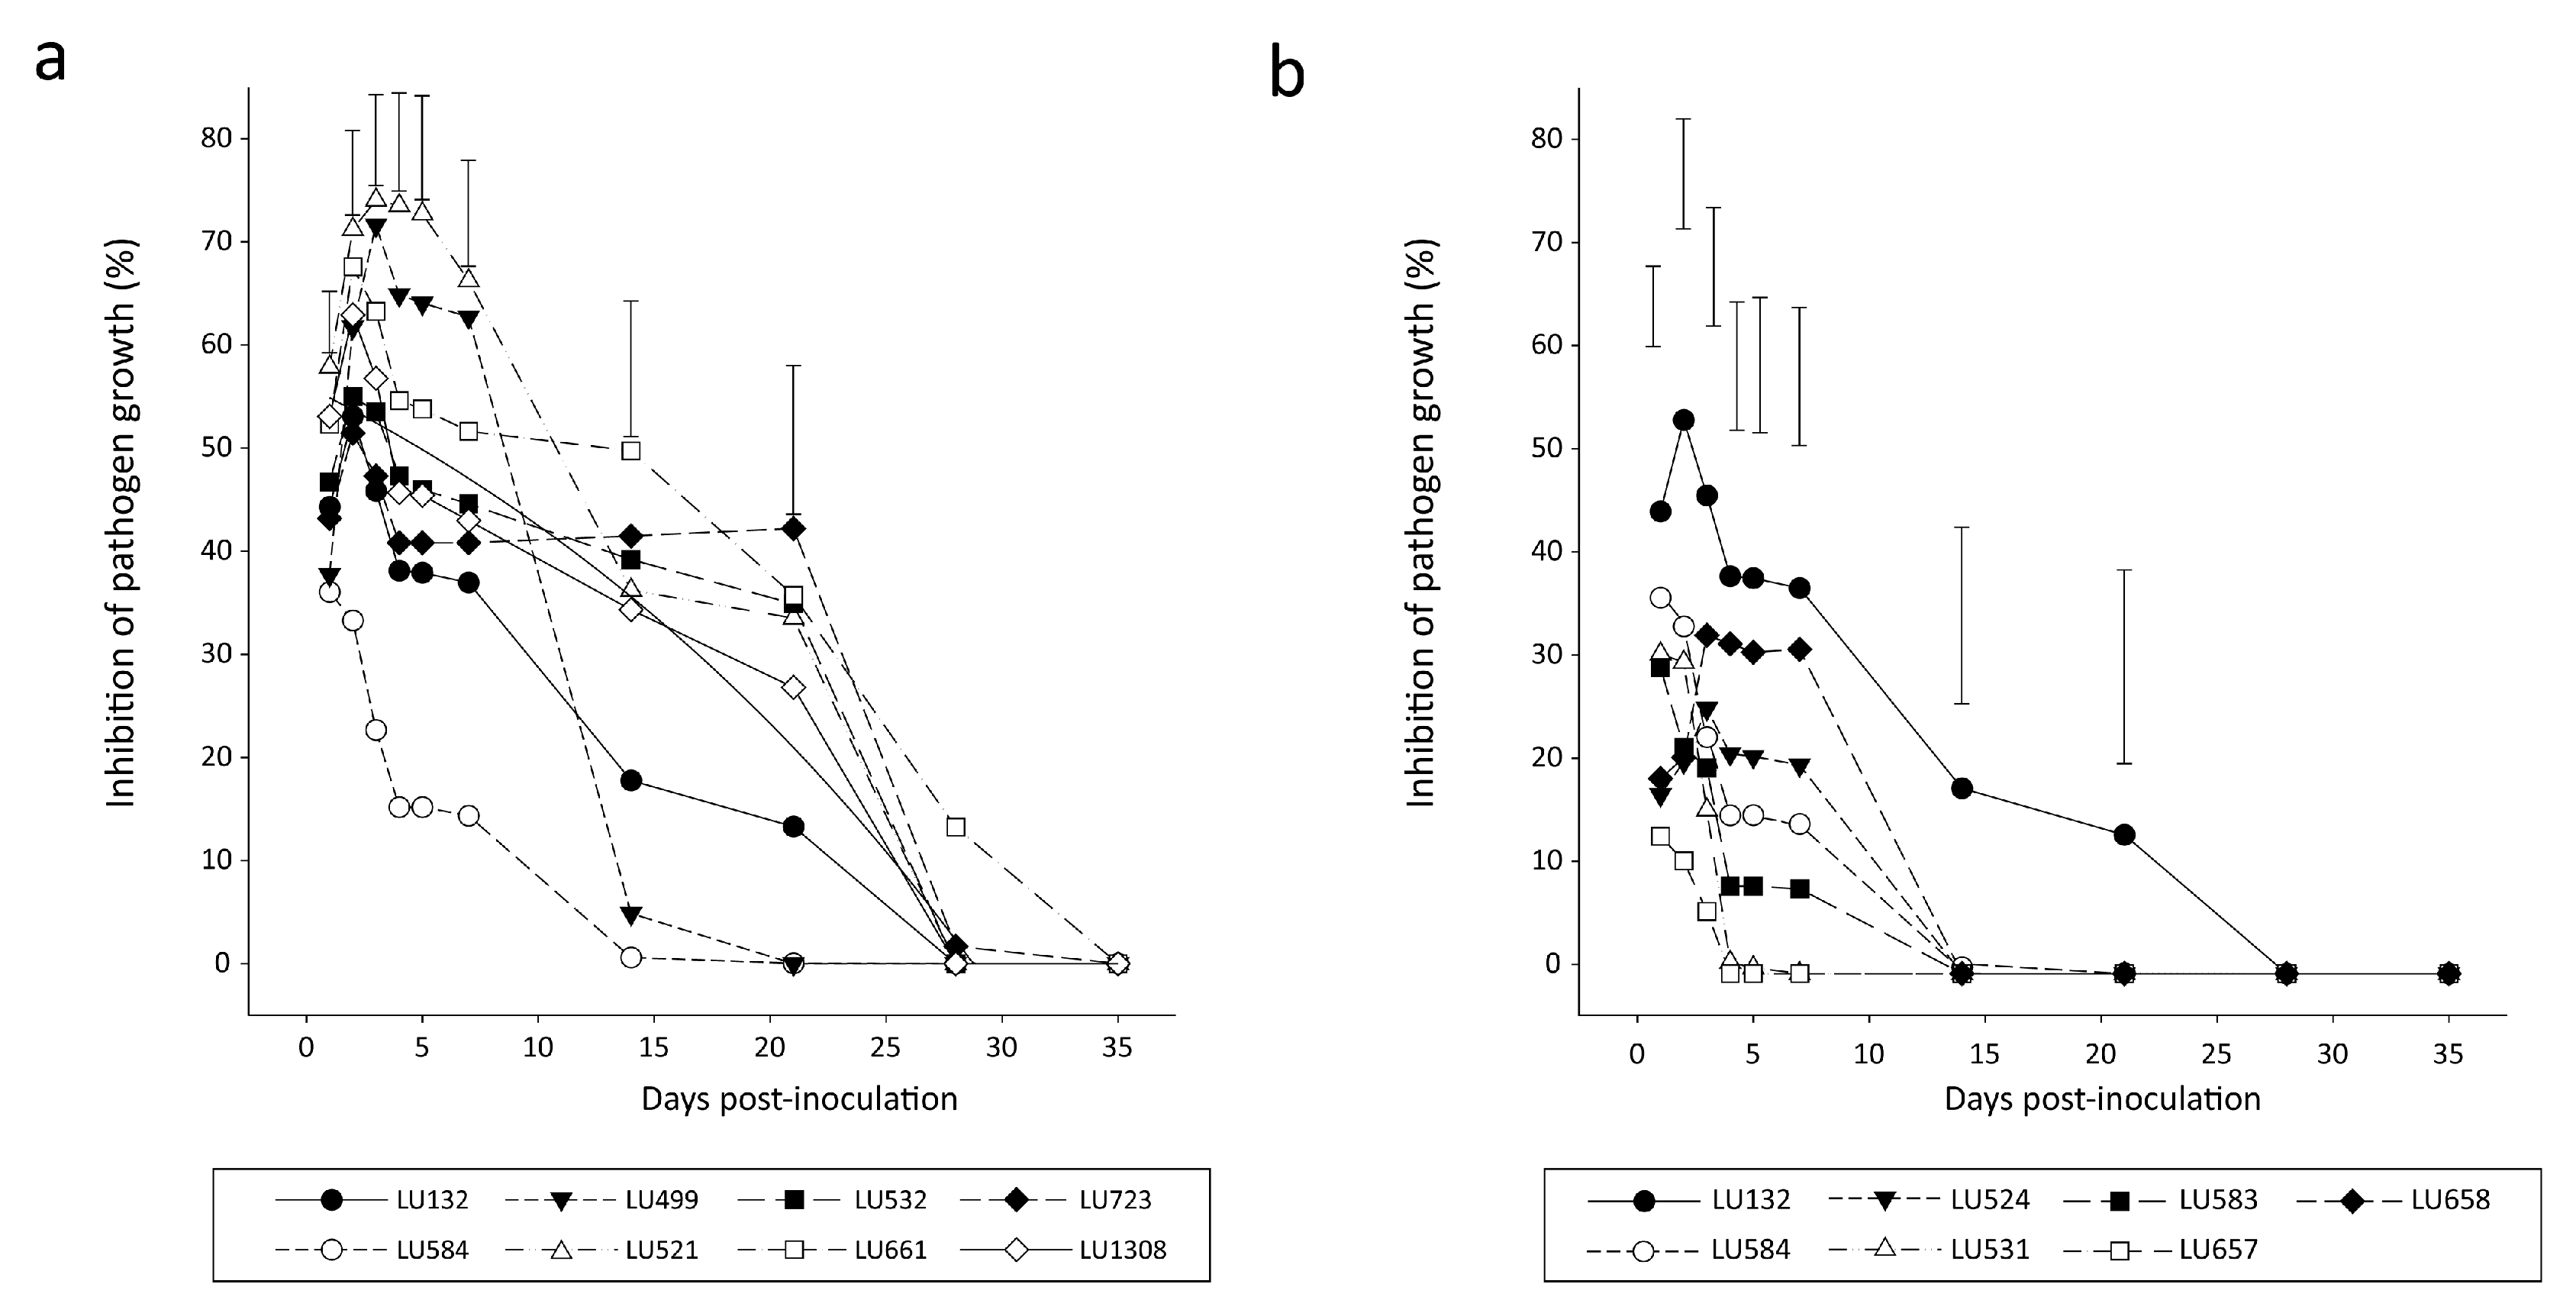
3.1. Bioactivity of VOCs from Trichoderma sp. “atroviride B” against R. solani

The suppressive activity of VOCs emitted by T. sp. “atroviride B”, the four patented strains and additional isolates of T. sp. “atroviride B”, previously identified [16],were tested against R. solani. There were differences in the level and duration of R. solani inhibition among the four patented strains and other isolates of T. sp. “atroviride B” when the pathogen was introduced 48 h after Trichoderma in the inverted plate assays. Strain LU132 displayed significantly higher levels of inhibition than strains LU140, LU584 and LU633 and 32 other isolates (Table 1). Five isolates (LU521, LU532, LU661, LU723 and LU1308) were more antagonistic towards R. solani than strain LU132 (Figure 2a). Inhibition with strain LU584 was significantly lower and shorter in duration than LU132, LU140 and LU633. There were no isolates that, on average, displayed significantly lower levels of inhibition than LU584, but inhibition was lower at two or more time points with four isolates; LU524, LU583, LU657 and LU658 (Figure 2b). The duration of antagonism was shorter for isolate LU657. None of the 59 Trichoderma isolates inhibited R. solani growth when both fungi were introduced simultaneously (data not shown).
Fifty-two of the Trichoderma isolates significantly reduced the occurrence of sclerotia in pathogen cultures (Table 1). For three isolates that strongly inhibited pathogen growth (LU661, LU723 and LU1308), the observed reduction was not significantly lower than the positive control. Some variation was detected in the growth of Trichoderma isolates. Unlike the other isolates, cultures of isolate LU499 were not white and fluffy in appearance. The growth rates of some of the best (LU532 and LU723) and worst (LU657) performing isolates were slower than that of the patented strains (Table 2). Two of the isolates with low bioactivity (LU524 and LU658) sporulated earlier than the four patented strains, whereas another (LU657) sporulated later, as did one of the isolates with high bioactivity (LU661). One isolate (LU723) had not sporulated by 22 days.

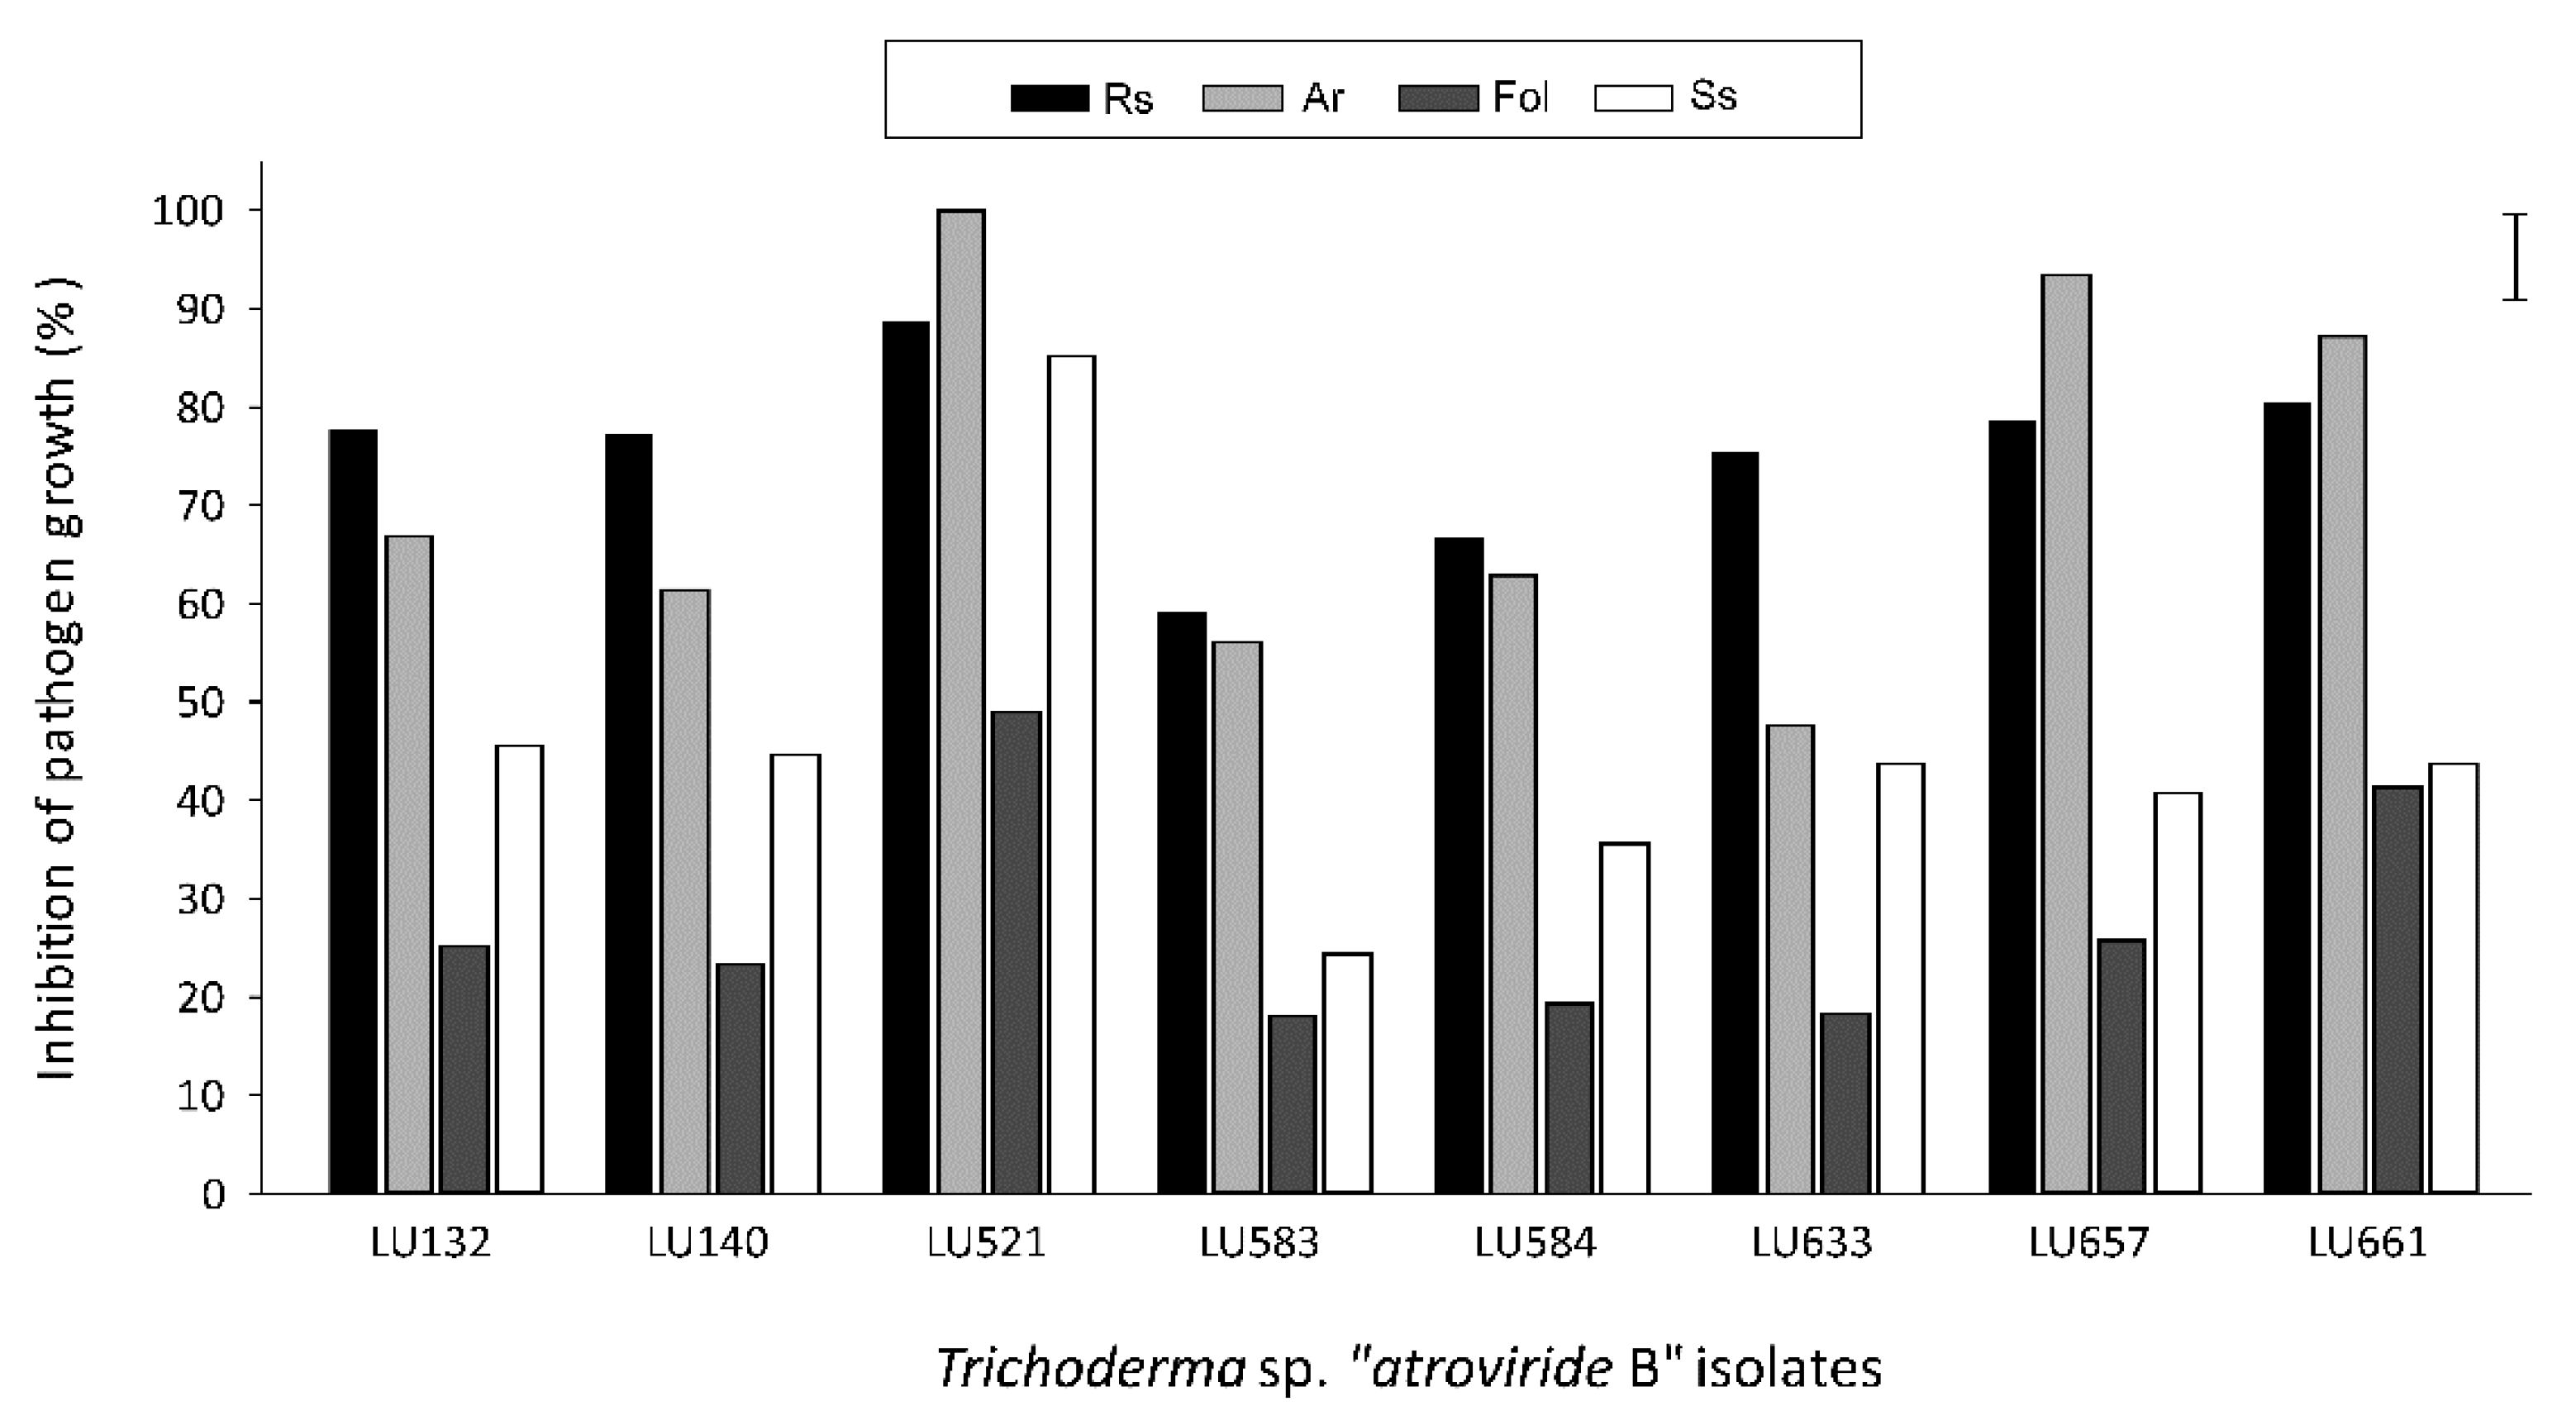
3.2. Bioactivity of VOCs from T. sp. “atroviride B” against other Pathogens

The four patented strains and the best and worst-performing isolates (as evaluated against R. solani) were able to inhibit the growth of other pathogens in the inverted plate assays (Figure 3). The best-performing isolate, LU521, showed high levels of bioactivity against R. solani, A. radicina and S. sclerotiorum, whereas bioactivity was lower against F. oxysporum f. sp. lycopersici. This isolate displayed significantly higher levels of bioactivity against these pathogens than most of the other Trichoderma isolates.
The four patented strains (LU 132, LU140, LU584 and LU633) were more antagonistic towards R. solani than the other pathogens (Figure 3). Inhibition of A. radicina and S. sclerotiorum was significantly higher than of F. oxysporum f. sp. lycopersici. The different strains displayed similar levels of bioactivity, and only strain LU633 tended to be less antagonistic than the other strains towards A. radicina.

3.3. Analysis of VOCs from T. sp. “atroviride B”

A total of 32 VOCs detected in the headspace of the inverted plate assays were categorized as having Trichoderma origin (Table 3). These were not detected on PDA plates without fungi (negative control) or on plates containing R. solani alone. Trichoderma isolates produced, on average, between 19 and 28 VOCs (Table 3). There was a direct correlation between the total number and quantity of VOCs produced by an isolate and bioactivity against R. solani (r = 0.93 and r = 0.87, respectively, p < 0.001).
The most abundant VOC produced by all Trichoderma isolates, 6-pentyl-α-pyrone (Table 4) (VOC 21), displayed a significant positive correlation with inhibition of R. solani growth (Figure 4). The abundance of 15 other VOCs was also correlated with bioactivity. These displayed identities to the compounds undecane (VOC 8), tridecane (VOC 15), (±)-limonene (VOC 5), trans-nerolidol (VOC 28), β-bisabolene (VOC 25), cis-β-farnesene (VOC 20), (−)-germacrene D (VOC 22), α-bergamotene (VOC 18), 2-undecanone (VOC 14) and geranylacetone (VOC 19). The identities of the remaining VOCs (VOC 9, 23, 24, 30 and 32) were unknown.
Isolate LU521, which displayed significantly higher levels of bioactivity (Table 4), produced three VOCs that were low or absent in the other Trichoderma isolates (Table 5). The identity of one was unknown (VOC 32), but the remaining two showed identity to 2-undecanone (VOC 14) and Methyl trans,cis-farnesate (VOC 29). Three other VOCs, verticiol (VOC 31) and two unknowns (VOC 16 and 30), were also detected in high levels in this isolate and in isolate LU661 (Table 5).
Calibration curves of five fungal VOCs (2-heptanone, 6-pentyl-α-pyrone, (+)-limonene, undecane and tridecane) were created to estimate absolute VOC concentrations in the fungal headspace samples (Figure S1). Linear regression analyses resulted in R2 values between 0.9298 for 2-heptanone and 0.9965 for 6-pentyl-α-pyrone. However, the compounds differed considerably in their affinity to the SPME fiber, and the full range of concentrations was not covered. Hence, only relative peak areas are given for fungal headspace VOCs (Table 5).

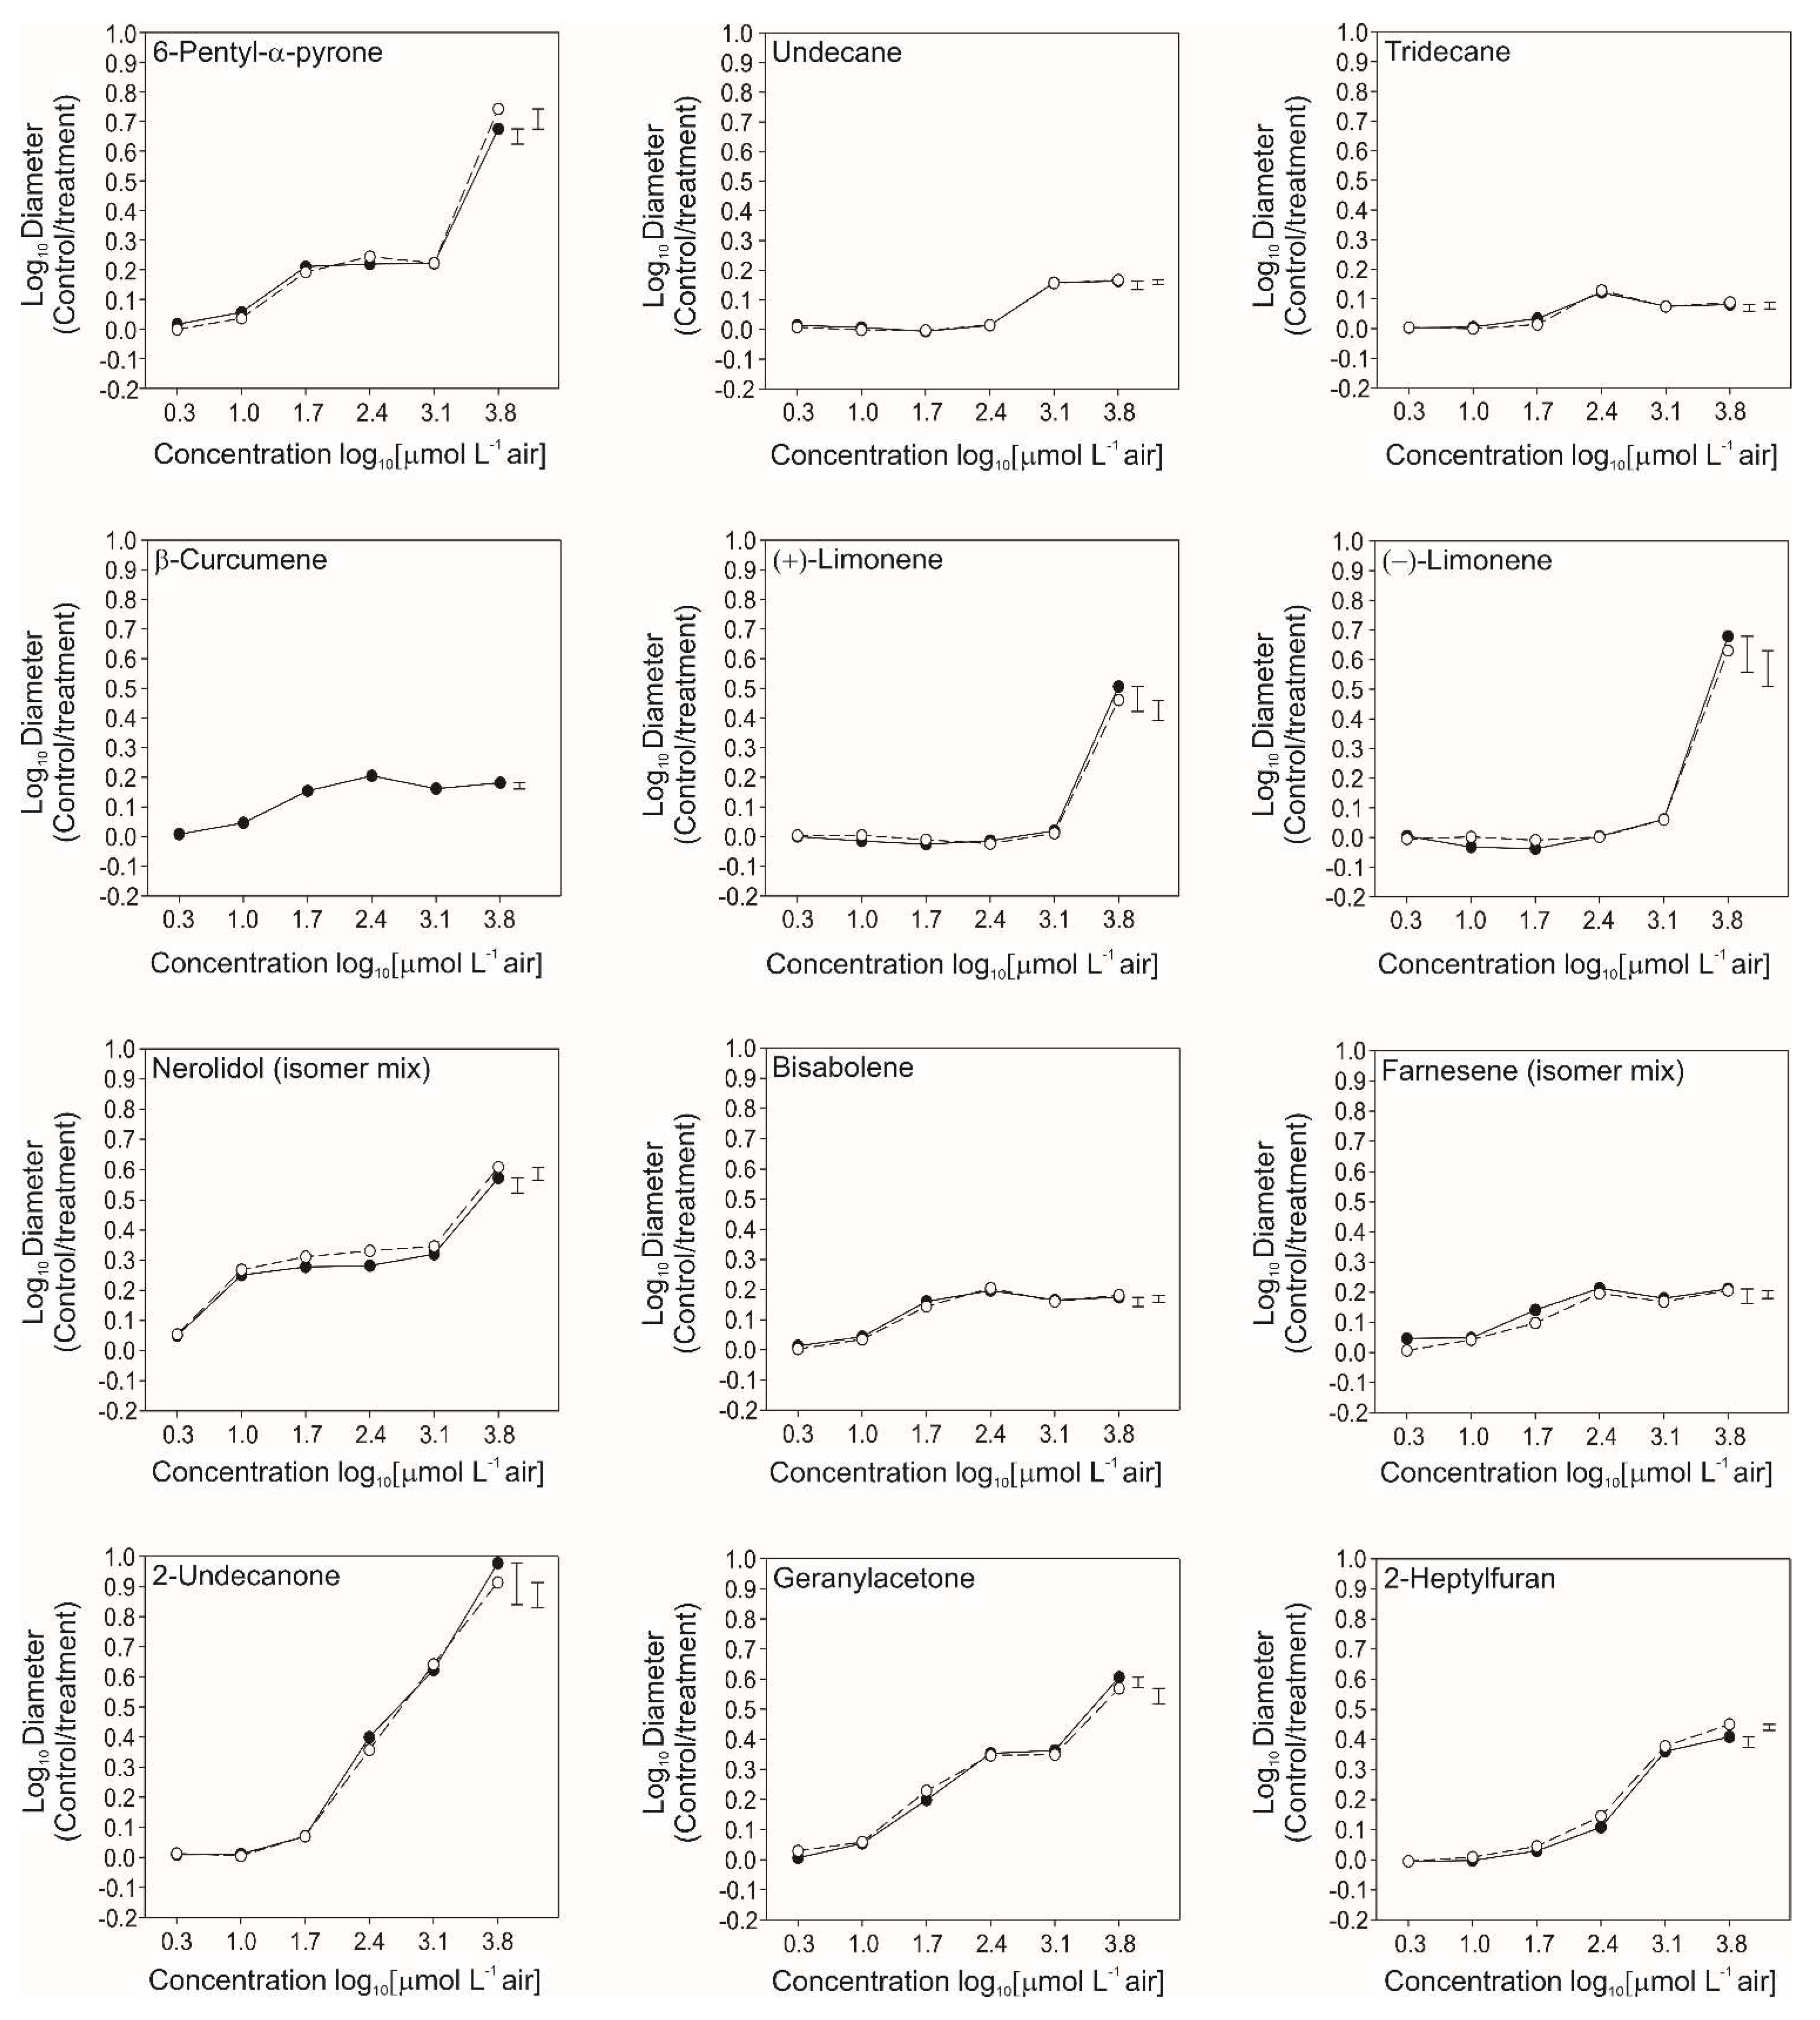
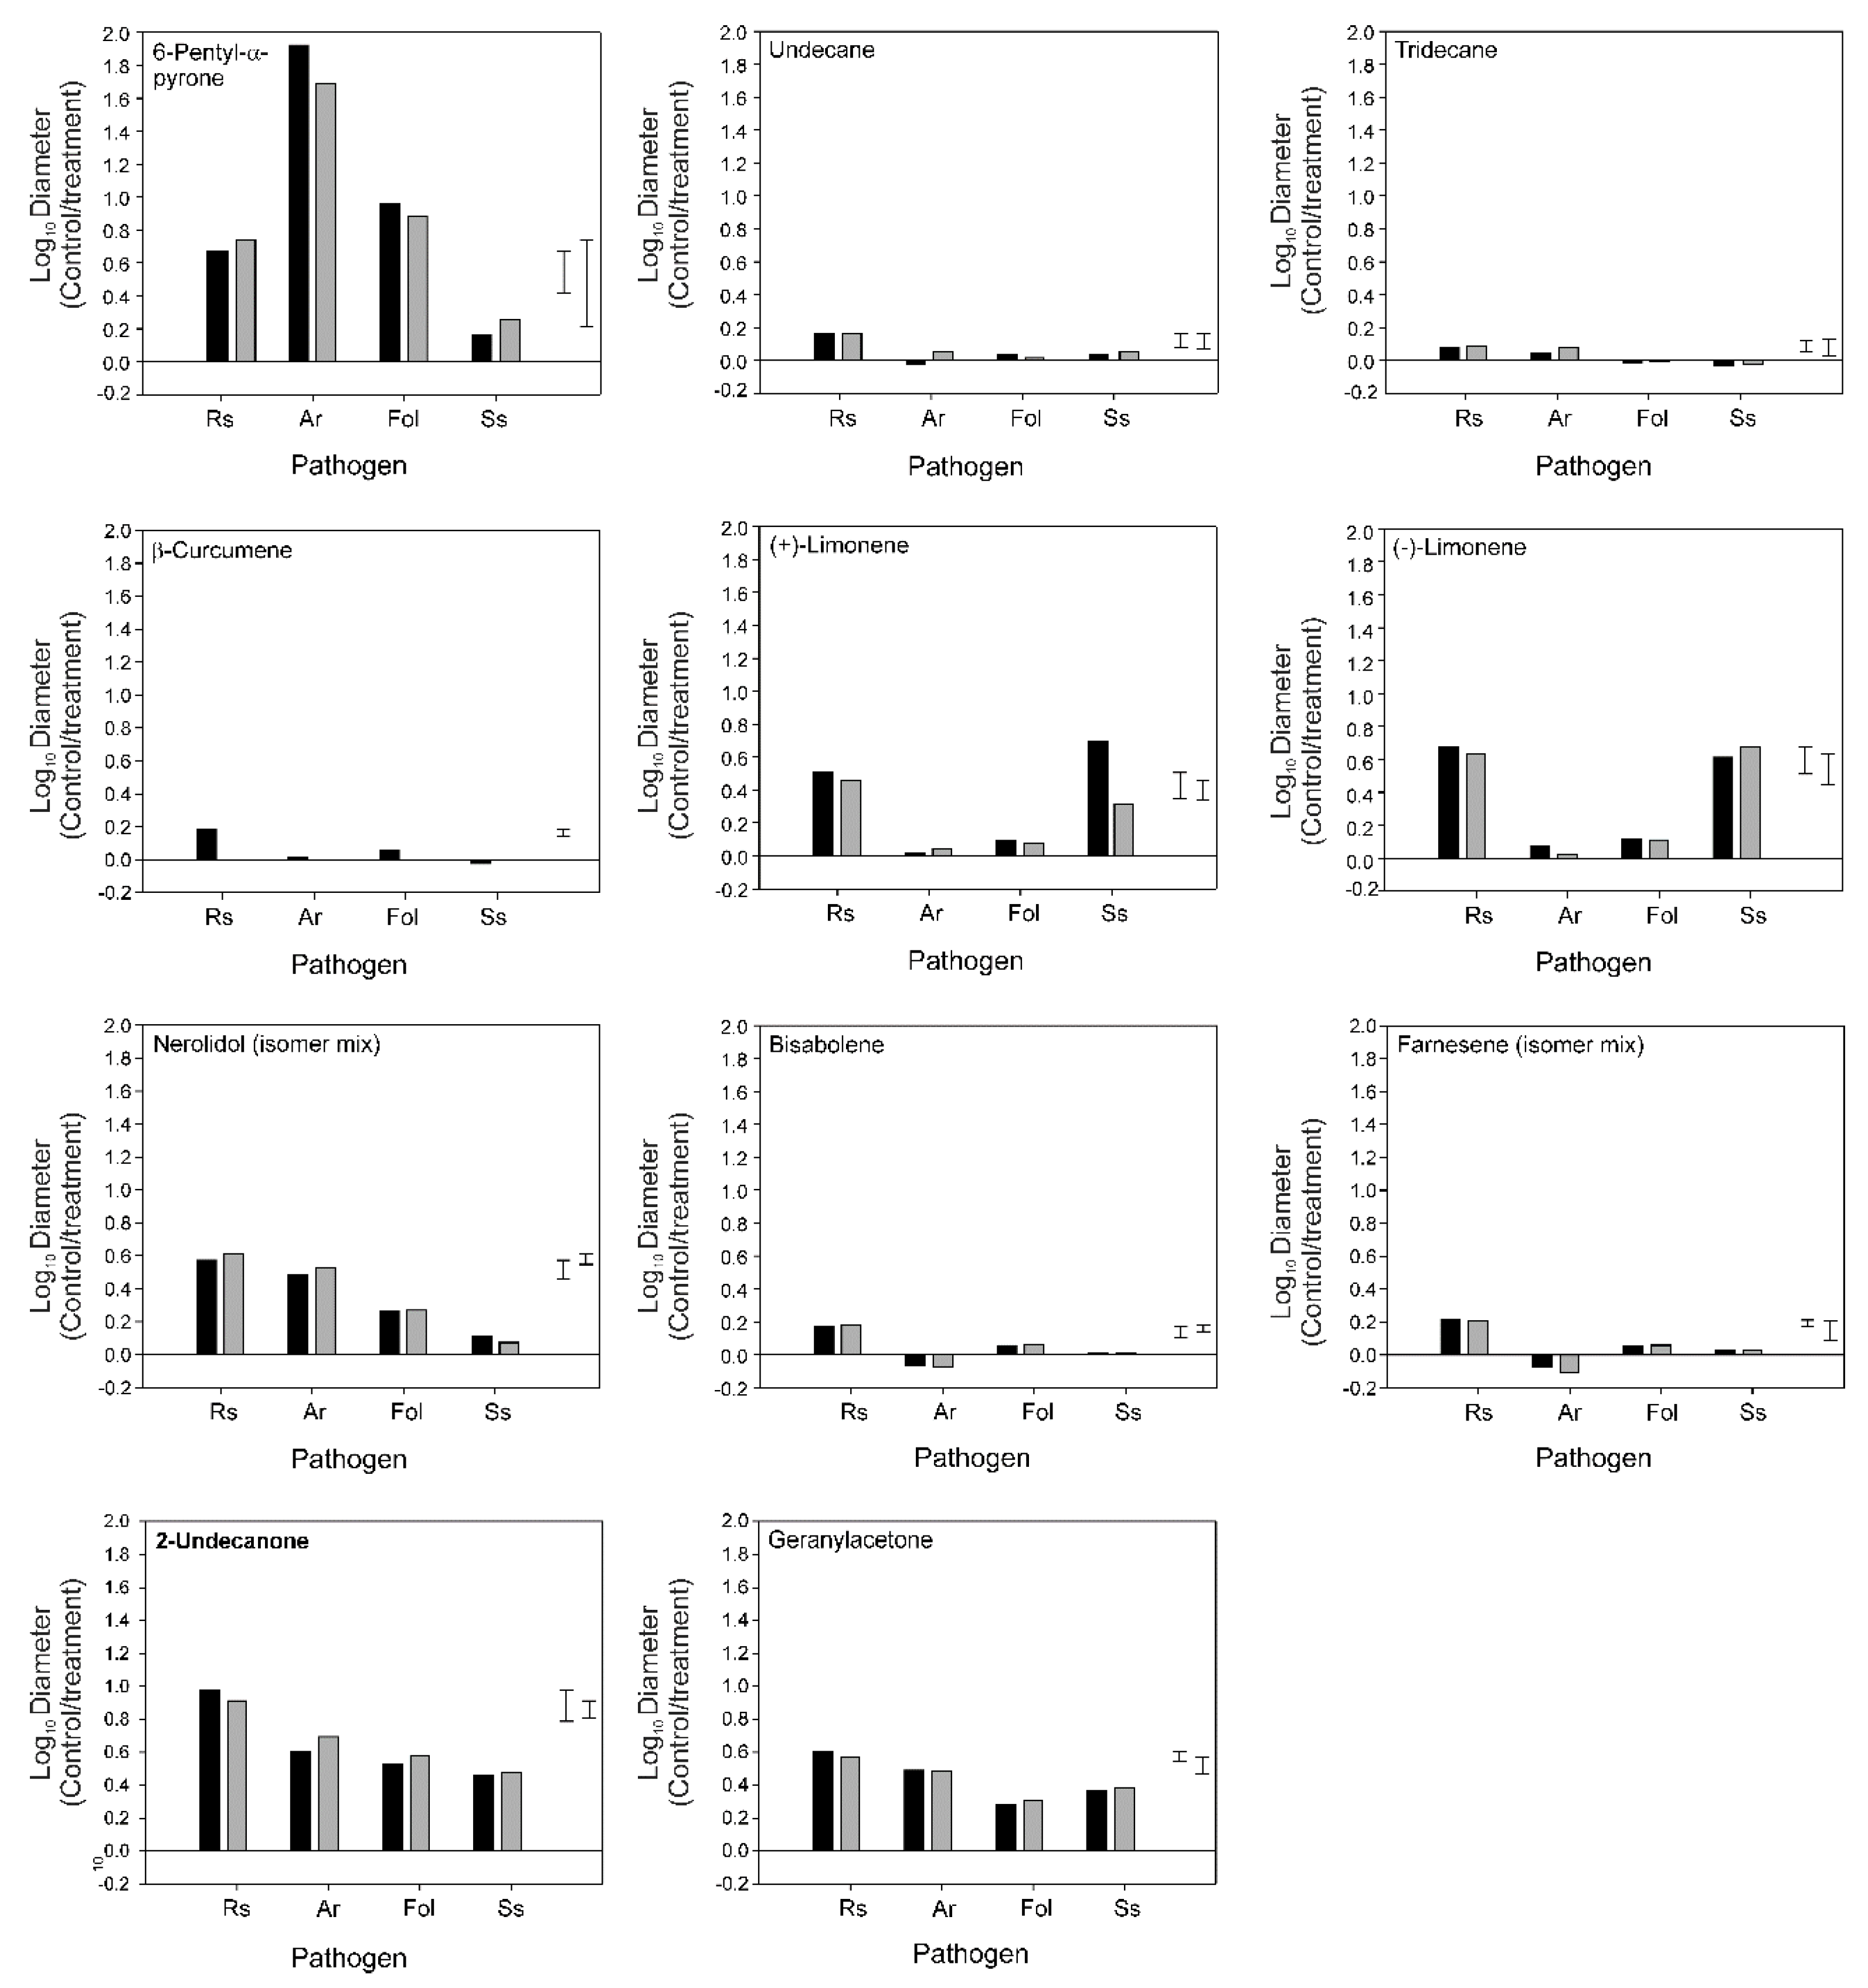
3.4. Bioactivity of Individual VOCs

The growth of R. solani was inhibited by all 11 of the tested VOCs (Figure 4). Seven of the VOCs inhibited growth by >50%. This level of inhibition was reached with lower concentrations of nerolidol, 2-undecanone, and geranylacetone (Figure 4), than of 6-pentyl-α-pyrone, (+)-limonene and (−)-limonene (Figure 4). Between 63–89% inhibition was detected with these VOCs. Inhibition was highest with 2-undecanone. Lower levels of inhibition (25–38%) were detected with the other five VOCs; undecane, tridecane, β-curcumene, bisabolene and farnesene.
In addition to their activity against R. solani, the VOCs 6-pentyl-α-pyrone, nerolidol, 2-undecanone, and geranylacetone inhibited the growth of A. radicina by >50%, as did 6-pentyl-α-pyrone and 2-undecanone against F. oxysporum f. sp. lycopersici, and 2-undecanone, geranylacetone, (+)-limonene and (−)-limonene against S. sclerotiorum (Figure 5). Inhibition levels were similar to or lower than those detected in R. solani, except for 6-pentyl-α-pyrone, which was more antagonistic towards A. radicina (p < 0.01). (Figure 5).

4. Discussion

This study shows that the blend of fungal volatile organic compounds is highly variable within the same Trichoderma species and depends on the specific isolate. Differences were found in the number of VOCs emitted by T. sp. “atroviride B” isolates, ranging from 19 to 28. The VOCs also differed in their concentrations. The fungistatic and fungicidal activities of Trichoderma VOCs, using inverted plate bioassays, have previously been reported [27,37] and were confirmed in the present study. Remarkably, the observed variation in VOC emission is directly associated with the extent of fungistatic activity against the plant pathogen R. solani.
T. sp. “atroviride B” can affect plants positively in a direct manner, for instance, by the production of beneficial metabolites or proteins and indirectly by inhibiting plant pathogens [17]. Intraspecific differences in inhibiting phytopathogens and promoting plant growth are well known but these also depend on the plant and pathogen species tested in addition to the fungal isolate [13,21,38]. Furthermore, Trichoderma isolates differ in their capacities to colonize the rhizosphere of diverse plant species [39]. In this work, we tested the VOC blends emitted by 59 different isolates of T. sp. “atroviride B” on the fungistatic activity against R. solani. Our data support a continuum in the antagonistic effects of VOC blends, ranging from strong inhibition to no effects on R. solani growth (Table 1). To our knowledge, this is the first intraspecific comparison of fungistatic activity caused by a large range of Trichoderma isolates. Our observations support previous results where a blend of VOCs from different Trichoderma isolates from the same species differentially affected plant growth in Arabidopsis thaliana [28,32]. Some VOC blends inhibited plant growth while other isolates had a positive effect [13,28]. Earlier studies showed that various T. sp. “atroviride B” isolates also respond differently to environmental cues; for example, while T. sp. “atroviride B” LU132 produces high levels of indole-3-acetic acid in the presence of L-tryptophan in the medium, this was not the case in T. sp. “atroviride B” LU660 [13]. Whether the observed specific variation in VOC composition is further influenced by the presence of a pathogen, such as R. solani or its strains, needs to be assessed in future studies.
We found that the VOC blends of T. sp. “atroviride B” isolates differentially suppressed sclerotia formation in R. solani. Hence, this is the first report showing intraspecific variability in the inhibition of sclerotia by a Trichoderma species. Likewise, it was reported that VOCs emitted by endophytic bacteria inhibit sclerotia formation in Sclerotinia sclerotiorum [40], suggesting a common strategy in organisms to manipulate growth in antagonists by volatiles. The sclerotia are important for the survival of pathogens under unfavorable environmental conditions, and by inhibiting their formation, Trichoderma contributes to eliminating the pathogen population. In R. solani, sclerotia formation is regulated by reactive oxygen species (ROS) and trehalose [41]. Further work is required to identify if VOCs emitted by Trichoderma modulate ROS and trehalose metabolism in plant pathogenic fungi.
The mechanisms behind VOC production in Trichoderma are not entirely understood; however, chemical and physical signals, including nutrients, light, temperature, pH, development stage and associations with other organisms have been described as inducers of VOC production [42,43,44,45,46,47]. The role of some signaling components in the production of VOCs in T. atroviride has been reported. For example, in the absence of the NADPH Oxidase Nox2 [27], the Histidine Kinase Two-Component Response Regulator Skn7 [37] or the MAPK Tmk3 [45] fromT. atroviride IMI206040 were unable to produce 6-pentyl-α-pyrone, the most abundant VOC in this isolate. However, this is not the case in the absence of the NADPH Oxidase Nox1, the NADPH Oxidase Regulator NoxR or the Histidine Kinase Two-Component Response Regulator Ssk1 [27,37]. The lack of the Histidine Kinase Two-Component Response Regulator Rim15, on the other hand, modifies the accumulation of VOCs in T. atroviride IMI206040 [37]. The role of these signaling components was studied in the interaction with R. solani and Sclerotinia sclerotiorum [27,37]. These studies illustrated that airborne signals communication is differentially modulated by these signaling components in Trichoderma and the outcome of the interaction is also plant pathogen dependent [27,37].
Further investigation is required to identify the mechanisms behind the volatile-mediated interactions between R. solani and T. sp. atroviride B. Variability in VOC production was previously observed in the two T. atroviride strains P1 and IMI 206040, which regulate the production of VOCs differently under the same light stimulus [43]. Interestingly, the same signaling components (the MAP kinase Tmk3) in T. atroviride P1 and IMI 206040 have different capacities to perceive or respond to the same stimulus [43]. Our observations were based on using the same stimuli in 59 different isolates from the same species, with a broad range of effects in R. solani. Moreover, the blend of VOCs produced by Trichoderma varies depending on the environmental conditions. For example, T. atroviride IMI206040 produced 28 VOCs when the PDA medium was used [37,43,44,45,46], but only 13 VOCs were detected when the MS medium was used [13,46]. Consequently, different effects on plant physiology were observed [46].
During biotic interactions, signaling mediated by VOCs is a bi-directional process. For example, Fusarium oxysporum releases VOCs, which Trichoderma recognizes; consequently, there is a response in the mycoparasite and the other way around [47]. The fact that we could not detect VOCs emitted by R. solani Rs73 grown alone (data not shown) is intriguing, as it has been reported that another isolate of R. solani emits 8 VOCs [48,49]. One reason for the lack of VOC emission found here could be the variability among Rhizoctonia isolates; another may be the use of different VOC sampling methods. In this study solid phase microextraction (SPME) sampling was employed while the previous reports used thermal desorption with Tenax as an adsorbent. Nevertheless, we do not rule out entirely that the Trichoderma VOCs may have influenced the production of VOCs in R. solani and those detected represent a blend of VOCs from both, Trichoderma and Rhizoctonia. However, most of the VOCs reported in this work correspond to those reported in T. sp. ‘ “atroviride B” LU132 grown on plant synthetic medium (MS) [13] and other species of Trichoderma, including Trichoderma atroviride sensu stricto grown alone [28,49,50,51,52].
More than 470 different VOCs have been reported from various Trichoderma spp. [13,28,43,44,45,46,47]. Here, we identified 28 VOCs produced by T. sp. “atroviride B” in the presence of R. solani. Most of these molecules have been previously identified, and some correspond to the “classical” VOCs reported in T. atroviride sensu stricto [48], including 6-pentyl-α-pyrone, 2-undecanone, and 2-hepatanone. These molecules have also been reported in other species such as T. gamsii, T. harzianum, T. asperellum and T. viride, but not in T. reesei and T. virens (Gv29.8) [13,28,52,53,54,55]. A clear correlation between the number of T. sp. “atroviride B” VOCs and the fungistatic activity against the pathogen suggests that the blend of VOCs emitted by the isolates might have a synergistic effect in inhibiting plant pathogens (Figure 3 and Table 2). This potential synergism became evident when individual VOCs were tested; some of them did not show the same fungistatic activity in the four pathogens tested, supporting the idea that the blend of these compounds might be essential for this activity. Interestingly, the production of ketones (e.g., 6-pentyl-α-pyrone, 2-undecanone, geranylacetone) showed strong inhibitory effects on R. solani growth (Figure 4 and Figure 5), which may be due to the general reactivity of the keto functional group. This contrasts with the relatively low inhibitory action of the compounds without a functional group (n-alkanes: undecane, tridecane; sesquiterpenes: curcumene, bisabolene, farnesene). The case of limonene (a monoterpene without a functional group) is peculiar: the compound showed inhibitory effects, though only at the highest concentration.
In addition to differences in the fungistatic activity among T. sp. “atroviride B” isolates, a pathogen’s susceptibility to particular Trichoderma VOCs is species-specific too. The fungistatic activity of the individual VOCs differed among the tested plant pathogens. For instance, fungistasis in R. solani decreased in the following order: 2-undecanone > 6-pentyl-α-pyrone > (−) limonene > geranylacetone > (+) limonene; for A. radicina it was: 6-pentyl-α-pyrone > 2-undecanone > nerolidol mixture > geranylacetone and for F. oxysporum we determined: 6-pentyl-α-pyrone > 2-undecanone = nerolidol mixture > geranylacetone. For S. sclerotiorum the order was: (−) Limonene = (+) Limonene > 2-Undecanone. These observations suggest that the effects of VOCs on the pathogens differ depending on the VOC produced, and the outcome may depend on the blend of the different VOCs. We suggest that screening isolates for VOC blends that have shown strong fungistatic activity may deliver promising candidates for Trichoderma-based bioinoculant development.

5. Conclusions

  • Trichoderma sp. “atroviride B” isolates produce qualitatively and quantitatively different VOC blends.
  • There is a direct correlation between the amount of VOCs emitted by T. sp. “atroviride B” and the fungistatic activity against R. solani.
  • The blend of VOCs produced by Trichoderma has stronger fungistatic activity than the single VOCs tested.
  • Plant pathogens respond species-specifically to single Trichoderma VOCs and the whole blend.

6. Patents

The strains LU132, LU584, LU633 and LU140 are patented (US 8,394,623).

Supplementary Materials

The following are available online at https://www.mdpi.com/article/10.3390/jof9020238/s1, Figure S1: Calibration curves of 5 VOCs detected in the headspace of Trichoderma sp. “atroviride B” isolates. Mixture of the 5 VOCs were added to 20 mL SPME glass vials in four concentrations (1, 2.5, 10, 25 µg L−1) and analyzed with four technical replicates by GC-MS.

Author Contributions

Conceptualization, E.v.Z.d.J., J.H., M.R. and A.M.-M.; methodology, E.v.Z.d.J., J.K., D.K. and M.R.; validation, E.v.Z.d.J. and M.R.; formal analysis, E.v.Z.d.J.; investigation, E.v.Z.d.J., J.K., D.K. and A.M.-M.; data curation, E.v.Z.d.J.; writing—original draft preparation, E.v.Z.d.J. and A.M.-M.; writing—review and editing, J.H., A.M.-M., M.R. and E.v.Z.d.J.; visualization, E.v.Z.d.J. and A.M.-M.; supervision, E.v.Z.d.J. and J.H.; project administration, J.H.; funding acquisition, J.H., M.R. and A.M.-M. All authors have read and agreed to the published version of the manuscript.

Funding

This study was funded by the Ministry of Business, Innovation, and Employment of New Zealand (LINX 0702, Smart Seeds for Export to J.H., E.v.Z.d.J. and D.K.); and Tertiary Education Commission through the Bio-Protection Research Centre, Lincoln University, New Zealand (to A.M.-M. and M.R.).

Institutional Review Board Statement

Not applicable.

Informed Consent Statement

Not applicable.

Data Availability Statement

Not applicable.

Acknowledgments

The authors acknowledge the technical assistance of Laura Nixon with GC-MS analysis and the statistical advice of David Saville.

Conflicts of Interest

The authors declare no conflict of interest. The funders had no role in the design of the study; in the collection, analyses, or interpretation of data; in the writing of the manuscript, or in the decision to publish the results.

References

  1. Gal-Hemed, I.; Atanasova, L.; Komon-Zelazowska, M.; Druzhinina, I.S.; Viterbo, A.; Yarden, O. Marine isolates of Trichoderma spp. as potential halotolerant agents of biological control for arid-zone agriculture. Appl. Environ. Microbiol. 2011, 77, 5100–5109. [Google Scholar] [CrossRef] [PubMed]
  2. Błaszczyk, L.; Strakowska, J.; Chełkowski, J.; Gąbka-Buszek, A.; Kaczmarek, J. Trichoderma species occurring on wood with decay symptoms in mountain forests in Central Europe: Genetic and enzymatic characterization. J. Appl. Genet. 2016, 57, 397–407. [Google Scholar] [CrossRef] [PubMed]
  3. Montoya-Gonzalez, A.H.; Quijano-Vicente, G.; Morales-Maza, A.; Ortiz-Uribe, N.; Hernandez-Martinez, R. Isolation of Trichoderma spp. from Desert Soil, Biocontrol Potential Evaluation and Liquid Culture Production of Conidia Using Agricultural Fertilizers. J. Fertil. Pestic. 2016, 7, 1. [Google Scholar] [CrossRef]
  4. Kim, K.; Heo, Y.M.; Jang, S.; Lee, H.; Kwon, S.-L.; Park, M.S.; Lim, Y.W.; Kim, J.-J. Diversity of Trichoderma spp. in Marine Environments and Their Biological Potential for Sustainable Industrial Applications. Sustainability 2020, 12, 4327. [Google Scholar] [CrossRef]
  5. Borut, S.Y.; Johnson, T., Jr. Some biological observations on fungi in estuarine sediments. Mycologia 1962, 54, 181–193. [Google Scholar] [CrossRef]
  6. Mendoza-Mendoza, A.; Zaid, R.; Lawry, R.; Hermosa, R.; Monte, E.; Horwitz, B.A.; Mukherjee, P.K. Molecular dialogues between Trichoderma and roots: Role of the fungal secretome. Fungal. Biol. Rev. 2018, 32, 62–85. [Google Scholar] [CrossRef]
  7. Braithwaite, M.; Clouston, A.; Minchin, R.; Yardley, J.; Nieto-Jacobo, M.F.; Mendoza-Mendoza, A.; Steyaert, J.; Hill, R.; Marshall, J.; Stewart, A. The density-dependent effect of initial nematode population levels on the efficacy of Trichoderma as a bio-nematicide against Meloidogyne hapla on tomato. Australas. Plant Path. 2016, 45, 473–479. [Google Scholar] [CrossRef]
  8. Su, D.; Ding, L.; He, S. Marine-derived Trichoderma species as a promising source of bioactive secondary metabolites. Mini-Rev. Med. Chem. 2018, 18, 1702–1713. [Google Scholar] [CrossRef]
  9. Poveda, J.; Hermosa, R.; Monte, E.; Nicolás, C. Trichoderma harzianum favours the access of arbuscular mycorrhizal fungi to non-host Brassicaceae roots and increases plant productivity. Sci. Rep. 2019, 9, 11650. [Google Scholar] [CrossRef]
  10. Lace, B.; Genre, A.; Woo, S.; Faccio, A.; Lorito, M.; Bonfante, P. Gate crashing arbuscular mycorrhizas: In vivo imaging shows the extensive colonization of both symbionts by Trichoderma atroviride. Environ. Microbiol. Rep. 2015, 7, 64–77. [Google Scholar] [CrossRef]
  11. Druzhinina, I.S.; Seidl-Seiboth, V.; Herrera-Estrella, A.; Horwitz, B.A.; Kenerley, C.M.; Monte, E.; Mukherjee, P.K.; Zeilinger, S.; Grigoriev, I.V.; Kubicek, C.P. Trichoderma: The genomics of opportunistic success. Nat. Rev. Microbiol. 2011, 9, 749–759. [Google Scholar] [CrossRef]
  12. Geraldine, A.M.; Lopes, F.A.C.; Carvalho, D.D.C.; Barbosa, E.T.; Rodrigues, A.R.; Brandão, R.S.; Ulhoa, C.J.; Lobo Junior, M. Cell wall-degrading enzymes and parasitism of sclerotia are key factors on field biocontrol of white mold by Trichoderma spp. Biol. Control 2013, 67, 308–316. [Google Scholar] [CrossRef]
  13. Nieto-Jacobo, M.F.; Steyaert, J.M.; Salazar-Badillo, F.B.; Nguyen, D.V.; Rostás, M.; Braithwaite, M.; De Souza, J.T.; Jimenez-Bremont, J.F.; Ohkura, M.; Stewart, A.; et al. Environmental Growth Conditions of Trichoderma spp. Affects Indole Acetic Acid Derivatives, Volatile Organic Compounds, and Plant Growth Promotion. Front. Plant Sci. 2017, 8, 102. [Google Scholar] [CrossRef]
  14. Sood, M.; Kapoor, D.; Kumar, V.; Sheteiwy, M.S.; Ramakrishnan, M.; Landi, M.; Araniti, F.; Sharma, A. Trichoderma: The “Secrets” of a Multitalented Biocontrol Agent. Plants 2020, 9, 762. [Google Scholar] [CrossRef]
  15. Cai, F.; Druzhinina, I.S. In honor of John Bissett: Authoritative guidelines on molecular identification of Trichoderma. Fungal Divers. 2021, 107, 1–69. [Google Scholar] [CrossRef]
  16. Braithwaite, M.; Johnston, P.R.; Ball, S.L.; Nourozi, F.; Hay, A.J.; Shoukouhi, P.; Chomic, A.; Lange, C.; Ohkura, M.; Nieto-Jacobo, M.F.; et al. Trichoderma down under: Species diversity and occurrence of Trichoderma in New Zealand. Australas. Plant Path. 2017, 46, 11–30. [Google Scholar] [CrossRef]
  17. Mendoza-Mendoza, A.; Nogueira-López, G.; Arizmendi, F.; Cripps-Guazzone, N.; Nieto-Jacobo, M.; Lawry, R.; Kandula, D.; Salazar-Badillo, F.; Salas-Muñoz, S.; Mauricio-Castillo, J. Mechanisms of growth promotion by members of the rhizosphere fungal genus Trichoderma. Adv. PGPR Res. 2017, 1, 1–15. [Google Scholar]
  18. Daryaei, A.; Jones, E.E.; Ghazalibiglar, H.; Glare, T.R.; Falloon, R.E. Culturing conditions affect biological control activity of Trichoderma atroviride against Rhizoctonia solani in ryegrass. J. Appl. Microbiol. 2016, 121, 461–472. [Google Scholar] [CrossRef]
  19. McLean, K.L.; Swaminathan, J.; Frampton, C.M.; Hunt, J.S.; Ridgway, H.J.; Stewart, A. Effect of formulation on the rhizosphere competence and biocontrol ability of Trichoderma atroviride C52. Plant Pathol. 2005, 54, 212–218. [Google Scholar] [CrossRef]
  20. Card, S.D.; Walter, M.; Jaspers, M.V.; Sztejnberg, A.; Stewart, A. Targeted selection of antagonistic microorganisms for control of Botrytis cinerea of strawberry in New Zealand. Australas. Plant Path. 2009, 38, 183–192. [Google Scholar] [CrossRef]
  21. Maag, D.; Kandula, D.R.W.; Müller, C.; Mendoza-Mendoza, A.; Wratten, S.D.; Stewart, A.; Rostás, M. Trichoderma atroviride LU132 promotes plant growth but not induced systemic resistance to Plutella xylostella in oilseed rape. BioControl 2014, 59, 241–252. [Google Scholar] [CrossRef]
  22. Yardley, J. Understanding Protoplast Technology as a Tool to Enhance Biocontrol. Ph.D. Thesis, Lincoln University, Lincoln, New Zealand, 2018. [Google Scholar]
  23. Martínez-Medina, A.; Van Wees, S.C.M.; Pieterse, C.M.J. Airborne signals from Trichoderma fungi stimulate iron uptake responses in roots resulting in priming of jasmonic acid-dependent defences in shoots of Arabidopsis thaliana and Solanum lycopersicum. Plant Cell Environ. 2017, 40, 2691–2705. [Google Scholar] [CrossRef] [PubMed]
  24. Audrain, B.; Létoffé, S.; Ghigo, J.-M. Airborne Bacterial Interactions: Functions Out of Thin Air? Front. Microbiol. 2015, 6, 1476. [Google Scholar] [CrossRef] [PubMed]
  25. Garbeva, P.; Weisskopf, L. Airborne medicine: Bacterial volatiles and their influence on plant health. New Phytol. 2020, 226, 32–43. [Google Scholar] [CrossRef]
  26. Schulz-Bohm, K.; Martín-Sánchez, L.; Garbeva, P. Microbial Volatiles: Small Molecules with an Important Role in Intra- and Inter-Kingdom Interactions. Front. Microbiol. 2017, 8, 2484. [Google Scholar] [CrossRef]
  27. Cruz-Magalhães, V.; Nieto-Jacobo, M.F.; van Zijll de Jong, E.; Rostás, M.; Padilla-Arizmendi, F.; Kandula, D.; Kandula, J.; Hampton, J.; Herrera-Estrella, A.; Steyaert, J.M.; et al. The NADPH Oxidases Nox1 and Nox2 Differentially Regulate Volatile Organic Compounds, Fungistatic Activity, Plant Growth Promotion and Nutrient Assimilation in Trichoderma atroviride. Front. Microbiol. 2019, 9, 3271. [Google Scholar] [CrossRef]
  28. Lee, S.; Yap, M.; Behringer, G.; Hung, R.; Bennett, J.W. Volatile organic compounds emitted by Trichoderma species mediate plant growth. Fungal Biol. Biotechnol. 2016, 3, 7. [Google Scholar] [CrossRef]
  29. Elsherbiny, E.A.; Amin, B.H.; Aleem, B.; Kingsley, K.L.; Bennett, J.W. Trichoderma Volatile Organic Compounds as a Biofumigation Tool against Late Blight Pathogen Phytophthora infestans in Postharvest Potato Tubers. J. Agric. Food Chem. 2020, 68, 8163–8171. [Google Scholar] [CrossRef]
  30. Sridharan, A.; Thankappan, S.; Karthikeyan, G.; Uthandi, S. Comprehensive profiling of the VOCs of Trichoderma longibrachiatum EF5 while interacting with Sclerotium rolfsii and Macrophomina phaseolina. Microbiol. Res. 2020, 236, 126436. [Google Scholar]
  31. Jalali, F.; Zafari, D.; Salari, H. Volatile organic compounds of some Trichoderma spp. increase growth and induce salt tolerance in Arabidopsis thaliana. Fungal Ecol. 2017, 29, 67–75. [Google Scholar] [CrossRef]
  32. Kottb, M.; Gigolashvili, T.; Großkinsky, D.K.; Piechulla, B. Trichoderma volatiles effecting Arabidopsis: From inhibition to protection against phytopathogenic fungi. Front. Microbiol. 2015, 6, 995. [Google Scholar] [CrossRef] [PubMed]
  33. Guo, Y.; Ghirardo, A.; Weber, B.; Schnitzler, J.P.; Benz, J.P.; Rosenkranz, M. Trichoderma Species Differ in Their Volatile Profiles and in Antagonism Toward Ectomycorrhiza Laccaria bicolor. Front. Microbiol. 2019, 10, 891. [Google Scholar] [CrossRef] [Green Version]
  34. Kandula, D.R.; Jones, E.E.; Stewart, A.; McLean, K.L.; Hampton, J.G. Trichoderma species for biocontrol of soil-borne plant pathogens of pasture species. Biocontrol. Sci. Techn. 2015, 25, 1052–1069. [Google Scholar] [CrossRef]
  35. Umar, A.; Kandula, D.R.; Hampton, J.G.; Rolston, M.P.; Chng, S.F. Potential biological control of take-all disease in perennial ryegrass. N. Z. Plant Prot. 2019, 72, 213–220. [Google Scholar] [CrossRef]
  36. Baskarathevan, J. Botryosphaeriaceous Infection in New Zealand Vineyards: Identification, Population Structure and Genetic Diversity. Ph.D. Thesis, Lincoln University, Lincoln, New Zealand, 2011. [Google Scholar]
  37. Cruz-Magalhães, V.; Nieto-Jacobo, M.F.; Rostás, M.; Echaide-Aquino, J.F.; Esquivel-Naranjo, E.U.; Stewart, A.; Loguercio, L.L.; Mendoza-Mendoza, A. Histidine kinase two-component response regulators Ssk1, Skn7 and Rim15 differentially control growth, developmental and volatile organic compounds emissions as stress responses in Trichoderma atroviride. Curr. Res. Microb. Sci. 2022, 3, 100139. [Google Scholar] [CrossRef]
  38. Hohmann, P.; Jones, E.E.; Hill, R.A.; Stewart, A. Understanding Trichoderma in the root system of Pinus radiata: Associations between rhizosphere colonisation and growth promotion for commercially grown seedlings. Fungal Biol. 2011, 115, 759–767. [Google Scholar] [CrossRef] [PubMed]
  39. Cripps-Guazzone, N.; Jones, E.E.; Condron, L.M.; McLean, K.L.; Stewart, A.; Ridgway, H.J. Rhizosphere and endophytic colonisation of ryegrass and sweet corn roots by the isolate Trichoderma atroviride LU132 at different soil pHs. N. Z. Plant Prot. 2016, 69, 78–85. [Google Scholar] [CrossRef]
  40. Massawe, V.C.; Hanif, A.; Farzand, A.; Mburu, D.K.; Ochola, S.O.; Wu, L.; Tahir, H.A.S.; Gu, Q.; Wu, H.; Gao, X. Volatile Compounds of Endophytic Bacillus spp. have Biocontrol Activity Against Sclerotinia sclerotiorum. Phytopathology 2018, 108, 1373–1385. [Google Scholar] [CrossRef]
  41. Wang, C.; Pi, L.; Jiang, S.; Yang, M.; Shu, C.; Zhou, E. ROS and trehalose regulate sclerotial development in Rhizoctonia solani AG-1 IA. Fungal Biol. 2018, 122, 322–332. [Google Scholar] [CrossRef] [PubMed]
  42. Inamdar, A.A.; Morath, S.; Bennett, J.W. Fungal Volatile Organic Compounds: More Than Just a Funky Smell? Annu. Rev. Microbiol. 2020, 74, 101–116. [Google Scholar] [CrossRef]
  43. Speckbacher, V.; Ruzsanyi, V.; Wigger, M.; Zeilinger, S. The Trichoderma atroviride Strains P1 and IMI 206040 Differ in Their Light-Response and VOC Production. Molecules 2020, 25, 208. [Google Scholar] [CrossRef] [PubMed]
  44. Bennett, J.W.; Inamdar, A.A. Are Some Fungal Volatile Organic Compounds (VOCs) Mycotoxins? Toxins 2015, 7, 3785–3804. [Google Scholar] [CrossRef] [Green Version]
  45. Atriztán-Hernández, K.; Moreno-Pedraza, A.; Winkler, R.; Markow, T.; Herrera-Estrella, A. Trichoderma atroviride from Predator to Prey: Role of the Mitogen-Activated Protein Kinase Tmk3 in Fungal Chemical Defense against Fungivory by Drosophila melanogaster Larvae. Appl. Environ. Microbiol. 2019, 85, e01825-18. [Google Scholar] [CrossRef]
  46. González-Pérez, E.; Ortega-Amaro, M.A.; Salazar-Badillo, F.B.; Bautista, E.; Douterlungne, D.; Jiménez-Bremont, J.F. The Arabidopsis-Trichoderma interaction reveals that the fungal growth medium is an important factor in plant growth induction. Sci. Rep. 2018, 8, 16427. [Google Scholar] [CrossRef]
  47. Li, N.; Alfiky, A.; Wang, W.; Islam, M.; Nourollahi, K.; Liu, X.; Kang, S. Volatile Compound-Mediated Recognition and Inhibition Between Trichoderma Biocontrol Agents and Fusarium oxysporum. Front. Microbiol. 2018, 9, 2614. [Google Scholar] [CrossRef]
  48. Cordovez, V.; Mommer, L.; Moisan, K.; Lucas-Barbosa, D.; Pierik, R.; Mumm, R.; Carrion, V.J.; Raaijmakers, J.M. Plant Phenotypic and Transcriptional Changes Induced by Volatiles from the Fungal Root Pathogen Rhizoctonia solani. Front. Plant Sci. 2017, 8, 1262. [Google Scholar] [CrossRef] [PubMed]
  49. Moisan, K.; Raaijmakers, J.M.; Dicke, M.; Lucas-Barbosa, D.; Cordovez, V. Volatiles from soil-borne fungi affect directional growth of roots. Plant Cell Environ. 2021, 44, 339–345. [Google Scholar] [CrossRef] [PubMed]
  50. Lazazzara, V.; Vicelli, B.; Bueschl, C.; Parich, A.; Pertot, I.; Schuhmacher, R.; Perazzolli, M. Trichoderma spp. volatile organic compounds protect grapevine plants by activating defense-related processes against downy mildew. Physiol. Plant. 2021, 172, 1950–1965. [Google Scholar] [CrossRef]
  51. Zhang, F.; Yang, X.; Ran, W.; Shen, Q. Fusarium oxysporum induces the production of proteins and volatile organic compounds by Trichoderma harzianum T-E5. FEMS Microbiol. Lett. 2014, 359, 116–123. [Google Scholar] [CrossRef] [PubMed]
  52. Inayati, A.; Sulistyowati, L.; Aini, L.Q.; Yusnawan, E. Antifungal activity of volatile organic compounds from Trichoderma virens. AIP Conf. Proc. 2019, 2120, 080012. [Google Scholar] [CrossRef]
  53. Moreno-Ruiz, D.; Fuchs, A.; Missbach, K.; Schuhmacher, R.; Zeilinger, S. Influence of Different Light Regimes on the Mycoparasitic Activity and 6-Pentyl-α-pyrone Biosynthesis in Two Strains of Trichoderma atroviride. Pathogens 2020, 9, 860. [Google Scholar] [CrossRef] [PubMed]
  54. Siddiquee, S. Chapter 11—Recent Advancements on the Role and Analysis of Volatile Compounds (VOCs) from Trichoderma. In Biotechnology and Biology of Trichoderma; Gupta, V.K., Schmoll, M., Herrera-Estrella, A., Upadhyay, R.S., Druzhinina, I., Tuohy, M.G., Eds.; Elsevier: Amsterdam, The Netherlands, 2014; pp. 139–175. [Google Scholar]
  55. Hong, J.-H.; Lee, J.; Min, M.; Ryu, S.-M.; Lee, D.; Kim, G.-H.; Kim, J.-J. 6-Pentyl-α-pyrone as an anti-sapstain compound produced by Trichoderma gamsii KUC1747 inhibits the germination of ophiostomatoid fungi. Holzforschung 2014, 68, 769–774. [Google Scholar] [CrossRef]
Figure 1. System for sampling volatile organic compounds produced by Trichoderma sp. “atroviride B” against Rhizoctonia solani in the inverted plate assay.
Jof 09 00238 g001
Figure 2. Inhibition of Rhizoctonia solani growth by the blend of volatile organic compounds emitted by two sets (a) and (b) of selected isolates of Trichoderma sp. “atroviride B” at various time points in the inverted plate assays. The pathogen was introduced 48 h after Trichoderma, and both were incubated at 25 °C, with the latter removed 21 days post-inoculation. The error bars indicate the least significant difference (LSD 5%) compared to isolates with the patented strains at the different time points with means >0. The experiment was conducted two times using five plates for each isolate.
Jof 09 00238 g002
Figure 3. Mean inhibition of Rhizoctonia solani (Rs), Alternaria radicina (Ar), Fusarium oxysporum f. sp. lycopersici (Fol) and Sclerotinia sclerotiorum (Ss) growth by isolates of Trichoderma sp. “atroviride B” in the inverted plate assays. The pathogen was introduced 48 h after Trichoderma, and both were incubated together at 25 °C for 2 d with Rs, 14 d with Ar, 7 d with Fol and 1.4 d with Ss. The error bar indicates the least significant difference (LSD 5%). The means are from two independent experiments conducted following a randomized complete block design with four blocks.
Jof 09 00238 g003
Figure 4. Mean inhibition of Rhizoctonia solani growth with individual volatile organic compounds (VOCs) identified in the headspace of the inverted plate assays with Trichoderma sp. “atroviride B” which displayed a positive correlation with bioactivity. The pathogen was incubated for 2 d at 25 °C above paper discs, to which one of six different concentrations of the VOC was applied at the time of pathogen inoculation. Closed circles correspond to Expt. 1, open circles correspond to Expt. 2. The error bars indicate the least significant difference (LSD 5%) for two independent experiments, Expt. 1 (left bar) and Expt. 2 (right bar). The values on the y-axis are from lowest to highest when back-transformed equivalent to −58, −26, 0, 21, 37, 50, 60, 68, 75, 80, 84, 87 and 90% inhibition of pathogen growth.
Jof 09 00238 g004
Figure 5. Mean inhibition of the growth of Rhizoctonia solani (Rs), Alternaria radicina (Ar), Fusarium oxysporum f. sp. lycopersici (Fol) and Sclerotinia sclerotiorum (Ss) by individual volatile organic compounds (VOCs) identified in the headspace of the inverted plate assays with Trichoderma sp. “atroviride B” that displayed a positive correlation with bioactivity. The pathogen was incubated at 25 °C for 2 d with Rs, 14 d with Ar, 7 d with Fol and 1.4 d with Ss above paper discs, to which the VOC was applied at a concentration of 3.84 log10 μmol L−1 air at the time of pathogen inoculation. The error bars indicate the least significant difference (LSD 5%) for two independent experiments, Expt. 1 (left bar) and Expt. 2 (right bar). Some of the VOCs were tested against Ss in a third experiment due to the abnormal growth of this pathogen in one of the earlier experiments. The values on the y-axis are from lowest to highest when back-transformed, equivalent to −58, 0, 37, 60, 75, 84, 90, 94, 96 and 97% inhibition of pathogen growth.
Jof 09 00238 g005
Table 1. Average percentage inhibition of Rhizoctonia solani colony growth and occurrence of sclerotia in the presence of Trichoderma sp. “atroviride B” isolates in the inverted plate assays a.
StrainReplicatesAverage Inhibition of Pathogen Growth (%) bOccurrence of Pathogen
Sclerotia (%)
Patented strains
LU1324018.3013.5***c
LU1404014.4036.8***
LU584405.7525.0***
LU6334014.4318.9***
Other isolates
LU661535.7460.0
LU521533.610.0***
LU723530.4450.0
LU532528.4420.0***
LU1308525.9160.0
LU141524.460.0***
LU579521.5133.3*
LU666520.2525.0**
LU131519.8120.0***
LU1345519.1050.0
LU1357518.8220.0***
LU499518.5140.0*
LU522518.2840.0*
LU665517.510.0***
LU572517.2320.0***
LU659517.1360.0
LU510517.110.0***
LU298516.7433.3*
LU1341515.7825.0**
LU1330515.7440.0*
LU562515.000.0***
LU497514.4020.0***
LU739513.7075.0
LU660513.3225.0**
LU634512.2920.0***
LU668511.8940.0*
LU575511.0250.0
LU590510.910.0***
LU577510.2340.0*
LU99259.9720.0***
LU56859.410.0***
LU57358.4860.0
LU65858.240.0***
LU13658.2120.0***
LU56357.9950.0
LU98757.2825.0**
LU65657.2420.0***
LU57456.9020.0***
LU72556.6680.0
LU57856.4540.0*
LU30056.3420.0***
LU58756.2120.0***
LU14756.0220.0***
LU58855.9840.0*
LU59155.9360.0
LU52455.7840.0*
LU58255.4940.0*
LU58055.3440.0*
LU74155.1520.0***
LU58155.0320.0***
LU58955.0340.0*
LU58655.0125.0**
LU58353.3440.0*
LU53151.8520.0***
LU65750.6940.0*
R. solani alone c40N/A92.5
LSD (5%)5 v. 58.41
5 v. 406.31
40 v. 402.97
a The pathogen was introduced 48 h after Trichoderma, and plates were incubated at 25 °C with the latter removed 21 days post-inoculation. The pathogen was grown for 35 days post-inoculation to detect sclerotia production. b Calculated from the average area under the curve of the percentage inhibition of pathogen growth by the Trichoderma strain from 0 to 35 days post-inoculation. c Significance of difference from R. solani growth alone in Chi-squared test where *: p ≤ 0.05; **: p ≤ 0.01; ***: p ≤ 0.001.
Table 2. The growth and sporulation patterns of selected Trichoderma sp. “atroviride B” isolates in the inverted plate assays. Rhizoctonia solani was introduced 48 h after Trichoderma and these were incubated together at 25 °C for a further 21 days.
TreatmentReplicatesTrichoderma Growth (mm, Diameter) at 2 DaysLog10 Days for Trichoderma
Colonization (Back Transformed)
Log10 Days for Trichoderma
Sporulation (Back Transformed)
Patented strains
LU13240(74.0) a(0.30) [2.0]0.64 [4.4]
LU14040(74.0)(0.30) [2.0]0.63 [4.3]
LU58440(74.0)(0.30) [2.0]0.62 [4.2]
LU63340(74.0)(0.30) [2.0]0.60 [4.0]
Top performers
LU4995(74.0)(0.30) [2.0]1.36 [22.9]
LU5215(74.0)(0.30) [2.0]0.64 [4.4]
LU532540.20.67 [4.6]0.64 [4.4]
LU6615(74.0)(0.30) [2.0]0.75 [5.6]
LU723541.20.58 [3.8]NS b
LU13085(74.0)(0.30) [2.0]0.66 [4.6]
Poor performers
LU5245(74.0)(0.30) [2.0]0.48 [3.0]
LU531518.01.10 [12.7]0.66 [4.6]
LU5835(74.0)(0.30) [2.0]0.60 [4.0]
LU657515.40.82 [6.6]0.97 [9.3]
LU6585(74.0)(0.30) [2.0]0.53 [3.4]
LSD (5%)5 v. 55.10.160.05
5 v. 403.80.120.04
40 v. 401.80.060.02
LSEffect (5%)5 v. 53.60.11
5 v. 402.70.08
40 v. 401.30.04
a Numbers in round brackets were excluded from ANOVA to achieve homogeneity of variance; these can be compared to the variable values using the LSEffect (5%). b No sporulation.
Table 3. Volatile organic compounds (VOCs) produced by Trichoderma sp. “atroviride B” isolates in the inverted plate assays with Rhizoctonia solani. The VOCs were sampled from the headspace by solid-phase micro-extraction 48 h after R. solani was introduced and were analyzed on a gas chromatograph-mass spectrometer. Putative identities were assigned based on comparisons with the NIST and Wiley databases.
VOC
No
Putative NameSynonym (or Nearest Match for Unknown)Similarity (%)Retention Index
12-Heptanone 91900
22-Heptanol 95904
3Pentyl acetateAcetic acid, pentyl ester97917
43-Octanone 96989
5(±)-Limonene a4-Isopropenyl-1-methylcyclohexene;911032
6Unknown(4-Hydroxyphenyl)acetonitrile831093
72-Nonanone 961094
8Undecane a 921099
9Unknown 1118
10Unknown3,7-Dimethyl-6-octenal811156
111-Butyl-4-methoxybenzene or4-Butylphenyl methyl ether 911249
12(S)-(-)-Citronellic acidMethyl 3,7-dimethyl-6-octenoate 921262
13Unknown3-Dodecen-1-ol, acetate, (E)-831285
142-Undecanone a 961295
15Tridecane a 951298
16Unknown 1311
17Unknown 1399
18α-Bergamotene2,6-Dimethyl-6-(4-methyl-3-penten-1-yl)bicyclo [3.1.1]hept-2-ene941444
19Geranylacetone a6,10-Dimethyl-5,9-undecadien-2-one951457
20cis-β-Farnesene a(6Z)-7,11-Dimethyl-3-methylene-1,6,10-dodecatriene911460
216-Pentyl-α-pyrone a6-Pentyl-2H-pyran-2-one921476
22(-)-Germacrene D8-Isopropyl-1-methyl-5-methylene-1,6-cyclodecadiene961496
23Unknowncis-γ-Bisabolene or β-Curcumene901502
24Unknown 1512
25β-Bisabolene a(4S)-1-Methyl-4-(6-methyl-1,5-heptadien-2-yl)cyclohexene931517
26β-Sesquiphellandrene(6S)-3-Methylene-6-[(2S)-6-methyl-5-hepten-2-yl]cyclohexene911534
27Unknown(E)-6-Pent-1-enylpyran-2-one851540
28trans-Nerolidol a(6E)-3,7,11-Trimethyl-1,6,10-dodecatrien-3-ol961570
29Methyl trans,cis-farnesate6,10-Dodecadienoic acid, 3,7,11-trimethyl-, methyl ester, (E)-(S)-921720
30Unknown 1995
31Verticiol[1R-(1R*,3E,7E,11R*,12R*)]-4,8,12,15,15-Pentamethyl- bicyclo[9.3.1]pentadeca-3,7-dien-12-ol90ND b
32Unknown ND b
a Compound identity was corroborated by GC-MS analysis of the standard. b Not determined.
Table 4. Mean inhibition of Rhizoctonia solani growth by Trichoderma sp. “atroviride B” isolates in the inverted plate assays sampled for gas chromatography-mass spectrometry analysis. The total number and quantity of VOCs detected in the headspace are listed.
TreatmentInhibition of
Pathogen Growth (%) a
Total Number
of VOCs
Total Quantity of VOCs (Peak Area × 107)
LU52178.2287.1
LU66167.7288.8
LU13265.8225.3
LU14065.3225.3
LU63362.5235.6
LU65759.9244.1
LU58453.7233.7
LU58346.1193.3
LSD (5%)6.731.2
a Pathogen colony diameter in the treatment as a percentage of the positive control 48 h post-inoculation.
Table 5. Volatile organic compounds (VOCs) produced by eight Trichoderma sp. “atroviride B” isolates in the inverted plate assays with Rhizoctonia solani.
VOC No. aRelative Peak Area (1 × 10⁵) b
LU132LU140LU521LU583LU584LU633LU657LU661
159.7 ± 10.760.5 ± 11.741 ± 5.932.9 ± 6.727.9 ± 4.898.2 ± 22.736.3 ± 5.8183.0 ± 39.3
21.9 ± 1.22.6 ± 1.2ND cNDND6.3 ± 1.91.2 ± 0.710.9 ± 3.2
36.6 ± 2.34.8 ± 1.5ND0.2 ± 0.20.3 ± 0.30.4 ± 0.40.5 ± 0.30.7 ± 0.3
43.5 ± 1.92.5 ± 1.010 ± 0.54.0 ± 2.42.4 ± 0.46.6 ± 2.12.9 ± 1.45.7 ± 1.7
52.6 ± 0.22.8 ± 0.44 ± 0.31.2 ± 0.41.9 ± 0.22.1 ± 0.2ND4.0 ± 0.4
63.5 ± 1.03.2 ± 0.80.7 ± 0.11.4 ± 0.31.9 ± 0.64.2 ± 1.43.4 ± 0.87.4 ± 1.7
73.6 ± 0.83.4 ± 0.80.5 ± 0.11.8 ± 0.51.6 ± 0.44.8 ± 1.22.2 ± 0.39.9 ± 2.2
81.2 ± 0.51.2 ± 0.41.5 ± 0.40.8 ± 0.41.0 ± 0.31.1 ± 0.41.0 ± 0.41.8 ± 0.7
928.5 ± 4.622.4 ± 4.8111.1 ± 18.25.4 ± 1.112.7 ± 2.917.8 ± 4.430.8 ± 5.896.5 ± 16.4
10NDNDNDND0.1 ± 0.10.1 ± 0.10.4 ± 0.20.4 ± 0.2
110.1 ± 0.1ND0.3 ± 0.090.1 ± 0.10.3 ± 0.1ND0.1 ± 0.10.5 ± 0.1
12NDND1.1 ± 0.7NDNDNDNDND
13NDNDNDNDNDNDND0.4 ± 0.2
14NDND6.4 ± 0.50.02 ± 0.020.02 ± 0.021.4 ± 0.30.2 ± 0.22.8 ± 0.4
153.8 ± 1.34.0 ± 1.23.8 ± 1.72.2 ± 1.02.1 ± 0.82.7 ± 0.72.5 ± 0.64.8 ± 1.7
16NDND1.3 ± 0.1NDNDNDND1.2 ± 0.3
17ND0.1 ± 0.10.12 ± 0.1NDNDND0.1 ± 0.10.2 ± 0.1
186.9 ± 1.36.5 ± 0.934.0 ± 9.91.2 ± 0.21.5 ± 0.33.0 ± 0.41.2 ± 0.424.4 ± 6.6
190.4 ± 0.10.4 ± 0.11.3 ± 0.1ND0.2 ± 0.10.5 ± 0.11.5 ± 0.21.9 ± 0.4
201.2 ± 0.31.2 ± 0.33.0 ± 0.3ND0.4 ± 0.30.6 ± 0.3ND3.6 ± 1.1
21390.2 ± 59.2394.3 ± 49.1456.2 ± 65.5273.5 ± 42.4300.9 ± 51.1398.0 ± 58.7308.0 ± 36.6489.6 ± 68.7
222.2 ± 0.62.1 ± 0.52.2 ± 0.61.3 ± 0.41.8 ± 0.51.1 ± 0.72.8 ± 1.03.7 ± 0.6
232.5 ± 0.53.1 ± 0.28.6 ± 0.82.0 ± 1.01.8 ± 0.63.6 ± 0.83.4 ± 0.94.2 ± 0.8
241.5 ± 0.31.6 ± 0.21.8 ± 0.30.6 ± 0.30.9 ± 0.31.1 ± 0.21.4 ± 0.22.8 ± 0.6
250.8 ± 0.10.8 ± 0.12.8 ± 0.30.3 ± 0.20.3 ± 0.20.4 ± 0.20.3 ± 0.21.4 ± 0.3
26NDND0.4 ± 0.1NDNDND0.8 ± 0.1ND
276.8 ± 0.87.1 ± 0.67.5 ± 0.64.2 ± 0.55.1 ± 0.97.5 ± 0.86.4 ± 0.310.6 ± 0.7
280.7 ± 0.10.7 ± 0.12.1 ± 0.10.2 ± 0.10.6 ± 0.20.5 ± 0.10.9 ± 0.21.9 ± 0.2
29NDND0.7 ± 0.0NDNDNDNDND
30NDND1.1 ± 0.2NDNDNDND0.4 ± 0.1
310.8 ± 0.30.7 ± 0.113.0 ± 2.7ND0.5 ± 0.20.8 ± 0.31.2 ± 0.14.6 ± 1.1
32NDND0.3 ± 0.1NDNDNDNDND
a The names of VOC correspond to the number indicated in Table 2. b The measurements are the average and standard error from five independent samples. c Not detected.
Disclaimer/Publisher’s Note: The statements, opinions and data contained in all publications are solely those of the individual author(s) and contributor(s) and not of MDPI and/or the editor(s). MDPI and/or the editor(s) disclaim responsibility for any injury to people or property resulting from any ideas, methods, instructions or products referred to in the content.

